summary - ucy
TRANSCRIPT

SUMMARY
One of the major factors limiting but also causing the application of modern technology in
medicine is the response time to patients, should they need specialized medical care. In this
thesis we propose a solution that can help and improve the patients’ life. Patients, after a heart
surgery, have to visit the hospital for a small period of time for a routine check which can take
only a few minutes. The aim of this project is to give the opportunity to these patients to be
monitored at home after their operation and not visit the hospital every day. On the other
hand, the doctor can use his time seeing other patients. Furthermore he can view his patient’s
vital information from his office at any time that he desires.
The vital information that can be measured by the proposed system is the blood pressure,
oxygen saturation, weight and last but most important is the patient’s ECG at for at least five
minutes. The ECG will be analyzed by the system using a specific algorithm that recognizes
some predefined types of arrhythmias. This algorithm was implemented during a previous
project and it will be incorporated in this project. The ECG can be shown to the doctor when
he wishes to see it. Furthermore the system can preview the ECG with the analyzed
information in order to help the doctor. In addition statistics and scores can be measured
before and after the patient’s treatment and can be used to find some important results
concerning his/her heart condition. This project can improve the life quality of patient after
his/her surgery.

ii
POST-CARDIOSURGERY HOME MONITORING SYSTEM
Panayiota Chimonidou Kyriakou
A Thesis
Submitted in Partial Fulfillment of the
Requirements for the Degree of
Master of Science
at the
University of Cyprus
Recommended for Acceptance
by the Department of Computer Science
June, 2010

iii
APPROVAL PAGE
Master of Science Thesis
POST-CARDIOSURGERY HOME MONITORING SYSTEM
Presented by
Panayiota Chimonidou Kyriakou
Research Supervisor
Constantinos Pattichis
Committee Member
Christos N. Schizas
Committee Member
Marios Neofytou
University of Cyprus
June, 2010

iv
ACKNOWLEDGEMENTS
I would like to thank Prof. Constantinos Pattichis, at the University of Cyprus, as well as Prof.
Efthyvoulos Kyriacou for their help and support, cooperation in this work. The help that
Demetris Hoplaros gave to me was of very great importance, too, so that I may understand
and continue this project.
Ending, I would like to show my appreciation to my husband and my family for their support.
v
INDEX
Chapter 1 - Introduction ..................................................................................................... - 2 -
1.1 Overview Narrative ..................................................................................... - 2 -
1.2 Project purpose ............................................................................................ - 4 -
1.3 Project Structure .......................................................................................... - 6 -
Chapter 2 - Theoretical Background ................................................................................. - 8 -
2.1 Electrocardiography (ECG) ........................................................................ - 8 -
2.1.1 Placement of electrodes ................................................................................. - 10 -
2.2 Characteristics Normal Electrocardiography ............................................ - 11 -
2.3 ECG Rhythms ........................................................................................... - 13 -
2.3.1 Normal Sinus Rhythm .................................................................................... - 13 - 2.3.2 Sinus Bradycardia .......................................................................................... - 13 - 2.3.3 Sinus Tachycardia .......................................................................................... - 14 - 2.3.4 Supraventricular Tachycardia Abnormal ....................................................... - 15 - 2.3.5 Atrial Fibrillation ........................................................................................... - 15 - 2.3.6 Atrial Flutter ................................................................................................... - 16 - 2.3.7 1st Degree AV Block ..................................................................................... - 16 - 2.3.8 2nd Degree AV Block Type 2........................................................................ - 17 - 2.3.9 3rd Degree Block ........................................................................................... - 17 -
2.4 Web Applications and health systems ...................................................... - 18 -
2.4.1 Web Application ............................................................................................ - 18 - 2.4.2 Healthcare Information Systems .................................................................... - 18 - 2.4.3 e-Health system .............................................................................................. - 18 - 2.4.4 m-Health ........................................................................................................ - 19 -
2.5 Other Mobile ECG Monitoring Systems .................................................. - 19 -
2.5.1 M-Health Monitoring System for Children with Suspected Arrhythmias ..... - 20 - 2.5.2 A Web Access to Data in a Mobile ECG Monitoring System ....................... - 21 -
Chapter 3 - System Requirements .................................................................................... - 22 -
3.1 Introduction ............................................................................................... - 22 -
3.1.1 System’s Purpose and System Function ........................................................ - 22 -
3.2 System Requirements ................................................................................ - 24 -
3.2.1 System operations and functions .................................................................... - 24 - 3.2.1.1 Basic System operations and functions ....................................................... - 26 -
3.3 Major Processes ........................................................................................ - 26 -
3.3.1 Registration Process ....................................................................................... - 26 - 3.3.2 Adjustment Process ........................................................................................ - 27 - 3.3.3 Analysis Process ............................................................................................ - 27 - 3.3.4 Vital Information Preview Process ................................................................ - 27 - 3.3.5 Archive Process ............................................................................................. - 27 -
Chapter 4 - System Specifications .................................................................................... - 28 -
4.1 Introduction ............................................................................................... - 28 -
4.2 System Inputs ....................................................................................... - 29 -
4.3 Entity Relationship Diagram ..................................................................... - 29 -
4.4 Process Flow Diagram (PFD) ................................................................... - 30 -
4.4.1 Collect Vital Information ............................................................................... - 30 -

vi
4.4.2 Collect ECG Information ............................................................................... - 30 - 4.4.3 User Input....................................................................................................... - 30 - 4.4.3 Process Coordination ..................................................................................... - 30 - 4.4.4 ECG Analysis ................................................................................................. - 31 - 4.4.6 Display ECG .................................................................................................. - 31 - 4.4.6 Display Vital Information .............................................................................. - 31 - 4.4.7 ECG Archive .................................................................................................. - 31 - 4.4.7 Data Storage ................................................................................................... - 31 -
4.5 Database structure ..................................................................................... - 32 -
4.6 Data Files .................................................................................................. - 32 -
4.6.1 Table Patient .................................................................................................. - 32 - 4.6.2 Table Patient Calls ......................................................................................... - 33 - 4.6.3 Table Patient ECG Analyzed ......................................................................... - 33 - 4.6.4 Table Patient Archive ECG Analyzed ........................................................... - 34 - 4.6.5 Table Patient Archive ECG Analyzed ........................................................... - 34 - 4.6.6 Table Patient ECG to Archive ....................................................................... - 35 - 4.6.7 Table Patient Follow Up information ............................................................ - 35 - 4.6.8 Table Patient Hospitalization information ..................................................... - 36 - 4.6.9 Table Patient Hospitalization Discharge Symptoms information .................. - 36 - 4.6.10 Table Patient Hospitalization Symptoms information ................................. - 37 - 4.6.11 Table Patient Medical Background information .......................................... - 37 - 4.6.12 Table Patient Oxygen Saturation information.............................................. - 38 - 4.6.13 Table Patient Weight .................................................................................... - 39 - 4.6.14 Table Patient Questionnaire ......................................................................... - 39 - 4.6.15 Table Patient Blood Pressure ....................................................................... - 40 - 4.6.16 Table Score Questionnaire ........................................................................... - 40 - 4.6.17 Table Symptoms .......................................................................................... - 40 - 4.6.18 Table User – Patient ..................................................................................... - 41 -
4.7 Class Diagram ....................................................................................... - 41 -
4.7.1 Application Server Classes ............................................................................ - 41 - 4.7.1.1 Declare Class .............................................................................................. - 42 - 4.7.1.2 Utils Class ................................................................................................... - 43 - 4.7.1.3 Data Access Layer (DAL) Class ................................................................. - 44 - 4.7.1.4 Vital Information Web Service (VitalInfoWS) ........................................... - 45 - 4.7.1.5 System Web Service (SystemWS) .............................................................. - 45 - 4.7.2 ECG Analysis Server Class............................................................................ - 45 - 4.7.2.1 ECG Analysis Class .................................................................................... - 46 - 4.7.3 ECG Archive Server Class ............................................................................. - 46 -
4.8 Use Case Diagram ..................................................................................... - 47 -
4.8.1 Use Case Diagram .......................................................................................... - 47 -
4.8.2 System Use Case Diagrams ................................................................... - 48 -
4.8.2.1 Scenarios system communication with the Application Server ........... - 48 -
4.9 Sequence Diagram ................................................................................ - 53 -
Chapter 5 - System Design ................................................................................................ - 54 -
5.1 Introduction........................................................................................... - 54 -
5.2 System Communication and Interface ...................................................... - 56 -
5.2.1 Interfaces with the External System ............................................................... - 56 - 5.2.2 Interface with the Internal System ................................................................. - 58 - 5.2.3 Patients’ Portal User Interface ....................................................................... - 60 -
5.3 Security and Control ................................................................................. - 60 -
5.3.1 Microsoft Membership Provider .................................................................... - 60 -
vii
Chapter 6 - Implementation Phase ................................................................................... - 61 -
6.1 Programming Language and Platform ...................................................... - 61 -
6.1.1 ASP.NET 3.5 and Visual Studio 2008 ........................................................... - 61 - 6.1.1.1 Visual Studio 2008 ...................................................................................... - 62 - 6.1.2 ASP.NET AJAX framework .......................................................................... - 62 - 6.1.2.1 Visual Studio 2008 ...................................................................................... - 62 - 6.1.3 Microsoft SQL Server .................................................................................... - 63 - 6.1.4 National Instruments (NI) Measurement Studio ............................................ - 63 - 6.1.5 Visual Basic .NET (VB.NET)........................................................................ - 63 -
6.2 User Interface ............................................................................................ - 64 -
6.3 Conclusion ................................................................................................ - 64 -
Chapter 7 - Installation Phase ........................................................................................... - 65 -
7.1 System Installation Method ...................................................................... - 65 -
7.2 Database Installation ................................................................................. - 65 -
7.3 Application Installation ............................................................................. - 67 -
7.3.1 wwwroot Installation ..................................................................................... - 67 -
7.3.2 IIS 6.0 Installation .................................................................................. - 68 -
7.3.2.1 Application Pool Setup ............................................................................... - 68 - 7.3.2.2 Patients Portal Virtual Directory configuration steps ................................. - 69 - 7.3.3 Configuration file changes ............................................................................. - 70 - 7.3.3.1 Connection string changes .......................................................................... - 71 - 7.3.3.2 Application Settings changes ...................................................................... - 72 - 7.3.3.3 ECGAnalysisServer and ECGArchiveServer settings ................................ - 72 - 7.3.3.4 Patient Portal E-Mail Settings ..................................................................... - 73 - 7.3.4 NTFS access ................................................................................................... - 73 -
7.4 Analysis configuration .............................................................................. - 73 -
7.5 Membership Provider Installation ............................................................. - 74 -
7.6 Conclusion ................................................................................................ - 74 -
Chapter 8 - System Evaluation Phase .............................................................................. - 75 -
8.1 Testing specification and planning ........................................................... - 75 -
8.1.1 Test Plan......................................................................................................... - 75 - 8.1.1.1 Module Testing ........................................................................................... - 75 - 8.1.1.2 Integration Testing ...................................................................................... - 76 - 8.1.1.3 Function Testing ......................................................................................... - 76 - 8.1.1.4 System Testing ............................................................................................ - 76 - 8.1.1.5 Acceptance Testing ..................................................................................... - 76 - 8.1.2 Programming and Testing .............................................................................. - 77 - 8.1.3 User Training Description .............................................................................. - 77 - 8.1.4 System Testing ............................................................................................... - 78 - 8.1.4.1 Complete System Test ................................................................................ - 78 -
8.2 Test Scenarios and Results ........................................................................ - 78 -
8.2.1 Web Service Call Scenarios ........................................................................... - 78 - 8.2.1.1 ECG input scenario ..................................................................................... - 78 - 8.2.1.2 Vital Information input scenario ................................................................. - 79 - 8.2.2 ECG Analysis Scenarios ................................................................................ - 80 - 8.2.3 ECG Archive Scenarios ................................................................................. - 81 - 8.2.4 Patients Portal code metrics ........................................................................... - 81 - 8.2.5 Patients Portal Load Test ............................................................................... - 82 - 8.2.5.1 Key Indicators ............................................................................................. - 83 - 8.2.5.2 Page Response Time ................................................................................... - 84 -
8.3 Compare our system with A Wireless System for Monitoring of Children with Suspected Arrhythmias ........................................................................... - 86 -
8.4 Conclusion ................................................................................................ - 86 -

viii
Chapter 9 - Conclusions and Future Work ..................................................................... - 87 -
9.1 Conclusions ............................................................................................... - 87 -
9.2 External System that has to be created...................................................... - 89 -
9.3 Internal System additional work ............................................................... - 90 -
Appendix I - User Input..................................................................................................... - 91 -
Patient’s Personal Information ........................................................................ - 91 -
Patient’s Questioner & Score Information [10] .............................................. - 99 -
Appendix II - Entity Relationship Diagram (ERD) ...................................................... - 100 -
Appendix III - Process Flow Diagram (PFD) ................................................................ - 101 -
Appendix IV - Database Structure ................................................................................. - 102 -
Appendix V - Patients Portal User Interface ................................................................ - 103 - Registration Page .................................................................................................. - 103 - Login Page ............................................................................................................ - 103 - Change Password Page ......................................................................................... - 104 - Patient’s Maintenance page .................................................................................. - 105 - Patient’s Hospitalization page ............................................................................... - 106 - Patient’s Hospitalization Symptoms page ............................................................. - 107 - Patient’s Call and Visits page ............................................................................... - 107 - Questioner page .................................................................................................... - 108 - Patient’s Scores page ............................................................................................ - 109 - Patient’s Follow Up page ...................................................................................... - 109 - Schedule ECG Archive page ................................................................................ - 109 - Patient’s Vital Info page ....................................................................................... - 110 - Patient’s ECG Info page ....................................................................................... - 111 -
Appendix VI - Membership Provider Installation ....................................................... - 112 -
Appendix VII -Sequence Diagram .................................................................................. - 117 -
Appendix VIII - Web Service – VitalInfoWS ................................................................ - 118 -
Web service: VitalInfoWS ............................................................................ - 118 -
Web Service Methods ................................................................................... - 118 -
All functions return "Result" Value ...................................................................... - 118 -
Add Weight Method ..................................................................................... - 118 -
Add Oxygen Saturation method .................................................................... - 119 -
Add Blood Pressure method ......................................................................... - 119 -
Add ECG Not Analyzed method .................................................................. - 119 -
Add ECG Analyzed method ......................................................................... - 120 -
Appendix IX - User Manual ............................................................................................ - 121 -
1. Menu ......................................................................................................... - 121 -
1.1 Home page ...................................................................................................... - 122 - 1.2 Home – View Patients page ............................................................................ - 123 -
2. Patient Maintenance Pages ....................................................................... - 124 -
2.1 Patient’s Maintenance ..................................................................................... - 124 - 2.2 Patient Medical Background ........................................................................... - 125 - 2.3 Patient’s Hospitalization ................................................................................. - 126 - 2.4 Hospitalization List ......................................................................................... - 127 - 2.5 Patient Hospitalization Symptoms .................................................................. - 128 - 2.6 Calls & Visits .................................................................................................. - 129 - 2.7 Questionnaire .................................................................................................. - 130 - 2.8 Patient Follow Up page ................................................................................... - 131 - 2.9 Schedule ECG Archive ................................................................................... - 131 -

ix
3. Patient’s Reports ....................................................................................... - 132 -
3.1 Patient’s Vital Information Report .................................................................. - 132 - 3.2 ECG Preview .................................................................................................. - 133 - 3.3 Patient Scores Report ...................................................................................... - 134 - 3.4 Patient Scores Chart Report ............................................................................ - 134 -
4. User account pages ................................................................................... - 135 -
4.1 Sign Up For Your New Account..................................................................... - 135 - 4.2 Change Your Password ................................................................................... - 136 - 4.3 My Account Information ................................................................................ - 136 - 4.4 Forgot Your Password? ................................................................................... - 137 -
5. Log Files ................................................................................................... - 138 -
5.1 Analysis Log File ............................................................................................ - 138 - 5.2 Interface Log File ............................................................................................ - 138 - 5.3 Trace Log File ................................................................................................. - 138 -
References ......................................................................................................................... - 139 -

x
LIST OF TABLES
TABLE 4.1: TABLE PATIENT ................................................................................................ - 32 -
TABLE 4.2: TABLE PATIENT CALLS ..................................................................................... - 33 -
TABLE 4.3: TABLE PATIENT ECG ANALYZED ...................................................................... - 33 -
TABLE 4.4: TABLE PATIENT ARCHIVE ECG ANALYZED ...................................................... - 34 -
TABLE 4.5: TABLE PATIENT ARCHIVE ECG ANALYZED ...................................................... - 34 -
TABLE 4.6: TABLE PATIENT ECG TO ARCHIVE ................................................................... - 35 -
TABLE 4.7: TABLE PATIENT FOLLOW UP INFORMATION .................................................... - 35 -
TABLE 4.8: TABLE PATIENT HOSPITALIZATION INFORMATION .......................................... - 36 -
TABLE 4.9: TABLE PATIENT HOSPITALIZATION DISCHARGE SYMPTOMS INFORMATION ... - 36 -
TABLE 4.10: TABLE PATIENT HOSPITALIZATION SYMPTOMS INFORMATION ..................... - 37 -
TABLE 4.11: TABLE PATIENT MEDICAL BACKGROUND INFORMATION .............................. - 38 -
TABLE 4.12: TABLE PATIENT OXYGEN SATURATION INFORMATION ................................. - 38 -
TABLE 4.13: TABLE PATIENT WEIGHT ................................................................................ - 39 -
TABLE 4.14: TABLE PATIENT QUESTIONNAIRE ................................................................... - 39 -
TABLE 4.15: TABLE PATIENT BLOOD PRESSURE ................................................................. - 40 -
TABLE 4.16: TABLE SCORE QUESTIONNAIRE ...................................................................... - 40 -
TABLE 4.17: TABLE SYMPTOMS .......................................................................................... - 40 -
TABLE 4.18: TABLE USER – PATIENT .................................................................................. - 41 -
TABLE 8.1: WEIGHT INPUT MATRICES. ............................................................................... - 79 -
TABLE 8.2.2: ECG ANALYSIS MATRICES. ............................................................................ - 80 -
TABLE 8.3: ECG ARCHIVE MATRICES ................................................................................. - 81 -
TABLE 8.4: KEY INDICATORS FOR 10 USERS’ SIMULATION ............................................... - 84 -
TABLE 8.5: PAGE RESPONSE TIME FOR 25 AND 10 USERS’ SIMULATION .......................... - 85 -
TABLE 8.6: COMPARISONS PCHMS VS. AMEK ..................................................................... - 86 -

xi
LIST OF FIGURES
REFERENCE 2.1.1: ECG OF A 26 YEAR OLD MALE ............................................................... - 9 -
REFERENCE 2.1.2: ECG LEADS - VIEWS OF THE HEART .................................................... - 11 -
REFERENCE 2.2: SCHEMATIC REPRESENTATION OF A NORMAL ECG ................................. - 12 -
REFERENCE 2.3.1: NORMAL SINUS RHYTHM [4] ................................................................ - 13 -
REFERENCE 2.3.2: SINUS BRADYCARDIA [4] ...................................................................... - 14 -
REFERENCE 2.3.3: SINUS TACHYCARDIA [4] ...................................................................... - 14 -
REFERENCE 2.3.4: SUPRAVENTRICULAR TACHYCARDIA (SVT) ABNORMAL [4] ............... - 15 -
REFERENCE 2.3.5: ATRIAL FIBRILLATION [4]..................................................................... - 15 -
REFERENCE 2.3.6: ATRIAL FLUTTER [4] ............................................................................. - 16 -
REFERENCE 2.3.7: 1ST DEGREE AV BLOCK [4] .................................................................. - 16 -
REFERENCE 2.3.8: 2ND DEGREE AV BLOCK TYPE 2 [4] ...................................................... - 17 -
REFERENCE 2.3.9: 3RD DEGREE BLOCK [4] ........................................................................ - 17 -
REFERENCE 3.1: SYSTEM ARCHITECTURE DIAGRAM. ........................................................ - 23 -
REFERENCE 3.2: DETAILED SYSTEM ARCHITECTURE DIAGRAM ....................................... - 24 -
REFERENCE 4.8.1: PATIENTS’ SYSTEM AND APPLICATION SERVER INTERFACE USE CASE
DIAGRAM .................................................................................................... - 48 -
REFERENCE 4.8.2: PATIENTS PORTAL USE CASE DIAGRAM .............................................. - 51 -
REFERENCE 4.8.3: SEQUENCE DIAGRAM ............................................................................ - 53 -
REFERENCE 5.2.1: TECHNICAL SYSTEM INTERFACE ........................................................... - 56 -
REFERENCE 5.2.2: TECHNICAL LOCAL SYSTEM INTERFACE .............................................. - 58 -
REFERENCE 7.2.1 CREATE A NEW LOGIN IN THE MICROSOFT SQL SERVER MANAGEMENT
STUDIO .......................................................................................................... - 67 -
REFERENCE 7.3.2.1 ADD NEW APPLICATION POOL ........................................................... - 69 -
REFERENCE 7.3.2.2 INTERNET INFORMATION SERVICES (IIS) MANAGER ......................... - 69 -
REFERENCE 7.3.2.3 ADD APPLICATION .............................................................................. - 70 -
REFERENCE 8.2.1: ECG INPUT MATRICES AND GRAPH. ..................................................... - 79 -
REFERENCE 8.2.3: ECG ANALYSIS CHART. ........................................................................ - 80 -
REFERENCE 8.2.3: CODE MATRICES. .................................................................................. - 81 -
REFERENCE 8.2.4: OVERALL RESULTS GRAPH. .................................................................. - 83 -
REFERENCE 8.2.5: KEY INDICATORS FOR 25 USERS’ SIMULATION. ................................ - 84 -
REFERENCE 8.2.6: KEY INDICATORS FOR 10 USERS’ SIMULATION. .................................... - 84 -
REFERENCE 8.2.7: PAGE RESPONSE TIME FOR 25 AND 10 USERS’ SIMULATION. ............... - 85 -

- 2 -
Chapter 1
Introduction
1.1 Overview Narrative
1.2 Project Purpose
1.3 Project Structure
1.1 Overview Narrative
The phenomenon of ageing population nowadays constitutes one of the most complex
problems of modern societies. The progress in science and the improvement of hygiene, diet
and health conditions resulted to an increase of the average duration of life expectancy by 20
years internationally during the last fifty years (1950-2000), while a further increase is
expected if current demographic tendencies continue. Cypriot population is also experiencing
demographic ageing (Eurostat, 2006). Elderly’s percentage in Cyprus was 11.65% in 2001. It
is expected to increase up to 28.71% of the whole population until the year of 2025 (Eurostat,
2006). The ageing of population and the increase of the living cost considerably will lead to
increasing demands for health and social care, affecting health care systems (Lambrinou, et
al., 2009; Drennan, et al., 2004; Treharne, 1990).
To cope with the challenges, effective delivery of health and social care will require multi-
disciplinary approach to design appropriate and cost effective solutions (de Bruin, et al., 2009;

- 3 -
Koch, and Hagglund, 2009). Also, the issue of domiciliary living and care is gaining
prominence in the research literature (Ryan, et al., 2009).
Cardiovascular diseases and diseases related to arrhythmias are a problem that affects a large
percentage of the population, and it is one of the main reasons for death in Europe. The
advantage of the rapid technology evolution, regarding the internet, the mobile phones, the
wireless communications and vital parameter sensors is that Man has managed to produce
revolutionary medical monitoring systems, which noticeably improve the lifestyle of patients.
The system that we are going to deal with has as its main purpose to make it easy for doctors
to see and review the patient’s progress, after a cardio surgery when they are released to go
home.
Like every web-based application, in order to achieve a respectable level of status, the system
must offer substantial services. Some typical facilities that our system includes are: doctor
registration, doctors must have the ability to help each other with some patients, patient’s
ECG must be provided to the system in order to be displayed to the doctor, the ECG, in the
case that it is not analyzed, it must be analyzed with the aim of giving the doctors helpful
information.
Another objective of this system is to help patients. With the use of this system they don’t
have to visit the hospital almost every day just for some minutes. With the help of specialized
sensors and other equipment, vital information like ECG, weight, blood pressure and oxygen
saturation will be collected by the patient and sent automatically to the doctor. After that, the
doctor can process that information and decide what action he/she must take. The solution that
will be taken at the patient’s home is not going to be implemented at this stage of the project.

- 4 -
The current project will build upon and further past research, incorporating multiple,
disparate technologies in one cohesive system focussing on the reasoning and
inferencing components of the system via the application of innovative machine
learning techniques and transferring this into a viable home automation-based
product that can handle this complex domain and meet the needs of elders.
Additionally, will focus on the development of an automated monitoring and care provision
system based on a set of dedicated software applications running on top of a platform
designed to allow mobile context-aware applications to focus on the real-world activity
domain sensing, activity recognition and medical monitoring of elderly people. The whole
system will be based on novel sensor network technologies, signal processing techniques as
well as several telemedicine technologies in order to achieve monitoring functions.
1.2 Project purpose
Cardiovascular diseases are a problem that affects a big percentage of the population, with
many subjects needing. When a patient has to undergo a surgery he/she has to visit the
hospital every day, at least the first 15 days in order to get his/her vital information. That
information is the ECG, the weight, blood pressure and finally the oxygen saturation. This
action consumes a lot of the doctor’s time and effort; furthermore the patient has to visit the
hospital every day, and this is not the best solution for the patient because not everybody lives
near the hospital.
With the help of technology we can provide a system that will control and help both parties,
the patients and the doctors. Technology nowadays provides several tools that can be used to
manage this. Several sensors are going to be used in order to get the patient’s ECG and send it
to the system. The patient has to measure his/her weight, his/her blood pressure and with the
help of a sensor he/she will calculate his/her oxygen saturation. That information will be
recorded by the system and will be displayed to the doctor.

- 5 -
With this system it is not necessary for the patient to visit the hospital every day. The doctor is
able to view the vital information that he needs from the system without the need of the
patient to be there.
The phenomenon of the aging population in one of the biggest challenges in the Western
society, including Cyprus, as it addresses the needs of 50% of the active population in 2050 in
an economically sustainable and effective way. In view of the complexity of older peoples’
needs, it is clear that older people need an important degree of resource with their daily
activities, both from formal and family carers, including the scientific, the economic and the
community resources. Without this input it is difficult to envisage them remaining in the
community. The ultimate aim of health informatics is to create a safe environment in the
community and their home, improving the quality of care and the quality of life (living in their
place, outside a hospital or a nursery) in a cost-efficient way.
The scientific objectives of this project will focus on a multidisciplinary approach, combining
the novel application of innovative software with advanced capabilities, health monitoring
devices, as well as low-cost wireless sensor networks, and home automation technology and
systems in order to transform elderly homes into affordable Secure Intelligent Assisted Living
environments, where our growing numbers of the elderly can live safely and independently.

- 6 -
More specifically the objectives are:
1. Trigger clinicians to the early signs and symptoms of decompensation by
telemonitoring the electrocardiogram (ECG), non invasive blood pressure (BP), heart
rate (HR) and oxygen saturation (SpO2).
2. Reduce the risk of house hazards (eg fire hazards, falls, accidents) by monitoring
safety and
3. Promote health associated quality of life by monitoring routine tasks and activities (eg
whether an elderly is eating regularly, takes his medication in regular time answering
the phone etc)
1.3 Project Structure
This thesis has the following chapter structure:
• Chapter 2 – Theoretical Background: The second chapter contains the necessary
information about Electrocardiography (ECG), e-health systems and necessary information
concerning previous work.
• Chapter 3 – System Requirements: In this chapter we are going to examine the system
that we are going to implement and on the other hand we are going to see the functional
specifications of the system.
• Chapter 4 – System Specifications: In this chapter we are going to examine all the input
and output information that we collect from the users.
• Chapter 5 – System Design: Chapter five analyzes all the information for the design the
system.
• Chapter 6 – Implementation Phase: In this chapter we describe in detail how the system
will be designed and implemented. We are going to see what tools are going to be needed.

- 7 -
• Chapter 7 – Installation Phase: In this chapter we are going to list the necessary
information needed for the project installation.
• Chapter 8 – System Evaluation Phase: In this chapter we are going to provide
information concerning the system testing and evaluation.
• Chapter 9 – Conclusions and Future Work: In this chapter we are going to see the
conclusions and future work.

- 8 -
Chapter 2
Theoretical Background
2.1 Electrocardiography (ECG)
2.2 Characteristics of Normal–ECG
2.3 ECG Rhythms
2.4 Web Applications and health systems
2.1 Electrocardiography (ECG)
“Electrocardiography (ECG or EKG) is a transthoracic interpretation of
the electrical activity of the heart over time captured and externally recorded by skin
electrodes. It is a noninvasive recording produced by an electrocardiographic device. The
etymology of the word is derived from electro, because it is related to electrical
activity, cardio, and graph” [1], refer to fig. 2.1.1.

- 9 -
Reference 2.1.1: ECG of a 26 year old male
Electrical impulses in the heart originate in the sinoatrial node and travel through the intrinsic
conducting system to the heart muscle. The impulses stimulate the myocardial muscle fibers
to contract and thus induce systole. The electrical waves can be measured at electrodes placed
at specific points on the skin. Electrodes on different sides of the heart measure the activity of
different parts of the heart muscle. An ECG displays the voltage between pairs of these
electrodes, and the muscle activity that they measure, from different directions, can also be
understood as vectors. This display indicates the overall rhythm of the heart and weaknesses
in different parts of the heart muscle. It is the best way to measure and diagnose abnormal
rhythms of the heart, particularly abnormal rhythms caused by damage to the conductive
tissue that carries electrical signals, or abnormal rhythms caused by electrolyte imbalances. In
a myocardial infarction (MI), the ECG can identify if the heart muscle has been damaged in
specific areas, though not all areas of the heart are covered. The ECG cannot reliably measure
the pumping ability of the heart, for which ultrasound-based (echocardiography) or nuclear
medicine tests are used [1].

- 10 -
2.1.1 Placement of electrodes
Ten electrodes are used for a 12-lead ECG. They are labeled and placed on the patient's body
as follows [1]:
•••• RA - On the right arm.
•••• LA - In the same location that RA was placed, but on the left arm this time.
•••• RL - On the right leg.
•••• LL - In the same location that RL was placed, but on the left leg this time.
•••• V1 - In the fourth intercostal space (between ribs 4 & 5) just to the right of the sternum
(breastbone).
•••• V2 - In the fourth intercostal space (between ribs 4 & 5) just to the left of the sternum.
•••• V3 - Between leads V2 and V4.
•••• V4 - In the fifth intercostal space (between ribs 5 & 6) in the mid-clavicular line.
•••• V5 - Horizontally even with V4, but in the anterior axillary line.
•••• V6 - Horizontally even with V4 and V5 in the midaxillary line.

- 11 -
Reference 2.1.2: ECG Leads - Views of the Heart [4]
2.2 Characteristics of Normal ECG
The normal EKG (ECG) is composed of a P wave, a QRS complex and a T wave. The P
wave represents atrial depolarization and the QRS represents ventricular depolarization. The
T wave reflects the phase of rapid repolarization of the ventricles [2]. P wave represents atrial
depolarization, it is the time necessary for an electrical impulse from the sinoatrial (SA) node
to spread through the atria musculature. The QRS complex represents the Ventricular
contractions. And finally T wave is the electrical activity produced when the ventricles are
recharging for the next contraction (repolarizing). The electrical activity results in P, QRS,
and T waves that are of different sizes and shapes. When viewed from different leads, these
waves can show a wide range of abnormalities of both the electrical conduction system and
the muscle tissue of the heart’s 4 pumping chambers [4].

- 12 -
Reference 2.2: Schematic representation of a normal ECG [2]
The P-Wave starts before the QRS complex. It should not exceed 2.5mm in height. Its
duration must be between 0.06 and 0.11 seconds.
The P-R Interval represents the time it takes for an impulse to travel from the atria through
the AV node, bundle of His, and bundle branches to the Purkinje fibres [4]. It extends from
the beginning of the P wave to the beginning of the QRS complex. It lasts from 0.12 to 0.20
seconds.
The QRS Complex represents ventricular depolarisation. It consists of three waves: the Q
wave, the R wave, and the S wave. The Q wave is placed at the beginning of the QRS
complex. Q may not be present. On the other hand the R wave is always the first positive
deflection. Furthermore the S wave, the negative deflection, follows the R wave. The QRS
follows the P-R interval. QRS normal values vary with age and sex. Its duration must be no
longer than 0.10 seconds.
The Q-T Interval represents the time necessary for ventricular depolarization and
repolarization [4]. It extends from the beginning of the QRS complex to the end of the T wave
(it includes the QRS complex, S-T segment, and the T wave). Its duration varies according to
age, sex, and heart rate.

- 13 -
The T Wave represents the repolarization of the ventricles. On rare occasions, a U wave can
be seen following the T wave. The U wave reflects the repolarization of the His-Purkinje
fibres [4]. It follows the S wave and the S-T segment
Amplitude: 5mm or less in standard leads I, II, and III; 10mm or less in precordial leads V1-
V6. Its duration is not usually measured.
The S-T Segment represents the end of the ventricular depolarization and the beginning of
ventricular repolarization [4]. It extends from the end of the S wave to the beginning of the T
wave. Its duration is not usually measured.
2.3 ECG Rhythms
2.3.1 Normal Sinus Rhythm
The ECG Rhythm is regular, the Rate is between 60 and 100 bpm. The QRS duration is
normal. The P Wave is visible before each QRS complex. On the other hand P-R Interval is
Normal is <5 small Squares. Anything above this would be 1st degree block [4]. This
indicates that the electrical signal is generated by the sinus node and travelling in a normal
fashion in the heart [4].
Reference 2.3.1: Normal Sinus Rhythm [4]
2.3.2 Sinus Bradycardia
The heart rate in this case is less than 60 beats per minute (BPM). In the case of an athletic
person this is may be “normal”, but other causes may be due to increased vagal tone from

- 14 -
drug abuse, hypoglyceamia and brain injury with increased intracranial pressure (ICP). We
can see from the ECG example that the rhythm is regular, but the rate is less than 60 beats per
minute. On the other hand the QRS duration is normal. In this case the P wave is visible
before each QRS complex. Furthermore the PR interval is normal.
Reference 2.3.2: Sinus Bradycardia [4]
2.3.3 Sinus Tachycardia
In this case we can observe an excessive heart rate above 100 beats per minute (BPM) which
originates from the SA node. It can be caused by stress, fright, illness and exercise. Not
usually a surprise if it is triggered in response to regulatory changes e.g. shock. But if there is
no apparent trigger then medications may be required to suppress the rhythm [4].
We view that rhythm is regular. The heart date is more than 100 beats per minute. On the
other hand QRS Duration is normal. P Wave is visible before each QRS complex. But P-R
interval is Normal. The impulses generating the heart beats are normal, but they are occurring
at a faster pace than normal. Seen during exercise [4].
Reference 2.3.3: Sinus Tachycardia [4]

- 15 -
2.3.4 Supraventricular Tachycardia Abnormal
A narrow complex tachycardia or atrial tachycardia which originates in the 'atria' but is not
under direct control from the SA node. SVT can occur in all age groups[4]. The rhythm is
regular. In this case the heart Rate is between 140 and 220 beats per minute. The QRS
duration is usually normal. The P wave is often masked in the preceding T wave. P-R interval
depends on the site of the supraventricular pacemaker [4]. Impulses stimulating the heart are
not being generated by the sinus node, but instead are coming from a collection of tissue
around and involving the atrioventricular (AV) node [4].
Reference 2.3.4: Supraventricular Tachycardia (SVT) Abnormal [4]
2.3.5 Atrial Fibrillation
Many sites within the atria are generating their own electrical impulses, leading to irregular
conduction of impulses to the ventricles that generate the heartbeat. This irregular rhythm can
be felt when palpating a pulse [4]. We observe that rhythm is irregularly irregular.
Furthermore the Heart Rate is usually between 100 and 160 beats per minute, but in the case
of medication it is slower. The QRS duration is usually normal. The P wave is not
distinguishable as the atria are firing off all over [4]. PR interval is not measurable. The atria
fire electrical impulses in an irregular fashion causing irregular heart rhythm.
Reference 2.3.5: Atrial Fibrillation [4]

- 16 -
2.3.6 Atrial Flutter
In this case the rhythm is regular. The heart rate is around 110 beats per minute. The QRS
duration is usually normal. We notice that the P wave is replaced with multiple F (flutter)
waves, usually at a ratio of 2:1 (2F - 1QRS) but sometimes 3:1. The p wave rate is 300 bits
per minute. Furthermore the PR interval is not measurable. As with SVT the abnormal tissue
generating the rapid heart rate is also in the atria, however, the atrioventricular node is not
involved in this case.
Reference 2.3.6: Atrial Flutter [4]
2.3.7 1st Degree AV Block
1st Degree AV block is caused by a conduction delay through the AV node but all electrical
signals reach the ventricles. This rarely causes any problems by itself and often trained
athletes can be seen to have it. The normal PR interval is between 0.12s to 0.20s in length, or
3-5 small squares on the ECG [4].
In this case the rhythm is regular as well as the heart rate, QRS duration and P wave rate are
normal. On the other hand P wave ration is 1:1. PR interval is prolonged >5 small squares.
Reference 2.3.7: 1st Degree AV block [4]

- 17 -
2.3.8 2nd Degree AV Block Type 2
When electrical excitation sometimes fails to pass through the A-V node or bundle of His, this
intermittent occurrence is said to be called second degree heart block. Electrical conduction
usually has a constant P-R interval; in the case of type 2 block atrial contractions are not
regularly followed by ventricular contraction [4].
We can notice from the diagram that the Rhythm is Regular. Heart Rate is normal or slow. On
the other hand QRS duration is prolonged. P Wave Ratio is 2:1 or 3:1. The P Wave rate is
normal but faster than QRS rate. Furthermore the PR Interval is normal or prolonged but
constant.
Reference 2.3.8: 2nd Degree AV block type 2 [4]
2.3.9 3rd Degree Block
3rd degree block or complete heart block occurs when atrial contractions are 'normal' but no
electrical conduction is conveyed to the ventricles. The ventricles then generate their own
signal through an 'escape mechanism' from a focus somewhere within the ventricle. The
ventricular escape beats are usually 'slow' [4]. We can observe that the rhythm is regular. But
on the other hand the heart rate is slow. QRS duration is prolonged. The P wave is unrelated
and the rate is normal but faster than the QRS rate. The PR interval has variations. Complete
AV block. No atrial impulses pass through the atrioventricular node and the ventricles
generate their own rhythm.
Reference 2.3.9: 3rd Degree block [4]
- 18 -
2.4 Web Applications and health systems
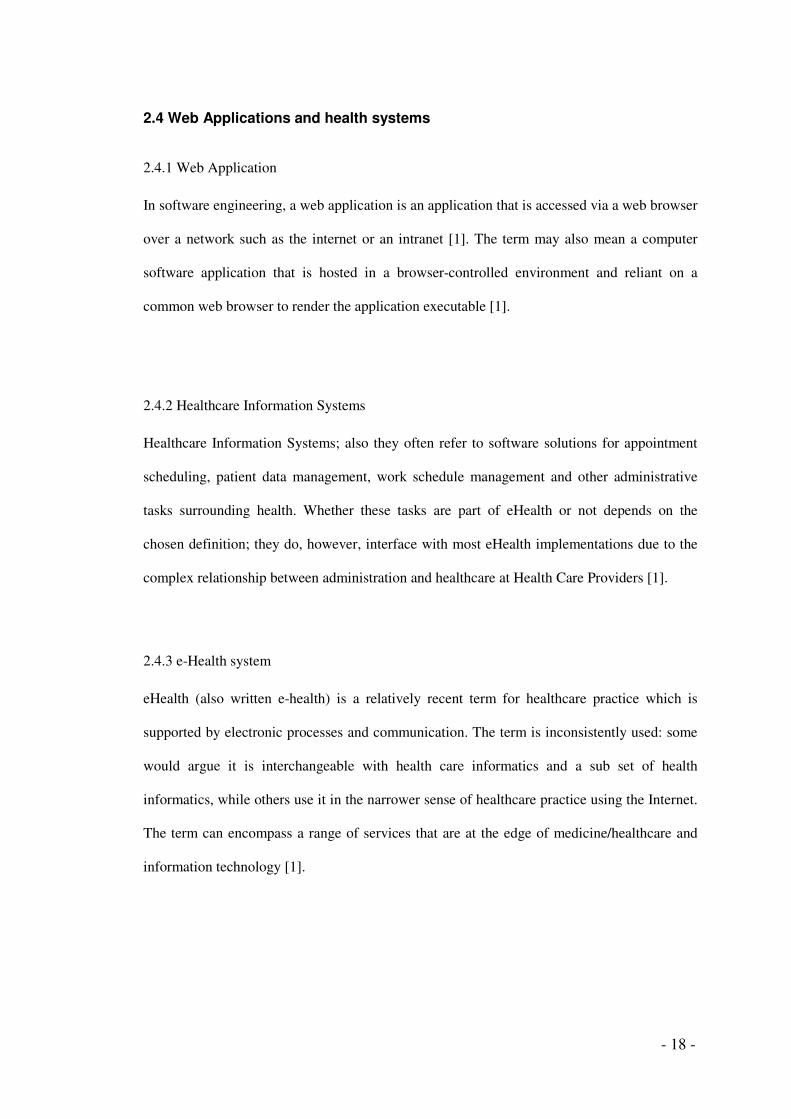
2.4.1 Web Application
In software engineering, a web application is an application that is accessed via a web browser
over a network such as the internet or an intranet [1]. The term may also mean a computer
software application that is hosted in a browser-controlled environment and reliant on a
common web browser to render the application executable [1].
2.4.2 Healthcare Information Systems
Healthcare Information Systems; also they often refer to software solutions for appointment
scheduling, patient data management, work schedule management and other administrative
tasks surrounding health. Whether these tasks are part of eHealth or not depends on the
chosen definition; they do, however, interface with most eHealth implementations due to the
complex relationship between administration and healthcare at Health Care Providers [1].
2.4.3 e-Health system
eHealth (also written e-health) is a relatively recent term for healthcare practice which is
supported by electronic processes and communication. The term is inconsistently used: some
would argue it is interchangeable with health care informatics and a sub set of health
informatics, while others use it in the narrower sense of healthcare practice using the Internet.
The term can encompass a range of services that are at the edge of medicine/healthcare and
information technology [1].
- 19 -
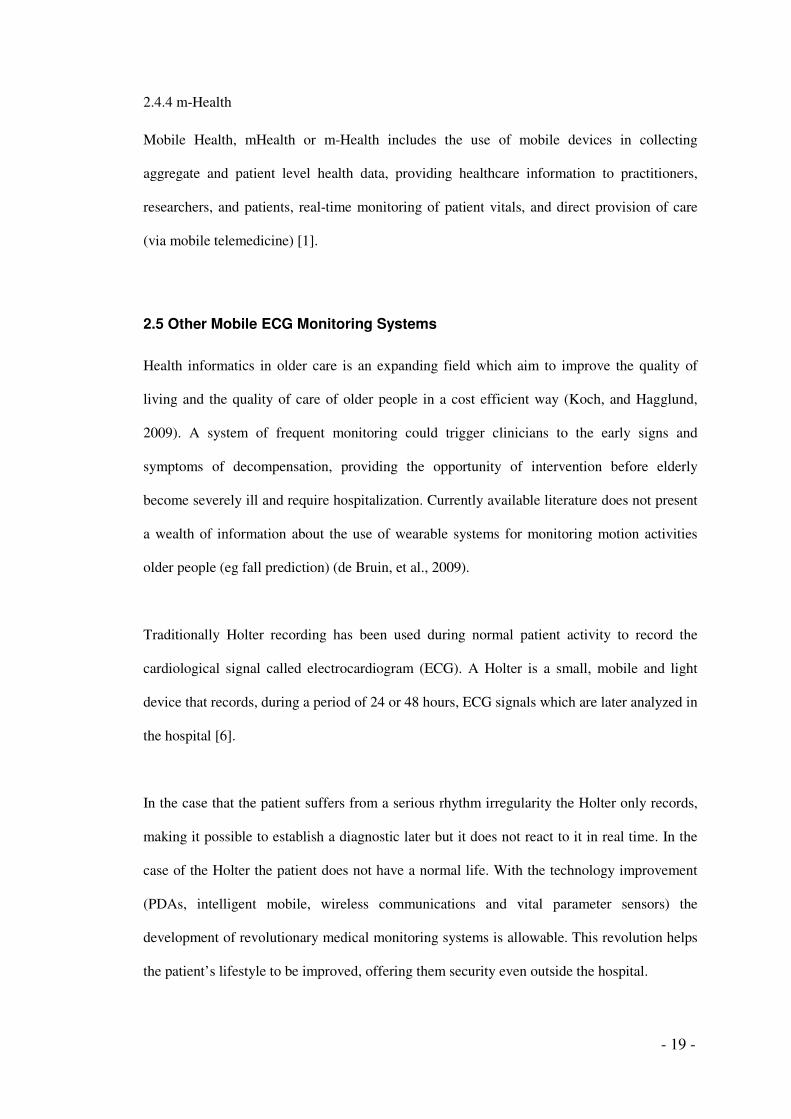
2.4.4 m-Health
Mobile Health, mHealth or m-Health includes the use of mobile devices in collecting
aggregate and patient level health data, providing healthcare information to practitioners,
researchers, and patients, real-time monitoring of patient vitals, and direct provision of care
(via mobile telemedicine) [1].
2.5 Other Mobile ECG Monitoring Systems
Health informatics in older care is an expanding field which aim to improve the quality of
living and the quality of care of older people in a cost efficient way (Koch, and Hagglund,
2009). A system of frequent monitoring could trigger clinicians to the early signs and
symptoms of decompensation, providing the opportunity of intervention before elderly
become severely ill and require hospitalization. Currently available literature does not present
a wealth of information about the use of wearable systems for monitoring motion activities
older people (eg fall prediction) (de Bruin, et al., 2009).
Traditionally Holter recording has been used during normal patient activity to record the
cardiological signal called electrocardiogram (ECG). A Holter is a small, mobile and light
device that records, during a period of 24 or 48 hours, ECG signals which are later analyzed in
the hospital [6].
In the case that the patient suffers from a serious rhythm irregularity the Holter only records,
making it possible to establish a diagnostic later but it does not react to it in real time. In the
case of the Holter the patient does not have a normal life. With the technology improvement
(PDAs, intelligent mobile, wireless communications and vital parameter sensors) the
development of revolutionary medical monitoring systems is allowable. This revolution helps
the patient’s lifestyle to be improved, offering them security even outside the hospital.

- 20 -
2.5.1 M-Health Monitoring System for Children with Suspected Arrhythmias
This system is based on sensor networks, in order to monitor the patient, the sensors are
placed in a predefined area like his/her house. On the other hand a module based on PDAs and
wearable ECG recorders was used in order to extend the coverage outside the patient’s house.
This m-Health system is monitoring children continuously during their daily life activities.
This system is a real-time system; it gathers and transmits ECG signals from the patient and it
offers alarms when it detects possible arrhythmias.
The system covers two cases, the first case is the case that the patient is at home and the
second case is when the patient is moving (outside the house).
FIRST CASE: IN-HOUSE CASE
During this case, a sensor network is installed in the child’s house in order to continuously
monitor ECG signals from the patient [7]. Other environmental parameters will be collected,
like light, temperature, sound acceleration in order to check the existing conditions.
The ECG signal will be recorded by a sensor carried by the child, and it will be part of a
wireless sensor network (WSN) installed in the house [7]. Signal information from the
wearable sensor will be sent to a local monitoring station which will also act as a gateway to
the rest of the monitoring network [7].
SECOND CASE: MOVING PATIENT CASE
For this case, the child is monitored using the same ECG recording device but the signals are
transmitted, through a PDA device, directly to the central monitoring system using of 2.5G
and 3G mobile communication networks (GPRS/UMTS).

- 21 -
Vital information will be stored locally on the PDA and basic analysis of the ECG signal is
performed. Furthermore, the central station analyses, stores and displays the information. On
the other hand notification in the case of an alarm is provided to the relative and to the on-call
doctor.
2.5.2 A Web Access to Data in a Mobile ECG Monitoring System
The system that was developed by the University of the Basque Country was designed to
capture record and locally analyze the ECG signals in a PDA carried by the patient. This
system uses several methods that can detect, with high precision, risk arrhythmias that the
user is suffering from [6].
Alarms are sent in time to an alarm center in order to receive the proper medical assistance
through GPRS [6]. The system has been designed to optimize limited and expensive resources
like PDA memory size and wireless communication costs [6]. This system has an innovate
feature; it contains web services that query the data computed in the PDA. This feature gives
the opportunity to authorized people to have easy access to that data.

- 22 -
Chapter 3
System Requirements
3.1 Introduction
3.2 System Requirements
3.3 Major Processes
3.1 Introduction
3.1.1 System’s Purpose and System Function
Our system will gather all the necessary information concerning patients, such as weight,
blood pressure, oxygen saturation and ECG (analyzed or not), in the case that the ECG is not
analyzed the system must analyze it to facilitate extra and helpful information to the doctor.
Each doctor can see his patient’s information; on the other hand, he must have the ability to
give or remove access to other doctors, to see the patient’s information, statistics and other
information in order to help each other to get some decisions.

- 23 -
Reference 3.1: System Architecture Diagram.
Web application – The Patient’s Portal provides site functionality as historical information is
stored and maintained by the system for the patients. Medical background information, patient
hospitalization information, the patient’s symptoms are collected. Furthermore, questionnaires
are provided before and after the treatment in order to calculate Physical, Emotional, Global
Score and Sum Score, although patient’s calls and follow up information are stored in the
system.
Also the Hospital system is used to store, analyze and archive patients’ information. The
system is able to facilitate and provide all the necessary functionality to the doctors and the
nurses. Reference 3.1 shows the System architecture diagram.

- 24 -
3.2 System Requirements
3.2.1 System operations and functions
Application server Functionality
The patient must evaluate his vital information every day. That information will be gathered
from the system that will be located at the patient’s home. With the help of web service
technology this information will be sent to the central system: the Application Server. The
web services that are provided by the Application Server contain the following methods
AddWeight that can be used to set the patient’s weight, and AddOxygenSaturation which can
be used to send the patient’s oxygen saturation. Moreover, the AddBloodPressure method can
be used to send the patient’s blood pressure. Additionally two more methods are provided
AddECGNotANalyzed and AddECGAnalyzed. Those methods can be used in order to send the
patient’s ECG to the Application server; further information concerning the Web Service and
web service methods and types can be found at Appendix I.
Reference 3.2: Detailed System Architecture Diagram
ECG Analysis Server
Application Server stores ECG, and the ECG Analysis Server which is scheduled to the
server, is running in predefined time, and checks if there is new ECG information that it has
not been analyzed yet, if it has not been analyzed, then it analyzes it and stores it back to the
server. Additionally, log files are provided by the system for auditing purposes. ECG Analysis

- 25 -
Server is calling the ECGAnalysis module which is used to analyze the ECG and finds out
that there is an arrhythmia, which this module developed in the previous project.
ECG Archive Server
Another important background process is the ECG Archive Server which is also scheduled at
the server to run in a predefined period of time. It is used to archive the patient’s ECG which
is scheduled to be done by the doctor. The archive process is important to be done to
minimize the ECG analysis time and the ECG preview process. By archiving the ECG data
which are too many, the size of the ECG table is minimized; with this action we optimize read
and write actions to that table.
Patients’ Portal – Web Application
After all the background processing, doctors and nurses are able to view and maintain
Patients’ information using the Patients’ Portal Web Application. The portal provides the
users the necessary security procedures that are required, as well as auditing information
stored in the server. The portal is accessible from the WEB. Patient information maintenance
and side functionality concerning the patient history as well as vital information, and statistics
are provided for viewing by the permitted users. Reference 3.2 shows the Detailed System
Architecture Diagram.

- 26 -
3.2.1.1 Basic System operations and functions
The System will consist of the following operations and functions:
Doctor registration
Patient Registration which can be done by the doctor or the nurse
Doctor must have the ability to give access to another doctor as contributor or just as a
viewer.
Before and after patient’s treatment several scores will be measured based on some
predefined questionnaire.
Historical information relating to previous diseases, medical background and
symptoms, is handled.
Patient calls and follow-up information are handled by the system.
Several statistics and graphs will be provided to the doctor such as
o ECG
o Weight
o Blood pressure
o Oxygen saturation
o Score statistics
The doctor has the ability to schedule an archive process for the patient’s ECG.
3.3 Major Processes
3.3.1 Registration Process
This is the process where Doctors and Nurses are enabled to register and provide a username
and password which will enable them to access the system in the future. Additionally, in this
process the doctors are able to add patients.

- 27 -
3.3.2 Adjustment Process
By this process the user names and passwords and user role are checked for verification
purposes. The doctor has the facility to give or remove access to some other doctor to review
patient information and help him to take a decision.
3.3.3 Analysis Process
This is the process that will take the patient’s ECG and analyze it, in order to give extra
information to the doctor such as if the patient has arrhythmia and other information.
3.3.4 Vital Information Preview Process
This is the process that will use the necessary components and information after the analysis
procedure, and will display the patient’s ECG as well as other collected information to the
doctors.
3.3.5 Archive Process
This is the process that will be scheduled on the server, in order to archive the ECG for
optimization, (refer to 3.2.1 for additional information).

- 28 -
Chapter 4
System Specifications
4.1 Introduction
4.2 System Inputs
4.3 Entity Relationship Diagram
4.4 Process Flow Diagram (PFD)
4.5 Database Structure
4.6 Data Files
4.7 Class Diagram
4.8 Sequence Diagram
4.1 Introduction
A System Requirements Specification is a structured collection of information that embodies
the requirements of the system [1].
The system requirements specification document must contain the problem, the system
functionality and the rules that must be applied. This information must be accurate and
reliable because, based on that information; the system will be designed and implemented.

- 29 -
4.2 System Inputs
System input information concerning the patient and his vital information are listed below
(refer to Appendix I for user input forms):
• Doctor, Secretary and Nurse Registration
• Patient Information
o Patient personal information
o Patient hospitalization information
o Patient medical background
o Information during hospitalization
o Information concerning patients release from hospital
o Follow up information
o Questionnaire
• Remotely input information
o ECG Input from another system
o Weight
o Oxygen Saturation
o Blood Pressure
4.3 Entity Relationship Diagram
Entity-relationship model (ERM) is an abstract and conceptual representation of data. Entity-
relationship modeling is a database modeling method, used to produce a type of conceptual
schema or semantic data model of a system, often a relational database, and its requirements
in a top-down fashion. Diagrams created by this process are called entity-relationship
diagrams, ER diagrams, or ERDs [1]. Refer to Appendix II for the ERD.

- 30 -
4.4 Process Flow Diagram (PFD)
The process flow diagram PFD displays the relationship between major equipment of a plant
facility and does not show minor details such as piping details and designations. Another
commonly-used term for a PFD is a flowsheet. Refer to Appendix III for more details.
4.4.1 Collect Vital Information
The vital information which is the patient’s weight, blood pressure and oxygen saturation are
collected using a web service. This web service is accessible from the web and it is accessible
from the patient’s station.
4.4.2 Collect ECG Information
The ECG information is collected using a web service. This web service is accessible from the
web and it is accessible from the patient’s station. A butch of ECG data is sent to the central
unit.
4.4.3 User Input
The users of the system, which are Doctor, Nurse and secretary can register to the system;
additionally they can maintain the patients. Furthermore doctors have the ability to view and
maintain patients’ vital information and ECG information.
4.4.4 Process Coordination
This process concerns the central unit of the system. This process collects all the vital
information, ECG Information and user input and gets the decision which process to call;
additionally it stores the information in order to be accessible any time.

- 31 -
4.4.5 ECG Analysis
When the Process coordinator collects the ECG then if that ECG is not analyzed it calls the
ECG Analysis process. This process gets one by one the ECG voltage and analyzes it in order
to determine if there is arrhythmia and if there is it defines what arrhythmia is.
4.4.612 Display ECG
When the Doctor wants to see the patient’s ECG then it triggers the Display ECG Process.
This process, based on doctors’ filter conditions, gets the ECG data from the database and
displays it graphically.
4.4.7 Display Vital Information
When the Doctor wants to see the patient’s vital information then it triggers the Display Vital
Information Process. This process, based on doctors’ filter conditions, gets the Weight, Blood
Pressure and Oxygen Saturation data from the database and displays it graphically.
4.4.8 ECG Archive
After the patient’s treatment the Doctor has the opportunity to schedule the archive process.
The ECG Archive process gets the ECG data and stores this information to an archive table in
order to optimize read and write the process to the original ECG data.
4.4.9 Data Storage
Data are collected from the “Collect Vital Information Process”, the “Collect ECG
Information Process” and from the user; then based on the instructions that it gets from the
“Process Coordination Process” it stores, updates and deletes the data to the database.

- 32 -
4.5 Database structure
The Database structure which represents logically-related records and files (tables) is
consolidated into a common pool that provides data for one or more multiple uses. System
Database Structure can be found at Appendix IV.
4.6 Data Files
All the files of our system will be indexed and normalized.
4.6.1 Table Patient
This Tbl_Patient table contains the entire patient’s personal and demographic information.
The primary key of the table is the PatientID.
Field Name Field type and length
PatientID int
Name nvarchar(150)
Surname nvarchar(150)
AHI_ID nvarchar(50)
Gender int
Birthday datetime
Nationality nvarchar(150)
Telephone nvarchar(50)
Telephone1 nvarchar(50)
Email nvarchar(250)
MaritalStatus int
Education int
Profession nvarchar(250)
Stay int
EjectionFraction int
DeathReason nvarchar(4000)
DeathDateTime datetime
DateLastUpdate datetime
UserLastUpdate nvarchar(150) Table 4.1: Table Patient

- 33 -
4.6.2 Table Patient Calls
This Tbl_Patient_Calls table contains patient’s calls information. The primary key of the table
is the ID and it is related with the TBL_Patient with the field FK_PatientID.
Field Name Field type and length
ID int
FK_PatientID int
Reason nvarchar(4000)
PersonAnsewer nvarchar(200)
EmergensyRoomVisit int
DateTimeCall datetime
DateLastUpdate datetime
UserLastUpdate nvarchar(150) Table 4.2: Table Patient Calls
4.6.3 Table Patient ECG Analyzed
The tbl_Patient_ECG_Analized table contains the patient’s analyzed ECG information. The
primary key of the table is the ID and it is related with the TBL_Patient with the field
FK_PatientID.
Field Name Field type and length
ID int
FK_PatientID int
ECGVoltage int
Analisys varchar(50)
TimeStamp datetime
dateLastUpdate datetime Table 4.3: Table Patient ECG Analyzed

- 34 -
4.6.4 Table Patient Archive ECG Analyzed
The Tbl_Patient_ECG_Analyzed_History is the table that contains the patient’s historically
analyzed ECG information. The primary key of the table is the ID and it is related with the
TBL_Patient with the field FK_PatientID.
Field Name Field type and length
ID int
FK_PatientID int
ECGVoltage int
Analisys varchar(50)
TimeStamp datetime
dateLastUpdate datetime Table 4.4: Table Patient Archive ECG Analyzed
4.6.5 Table Patient Archive ECG Analyzed
The Tbl_Patient_ECG_NotAnalized is the temporary table contains the patient’s ECG
information before it is analyzed, after the analysis the data are deleted automatically from the
table. The primary key of the table is the ID and it is related with the TBL_Patient with the
field FK_PatientID.
Field Name Field type and length
ID int
FK_PatientID int
ECGVoltage int
BatchTimeStamp datetime
TimeStamp datetime
dateLastUpdate datetime Table 4.5: Table Patient Archive ECG Analyzed

- 35 -
4.6.6 Table Patient ECG to Archive
The Tbl_Patient_ECG_ToArchive table is used to store the patient ID that it has to be
archived. The primary key of the table is the ID and it is related with the TBL_Patient with the
field FK_PatientID.
Field Name Field type and length
ID int
FK_PatientID int
UserLastUpdate varchar(150)
DateLastUpdate datetime Table 4.6: Table Patient ECG to Archive
4.6.7 Table Patient Follow Up information
The TBL_Patient_FollowUP table is used to store the patient’s follow up information. The
primary key of the table is the ID and it is related with the TBL_Patient with the field
FK_PatientID.
Field Name Field type and length
ID int
FK_PatientID int
RecruitmentDate datetime
RGroup int
Doctor nvarchar(200)
NurseEducator nvarchar(200) Table 4.7: Table Patient Follow Up information

- 36 -
4.6.8 Table Patient Hospitalization information
The Tbl_Patient_Hospitalization table is used to store the patient’s Hospitalization
information. The primary key of the table is the HospitalizationID and it is related with the
TBL_Patient with the field FK_PatientID.
Field Name Field type and length
HospitalizationID int
FK_PatientID int
HospitalizationDate datetime
HowRecruitment int
Escort int
Dyspnoea int
SymptomsOnImport nvarchar(50)
CoronaryIllness int
SergioProcedure nvarchar(2000)
SergionDate datetime
LeaveHospitalDate datetime
DateLastUpdate datetime
UserLastUpdate nvarchar(150) Table 4.8: Table Patient Hospitalization information
4.6.9 Table Patient Hospitalization Discharge Symptoms information
The Tbl_Patient_Hospitalization_ discharge _ Symptoms table is used to store the patient’s
symptoms after his hospitalization discharge. The primary key of the table is the ID and it is
related with the Tbl_Symptoms with the field FK_SymptomID and with the
Tbl_Patient_Hospitalization with the field FK_HospitalizationID.
Field Name Field type and length
ID int
FK_SymptomID int
FK_HospitalizationID int
DateLastUpdate datetime
UserLastUpdae nvarchar(150) Table 4.9: Table Patient Hospitalization Discharge Symptoms information

- 37 -
4.6.10 Table Patient Hospitalization Symptoms information
The Tbl_Patient_Hospitalization_Symptoms table is used to store the patient’s symptoms at
his hospitalization. The primary key of the table is the FK_SymptomID and
FK_HospitalizationID.
Field Name Field type and length
FK_HospitalizationID int
FK_SymptomID int
DateLastUpdate datetime
UserLastUpdate nvarchar(150) Table 4.10: Table Patient Hospitalization Symptoms information
4.6.11 Table Patient Medical Background information
The Tbl_Patient_MedicalBackground table is used to store the patient’s medical background
information. The primary key of the table is the FK_PatientID and it is related 1:1 with the
TBL_Patient with the primary key.
Field Name Field type and length
FK_PatientID int
Alergies nvarchar(500)
PreviousImports int
PreviousImportsReason nvarchar(2000)
ChirurgicalIntervetions nvarchar(2000)
OlderDisease nvarchar(2000)
ChronicAccompanyingDisease int
RheumaticDisease int
Exercising int
UseSubstances int
FamilyHeardProblemsBackground int
FamilyHeardProblemsBackgroundTotal int
FactorsHypertension int
FactorsDiabetes int
FactorsAlcoholAbuse int
FactorsHyperlipidemia int
FactorsObesity int
FactorsCardiotoxicMedicines int
FactorsSmoking int
FactorsActiveSmoker int
AmenableCoronarIllness int
AmenableArrhythmias int

- 38 -
AmenableAngiography int
AmenableAngiographyDate datetime
AmenableBalloonAngioplasty int
AmenableBalloonAngioplastyDate datetime
AmenablePermanentPacemaker int
AmenablePermanentPacemakerDate datetime
AmenableAddedValves int
AmenableAddedValvesDate datetime
DiseaseCoronary int
DiseaseValvular int
DiseaseArrhythmias int
DiseaseHypertensiveCardiomyoeathy int
DiseaseCardiomyopathy int
DiseaseChronicAtrialFibrilation int
DiseaseOther nvarchar(1000)
ComorbiditiesRheumaticDisease int
ComorbiditiesCOPD int
ComorbiditiesAsthma int
ComorbiditiesStroke int
ComorbiditiesFailure int
ComorbiditiesOther varchar(1000)
AblationTherapy int
CardiacArest int
Sergery nvarchar(4000)
DateOfSergery datetime
Surgeon nvarchar(500)
DateLastUpdate datetime
UserLastUpdae nvarchar(150) Table 4.11: Table Patient Medical Background information
4.6.12 Table Patient Oxygen Saturation information
The Tbl_Patient_Oxygen_Saturation table is used to store the patient’s oxygen saturation. The
primary key of the table is the ID and it is related with TBL_Patient with FK_PatientID .
Field Name Field type and length
ID int
FK_PatientID int
Oxygen_Saturation real
DateLastUpdate datetime Table 4.12: Table Patient Oxygen Saturation information

- 39 -
4.6.13 Table Patient Weight
The Tbl_Patient_Weight table is used to store the patient’s weight. The primary key of the
table is the ID and it is related with TBL_Patient with FK_PatientID.
Field Name Field type and length
ID int
FK_PerientID int
Weight numeric(18, 3)
DateLastUpdate datetime Table 4.13: Table Patient Weight
4.6.14 Table Patient Questionnaire
The TBL_PatientQuestion table is used to store the answers of the patient before and after the
treatment. The primary key of the table is the ID and it is related with TBL_Patient with
FK_PatientID and with the TBL_Scores_Questioner with the FK_QuestionID.
Table 4.14: Table Patient Questionnaire
Field Name Field type and length
ID int
FK_PatientID int
FK_QuestionID int
Answer int
DateTime datetime
UserLastUpdate nvarchar(150)

- 40 -
4.6.15 Table Patient Blood Pressure
The Tbl_Petient_Blood_Presure table is used to store patient’s Blood Pressure. The primary
key of the table is the ID and it is related with TBL_Patient with FK_PatientID.
Field Name Field type and length
ID int
FK_PetientID int
Blood_Presure_Sistolic int
Blood_Pressure_Distolic int
DateLastUpdate datetime Table 4.15: Table Patient Blood Pressure
4.6.16 Table Score Questionnaire
The TBL_Scores_Questioner table is used to store the questions that are needed to calculate
the scores. The primary key of the table is the ID.
Field Name Field type and length
ID int
Question nvarchar(2000)
Type char(1) Table 4.16: Table Score Questionnaire
4.6.17 Table Symptoms
The Tbl_Symptoms table is used to store the symptoms that a patient may have. The primary
key of the table is the ID.
Field Name Field type and length
SymptomID int
Description nvarchar(200)
DateLastUpdate datetime
UserLastUpdate nvarchar(150) Table 4.17: Table Symptoms

- 41 -
4.6.18 Table User – Patient
The Tbl_User_Patient table is used to store the doctor’s user name that has access to review a
patient’s ID. The primary key of the table is the ID and it is related with TBL_Patient with
FK_PatientID.
Field Name Field type and length
ID int
FK_PetientId int
UserName varchar(150)
DateLastUpdae datetime
UserLastUpdate nvarchar(150) Table 4.18: Table User – Patient
4.7 Class Diagram
The class diagram in the Unified Modeling Language (UML) is a type of static structure
diagram that describes the structure of a system by showing the system's classes, their
attributes, and the relationships between the classes [1].
4.7.1 Application Server Classes
The Application Server contains the two web services SystemWS and VitalInfoWS which are
used from the internal and external systems to mainly send the vital information. Furthermore
the Application Server web application contains DAL class and mdlDeclares that help classes
for the web services.

- 42 -
4.7.1.1 Declare Class
The Module Declares contains three constant names
for the log files that the system creates; the first log
file is the Analysis which contains the information
about the analysis like start end time, patient ID and
other. The Trace Log file contains the information
concerning system crashes.
The Blood Pressure class contains the information
about Systolic and Diastolic blood pressure.
The ECG class contains the information for the
ECG, the AnalysiResult is of type enmAnalysis
and it indicates the analysis information like PVC,
NTQRS and others.
Finally the enumeration Result contains some error
codes like success, NoData and others.

- 43 -
4.7.1.2 Utils Class
This class contains help functions and classes that
are used from all the projects in the solution.
Fields
It contains several constants that are used in most
cases for validation.
Methods
The two methods that are included in the class are
used for validation, the method
GetControlsArrayByType is used to validate the
user input that was entered in a specific user
control. RegExpTest is used to evaluate a regular
expression over a user input.
Log Sub Class
This sub class is used for logging. It creates a log
file that does not exist with the method
CreateLogFile and with the method WriteLog it
writes the input information to the created log
file.
Validation Sub Class
This sub class has several helpful methods for validation. Those methods are validating digits,
double numbers, dates, date and times, E-mail addresses and the method IsValidUserInput is
used to discard any illegal character.

- 44 -
4.7.1.3 Data Access Layer (DAL) Class
The Data Access Layer is the layer that is allowed to have access to the database. In this layer
we are reading and writing in the database. DAL class is used from all the projects in the
solution.
Fields
The fields of this class are mainly the constants for the
store procedure names and the connection string that is
used to access the database.
Properties
There is one property the GetDBConnectionString has
that it is used to get the connection string from the
configuration file (app.config or web.config)
Methods
Most methods here are used to store vital information
and ECG information in the Database.
The method ArchiveECG is used from the project
ECGArchiveServer and it is used to archive the ECG.
The method GetButchECGNotAnalized is used from
the project ECGAnalysisServer and it reads a data set of ECG data that is not analyzed for a
patient.

- 45 -
The method PatientExist is a help function and it is used almost from all the methods in the
DAL class; it validates if the specific patient exists or not and it returns the appropriate result
code (InvalidPatientID) (refer to 4.7.1.1 Declare Class for more information).
4.7.1.4 Vital Information Web Service (VitalInfoWS)
This web service class contains all the necessary methods
that are needed to collect the vital information which are
AddBloodPressure, AddECGAnalized,
AddECGNotAnalized, AddOxigenSaturation and
AddWeight. For more details about VitalInfoWs refer to
Appendix VIII.
4.7.1.5 System Web Service (SystemWS)
This web service is used from the Patients Portal web
application. It contains two methods: the first method is
AddPatientDoctor and it is used to associate the Patient with
his Doctor. The method AddSymptom is used to add the
symptoms that the patient has.
4.7.2 ECG Analysis Server Class
The ECG Analysis Server is going to be a scheduled task in
the server to run many times per day to check if there is a
new not analyzed ECG. If there is then it will get it from the
database and analyze it. This class contains a constant of
maximum number of retries. This number is collected from

- 46 -
the configuration files (refer to chapter 7 Installation Phase section 7.3.3.3
ECGAnalisysServer and ECGArchiveServer settings).
4.7.2.1 ECG Analysis Class
The ECG Analysis is an old C program that was converted to the .Net C# program and it is
used from the ECG Analysis Server to Analyze the ECG.
Methods
The BDAC method is used to analyze record by record the ECG voltage and returns the
Arrhythmia definition for each record.
The BDACArray method gets an array of ECG voltage and
analyzes it using the BDAC method.
The ResetBDAC method clears the variable that is used for
the analysis and it must be called every time that the BDAC method is called.
4.7.3 ECG Archive Server Class
The ECG Archive Server is going to be a scheduled task in
the server to run many times per day to check if there is a
schedule task of the ECG archive. If there is then it will get
it from the database and archive it. This class contains a
constant of a maximum number of retries. This number is
collected from the configuration files (refer to chapter 7
Installation Phase section 7.3.3.3 ECGAnalisysServer and ECGArchiveServer settings).

- 47 -
4.8 Use Case Diagram
4.8.1 Use Case Diagram
A use case diagram in the Unified Modeling Language (UML); it is a type of behavioral
diagram defined by and created from a Use-case analysis. Its purpose is to present a graphical
overview of the functionality provided by a system in terms of actors, their goals (represented
as use cases), and any dependencies between those use cases [1].
The main purpose of a use case diagram is to show what system functions are performed for
which actor. Roles of the actors in the system can be depicted [1]. Use cases are represented
by ovals and the actors are represented by stick References [1].
Diagram building blocks
• Actor: The most important relationship between the Actors is
Generalization/Specialization. This is helpful in determining overlapping roles
between actors. The notation is a solid line ending in a hollow triangle drawn from the
specialized to the more general actor [1].
• Use case Relationships:
o Include: Include is a Directed Relationship between two use cases, implying
that the behaviour of the included use case is inserted into the behaviour of
the including use case [1]. The notation is a dashed arrow from the including
to the included use case, with the label "«include»".
o Extend: This relationship indicates that the behaviour of the extension use
case may be inserted in the extended use case under some conditions [1]. The
notation is a dashed arrow from the extension to the extended use case, with
the label "«extend»".

- 48 -
o Generalization: A given use case may have common behaviours, constraints
and assumptions to the general use case; describe them once, and deal with it
in the same way, except for the details in the specialised cases. The notation is
a solid line ending in a hollow triangle drawn from the specialized to the more
general use case.
4.8.2 System Use Case Diagrams
4.8.2.1 Scenarios system communication with the Application Server
Reference 4.8.1: Patients’ system and Application Server interface Use Case Diagram
The system that is located at the patient’s house will communicate with the Application
Server to send ECG and Vital information. The two systems will communicate with the Web
Service application programming interface, and will be accessed over the Internet network.
The web service will contain the functions that will transfer the data to the server; furthermore
all functions will return a status code that will indicate if there was an error in the
communication. Those return error codes are the same to all functions.

- 49 -
Error codes will cover the following scenarios:
• There was an unhandled error.
• Process completed successfully
• One or more input parameters contain invalid values
• There was an error in the process and it didn’t complete successfully.
• The input patient ID is invalid
• There wasn’t any data for the search criteria
Methods that must be implemented to handle all the cases are:
• Vital Information
o Weight: Send the patient’s weight. It must take three parameters: the Patient ID
which will indicate the system identity of the patient and it must be numeric, the
Weight which takes numeric values and indicates the patient’s weight and the Date
Time Stamp which indicates the time that the patient measured his/her weight.
o Oxygen Saturation: Which can be used to send the patient’s Oxygen Saturation. This
method must take three parameters: the Patient ID which indicates the system identity
of the patient and must be numeric, the Oxygen Saturation which must be numeric
and it will indicate the patient’s oxygen saturation and finally the Date Time Stamp
which will indicate the time that the patient measured his/her oxygen saturation.
o Blood Pressure: This function will be used to send the patient’s blood pressure. This
method will contain three parameters as well: the Patient ID which was mentioned
above, the Blood Pressure parameter which must be an array and must take two
values: the systolic and diastolic blood pressure and the last parameter must be the
Date Time Stamp which was mentioned above.

- 50 -
• ECG Information
o ECG Not Analyzed: Which will be used to collect a batch of ECG measurements for
a specific patient. This method must take four parameters. The first parameter is the
Patient ID that was mentioned before, the second parameter must be an array of
integers which indicates the series of ECGVoltage. The third parameter must be the
Sample Rate which is the number of bits that are processed per unit of time. Finally
the last parameter must be the Date Time Stamp which was mentioned above.
o ECG Analyzed: This is going to be used to collect a batch of analyzed ECG
measurement for a specific patient. The first parameter must be the Patient ID that
was mentioned before, the second parameter must be an array and it will take 2 values
the ECG – Voltage and the analysis result. The third parameter will be the Sample
Rate which was mentioned above. Finally the last parameter is the Date Time Stamp
which was mentioned above.

- 51 -
Reference 4.8.2: Patients Portal Use Case Diagram
A Patients’ Portal must be a web application and must be accessible from the internet. The
users must register with the system and define their role. Furthermore registered users must be
able to update their information and their password.
The users must be able to add, update and delete Patients. Users must see, update and delete
Patients’ Medical Background information, hospitalization information, Patients’ symptoms,
and information relevant to patient hospital calls and follow up information. A questionnaire
concerning the physical and psychological state of the patient will be offered. Based on that
questionnaire, important scores will be calculated.
- 52 -
Vital information concerning the patient must be provided to the doctors. This information is
the patient’s weight, blood pressure and oxygen saturation. The last and most important
information that will be provided to the doctor is the patient’s ECG. Several search criteria
will be provided to the doctor, in order to find and view the ECG that he wants.
At the end of the patient’s treatment, the doctor must schedule an archive procedure for the
patient’s ECG. This process will archive ECG information to minimize the table size; by
doing that we optimize, read, and write time to the ECG table.
Additionally patients must be attached to a doctor. That doctor can name another doctor or
doctors, who will be his collaborators – helpers. Only doctors that are attached to the patient
together with their appointed collaborators–helpers can have access to view, edit and maintain
patients’ information.

- 53 -
4.9 Sequence Diagram
Reference 4.8.3: Sequence Diagram
First of all the Doctors and the Nurses must register to the Patients Portal system in order to
have access to the system. After that they are going to be able to add, update and delete
patients’ information. Cardiac Pulse and Vital Information are collected from the Local
Monitoring System and it is sent to the Application Server system for further processing and
storage to the Database. After the ECG is collected to the Application Server, then the ECG is
analyzed and then it is stored back to the Database. When the above information is collected,
then the Doctor requests to see the Vital Information, ECG Plot and the Patient’s information
from the Patient’s Portal. The nurse is able to see and request the Patient’s information. When
the treatment is completed then the doctor is able to schedule the ECG Archive procedure;
after that ECG Analysis Server takeS action and archiveS the Patient’s ECG.

- 54 -
Chapter 5
System Design
5.1 Introduction
5.2 System Communication and Interface
5.3 Security and Control
5.1 Introduction
The System Analysis is a detailed study of various operations performed by a system and their
relationships within and outside the system. During analysis, data are collected on the
available files, decision points and transactions are handled by the present system. Interviews,
on-site observation and questionnaires are the tools used for the system analysis [9].
User requirements are analyzed in order to define the system specification that the new system
must accomplish. Functional hierarchy shows the functions to be performed by the new
system and their relationship with each other [9]. It determines the attributes of the entities
which are the data items that need to be held about each entity.
`
The new system must be designed according the user requirements and the detailed analysis
of a new system. This phase is called System Design. This is the phase of system designing. It
is a most crucial phase in the development of a system [9].

- 55 -
The features of the new system are specified. The costs of implementing these features and the
benefits to be derived are estimated. If the project is still considered to be feasible, we move to
the detailed design stage. After that stage, the design of the system becomes more structured.
Input, output and processing specifications are drawn up in detail. In the design stage, the
programming language and the platform in which the new system will run are also decided.

- 56 -
5.2 System Communication and Interface
5.2.1 Interfaces with the External System
Reference 5.2.1: Technical system interface
The Local Monitoring System
The Local Monitoring System is communication first of all with the ECG sensors, the Blood
pressure sensors, the Oxygen Saturation sensors and finally with the weight sensors in order to
collect vital information. After the data collection the local system communicates with the

- 57 -
Central Monitoring System. The Local Monitoring System is not going to be examined in this
project.
The Central Monitoring System
The Central Monitoring System collects the vital information from the Local Monitoring
System using web services over the IP network. Additionally the Central Monitoring System
uses the Microsoft IIS server to facilitate the communication with the internet. Furthermore
the Microsoft SQL Server 2005 above is used to store all the information that is retrieved
from the system. The central system includes four major processes. The first one is the
Application Server which is the central process that is used to collect and store vital
information and side information. The second one is the ECG Analysis Server which is used
to analyze and store the ECG. The third major process is the ECG Archive Server which is
used to archive the ECG that was scheduled by the doctor. Finally, the most important process
is the Patients Portal, which is used to collect and display the patients’ information and their
vital information. The portal is accessible from the web; the doctors, nurses and secretaries
can apply their user name and password and in this way they are able to maintain and view the
patients’ information.

- 58 -
5.2.2 Interface with the Internal System
The system consists of the Patients’ Portal web application, the Application Server web
application, and additionally, it contains the ECG Archive Server which is a console
application, and the ECG Analysis Server which is as well a console application; the ECG
Analysis Server includes the ECG Analysis module (refer to Reference 5.2.2).
Reference 5.2.2: Technical Local System Interface
Patients’ Portal
This is going to be used by the Doctors and Nurses and it is going to be accessible from the
Internet. The users will be able to view, add, update and delete information concerning the
Patient, Patient treatment and vital information. The Patients’ Portal is going to be a web
application, and it will treat information from the Patients’ Portal Database; furthermore,
additional information will be accessed through the Application Server web services.

- 59 -
Application Server
This part of the solution is one of the major processes of the system. It will be used to collect
the ECG and Vital information from the patient’s holders and will store this information to the
Patients’ Portal Database. The web service will be provided in order to collect that useful
information. Additionally, the web services will be provided in order to offer help functions to
the Patients Portal. This solution is also a Patients Portal web application which can be
accessible from the Internet.
ECG Archive Server
This part of the solution is going to be a console application, and it is going to be scheduled to
the server in order to run all the time by the server. It is going to check if there is any schedule
archive information concerning the Patients’ ECG; when there is the need, it will delete the
ECG from the original table and store it automatically to the archive table. The Patients’
Portal Database will be used in this solution as well.
ECG Analysis Server
This part of the solution is going to be a console application, and it is going to be scheduled to
the server in order to run all the time from the server. It is going to check if there is an ECG
that it has not been analyzed yet. In the case when it finds an unanalyzed ECG it will analyze
it and store it back to the Patients’ Portal Database.
To analyze the ECG the ECG Analysis will be used; this solution is an old C solution that
was converted to a .Net C# solution in previous projects.

- 60 -
5.2.3 Patients’ Portal User Interface
As far as the user interface is concerned it will be simple enough and easy to use by the
average user. Advanced procedures will be avoided if possible. Attractive menus and a
descriptive online help will be provided. Refer to Appendix V for the user interface.
5.3 Security and Control
Access to the system will be restricted to unauthorized users; it will only be allowed to the
doctors and nurses. The use of a password and a username is required. A Microsoft
Membership provider is used to handle the authorization processes.
5.3.1 Microsoft Membership Provider
ASP.NET 2.0 provides login controls that can be used to perform authentication. The controls
talk directly to the membership provider. ASP.NET 2.0 also offers controls to support the
ongoing maintenance of users, including changing passwords and resetting passwords. All of
these controls are built on top of the features of the membership providers [12]. Once we
know who a user is, we can find out what we will allow the user to do – this is authorization.
The role providers in 2.0 allow us to create roles, and map users into the roles. Given a
username, the role manager can tell us to which roles a user belongs. Areas of a web
application, or specific operations, can be restricted to exact roles [12]. Refer to Appendix VI
for the membership provider installation.
The default Membership Provider passwordFormat is Hashed and it is also the most secure.
Hashed passwords are converted using a one-way hashing algorithm and a randomly
generated "salt" value. There is no way to retrieve a hashed password, so password
verification is performed by hashing then the newly entered password is compared to the one
stored in the database.

- 61 -
Chapter 6
Implementation Phase
6.1 Programming Language and Platform
6.2 User Interface
6.3 Testing Specification and Planning
6.4 Conclusion
6.1 Programming Language and Platform
For the implementation we are going to use Visual Studio 2008 with ASP.NET and Visual
Basic.NET. Additionally, the Database Management System that it is going to be used is the
Microsoft SQL Server 2005 express edition for the development and in the server, the
Microsoft SQL Server 2008. Furthermore, Ajax Toolkit 3.5 is going to be used to reach user
interface. Finally for the graphs, the National Instruments Measurements Studio is going to be
used.
6.1.1 ASP.NET 3.5 and Visual Studio 2008
ASP.NET 3.5 and Visual Studio 2008 bring great new functionality around the Web
development and design, and make building standards based on the next generation Web sites
easier than ever. From the inclusion of ASP.NET AJAX into the runtime, to new controls, the
new LINQ data capabilities, to improved support for CSS, JavaScript and others, Web
development has taken a significant step forward [13].

- 62 -
6.1.1.1 Visual Studio 2008
Visual Studio 2008 has incorporated a new Web designer that uses the design engine from
Expression Web. Moving between design and source view is faster than ever and the new split
view capability means you can edit the HTML source and simultaneously see the results on
the page. Support for style sheets in separate files has been added as well as a CSS properties
pane which clarifies the sometimes-complex hierarchy of cascading styles, so that it is easy to
understand why an element looks the way it does. In addition, Visual Studio 2008 has full
WYSIWYG support for building and using ASP.NET Nested Master Pages, which greatly
improves the ability to build a Web site with a consistent look and feel [13].
6.1.2 ASP.NET AJAX framework
With the ASP.NET AJAX, developers can quickly create pages with sophisticated, responsive
user interfaces and more efficient client-server communication by simply adding a few server
controls to their pages. Previously an extension to the ASP.NET runtime, the ASP.NET AJAX
is now built into the platform and makes the complicated task of building cross platform
standards based on AJAX applications easy [13].
6.1.2.1 Visual Studio 2008
The ASP.NET AJAX Control Toolkit is an open-source project built on top of the Microsoft
ASP.NET AJAX framework. It is a joint effort between Microsoft and the ASP.NET AJAX
community that provides a powerful infrastructure to write reusable, customizable and
extensible ASP.NET AJAX extenders and controls, as well as a rich array of controls that can
be used out of the box to create an interactive Web experience. The AJAX Control Toolkit
contains more than 30 controls that enable you to easily create rich, interactive web pages
[13].

- 63 -
6.1.3 Microsoft SQL Server
The Microsoft SQL Server is a relational model database server produced by Microsoft. Its
primary query languages are T-SQL and ANSI SQL [1].
The Microsoft SQL Server 2008 provides a trusted, productive, and intelligent data platform
that enables you to run your most demanding mission-critical applications, reduce time and
cost of development and management of applications, and deliver actionable insight to your
entire organization [14].
6.1.4 National Instruments (NI) Measurement Studio
The National Instruments Measurement Studio is an integrated suite of measurement and
automation controls, tools, and class libraries for Visual Studio 2008, Visual Studio 2005,
Visual Studio .NET 2003, and Visual Studio 6.0. The NI Measurement Studio dramatically
reduces application development time with ActiveX and .NET controls, object-oriented
measurement hardware interfaces, advanced analysis libraries, scientific user interface
controls, measurement data networking, wizards, interactive code designers, and highly
extensible classes [15].
Building on more than 20 years of measurement programming expertise, National Instruments
created Measurement Studio with tools designed specifically for Microsoft Visual Basic,
Visual C# .NET, and Visual C++ to bring you simplified integration with data acquisition and
instrument control interfaces for easier hardware integration. With Measurement Studio, you
use your Visual Studio programming knowledge to get measurements started quickly and
create a complete measurement solution - all the way from acquiring to analyzing or
presenting [15].
6.1.5 Visual Basic .NET (VB.NET)
Visual Basic .NET (VB.NET) is an object-oriented computer programming language that is
the progression of Microsoft's Visual Basic (VB) which is generally implemented on the

- 64 -
Microsoft .NET Framework. Visual Basic 9.0 was released together with the Microsoft .NET
Framework 3.5. For this release, Microsoft added many features, like Anonymous types,
Support for LINQ, XML Literals and others.
6.2 User Interface
The user interface will be user-friendly with on-line documentation on each page explaining
the different page functions and fields. A “Help” option will be provided as well as a contact
page where the users can be directed in order that they might contact and communicate with
the systems administrator. Drop-down lists, radio-buttons and other user-friendly options will
be provided for the realization of data inputs to the system. Ajax Toolkit will be used to
provide Web 2 functionality and nice interface. (Refer to Appendix V for the user interface).
6.3 Conclusion
The final end-product of this phase is the complete system. The coding of the system comes
to an end and all types of testing are performed.
The transformation of the client requirements into a completed, documented and thoroughly
tested system has been accomplished in such a way that the new system should fulfil the
expectations of the client for service and system functionality.

- 65 -
Chapter 7
Installation Phase
7.1 System Installation Method
7.2 Database Installation
7.3 Web Site Installation
7.4 Analysis Configuration
7.5 Membership Provider Installation
7.6 Conclusion
7.1 System Installation Method
The Server on which the system will be installed is good to operate using the Windows 2008
Server. First of all, the system designers need to make sure that the IIS 5 and above is
functioning fully. If not, it must be correctly installed. After the installation of the MS SQL
Server 2005 and the Visual Studio.NET framework 3.5, a copy of the system Database, must
be introduced onto the Microsoft SQL Server.
7.2 Database Installation
For the database installation first of all you have to create an empty database and then restore
the original Patients’ Portal Database and after that you have to create a new login.

- 66 -
Steps to restore the database
• Login to Microsoft SQL Server 2005 with the server name and the Authentication mode
must be “Windows Authentication”.
• After that, create New Database with the database name PatientsPortal.
• Right click on the PathentsPortal database
Select Tasks\ Restore\ Database
• On the new window “Restore Database - PatientsPortal”
On the General tab, at “Source for restore” section select from the device the
path for the “PatientsPortal.bak”
On the Options tab, select the option “Overwrite the existing database”
Steps to create new login
• Go to Security\Logins
o Right click and select “New Login…”
o Insert new “PPUser” to the new “Login name”
o Then Select SQL Server authentication and insert the password “PPUser”
• When you have completed the new security login creation, select the PatientsPortal
database, and then select security\users and insert the new user that you have created
the “PPUser”.

- 67 -
Reference 7.2.1 Create a New Login in the Microsoft SQL Server Management Studio
7.3 Application Installation
7.3.1 wwwroot Installation
To install the website you have to create a PatientsPortal folder under the
C:\Inetpub\wwwroot directory. There you have to copy the following files that are shown
below:
• \App_data\*.mdf
• \App_data\*.ldf
• \App_Themes\Default\*.css
• \App_Themes\Default\*.skin
• \Images\*.*
• \Bin\*.dll
• \My Project\*.myapp

- 68 -
• \My Project\*.resx
• \NotSecure\*.aspx
• \*.aspx
• \*.ascx
• \licenses.licx
7.3.2 IIS 6.0 Installation
7.3.2.1 Application Pool Setup
First of all a new Application Pool for each web application (PatientsPortal,
ApplicationServer) must be created. An Application Pool can contain one or more
applications and allows us to configure a level of isolation between different Web applications
[16]. Because each application pool runs in its own worker process, errors in one application
pool will not affect the applications running in other application pools [16].
Creating a new application pool is a very simple process that is carried out by using the IIS
manager. To create a new application pool, right-click on the Application Pools node from
the tree view and select New Application Pool [Reference 7.1] from the context menu.
You will be presented with the following screen, where you need to enter a name for the
application pool which in this case is PatientsPortal. When creating a new application, you
also have the option of inheriting the settings from an existing application pool [16].

- 69 -
Reference 7.3.2.1 Add New Application Pool
7.3.2.2 Patients Portal Virtual Directory configuration steps
1. The first step is to configure the Application Mapping within the web site properties.
Open Internet Services Manager and navigate to the web site hosting your
PatientsPortal web application which is the Default Web Site, (refer to Reference
7.2).
Reference7.3.2.2 Internet Information Services (IIS) Manager

- 70 -
2. Right click on the Default Web Site and select Properties. In the Web Site Properties
dialog box, click on the Home Directory tab. Make sure that both the Read and Write
checkboxes are checked. Browse and select the C:\Inetpub\wwwroot\PatientsPortal
directory. In the Application name field insert PatientsPortal then select PatientPortal
in Application pool.
Reference7.3.2.3 Add Application
7.3.3 Configuration file changes
Web applications ApplicationServer and PatientsPortal have web.config file. Additionally
windows and console applications; ECGAnalisysServer and ECGArchiveServer have
app.config file.

- 71 -
7.3.3.1 Connection string changes
Make the appropriate changes to the connectionString in order to have access to the database
server. Insert the Data Source name which is the Database server then insert the Initial
Catalog which is the database name which is the PatientsPortal. Note that the
connectionString is case sensitive. In the connection string you have to insert the new user
that we created before the PPuser in the uid and his password the pwd.
<connectionStrings>
<add name="PatientsPortalConnectionString"
connectionString="Data Source=WIN-U3U4TCTHYTP;
Initial Catalog=PatientsPortal;
Integrated Security=False;
uid=PPuser;pwd=PPuser;"
providerName="System.Data.SqlClient" />
</connectionStrings>
<system.web>

- 72 -
7.3.3.2 Application Settings changes
Furthermore applicationSettings section must change. Update the value section below with
the valid URL for the SystemWS.asmx web reference for the web service. Note that this
section is applicable only to the PatientsPortal web.config.
<applicationSettings>
<PatientsPortal.My.MySettings>
<setting name="PatientsPortal_SystemWSRef_SystemWS"
. serializeAs="String">
<value>
http://localhost/ApplicationServer/SystemWS.asmx
</value>
</setting>
</PatientsPortal.My.MySettings>
</applicationSettings>
7.3.3.3 ECGAnalysisServer and ECGArchiveServer settings
The ECGAnalysisServer is programmed to loop 5 times on the not analyzed ECG in order to
get the data and analyze. In order to update that you have to edit the MaxLoopCount based
on your needs, in the app.config file.

- 73 -
7.3.3.4 Patient Portal E-Mail Settings
With the settings below the system is able to send the E-Mails using the Gmai SMTP service.
<system.net>
<mailSettings>
<smtp from="[email protected]" deliveryMethod="Network">
<network
host="smtp.gmail.com"
port="587"
password="avari$2010"
userName="patientsportal" />
</smtp>
</mailSettings>
</system.net>
7.3.4 NTFS access
The systems write to a log files folder for logging purposes, in order to have access to do that;
create logfiles folder in the C:\ drive then give write access to the ASPNET user and the
PPuser.
7.4 Analysis configuration
The ECGAnalysisServer is used to analyze the ECG that has not been analyzed yet. In order
to do that it gets the ECG from the database, and then it calls the ECGAnalysis to analyze the
ECG. Note that the ECGAnalysis project is an old c program that was converted to a .Net C#
program, which in our case needs some extra configuration.

- 74 -
In the folder which contains the ECGAnalysisServer.exe you must copy the
ECGAnalysis.dll and all the C and header files that are needed.
In some cases the ECGAnalysis.dll must be copied under the C:\WINDOWS\system32
folder to be found from the ECGAnalysisServer.
7.5 Membership Provider Installation
The purpose of the Membership Provider is to provide a layer of indirection between
membership controls, like the Login Control, and the data store containing membership
information [12]. In order to make changes to the membership provider there is some help
information in Appendix IV.
7.6 Conclusion
Note that the same steps that we took for the Patients’ Portal web application we have to do
it for the ApplicationServer which contains the web services and Test web applications that
are used to insert data for testing. For extra information concerning the solution installation
refer to chapter 7.
After the installation procedures have been completed, the web site should be “up and
running”.

- 75 -
Chapter 8
System Evaluation Phase
8.1 Testing Specification and Planning
8.2 Test Scenarios and Results
8.3 Conclusion
8.1 Testing specification and planning
8.1.1 Test Plan
Professional statistics show that satisfactory project evaluation depends heavily on a thorough
testing plan and strategy. Therefore, rigorous testing is demanded for the effective evaluation
of the finished end-product. Testing one of the most essential aspects of project
implementation is the systematic process of executing the system with the intent of finding
and removing all operating “bugs”. Successful testing of the system’s performance is
required at each of the following levels:
8.1.1.1 Module Testing
For this type of testing, each individual module will be tested to determine whether all the
system’s modules are logically and functionally correct. If an error occurs, a suitable
debugging procedure will be followed.

- 76 -
8.1.1.2 Integration Testing
This form of testing will be applied to all interfaces among modules to ensure that transfer of
both data and control are performed correctly. This testing method includes the run-time
evaluation of all variables that are passed from one module to another.
8.1.1.3 Function Testing
The results and outcomes of the program will be evaluated after the execution of the program
in which every functional menu selection has been activated systematically in turn.
After the program has been completed, comprehensive runs will be made so that each of the
menu options can be activated in such a way as to trigger every possible program outcome
and menu function. The results of the test runs will be compared with the projected outcomes
for each of the program’s functions and menu options. The outcomes of the program must
match the projected outcomes within the program development plan. This procedure will
indicate whether the results meet the expected requirements and will indicate where
corrections or revisions need to be incorporated into the program or the new system.
8.1.1.4 System Testing
Since the objective of this type of testing is a full test of the entire system on the completion
of the system development period, several testing tools e.g. the load test, the unit test that the
visual studio 2008 offers will help us with testing in order to discover programming errors and
potential problems. Then, a major effort will be made towards entirely debugging the system.
8.1.1.5 Acceptance Testing
Upon completion, the system will be transferred to a trusted Server and a group of friends and
lecturers will have the chance to verify that the system is performing according to user

- 77 -
expectations and projections. They will test it using realistic data and within a real-life
environment. Through this type of testing, program evaluators can approach the system and
its facilities from the standpoint of the potential user. Hence, the users become familiar with
the system environment and can compare it with the manner in which the new system was
expected to operate.
The system will be tested with real data, with the patients’ and doctors’ help. The goal is to
use this system to the minimum number of 50 patients, in order to be sure that everything is
working correctly and it satisfies all requirements.
8.1.2 Programming and Testing
A proper system development demands the implementation of a procedure which consists of
the following steps: Examination of the program specifications that were prepared during the
technical design phase and the combining of them with the initial system requirements;
preparation of a general program structure using the “Use Case” scenarios, entity relationship
diagram etc; debugging and testing of the program modules.
8.1.3 User Training Description
As this project is a web application, there will be no need for user training. Therefore, as the
system has a user-friendly environment, the users ought easily to be able to understand it. A
“Help” option is provided and is available on-line from the site for any user who encounters a
procedure or element which is not readily understandable. Additionally, a user’s manual will
be prepared which explains the functionality of the system and its parts.
As far as users’ training is concerned, no special training is expected to be demanded because
a competent administrator is required to have previous experience handling several types of

- 78 -
related tools and web servers. Also training material will be prepared for the patients and the
nursery in order to help the patients to use it.
8.1.4 System Testing
8.1.4.1 Complete System Test
The activity of a complete system testing comprises two types of tests: the functional and the
performance test.
Within functional testing, procedures will be followed to make sure that all the expected and
required operations are incorporated and they perform completely and correctly. On the other
hand, performance testing has to do with the testing of the quality of the performance of the
system, and the instances of exceptional cases are listed and assessed.
8.2 Test Scenarios and Results
The main scenarios that we are going to examine here is the scenarios that have to do with
Patient’s vital information which is the main purpose of this project.
8.2.1 Web Service Call Scenarios
Note that the scenarios below were executed calling the web service that was in Paphos
Hospital from my local computer located in Nicosia over the internet. The results may be are
different based on other conditions.
8.2.1.1 ECG input scenario
This scenario concerns the case that the ECG data are sent to the system using the web service
from the external system.

- 79 -
Reference8.2.1: ECG Input matrices and graph.
The time is increased based on the number of records. It is a good practice to not sent more
than 6000 records using the web service in order to not increase the content length of the http
request. It is good practice to sent butches of 6000 ECG records in order to keap the HTTP
content length small doing that we avoid data lost and data corruction.
8.2.1.2 Vital Information input scenario
This scenario concerns the case that the patient’s Weight, Oxygen Saturation and Blood
Pressure are sent to the system using the web service from the external system.
Scenario Number of Records Response Time
Weight 1 1 sec Oxygen Saturation 1 1 sec Blood Pressure 3 1 sec
Table 8.1: Weight Input matrices.

- 80 -
8.2.2 ECG Analysis Scenarios
The scenarios below shows the time that was needed to read the data from the Database
analyze them and finally store it back to the database. The analysis is done by calling the
ECGAnalysisServer. The response time is very good and it is raise based on the records
increase.
Number of Records Response Time/ sec
120 1 6000 2
17982 5 29970 10 59940 18 65934 20 83916 26
215784 67
Table 8.2.2: ECG Analysis matrices.
Reference 8.2.3: ECG Analysis chart.

- 81 -
8.2.3 ECG Archive Scenarios
The scenarios below shows the time that was needed to archive the ECG data. The archive
process is done by calling the ECGArchiveServer. We see that the response time have not
significant change derived from the record amount.
Number of Records Response Time (sec)
6000 1 17983 1 41959 1 77923 1
215785 2
Table 8.3: ECG Archive matrices
8.2.4 Patients Portal code metrics
Visual Studio offers the Code Metrics tool that helps users find and act upon complex and
unmaintainable areas within an application. Below there are the most important code metrics
of the PatientPortal project.
The following table shows the range at which an icon is shown [11]:
High Maintainability Between 20 and 100 inclusive
Moderate Maintainability Between 10 and 19 inclusive
Low Maintainability Between 0 and 9 inclusive
High coupling indicates a design that is difficult to reuse and maintain because of its many
interdependencies on other types. Indicates the number of class definitions that extend to the
root of the class hierarchy. The deeper the hierarchy the more difficult it might be to
understand where particular methods and fields are defined or/and redefined [11].
Reference 8.2.3: Code matrices.

- 82 -
8.2.5 Patients Portal Load Test
Load testing is one of those steps that should be performed for every major system rollout but
rarely happens. When a web application exposes complex information structures and
implements complex business logic, synchronization problems resulting from simultaneous
users accessing and modifying the same data can cause system defects that cannot be detected
with single-user mode functional testing tools. These types of defects frequently result in
incorrect behavior and/or data corruption - sometimes even complete application lockup or
crashing. They are also the hardest to detect and reproduce - and are frequently blamed on
other sources, such as the users, when they cannot be easily reproduced by the developers or
testers [20].
The tests below simulate 25 and 10 users and it was running for 10 minutes the warm-up
duration was 30 and 60 seconds respectively. Tests were applied to the pages that have the
most significant processing functions like ECG Preview and VitalInfo.
Below there are the overall results and the load test parameters.
Max User Load 25 10
Requests/Sec 6,65 5.71
Requests Cached Percentage 64,3 75
Avg. Response Time (sec) 4,65 1.74
Avg. Content Length (bytes) 9.021 10.179
Tests/Sec 0,048 0.085
Avg. Test Time (sec) 386 116
Avg. Transaction Time (sec) 0 0
Avg. Page Time (sec) 24,6 6.21
The graphical representation of overall results, which can be viewed in Reference 8.2.9. Blue
bars display the first case that the scenario was simulating 25 simultaneous accesses to the
Patients Portal and the red bars indicates the scenario with 10 users. We notice that the results

- 83 -
of the second case are much better than the first case. Request cached, Average Response
Time and the Average Page time are better in the case that we have 10 users accessing the
patient portal.
Reference 8.2.4: Overall Results Graph.
The “average page time” from 24.60 seconds it is decreased to 6.21 seconds. Furthermore the
cached percentage it is increased in the case that the uses are 10 rather than 24 this minimize
the response time.
8.2.5.1 Key Indicators
In the graph below we notice that the Request time is normal in all cases with average time
6.65 and maximum time 20.60 seconds. On the other hand the average response time is 4.65
and the minimum response time is 0.92 seconds. Furthermore we see a pick with the
maximum 62.8 at 2:30 minutes when the Home.aspx was displayed; this case is acceptable
because home page displays huge amount of data and the simultaneous users’ access was 25
which decrease the cache percentage.

- 84 -
Reference 8.2.5: Key indicators for 25 users’ simulation.
In the case below we see that the results are much better than the results shown in the
Reference 8.2.10. The warm up time below is 1 minute on the other hand the warm up time is
30 seconds on the first experiment. The maximum response time in the first case is 62.8 on the
other hand the maximum response time in the second experiment is 31.1 much better.
Reference 8.2.6: Key indicators for 10 users’ simulation.
Table 8.4: Key indicators for 10 users’ simulation
8.2.5.2 Page Response Time
The graph below shows the response time for the pages. There are no any irregular picks in
the response time except the home.aspx. We can see that the Page Response Time for the case
that the test was done with 10 users is better.
Key Indicators Min 25 users
Min 10 users
Max 25 users
Max 10 users
Avg 25 users
Avg 10 users
Request/Sec
0.80 0.80 20.6 26.4 6.65 5.71
Avg. Response Time
0.92 0.56 62.8 31.1 4.65 1.74

- 85 -
Reference 8.2.7: Page Response Time for 25 and 10 users’ simulation.
Page Min 25 users
Min 10 users
Max 25 users
Max 10 users
Avg 25 users
Avg 10 users
Home 6,77
0,78 51,90 37,90 28,60 9,95
PatientEECG 0,00
0,00 12,90 5,71 5,68 2,20
PatientVitalInfo 8,67 1,73 35,60 14,50 22,90 8,40
PatientScores 4,97
0,86 57,80 12,40 16,90 5,78
PatientScoresReport 6,28
1,04 34,30 11,10 18,80 6,47
Table 8.5: Page Response Time for 25 and 10 users’ simulation

- 86 -
8.3 Compare our system with A Wireless System for Monitoring of Children
with Suspected Arrhythmias
Below in table 8.6 there are several comparisons concerning the proposed system; Post-
Cardiosurgery Home Monitoring System (PCHMS) with AMEK (A Wireless System for
Monitoring of Children with Suspected Arrhythmias) [19].
Information PCHMS AMEK
Maintain Patient Information
Patient’s Medical Background Hospitalization Information Hospitalization Symptoms Call Visits
Questionnaire and Scores Follow up information 24 hours ECG monitoring
Several (5) minutes ECG monitoring Real time ECG Analysis
Near Real Time ECG Analysis Weight monitoring Blood Pressure monitoring Oxygen Saturation monitoring ECG Analysis Batch ECG Analysis 1 record each time
Table 8.6: Comparisons PCHMS vs. AMEK
8.4 Conclusion
The final end-product of this phase is the complete system. The coding of the system comes
to an end and all types of testing were performed. The transformation of the client
requirements into a completed, documented and thoroughly tested system has been
accomplished in such a way that the new system should fulfil the expectations of the client for
service and system functionality.
Based on the conditions that we did the tests, the test results indicates that it is good to not to
have more than 10 users accessing the application simultaneously, because the response time
it is increased.

- 87 -
Chapter 9
Conclusions and Future Work
9.1 Conclusions
9.2 External System that has to be created
9.3 Internal System additional work
9.1 Conclusions
The added value of carrying out this project at National and European level is clear, given the
dimension of the growing elderly population in Cyprus. The ageing population affects Cyprus
as a whole, and is not particular to any given layer of the society. People in general can expect
to live longer lives opens great new opportunities for individuals to fulfil their potential. The
combined effect of these achievements in the form of population ageing also presents us with
new challenges and will affect the social and economic foundations of the society.
Furthermore, it is project's conviction that innovations and technologies for an ageing
population should not exclude older people from the production and use of technologies. It is
thus vital that this project embraces a general scope, so as to include several end-users to
reflect the needs and user specifications of the most possible senior citizens, not just those of a
limited group. It will be a highly innovative solution. Enabling safe independent living in the
elderly persons preferred environment will contribute to their happiness, security and
wellbeing.

- 88 -
Some typical functionality that the proposed system supports includes the following: user
management, patient information and finally the most important is the patient’s vital
information reports and graphs.
User Management includes user registration, which, in our case, users will be the Doctors and
the Nurses. The users can manage their account, they can change their account and their
personal and contact information. The Patient Information can be added by the nurses or by
the doctor that examines the patient. Patient information includes his demographic
information, his medical background, his hospitalization information and his symptoms.
Furthermore, information concerning his calls and visits and patient follow up information are
collected by the system. Additionally, a questionnaire is provided by the system that the
patient answers before and after his treatment. The Patient’s vital information reports and
graphs are generated by the system for each patient. Reports and graphs are provided for the
patient’s weight, blood pressure, oxygen saturation and, finally and most importantly the ECG
graph is generated, in the case that it is not analyzed; it is analyzed by the system with the aim
of giving the doctors helpful information. With the help of technology we provide a system
that will control and help parties, the patients and the doctors. Technology nowadays provides
several tools like sensors that can be used to manage this. The Scores report is generated
automatically based on the patient’s answers on the questionnaire.
With the use of this system the patients don’t have to visit the hospital almost every day just
for monitoring purposes for few minutes. With the help of specialized sensors and other
equipment, vital information like the ECG, weight, blood pressure and oxygen saturation will
be collected by the patient and sent automatically to the doctor (using the external system that
will be created in the future. Refer to 9.2 for more information). After that the doctor can
process that information and decide what action he/she must take. The solution that will be
taken at the patient’s home is not going to be implemented at this stage of the project.

- 89 -
The use of the system will both save money and time for the patients and for the doctors. With
this system it is not necessary for the patient to visit the hospital every day. The doctor is able
to view the vital information that he needs from the system without the need of the patient to
be there.
9.2 External System that has to be created
An external system has to be created that will be at the patient’s house. This system will
collect the patient’s vital items of information, which are Weight, Blood Pressure and Oxygen
Saturation. Additionally, the most important vital information that has to be collected is the
patient’s ECG. That vital information will be collected with specialized sensors that will be
connected with the system.
An assessment has to be done to verify that the external system has the power to analyse the
ECG, in case the system has the power to do it; then it will analyse the ECG and send the
Analysed ECG to the Application Server calling the AddECGAnalyzed method of the
VitalInfoWS. In the case that the system doesn’t have the power to analyze the ECG then it
has to collect the ECG and send it to the system called the AddECGNotAnalyzed method of
the VitalInfoWS.
In addition, the vital items of information that will be collected are the Weight, Blood
Pressure and Oxygen Saturation; this vital information has to be sent to the systems calling
AddWeight, AddCxygenSaturation and AddBloodPressure methods respectively. The
connection with the external system will be done by calling the VitalInfoWS web service. For
more information refer to Appendix VIII.

- 90 -
9.3 Internal System additional work
The system now has completed its predefined scope. Furthermore some additional
information can be provided from the system; this information includes statistical reports and
data mining functionality.
The system collects the vital information that is necessary so that the doctor may review
his/her patients. Additionally, more information is currently collected concerning the patient;
this information is his/her demographic information; his/her medical background,
hospitalization information, calls and visits, follow up information and finally and more
importantly, a questionnaire is answered by the patient before and after his/her treatment;
based on these answers, physical, emotional and global scores are calculated.
Additionally, monthly statistical reports can be generated and be sent to the doctors
concerning the patients’ vital information and data.

- 91 -
Appendix I
User Input
Patient’s Personal Information
ΙΣΤΟΡΙΚΟ
Νοσοκοµείο .................................................. Αρ. Αρχείου.............................
Θάλαµος........................................ Θεράπων Γιατρός.....................................
Ηµεροµηνία ................................. Ηµεροµηνία Εισαγωγής .............................
Αρχική ∆ιάγνωση ........................... ∆ιάγνωση κατά το εξιτήριο.......................
∆ΗΜΟΓΡΑΦΙΚΑ ΣΤΟΙΧΕΙΑ
ΠΡΟΣΩΠΙΚΑ ΣΤΟΙΧΕΙΑ
Όνοµα ασθενούς: ………………............. Επίθετο: ……………………………………………
Αριθµός Ταυτότητας: ……………………… Φύλο: Άρρεν Θήλυ
Ηµ. Γέννησης: ............/........./.......................
Εθνικότητα: .............................. Ιθαγένεια: …..………………………………………..
Οικογενειακή κατάσταση Παντρεµένος/η ∆ιαζευγµένος/η
Χήρος/α Ελεύθερος/η
Επάγγελµα / Ιδιότητα: .................................................................................
Εκπαίδευση: ∆ηµοτικό Λύκειο Ανώτερη Ανωτάτη Μεταπτ/κή
Παρούσα κατάσταση: Εργοδοτούµενος Άνεργος Συνταξιούχος Με αναπηρία
Μένει: Με την οικογένεια
Στο σπίτι µόνος/η µε βοήθεια από την οικογένεια

- 92 -
Στο σπίτι µόνος/η µε οικιακή βοηθό
Στο σπίτι µόνος/η µε βοήθεια από την κοινωνική πρόνοια
Σε οίκο ευγηρίας
Αλλού: ∆ιευκρινίστε ....................................................
Προσωπικός Γιατρός: ....................................................................................
Τηλέφωνο προσωπικού γιατρού: ...................................................................
ΣΤΟΙΧΕΙΑ ΕΠΙΚΟΙΝΩΝΙΑΣ
∆ιεύθυνση κατοικίας:.......................................................................................
Τηλέφωνο: 1. …………………………………. 2.
………………………………………........
Πλησιέστερος συγγενής / φροντιστής : .............................................................
Συγγένεια / Σχέση: .......................
Τηλέφωνο πλησιέστερου συγγενή: …………………………………...............................
ΣΤΟΙΧΕΙΑ ΕΙΣΑΓΩΓΗΣ
Ώρα εισαγωγής: ΠΜ ΜΜ
Τρόπος Προσέλευσης: Απευθείας προσέλευση στο Τµήµα Πρώτων Βοηθειών
Προγραµµατισµένη εισαγωγή
Παραποµπή από προσωπικό γιατρό
Κλήση Ασθενοφόρου
Με συνοδεία: ΝΑΙ ΟΧΙ
Κύριο ενόχληµα κατά την εισαγωγή: ...................................................................
Συµπτώµατα / Σηµεία κατά την εισαγωγή:
∆ύσπνοια Κόπωση
Ορθόπνοια Οίδηµα
Λήθαργος Συριγµός
Περικάρδιο άλγος / Στηθάγχη Υπέρταση ή Υπόταση
Αίσθηµα παλµών Άλλα: ........................................
ΙΑΤΡΙΚΟ ΙΣΤΟΡΙΚΟ

- 93 -
ΠΑΛΑΙΟΤΕΡΟ ΙΣΤΟΡΙΚΟ
Αλλεργίες :
…………………………………………………………………………………………………
…
Προηγούµενες εισαγωγές στο νοσοκοµείο: ΝΑΙ ΟΧΙ
Αν ναι, αιτία: ...........................................................................................................................
Επεµβάσεις:
Παλαιότερα νοσήµατα: .................................................................................
Χρόνια συνοδά νοσήµατα:
Ρευµατική νόσος: NAI OXI
Χρόνια νεφρική ανεπάρκεια: NAI OXI
Χρόνια αποφρακτική πνευµονοπάθεια: NAI OXI
Άσθµα: NAI OXI
Αγγειακό Εγκεφαλικό Επεισόδιο: NAI OXI
Άλλα:……………………………….
Φυσική Κατάσταση:
Άθληση / Άσκηση: NAI OXI
Χρήση ουσιών: NAI OXI
ΚΑΡ∆ΙΟΛΟΓΙΚΟ ΙΣΤΟΡΙΚΟ
Οικογενειακό ιστορικό: ΟΧΙ ΝΑΙ
Αριθµός Ά Βαθµού Συγγενών: ........
Παράγοντες κινδύνου:
Υπέρταση Κατάχρηση αλκοόλ Παχυσαρκία
∆ιαβήτης Υπερλιπιδαιµία Καρδιοτοξικά φάρµακα Κάπνισµα :
OXI NAI Παθητικό κάπνισµα
Κοινωνικό κάπνισµα
Τακτικός καπνιστής
Ενεργός καπνιστής ; NAI OXI

- 94 -
Συνολικά έτη καπνίσµατος: 1-5 έτη 6-10 έτη 11-20 έτη πάνω από 20
Υποκείµενη Νόσος:
Στεφανιαία Νόσος Αρρυθµίες Μυοκαρδιοπάθεια
Βαλβιδοπάθεια Υπερτασική Χρόνια κολπική
Άλλο ..................... µυοκαρδιοπάθεια µαρµαρυγή
Αγγειογραφία: ΟΧΙ
ΝΑΙ Ηµεροµ. :
………
….
Με
ευρήµατα
Ιστορικό εµφράγµατος του µυοκαρδίου: ΟΧΙ
ΝΑΙ Ηµεροµ. :
………
….
Αγγειοπλαστική (Μπαλονάκι): ΟΧΙ
ΝΑΙ Ηµεροµ. :
………
….
Αορτοστεφανιαία Παράκαµψη (By Pass): ΟΧΙ
ΝΑΙ Ηµεροµ. :
………
….
Εµφυτευµένες συσκευές
(implantable devices)
Μόνιµος
Βηµατοδότης:
ΟΧΙ
ΝΑΙ Ηµεροµ. :
………
….
Εµφυτευµένος
απινiδωτής (ICD)
ΟΧΙ
ΝΑΙ Ηµεροµ. :
………
….

- 95 -
Συσκευή
συγχρονισµένης
βηµατοδότησης
(CRT)
ΟΧΙ
ΝΑΙ Ηµεροµ. :
………
….
Συσκευή
υποβοήθησης
αριστερής
κοιλίας (LVAD)
ΟΧΙ
ΝΑΙ Ηµεροµ. :
………
….
Προσθετικές Βαλβίδες: ΟΧΙ
ΝΑΙ Ηµεροµ. :
………
….
Hλεκτροφυσιολογiκή
µελέτη: ΟΧΙ
ΝΑΙ Ηµεροµ. :
………
….
Νοσηλεία στη ΜΕΘ: ΟΧΙ
ΝΑΙ Ηµεροµ. :
………
….
Αιτία: ..............
Ήµερες
νοσηλείας: ...............
ΚΑΡΠΑ: ΟΧΙ
ΝΑΙ Ηµεροµ. : ..............
Ανάταξη από
εµφυτευµένη
συσκευή: ΟΧΙ
ΝΑΙ Ηµεροµ. : ..............

- 96 -
ΚΑΤΑ ΤΗ ΝΟΣΗΛΕΙΑ
∆ιαγνωστικές Εξετάσεις:
Υπερηχοκαρδιογράφηµα Κλάσµα εξώθησης (LV Ejection Fraction) ……… %
Συστολική ∆υσλειτουργία αρ. κοιλίας
Υπερτροφία αριστερής κοιλίας
Στένωση µιτροειδούς
Στένωση αορτικής βαλβίδας
Βαλβιδική παλινδρόµηση αορτική
µιτροειδική
πνευµονική
τριγλωχινική
Ακτινογραφία θώρακα: Χωρίς ευρήµατα Πνευµονικό Οίδηµα
Πλευριτική συλλογή Πνευµονική λοίµωξη
Ατελεκτασία Άλλα παθολογικά ευρήµατα
ΗΚΓ: Ρυθµός Φλεβοκοµβικός Κολπική Μαρµαρυγή
Βηµατοδοτούµενος Άλλος ……………………………………..
Παλαιό ΕΜ ΝΑΙ ΟΧΙ
BNP τιµή ............................................
ΝΤ-pro BNP τιµή …………………………………….
Απεικόνιση µε ραδιονουκλίδια (σπινθηρογράφηµα)
Ευρήµατα .............................................
Καθετηριασµός Ευρήµατα………………………………..
Μαγνητική τοµογραφία (MRI) / Αξονική τοµογραφία (CT)

- 97 -
Αιµατολογικός – Βιοχηµικός έλεγχος
Τιµές της πιο πρόσφατης ανάλυσης Ηµεροµηνία ................................
ΣΤΟΙΧΕΙΑ ΚΑΤΑ ΤΟ ΕΞΙΤΗΡΙΟ
Ταξινόµηση κατά ΝΥΗΑ Ι ΙΙ ΙΙΙ ΙV Βάρος: ………………………………. Ύψος: ................................. ∆ΜΣ: ................. Εξιτήριο: Στο σπίτι
Σε κλινική αποκατάστασης
Σε οίκο ευγηρίας
Σε συγγενείς
Αλλού ............................. Συµπτώµατα / Σηµεία κατά το εξιτήριο: ∆ύσπνοια Κόπωση
Ορθόπνοια Αναιµία
Προκάρδιο άλγος/Στηθάγχη Ζάλη
Αίσθηµα παλµών Ασκίτης
Ακροαστικά πνευµόνων Συριγµός
Ανορεξία Άλλα: ...................................
Οίδηµα: Σφυρών Γαστροκνηµίας Μηρών Κοιλιακή χώρα ΑΠ κατά το εξιτήριο: ............................................................. Καρδιακός ρυθµός κατά το εξιτήριο: Συχνότητα ............................... ΦΚ
Κολπική Μαρµαρυγή
Βηµατοδοτούµενος
Έκτακτες συστολές
Άλλο ........................ Φαρµακευτική Αγωγή κατά το εξιτήριο
∆ιουρητικό Αγκύλης Σκεύασµα ........................... ∆όση ..............
∆ιγοξίνη Σκεύασµα ........................... ∆όση ..............
Σπιρονολακτόνη Σκεύασµα ........................... ∆όση ..............
Β-αποκλειστές Σκεύασµα ........................... ∆όση ..............
Αναστολείς ∆ιαύλων Ca++ Σκεύασµα ........................... ∆όση ..............
ΑΜΕΑ / ΑΤ ΙΙ Σκεύασµα ........................... ∆όση ..............
Θειαζίδη / Μετολαζονη Σκεύασµα ........................... ∆όση ..............
Νιτρώδη Σκεύασµα ........................... ∆όση ..............

- 98 -
Σπρέι Νιτρογλυκερίνης Σκεύασµα ........................... ∆όση ..............
Ασπιρίνη Σκεύασµα ........................... ∆όση ..............
Κουµαρινικά Σκεύασµα ........................... ∆όση ..............
Στατίνες Σκεύασµα ........................... ∆όση ..............
Άλλα: 1............................... Σκεύασµα ........................... ∆όση ..............
2............................... Σκεύασµα ........................... ∆όση ..............
3............................... Σκεύασµα ........................... ∆όση ..............
4............................... Σκεύασµα ........................... ∆όση ..............
5................................ Σκεύασµα ........................... ∆όση ..............
6................................ Σκεύασµα ........................... ∆όση ..............
ΕΚΠΑΙ∆ΕΥΣΗ: Εκπαίδευση κατα το εξιτήριο: NAI OXI ∆όθηκε έντυπο εκπαιδευτικό υλικό: NAI OXI Εκπαίδευση της οικογένειας: NAI OXI

- 99 -
Patient’s Questioner & Score Information [10]

- 100 -
Appendix II
Entity Relationship Diagram (ERD)

- 101 -
Appendix III
Process Flow Diagram (PFD)

- 102 -
Appendix IV
Database Structure

- 103 -
Appendix V
Patients Portal User Interface
Registration Page
Login Page

- 104 -
Change Password Page

- 105 -
Patient’s Maintenance page

- 106 -
Patient’s Hospitalization page

- 107 -
Patient’s Hospitalization Symptoms page
Patient’s Call and Visits page

- 108 -
Questioner page

- 109 -
Patient’s Scores page
Patient’s Follow Up page
Schedule ECG Archive page

- 110 -
Patient’s Vital Info page

- 111 -
Patient’s ECG Info page

- 112 -
Appendix VI
Membership Provider Installation
MEMBERSHIP PROVIDER INSTALLATION [18]
ASP.NET MVC Forms Authentication With SqlMembershipProvider
The ASP.NET MVC Website Template comes pre-configured to use SqlMembershipProvider
which manages storage of membership information for an ASP.NET application in a SQL
Server database.
But before you can use this properly you will need to setup your database, which will be very
easy because Microsoft shipped .NET 2.0 with a nice utility to do it! You can find this on
your computer, at this path:
C:\Windows\Microsoft.NET\Framework\v2.0.50727\aspnet_regsql.exe
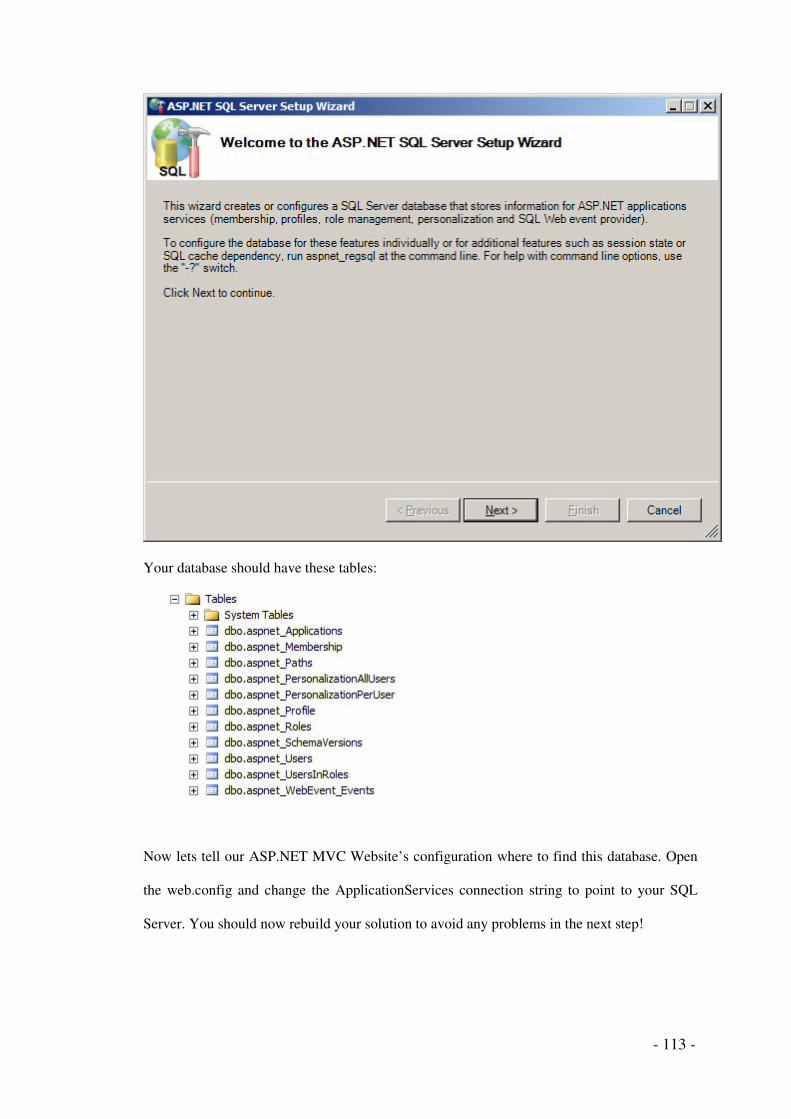
- 113 -
Your database should have these tables:
Now lets tell our ASP.NET MVC Website’s configuration where to find this database. Open
the web.config and change the ApplicationServices connection string to point to your SQL
Server. You should now rebuild your solution to avoid any problems in the next step!

- 114 -
view plaincopy to clipboardprint?
1. <connectionStrings>
2. <add name="ApplicationServices"
3. connectionString="Data Source=localhost;
4. Initial Catalog=database;
5. Persist Security Info=True;
6. User ID=user;
7. Password=password"
8. providerName="System.Data.SqlClient"
9. />
10. </connectionStrings>
It’s all good and nice but now we need Users in this database otherwise it’s completly useless!
So open up your ASP.NET MVC Solution in Visual Studio and go to Project » ASP.NET
Configuration. This will open the ASP.NET Web Application Administration website. In the
Security tab you can Add/Manage Users and Roles. For the moment, add a user so we can try
the login. I’ve added userMike.

- 115 -
You can now run your application and click on [ Log On ] at the top right corner of the page,
this will redirect you the the logon form.

- 116 -
If you entered the correct credential you should be redirected to the home page of the site and
you will see your name and a Log Off button instead of the Log On button.
Well congraticulations! You now have SqlMembershipProvider working on your website, wasn’t so hard, was it? Not a single line of code required! I’ll be posting again soon to show you how to use Roles in your applications.

- 117 -
Appendix VII
Sequence Diagram

- 118 -
Appendix VIII
Web Service – VitalInfoWS
Web service: VitalInfoWS
The system includes a web service that will be called by the patient’s system. This web
service will help the two systems to communicate and transfer data from the patient’s system
to the system on the server. The web service has the name VitalInfoWS, and it contains
several methods which are AddWeight, AddOxygenSaturation, AddBloodPressure,
AddECGAnalyzed and AddECGNotAnalyzed.
Web Service Methods
All functions return "Result" Value
Note that all methods return a “Result” parameter, which is an enumeration value and defines
if there was some processing error or not. The Return value can have the following values:
• "_Undefined" There was an unhandled error.
• "Success" Process completed successfully
• "ValidationFailed" One or more input parameters contains invalid values
• "Failed" There was an error in the process and it didn’t complete
successfully.
• "InvalidPatientID" The input patient ID is invalid
• "NoData" There wasn’t any data for the search criteria
Add Weight Method
The method AddWeight can be used to set the patient’s weight. It takes three parameters; the
PatientID which indicates the system identity of the patient and it must be numeric, the
Weight which takes numeric values and indicates the patient’s weight and the DateTimeStamp
which is of type DateTime and it indicates the time that the patient measured his/her weight.
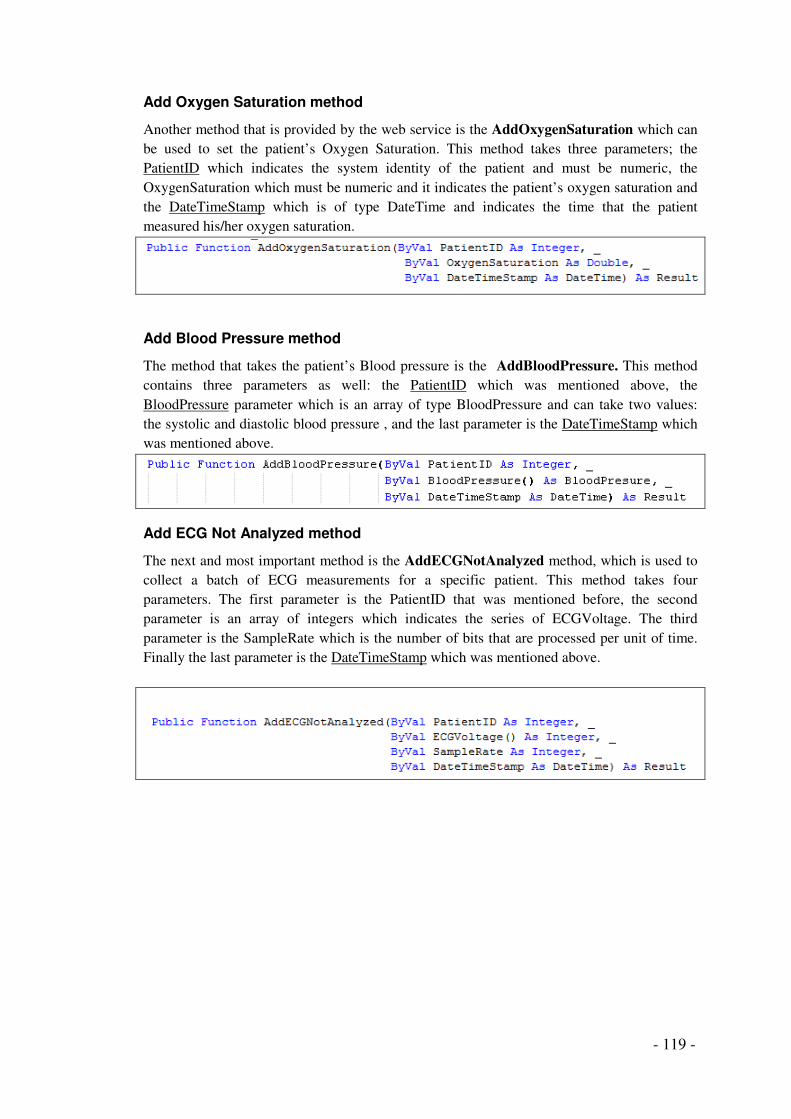
- 119 -
Add Oxygen Saturation method
Another method that is provided by the web service is the AddOxygenSaturation which can
be used to set the patient’s Oxygen Saturation. This method takes three parameters; the
PatientID which indicates the system identity of the patient and must be numeric, the
OxygenSaturation which must be numeric and it indicates the patient’s oxygen saturation and
the DateTimeStamp which is of type DateTime and indicates the time that the patient
measured his/her oxygen saturation.
Add Blood Pressure method
The method that takes the patient’s Blood pressure is the AddBloodPressure. This method
contains three parameters as well: the PatientID which was mentioned above, the
BloodPressure parameter which is an array of type BloodPressure and can take two values:
the systolic and diastolic blood pressure , and the last parameter is the DateTimeStamp which
was mentioned above.
Add ECG Not Analyzed method
The next and most important method is the AddECGNotAnalyzed method, which is used to
collect a batch of ECG measurements for a specific patient. This method takes four
parameters. The first parameter is the PatientID that was mentioned before, the second
parameter is an array of integers which indicates the series of ECGVoltage. The third
parameter is the SampleRate which is the number of bits that are processed per unit of time.
Finally the last parameter is the DateTimeStamp which was mentioned above.
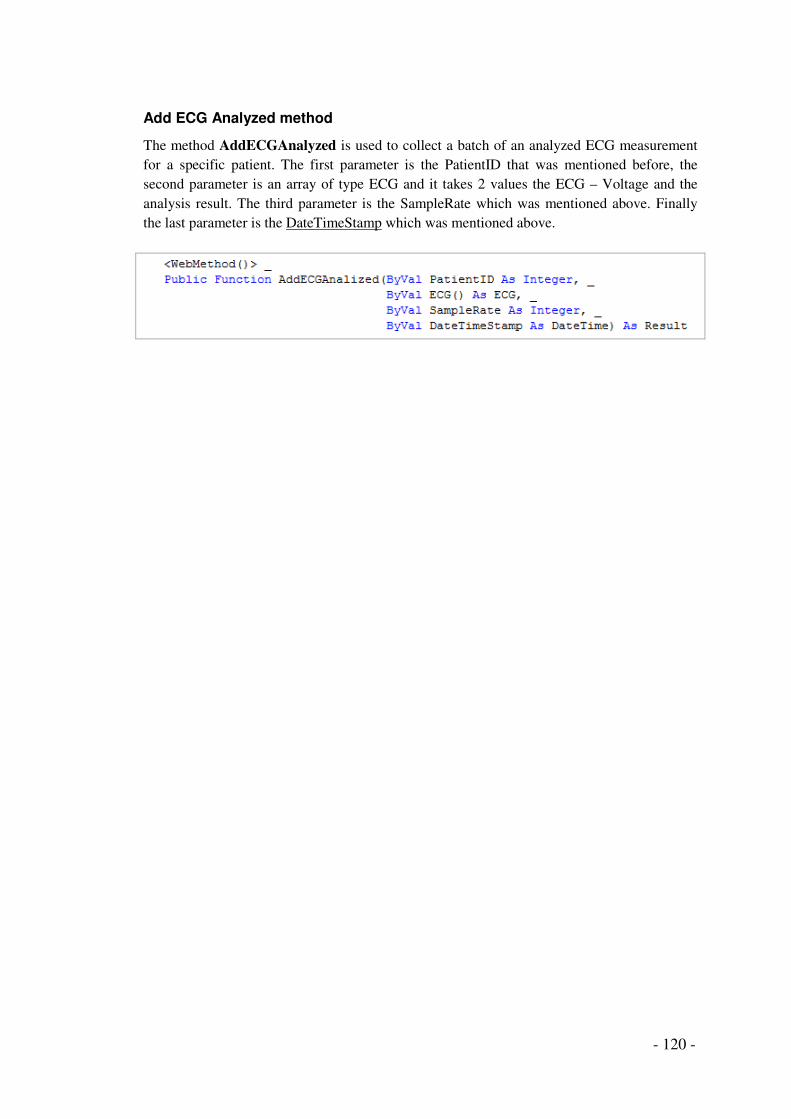
- 120 -
Add ECG Analyzed method
The method AddECGAnalyzed is used to collect a batch of an analyzed ECG measurement
for a specific patient. The first parameter is the PatientID that was mentioned before, the
second parameter is an array of type ECG and it takes 2 values the ECG – Voltage and the
analysis result. The third parameter is the SampleRate which was mentioned above. Finally
the last parameter is the DateTimeStamp which was mentioned above.

- 121 -
Appendix IX
User Manual
1 Menu
2 Patient maintenance pages
3 Patients’ reports
4 User account pages
5 Log Files
1. Menu
The Menu is used to access all the actions of the system. It
is divided into several sections.
• “Home” is used to access the home page.
• “Patients” is a list of the patients.
• After that, there are the maintenance screens
concerning each patient.
• Following that, there are the links for the reports.
• User account links can be found next and
• Finally the help links can be found.

- 122 -
1.1 Home page
Home page is used as a menu page for the doctors; they can see the latest information
concerning their patients. The first list that they see is the last ten records of Analyzed ECG
information that were inserted in the system; by clicking the button near the patient’s
name they will be redirected to the ECG page, in order to view the ECG. Then the patient’s
scores are presented. Additionally Patient’s Blood Pressure, Oxygen Saturation and Weight
lists are presented; by clicking the button the doctor will be redirected to the Vital
Information page.

- 123 -
1.2 Home – View Patients page
This page displays the patients that are attached to the login doctor. Additionally the “Add
New Patient” link can be used to add a new patient.
A Search option is provided. The user can search by patient Name, Telephone and AHI ID.
Edit the patient by clicking the button
Patient Medical Background can be accessed by clicking the button
Hospitalization list is open by clicking the button
Patient Scores can be viewed by clicking the button
Patient Calls & Visits can be viewed by clicking the button
Patient Follow up page is available by clicking the button
Vital Information is accessible by clicking the button
ECG preview is available by clicking the button

- 124 -
2 Patient Maintenance Pages
2.1 Patient’s Maintenance
This page can be used to Add, Edit and Delete a patient. User information is stored for
logging purposes.
Additionally here you can Add or remove a cooperating doctor by clicking on the [Select
Doctor] dropdown list. And then press Add Doctor link. To remove a doctor from viewing
the patient’s information click the Remove Doctor link near the doctor’s user name.

- 125 -
2.2 Patient Medical Background
This page can be used to Add and Edit Patient Medical Background information.

- 126 -
2.3 Patient’s Hospitalization
This page is used to Insert, Update and Delete patients' Hospitalization information. Here
Hospitalization date, Way of Arrival, information concerning the Major Symptoms on
Admission, Surgery Date and Procedure, if it is applicable, and finally Classification and
Leave Hospital Date are provided.

- 127 -
2.4 Hospitalization List
This screen is used to view the list of the hospitalizations of the selected patient and to change
a patient, just select his name from the patient dropdown list above. In order to add new
hospitalization for the patient select “Add new Hospitalization”.
The list displays the major symptoms, the hospitalization date and the date that the patient has
left the hospital. Additionally, to add the Symptoms that the patient was having on his
admission to the hospital click the link “Symptoms on hospitalization” and you will be
redirected to the Patient Hospitalization symptoms page.

- 128 -
2.5 Patient Hospitalization Symptoms
The only thing that you have to do is to select the symptoms that the patient was having his
hospitalization and then press Save. To return to the Hospitalization list click “Back to
Hospitalization List”.

- 129 -
2.6 Calls & Visits
This page displays a list of the calls and visits that the patient did. To had a new call and visit
click the “Add Call & Visit” link. By selecting a call or by pressing “Add Call & Visit” the
list below will appear. This allows you to Insert, Edit or Delete the entry.
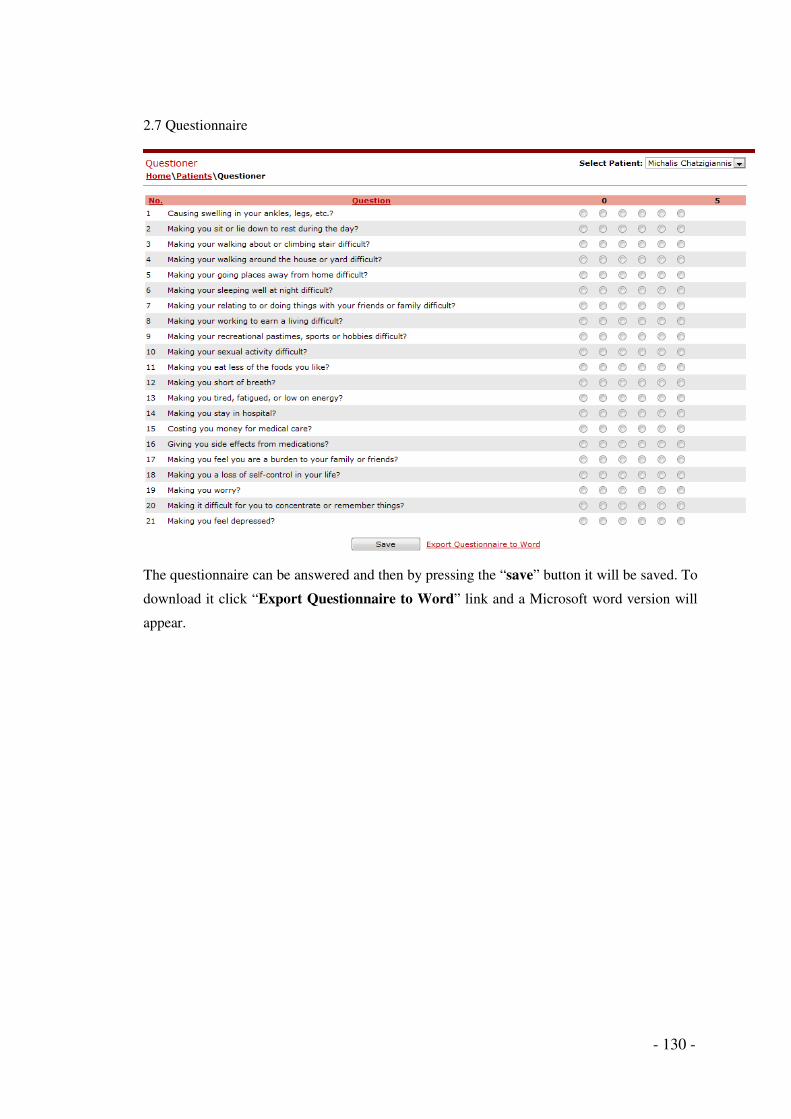
- 130 -
2.7 Questionnaire
The questionnaire can be answered and then by pressing the “save” button it will be saved. To
download it click “Export Questionnaire to Word” link and a Microsoft word version will
appear.

- 131 -
2.8 Patient Follow Up page
This page is used to add follow up information for the patient. To add new follow up
information, press “Add new entry” link. To Edit or Delete press Select and then the list
below the table will appear.
2.9 Schedule ECG Archive
Here the user can schedule ECG Archive. To do that Select Patient and then click on
Schedule Patient’s ECG Archive. Then the Patient’s name, the user name of the person that
did the schedule and the time are displayed on the list below. After some time the scheduler
will run and archive the ECG.

- 132 -
3 Patient’s Reports
3.1 Patient’s Vital Information Report
The user here can see the vital information of the selected patient. That vital information is the
weight, oxygen saturation and blood pressure. For each set of data we see the table of content
with the date and time and the graph. At the right of each graph the average, minimum and
maximum are shown. Under each table we see the total measurements that the patient has
done.

- 133 -
3.2 ECG Preview
The user here can see the ECG for the selected patient and the selected date.
The calendar indicates the dates that there is ECG data to present (the dates that the patient
measured his ECG). In the case that the ECG was archived then select the View Old ECG
which will update the calendar with the dates of the old ECG.
By selecting a date and then clicking the Display ECG button the ECG Graph will start
to animate. Several ECG arrhythmias are recognized and indicated in the graph.
Vital information for the selected date is displayed near the ECG Graph. That information is
the Start Time and the End Time of the ECG measurement, the Heart Rate, the Weight, the
Oxygen Saturation and the Blood Pressure.

- 134 -
3.3 Patient Scores Report
Those scores are calculated based on the answers that the patient gave on the questionnaire
(refer to 2.7 for more details) and some predefined scores for each question. Here the report
displays for each time that the patient answers the questionnaire the following scores:
Emotional, Physical, Global and Sub Score (which is the Emotional & Physical).
3.4 Patient Scores Chart Report
This report indicates the scores Emotional, Physical, Global and Sub Score which is the
Emotional plus the Physical graphically. The dates that the questionnaire was answered are
indicated below the bar chart.

- 135 -
4 User account pages
4.1 Sign Up For Your New Account
This page is used to register a new user. There are three steps for the user registration.
Step 1 – Sign up information:
In the first step the user must define his login information: User Name and Password are
mandatory fields.
Step 2 – Personal Information:
The user here must define his contact and personal information, like his telephone number,
address and date of birth. By pressing Insert link button the user will be redirected to the last
step.

- 136 -
Step 3 – Select Role:
The user here must select his role, which might be Doctor or Nurse and then press the Finish
link button.
4.2 Change Your Password
This page gives the user the opportunity to change his password.
4.3 My Account Information
This page gives the user the opportunity to insert or update his/her personal information.

- 137 -
4.4 Forgot Your Password?
This page is used to reset the user’s password. There are three steps for the Forgot your
password process.
Step 1 – Forgot your password?
In this step the user must insert his user name and the Press Submit button.
Step 2 – Identify Confirmation
If the first step is valid then this step will appear. In this step the user has to define his Answer
to his secret question. In the case that it is correct then an E-mail will be sent to the user with
his new password.
Step 3 – E-mail
In the E-mail the user can find his User name and his new Password, which can be changed in
Change Your Password (see 4.2 for more details).

- 138 -
5 Log Files
Several Log files are created from the system, those log files log necessary information to
trace errors.
5.1 Analysis Log File
An Analysis Log File is created every day when the ECG Analysis Server is run. This file
indicates the Date and time that the analysis was run, the Patient ID, the BatchDateTime of the
sample and the Result which must be Success. In the case that the Result is not Success then
there was an error. When the Analysis ends, the Total Records are indicated for the patient
and there is a proof that his ECG has been analyzed.
129094336006838832 Date: 2010-01-31 19:46:40Z
129094336006838832 PatientID: 10
BatchDateTime: 31/1/2010 10:57:08 πµ
Result: Success
129094336978778832 ---------------------------------------------------------------
129094336978778832 Date: 2010-01-31 19:48:17Z
129094336978778832 Total Records: 11988
129094337128508832 ---------------------------------------------------------------
129094337128508832 Date: 2010-01-31 19:48:32Z
129094337128508832 PatientID: 11
BatchDateTime: 31/1/2010 7:29:18 µµ
Result: Success
5.2 Interface Log File
An Interface Log File is created when an error is found with the communication with the
external system that sends the vital information. For example below we see that the external
system sent Patient ID 150 to the VitalInfoWS, but this patient does not exist in the system.
129107304809400000 -----------------------------------
129107304809400000 Date:2010-02-15 20:01:20Z
129107304809400000 InvalidPatientID, Input PatientID=150
5.3 Trace Log File
A Trace Log File is created when an exception error is found in the solution; this error is
written in the file in order that you may trace it and able to correct it.

- 139 -
References
[1] Wikepedia - www.wikipedia.org
[2] The Electrocardiogram - http://www.tveatch.org/ekgs/pqrst.html
[3] http://www.medicinenet.com/arrhythmia_irregular_heartbeat/article.htm
[4] Ambulance technician study-http://www.ambulancetechnicianstudy.co.uk/ecgbasics.html
[5] Medical News Today-http://www.medicalnewstoday.com/articles/32065.php
[6] Jimena Rodrνguez, Lacramioara Dranca, Alfredo Goρi and Arantza Illarramendi
University of the Basque Country (UPV/EHU).LSI Department.Donostia-San Sebastiαn.
Spain. A Web Access to Data in a Mobile ECG Monitoring System, pp 1-3, 2004
[7] E. Kyriacou, C. Pattichis, M. Pattichis, A. Jossif, L. Paraskeva, A. Konstantinides, D.
Vogiatzis, An m-Health Monitoring System for Children with Suspected Arrhythmias, pp
1- 4, 2007.
[8] American heart Association - http://www.americanheart.org
[9] http://www.answers.com/
[10] Minnesota Living with Heart Failure Questionnaire (MLHFQ)
Thomas S Rector PhD, University of Minnesota Minneapolis USA
[11] http://msdn.microsoft.com/
[12] http://odetocode.com
[13] The Official Microsoft ASP.NET Site http://www.asp.net
[14] http://www.microsoft.com
[15] http://www.ni.com
[16] http://www.developer.com
[17] http://www.dbase.com/
[18] Open Source Arrhythmia detection Software DOI - Patrick S. Hamilton
http://www.eplimited.com
[19] E. Kyriacou, C. Pattichis, M. Pattichis, A. Jossif, L. Paraskeva, D. Hoplaros, D.Vogiatzis
A Wireless System for Monitoring of Children with Suspected Arrhythmias, pp 1-4,2009
[20] Web Performance http://www.webperformanceinc.com/
[21] de Bruin, E.,D., Swanenburg, J., Betschon, E., Murer, K. A randomised controlled trial
investigating motor skill training as a function of attentional focus in old age. BMC
Geriatrics, 8(9):15, 2009
[22] Koch, S., and Haggland, M. Health informatics and the delivery of care to older people.
Maturitas, 63(3):195-199, 2009.
[23] Ryan, A.,A. , McCann, S. , McKenna, H. Impact of community care in enabling older
people with complex needs to remain at home. International Journal of Older People
Nursing, Volume 4 (1): 22 – 32, 2009

- 140 -
[24] Glascock A., Kutzik D., “The Impact of Behavioral Monitoring Technology on the
Provision of Health Care in the Home,” Journal of Universal Computer Science, vol. 12,
no. 1, 59-79, 2006
[25] Chan M., Campo E., Esteve D., “ Monitoring Elderly People Using a Multisensor
System,” Towards a Human-Friendly Assistive Environment, D.Zhang and
M.Mokhtari(Eds.), IOS Press 2004.
[26] Korhonen, I. Parkka, J. Van Gils, M., “Health monitoring in the home of the future,”
Engineering in Medicine and Biology Magazine, IEEE, vol.22(3), pp.66-73,2003.
[27] Nambu, M. Nakajima, K. Kawarada, A. Tamura, T. “A system to monitor elderly
people remotely, using the power linenetwork,” in proc. Of the 22nd IEEE EMBC conf,
Chicago, IL, USA, 2000.
[28] Glascock A., Kutzik D., “Behavioral Telemedicine: A New Approach to the Continuous
Nonintrusive Monitoring of Activities of Daily Living,” Telemedicine Journal, 6(1): 33-
44, 2000.
[29] Sixsmith A, “An evaluation of an intelligent home monitoring system,” Journal of
Telemedicine and Telecare, Volume 6, Number 2, pp. 63-72(10), 1 April 2000.
[30] Tiresias Scientific Research Unit's website, http://www.tiresias.org.
[31] Eurostat, 2006. International Day of Old Persons. EU25 population aged 65 and over
expected to double between 1995 and 2050. Eurostat news release, 129/2006.
[32] Lambrinou, E., Sourtzi, P., Kalokerinou, A., Lemonidou, C. Attitudes and knowledge of
the Greek nursing students towards older people. Nurse Education Today, 29(6):617-22,
2009.
[33] Drennan, V., Levenson, R., Goodman, C., Evans C. The workforce in health and social
care services to older people: developing an education and training strategy. Nurse
Education Today, 24: 402 – 408, 2004
[34] Treharne G. Attitudes towards the care of elderly people: are they getting better? Journal
of Advanced Nursing, 15(7):777-81, 1990.