journal of archaeological science:...
TRANSCRIPT

Journal of Archaeological Science: Reports xxx (2014) xxx–xxx
JASREP-00013; No of Pages 12
Contents lists available at ScienceDirect
Journal of Archaeological Science: Reports
j ourna l homepage: ht tp : / /ees.e lsev ie r .com/ jas rep
Reassessing obsidian field relationships at Glass Buttes, Oregon
Ellery Frahm ⁎, Joshua M. Feinberg 1
Department of Anthropology, University of Minnesota, 301 19th Avenue South, Minneapolis, MN 55455, United StatesInstitute for Rock Magnetism, Department of Earth Sciences, University of Minnesota, 310 Pillsbury Drive SE, Minneapolis, MN 55455, United States
⁎ Corresponding author at: University of MinnesMinneapolis, MN 55455, United States. Tel.: +1 763 807
E-mail addresses: [email protected], elleryfrahm@[email protected] (J.M. Feinberg).
1 Tel.: +1 612 624 8429.
http://dx.doi.org/10.1016/j.jasrep.2014.11.0072352-409X/© 2014 Published by Elsevier Ltd.
Please cite this article as: Frahm, E., Feinbergence: Reports (2014), http://dx.doi.org/10.1
a b s t r a c t
a r t i c l e i n f oArticle history:Received 13 September 2014Received in revised form 15 November 2014Accepted 18 November 2014Available online xxxx
Keywords:Glass ButtesOregonHigh Lava PlainsObsidian sourcingPortable XRF
The Glass Buttes complex in the High Lava Plains of Oregon produced obsidians during a series of rhyolitic erup-tions circa 5.8 to 6.5 Ma. These obsidians have been used to craft stone tools for millennia, from Clovis peoples tomodern knappers, and have been recovered at sites throughout the Pacific Northwest. Glass Buttes is also the or-igin of much obsidian used for lithic replication experiments and to test new techniques for sourcing. Paradoxi-cally, the spatial distributions of chemically distinct obsidians at this complex have received comparatively littleattention. The only published study to connect obsidian compositional differences to theGlass Buttes landscape isAmbroz et al. (2001), who reported seven discrete, spatially constrained obsidian “chemical groups” based onclustered data in elemental scatterplots. Since its publication, their paper has been cited as an example of success-ful obsidian “subsource” characterization. During the course of a wider research program, we collected 337 spec-imens at Glass Buttes from loci originally sampled by Ambroz et al. (2001). While we could replicate the“chemical groups” observed by Ambroz et al. (2001), wewere unable to reproduce the reported spatial distribu-tion of sources across the landscape. Almost half of the resampled loci exhibited intermingled populations ofchemical types due to their locations on alluvial–colluvial deposits. We also identified five additional obsidianchemical types at the complex; however, geochemically significant elements suggest that only a subset ofthese eleven types correspond to different flows and domes at Glass Buttes. A few appear to reflect chemical zon-ing within flows, whereas two other types may be exogenous, moved from nearby obsidian sources via second-ary transport. Thus, we demonstrate here that the discrete subsource zones demarcated by Ambroz et al. (2001)do not reflect reality on the landscape. This, in turn, alters how artifact sourcing results are interpreted with re-spect to howmobile foraging groups interacted with the landscape and made choices regarding resource acqui-sition, toolstone provisioning, and land use.
© 2014 Published by Elsevier Ltd.
1. Introduction
The High Lava Plains (HLP) of Oregon is one of themost volcanicallyactive regions in the continental United States. More than a hundredrhyolitic volcanic centers have erupted over the last 11 Ma within this20,000-km2 zone (Orr and Orr, 1992), creating a landscape rich inobsidian-bearing flows and domes. The Glass Buttes volcanic complex,perhaps the best known obsidian locale in the Pacific Northwest, liesin the middle of the HLP. Generated by a series of eruptions circa 5.8to 6.5 Ma (Godfrey-Smith et al., 1993; Ford et al., 2013), its obsidianswere used to craft stone tools for millennia, from at least as early as7000 BCE (Carlson, 1994; perhaps even during the Clovis era, Stueberand Skinner, 2011) to recent centuries (Jackson and Ericson, 1994).Glass Buttes obsidians have been recognized throughout the Pacific
ota, 310 Pillsbury Drive SE,8642.ail.com (E. Frahm),
, J.M., Reassessing obsidian fie016/j.jasrep.2014.11.007
Northwest, from British Columbia to the north, California to the south,and Idaho to the east (Hughes, 1978, 1986; Carlson, 1994); however,their utilization was primarily local (Musil and O'Neill, 1997; Hutchinsand Simons, 1999; Cadena, 2012). In a rare regional-scale study, Skinner(1995) observed that Glass Buttes obsidianswere found at archaeologicalsites in the nearby LowerDeschutes and JohnDayRiver Basins but are vir-tually absent at sites in the more distant Upper Deschutes and KlamathBasins. Thus, while published archaeological data are limited, intensiveexploitation of Glass Buttes obsidians apparently occurred principally atnearby sites, asmight be expected for the obsidian-richOregon landscape.
Glass Buttes is even better known as a source of abundant obsidianfor archaeologists, knappers, and experimentalists in a variety of fields.For example, its obsidians have been used to test the efficacy of diversesourcing techniques (e.g., Cherry, 1968; Jack and Carmichael, 1969;Stevenson et al., 1971; Bennet and D'Auria, 1974; Huntley and Bailey,1978; de B. Pereira et al., 2001; Gratuze et al., 2001; Bellot-Gurletet al., 2005). Tests of and experiments with obsidian hydration havealso utilized Glass Buttes obsidians (e.g., Friedman, 1968; Friedmanand Long, 1976; Dobson et al., 1989; Ihinger et al., 1999). In addition, ar-chaeologists tend to favor its obsidians in lithic replication and
ld relationships at Glass Buttes, Oregon, Journal of Archaeological Sci-

2 E. Frahm, J.M. Feinberg / Journal of Archaeological Science: Reports xxx (2014) xxx–xxx
experimentation (e.g., Sheets and Muto, 1972; Flenniken, 1978;Fladmark, 1982; Titmus and Woods, 1986; Domanski and Webb,1992; Andrefsy, 2006; Eren et al., 2014). Similarly, Glass Buttes is thebest-known source of obsidian for American knappers, and themajorityof the obsidian at knap-ins originates there (Whittaker, 2004:207).
The appeal of Glass Buttes is simple: the complex has abundant, eas-ily accessible, high-quality obsidian on public land, specifically a free-use area administered by the U.S. Bureau of Land Management (BLM).In recent years, collection restrictions have increased somewhat, butthe BLM still allows, at last check, noncommercial collection of 250 lbs(113 kg) of obsidian per person per visit. In contrast, many othersources in the Pacific Northwest have protected status (e.g., Big Obsidi-an Flow in Newberry National Volcanic Monument; Glass Mountain inModoc National Forest; Obsidian Dome in Inyo National Forest; Obsidi-an Cliff in Yellowstone National Park). Therefore, for obsidian research,Glass Buttes enables studies that simply are not possible or feasible else-where. For such reasons,we pursuedGlass Buttes as a location to furtherour research into the mineralogical mechanisms and spatial variabilityof obsidian magnetism (e.g., Feinberg et al., 2009, 2013; Frahm andFeinberg, 2013; Frahm et al., 2014a).
Somewhat paradoxically, the compositions and spatial distributionsof distinct obsidians at Glass Buttes have received comparatively littleattention. Most geological fieldwork at this complex has focused on itsrelationship to regional volcanism trends (i.e., age-progressive silicicvolcanism of the HLP; e.g., Godfrey-Smith et al., 1993; Jordan et al.,2004; Ford et al., 2013) or economic potential (i.e., geothermal energy,mineral resources; e.g., Berri, 1982; Johnson, 1984; Johnson andCiancanelli, 1984; Roche, 1987). Until the 1990s, it was generallythought that obsidian at Glass Buttes had a single chemical composition(e.g., Skinner, 1983, 1995; Hughes, 1986; cf. Nelson et al., 1975). A re-examination of the obsidian analyses in Godfrey-Smith et al. (1993)
Fig. 1.The spatial distribution of seven obsidian “chemical groups” at Glass Buttes according to AAmbroz et al. (2001), as are the zone boundaries. The black circles denote loci of Ambroz et al. (pled in this study, the open circles denote loci of Skinner (1983), the numbered squares denoteSpring archaeological site inAmbroz et al. (2001). Theprimary peaks of the complex are labeled:Top Butte (RTB). Other feature names are consistent with United States Geological Service (USDataset with 1/3-arc-second resolution, specifically maps N44W120 and N44W121.
Please cite this article as: Frahm, E., Feinberg, J.M., Reassessing obsidian fieence: Reports (2014), http://dx.doi.org/10.1016/j.jasrep.2014.11.007
reveals three distinct compositions, but with a focus on regional trends,this fact may have been simply overlooked. James et al. (1996) reported“five chemically-distinct variants” of obsidian from the Glass Buttescomplex that “may represent either separate events that occurredover a short geological time span or chemical variability across a flow”
(95). Unfortunately, their specimens were not geo-referenced, andtheir data are only instrument-specific X-ray intensities rather than el-ement concentrations. The only published study to connect obsidiancompositional differences to the Glass Buttes landscape is Ambrozet al. (2001).
Ambroz et al. (2001) used neutron activation analysis (NAA) con-ducted at the University of Missouri Research Reactor (MURR) to ana-lyze 225 Glass Buttes obsidian specimens. They argue that propercharacterization of obsidian sources involves “finding the geographicallimits of the obsidian zone, taking careful note of where specimenswere collected, and making sure enough samples were characterizedto be able to make statistically valid statements about the compositionof obsidian from a source” (741). Their NAA analyses revealed sevenobsidian “chemical groups,” labeled A through G, and theymap the spa-tial distributions of these groups onto the landscape (Fig. 1). That is,they identify seven discrete, spatially constrained obsidian “chemicalgroups” based on trace-element scatterplots. Thus, their map appearsto delineate the boundaries of seven distinct obsidian-bearing flows ordomes. This study has subsequently been considered an example of ob-sidian “subsource” characterization. For example, Glascock et al. (2007)cite the work as a case of successful “identification of specific sub-sources as small as a few square meters” (348; see also Ericson andGlascock, 2004:779).
We collected obsidian from fourteen Glass Buttes loci originallysampled by Ambroz et al. (2001) as part of our research program to ex-plore inter- and intra-flow variability in obsidian magnetism. That is,
mbroz et al. (2001), redrawn from their Fig. 1. The group and loci nomenclatures are that of2001) thatwere sampled in this study, the grey circles denote their loci that were not sam-the loci of Godfrey-Smith et al. (1993), and the black star inside a circle denotes the RobinsBig Glass Butte (BGB; otherwise knownasGlass Butte), LittleGlass Butte (LGB), and RoundGS) nomenclature. The topographic base map is composed of the USGS National Elevation
ld relationships at Glass Buttes, Oregon, Journal of Archaeological Sci-

Fig. 2. Multivariate analysis of the Glass Buttes specimens collected and measured byGodfrey-Smith et al. (1993). They collected a total of eighteen specimens from three loci(numbered 1, 3, and 4). Our discriminant analysis is based on the twelve elements mostconsistently detected in their Glass Buttes specimens: Al, Ba, Ca, Fe, K, Mg, Mn, Na, P, Si,Sr, and Ti. A scatterplot of the first two discriminant functions reveals the presence ofthree distinct obsidian compositions in their sample set. These compositions, however,do not correlate one-to-one to sampling loci. Two obsidians were present at locus #4,one of which also occurred at #3. Godfrey-Smith et al. (1993) describe these loci as “inthe fields flanking” a road, which we interpret as the alluvial–colluvial deposits that sur-round the buttes themselves. Thus, their data attest to potential mixing of different obsid-ian compositions in such areas of the Glass Buttes complex.
3E. Frahm, J.M. Feinberg / Journal of Archaeological Science: Reports xxx (2014) xxx–xxx
sampling at Glass Buttes was a means to intensively collect obsidiansfrom distinct but geochemically and volcanically related flows anddomes. We followed the sampling loci and map of Ambroz et al.(2001) because we initially accepted their claim to have identifiedseven discreet “zones surrounding each geochemical source group”(743). However, as a routine part of our work, we chemically analyzedeach of our 337 collected specimens using portable X-ray fluorescence(pXRF), following our established protocols (Frahm, 2014b).
Here we report that, although we were able to replicate the “chem-ical groups” of Glass Buttes obsidians noted by Ambroz et al. (2001), wecould not reproduce their map of the spatial distributions of theseobsidian types on the landscape. Instead, six (43%) of the loci hadmixed obsidians due to their location on alluvial–colluvial deposits,where simple downslope transport processes (e.g., intermittent streamflow) have intermingled obsidians from multiple flows and domes. Inaddition to the seven chemical types of obsidian reported by Ambrozet al. (2001), we identified five other types at the complex. Just a subsetof these eleven obsidian types likely correspond to different obsidian-bearing flows and domes at Glass Buttes. A few seem to reflect chemicalzoning within large obsidian flows, while types represented by singlespecimens might be exogenous to Glass Buttes itself, arriving at thecomplex via secondary transport processes and occurring only in alluvi-al–colluvial deposits. In short, we demonstrate here that the discrete“subsource” zones demarcated byAmbroz et al. (2001) donot reflect re-ality on the landscape. This, in turn, affects the behavioral implicationsof their artifact sourcing results for the Robins Spring archaeologicalsite, discussed byAmbroz et al. (2001), within the Glass Buttes complex.Rather than having to collect obsidian from five areas broadly distribut-ed across the complex, as well as another nearby source, all six of theirobserved obsidian types could have been collected from just two orthree neighboring locations at Glass Buttes, yielding a different pictureof howmobile foraging groupsmay have used the landscape and provi-sioned themselves.
2. Background: Ambroz et al. (2001)
Prior to Ambroz et al. (2001), only two studies reported analyses ofgeo-referenced Glass Buttes obsidians: Skinner (1983) and Godfrey-Smith et al. (1993). Skinner (1983) sampled from three loci on thenorthernmost slopes of the largest hill, known as Glass Butte or BigGlass Butte (BGB; Fig. 1). Little Glass Butte (LBG) and other featureswere unsampled. Analyzed by XRF, the twelve specimens (i.e., fourfrom each of the three loci) were chemically uniform. Godfrey-Smithet al. (1993) collected eighteen specimens from Glass Buttes at threeloci (numbered 1, 3, and 4, Fig. 1; i.e., six specimens from each locus).Their focus was investigating regional trends (i.e., age-progressive HLPvolcanism), so intra-complex trends at Glass Buttes went unexamined(i.e., a single ellipse encompasses all Glass Buttes specimens in theirCaO–MgO–Fe2O3 diagram). An examination of their data reveals threeobsidian compositions present in the sample set (Fig. 2). Locus #4 hadtwo different obsidians, one of which also occurred at locus #3. Bothloci were described “in the fields flanking” a road, which we interpretas the alluvial–colluvial deposits that surround the hills. Unfortunately,their focus on major-element geochemistry and use of optical spectro-scopic techniques (optical emission and atomic absorption) make ithard to correlate their measurements with trace-element data fromother analytical techniques.
Ambroz et al. (2001) sought to characterize theGlass Buttes obsidiancomplex in light of calls for greater attention to geological contexts andfield relationships (Glascock et al., 1998:22; Shackley, 1998:98). Theycollected “20–30 fist-sized pieces of obsidian” from each of 26 (in thetext) or 27 (on their map) “sampling locales” at Glass Buttes (742). Itis worth noting that Ambroz et al. (2001) describe these loci as obsidian“outcrops” (741, 742), which, in typical geological usage, refers to sur-face exposures of bedrock or other rock strata. This point will be impor-tant in Sections 4 and 8. The resulting collection was divided between
Please cite this article as: Frahm, E., Feinberg, J.M., Reassessing obsidian fieence: Reports (2014), http://dx.doi.org/10.1016/j.jasrep.2014.11.007
two laboratories: the MURR Archaeometry Laboratory and the North-west Research Obsidian Studies Laboratory. Ambroz et al. (2001) reporttheir findings based on 225 of these obsidian specimens analyzed byNAA usingMURR's standard procedures (743–744; Glascock, 1999:16).
Specifically, Ambroz et al. (2001) identified seven obsidian “chemi-cal groups,” labeled as Groups A through G, at the complex (Fig. 1).These types are largely defined by a scatterplot of Th versus Eu,which, they argue, are two of the most “discriminating elements”(744) for these groups. Additionally, their map delineates seven spatial-ly constrained “zones surrounding each geochemical source group”(743), the labels for which match the clusters in their NAA data(i.e., Groups A through G). It is clear that the seven groups both on thelandscape and in their scatterplots are meant to coincide (e.g., thesame A through G labels; “… chemical groups [i.e., geographic sourceareas],” 741). Only one obsidian chemical type is implied to occur ateach locus in their reconstruction, and these seven internally homoge-neous zones are interpreted as examples of the complex's “many obsid-ian flows” (744). Ambroz et al. (2001) also note that obsidian types“closest to each other geochemically are also near each other geograph-ically” (744), but no further interpretation is offered. In short, they re-port that purportedly outcrop-derived obsidian specimens fall intoseven discrete compositional groups in trace-element plots that corre-spond to seven coherent, circumscribed zones on the landscape(Fig. 1). This remains a currently acceptedmodel for obsidian field rela-tionships at Glass Buttes.
3. Field sampling procedures
We collected 337 obsidian specimens from 16 sampling loci (14 locifrom Ambroz et al., 2001 plus two nearby). With one exception(i.e., locus L2), at least 19 specimens were collected from each locus.Ambroz et al. (2001) recorded their loci using GPS, but the coordinateswent unpublished. Therefore, we derived the coordinates by overlaying
ld relationships at Glass Buttes, Oregon, Journal of Archaeological Sci-

4 E. Frahm, J.M. Feinberg / Journal of Archaeological Science: Reports xxx (2014) xxx–xxx
their map onto Google Earth. As their map symbols are about 200 m indiameter, no greater precision can be assumed in the location of our de-rived coordinates. In two cases (i.e., FF2 near FF, L2 near L), we added asecond sampling locus circa 250 m away, partly as a means to examineany variability on such scales. In both instances, there was no differencein obsidian found at the primary (e.g., FF) and secondary (e.g., FF2) loci.We consider this evidence that the positions of our sampling loci aresufficiently precise. Additionally, the sizes of the “zones” drawn byAmbroz et al. (2001) must be kept in mind (Fig. 1). Even their smallestzones are more than 1 km in diameter along the narrowest axis, where-as the largest zone (i.e., Group A) is nearly 19 km along itsmaximumdi-mension.With proposed features of such large scales, we argue that thesampling imprecision is insignificant. The derived coordinates wereuploaded to a GPS unit, which directed us to the proper spots, and areavailable as a Supplementary/Inline KML file (File 1).
Due to the potential for anthropogenic transport of obsidian cob-bles by rockhounds and knapping enthusiasts (Whittaker, 2004: 93,207), we avoided areas at Glass Buttes with evidence of activity(e.g., knapping debris, campfires, broken bottles). Such evidence gener-ally decreased with road quality and the number of barbed wire fencesencountered. In addition, rockhounding maps, newsletters, and booksrevealed popular collecting spots (which we avoided). Cobbles on thesurface were ignored. Collected cobbles were extracted from subsur-face. Only rounded and subangular obsidian cobbles with weatheredor cortical surfaces were selected. No cobbles with fresh surfaces orother evidence of recent conchoidal fracture were collected. Therefore,we are highly confident anthropogenic activities contributed minimal-ly, if at all, to our sample set. Our collected cobbles were, for the mostpart, 10–20 cm (4–8 in. in diameter (Fig. 3d).
4. Sampling loci descriptions
During the course of our sampling at Glass Buttes, we documented(i.e., using field notes and photographs like Figs. 3a–c) the geologicalcontext of each sampling locus. The following loci descriptions arebased on our field observations while at the complex.
The Glass Buttes lava flows and domes are surrounded by extensiveQuaternary alluvial–colluvial and playa (dry lake) deposits (Berri, 1982;Johnson and Ciancanelli, 1984; Roche, 1987). LociM, N, O, andQ all lie inthe alluvium–colluvium at the base of the southwestern BGB flow. Thesandy-to-clayey sediments are slopewashdeposits and contain obsidian
Fig. 3. (a) Locus FF2 is an extensive scatter of abundant obsidian fragments, apparently remnantsto be themost likely places to collect in situ, or nearly so, obsidians at Glass Buttes. (b) Loci O an(c) Locus P viewed from locus O. (d) Examples of the rounded and subangular obsidian cobble
Please cite this article as: Frahm, E., Feinberg, J.M., Reassessing obsidian fieence: Reports (2014), http://dx.doi.org/10.1016/j.jasrep.2014.11.007
cobbles transported downslope. Locus M lies within depositssandwiched between the BGB slope and basalt ridges, likely due tofaulting in the HLP. Locus N is slightly higher up onto the deposits atthe base of the flow, where a shallow gully has exposed such cobbles.Locus O lies near the base of a deep gully that leads almost to the topof BGB. There are no topographic indications to suggest that a smalldome or flow produced obsidian with a unique composition there.Locus Q lies farther from the slope, near a low ridge almost on theplaya deposits immediately south (called “Overall Flat” on USGSmaps). All of these loci represent secondary obsidian deposits.
Of all thewestern BGB loci, P is the only one on a lobe of the flow thatappears to cover the southwestern BGB slopes. The road onto this lobeends at an extensive scatter of abundant obsidian fragments. Such scat-ters at the complex seem to be the remnants of the flow's obsidian layer,exposed on flat areas by erosion and deflation (i.e., the covering sedi-ment has washed and blown away; see Frahm, 2012: Fig. 7, Frahm,2014a: Fig. 5 for simplified cross sections of an obsidian-bearing flow).The resulting “desert pavements” (i.e., the HLP is part of the Oregonhigh desert) are themost likely places to find in situ, or nearly so, obsid-ians at Glass Buttes. Figs. 3b and c show the settings and spatial relation-ships among sampling loci O, P, and Q.
Locus GG lies at the interface between the northern BGB flow lobesand the surrounding alluvium–colluvium. Near GG is locus FF, where adeep gully has cut into theflow and exposed obsidian cobbles apparent-ly near their primary locations. Our locus FF2 is approximately 250 mwest, on a flow lobe with a dense obsidian pavement similar to that atlocus P (Fig. 3a).
Loci CC, DD, and U lie between BGB and LGB. Locus CC is a smallpatch of alluvium–colluvium at the base of BGB flows to the west andLGB flows to the east, meaning this locus is likely a catchment area forobsidian from both buttes. DD, in contrast, lies atop the eastern BGBflow, where a gully has cut into a lobe and exposed obsidian cobbles.The BGB and LGB flows appear to nearly meet to the east, separatedby a channel that serves as a road. Locus U is a low rise at the base ofthe BGB flow, where it might be an eroded flow lobe or a slopewash de-posit. Thus, in this part of the complex, DD is themost likely locus tofindin situ obsidian.
At locus J, obsidian pebbles occur so densely across a low rise around300m in diameter that this scatter is visible on Google Earth. Given ba-salt ridges to the east and alluvial–colluvial deposits to thewest, it is un-certain, based on the modern topography, from where these pebbles
of aflow's obsidian layer exposedby erosion and deflation. Such “desert pavements” seemd P viewed from locus Q, well into the alluvial–colluvial deposits that surround the buttes.s collected from locus J. The rock hammer in the photograph is 28 cm long.
ld relationships at Glass Buttes, Oregon, Journal of Archaeological Sci-

5E. Frahm, J.M. Feinberg / Journal of Archaeological Science: Reports xxx (2014) xxx–xxx
could have washed to this location. Instead, it seems likely that this lowrise is the remnant of a small, eroded and deflated obsidian-bearing lavadome, resulting in a pavement similar to those at loci P and FF2. It mustbe considered, however, that it could be a secondary obsidian deposit,perhaps from theMidnight Point or Antelope Ridge flows, when the to-pography differed.
The contexts of L (and our L2) are unclear. A series of low, roundrises in this area could be remnants of rhyolitic flows and/or domes,some of which might have been obsidian-bearing. The road, however,appears to lie on alluvial–colluvial deposits. Therefore, our specimenswere collected from low rises to either side of the road: L to the westand L2 to the east, about 250 m apart. Locus HH lies between LGB andCascade Ridge to the north and Round Top Butte (RTB) to the south,and locus II is about 3 km west of HH. Like several other loci, both HHand II also lie right at the base of rhyolitic flow features, likely on alluvi-al–colluvial deposits. Neither locus could be a primary obsidian deposit.Several low ridges, flows, and domes in this area suggest that a few dif-ferent vents, including RTB,may have produced obsidian, so it is unclearwhere obsidian cobbles within the alluvium–colluvium of loci HH and IIwould have originated.
5. Instrument and analytical methods
Our elemental analyses were conducted using a pXRF instrument,specifically a Thermo Scientific Niton XL3t GOLDD. This instrument gen-erates X-rays via a miniaturized 50 kV tube, which increases sensitivityfor elements such as Ba, andNiton instruments automatically adjust thetube's current to attain optimal X-ray count rates for a particular speci-men. This instrument is equipped with a newer silicon drift detector(SDD) rather than an older Si p-n diode detector. It has an analyticalwindow 10-mm in diameter (80 mm2) with the greatest intensity in abeam circa 8-mm in diameter (50 mm2). Specimen positioning overthe analytical window was aided by the instrument's internal videocamera. The instrument was mounted in a portable test stand for allmeasurements reported here. It is worth pointing out that this instru-ment is capable of parts permillion (ppm) detection limits for favorable(e.g., “mid-Z”) elements. For example, after a 40-smeasurement, the de-tection limit for Sr and Rb was circa 1–2 ppm for freshly flaked surfaces(i.e., not polished or powdered) of our Glass Buttes obsidian specimens.
The instrument is equipped to measure more than 40 elements(including, except for Na, all major elements in obsidians); however,in the interest of time (i.e., throughput), not all were measured. Instead,we focused on elements that (1) arewell measured (i.e., high reproduc-ibility, repeatability) and (2) aremost often useful for differentiating ob-sidians. Each analysis took 2 minutes: 40 s on each of three X-ray filters(main, low, and high). All analyses were conducted on freshly flakedsurfaces. Severely curved specimen surfaces, however, can introduceerror due to non-optimal arrangements of the tube, specimen, and de-tector (e.g., Davis et al., 2011; Forster et al., 2011). This source of errorwasmitigated through (1) element selection (i.e., the “mid-Z” elementsare less affected) and (2) taking multiple analyses on the flattest sur-faces, which, when averaged, can yield errors like those for powderedspecimens (Davis et al., 2011).
Our measurements were corrected and calibrated using the “funda-mental parameters (FP) with standards” approach, which Heginbothamet al. (2010) established yields superior accuracy than empirical or stan-dardless approaches. In FP correction, raw measurements are adjustedfor varied phenomena in a specimen (e.g., X-ray absorption, secondaryfluorescence) using physics-based models. The initial factory-setcalibration was supplemented by regression analysis using 24 obsidianspecimens previously measured by NAA, conventional lab-based XRF,and electronmicroprobe analysis (EMPA). The specimens, all calcalkalineobsidianswith a range of element concentrations, were used because cer-tified reference materials (CRMs) of solid obsidians do not exist(e.g., USGS RGM-1 and NIST SRM 278 are powders). Linear regressionanalysis yielded equations that “fine tuned” the factory-set calibration
Please cite this article as: Frahm, E., Feinberg, J.M., Reassessing obsidian fieence: Reports (2014), http://dx.doi.org/10.1016/j.jasrep.2014.11.007
and resulted in accurate measurements. In addition, this set of obsidianswas analyzed daily to monitor reproducibility.
6. Data reduction and evaluation
Supplementary Table S1 reports the values for only those elementsin which we have the highest confidence. In any analytical technique,not all elements are measured equally well, and the best-measured ele-ments vary by specimen composition and instrument configuration.Thus, we devised two criteria to identify the best-measured elementsin this particular study. First, we identified elements with lowmeasure-ment uncertainties. For each measurement, the instrument reports theuncertainty due to the inherent randomness of X-ray emission and de-tection. Hence, one criterion to define a well-measured element in thisstudy is that, for Glass Buttes obsidians, the element's mean uncertaintyat the one-sigma level is less than 5% of its mean concentration. That is,for a specific element, the relative standard deviation that can be ex-pected from a series of measurements must fall below 5%. Eight mea-sured elements met this criterion for the Glass Buttes obsidians: Ba(2.5%), Ca (2.9%), Fe (1.0%), K (0.6%), Rb (1.8%), Sr (4.5%), Ti (4.1%),and Zr (1.5%). Supplementary Figure S1 establishes how these uncer-tainties were attained with measurements of 40 s/filter. Second, weidentified those elements with excellent reproducibility with respectto the 24 obsidian specimens used for calibration. Six elements exhibit-ed Pearson's r correlation coefficients of 0.95 or greater: Ba (1.00), Ca(0.98), Fe (0.97), Rb (0.99), Sr (1.00), and Zr (0.98). SupplementaryFigure S2 illustrates these high correlations even with such short mea-surements. These coefficients were calculated based on individualdaily measurements, not means, and thus incorporate both inter-technique and day-to-day reproducibility.
Fortunately, C-type Glass Buttes obsidian in Ambroz et al. (2001)was used for an inter-laboratory/inter-technique comparison organizedby MURR (Glascock, 1999). Although we did not sample either locus inthe C-type zone delineated by Ambroz et al. (2001), we did identify it(i.e., as our gamma type) among our specimens from locus CC. Thus,we can compare our pXRFmeasurements to ten data sets fromeight dif-ferent analytical facilities. Supplementary Table S2 reveals that, for ele-ments also measured by MURR using NAA, our pXRF data exhibitexcellent agreement with theirs. The only exception is Zr, which doesagree with LA–ICP–MS value from CNRS Orléans. This is consistentwith prior inter-technique comparisons, which exhibit greater dispar-ities when the Zr levels are near or below 100 ppm (Frahm, 2014b:Table 2). Thus, inter-laboratory disagreement seems high for Zr at lowlevels (i..e, ≤100 ppm), and this, in turn, has led to higher calibrationuncertainties at the element's lowest concentrations (i.e., Zr in NorthAmerican obsidians varies from 50 to nearly 3500 ppm; Glascock andFerguson, 2012).
7. Results
Ambroz et al. (2001) identify their obsidian “chemical groups” usingLatin letters (i.e., A throughG). The correspondingGreek letters, howev-er, define our chemical types (we prefer the term “types” since we con-sider obsidian artifact sourcing to be analogous to other archaeologicaltypologies; see Frahm, 2014c for a discussion).We use a different alpha-bet to acknowledge that, although both are compositionally defined,these two typologies are based on different sets of elements. Ambrozet al. (2001) define their types based on trace elements well measuredusing NAA (e.g., Eu vs. Th), whereas we define our types based onthose well measured using XRF techniques (e.g., Sr vs. Rb, Ba vs. Zr).Nevertheless, we contend that our analyses identified six of the sevenobsidian types reported by Ambroz et al. (2001), and their A is ouralpha, their B is our beta, etc. We did not identify their F-type obsidian(our zeta-type), but this was expected as Ambroz et al. (2001) reportedthis type only at locus L-A, which we did not sample. Nor did we expectto identify their C-type obsidian (our gamma) because we did not
ld relationships at Glass Buttes, Oregon, Journal of Archaeological Sci-

6 E. Frahm, J.M. Feinberg / Journal of Archaeological Science: Reports xxx (2014) xxx–xxx
sample loci EE and L-B. However, specimens of this type were found atlocus CC. In addition to the chemical types identified by Ambroz et al.(2001), we identified five additional ones.
Fig. 4 shows scatterplots with our types and their correlates fromAmbroz et al. (2001) based on (a) Sr vs. Rb, (b) Ba vs. Zr, and(c) discriminant functions based on the eleven elements most consis-tently measured in the Glass Buttes obsidians (Ba, Ca, Fe, K, Mn, Nb,Rb, Sr, Ti, Zn, and Zr), allowing us to examine the types' overall compo-sitional similarity. Our eleven types are most clearly separated in the Srvs. Rb scatterplot (Fig. 4a). A Ba vs. Zr scatterplot (Fig. 4b) also discernsour types with the exception of eta/G- and alpha/A-type obsidians,which overlap in this plot, suggesting these two types' compositionsare similar. The discriminant function scatterplot (Fig. 4c) differentiatesthe types but also indicates that alpha- and eta-type obsidians are moresimilar in composition than implied by the Eu vs. Thplot in Ambroz et al.(2001). Additionally, this plot suggests that beta- and kappa-type obsid-ians are compositionally similar.
Fig. 5 shows Sr vs. Rb scatterplots for each of our sixteen loci. Theseplots reveal that six sampling loci aremixtures of obsidians withmultiplecompositions. Half of these have three or more obsidian types. This is astark contrast to the single compositions per locus reported by Ambrozet al. (2001). Only ten of our loci (eight of them sampled by Ambrozet al., 2001) have obsidian with a single composition, and a few of theseloci, as noted in Section 4, are secondary obsidian deposits in alluvial–
Fig. 4. Scatterplots of our pXRF data reveal the obsidian chemical types identified by Ambroz et(c) discriminant functions based on the eleven elements most consistently measured by pXRFelements in one plot enables us to examine the overall compositional similarity of these “cheand the two types may reflect either two parts of a chemically zoned flow or two closely timemagma chamber. The same may also be true for the beta/B and kappa obsidian types (for inweb version of the article).
Please cite this article as: Frahm, E., Feinberg, J.M., Reassessing obsidian fieence: Reports (2014), http://dx.doi.org/10.1016/j.jasrep.2014.11.007
colluvial contexts. Table 1 summarizes these findings, reporting the num-bers of obsidian types at each locus sampled for our study. Theseplots alsoreveal slight locus-by-locus differences in alpha/A and beta/B composi-tions, implying that the corresponding obsidian flows, which seem fairlylarge, might have been chemically zoned.
Fig. 6 illustrates how our results compare to those of Ambroz et al.(2001) in Fig. 1. A set of fourteen pie charts, one for each samplinglocus of Ambroz et al. (2001) (i.e., FF and FF2 are combined here, asare L and L2), shows the relative proportions of our eleven obsidiantypes across Glass Buttes. As noted above, six of these loci have mixedobsidians, including three loci with three or more types, and thus devi-ate from the reconstructions of Ambroz et al. (2001). For example, eta/G-type obsidian accounts for a mere 8%, not the entirety, of the speci-mens found at locus O. P is the only locus with only beta/B-type obsidi-an, which was also found on the eastern BGB slopes at locus CC,suggesting a very different distribution and origin than that reportedby Ambroz et al. (2001). Another notable deviation is that locus HHhas entirely different obsidian (iota) than those found at loci L (delta/D) and II (delta/D and theta), the three of which constitute a coherent“chemical group” and “obsidian zone” in Ambroz et al. (2001).
Fig. 7 shows the sampling loci of Ambroz et al. (2001) on a recentgeological map of the Glass Buttes complex (Boschmann, 2012). Thismap confirms that alluvial–colluvial deposits are more likely to containa mixture of obsidian types; however, secondary deposits may contain
al. (2001) and five additional obsidian compositions: (a) Sr versus Rb, (b) Ba versus Zr, andin the Glass Buttes obsidians: Ba, Ca, Fe, K, Mn, Nb, Rb, Sr, Ti, Zn, and Zr. Using all elevenmical types” of obsidian. This plot strongly suggests that eta/G is very similar to alpha/A,d obsidian-producing eruptions so that there was little time for chemical evolution in theterpretation of the references to color in this figure legend, the reader is referred to the
ld relationships at Glass Buttes, Oregon, Journal of Archaeological Sci-

Fig. 5. Sr versus Rb plots for each of the sixteen loci in our study. The ellipses represent the data distributions from Fig. 4. Six loci, like CC, have obsidianswithmultiple compositions. Others, likeDD, have only one. Slight locus-by-locus differences in alpha/A and beta/B compositions suggest that the corresponding obsidian flows might have been somewhat chemically zoned.
7E. Frahm, J.M. Feinberg / Journal of Archaeological Science: Reports xxx (2014) xxx–xxx
cobbles derived from one source and, thus, that reflect a single obsidiantype (e.g., locusHH). Itmust be noted our obsidiandata suggest that thisgeological map is somewhat oversimplified. For example, the BGB rhy-olitic features cannot, as shown, account for the different compositionsand distributions of A/alpha and B/beta obsidians, suggesting greatercomplexity exists.
8. Discussion
Loci with multiple obsidians are consistent with mixing in alluvial–colluvial deposits due to simple downslope processes (e.g., intermittentstream transport, mass wasting, frost heaving, etc.; Fig. 7). That is, theloci with intermingled obsidians are mixtures of cobbles that weatheredout locally and secondarily deposited cobbles that have been transportedsome distance from their emplacement contexts. Ambroz et al. (2001)refer to their sampling loci as “outcrops,” but that term suggests in situ ob-sidian strata within a flow or dome, not secondary deposits. While thereare rare rock outcrops of obsidian at Glass Buttes, the quality of the insitumaterial is often poor, andmany loci in Ambroz et al. (2001) are actu-ally situated on secondary deposits (Fig. 7). Occasionally there aredense accumulations of loose obsidian cobbles that are similar to desertpavements, which we propose are the remnants of a flow's original ob-sidian layer exposed by erosion and deflation. Based on our field obser-vations and source identifications, these features are the most likelylocations to find in situ, or nearly so, obsidians at Glass Buttes. In short,the underlying geology of the complex is one of the controlling factors,when combined with forces such as erosion and deposition, that affects
Please cite this article as: Frahm, E., Feinberg, J.M., Reassessing obsidian fieence: Reports (2014), http://dx.doi.org/10.1016/j.jasrep.2014.11.007
the availability of obsidian near the surface in various locations. Despiterecent (Boschmann, 2012) and older (e.g., Berri, 1982; Roche, 1987) ef-forts to geologically map the Glass Buttes complex, the precise bound-aries of its obsidian-bearing flows and domes remain unidentified,requiring further work to elucidate.
We are at a loss to explain the findings of Ambroz et al. (2001), spe-cifically their seven discrete, geochemically homogenous “zones sur-rounding each geochemical source group” on the landscape (Fig. 1).Their paper includes no mention at all of mixing, secondary deposits,transport mechanisms, or the like. It cannot be that they simply delin-eated their zones based on the major obsidian type present at eachlocus. For example, Ambroz et al. (2001) draw a “Group G” zone aroundlocus O, but this obsidian type (our eta) constitutes, in our sample, only8% of the specimens. In addition, sampling loci N and Q have nearlyidentical ratios of A/alpha and B/beta obsidians: 71%:29% at N and67%:33% at Q (Table 1). If their zones were delineated solely based onthe major obsidian type, loci N and Q would both be ascribed to the“Group A” zone. Ambroz et al. (2001), however, attributed locus N totheir “Group B” zone, whereas locus Q is assigned to their “Group A”zone. Furthermore, at locus HH, we identified a completely different ob-sidian type (i.e., our iota) than that reported by Ambroz et al. (2001).
We can only explain the findings of Ambroz et al. (2001) as a resultof some form of data selectivity. A clue is that Ambroz et al. (2001) re-port collecting about 20–30 specimens per locus (i.e., 540–800 total)and dividing them between the two different laboratories. Their chem-ical groups/zones “E” and “F” consist of 12 specimens for one locus (loci Jand L-A, respectively), whereas their group/zone “G” consists of only
ld relationships at Glass Buttes, Oregon, Journal of Archaeological Sci-

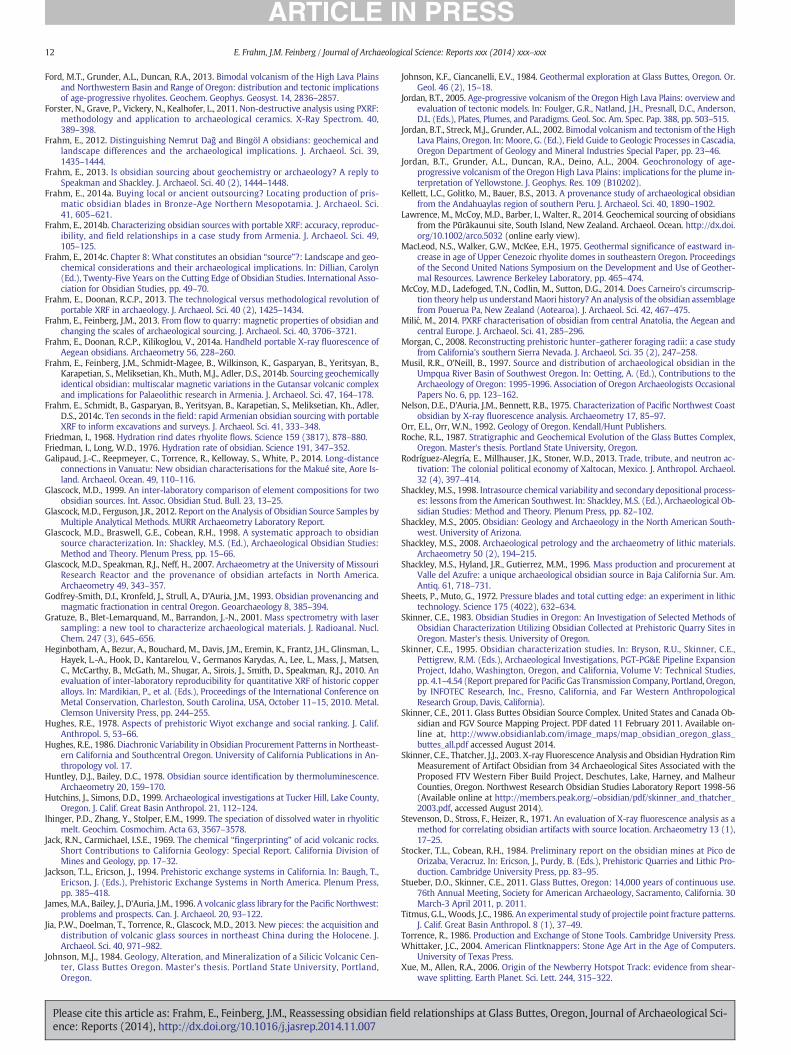
Table 1Numbers and proportions of different obsidians (Latin alphabet = Ambroz et al., 2001; Greek alphabet = this study) at each of sixteen loci sampled for this study. The same data are alsosummarized as pie charts on amap in Fig. 6. The asterisk denotes chemical types thatwe did not expect in our sample set based onAmbroz et al. (2001)'s zones (i.e., we did not sample lociEE, L-A, and L-B). F/zetawas not identified in our sample, but we did not sample locus L-A, so this was expected. We did not anticipate identifying C/gamma-type obsidian because we didnot sample loci EE or L-B. However, three specimens of this obsidian were collected at locus CC, which was expected to be completely A/alpha obsidian. Ambroz et al. (2001) report noequivalents to our five obsidian types termed theta through mu.
Ambroz et al., 2001
A B C* D E F* G – – – – –
This study
Locus alpha beta gamma delta epsilon zeta eta theta iota kappa lambda mu Total
CC 16 (72%) 3 (14%) 3 (14%) 22DD 21 (100%) 21FF 21 (100%) 21FF2 19 (100%) 19GG 20 (100%) 20HH 23 (100%) 23II 20 (83%) 4 (17%) 24J 23 (100%) 23L 20 (100%) 20L2 5 (100%) 5M 17 (77%) 3 (14%) 1 (4.5%) 1 (4.5%) 22N 15 (71%) 6 (29%) 21O 24 (67%) 9 (25%) 3 (8%) 36P 19 (100%) 19Q 14 (67%) 7 (33%) 21U 20 (100%) 20
Total 170 (50%) 61 (18%) 3 (0.9%) 45 (13%) 23 (6.8%) - 3 (0.9%) 4 (1.2%) 23 (6.8%) 3 (0.9%) 1 (0.3%) 1 (0.3%) 337
8 E. Frahm, J.M. Feinberg / Journal of Archaeological Science: Reports xxx (2014) xxx–xxx
five specimens from locus O. It seems likely that specimens of A/alphaand B/beta obsidians were indeed identified at O by Ambroz et al.(2001) (perhaps seven or so specimens if we assume that most lociare represented by about 12) and that these specimenswere discountedwhen they delineated their source zones. They give, however, no indica-tion of obsidian mixing on the ground and “unmixing” of their data set.
Fig. 6. Pie charts illustrate the relative proportions of eleven obsidian chemical types at the loci soriginally sampled by Ambroz et al. (2001) havemixed obsidians and, thus, deviate from theirentirety, of the obsidian foundat locusO. Locus P is the only onewith entirely beta/B obsidian,wthan that proposed byAmbroz et al. (2001). Another notable deviation is that HH (i.e., ι) has entgroup” D in Ambroz et al. (2001) (for interpretation of the references to color in this figure leg
Please cite this article as: Frahm, E., Feinberg, J.M., Reassessing obsidian fieence: Reports (2014), http://dx.doi.org/10.1016/j.jasrep.2014.11.007
We also note that subsequent work by Skinner (e.g., Skinner andThatcher, 2003; Skinner, 2011), conducted at the Northwest ResearchObsidian Studies Laboratory and shared on the lab's website (http://www.obsidianlab.com), supports our finding of pervasive obsidianmixing in the alluvial–colluvial areaswithin and around theGlass Buttescomplex; however, we know of no published comment or correction
ampled for this study. The same data are also summarized in Table 1. Six of the fourteen locireconstructions. For example, our eta and Ambroz et al. (2001)'s G accounts for 8%, not thehichwas also found on the eastern BGB slopes at CC, suggesting a very different distributionirely different obsidian than those found at L and II, the three of which constitute “chemicalend, the reader is referred to the web version of the article).
ld relationships at Glass Buttes, Oregon, Journal of Archaeological Sci-
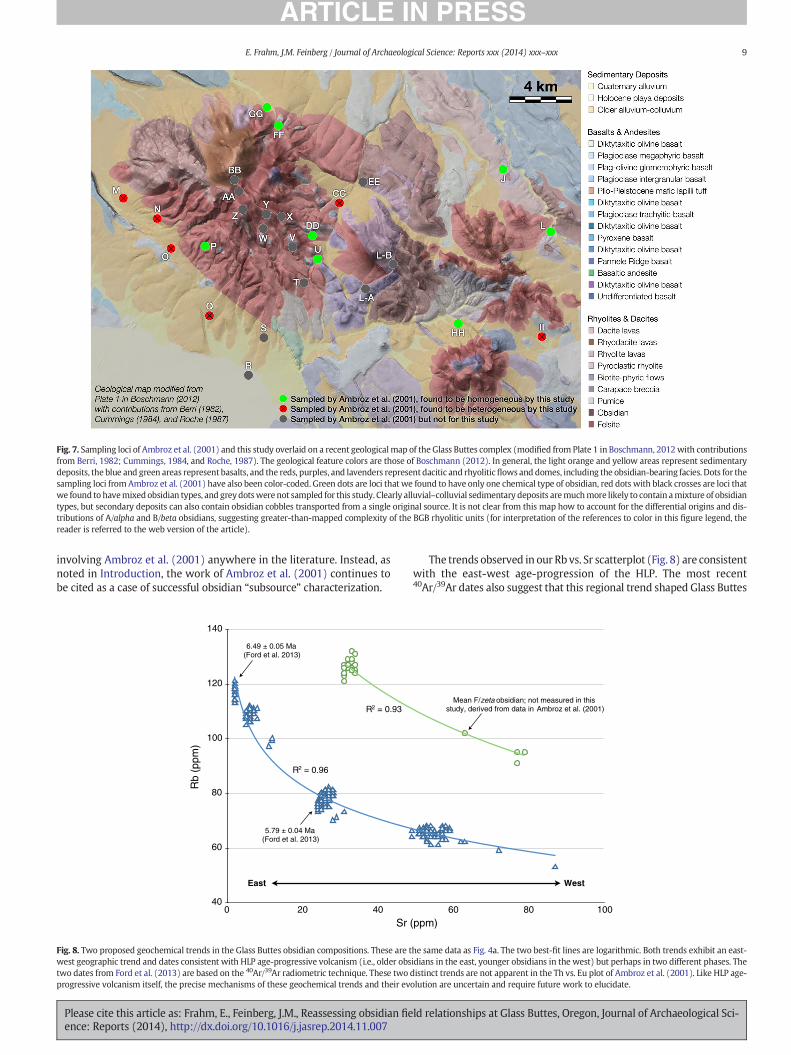
Fig. 7. Sampling loci of Ambroz et al. (2001) and this study overlaid on a recent geological map of the Glass Buttes complex (modified from Plate 1 in Boschmann, 2012with contributionsfrom Berri, 1982; Cummings, 1984, and Roche, 1987). The geological feature colors are those of Boschmann (2012). In general, the light orange and yellow areas represent sedimentarydeposits, the blue and green areas represent basalts, and the reds, purples, and lavenders represent dacitic and rhyoliticflows and domes, including the obsidian-bearing facies. Dots for thesampling loci from Ambroz et al. (2001) have also been color-coded. Green dots are loci that we found to have only one chemical type of obsidian, red dots with black crosses are loci thatwe found to havemixedobsidian types, and greydotswere not sampled for this study. Clearly alluvial–colluvial sedimentary deposits aremuchmore likely to contain amixture of obsidiantypes, but secondary deposits can also contain obsidian cobbles transported from a single original source. It is not clear from this map how to account for the differential origins and dis-tributions of A/alpha and B/beta obsidians, suggesting greater-than-mapped complexity of the BGB rhyolitic units (for interpretation of the references to color in this figure legend, thereader is referred to the web version of the article).
9E. Frahm, J.M. Feinberg / Journal of Archaeological Science: Reports xxx (2014) xxx–xxx
involving Ambroz et al. (2001) anywhere in the literature. Instead, asnoted in Introduction, the work of Ambroz et al. (2001) continues tobe cited as a case of successful obsidian “subsource” characterization.
Rb
(ppm
)
40
60
80
100
120
140
Sr 200 40
R2 = 0.96
R2 = 0.93
East
6.49 ± 0.05 Ma (Ford et al. 2013)
5.79 ± 0.04 Ma(Ford et al. 2013)
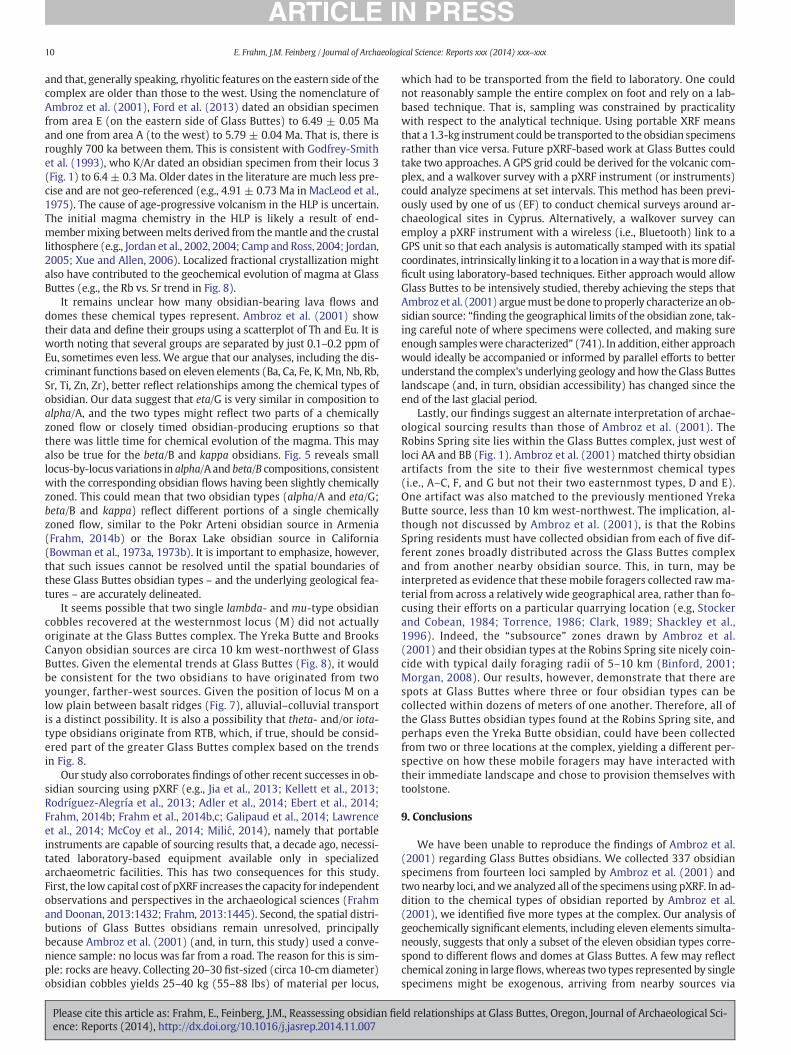
Fig. 8. Two proposed geochemical trends in the Glass Buttes obsidian compositions. These are twest geographic trend and dates consistent with HLP age-progressive volcanism (i.e., older obstwo dates from Ford et al. (2013) are based on the 40Ar/39Ar radiometric technique. These twoprogressive volcanism itself, the precise mechanisms of these geochemical trends and their ev
Please cite this article as: Frahm, E., Feinberg, J.M., Reassessing obsidian fieence: Reports (2014), http://dx.doi.org/10.1016/j.jasrep.2014.11.007
The trends observed in our Rb vs. Sr scatterplot (Fig. 8) are consistentwith the east-west age-progression of the HLP. The most recent40Ar/39Ar dates also suggest that this regional trend shaped Glass Buttes
(ppm)60 80 100
Mean F/zeta obsidian; not measured in this study, derived from data in Ambroz et al. (2001)
West
he same data as Fig. 4a. The two best-fit lines are logarithmic. Both trends exhibit an east-idians in the east, younger obsidians in the west) but perhaps in two different phases. Thedistinct trends are not apparent in the Th vs. Eu plot of Ambroz et al. (2001). Like HLP age-olution are uncertain and require future work to elucidate.
ld relationships at Glass Buttes, Oregon, Journal of Archaeological Sci-
10 E. Frahm, J.M. Feinberg / Journal of Archaeological Science: Reports xxx (2014) xxx–xxx
and that, generally speaking, rhyolitic features on the eastern side of thecomplex are older than those to the west. Using the nomenclature ofAmbroz et al. (2001), Ford et al. (2013) dated an obsidian specimenfrom area E (on the eastern side of Glass Buttes) to 6.49 ± 0.05 Maand one from area A (to the west) to 5.79 ± 0.04 Ma. That is, there isroughly 700 ka between them. This is consistent with Godfrey-Smithet al. (1993), who K/Ar dated an obsidian specimen from their locus 3(Fig. 1) to 6.4 ± 0.3 Ma. Older dates in the literature are much less pre-cise and are not geo-referenced (e.g., 4.91 ± 0.73 Ma in MacLeod et al.,1975). The cause of age-progressive volcanism in the HLP is uncertain.The initial magma chemistry in the HLP is likely a result of end-membermixing betweenmelts derived from themantle and the crustallithosphere (e.g., Jordan et al., 2002, 2004; Camp and Ross, 2004; Jordan,2005; Xue and Allen, 2006). Localized fractional crystallization mightalso have contributed to the geochemical evolution of magma at GlassButtes (e.g., the Rb vs. Sr trend in Fig. 8).
It remains unclear how many obsidian-bearing lava flows anddomes these chemical types represent. Ambroz et al. (2001) showtheir data and define their groups using a scatterplot of Th and Eu. It isworth noting that several groups are separated by just 0.1–0.2 ppm ofEu, sometimes even less. We argue that our analyses, including the dis-criminant functions based on eleven elements (Ba, Ca, Fe, K, Mn, Nb, Rb,Sr, Ti, Zn, Zr), better reflect relationships among the chemical types ofobsidian. Our data suggest that eta/G is very similar in composition toalpha/A, and the two types might reflect two parts of a chemicallyzoned flow or closely timed obsidian-producing eruptions so thatthere was little time for chemical evolution of the magma. This mayalso be true for the beta/B and kappa obsidians. Fig. 5 reveals smalllocus-by-locus variations in alpha/A and beta/B compositions, consistentwith the corresponding obsidian flows having been slightly chemicallyzoned. This could mean that two obsidian types (alpha/A and eta/G;beta/B and kappa) reflect different portions of a single chemicallyzoned flow, similar to the Pokr Arteni obsidian source in Armenia(Frahm, 2014b) or the Borax Lake obsidian source in California(Bowman et al., 1973a, 1973b). It is important to emphasize, however,that such issues cannot be resolved until the spatial boundaries ofthese Glass Buttes obsidian types – and the underlying geological fea-tures – are accurately delineated.
It seems possible that two single lambda- and mu-type obsidiancobbles recovered at the westernmost locus (M) did not actuallyoriginate at the Glass Buttes complex. The Yreka Butte and BrooksCanyon obsidian sources are circa 10 km west-northwest of GlassButtes. Given the elemental trends at Glass Buttes (Fig. 8), it wouldbe consistent for the two obsidians to have originated from twoyounger, farther-west sources. Given the position of locus M on alow plain between basalt ridges (Fig. 7), alluvial–colluvial transportis a distinct possibility. It is also a possibility that theta- and/or iota-type obsidians originate from RTB, which, if true, should be consid-ered part of the greater Glass Buttes complex based on the trendsin Fig. 8.
Our study also corroborates findings of other recent successes in ob-sidian sourcing using pXRF (e.g., Jia et al., 2013; Kellett et al., 2013;Rodríguez-Alegría et al., 2013; Adler et al., 2014; Ebert et al., 2014;Frahm, 2014b; Frahm et al., 2014b,c; Galipaud et al., 2014; Lawrenceet al., 2014; McCoy et al., 2014; Milić, 2014), namely that portableinstruments are capable of sourcing results that, a decade ago, necessi-tated laboratory-based equipment available only in specializedarchaeometric facilities. This has two consequences for this study.First, the low capital cost of pXRF increases the capacity for independentobservations and perspectives in the archaeological sciences (Frahmand Doonan, 2013:1432; Frahm, 2013:1445). Second, the spatial distri-butions of Glass Buttes obsidians remain unresolved, principallybecause Ambroz et al. (2001) (and, in turn, this study) used a conve-nience sample: no locus was far from a road. The reason for this is sim-ple: rocks are heavy. Collecting 20–30 fist-sized (circa 10-cm diameter)obsidian cobbles yields 25–40 kg (55–88 lbs) of material per locus,
Please cite this article as: Frahm, E., Feinberg, J.M., Reassessing obsidian fieence: Reports (2014), http://dx.doi.org/10.1016/j.jasrep.2014.11.007
which had to be transported from the field to laboratory. One couldnot reasonably sample the entire complex on foot and rely on a lab-based technique. That is, sampling was constrained by practicalitywith respect to the analytical technique. Using portable XRF meansthat a 1.3-kg instrument could be transported to the obsidian specimensrather than vice versa. Future pXRF-based work at Glass Buttes couldtake two approaches. A GPS grid could be derived for the volcanic com-plex, and a walkover survey with a pXRF instrument (or instruments)could analyze specimens at set intervals. This method has been previ-ously used by one of us (EF) to conduct chemical surveys around ar-chaeological sites in Cyprus. Alternatively, a walkover survey canemploy a pXRF instrument with a wireless (i.e., Bluetooth) link to aGPS unit so that each analysis is automatically stamped with its spatialcoordinates, intrinsically linking it to a location in away that ismore dif-ficult using laboratory-based techniques. Either approach would allowGlass Buttes to be intensively studied, thereby achieving the steps thatAmbroz et al. (2001) arguemust be done to properly characterize anob-sidian source: “finding the geographical limits of the obsidian zone, tak-ing careful note of where specimens were collected, and making sureenough sampleswere characterized” (741). In addition, either approachwould ideally be accompanied or informed by parallel efforts to betterunderstand the complex's underlying geology and how the Glass Butteslandscape (and, in turn, obsidian accessibility) has changed since theend of the last glacial period.
Lastly, our findings suggest an alternate interpretation of archae-ological sourcing results than those of Ambroz et al. (2001). TheRobins Spring site lies within the Glass Buttes complex, just west ofloci AA and BB (Fig. 1). Ambroz et al. (2001) matched thirty obsidianartifacts from the site to their five westernmost chemical types(i.e., A–C, F, and G but not their two easternmost types, D and E).One artifact was also matched to the previously mentioned YrekaButte source, less than 10 km west-northwest. The implication, al-though not discussed by Ambroz et al. (2001), is that the RobinsSpring residents must have collected obsidian from each of five dif-ferent zones broadly distributed across the Glass Buttes complexand from another nearby obsidian source. This, in turn, may beinterpreted as evidence that these mobile foragers collected rawma-terial from across a relatively wide geographical area, rather than fo-cusing their efforts on a particular quarrying location (e.g, Stockerand Cobean, 1984; Torrence, 1986; Clark, 1989; Shackley et al.,1996). Indeed, the “subsource” zones drawn by Ambroz et al.(2001) and their obsidian types at the Robins Spring site nicely coin-cide with typical daily foraging radii of 5–10 km (Binford, 2001;Morgan, 2008). Our results, however, demonstrate that there arespots at Glass Buttes where three or four obsidian types can becollected within dozens of meters of one another. Therefore, all ofthe Glass Buttes obsidian types found at the Robins Spring site, andperhaps even the Yreka Butte obsidian, could have been collectedfrom two or three locations at the complex, yielding a different per-spective on how these mobile foragers may have interacted withtheir immediate landscape and chose to provision themselves withtoolstone.
9. Conclusions
We have been unable to reproduce the findings of Ambroz et al.(2001) regarding Glass Buttes obsidians. We collected 337 obsidianspecimens from fourteen loci sampled by Ambroz et al. (2001) andtwo nearby loci, andwe analyzed all of the specimens using pXRF. In ad-dition to the chemical types of obsidian reported by Ambroz et al.(2001), we identified five more types at the complex. Our analysis ofgeochemically significant elements, including eleven elements simulta-neously, suggests that only a subset of the eleven obsidian types corre-spond to different flows and domes at Glass Buttes. A few may reflectchemical zoning in largeflows,whereas two types represented by singlespecimens might be exogenous, arriving from nearby sources via
ld relationships at Glass Buttes, Oregon, Journal of Archaeological Sci-

11E. Frahm, J.M. Feinberg / Journal of Archaeological Science: Reports xxx (2014) xxx–xxx
secondary transport processes and found only at Glass Buttes in alluvi-al–colluvial deposits. Two geochemical trends and recent dates suggestthat this complex was produced by processes consistent with HLP age-progressive volcanism but perhaps in two different phases.
Most importantly, we could not replicate the discrete, geochemicallyhomogenous source areas drawn by Ambroz et al. (2001) on the GlassButtes landscape. Six loci (43%) first sampled by Ambroz et al. (2001)havemixed obsidians due to their location on alluvial–colluvial depositsat the base of the buttes, where simple downslope transport processes(e.g., intermittent stream flow) have intermingled obsidians frommultiple origins. Our data reveal a number of important deviationsfrom their “obsidian zone” reconstructions, and therefore, the discrete“subsources” delineated by Ambroz et al. (2001) do not reflect the real-ity of the landscape.
The true spatial distributions of Glass Buttes obsidians have yet to beresolved. This is due to convenience sampling at the complex and someform of data selectivity in Ambroz et al. (2001). Addressing thequestions raised by this study (e.g., the spatial relationships betweenA/alpha and B/beta obsidians, whether A/alpha and G/eta obsidians rep-resent different events or zoned portions of one flow) will require new,critical sampling at Glass Buttes, most likely with an intensity that re-quires field deployment of pXRF. This strategy would allow pXRF to beused in a manner like that in Frahm et al. (2014b), whereby specimencompositions can be determined while in the field and, in turn, can in-form researchers' survey and sampling strategies.
Glass Buttes is more complex and nuanced than the currentmodel proposed by Ambroz et al. (2001). This complex necessitatesextraordinary efforts to characterize the distributions of its archaeo-logically important obsidians. Two decades ago, Glass Buttes wascharacterized by a few dozen obsidian specimens, and it was stillconceptualized as a single source. Many obsidian sources worldwidehave only been characterized using just a handful of specimens,often five or fewer (Shackley, 2005, 2008). Cobean (2012) recentlylikened source characterization studies to the Apollomoonmissions:where researchers visited during the 1960s and 1970s, grabbed a fewrocks, and left, never to return. Glass Buttes is certainly an extremeexample, but the complexity of obsidian sourcesmight bemore com-mon than widely thought. These findings also reinforce the idea pro-posed by Shackley (1998), that research on “the field relationshipsthat can influence the chemical variability that hampers our abilityto confidently assign artifacts to sources has lagged behind… instru-mental advances” (99), which in turn, limits our ability to developrigorously supported behavioral interpretations.
Acknowledgments
Charissa Johnson provided field and laboratory assistance, whichwas supported by the University of Minnesota's Undergraduate Re-search Opportunity Program (UROP) and a Sigma Xi Grant. MichelleMuth also provided research assistance and was supported by the Na-tional Science Foundation's Research Experience for Undergraduates(REU) program (EAR-1062775) and the University of Minnesota'sEarth Sciences Summer Internship program. Additional field assistancewas provided by LeRoy Frahm and Sarah Johnson, and Liev Frahmassisted with the pXRF analyses. The pXRF instrument utilized in thisstudy is part of the research infrastructure of the University ofMinnesota's Wilford Laboratory of North American Archaeology,which is directed by Katherine Hayes. Funding for the instrument wasprovided by the College of Liberal Arts and the Office of the AssociateDean for Research and Graduate Programs. This research was also sup-ported by the Department of Earth Sciences, the Institute for RockMag-netism, and the Department of Anthropology at the University ofMinnesota-Twin Cities. The comments of two anonymous reviewers en-abled us to improve and clarify the article. This is Institute for RockMag-netism contribution #1408.
Please cite this article as: Frahm, E., Feinberg, J.M., Reassessing obsidian fieence: Reports (2014), http://dx.doi.org/10.1016/j.jasrep.2014.11.007
Appendix A. Supplementary data
Supplementary data associated with this article can be found in theonline version, http://dx.doi.org/10.1016/j.jasrep.2014.11.007. Thesedata include Google maps of the most important areas described inthis article.
References
Adler, D.S., Wilkinson, K., Blockley, S., Mark, D., Pinhasi, R., Schmidt-Magee, B.,Nahapetyan, S., Mallol, C., Berna, F., Glauberman, P., Raczynski-Henk, Y., Cullen, V.,Frahm, E., Jöris, O., Macloud, A., Smith, V., Gasparyan, B., 2014. Early Levallois technol-ogy and the transition from the Lower toMiddle Palaeolithic in the Southern Caucasus.Science 345 (6204), 1609–1613.
Ambroz, J.A., Glascock, M.D., Skinner, C.E., 2001. Chemical differentiation of obsidianwith-in the Glass Buttes complex, Oregon. J. Archaeol. Sci. 28, 741–746.
Andrefsy Jr., W., 2006. Experimental and archaeological verification of an index of retouchfor hafted bifaces. Am. Antiq. 71 (4), 743–757.
Bellot-Gurlet, L., Poupeau, G., Salomon, J., Calligaro, T., Moignard, B., Dran, J., Barrat, J.,Pichon, L., 2005. Obsidian provenance studies in archaeology: a comparison betweenPIXE, ICP-AES and ICP-MS. Nucl. Inst. Methods Phys. Res. B 240 (1–2), 583–588.
Bennet, R.B., D'Auria, J.M., 1974. The application of energy dispersive X-ray fluorescencespectroscopy to determining the provenience of obsidian. Int. J. Rad. Isot. 25,361–371.
Berri, A.D., 1982. Geology and Hydrothermal Alteration, Glass Buttes, Southeast Oregon.Master's thesis. Portland State University, Oregon.
Binford, L., 2001. Constructing Frames of Reference: An AnalyticalMethod for Archaeolog-ical Theory Building Using Hunter–Gatherer and Environmental Data Sets. Universityof California Press.
Boschmann, D.E., 2012. Structural and Volcanic Evolution of the Glass Buttes Area, HighLava Plains, Oregon. Master's thesis. Oregon State University.
Bowman, H., Asaro, F., Pearlman, I., 1973a. Composition variations in obsidian sources andthe archaeological implications. Archaeometry 15, 123–127.
Bowman, H., Asaro, F., Pearlman, I., 1973b. On the uniformity of composition in obsidiansand evidence for magmatic mixing. J. Geol. 81 (3), 312–327.
Cadena, G.P., 2012. The Malheur Headwaters, Northeast Oregon. Curr. Archaeol. Happen-ings Oregon 37 (4), 3–6.
Camp, V.E., Ross, M.E., 2004. Mantle dynamics and genesis of mafic magmatism in the in-termontane Pacific Northwest. J. Geophys. Res. 109 (B08204).
Carlson, R.L., 1994. Trade and exchange in prehistoric British Columbia. In: Baugh, T.G.,Ericson, J.E. (Eds.), Prehistoric Exchange Systems in North America. Plenum Press,pp. 307–361.
Cherry, R.L., 1968. A method of locating petrographic sources of obsidian artifacts. North-west Anthropol. Res. Notes 2, 93–98.
Clark, J.E., 1989. Obsidian: the primary sources. In: Gaxiola, G., Clark, J.E. (Eds.),La Obsidiana en Mesoamerica. Instituto Nacional de Antropologia e Historia,pp. 299–319.
Cobean, R., 2012. Discussant for “A World of Obsidian: Sourcing, Dating, and Beyond.Annual Meeting of the Society for American Archaeology, Memphis, 18-22 April.
Cummings, M.L., 1984. Glass domes at Round Top Butte, Glass Buttes silicic complex,south-central Oregon. Proc. Oregon Acad. Sci. 20, 54.
Davis, M.K., Jackson, T.L., Shackley, M.S., Teague, T., Hampel, J.H., 2011. Chapter 3: Factorsaffecting the energy-dispersive X-ray fluorescence (EDXRF) analysis of archaeologicalobsidian. In: Shackley, M.S. (Ed.), X-Ray Fluorescence Spectrometry (XRF) inGeoarchaeology. Springer Press, pp. 45–63.
de B. Pereira, C., Miekeley, N., Poupeau, G., Küchler, I., 2001. Determination of minor andtrace elements in obsidian rock samples and archaeological artifacts by laser ablationinductively coupled plasma mass spectrometry using synthetic obsidian standards.Spectrochim. Acta B At. Spectrosc. 56 (10), 1927–1940.
Dobson, P.F., Epstein, S., Stopler, E.M., 1989. Hydrogen isotope fractionation betweencoexisting vapor and silicate glasses andmelts at low pressure. Geochim. Cosmochim.Acta 53, 2723–2730.
Domanski, M., Webb, J.A., 1992. Effect of heat treatment on siliceous rocks used in prehis-toric lithic technology. J. Archaeol. Sci. 19, 601–614.
Ebert, C.E., Dennison, M., Hirth, K.G., McClure, S.B., Kennett, D.J., 2014. Formative periodobsidian exchange along the Pacific coast of Mesoamerica. Archaeometry http://dx.doi.org/10.1111/arcm.12095 (online early view).
Eren, M.I., Roos, C.I., Story, B.A., von Cramon-Taubadel, N., Lycett, S.J., 2014. The role of rawmaterial differences in stone tool shape variation: an experimental assessment. J.Archaeol. Sci. 49, 472–487.
Ericson, J.E., Glascock, M.D., 2004. Subsource characterization: obsidian utilization ofsubsources of the Coso volcanic field, Coso Junction, California, USA. Geoarchaeology19, 779–805.
Feinberg, J.M., Johnson, C., Frahm, E., 2009. A Database of ObsidianMagnetic Properties forArchaeological Sourcing. Obsidian from Magma to Artifact: Geological and Archaeo-logical Perspectives. Geological Society of America, Portland, Oregon (18-21 October).
Feinberg, J.M., Frahm, E., Muth, M.J., 2013. Magnetic Studies of Archaeological Obsidian:Variability of Eruptive Conditions within Obsidian Flows is Key to High-ResolutionArtifact Sourcing. Magnetic Studies of Igneous Processes. American GeophysicalUnion, Fall Meeting, San Francisco, California, 9-13 December.
Fladmark, K.R., 1982. Microdebitage analysis: initial considerations. J. Archaeol. Sci. 9,205–220.
Flenniken, J.J., 1978. Reevaluation of the Lindenmeier Folsom: a replication experiment inlithic technology. Am. Antiq. 43 (3), 473–480.
ld relationships at Glass Buttes, Oregon, Journal of Archaeological Sci-
12 E. Frahm, J.M. Feinberg / Journal of Archaeological Science: Reports xxx (2014) xxx–xxx
Ford, M.T., Grunder, A.L., Duncan, R.A., 2013. Bimodal volcanism of the High Lava Plainsand Northwestern Basin and Range of Oregon: distribution and tectonic implicationsof age-progressive rhyolites. Geochem. Geophys. Geosyst. 14, 2836–2857.
Forster, N., Grave, P., Vickery, N., Kealhofer, L., 2011. Non-destructive analysis using PXRF:methodology and application to archaeological ceramics. X-Ray Spectrom. 40,389–398.
Frahm, E., 2012. Distinguishing Nemrut Dağ and Bingöl A obsidians: geochemical andlandscape differences and the archaeological implications. J. Archaeol. Sci. 39,1435–1444.
Frahm, E., 2013. Is obsidian sourcing about geochemistry or archaeology? A reply toSpeakman and Shackley. J. Archaeol. Sci. 40 (2), 1444–1448.
Frahm, E., 2014a. Buying local or ancient outsourcing? Locating production of pris-matic obsidian blades in Bronze-Age Northern Mesopotamia. J. Archaeol. Sci.41, 605–621.
Frahm, E., 2014b. Characterizing obsidian sources with portable XRF: accuracy, reproduc-ibility, and field relationships in a case study from Armenia. J. Archaeol. Sci. 49,105–125.
Frahm, E., 2014c. Chapter 8: What constitutes an obsidian “source”?: Landscape and geo-chemical considerations and their archaeological implications. In: Dillian, Carolyn(Ed.), Twenty-Five Years on the Cutting Edge of Obsidian Studies. International Asso-ciation for Obsidian Studies, pp. 49–70.
Frahm, E., Doonan, R.C.P., 2013. The technological versus methodological revolution ofportable XRF in archaeology. J. Archaeol. Sci. 40 (2), 1425–1434.
Frahm, E., Feinberg, J.M., 2013. From flow to quarry: magnetic properties of obsidian andchanging the scales of archaeological sourcing. J. Archaeol. Sci. 40, 3706–3721.
Frahm, E., Doonan, R.C.P., Kilikoglou, V., 2014a. Handheld portable X-ray fluorescence ofAegean obsidians. Archaeometry 56, 228–260.
Frahm, E., Feinberg, J.M., Schmidt-Magee, B., Wilkinson, K., Gasparyan, B., Yeritsyan, B.,Karapetian, S., Meliksetian, Kh., Muth, M.J., Adler, D.S., 2014b. Sourcing geochemicallyidentical obsidian: multiscalar magnetic variations in the Gutansar volcanic complexand implications for Palaeolithic research in Armenia. J. Archaeol. Sci. 47, 164–178.
Frahm, E., Schmidt, B., Gasparyan, B., Yeritsyan, B., Karapetian, S., Meliksetian, Kh., Adler,D.S., 2014c. Ten seconds in the field: rapid Armenian obsidian sourcing with portableXRF to inform excavations and surveys. J. Archaeol. Sci. 41, 333–348.
Friedman, I., 1968. Hydration rind dates rhyolite flows. Science 159 (3817), 878–880.Friedman, I., Long, W.D., 1976. Hydration rate of obsidian. Science 191, 347–352.Galipaud, J.-C., Reepmeyer, C., Torrence, R., Kelloway, S., White, P., 2014. Long-distance
connections in Vanuatu: New obsidian characterisations for the Makué site, Aore Is-land. Archaeol. Ocean. 49, 110–116.
Glascock, M.D., 1999. An inter-laboratory comparison of element compositions for twoobsidian sources. Int. Assoc. Obsidian Stud. Bull. 23, 13–25.
Glascock, M.D., Ferguson, J.R., 2012. Report on the Analysis of Obsidian Source Samples byMultiple Analytical Methods. MURR Archaeometry Laboratory Report.
Glascock, M.D., Braswell, G.E., Cobean, R.H., 1998. A systematic approach to obsidiansource characterization. In: Shackley, M.S. (Ed.), Archaeological Obsidian Studies:Method and Theory. Plenum Press, pp. 15–66.
Glascock, M.D., Speakman, R.J., Neff, H., 2007. Archaeometry at the University of MissouriResearch Reactor and the provenance of obsidian artefacts in North America.Archaeometry 49, 343–357.
Godfrey-Smith, D.I., Kronfeld, J., Strull, A., D'Auria, J.M., 1993. Obsidian provenancing andmagmatic fractionation in central Oregon. Geoarchaeology 8, 385–394.
Gratuze, B., Blet-Lemarquand, M., Barrandon, J.-N., 2001. Mass spectrometry with lasersampling: a new tool to characterize archaeological materials. J. Radioanal. Nucl.Chem. 247 (3), 645–656.
Heginbotham, A., Bezur, A., Bouchard, M., Davis, J.M., Eremin, K., Frantz, J.H., Glinsman, L.,Hayek, L.-A., Hook, D., Kantarelou, V., Germanos Karydas, A., Lee, L., Mass, J., Matsen,C., McCarthy, B., McGath, M., Shugar, A., Sirois, J., Smith, D., Speakman, R.J., 2010. Anevaluation of inter-laboratory reproducibility for quantitative XRF of historic copperalloys. In: Mardikian, P., et al. (Eds.), Proceedings of the International Conference onMetal Conservation, Charleston, South Carolina, USA, October 11–15, 2010. Metal.Clemson University Press, pp. 244–255.
Hughes, R.E., 1978. Aspects of prehistoric Wiyot exchange and social ranking. J. Calif.Anthropol. 5, 53–66.
Hughes, R.E., 1986. Diachronic Variability in Obsidian Procurement Patterns in Northeast-ern California and Southcentral Oregon. University of California Publications in An-thropology vol. 17.
Huntley, D.J., Bailey, D.C., 1978. Obsidian source identification by thermoluminescence.Archaeometry 20, 159–170.
Hutchins, J., Simons, D.D., 1999. Archaeological investigations at Tucker Hill, Lake County,Oregon. J. Calif. Great Basin Anthropol. 21, 112–124.
Ihinger, P.D., Zhang, Y., Stolper, E.M., 1999. The speciation of dissolved water in rhyoliticmelt. Geochim. Cosmochim. Acta 63, 3567–3578.
Jack, R.N., Carmichael, I.S.E., 1969. The chemical “fingerprinting” of acid volcanic rocks.Short Contributions to California Geology: Special Report. California Division ofMines and Geology, pp. 17–32.
Jackson, T.L., Ericson, J., 1994. Prehistoric exchange systems in California. In: Baugh, T.,Ericson, J. (Eds.), Prehistoric Exchange Systems in North America. Plenum Press,pp. 385–418.
James, M.A., Bailey, J., D'Auria, J.M., 1996. A volcanic glass library for the Pacific Northwest:problems and prospects. Can. J. Archaeol. 20, 93–122.
Jia, P.W., Doelman, T., Torrence, R., Glascock, M.D., 2013. New pieces: the acquisition anddistribution of volcanic glass sources in northeast China during the Holocene. J.Archaeol. Sci. 40, 971–982.
Johnson, M.J., 1984. Geology, Alteration, and Mineralization of a Silicic Volcanic Cen-ter, Glass Buttes Oregon. Master's thesis. Portland State University, Portland,Oregon.
Please cite this article as: Frahm, E., Feinberg, J.M., Reassessing obsidian fieence: Reports (2014), http://dx.doi.org/10.1016/j.jasrep.2014.11.007
Johnson, K.F., Ciancanelli, E.V., 1984. Geothermal exploration at Glass Buttes, Oregon. Or.Geol. 46 (2), 15–18.
Jordan, B.T., 2005. Age-progressive volcanism of the Oregon High Lava Plains: overview andevaluation of tectonic models. In: Foulger, G.R., Natland, J.H., Presnall, D.C., Anderson,D.L. (Eds.), Plates, Plumes, and Paradigms. Geol. Soc. Am. Spec. Pap. 388, pp. 503–515.
Jordan, B.T., Streck, M.J., Grunder, A.L., 2002. Bimodal volcanism and tectonism of the HighLava Plains, Oregon. In: Moore, G. (Ed.), Field Guide to Geologic Processes in Cascadia,Oregon Department of Geology and Mineral Industries Special Paper, pp. 23–46.
Jordan, B.T., Grunder, A.L., Duncan, R.A., Deino, A.L., 2004. Geochronology of age-progressive volcanism of the Oregon High Lava Plains: implications for the plume in-terpretation of Yellowstone. J. Geophys. Res. 109 (B10202).
Kellett, L.C., Golitko, M., Bauer, B.S., 2013. A provenance study of archaeological obsidianfrom the Andahuaylas region of southern Peru. J. Archaeol. Sci. 40, 1890–1902.
Lawrence, M., McCoy, M.D., Barber, I., Walter, R., 2014. Geochemical sourcing of obsidiansfrom the Pūrākaunui site, South Island, New Zealand. Archaeol. Ocean. http://dx.doi.org/10.1002/arco.5032 (online early view).
MacLeod, N.S., Walker, G.W., McKee, E.H., 1975. Geothermal significance of eastward in-crease in age of Upper Cenezoic rhyolite domes in southeastern Oregon. Proceedingsof the Second United Nations Symposium on the Development and Use of Geother-mal Resources. Lawrence Berkeley Laboratory, pp. 465–474.
McCoy, M.D., Ladefoged, T.N., Codlin, M., Sutton, D.G., 2014. Does Carneiro's circumscrip-tion theory help us understandMaori history? An analysis of the obsidian assemblagefrom Pouerua Pa, New Zealand (Aotearoa). J. Archaeol. Sci. 42, 467–475.
Milić, M., 2014. PXRF characterisation of obsidian from central Anatolia, the Aegean andcentral Europe. J. Archaeol. Sci. 41, 285–296.
Morgan, C., 2008. Reconstructing prehistoric hunter–gatherer foraging radii: a case studyfrom California's southern Sierra Nevada. J. Archaeol. Sci. 35 (2), 247–258.
Musil, R.R., O'Neill, B., 1997. Source and distribution of archaeological obsidian in theUmpqua River Basin of Southwest Oregon. In: Oetting, A. (Ed.), Contributions to theArchaeology of Oregon: 1995-1996. Association of Oregon Archaeologists OccasionalPapers No. 6, pp. 123–162.
Nelson, D.E., D'Auria, J.M., Bennett, R.B., 1975. Characterization of Pacific Northwest Coastobsidian by X-ray fluorescence analysis. Archaeometry 17, 85–97.
Orr, E.L., Orr, W.N., 1992. Geology of Oregon. Kendall/Hunt Publishers.Roche, R.L., 1987. Stratigraphic and Geochemical Evolution of the Glass Buttes Complex,
Oregon. Master's thesis. Portland State University, Oregon.Rodríguez-Alegría, E., Millhauser, J.K., Stoner, W.D., 2013. Trade, tribute, and neutron ac-
tivation: The colonial political economy of Xaltocan, Mexico. J. Anthropol. Archaeol.32 (4), 397–414.
Shackley,M.S., 1998. Intrasource chemical variability and secondary depositional process-es: lessons from the American Southwest. In: Shackley, M.S. (Ed.), Archaeological Ob-sidian Studies: Method and Theory. Plenum Press, pp. 82–102.
Shackley, M.S., 2005. Obsidian: Geology and Archaeology in the North American South-west. University of Arizona.
Shackley, M.S., 2008. Archaeological petrology and the archaeometry of lithic materials.Archaeometry 50 (2), 194–215.
Shackley, M.S., Hyland, J.R., Gutierrez, M.M., 1996. Mass production and procurement atValle del Azufre: a unique archaeological obsidian source in Baja California Sur. Am.Antiq. 61, 718–731.
Sheets, P., Muto, G., 1972. Pressure blades and total cutting edge: an experiment in lithictechnology. Science 175 (4022), 632–634.
Skinner, C.E., 1983. Obsidian Studies in Oregon: An Investigation of Selected Methods ofObsidian Characterization Utilizing Obsidian Collected at Prehistoric Quarry Sites inOregon. Master's thesis. University of Oregon.
Skinner, C.E., 1995. Obsidian characterization studies. In: Bryson, R.U., Skinner, C.E.,Pettigrew, R.M. (Eds.), Archaeological Investigations, PGT-PG&E Pipeline ExpansionProject, Idaho, Washington, Oregon, and California, Volume V: Technical Studies,pp. 4.1–4.54 (Report prepared for Pacific Gas Transmission Company, Portland, Oregon,by INFOTEC Research, Inc., Fresno, California, and Far Western AnthropologicalResearch Group, Davis, California).
Skinner, C.E., 2011. Glass Buttes Obsidian Source Complex. United States and Canada Ob-sidian and FGV Source Mapping Project. PDF dated 11 February 2011. Available on-line at, http://www.obsidianlab.com/image_maps/map_obsidian_oregon_glass_buttes_all.pdf accessed August 2014.
Skinner, C.E., Thatcher, J.J., 2003. X-ray Fluorescence Analysis and Obsidian Hydration RimMeasurement of Artifact Obsidian from 34 Archaeological Sites Associated with theProposed FTV Western Fiber Build Project, Deschutes, Lake, Harney, and MalheurCounties, Oregon. Northwest Research Obsidian Studies Laboratory Report 1998-56(Available online at http://members.peak.org/~obsidian/pdf/skinner_and_thatcher_2003.pdf, accessed August 2014).
Stevenson, D., Stross, F., Heizer, R., 1971. An evaluation of X-ray fluorescence analysis as amethod for correlating obsidian artifacts with source location. Archaeometry 13 (1),17–25.
Stocker, T.L., Cobean, R.H., 1984. Preliminary report on the obsidian mines at Pico deOrizaba, Veracruz. In: Ericson, J., Purdy, B. (Eds.), Prehistoric Quarries and Lithic Pro-duction. Cambridge University Press, pp. 83–95.
Stueber, D.O., Skinner, C.E., 2011. Glass Buttes, Oregon: 14,000 years of continuous use.76th Annual Meeting, Society for American Archaeology, Sacramento, California. 30March-3 April 2011, p. 2011.
Titmus, G.L.,Woods, J.C., 1986. An experimental study of projectile point fracture patterns.J. Calif. Great Basin Anthropol. 8 (1), 37–49.
Torrence, R., 1986. Production and Exchange of Stone Tools. Cambridge University Press.Whittaker, J.C., 2004. American Flintknappers: Stone Age Art in the Age of Computers.
University of Texas Press.Xue, M., Allen, R.A., 2006. Origin of the Newberry Hotspot Track: evidence from shear-
wave splitting. Earth Planet. Sci. Lett. 244, 315–322.
ld relationships at Glass Buttes, Oregon, Journal of Archaeological Sci-

Supplementary Table SI - Glass Buttes obsidian data (only best-measured elements) by locus
Specimen Ambroz New Analyses So (ppm) Zr(ppm) Sr(ppm) Rb (ppm) Fe (ppm) Ca (ppm)
cc02 A alpha 3 1085 72 24 75 5165 3878
cc 03 A alpha 3 1148 71 25 77 5279 4009
cc05 A alpha 3 1119 71 25 77 5340 3981
cc 06 A alpha 3 1139 75 26 78 5367 3945
cc 07 A alpha 3 1105 72 26 78 5326 3894
cc 08 A alpha 3 1107 72 27 75 5322 4055
cc 10 A alpha 3 1152 75 26 78 5630 4160
cc 11 A alpha 2 1148 74 26 78 5543 4157
cc 13 A alpha 3 1179 77 27 77 5512 4101
cc 14 A alpha 3 1080 69 24 73 5226 3975
cc 16 A alpha 3 1115 74 25 79 5541 4085
cc 17 A alpha 3 1121 69 25 76 5349 3957
cc 18 A alpha 3 1152 75 26 79 5441 4090
ccl9 A alpha 3 1099 71 24 76 5407 4047
cc21 A alpha 3 1144 73 26 78 5484 4095
cc 22 A alpha 3 1102 74 26 77 5311 3964
ccOl B beta 2 1230 97 56 61 5901 4747
cc 12 B beta 3 1331 102 58 63 6277 5034
cc 15 B beta 3 1336 102 56 65 6265 5086
cc04 C gamma 3 1273 85 77 91 5821 5792
cc09 C gamma 3 1276 86 79 95 6093 6020
cc 20 C gamma 3 1246 85 77 95 5905 5823
Specimen Ambroz New Analyses Ba (ppm) Zr(ppm) Sr (ppm) Rb (ppm) Fe (ppm) Co (ppm)
dd 01 A alpha 6 1131 73 26 79 5312 3846
dd 02 A alpha 3 1169 76 25 78 5311 3962
dd 03 A alpha 5 1145 73 26 78 5291 3928
dd 04 A alpha 5 1134 73 26 77 5202 3803
dd 05 A alpha 3 1104 72 25 77 5264 3782
dd 06 A alpha 3 1094 71 24 77 5237 3810
dd 07 A alpha 4 1124 72 24 76 5222 3843
dd 08 A alpha 3 1110 71 25 77 5234 3738
dd 09 A alpha 6 1154 75 26 78 5323 3875
ddlO A alpha 4 1131 72 25 77 5445 3852
dd 11 A alpha 3 1100 71 25 74 5339 3928
dd 12 A alpha 4 1129 77 25 78 5324 3847
dd 13 A alpha 3 1112 72 27 78 5213 3866
dd 14 A alpha 3 1121 73 24 75 5157 3774
dd 15 A alpha 6 1122 77 25 78 5332 3908
dd 16 A alpha 6 1147 74 26 76 5264 3900

dd 17 A alpha 4 1174 74 25 79 5308 3917
dd 18 A alpha 2 1139 78 27 79 5318 3974
dd 19 A alpha 3 1151 74 25 77 5306 3943
dd 20 A alpha 3 1127 73 25 76 5203 3816
dd 21 A alpha 3 1138 75 25 80 5302 3906
Specimen Ambroz New Analyses Ba (ppm) Zr (ppm) Sr (ppm) Rb (ppm) Fe(ppm) Ca(ppm)
ffOl A alpha 3 1163 73 26 78 5277 3973
ff02 A alpha 3 1135 73 25 77 5287 3916
ff03 A alpha 3 1146 71 25 77 5149 3733
ff04 A alpha 3 1133 74 26 79 5357 3982
ff05 A alpha 3 1178 72 25 77 5185 3871
ff06 A alpha 3 1137 78 27 78 5273 3989
ff07 A alpha 3 1098 76 27 77 5304 4050
ffOS A alpha 4 1111 75 28 79 5516 4109
ff09 A alpha 3 1104 76 28 81 5557 4097
fflO A alpha 3 1147 76 28 81 5556 4134
ff 11 A alpha 3 1140 78 28 80 5492 4148
ffl2 A alpha 3 1109 76 27 81 5646 4224
ffl3 A alpha 4 1181 75 27 81 5391 4074
ffl4 A alpha 3 1152 IS 28 80 5410 4132
ff 15 A alpha 3 1143 75 28 79 5481 4089
ffl6 A alpha 4 1133 75 26 78 5326 3937
ffl7 A alpha 3 1122 73 25 77 5254 3877
fflS A alpha 3 1152 77 25 77 5263 3929
ffl9 A alpha 3 1122 72 25 76 5256 3792
ff20 A alpha 4 1107 72 25 78 5338 3927
ff21 A alpha 3 1131 78 26 81 5501 4115
Specimen Ambroz New Analyses Ba (ppm) Zr(ppm) /?b (ppm) fe (ppm) Co (ppm)
ff2 01 A alpha 3 1158 74 26 79 5523 3974
ff2 02 A alpha 3 1138 76 26 79 5674 4017
ff2 03 A alpha 3 1139 72 26 77 5349 3842
ff2 04 A alpha 3 1144 75 26 76 5471 3887
ff2 05a A alpha 3 1148 78 27 80 5574 4027
ff2 05b A alpha 3 1108 73 26 77 5363 3856
ff2 06 A alpha 3 1125 71 25 77 5329 3867
ff2 07 A alpha 3 1176 76 26 80 5421 4074
ff2 08 A alpha 3 1152 75 26 77 5426 3964
ff2 09a A alpha 3 1174 73 25 79 5402 3963
ff2 09b A alpha 3 1166 76 25 79 5555 4013
ff210 A alpha 3 1166 78 26 IS 5404 3940
ff211 A alpha 4 1159 76 26 80 5453 3993
ff2 12 A alpha 2 1125 72 25 80 5425 3925
ff213 A alpha 4 1116 73 26 79 5310 3953
ff2 14a A alpha 3 1170 71 26 78 5445 3983
ff214b A alpha 4 1130 79 27 81 5508 4041
ff214c A alpha 3 1179 74 26 80 5412 4043
ff215 A alpha 3 1170 76 26 79 5452 3881
Specimen Ambroz New1
Analyses Ba (ppm) Zr(ppm) Sr (ppm) Rb (ppm) Fe(ppm) Ca(ppm)
ggOl A alpha 3 1176 75 25 78 5381 4033
gg 02 A alpha 3 1134 74 25 77 5265 3977
gg03 A alpha 3 1163 76 26 79 5244 3858
gg04 A alpha 3 1147 73 25 78 5305 3938
gg05 A alpha 3 1103 71 25 77 5296 3894
gg06 A alpha 3 1171 81 25 80 5298 3906
gg07 A alpha 5 1135 75 26 79 5347 3988
gg08 A alpha 3 1134 76 24 76 5138 3770
gg 09 A alpha 3 1163 78 26 79 5391 4005
gg 10 A alpha 4 1129 76 25 78 5300 3855
ggll A alpha 3 1109 73 25 76 5199 3783
ggl2 A alpha 4 1174 76 25 80 5432 4012
gg 13 A alpha 3 1161 74 26 79 5305 3908
gg 14 A alpha 3 1142 75 26 81 5346 3981
ggl5 A alpha 3 1194 77 25 80 5389 3993
ggl6 A alpha 3 1176 74 27 79 5347 3986
ggl7 A alpha 3 1132 72 25 77 5149 3856
ggl8 A alpha 3 1170 76 25 79 5353 4015
ggl9 A alpha 3 1141 73 26 77 5314 3906
gg20 A alpha 2 1130 76 27 79 5395 3987
Specimen Ambroz New Analyses Ba (ppm) Zr(ppm) Sr(ppm) Rb (ppm) Fe (ppm) Co (ppm)
hhOl - iota 3 361 53 31 127 4470 5052
hh02 - iota 3 350 52 33 126 4498 5041
hh 03 - iota 3 331 55 32 127 4501 5000
hh04 - iota 3 354 52 31 123 4438 4984
hh05 - iota 3 368 54 32 129 4600 5146
hh06 - iota 3 365 55 31 124 4436 5063
hh 07 - iota 3 358 54 33 128 4614 5217
hh08 - iota 3 361 54 33 125 4474 5085
hh09 - iota 4 368 52 31 126 4527 4995
hh 10 - iota 3 370 56 33 132 4700 5225
hh 11 - iota 2 365 53 32 126 4511 4999
hh 12 - iota 3 357 54 34 125 4591 5152
hh 13 - iota 3 378 55 34 127 4657 5321

hh 14 - iota 3 358 54 34 124 4584 5194
hh 15 - iota 4 374 56 34 131 4721 5402
hh 16 - iota 3 375 54 33 129 4682 5365
hh 17 - iota 3 357 52 32 126 4491 5191
hh 18 - iota 3 354 51 31 121 4340 5082
hh 19 - iota 4 353 52 31 126 4532 5115
hh 20 - iota 3 361 52 31 124 4451 5046
hh21 - iota 3 368 53 33 125 4528 5098
hh 22 - iota 4 356 53 32 127 4524 5034
hh 23 - iota 2 368 55 33 125 4526 5014
Specimen Ambroz New Analyses Ba (ppm) Zr (ppm) Sr (ppm) Rb (ppm) Fe(ppm) Ca(ppm)
iiOB - theta 2 661 73 11 97 4714 3611
iiOS - theta 3 645 75 12 99 4761 3671
ii 13 - theta 2 653 77 12 99 4783 3872
ii 24 - theta 3 664 76 12 100 4809 3870
iiOl D delta 3 232 64 5 108 4624 3433
ii 02 D delta 3 298 66 6 109 4667 3485
ii04 D delta 4 253 66 6 109 4645 3497
ii 06 D delta 3 245 64 5 107 4553 3427
ii 07 D delta 3 268 68 7 109 4662 3632
iiOS D delta 5 247 66 6 106 4601 3597
ii09 D delta 3 290 68 7 111 4714 3793
ii 10 D delta 4 263 65 8 107 4630 3791
ii 11 D delta 3 279 67 8 111 4900 4112
ii 12 D delta 4 279 66 6 108 4731 3776
ii 14 D delta 2 235 67 6 109 4693 3632
ii 15 D delta 4 274 66 6 107 4647 3627
ii 16 D delta 2 314 66 6 106 4686 3597
ii 17 D delta 3 260 67 7 110 4622 3626
ii 18 D delta 4 253 66 6 110 4744 3671
ii 19 D delta 3 243 68 6 108 4798 3734
ii 20 D delta 3 237 64 5 105 4616 3654
ii 21 D delta 4 253 66 6 109 4704 3677
ii 22 D delta 3 288 67 6 108 4705 3653
ii 23 D delta 4 302 66 6 106 4626 3628
Specimen Ambroz New Analyses Ba (ppm) Zr(ppm) Sr (ppm) Rb (ppm) Fe(ppm) Ca (ppm)
jOl E epsilon 3 59 62 2 120 4843 3624
j02 E epsilon 3 32 63 2 117 4709 3501
j03 E epsilon 3 24 60 2 114 4631 3400
j04 E epsilon 4 51 64 2 117 4681 3446
j05 E epsilon 5 51 63 2 118 4765 3487
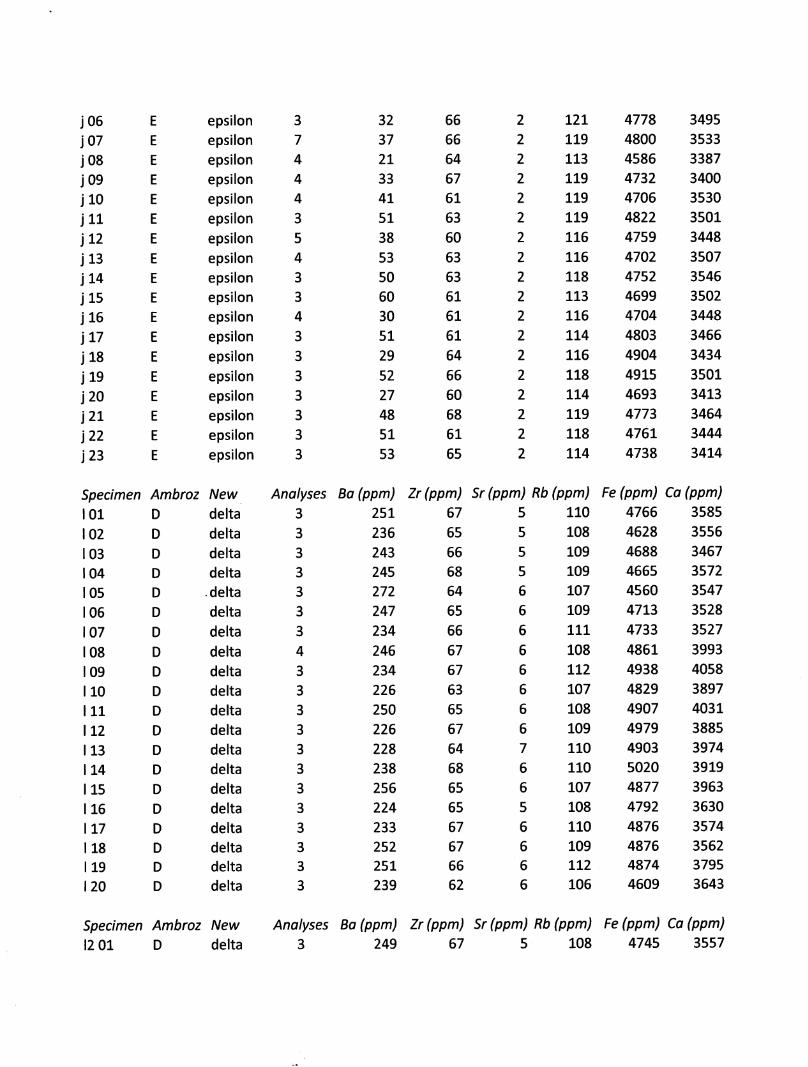
j06 E epsilon 3 32 66 2 121 4778 3495
j07 E epsilon 7 37 66 2 119 4800 3533
j08 E epsilon 4 21 64 2 113 4586 3387
j09 E epsilon 4 33 67 2 119 4732 3400
j 10 E epsilon 4 41 61 2 119 4706 3530
j 11 E epsilon 3 51 63 2 119 4822 3501
j 12 E epsilon 5 38 60 2 116 4759 3448
j 13 E epsilon 4 53 63 2 116 4702 3507
j 14 E epsilon 3 50 63 2 118 4752 3546
jl5 E epsilon 3 60 61 2 113 4699 3502
jl6 E epsilon 4 30 61 2 116 4704 3448
jl7 E epsilon 3 51 61 2 114 4803 3466
jl8 E epsilon 3 29 64 2 116 4904 3434
j 19 E epsilon 3 52 66 2 118 4915 3501
j20 E epsilon 3 27 60 2 114 4693 3413
j21 E epsilon 3 48 68 2 119 4773 3464
j22 E epsilon 3 51 61 2 118 4761 3444
j23 E epsilon 3 53 65 2 114 4738 3414
Specimen Ambroz New Analyses Ba (ppm) Zr(ppm) Sr (ppm) Rb (ppm) Fe(ppm) Ca(ppm)
101 D delta 3 251 67 5 110 4766 3585
102 D delta 3 236 65 5 108 4628 3556
103 D delta 3 243 66 5 109 4688 3467
104 D delta 3 245 68 5 109 4665 3572
105 D . delta 3 272 64 6 107 4560 3547
106 D delta 3 247 65 6 109 4713 3528
107 D delta 3 234 66 6 111 4733 3527
108 D delta 4 246 67 6 108 4861 3993
109 D delta 3 234 67 6 112 4938 4058
110 D delta 3 226 63 6 107 4829 3897
111 D delta 3 250 65 6 108 4907 4031
112 D delta 3 226 67 6 109 4979 3885
113 D delta 3 228 64 7 110 4903 3974
114 D delta 3 238 68 6 110 5020 3919
115 D delta 3 256 65 6 107 4877 3963
116 D delta 3 224 65 5 108 4792 3630
117 D delta 3 233 67 6 110 4876 3574
118 D delta 3 252 67 6 109 4876 3562
119 D delta 3 251 66 6 112 4874 3795
120 D delta 3 239 62 6 106 4609 3643
Specimen Ambroz New Analyses Ba (ppm) Zr(ppm) Sr (ppm) Rb (ppm) Fe(ppm) Ca (ppm)
12 01 D delta 3 249 67 5 108 4745 3557

12 02 D delta 3 242 66 6 112 4810 3653
12 03 D delta 3 273 68 6 111 4746 3580
12 04 D delta 3 235 67 5 110 4624 3491
12 05 D delta 2 231 66 5 110 4721 3432
Specimen Ambroz New Analyses Ba (ppm) Zr(ppm} Sr (ppm) Rb (ppm) Fe(ppm) Ca(ppm)
m 03 - kappa 6 1279 113 62 62 6371 5419
m 18 - kappa 7 1256 111 62 62 6351 5359
m 19 - kappa 7 1248 112 63 62 6355 5440
m06-l - lambda 3 1168 123 72 59 6396 5929
m06-2 - lambda 4 1196 117 74 61 6422 5976
m 16-1 - mu 4 1123 140 87 53 7109 6607
m 16-2 - mu 5 1093 148 90 56 7194 6684
mOl B beta 3 1309 109 57 66 6083 4941
m02 B beta 3 1317 102 54 66 5985 4818
m 04 B beta 2 1234 96 54 61 5735 4626
m 05 B beta 3 1300 97 53 63 5806 4732
m07 B beta 3 1234 96 53 63 5756 4684
mOS B beta 2 1342 100 58 67 6145 4994
m 09 B beta 2 1241 98 57 64 5929 4798
mlO B beta 3 1237 101 55 65 6052 4695
mil B beta 2 1336 101 57 66 6102 5045
m 12 B beta 2 1219 101 55 66 6146 4907
ml3 B beta 2 1302 100 56 65 7616 4912
m 14 B beta 2 1344 105 56 64 6122 4994
m 15 B beta 3 1267 97 54 64 5898 4895
m 17 B beta 2 1309 106 56 64 5771 4861
m20 B beta 2 1271 99 55 66 5941 4690
m21 B beta 2 1303 92 53 62 5779 4891
m22 B beta 2 1255 100 54 66 5959 4874
Specimen Ambroz New Analyses Ba (ppm) Zr(ppm) Sr(ppm) Rb (ppm) Fe (ppm) Co (ppm)
nOl A alpha 3 1125 72 < 25 11 5237 3803
n02 A alpha 2 1077 73 25 78 5296 3861
n03 A alpha 3 1092 71 24 74 5179 3744
n04 A alpha 3 1139 74 26 77 5255 3856
n05 A alpha 4 1114 76 26 77 5283 3780
n07 A alpha 3 1078 75 26 IB 5476 3851
nOS A alpha 3 1168 74 25 IB 5283 3819
n09 A alpha 2 1145 73 25 78 5370 3943
n 10 A alpha 2 1096 72 25 77 5269 3696
n 12 A alpha 3 1172 76 26 77 5235 3775
nl4 A alpha 3 1094 76 26 IB 5319 3899
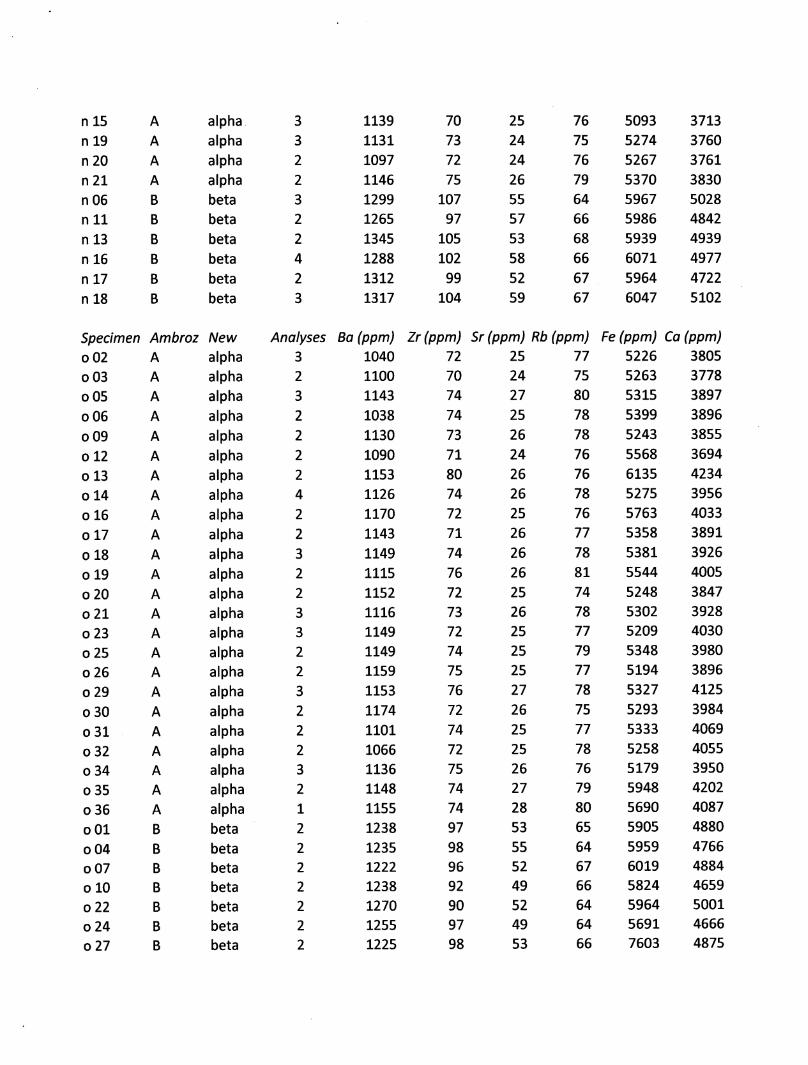
n 15 A alpha 3 1139 70 25 76 5093 3713
nl9 A alpha 3 1131 73 24 75 5274 3760
n20 A alpha 2 1097 72 24 76 5267 3761
n21 A alpha 2 1146 75 26 79 5370 3830
n06 B beta 3 1299 107 55 64 5967 5028
nil B beta 2 1265 97 57 66 5986 4842
nl3 B beta 2 1345 105 53 68 5939 4939
n 16 B beta 4 1288 102 58 66 6071 4977
nl7 B beta 2 1312 99 52 67 5964 4722
n 18 B beta 3 1317 104 59 67 6047 5102
Specimen Ambroz New Analyses Ba (ppm) Zr(ppm) Sr (ppm) Rb (ppm) Fe (ppm) Co (ppm)
o02 A alpha 3 1040 72 25 77 5226 3805
o03 A alpha 2 1100 70 24 75 5263 3778
oOS A alpha 3 1143 74 27 80 5315 3897
o06 A alpha 2 1038 74 25 78 5399 3896
o09 A alpha 2 1130 73 26 78 5243 3855
0 12 A alpha 2 1090 71 24 76 5568 3694
ol3 A alpha 2 1153 80 26 76 6135 4234
ol4 A alpha 4 1126 74 26 78 5275 3956
ol6 A alpha 2 1170 72 25 76 5763 4033
0 17 A alpha 2 1143 71 26 77 5358 3891
olS A alpha 3 1149 74 26 78 5381 3926
ol9 A alpha 2 1115 76 26 81 5544 4005
o20 A alpha 2 1152 72 25 74 5248 3847
o21 A alpha 3 1116 73 26 78 5302 3928
o23 A alpha 3 1149 72 25 77 5209 4030
o25 A alpha 2 1149 74 25 79 5348 3980
o26 A alpha 2 1159 75 25 77 5194 3896
o29 A alpha 3 1153 76 27 78 5327 4125
o30 A alpha 2 1174 72 26 75 5293 3984
o31 A alpha 2 1101 74 25 77 5333 4069
o32 A alpha 2 1066 72 25 78 5258 4055
o34 A alpha 3 1136 75 26 76 5179 3950
o35 A alpha 2 1148 74 27 79 5948 4202
o36 A alpha 1 1155 74 28 80 5690 4087
oOl B beta 2 1238 97 53 65 5905 4880
o04 B beta 2 1235 98 55 64 5959 4766
o07 B beta 2 1222 96 52 67 6019 4884
olO B beta 2 1238 92 49 66 5824 4659
0 22 B beta 2 1270 90 52 64 5964 5001
o24 B beta 2 1255 97 49 64 5691 4666
o27 B beta 2 1225 98 53 66 7603 4875

o28 B beta 2 1300 93 51 67 5872 4735
o33 B beta 3 1324 92 51 65 5776 4864
o08 G eta 2 1128 72 31 73 6503 4739
oil G eta 2 1064 71 28 70 6166 4182
ol5 G eta 2 1066 73 29 71 6030 4426
Specimen Ambroz New Analyses So (ppm) Zr(ppm) Sr(ppm) Rb (ppm) Fe(ppm) Ca(ppm)
pOl B beta 3 1279 94 52 65 5839 4738
p02 B beta 3 1306 96 53 66 6041 4867
p03 B beta 3 1309 95 52 66 5909 4784
p04 B beta 4 1336 95 53 66 6015 4832
p05 B beta 3 1291 104 53 68 6102 4982
p06 B beta 3 1330 96 54 68 6189 4900
p07 B beta 2 1340 93 52 64 5947 4747
p08 B beta 3 1272 96 51 65 5803 4713
p09 B beta 2 1338 92 51 65 5875 4700
plO B beta 3 1293 98 52 67 6038 4769
pll B beta 3 1333 96 52 66 5998 4776
pl2 B beta 4 1313 97 53 66 5998 4732
pl3 B beta 4 1319 95 52 66 5982 4817
pl4 B beta 1 1298 95 53 67 6034 4850
pl5 B beta 2 1259 96 51 65 6025 4670
pl6 B beta 3 1294 97 52 64 5962 4766
pl7 B beta 3 1331 94 51 66 5840 4683
pl8 B beta 3 1289 92 51 65 5857 4663
pl9 B beta 2 1298 99 53 66 5928 4721
Specimen Ambroz New Analyses Ba (ppm) Zr(ppm) Sr(ppm) Rb (ppm) Fe (ppm) Co (ppm)
qOl A alpha 3 1155 77 27 79 5296 4158
q03 A alpha 6 1148 76 27 79 5437 4332
q04 A alpha 9 1134 75 26 78 5330 4203
q 05 A alpha 6 1143 76 27 78 5498 4286
q08 A alpha 3 1148 74 27 75 5387 4241
q09 A alpha 3 1124 73 25 75 5253 3982
qlO A alpha 3 1177 77 27 79 5468 4239
ql3 A alpha 2 1049 72 27 80 6154 4337
ql4 A alpha 3 1124 76 28 80 5824 4376
ql7 A alpha 4 1133 77 28 81 5954 4344
q 18 A alpha 4 1135 81 28 80 5736 4256
ql9 A alpha 4 1157 77 28 80 5963 4268
q20 A alpha 4 1109 78 28 81 5990 4338
q21 A alpha 4 1109 79 28 79 5815 4276
q02 B beta 3 1284 97 57 63 6026 5117

q 06 B beta 3 1295 102 56 65 5889 4787
q07 B beta 4 1305 100 57 65 6190 5010
qll B beta 3 1284 102 59 66 6518 5167
ql2 B beta 3 1255 101 57 68 6719 5162
ql5 B beta 2 1298 108 58 68 6793 5316
ql6 B beta 4 1269 103 57 67 6766 5278
Specimen Ambroz New Analyses Ba (ppm) Zr(ppm) Sr (ppm) Rb (ppm) Fe (ppm) Co (ppm)
uOl A alpha 3 1149 li\, 25 78 5310 3788
u02 A alpha 3 1159 73 26 81 5339 3907
u03 A alpha 2 1147 74 26 79 5327 3782
u04 A alpha 2 1131 74 26 78 5268 3858
u05 A alpha 2 1160 78 27 82 5508 4043
uoe A alpha 3 1141 74 26 79 5342 3924
u07 A alpha 2 1143 69 25 74 5080 3636
u08 A alpha 2 1112 72 26 77 5301 3756
u09 A alpha 2 1137 69 25 77 5137 3762
u 10 A alpha 2 1152 78 25 78 5401 3954
ull A alpha 2 1115 72 26 75 5377 3773
ul2 A alpha 4 1140 73 25 77 5275 3836
u 13 A alpha 3 1154 77 25 77 5323 3940
ul4 A alpha 3 1135 77 27 81 5643 4001
ul5 A alpha 2 1125 75 25 77 5436 3884
ul6 A alpha 2 1179 75 26 79 5318 3919
ul7 A alpha 2 1146 74 26 79 5239 3770
ul8 A alpha 3 1164 75 25 79 5434 3841
ul9 A alpha 2 1160 72 25 77 5302 3871
u20 A alpha 2 1143 73 26 78 5298 3890
Specimen Ambroz New Analyses Ba (ppm) Zr(ppm) Sr (ppm) Rb (ppm) Fe (ppm) Co (ppm)
none F zeta

Seediscussions,stats,andauthorprofilesforthispublicationat:https://www.researchgate.net/publication/275345638
SuppTableS2-Glascock1999comparison
Data·April2015
CITATIONS
0
READS
22
2authors:
Someoftheauthorsofthispublicationarealsoworkingontheserelatedprojects:
PortableXRFApplicationsinArchaeologyViewproject
ThePalaeolithicofArmeniaViewproject
ElleryFrahm
YaleUniversity
45PUBLICATIONS476CITATIONS
SEEPROFILE
JoshuaFeinberg
UniversityofMinnesotaTwinCities
162PUBLICATIONS1,420CITATIONS
SEEPROFILE
AllcontentfollowingthispagewasuploadedbyElleryFrahmon23April2015.
Theuserhasrequestedenhancementofthedownloadedfile.

Rio Rome
ICP-AES/MS WDXRF Mean 1σ
Ba 1270 ± 20 1550 ± 130 1080 ± 2 843 1237 ± 14 1270 ± 13 1338 ± 14 1265 ± 8
Ca 5900 ± 30 6813 ± 69 5432 6219 ± 246 5565 ± 97 6230 ± 50 5933 5878 ± 124
Fe 6200 ± 100 6500 ± 300 6840 ± 280 6100 6500 ± 360 6070 ± 110 7020 ± 230 7900 5730 ± 150 6600 ± 800 5939 ± 139
K (%) 3.52 ± 0.16 3.90 ± 0.05 3.43 ± 0.05 3.6 3.15 ± 0.06 3.24 ± 0.03 3.57 ± 0.02 3.44 3.59 ± 0.08
Mn 327 ± 6 297 ± 30 269 ± 5 303 333 ± 10 291 ± 11 357 ± 9 387 298 ± 13 349 ± 47 337 ± 13
Nb 12 ± 1 9 ± 1 8 8 ± 1 6 7 ± 1 8 ± 2 8 1
Rb 95 ± 1 110 ± 1 97 ± 1 95 94 ± 1 105 ± 6 109 ± 6 97 96 ± 2 101 ± 3 94 ± 3
Sr 78 ± 20 52 ± 1 66 87 ± 1 73 ± 5 81 ± 6 71 69 ± 3 73 ± 9 78 ± 1
Ti 690 ± 25 595 ± 5 600 527 ± 34 788 ± 38 691 ± 16 659 570 ± 97 778 ± 14
Zn 31 ± 7 90 ± 3 27 ± 1 29 27 ± 2 36 ± 1 24 ± 3 41 ± 7 38 ± 1
Zr 118 ± 7 99 ± 10 83 ± 7 106 106 ± 2 105 ± 8 107 ± 3 105 96 ± 3 109 ± 8 85 ± 1
Supplementary Table S2: Inter-laboratory/inter-technique comparison for Ambroz and colleagues' "Group C"obsidian (our gamma type); reformated from Glascock (1999)
PIXE PIXE/PIGME EDXRF EDXRF
MURR CNRS Orléans CNRS Grenoble ANSTO
NAA NAA LA-ICP-MS ICP-AES/MS
Glascock 1999 This Study
pXRF
Little Glass Buttes - Group C/Gamma
Ashe Analytics NW Research
View publication statsView publication stats