journal of cave and karst studies microclimate and...
TRANSCRIPT

MICROCLIMATE AND MICROBIAL CHARACTERIZATIONIN THE ZINZULUSA SHOW CAVE (SOUTH ITALY) AFTER
SWITCHING TO LED LIGHTINGDELIA D’AGOSTINO1*, LEONARDO BECCARISI2, MICHELE CAMASSA3, AND PETER FEBBRORIELLO4
Abstract: Show caves are vulnerable environments whose conditions should bemonitored over time. Many factors, such as visits by tourists and the installation oflights, can easily alter the equilibrium of the cave system. Grotta Zinzulusa is a showcave located on the southeastern coast of Italy. This cave is renowned for the richness ofits faunal biodiversity, but little is known about its microclimate and about its microbialdiversity in the form of lampenflora growth near the light sources. We investigated thephotosynthetic microorganisms living in the Zinzulusa in regard to its microclimaticconditions one year after the change of the lighting system from tungsten to LED (lightemitting diode) lamps. Most microbial activity was found in areas with vermiculations.We established four distinct communities based on macroscopic characteristics as afunction of light intensity and wavelength. The observations were compared both withprevious data collected in the last decade and with other caves reported in the literature.Results show that not much has changed within the first year after switching to a LEDsystem with respect to the 1999 state. This research contributes to the knowledge of theenvironmental attributes and provides a baseline to check for changes in thelampenflora community over time in the Zinzulusa.
INTRODUCTION
Show caves provide important financial and educationalopportunities for the increase in nature-based tourism(Hamilton-Smith, 2004). Opening caves to the public bringschanges that alter the environment, such as construction ofwalking surfaces and infrastructure for electricity and water(Mulec, 2014). Recreational use of caves dates back to theearly seventeenth century (Šebela and Turk, 2014). Nowa-days, more than six hundred show caves are operatingworldwide (Gillieson, 2011). The number of tourists visitingcaves is continually increasing and can reach half a millionvisits per year in caves such as Grotte di Castellana in Italyand Han sur Lesse in Belgium (Parise, 2011).
The presence of large numbers of tourists can alter thenatural microclimatic and environmental conditions of acave, with consequences for the equilibrium of the system(Cigna, 2004). In particular, temperature and humidity canincrease considerably within the cave due to the presenceof tourists (Russell and MacLean, 2008). Moreover, humanrespiration can lead to an augmented CO2 concentrationthat can promote speleothem corrosion (Baker and Genty,1998). Visitors often contribute to the introduction ofmicroorganisms and foreign species into caves (Gambleet al., 2000). The presence of these microorganisms createsmanagement complications in many caves. Tourists alsocontribute to lint accumulation that supports the growthof bacteria on natural fibres, leading to discoloration ordamage to speleothems. Other factors, such as the introduc-tion of mud and dust, may adversely impact the equilibriumof hypogean caves.
In the artificially illuminated parts of caves, the devel-opment of heterotrophic biofilms (Jurado et al., 2009;Saiz-Jimenez et al., 2011) and phototrophic communitiesserving as primary producers (Bastian and Alabouvette,2009) is common. This community, generally known aslampenflora, is usually composed of different microbes,eukaryote algae, cyanobacteria, bryophytes, mosses, andferns. It adheres strongly to the substratum and deterio-rates speleothems and other objects (Mulec, 2012). Nutri-ents and moisture levels are often sufficient to support itsgrowth (Mulec et al., 2008). Rock surfaces, sediments,and artificial materials around lamps often become colo-nized by these phototrophs (Dobat, 1998a). Biomass fixeddue to light energy, together with other organic matterbrought by tourists on clothing and skin, becomes avail-able to cave organisms. Light sources can contribute to atemperature increase that further supports their prolifera-tion. The lighting system can alter the microclimate, favor-ing the growth of photosynthetic organisms, as happenedin the Lascaux caves, France, where algal colonizationdamaged the cave paintings (Baker and Genty, 1998).Lampenflora is completely dependent on light, as the lightsaturation point of these species is quickly reached at the
* Correspondence author: [email protected] Department of Material Science - University of Salento, 73047, Monteroni di Lecce(Lecce), Italy2 Regional Natural Park “Costa Otranto-Santa Maria di Leuca e Bosco di Tricase”,Andrano (Lecce), Italy3 Istituto Sperimentale of “Biologia del Sottosuolo P. Parenzan”, 72022, Latiano(Brindisi), Italy4 Research Support Group, Torrington CT, USA
D. D’Agostino, L. Beccarisi, M. Camassa, and P. Febbroriello – Microclimate and microbial characterization in the Zinzulusa show cave (SouthItaly) after switching to LED lighting. Journal of Cave and Karst Studies, v. 77, no. 3, p. 133–144, DOI: 10.4311/2014EX0123
Journal of Cave and Karst Studies, December 2015 .133

cave temperature (Dobat, 1998b). Moreover, some cyano-bacteria and micro-algae can survive even at photon fluxdensities lower than their photosynthetic compensationpoint (Mulec and Kosi, 2009).
These phototrophic communities are inappropriate froman aesthetic point of view and cause degradation of colo-nized substrata, producing weak organic acids that canslowly corrode the speleothems. Until now, the most com-mon treatments for controlling lampenflora growthincluded physical abrasion and bleach solutions. Hydrogenperoxide seems to be the most favorable biocidal amongthe tested chemicals (Faimon et al. 2003; Mulec and Kosi2009). These methods can be replaced with a proper selec-tion of time-limited illumination, reduction of light intensityand the use of lights whose spectrum does not supportphotosynthesis, such as light-emitting-diode (LED) systems(Olson, 2006 and references therein). In the Frozen Niagarasection of the Mammoth cave, Olson (2006) monitored anarrow spectrum yellow LED (595 nm) with an intensity of49.5 lux, corresponding to double the value recommendedfor white light by Aley (2004). After one year, a reductionof lampenflora growth was observed where previously awidespread algal cover was present (Toomey et al., 2009).
Some cave managers ignore light and tourist pollutionuntil problems become very obvious and difficult to solve.Therefore, due to the high vulnerability of these environ-ments, it is important to know their specific physical andbiological attributes and constantly monitor their condi-tions. Remediation actions that are done without carefulplanning may not solve, or may even exacerbate, the prob‐lem. The installation of a new lighting system should be pre-ceded by specific surveys. To minimize visitor impact, cavemanagers need to ensure a sustainable development of thecave system (Gillieson, 1996). Hence the introduction of aclimatic and biological monitoring program should assistthose involved in the adviser role to define and maintain asuitable environmental status in these systems (de Freitasand Littlejohn, 1987).
MATERIALS AND METHODS
Grotta Zinzulusa (Fig. 1a) is a karst cave facing theAdriatic Sea in the southeastern coast of Italy near thetown of Castro, in the province of Lecce. Monitoring in Zin-zulusa was aimed at investigating the microbial diversityestablished in the cave compared to its microclimatic condi-tions. With this aim, the following types of surveys were per-formed: microclimatic surveys to describe temperature andhumidity inside the cave; analysis of the algal and micro-biological communities checking their macroscopic charac-teristics; surveys to analyze the distribution of phototrophicorganisms in response to light intensity; and microbiologicalsurveys to investigate the composition of vermicular forma-tions, as well as identifying bacteria and fungi. The researchwas carried out in the air-filled part of the cave (Fig. 2a)
between March 2008 and December 2009. Additional datawere used to evaluate the response of the cave environmentto the new LED system that replaced tungsten incandescentlamps, among them microclimatic data available fromDecember 2007 to March 2008 and microbiological datafrom 1999.
GROTTA ZINZULUSA
Grotta Zinzulusa is a renowned show cave located onthe southeastern coast of Italy (Fig. 1a). It develops in awesterly direction for 156.5 m, at 11 m above sea level.The cave has a large entrance opening onto the AdriaticSea (Fig. 1b) and is the result of a long karst erosive processduring the Pleistocene. The cave was discovered in 1793,and it has been accessible to tourists since 1975. Grotta Zin-zulusa is visited by about 130,000 people annually, andmany facilities were built for tourists, including a passageexcavated into the cliff to allow entrance into the cave (Cic-carese and Pesce, 1999). An internal walkway and a lightingsystem were installed between 1950 and 1957 to permit aneasy visit in most of the air-filled part of the cave.
The cave can be divided into two parts, air-filled (Fig. 2a)and submerged (Onorato et al., 1999). The higher part canbe itself divided into three parts. The first, from the entranceto the Crypt, is characterized by numerous speleothems(Fig. 1d) and a brackish pool, the Basin, that contains mar-ine species (Toomey et al., 2009). The second area, from theCrypt to the Cathedral, contains fewer stalactites and sta-lagmites. In the final part, there is a 1.5 m deep freshwaterpool, the Cocito, of cold brackish water in an area closedto visitors. The pool’s water level often fluctuates with tidalchanges due to the coastal location and the connection withthe sea. This pool confirms the anchialine nature of thehydrological system. In this location, the rich diversity offauna includes crustaceans, copepods, and blind fishes.The Cocito is a sump where the submerged part of thecave starts, and has been explored for about 120 m and iscomposed of many rooms connected by short passages.Unlike the entrance, which was subjected to marine erosiveprocesses, the other parts were formed through a long karstprocess of carbonate rock dissolution (Parenzan, 1963).
More than sixty terrestrial and aquatic species have beenidentified in Zinzulusa. Among them are bats and anchia-line species of ancient origin (Pesce, 2001). However, as inother caves (Fong, 2011), changes in the environmentcaused some animals, such as bats, to abandon their naturalhabitat. In 1999 the Karst Waters Institute included GrottaZinzulusa in the top-ten list of the world endangered karstecosystems (Belson, 1999). This was mainly due to touristimpact on natural formations, as well as pollution fromurban water discharges that threatens the hypogean envi‐ronment. Grotta Zinzulusa presents an abundance of vermi-cular clay-slime formations (Camassa and Febbroriello,2003) whose origin is still unknown, spreading on the cavesurfaces and the calcite speleothems (Fig. 2b). Various the-ories have been published about the origin of vermiculations
MICROCLIMATE AND MICROBIAL CHARACTERIZATION IN THE ZINZULUSA SHOW CAVE (SOUTH ITALY) AFTER SWITCHING TO LED LIGHTING
134. Journal of Cave and Karst Studies, December 2015
and the development of those formations on cave walls andspeleothems (Nováková, 2009). Due to their biotic compo-nent, they represent a food source for microorganisms.Furthermore, the production of metabolic acids, especiallylactic and succinic, is involved in the surface bioerosion ofspeleothems (Northup and Lavoie, 2001; Camassa, 2003)or litholitic processes (Mulec et al., 2007)
Lampenflora growth has been visible for a long timenear the lights in Zinzulusa (Fig. 1c). To remove it, repeatedapplications of bleach were applied in the past, withoutinvestigating the relationship between microorganisms andlights. Grotta Zinzulusa has been examined for its faunalbiodiversity (Pesce, 2001), but in the international literaturethere are no specific studies on its lampenflora and micro-biological characteristics.
A LED system was installed in March 2008, consistingof spotlights with six to nine 1 watt LEDs without UVand IR spectral components. This system replaced tungstenincandescent lamps that emitted from 100 W to 200 W,increasing temperature and decreasing relative humidity.The new system was selected for various reasons: to have a
lower impact on the microclimate, to reduce the lampen-flora, to darken selected areas to benefit species having con-servation issues, such as bats that were abundant betweenthe Cathedral and Cocito (Lazzari, 1966), and to enhancethe visibility for visitors inside the cave. Each diode fur-nishes a white light of maximum intensity of 45 lux, withnarrow peaks in red (620–630 nm), green (515–530 nm)and yellow-amber (585–595 nm) wavelengths and minimalamounts of UV. This range of wavelengths is unfavorablefor chlorophyll photosynthesis (Teramura and Sullivan,1984). The lighting system is turned on during the visitinghours of the cave, which last for eight hours daily in summerand six hours during the other seasons.
THE MICROCLIMATE
In connection with the installation of the new lightingsystem, microclimatic monitoring was performed by theUniversity of Salento, commissioned by the Castro munici-pality that provided permission to publish all the data. Datawere automatically recorded every 15 minutes using tendata loggers (numbered 1–10 in Fig. 2a) provided with
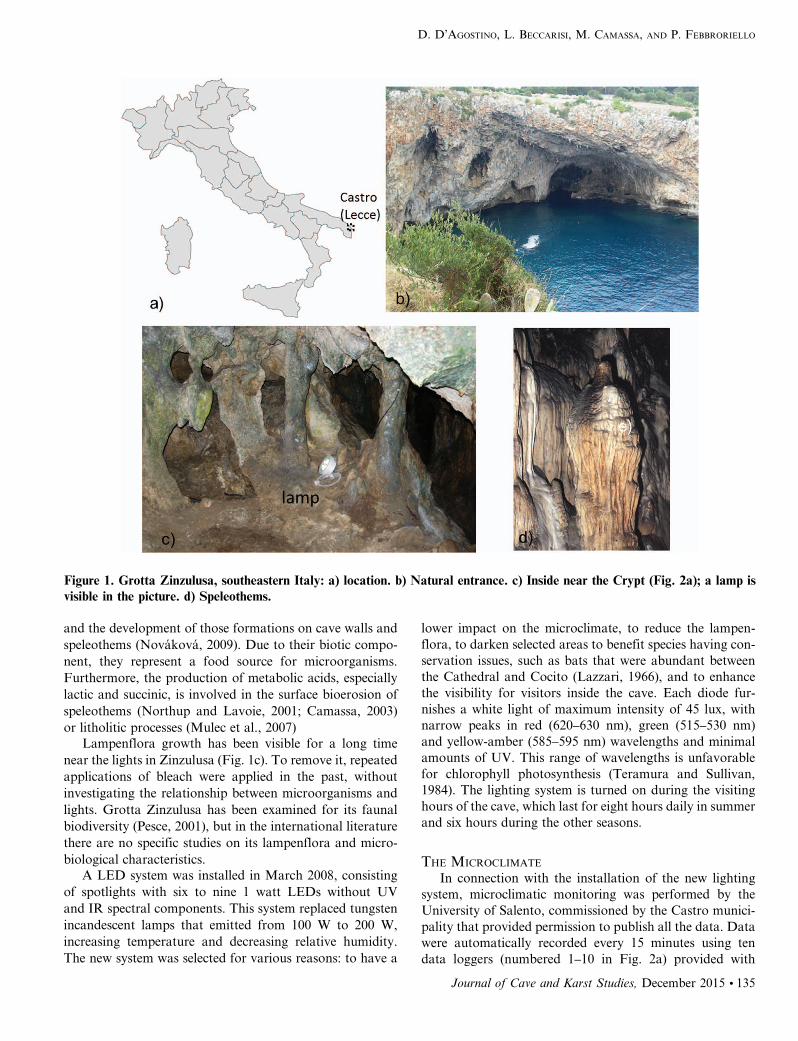
Figure 1. Grotta Zinzulusa, southeastern Italy: a) location. b) Natural entrance. c) Inside near the Crypt (Fig. 2a); a lamp isvisible in the picture. d) Speleothems.
D. D’AGOSTINO, L. BECCARISI, M. CAMASSA, AND P. FEBBRORIELLO
Journal of Cave and Karst Studies, December 2015 .135

sensors for temperature (range from −25 to +85 uC, accu-racy ¡ 0.5 uC, resolution 0.01 uC) and relative humidity(range from 0 to 100%, accuracy ¡ 2%, resolution 0.5%).One data logger was placed outdoors to analyze the impactof the outside climate on the cave interior. The others wereplaced inside the cave, from the entrance (point 1 in Fig.2a) up to the Cocito pool (point 10). These locations wereselected to cover the air-filled part of the cave to analyzethe microclimatic changes related to the increased use ofthe cave for tourism. The names of these locations originatefrom features in the cave. Starting from the entrance (Fig.2a), the identified locations included: the Vestibule (point2), the Pond (point 3), the Trap (point 4), the Canopy (point5), the Waterfall (point 6), the Crypt (point 7), and theCathedral (points 8 and 9).
PHOTOTROPHIC ORGANISMS IDENTIFICATION
The main types of communities that colonize the cavesurfaces were identified near the light sources on the basisof their microscopic and macroscopic features. Thisapproach was chosen in order to be easily reproduced byfuture cave management. It was assumed that the new lightswere placed in the same locations as the previous installa-tion. Samples were acquired in the monitoring sites shownin Figure 2a (sites Zi-1 to Zi-6). The phototrophic commu-nity types were identified on the basis of samples collectedalong transects that involve multiple lights. These weredesigned by randomly selecting six lamps at each site. Ateach sampling site, four samples were acquired at a distanceof about 1 m from each lamp in different directions, north,south, east, and west. Samples were acquired by scrapingoff 2 cm2 of surface at each sampling site and near thecave entrance. It is important to stress that the entrance isthe only part of the cave that can be reached by solar radia-tion, therefore, a different flora is expected in this area. Thepresence of vermicular formations, the color and size ofalgal colonization, and the moisture content of the substratewere recorded for each sample. Each sample was collectedusing a disposable sterile spatula and stored separately in a
sterilized plastic tube until its analysis in the laboratoryone hour later. Samples were examined using a LEICA opti-cal microscope (maximum magnification 10003) to detectthe presence of fungal mycelium, examine the morphologyand frequency of the algal component, and distinguishbetween green algae and cyanobacteria. Algae were deter-mined only at phyla taxonomic level. Bryophytes and pteri-dophytes were determined according to Pedrotti (2001) andPrelli and Boudrie (2001).
COMMUNITY DISTRIBUTION IN RESPONSE TO LIGHT
INTENSITY
The distribution of the phototrophic community typespreviously identified was analyzed with respect to the lightintensity measured with a luxmeter ISO-Tech ILM 350.Light intensity was acquired in a perpendicular directionwith respect to the highest part of the cave in order to con-sider possible shadows cast in some parts of the transects.Data on light intensity were collected along thirty trans-ects using the luxmeter. Each transect was designed tospan two light sources. The transect length varied from 5m (minimum distance between lights) to 15 m (maximumdistance between lights). Each transect had its origin atone light source and covered the adjacent lateral surfacesup to the ceiling surface of the cave until its end in thenext light source (Fig. 2c). Each transect was acquired inlocations characterized by almost constant microclimaticconditions. The transects were designed in the Zi-2through Zi-5 sites (Fig. 2a), where temperature remainsalmost stable over the year and relative humidity is over90%. The community type, the height from the floor, thedistance from the radiation source, and the intensity ofthe incident light were recorded every 30 cm along eachtransect.
COMPOSITION OF VERMICULAR FORMATIONS
Microbiological surveys were performed to investigatethe composition of vermicular formations. Samples of ver-micular formations and soil were collected in seven sites,
Figure 2. a) Plan map of the air-filled part of Grotta Zinzulusa, modified from Onorato et al. (1999), showing the points of themicroclimatic survey performed by the University of Salento commissioned by the Castro municipality (1. Entrance Chamber,2. Vestibule, 3. Pond, 4. Trap, 5. Canopy, 6. Waterfall, 7. Crypt, 8. Cathedral 1, 9. Cathedral 2, 10. Cocito), and the samplingareas for the microbiological surveys (Zi-0 through Zi-6) divided by lines. b) Vermicular formations in the cave. c) Collectinglight intensity data.
MICROCLIMATE AND MICROBIAL CHARACTERIZATION IN THE ZINZULUSA SHOW CAVE (SOUTH ITALY) AFTER SWITCHING TO LED LIGHTING
136. Journal of Cave and Karst Studies, December 2015

labelled Zi-0 through Zi-6 in Fig. 2a, within the cave. Thesamples were collected using sterile equipment, such as dis-posable spatulas and fiber dracon swabs. An aliquot of thesamples was introduced directly in liquid medium (tryptosebroth), and another aliquot was sown directly onto solidmalt agar, Sabouraud, and Triple Sugar Iron. Moreover,pool and dripping water samples were collected in the Zi-2site using sterilized pipettes. Water samples were filteredusing 47 mm millipore filter with 0.45 mm porosity. Stan-dard methods were followed for the identification of bac-teria and fungi (Bailey and Scott, 1974; Barnett andHunter, 1998). It was carried out by the macroscopic exam-ination of colonies (color, gloss, forms), by detection of themicroscopic features of bacteria (Gram stain, presence ofcapsule, morphology, motility, size), and biochemical typ-ing on Triple Sugar Iron in Methyl Red–liquid Voges Pros-kauer, nitrate liquid medium, phenylalanine agar, citrateagar, urea liquid medium.
A ZEISS UltraLux microscope and a ZEISS Axioscopemicroscope were used for the morphological analysis. ADCM500 digital imager was used to capture and storeimages. Fungi were identified on the basis of visible sporeand hyphal morphology and color. Both classical (Baileyand Scott, 1974) and numerical methods (Holt, 1994; Good-all, 1966) were used for tests on each colony. Triple SugarIron (TSI), TSI gas, TSI butt, TSI slant, H2S, Sellers, fluor-escent slant, citrate, catalase, indole, methyl red, phenylala-nine, urease, Voges Proskauer, nitrate and nitrite reduction,and oxidase reactions were used for bacterial typing andsaved in a database for use in future tests. Fungi of genusGeotrichum were identified on the basis of visible rectangu-lar arthrospores, in the germinative state (Bailey and Scott,1974).
Numerical methods (Holt, 1994; Jaccard, 1912) opti-mally require a minimum of thirty tests to determine genus,and possibly as many as one hundred tests to determine spe-cies. The morphometric and biochemical data is generallycompared to large databases of bacterial data to attemptautomated identification by scoring each colony with theJaccard index. However, in this case, the Sokal modification(Sneath and Sokal, 1973) to the Jaccard index, whichignores negative test results, is more suitable for biome com-parison and study of metabolic processes within a biome(Goodall, 1966), as well as for mapping the flow of metaboliteson cave surfaces. We carried out thirty tests to investigatethe metabolic environment and to make a determination ofsimilarity. Sokal scores were calculated from the morpho-metric and metabolic tests on the bacteria collected in the Zin-zulusa in 1999 (Onorato et al., 1999) and to make a similaritycomparison with 2009. Test results and images were stored in adatabase and processed to provide a comparison with othercaves. The similarity index can provide a measure of changein metabolic profiles within the biomes caused by the changesmade in illumination.
RESULTS AND DISCUSSION
The Grotta Zinzulusa microclimate is consistent withother single-entrance caves, with large temperature and rela-tive-humidity variations near the entrance and smaller var-iations internally. These variations depend on the positioninside the cave and the season (Fig. 3). Only the first mea-surement sites are influenced by the outdoor exchanges,while starting from the Trap (point 4) the difference is lowerand the temperature profile is more stable within the siteduring the monitoring period.
When the thermal inversion occurs, from November toMay, the average cave temperature is 17.3 ¡ 2.6 uC, whilethe average external temperature is 14.1 ¡ 1.3 uC. In gen-eral, the thermal gradient between the cave and the exterioratmosphere is between 3 and 4 uC (Fig. 3b).
The maximum temperature gradient between the outsideair and points in the cave occurs up to the Canopy (point 5in Fig. 2a), approximately in the middle part of the cave.From the Trap (point 4 in Fig. 2a) to the Waterfall (point6 in Fig. 2a) there is a gradient of at least 1 uC. After theCrypt (point 7 in Fig. 2a) no difference is found in both sea-sons (Fig. 3a).
Humidity within Grotta Zinzulusa tends to remain highat all the monitoring sites 1 to 10 in the cave, with valuesbetween 90% and 100%, showing small differences overtime. The logger at point 1 recorded the most variationand the lowest relative humidity, with values around 80%.The saturation level is quite often reached inside the cave,and in general, an equilibrium is achieved between spe-leothems, ceiling areas, and surrounding air.
We now describe the outcomes related to the algal andmicro-biological communities of Grotta Zinzulusa. Theresponse of phototrophic organisms to light intensityrevealed an abundant cryptogam flora present within 5 mfrom the entrance, where the light intensity and the solarradiation are reduced by about 80%. It primarily consistsof lichens, bryophytes (mainly unidentified protonema andmosses such as Rhynchostegiella tenella and Eucladium ver-ticillatum), gametophytes, and sporophytes of pteridophytessuch as Adiantum capillus-veneris. E.verticillatum is respon-sible for the formation of organogenic concretions thatgrow from the dripping ceilings oriented towards the outsideof the cave as phototropic growth. Bryophyte protonemaand small lichens are only present occasionally, while algalcommunities consistently spread over artificially-lit sur-faces. A dense presence of bacteria and fungi was detected.
Four phototrophic community types (Fig. 4 and Table 1)have been identified during the transects (Fig. 2c) carriedout to analyze the response to light intensity. They are dis-tinguished by macroscopic characteristics detectable withthe naked eye, so this identification can be useful for rapidlydetecting future changes in their distribution. From theentrance of the cave to the other locations, the relative fre-quency of the algal component increases. A major algalcomponent can be observed passing from the community
D. D’AGOSTINO, L. BECCARISI, M. CAMASSA, AND P. FEBBRORIELLO
Journal of Cave and Karst Studies, December 2015 .137

types 1 and 2 to the community types 3 and 4, in relation tothe light gradient. Types 3 and 4 also respond selectively tothe substrate wetting, and, in particular, the communitytype 4 requires a wet substrate.
The response to the light intensity is not monotonic.Fig. 5 shows the frequency distributions of the four com-munity types versus the photon flux density (PPFD)obtained by combining data from all the transects. Thecommunity types are distributed selectively according tothe light intensity around the lights. In particular, the com-munity type 1 shows a peak at a flux of 0.3 mmol m−2 s−1,while at other intensities, its presence is much lower. The
community types 2 and 3 have their ecological optimumin the short interval between 0.1 and 0.3 mmol m−2 s−1,and their presence is inhibited at both minor and majorlight intensities. The community type 4 is the most helio-philous, since it is distributed in a light range between 0.1and 0.8 mmol m−2 s−1. The community types 3 and 4show algae growth at light intensity as low as 0.33 mmolm−2 s−1, showing that algae in caves can survive atphoton flux densities in the range of 0.5 to 1 mmol m−2
s−1. Finally, it is worth noting that all community typeshave a reduced growth to light intensities higher than0.8 mmol m−2 s−1.
Figure 3. a) Average, maximum, and minimum air temperature (6C) in the period December 2007–December 2009 at themeasurement points of Fig. 2a. b) Air temperature over the measurement period outside and at some named points inside thecave. The error bars indicate the uncertainty of the given values, they refer to the instrumental error of the measurements. Datacollected by the University of Salento and provided with publishing permission by the Castro Municipality.
MICROCLIMATE AND MICROBIAL CHARACTERIZATION IN THE ZINZULUSA SHOW CAVE (SOUTH ITALY) AFTER SWITCHING TO LED LIGHTING
138. Journal of Cave and Karst Studies, December 2015

Microscopic analysis of the vermicular formations hasidentified a biotic component mainly composed of bacteriaand protozoa with a predominance of fungi (septate hyphae,spores). Moreover, elements of animal origin are found inthe samples collected throughout the cave, including excretaand residuals of Isopoda, Diptera, and Lepidoptera scales.Lint has also been found in the collected material, and itsorigin is due to the tourist presence.
We identified Geotrichum candidum (Fig. 6), Mucor tro-glophilus, and Aspergillus sp. pl. in the vermicular
formations. Geotrichum has cells which are fairly character-istic, with dimensions of 4 by 8 mm. It produces a thickmucus capable of aggregating clay particles (de Hoog et al.,1986). Biological activity of Geotrichum was detected by theproduction of the metabolic lactic and succinic acids. Geo-trichum tends to develop linearly according to a dendriticpattern that suggests a role in the vermicular formations.Comparing the vermicular formation organisms with othercave collections and identification charts (Cornish-Bowden,2012), an unsatisfactory classical identification profile has
Figure 4. Community types (Table 1) living in Grotta Zinzulusa: a) type 1, b) type 2, c) type 3, d) type 4. e) A profile of of a 5-mtransect two lamps, h the height measured from the cave floor.
D. D’AGOSTINO, L. BECCARISI, M. CAMASSA, AND P. FEBBRORIELLO
Journal of Cave and Karst Studies, December 2015 .139

been obtained. Those fungi are capable of development viadifferent types of interactions with other organisms by usingtheir versatile metabolic pathways (Lazzari, 1966).
The bacterial taxa isolated in the samples are Shigellasp., Campylobacter concisus, Enterobacter aerogenes, Enter-obacter hafniae, Pseudomonas sutzeri, Pseudomonas aerugi-nosa, Ancalomicrobium adetum, Klebsiella pneumoniae,Moraxella lacunata, Moraxella osloensis, Yersinia sp.,Providencia stuartii, Bacillus schlegelii, Bacillus polpilliae,Kingella kingie (5 Moraxella kingie), and Psychrobacterphenylpyruvicus (5 Moraxella phenylpyruvica). They werealmost uniformly distributed within the sampling sites.
Results of the computational comparison between thedata of 1999 and 2009 reveal a Sokal index of 0.39, suggestingthat some changes might have taken place between collec-tions. Figure 7 and Table 2 present the metabolite informa-tion from the bacterial tests to identify the predominatechemistry in the different biomes. Table 2 shows that the largeamount of nitrate observed at the Zi-4 site could be coupledto vegetal activity, but could also be related to light intensity.The table shows decreases in the later data in oxidase andVogues-Proskauer (utilizing the butylene glycol pathway pro-ducing acetoin) and a reduction of motile organisms to 25%of 1999 levels. Also, there is no remaining urea metabolism
Table 1. Main features of the phototrophic community types living in the lighted part of Grotta Zinzulusa.
Communitytype Microscopic examination Substrate Macroscopic appearance
1 Abundant fungal mycelium and inorganiccomponents.
Algal cells almost absent.
Dry or slightly wet. Vermicular formations. Nogreen film.
2 Fungal mycelium and unicellular algae(Cyanophytes).
Dry or slightly wet. Vermicular formation and brightgreen isolated stains.
3 Abundant fungal mycelium, unicellular andmulticellular threadlike algae(Cyanophytes).
Clusters of small rounded algal cells(Cyanobacteria).
Dry or slightly wet. Vermicular formations and brightgreen confluent stains.
4 Abundant Cyanophytes.Clusters of rounded algal cells
(Cyanobacteria).Fungal mycelium relatively less frequent.
Wet. Gelatinous and dark green films.
Figure 5. Relative frequency distribution of the four communities versus the light intensity, developed by combining data fromall transects. Relative frequency is the percentage of the identified communities versus light intensity. The total of 100% isverified in the sum of the frequencies of each community (community 1, 2, 3, 4) with light intensity.
MICROCLIMATE AND MICROBIAL CHARACTERIZATION IN THE ZINZULUSA SHOW CAVE (SOUTH ITALY) AFTER SWITCHING TO LED LIGHTING
140. Journal of Cave and Karst Studies, December 2015

by vermiculation bacteria, possibly due to the change toLED lighting. Evidence of nitrogen fixation from nitrate isseen in low-light areas even though, according to Dunstanet al. (1982) and de Freitas and Schmekal (2003), this activityshould be inhibited in darkness. It is also interesting toobserve that very little nitrite reduction to N2 is taking place(Table 2 and Fig. 7), supporting the hypothesis of nitrite con-sumption by vegetation or fungi rather than by bacteria.
In the light range between 0.1 and 0.3 mmol m−2 s−1,which is the ecological optimum of the community types2 and 3, the maximum level of metabolic activity isobserved (Fig. 7). Of course, while there seems to besome correlation between photon flux and sugar metabo-lism (Fig. 7), there could be several other factors at play.More study is needed in this direction. Moreover, therewas a doubling of citrate utilization, which might indicatemutations in E. coli (Lenski, 2000), and indole production,
which reinforces the need to remediate the sewage influxproblem with Zinzulusa.
A comparison of the microbiological component ofGrotta Zinzulusa with the microbiological component ofother caves is depicted in Figure 8. Among the testedcaves, the most dissimilar caves, corresponding to scorevalues close to zero, were the closed-to-visitors HorsethiefCave, Wyoming, (Sokal score 0.015) and a cave exploredin Canada with spherical ceiling pendants having Geotri-chum sp. These caves are rather dry caves compared toZinzulusa. On the other end of the scale, SnaggletoothCave, a partially restricted cave in New York State,scored highest at 0.47; a value justified by the fact thatthis cave is subject to seepage of treated sewage. Theremainder are mostly caves with influx consisting ofwoodland drainage, all of which represent animal activityin bacterial content.
Figure 6. Geotrichum candidum (Gram stain, scale bar is 10 mm).
Figure 7. Metabolic activity of the bacterial component in the community types in Grotta Zinzulusa versus the light intensity.
D. D’AGOSTINO, L. BECCARISI, M. CAMASSA, AND P. FEBBRORIELLO
Journal of Cave and Karst Studies, December 2015 .141

Many factors can favor a long-term colonization, amongthem a high relative humidity, relatively stable temperature,a water pH close to neutrality, and other features influencingthe attachment of bacteria, such as micro-roughness, sub-stratum chemistry and pH, and fluid-dynamics. As an exam-ple, a large presence of bacteria is observed in the closed-to-visitors Lascaux Cave (Cunningham et al., 1995) and in theMaltravieso (Arroyo et al., 1997) and Altamira Caves(Laiz et al., 1999), where cyanobacteria and faecal indicatorsappeared in abundance, especially in dripping waters(Northup et al., 2003). Even though these measurementshave helped to identify caves with metabolic similarity, thegenerally low scores clearly suggest that every cave environ-ment is unique and worth a detailed study and protection.
CONCLUSIONS
This paper represents the first assessment of the microcli-matic and microbial characterization of Grotta Zinzulusa insoutheastern Italy. We performed surveys to analyze boththe distribution of the phototrophic organisms in responseto light intensity and the microbiological component of ver-micular formations. The outcomes of this research contri-bute to the knowledge of lampenflora contamination afterlighting replacement by LEDs. The environmental monitor-ing performed in the cave revealed that the light sourcescontribute to the development of a complex system of com-munities inside the cave.
The replaced tungsten lamps were not suitable for cavepreservation, as they increased temperature and decreasedhumidity. The new LED system has a smaller impact onthe cave microclimate, emits light of natural appearance,consumes less electricity, and has no IR spectrum. Another
advantage is to have a lower irradiance with high illumi-nance values that create contrast with the illuminatedobjects. Tourist attendance is contributing to the introduc-tion of live microorganisms that can persist in the caveenvironment, such as fungi and bacteria. To prevent theintroduction of microbes, a disinfection barrier can beinstalled outside the cave. Among the different species,photosynthetic algae appeared to be dependent on lightintensity, but in the presence of available nutrients, an unsui-table light quality for lampenflora growth can slow theirproliferation slightly, but only within a short period of time.
The study assessed the presence and identification of fourprincipal phototrophic communities with a preference forlow light intensities. The complex lampenflora algae is ubi-quitous. Furthermore, a dense diffusion of microbial forms,mainly represented by Geotrichum, was found spreading inthe cave, with the production of metabolic lactic and succinicacids that are responsible for superficial bioerosion. Toreduce lampenflora growth, the lighting regime should berestricted. Specific actions could be taken to control the diffu-sion of communities inside the cave. For example, the openhours of the cave or the hours during which the lights areturned on could be reduced. A limit of people entering thecave or further spatial restrictions could be also established.
The results of this study are intended to be used to sup-port the development of a rigorous monitoring programfor the on-going management of Grotta Zinzulusa. Along-term program is needed to monitor lampenfloragrowth, the microclimate, and environmental. These resultscan be a basis for the establishment of guidelines for the useof the cave system as a natural asset, including maximumnumber of tourists and frequency of visits. They mightalso serve as a starting point for future investigations, aswell as for comparisons with other caves.
Table 2. Metabolic characteristics of the bacterial component of the samples collected during the surveys of 1999 (Camassa andFebbroriello, 2003) and 2009.
Metabolome # 1999 % POS 1999 % NEG 1999 # 2009 % POS 2009 % NEG 2009
TSI GAS 14 0 100 33 0 100pH in V-P broth ,6 14 14.3 85.7 36 38.9 61.1Utilization of citrate 14 14.3 85.7 28 25 75Gram Positive (young cultures) 7 42.8 57.1 23 52.2 47.8Catalase 10 50 50 27 55.6 44.4Indole 14 0 100 28 28.6 71.4Motility 7 42.8 57.1 8 12.5 87.5Oxidase 6 83.3 16.7 27 44.5 55.5Phenylalanine deaminase 6 0 100 20 0 100TSI 14 57.1 42.8 33 51.5 48.5TSI BUTT 6 0 100 16 0 100TSI H2S 14 0 100 33 0 100TSI SLANT 8 0 100 16 0 100Urease 14 7.2 92.8 20 0 100Voges Proskauer 13 7.6 92.3 35 0 100Nitrate reduction 14 64.3 35.7 36 75 25TSI GAS 14 0 100 33 0 100
MICROCLIMATE AND MICROBIAL CHARACTERIZATION IN THE ZINZULUSA SHOW CAVE (SOUTH ITALY) AFTER SWITCHING TO LED LIGHTING
142. Journal of Cave and Karst Studies, December 2015

ACKNOWLEDGEMENTS
The authors thank the Castro Municipality that providedpermission to publish the microclimatic data, as well as otherinformation about the cave. They are grateful to MassimoLuggeri and Ninì Ciccarese for technical support and toMichele Aleffi for mosses identification. Thanks are also dueto Peter Gattinesi and Robert Kenny for proofreading.
The authors participated in establishing research design,methodology, and analysis. In particular, D. D’Agostinocontributed to microclimatic and light intensity surveys, L.Beccarisi andD.D’Agostino cooperated to the photophilouscommunities analysis, and M.M. Camassa and P. Febbror-iello collaborated on microbiological surveys.
REFERENCES
Aley, T., 2004, Tourist caves: algae and lampenflora, in Gunn J, ed., Ency-clopedia of Caves and Karst Science: New York, Fitzroy Dearborn,p. 733–734.
Arroyo, G., Arroyo, I., and Arroyo, E., 1997, Microbiological analysis ofMaltravieso cave (Caceres) Spain: International Biodeterioration andBiodegradation, v. 40, no. 2-4, p.131–139. doi:10.1016/S0964-8305(97)00039-5.
Bailey, W.R., and Scott, E.G., 1974, Diagnostic Microbiology: A Textbookfor the Isolation and Identification of Pathogenic Microorganisms,fourth edition: St. Louis, Mosby, p. 363–403.
Baker, A., andGenty,D., 1998, Environmental pressures on conserving cavespeleothems: effects of changing surface land use and increased cavetourism: Journal of Environmental Management, v. 53, p. 165–175.doi:10.1006/jema.1998.0208.
Barnett, H.L., and Hunter, B.B., 1998, Illustrated Genera of ImperfectFungi, fourth edition: St. Paul, APS Press, 218 p.
Figure 8. Comparison of Sokal index of similarity with other caves: Snaggletooth Cave (SNAGGLETOOTH), NY, USA,treated sewer seepage; Dolo Cave (DOLO), MA, USA, woodland surface stream insurgence; Mount Anthony Cave (MTA),VT, USA, woodland surface stream insurgence; Growling Bear (GR BEAR) Cave, MA, USA, underground spring; HoweCaverns, NY, USA, tourist cave; Grahm Mountain Cave (GRAHM), NY, USA, bat hibernaculum (B LADY), CT, USA,woodland swamp drainage; Zinzulusa, 1999 samples (ZIN99); Lake of the White Roses (LWR), Lechuguilla Cave, NM, USA,sulfur cycle with minimum surface water influx; Movile Cave (MOVILE), Romania, H2S, underwater samples; Buford Pruitt(PRUITT) cave samples, FL, USA, rarely entered; Ian McKenzie (IANMAC) cave samples, Canada, dry mountain caveceiling pendants, restricted access; Horsethief Cave (HTC04), WY, USA, mountainous cave area.
D. D’AGOSTINO, L. BECCARISI, M. CAMASSA, AND P. FEBBRORIELLO
Journal of Cave and Karst Studies, December 2015 .143

Bastian, F., and Alabouvette, C., 2009, Lights and shadows on the conser-vation of a rock art cave: The case of Lascaux Cave: InternationalJournal of Speleology, v. 38, p. 55–60. doi: 10.5038/1827-806X.38.1.6.
Belson, C., 1999,KarstWaters Institute’s second annual top ten list of endan-gered karst ecosystems: KWI Conduit, v. 7. no. 1-2, 5 p., http://www.karstwaters.org/conduit/vol7no1/karst10.htm [accessed January 2015]
Camassa, M.M., 2003, Food resources, in Gunn, J., ed., Encyclopediaof Caves and Karst Science: New York, Fitzroy Dearborn, p. 367–370.
Camassa, M.M., and Febbroriello, P., 2003, Le foval della Grotta Zinzu-lusa in Puglia (SE-Italia): Thalassia Salentina, v. 26 suppl., p. 207–218. doi:10.1285/i15910725v26supp207. [v. 26 was published in 2002,v. 26 supplement in 2003]
Ciccarese, G., and Pesce, G., 1999, La Zinzulusa: 200 anni dopo: ThalassiaSalentina, v. 23 suppl., p. 79–88.
Cigna, A.A., 2004, Climate of Caves: in Gunn, J., ed., Encyclopedia ofCaves and Karst Science: New York, Fitzroy Dearborn, p. 726–730.
Cornish-Bowden, A., 2012, Fundamentals of Enzyme Kinetics, fourth edi-tion: Weinheim, Wiley–Blackwell, 510 p.
Cunningham, K.I., Northup, D.E., Pollastro, R.M., Wright, W.G., LaRock, E.J., 1995, Bacteria fungi and biokarst in Lechuguilla CavesCarlsbad Caverns National Park New Mexico: Environmental Geol-ogy, v. 25, p. 2–8.
de Freitas, C.R., and Littlejohn, R.N., 1987, Cave climate: Assessment ofheat and moisture exchange: Journal of Climatology, v.7, p. 553–569.doi:10.1002/joc.3370070604.
de Freitas, C.R., and Schmekal, A., 2003, Condensation as a microclimateprocess: Measurement, numerical simulation and prediction in theGlowworm Cave, New Zealand: International Journal of Climatology,v. 23, p. 557–575. doi:10.1002/joc.898.
de Hoog, G.S., Smith, M.T., and Guého, E., 1986, A Revision of the GenusGeotrichum and its Teleomorphs: Utrecht, CBS-KNAW Fungal Biodi-versity Centre, Studies in Mycology 29, 131 p.
Dobat, K., 1998a, Flore (lichens, bryophytes, pteridophytes, spermato-phytes), in Juberthie, C., and Decu, V., eds., Encyclopaedia Biospeolo-gica: Moulis, Société Biospéologie, vol. 2, p. 1311–1324.
Dobat, K. 1998b, Flore de la lumière artificielle (lampenflora - maladieverte), in: Juberthie, C., and Decu, V., eds., Encyclopaedia Biospeolo-logica: Moulis, Société Biospéologie, vol. 2, p. 1325–1335.
Dunstan, R.H., Kelley, B.C, and Nicholas, D.J.D., 1982, Fixation of dini-trogen derived from denitrification of nitrate in a photosynthetic bac-terium, Rhodopseudomonas sphaeroides forma sp. denitrificans:Journal of Bacteriology, v. 150, no. 1, p. 100–104.
Faimon, J., Štelcl, J., Kuběová, S., and Zímak, J., 2003, Environmentallyacceptable effect of hydrogen peroxide on cave "lamp-flora", calcite spe-leothems and limestones: Environmental Pollution, v. 122, p. 417–422.doi:10.1016/S0269-7491(02)00309-3.
Fong, D.W., 2011, Management of subterranean fauna in karst, in van Bey-nen, P.E., ed., Karst Management: Dordrecht, Springer, p. 201–224.doi:10.1007/978-94-007-1207-2_9.
Gamble, D.W., Dogwiler, J.T., and Mylroie, J., 2000, Field assessment ofthe microclimatology of tropical flank margin caves: Climate Research,v. 16, p. 37–50. doi:10.3354/cr016037.
Gillieson, D., 1996, Caves: Processes, Development, Management: Oxford,Blackwell, 324 p.
Gillieson, D.S., 2011, Management of caves, in van Beynen, P.E., ed.,Karst Management: Dordrecht, Springer, pp. 141–158. doi:10.1007/978-94-007-1207-2_6.
Goodall, D.W., 1966, Numerical taxonomy of bacteria—Some publisheddata re-examined: Microbiology, v. 42, p. 25–37. doi: 10.1099/00221287-42-1-25.
Hamilton-Smith, E., 2004, Show caves, in Gunn, J., ed., Encyclopedia ofCaves and Karst Science: New York, Fitzroy Dearborn, p. 726–730.
Holt, J.G., 1994, Bergey’s Manual of Determinative Bacteriology, ninthedition: Hagerstown, Lippincott Williams & Wilkins, p. 787.
Jaccard, P., 1912, The distribution of the flora in the alpine zone: New Phy-tologist, v. 11, p. 37–50, doi:10.1111/j.1469-8137.1912.tb05611.x.
Jurado, V., Fernandez-Cortes, A., Cuezva, S., Laiz, L., Cañaveras, J.C,,Sanchez-Moral, S., and Saiz-Jimenez, C., 2009, The fungal colonisa-tion of rock-art caves: Experimental evidence: Naturwissenschaften,v. 96, p. 1027–1034. doi:10.1007/s00114-009-0561-6.
Laiz, L., Groth, I., Gonzalez, I., and Saiz-Jimenez, C., 1999, Microbiologi-cal study of the dripping waters in Altamira cave (Santillana del MarSpain): Journal of Microbiological Methods, v. 36, p. 129–138.doi:10.1016/S0167-7012(99)00018-4.
Lazzari, A., 1966, LagrottaZinzulusa pressoCastro (Lecce., osservazioni geo-morfologiche con notizie storico-bibliografiche e due appendici): Annalidel Pontificio Istituto Superiore di Scienze e Lettere “S. Chiara”, p. 1–63.
Lenski, R.E., 2000, Source of founding strain, web site of the long-termevolution experiment, Michigan State University, http://myxo.css.msu.edu/ecoli/strainsource.html [accessed 18 June 2008].
Mulec, J., 2012, Lampenflora, in White, W.B., and Culver, D.C., eds.,Encyclopedia of Caves: Amsterdam, Elsevier, p. 451–456.
Mulec, J., 2014, Human impact on underground cultural and natural heri-tage sites, biological parameters of monitoring and remediation actionsfor insensitive surfaces: Case of Slovenian show caves: Journal of Nat-ure Conservation, v. 22, p. 132–141. doi:10.1016/j.jnc.2013.10.001.
Mulec, J., and Kosi, G., 2009, Lampenflora algae and methods of growthcontrol: Journal of Cave and Karst Studies, v. 71, no. 2, p. 109–115.
Mulec, J., Kosi, G., and Vrhovšek, D., 2007, Algae promote growth of sta-lagmites and stalactites in karst caves (Škocjanske jame Slovenia): Car-bonates and Evaporites, v. 22, no. 1, p. 6–9. doi:10.1007/BF03175841.
Mulec, J., Kosi, G., and Vrhovšek D., 2008, Characterization of cave aero-phytic algal communities and effects of irradiance levels on productionof pigments: Journal of Cave and Karst Studies, v. 70, no. 1, p. 3–12.
Northup, D.E., Barns, S.M., Yu, L.E., Spilde, M.N., Schelble, R.T., Dano,K.E., Crossey, L.J., Connolly, C.A., Boston, P.J., Natvig, D.O., andDahm, C.N., 2003, Diverse microbial communities inhabiting ferroman-ganese deposits in Lechuguilla and Spider caves: Environmental Micro-biology, v. 5, p. 1071–1086. doi:10.1046/j.1462-2920.2003.00500.x.
Northup, D.E., and Lavoie, K.H., 2001, Geomicrobiology of caves: Areview: Geomicrobiology Journal, v. 18, no. 3, p. 199–222. doi:10.1080/01490450152467750.
Nováková, A., 2009, Microscopic fungi isolated from the Domica Cavesystem (Slovak Karst National Park, Slovakia). A review: Interna-tional Journal of Speleology, 38, no. 1, 71–82. doi:10.5038/1827-806X.38.1.8.
Olson, R., 2006, Control of lamp flora in developed caves, inHildreth-Wer-ker, V., and Werker, J.C, eds., Cave Conservation and Restoration:Huntsville, National Speleological Society, p. 343–348.
Onorato, R., Denitto, F., and Belmonte, G., 1999, Le grotte marine delSalento: classificazione, localizzazione e descrizione: Thalassia Sale-ntina, v. 23, p. 67–116. doi:10.1285/i15910725v23p67.
Parenzan, P., 1963, Concerning the clayish-slimy formations termed vermi-cular: Cascade Caver, v. 2, no. 7, 8 p.
Parise, M., 2011, Some considerations on the show cave management issuesin southern Italy, in van Beynen, P.E., ed., Karst Management: Dor-drecht, Springer, p. 159–167. doi:10.1007/ 978-94-007-1607-2_7.
Pedrotti, C.C., 2001, Flora dei muschi d’Italia, parte 1: Sphagnopsida,Andreaeopsida e Bryopsida: Rome, Antonio Delfino, 817 p.
Pesce, G.L., 2001, The Zinzulusa Cave: An endangered biodiversity "hotspot" of South Italy: Natura Croatica, v. 10, no. 3, p. 207–212.
Prelli, R., and Boudrie, M., 2001, Les Fougères et Plantes Allieées deFrance et d’Europe Occidentale: Paris, Belin, 429 p.
Russell, M.J., and MacLean, V.L., 2008, Management issues in a Tasma-nian tourist cave: Potential microclimatic impacts of cave modifica-tions: Journal of Environmental Management, v. 87, p. 474–483.doi:10.1016/j.jenvman.2007.01.012.
Saiz-Jimenez, C., Cuezva, S., Jurado, V., Fernandez-Cortes, A., Porca, E.,Benavente, D., Cañaveras, J.C., and Sanchez-Moral, S, 2011, Palaeo-lithic art in peril: Policy and science collide at Altamira Cave: Science,v. 334, p. 42–43. doi:10.1126/science.1206788.
Šebela, S., and Turk, J., 2014, Sustainable use of the Predjama cave (Slove-nia) and possible scenarios related to anticipated major increases intourist numbers: Tourism Management Perspectives, v. 10, p. 37–45.doi:10.1016/j.tmp.2014.01.002.
Sneath, P.H.A., and Sokal, R.R., 1973, Numerical Taxonomy: San Fran-cisco, Freeman, 588 p.
Teramura, A.H., and Sullivan J.H., 1984, Effects of UV-B radia-tion on photosynthesis and growth of terrestrial plants: Photosyn‐thesis Research, v. 39, no. 3, p. 463–473. doi:10.1007/BF00014599.
Toomey, R.S. III, Olson, R.A., Kovar, S., Adams, M., and Ward, R.H.,2009, Relighting Mammoth cave’s New Entrance: Improving visitorexperience, reducing exotic plant growth, and easing maintenance, inWhite, W.B., ed., Proceedings 15th International Congress of Speleol-ogy, Kerrville, Texas: Huntsville, National Speleological Society,vol. 2, p. 1223–1228.
MICROCLIMATE AND MICROBIAL CHARACTERIZATION IN THE ZINZULUSA SHOW CAVE (SOUTH ITALY) AFTER SWITCHING TO LED LIGHTING
144. Journal of Cave and Karst Studies, December 2015