journal of engineering design supporting knowledge...
TRANSCRIPT
PLEASE SCROLL DOWN FOR ARTICLE
This article was downloaded by: [Pennsylvania State University]On: 12 August 2010Access details: Access Details: [subscription number 915425846]Publisher Taylor & FrancisInforma Ltd Registered in England and Wales Registered Number: 1072954 Registered office: Mortimer House, 37-41 Mortimer Street, London W1T 3JH, UK
Journal of Engineering DesignPublication details, including instructions for authors and subscription information:http://www.informaworld.com/smpp/title~content=t713429619
Supporting knowledge exploration and discovery in multi-dimensionaldata with interactive multiscale visualisationXiaolong Zhanga; Tim Simpsonb; Mary Freckerc; George Lesieutred
a College of Information Sciences and Technology, The Pennsylvania State University, University Park,PA, USA b Mechanical and Industrial Engineering, Penn State University, University Park, PA, USA c
Department of Mechanical and Nuclear Engineering, The Pennsylvania State University, UniversityPark, PA, USA d Department of Aerospace Engineering, The Pennsylvania State University, UniversityPark, PA, USA
First published on: 23 June 2010
To cite this Article Zhang, Xiaolong , Simpson, Tim , Frecker, Mary and Lesieutre, George(2010) 'Supporting knowledgeexploration and discovery in multi-dimensional data with interactive multiscale visualisation', Journal of EngineeringDesign,, First published on: 23 June 2010 (iFirst)To link to this Article: DOI: 10.1080/09544828.2010.487260URL: http://dx.doi.org/10.1080/09544828.2010.487260
Full terms and conditions of use: http://www.informaworld.com/terms-and-conditions-of-access.pdf
This article may be used for research, teaching and private study purposes. Any substantial orsystematic reproduction, re-distribution, re-selling, loan or sub-licensing, systematic supply ordistribution in any form to anyone is expressly forbidden.
The publisher does not give any warranty express or implied or make any representation that the contentswill be complete or accurate or up to date. The accuracy of any instructions, formulae and drug dosesshould be independently verified with primary sources. The publisher shall not be liable for any loss,actions, claims, proceedings, demand or costs or damages whatsoever or howsoever caused arising directlyor indirectly in connection with or arising out of the use of this material.
Journal of Engineering DesigniFirst, 2010, 1–25
Supporting knowledge exploration and discovery inmulti-dimensional data with interactive multiscale visualisation
Xiaolong (Luke) Zhanga*, Tim Simpsonb, Mary Freckerc and George Lesieutred
aCollege of Information Sciences and Technology, The Pennsylvania State University, IST Building,University Park, PA 16802 USA; bMechanical and Industrial Engineering, Penn State University, 329
Leonhard Building, University Park, PA 16802, USA; cDepartment of Mechanical and NuclearEngineering, The Pennsylvania State University, University Park, PA, USA; dDepartment of Aerospace
Engineering, The Pennsylvania State University, University Park, PA, USA
(Received 17 August 2008; final version received 19 March 2010 )
Knowledge discovery in multi-dimensional data is a challenging problem in engineering design. For exam-ple, in trade space exploration of large design data sets, designers need to select a subset of data of interestand examine data from different data dimensions and within data clusters at different granularities. Thisexploration is a process that demands both humans, who can heuristically decide what data to explore andhow best to explore it, and computers, which can quickly extract features that may be of interest in the data.Thus, to support this process of knowledge discovery, we need tools that can go beyond traditional computer-oriented optimisation approaches and support advanced designer-centred trade space exploration and datainteraction. This paper is an effort to address this need. In particular, we propose the interactive multiscale-nested clustering and aggregation framework to support trade space exploration of multi-dimensional datacommon to design optimisation. A system prototype of this framework is implemented to allow users tovisually examine large design data sets through interactive data clustering, aggregation, and visualisation.The paper also presents an evaluation study involving morphing wing design using this prototype system.
Keywords: trade space exploration; visualisation; multiscale visualisation; multi-dimensional data;multiscale data; nested clustering and aggregation
1. Introduction
Complex engineered systems such as automobiles, aircraft, and satellites usually consist of mul-tiple, interacting sub-systems and components that are often designed by engineers from a varietyof disciplines. The main challenge when designing such systems lies in resolving the inherenttrade-offs that exist both within and between sub-systems and the overall system.
The design of such complex engineered systems is starting to experience a paradigm shift. Moreand more, designers want to go beyond single point solutions obtained from a fully automatedoptimisation process and explore trade space while ‘shopping’ for the best design that suits theirneeds and meets the customers’ requirements. This paradigm shift from design optimisation todesign exploration is being enabled by recent advances in computing power and speed and novel
*Corresponding author. Email: [email protected]
ISSN 0954-4828 print/ISSN 1466-1837 online© 2010 Taylor & FrancisDOI: 10.1080/09544828.2010.487260http://www.informaworld.com
Downloaded By: [Pennsylvania State University] At: 16:24 12 August 2010
2 X. Zhang et al.
visualisation software; however, designers are encountering new problems such as informationoverload in that they have too many options from which to choose and become overwhelmed, notknowing which design is the best. Trade space here refers to the ‘potential solution space’ (Rosset al. 2004). This space consists of a set of multiple design alternatives, data attributes, or systemparameters that designers can evaluate to satisfy various design objectives (Brantley et al. 2002).
Designers need help in analysing large data sets and generating knowledge from them. Usually,large data sets are multi-dimensional and stored in databases, and designers often choose part ofa data set in certain dimensions and examine their behaviour in other dimensions. One of theprimary challenges in the design of complex engineered systems, such as cars, is to identify inter-esting trends among many design alternatives. Designers explore multiple design alternatives toevaluate the impact of changes in the design parameters (e.g. car size, engine size, the number ofcylinders, etc.) on the performance of the car (e.g. fuel efficiency, torque). To determine the bestdesign(s) among thousands of simulated design alternatives – created by varying these designvariables and storing the corresponding values of the performance variables for each alternative– designers need to compare the performance of each alternative to choose the best design vari-ables. Designers need effective tools for choosing data of interest (often a subset of the wholedata set), selecting the attributes to observe (e.g. engine size, weight in the aforementioned exam-ple), and determining which attributes to cluster during data analysis (e.g. fuel efficiency, torque).Furthermore, designers would benefit greatly from controlling the way in which they comparedesign alternatives, such as evaluating data clusters with different aggregation methods (e.g. mean,median, and sum) and changing the size of clusters. Current data analyses and visualisation toolsin engineering design do not support these diverse needs well. Advanced visualisation techniqueslike the scatter plot matrix (Carr and Nicholson 1985) are largely ad hoc and often overwhelmdesigners with too much information.
To support trade space exploration for multi-dimensional data, we propose an interactivemultiscale-nested clustering and aggregation (iMSNCA) framework in this paper. The novelframework puts design activities in the forefront and emphasises the role of computational toolsin supporting such activities by considering the characteristics of design data. The next sectionreviews relevant literature. Section 3 introduces the framework, and a prototype system is describedin Section 4. An evaluation study involving an aircraft wing design problem is presented inSection 5. Finally, the benefits and limitations of this research are discussed in Section 6.
2. Related work
The research questions we address in this paper are related to trade space exploration in engineer-ing design, scientific and information visualisation, and multi-dimensional and multiscale datainteraction. Each is reviewed in the following sections.
2.1. Visualisation in engineering design
Much of the research in the design of complex engineered systems has focused on novel for-mulations and algorithms for solving optimisation problems (Chen et al. 2000, Deb 2001,Sobieszczanski-Sobieski et al. 2003); approximation methods to reduce the computationalexpense of these analyses (Haftka et al. 1998, Simpson et al. 2001); and computational frame-works to integrate analyses from multiple disciplines (Phoenix Integration 1999, Koch et al.2002). Despite the advances and developments over the past two decades, design optimisationstill has several shortcomings and challenges (Papalambros 2002). Balling (1999) has notedthat the traditional optimisation-based design process of ‘(1) formulate the design problem, (2)
Downloaded By: [Pennsylvania State University] At: 16:24 12 August 2010
Journal of Engineering Design 3
obtain/develop analysis models, and (3) execute an optimisation algorithm’ often left designersunsatisfied with their results because the problem is usually improperly formulated: ‘the objectivesand constraints used in optimisation were not what the owners and stakeholders really wanted. . . in many cases, people don’t know what they really want until they see some designs’. Similarfindings have occurred in other fields. For instance, Shanteau (1992) observed that when peopleare dissatisfied with the results of a rational decision-making process, they often change theirratings to make it come out the way they want. Wilson and Schooler (1991) have shown thatpeople do worse at some decision tasks when asked to analyse the reasons for their preferencesor to evaluate all the attributed of their choices.
Consequently, there is an emerging paradigm of design exploration whereby designers ‘shop’for the best solution using visualisation tools instead of relying solely on optimisation. This designby shopping process, introduced by Balling (1999), allows designers to explore the design spacefirst and then choose an optimal solution from a set of possible designs after ‘forming realisticexpectations of what is possible’. This approach can be classified as an a posterior articulation ofpreferences to solve a multi-objective optimisation (Hwang and Masud 1979) in that designers firstform their preferences based on visualisation of the entire design space and then choose an optimaldesign that is based on their formed preference. The basic steps to such an approach include (1)creating a simulation model to analyse the system being designed, (2) generating thousands ofsimulated design alternatives by varying design variables and storing the corresponding values ofthe performance variables for each alternative, and (3) using visualisation tools to explore thesedesign alternatives and ‘shop’ for the best design (Stump et al. 2003, 2004).
To date, trade space exploration has focused primarily on developing virtual environments andvisualisation tools to support such an approach. For instance, spherical mechanism design has ben-efited greatly from virtual reality advancements (Evans et al. 1999, Furlong et al. 1999, Kihonge etal. 2002), as have large-scale manufacturing simulations (Kesavadas and Sudhir 2000, Kelsick etal. 2003). Several researchers have also looked at effective interface development for virtual envi-ronments (Mulder et al. 1998, Volkov and Vance 2001, Balijepalli and Kesavadas 2004). Virtualreality has supported a wide variety of engineering design problems (Jayaram et al. 2001); how-ever, such environments tend not to support trade space exploration since they are used to visualisea single point solution, not explore the entire trade space. Cloud visualisation (Eddy and Lewis2002), the visual design steering methods (Winer and Bloebaum 2001, Winer and Bloebaum,2002a, 2002b), the ATSV system (Stump et al. 2003, 2004), and the U.S. Naval Research Lab-oratory’s visual steering methods in their Virtual Reality Lab and High Performance ComputingCenter (Smith et al. 1999) are exceptions to this, but these methods are used in an ad hoc manner tosupport design decision-making – none of the research in engineering design has investigated theknowledge discovery process during trade space exploration or formalised systematic proceduresto support it. Meanwhile, efforts to simplify the visualisation of n-dimensional Pareto frontiers(Agrawal et al. 2004) and group uncertainty-related data into ‘bricks’(Kanukolanu et al. 2006) pro-vide good intentioned, yet still ad hoc, solutions to the problem of overwhelming designers with toomuch information as they are put ‘back in the loop’ as part of the trade space exploration process.
2.2. Scientific and information visualisation
Research on using visualisation to facilitate information and knowledge processing has advancedgreatly in the past two decades. Card et al. (1999) classify visualisation techniques into twocategories – scientific visualisation and information visualisation – based on the nature of the databeing visualised. Scientific visualisation usually deals with physical data. In scientific visualisationprojects, such as flow vector visualisation (Shahnawaz et al. 1999, Wasfy and Wasfy 2003, Laidlawet al. 2005), the spatial relationship of physical objects is accurately mapped (often re-scaled to fit
Downloaded By: [Pennsylvania State University] At: 16:24 12 August 2010
4 X. Zhang et al.
the screen) into that of visual components so that scientific phenomena can be accurately measuredand clarified. Information visualisation extends beyond physical data and usually focuses onhelping people analyse and make sense of more abstract phenomena. For example, Card et al.(1991) proposed a 3D-based visualisation technique for information visualisation where the 3Dspace is used to expand people’s information workspace and reduce the cognitive costs in dealingwith complex data, rather than just as a habitat to show 3D data.
Information visualisation also provides a means for exploratory analysis (Nagel 2006). Whilescientific visualisation emphasises confirmatory analysis (i.e. confirm or reject hypotheses), infor-mation visualisation can also help people identify new hypotheses through cognitive amplificationand user-centred interactive designs (Card et al. 1999). Cognitively, information visualisation ben-efits users by increasing available spatial (e.g. large workspace) and cognitive resources (e.g. lessdemand for information recall mentally), improving searching processes (e.g. colour-coded visualsearch), enhancing pattern recognition (e.g. visual icons), etc. Interactively, information visuali-sation allows users to manipulate the data transformation from raw data (e.g. direct manipulation),control the mapping between data and visual forms (e.g. hierarchical visualisation as discussedlater), and modify the views on visual forms (e.g. zooming). Cognitive amplification and flex-ible interaction facilitate a knowledge crystallisation process that provides ‘the most compactdescription possible’ of complicated data and information (Card et al. 1999).
Making sense of large data sets often involves creating structures and putting data into struc-tures (Russell et al. 1993), and this ‘sense-making’ process is often a critical component in theknowledge crystallisation process. The famous ‘knowledge hierarchy’ of Lucky (1989) arguesthat knowledge is built upon information, which is in turn built upon data. In this sense, knowl-edge is the result of aggregating information, and knowledge discovery arises from organisingfragmental information into structured knowledge schemas. However, finding appropriate struc-tures to organise available information is a complicated yet cognitively costly process, becausepossible structures must be mentally searched and modified to fit all information of interest. Suchsearching and fitting activities are conceptual and involve an analysis of the attributes of bothknowledge structures and information pieces. To reduce the cognitive costs of ‘sense-making’,researchers have proposed a variety of structures for organising information (Qu and Furnas 2005).Among these structures, hierarchies are frequently used to organise information and knowledge:they provide semantic descriptions with different levels of detail and allow users to navigatethrough the different levels with context and content as needed. Techniques for visualising hierar-chies include treemaps (Shneiderman 1992), Cone Trees (Robertson et al. 1991), and hyperbolicviews (Lamping and Rao 1994), which use nested boxes, 3D space and interactive animation, andhyperbolic representations, respectively.
Although information visualisation is regarded as a means to crystallise knowledge,visualisation-based methods to support knowledge discovery in engineering design are not wellunderstood. Among the extensive literature on information visualisation, we are particularly inter-ested in research on multi-dimensional and multiscale data visualisation because design data forcomplex engineered systems is usually multi-dimensional and designers often need to examinedata at different levels of analysis when designing different sub-systems.
It should be pointed out that data visualisation is a broad topic that has been researched byscientists from many disciplines. For example, researchers in statistics also have developed pow-erful tools to assist the analysis of multi-dimensional data (Unwin et al. 2006, Cook and Swayne2007). However, these tools are often built upon specialised statistics software packages (e.g.R), making it impractical to integrate them into general-purpose, stand-alone visualisation sys-tems. Also, the focus of such tools is on visualising general statistical characteristics of large datasets and need to be further enhanced to support trade space exploration, which often concernsboth general data distributions of data at a global level and potential data anomalies at locallevels.
Downloaded By: [Pennsylvania State University] At: 16:24 12 August 2010
Journal of Engineering Design 5
2.3. Multi-dimensional and multiscale data interaction
Extensive research has been done in visualising multi-dimensional data.Although these techniquesare not targeted at in-depth analysis, such as quantitatively comparing a few dimensions, theirfocus on visualising overall relationships does serve as the entry point to understanding of multi-dimensional data. Parallel coordinates (Inselberg 1985) represent individual dimensions as parallellines and plot a multi-dimensional record as a poly-line across parallel coordinates, revealingcross-dimension patterns and trends. There are also some variations derived from this technique(Hoffman et al. 1999) by positioning individual dimensions in different ways. These techniquesare effective to present overall trends, but lack detailed descriptions of between-dimension rela-tionships and aggregated information of individual dimensions. Scatter plot matrices (Carr andNicholson 1985) use a matrix to organise scatter plots between each pair of dimensions andhelp users quickly grasp the overall trends and relationships between each pair of dimensionsand then pick those of interest. Recently, this technique was improved by the rank-by-feature(Seo and Shneiderman 2005) method, which colour-codes the matrix cells based on the magni-tude of correlation between each pair of dimensions. However, these techniques largely focus onbetween-dimension relationships, and they do not provide sufficient support for detailed analy-sis within dimensions of interest. The Table Lens technique (Rao and Card 1995) uses a simple2D table to hold data for in-depth, within-dimensional data analysis, but the tools are largelyabout ranking and sorting data, which are not sufficient for engineering design. Recently, somecommercial software packages (e.g. http://www.tableausoftware.com/, http://www. ilog.com, andhttp://www.grantadesign.com/products/ces/) provide comprehensive tools for multi-dimensionaldata visualisation. However, their support for in-depth data analysis within the same dimen-sion is insufficient to enable designers to examine how designs may vary at different levels ofanalysis.
Multiscale user interfaces, also called zoomable user interfaces, allows users to control thelevels of detail in visualising and interacting with large data sets. Benefits of multiscale toolsinclude helping users obtain desired context and content information and showing importantcharacteristics of data at various scales at the same workspace (Perlin and Fox 1993, Furnas andBederson 1995, Bederson et al. 1996). However, most systems that use multiscale tools, such asPhotoMesa (Bederson 2001), are targeted at data sets that are already hierarchically structured.Few designs can support interaction with raw data sets that do not have hierarchical structures orare not structured at all.
Semantic zooming is a powerful tool in multiscale user interfaces for visualising differentdata properties across scales. For example, with semantic zooming, designers can examine whatfactors affect the characteristics of a new material by seeing features from the atomic level (e.g.the strength of atomic bonds) to the microscopic level (e.g. the tangle of molecules) and to themacroscopic level (e.g. mechanical stress). However, how to generate semantic representationsacross scales is still a challenge. Some efforts have been made to interactively construct semanticrepresentations for a small set of objects (Furnas and Zhang 1998), but it is still difficult to dealwith large data sets with thousands or even millions of data records.
Another stream of relevant research is multi-facet information visualisation and navigation.Originating from the area of library science, a facet refers to an aspect in which information isorganised (Hearst 2006) and can be regarded as equivalent to dimension, but with different focus.While dimension tends to be used to describe the intrinsic aspect of data, facet emphasises theperspective of people’s understanding of data. Often, dimension and facet are inter-exchangeable(Hearst 2006), but in some situations, such as visualising unstructured data, data dimension maybe difficult to identify, but data facets can be generated with the help of tools like data mining.Designs have been explored to combine different data and visual facets in support of informationsearch and knowledge visualisation (Hearst 2006, Dachselt et al. 2008). Usability studies have
Downloaded By: [Pennsylvania State University] At: 16:24 12 August 2010
6 X. Zhang et al.
shown that multiscale faceted designs are effective in assisting navigation in large informationspace (Dachselt and Frisch 2007). It has also been found that facet-based visualisation toolsneed to provide users with accurate and appropriate facet descriptions in support of informationexploration (Hearst 2009). This finding echoes an argument on effective view navigation (Furnas1997), which suggests that visual information should be sufficient for users to see where to goand at the same time should be succinct to avoid making views cluttered. This issue is evenmore challenging in dealing with multi-dimensional engineering data, because unlike data setsin these facet-based visualisation tools, which usually already have had pre-defined hierarchicalfacet structures, multi-dimensional engineering data usually do not have finer structures withinindividual data dimensions to describe the characteristics of possible data clusters.
In summary, while visually guided knowledge exploration in complex data becomes increas-ingly important, existing research has not sufficiently addressed the user needs concerningmultiscale data clustering of multi-dimensional data.
3. The iMSNCA framework
The iMSNCA framework is an effort to address this issue. This framework has been developedbased on our rich experiences in developing visualisation-based knowledge exploration systems(Stump et al. 2003, 2004, Zhang et al. 2008, Wu et al. 2009) and our observations of the design ofcomplex engineering systems (e.g. car, airplane) that involve extensive use of simulation-baseddesign and struggle with visualising the results.
3.1. Framework development
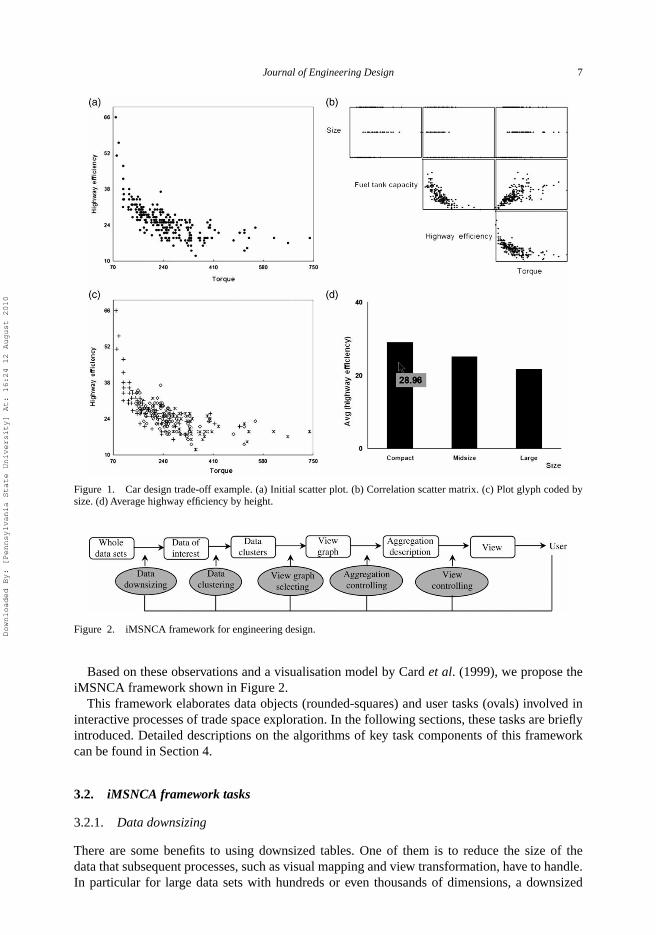
When designers visualise large data sets, one of the primary goals is to identify interesting trendsamong thousands, if not millions, of design alternatives. For vehicle design, for instance, we maybe interested in understanding how car size, car type, engine size, etc., affect vehicle performancecharacteristics such as torque, fuel efficiency, weight, etc. Designers might also want to knowhow these performance characteristics are correlated; so, a designer might, for instance, constructa scatter plot of available design alternatives to see how torque and highway efficiency are related(Figure 1(a)). From this figure, the designer might see that the points tend to concentrate in themiddle torque region, and a savvy designer might want to explore the data more to identify howthis relates to the size of the car (i.e. compact, mid-size, large). After viewing the scatter matrixin Figure 1(b), the values can be grouped by size and groups can be represented by differentglyphs to create Figure 1(c), which provides valuable insight among three groups: designs in asize group with lower torques (represented by ‘+’) lead to better results than those in other twosize groups with higher torques. The designer can review these three size groups in more detailby comparing the average highway efficiency for each group as seen in Figure 1(d). During theexploration, the designer can change the viewing scale of any graph at any time to see generalpatterns or detailed data.
This example exploration process demonstrates several major tasks in the trade space explo-ration process. First, the designer selects three dimensions (highway efficiency, torque, and size)out of those available data dimensions and then clusters the data based on the dimension(s) ofinterest (car size in this case). Next, the designer uses different graph types, a scatter plot and ahistogram in this case, to compare data clusters of interest. Some graph types (e.g. histogram)show the aggregate descriptions of data clusters, while some (e.g. scatter plot) do not. Finally, thedesigner explores design alternatives at different levels of analysis by manipulating the viewingscale of the graphs (e.g. zooming out on the scatter matrix to browse the overall pattern or zoomingin the matrix to examine the relationship between any two dimensions).
Downloaded By: [Pennsylvania State University] At: 16:24 12 August 2010
Journal of Engineering Design 7
Figure 1. Car design trade-off example. (a) Initial scatter plot. (b) Correlation scatter matrix. (c) Plot glyph coded bysize. (d) Average highway efficiency by height.
Figure 2. iMSNCA framework for engineering design.
Based on these observations and a visualisation model by Card et al. (1999), we propose theiMSNCA framework shown in Figure 2.
This framework elaborates data objects (rounded-squares) and user tasks (ovals) involved ininteractive processes of trade space exploration. In the following sections, these tasks are brieflyintroduced. Detailed descriptions on the algorithms of key task components of this frameworkcan be found in Section 4.
3.2. iMSNCA framework tasks
3.2.1. Data downsizing
There are some benefits to using downsized tables. One of them is to reduce the size of thedata that subsequent processes, such as visual mapping and view transformation, have to handle.In particular for large data sets with hundreds or even thousands of dimensions, a downsized
Downloaded By: [Pennsylvania State University] At: 16:24 12 August 2010
8 X. Zhang et al.
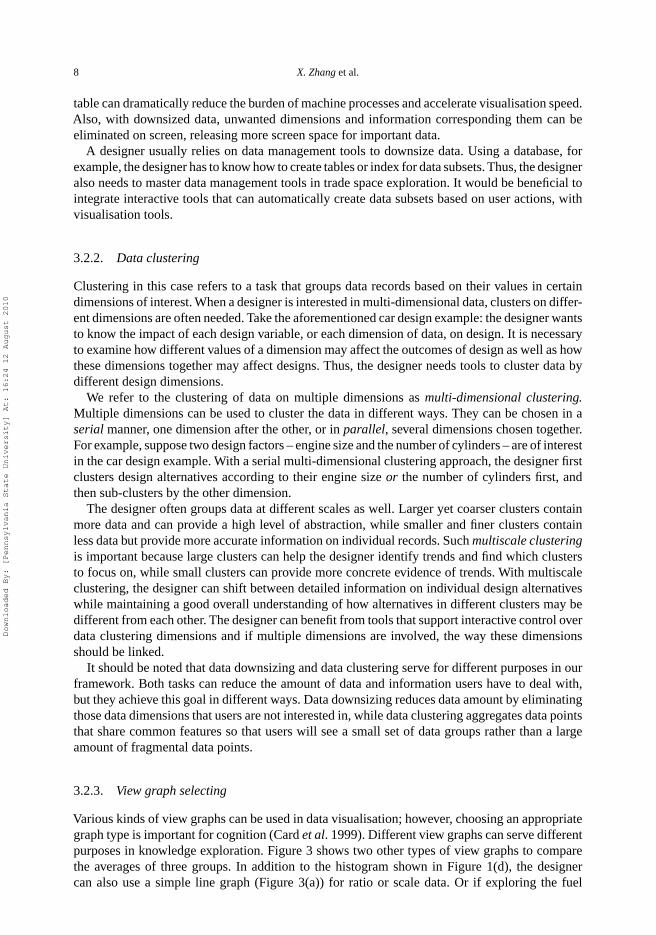
table can dramatically reduce the burden of machine processes and accelerate visualisation speed.Also, with downsized data, unwanted dimensions and information corresponding them can beeliminated on screen, releasing more screen space for important data.
A designer usually relies on data management tools to downsize data. Using a database, forexample, the designer has to know how to create tables or index for data subsets. Thus, the designeralso needs to master data management tools in trade space exploration. It would be beneficial tointegrate interactive tools that can automatically create data subsets based on user actions, withvisualisation tools.
3.2.2. Data clustering
Clustering in this case refers to a task that groups data records based on their values in certaindimensions of interest. When a designer is interested in multi-dimensional data, clusters on differ-ent dimensions are often needed. Take the aforementioned car design example: the designer wantsto know the impact of each design variable, or each dimension of data, on design. It is necessaryto examine how different values of a dimension may affect the outcomes of design as well as howthese dimensions together may affect designs. Thus, the designer needs tools to cluster data bydifferent design dimensions.
We refer to the clustering of data on multiple dimensions as multi-dimensional clustering.Multiple dimensions can be used to cluster the data in different ways. They can be chosen in aserial manner, one dimension after the other, or in parallel, several dimensions chosen together.For example, suppose two design factors – engine size and the number of cylinders – are of interestin the car design example. With a serial multi-dimensional clustering approach, the designer firstclusters design alternatives according to their engine size or the number of cylinders first, andthen sub-clusters by the other dimension.
The designer often groups data at different scales as well. Larger yet coarser clusters containmore data and can provide a high level of abstraction, while smaller and finer clusters containless data but provide more accurate information on individual records. Such multiscale clusteringis important because large clusters can help the designer identify trends and find which clustersto focus on, while small clusters can provide more concrete evidence of trends. With multiscaleclustering, the designer can shift between detailed information on individual design alternativeswhile maintaining a good overall understanding of how alternatives in different clusters may bedifferent from each other. The designer can benefit from tools that support interactive control overdata clustering dimensions and if multiple dimensions are involved, the way these dimensionsshould be linked.
It should be noted that data downsizing and data clustering serve for different purposes in ourframework. Both tasks can reduce the amount of data and information users have to deal with,but they achieve this goal in different ways. Data downsizing reduces data amount by eliminatingthose data dimensions that users are not interested in, while data clustering aggregates data pointsthat share common features so that users will see a small set of data groups rather than a largeamount of fragmental data points.
3.2.3. View graph selecting
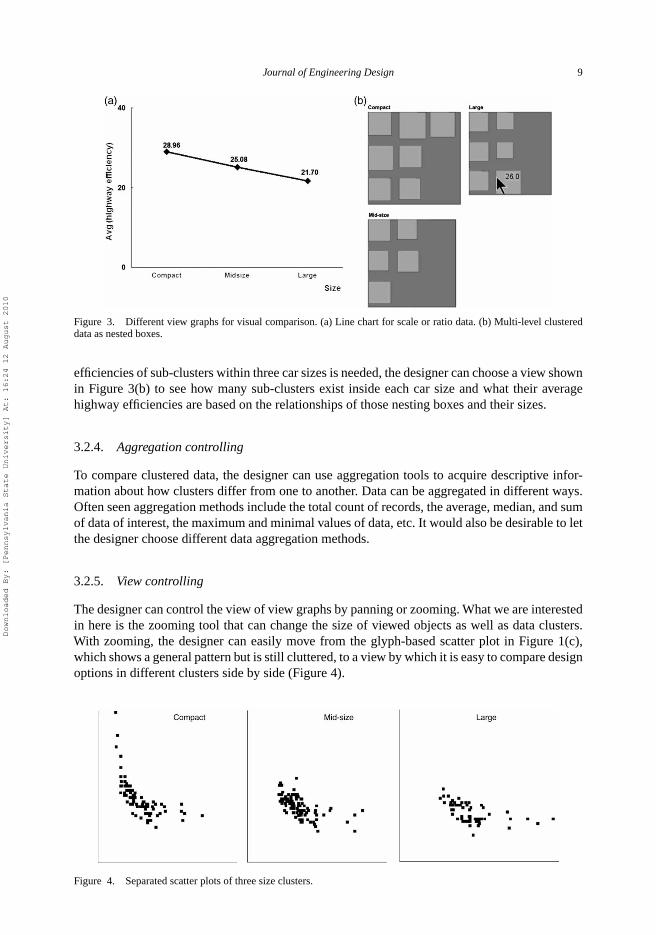
Various kinds of view graphs can be used in data visualisation; however, choosing an appropriategraph type is important for cognition (Card et al. 1999). Different view graphs can serve differentpurposes in knowledge exploration. Figure 3 shows two other types of view graphs to comparethe averages of three groups. In addition to the histogram shown in Figure 1(d), the designercan also use a simple line graph (Figure 3(a)) for ratio or scale data. Or if exploring the fuel
Downloaded By: [Pennsylvania State University] At: 16:24 12 August 2010
Journal of Engineering Design 9
Figure 3. Different view graphs for visual comparison. (a) Line chart for scale or ratio data. (b) Multi-level clustereddata as nested boxes.
efficiencies of sub-clusters within three car sizes is needed, the designer can choose a view shownin Figure 3(b) to see how many sub-clusters exist inside each car size and what their averagehighway efficiencies are based on the relationships of those nesting boxes and their sizes.
3.2.4. Aggregation controlling
To compare clustered data, the designer can use aggregation tools to acquire descriptive infor-mation about how clusters differ from one to another. Data can be aggregated in different ways.Often seen aggregation methods include the total count of records, the average, median, and sumof data of interest, the maximum and minimal values of data, etc. It would also be desirable to letthe designer choose different data aggregation methods.
3.2.5. View controlling
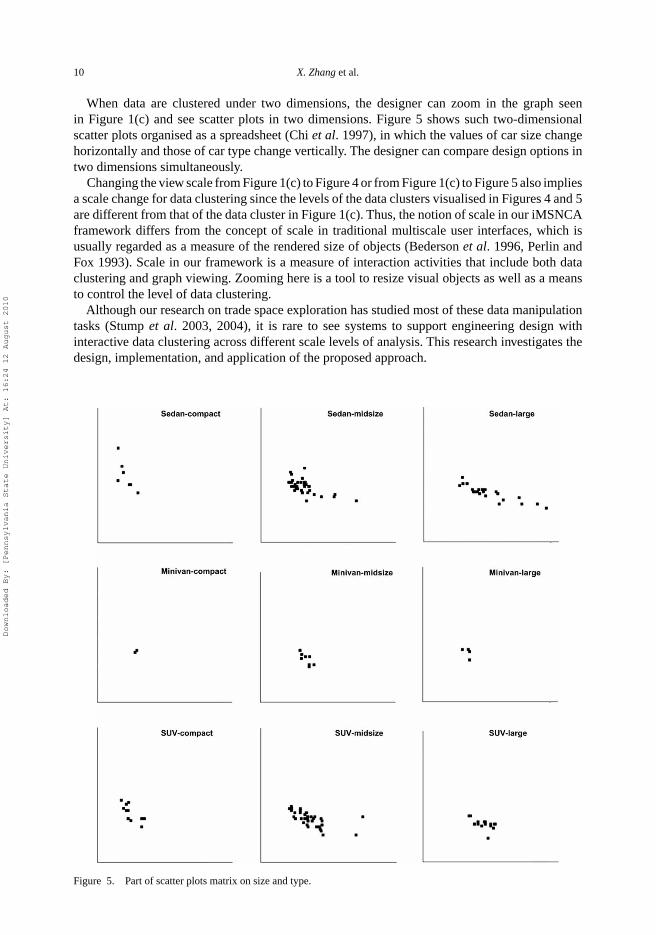
The designer can control the view of view graphs by panning or zooming. What we are interestedin here is the zooming tool that can change the size of viewed objects as well as data clusters.With zooming, the designer can easily move from the glyph-based scatter plot in Figure 1(c),which shows a general pattern but is still cluttered, to a view by which it is easy to compare designoptions in different clusters side by side (Figure 4).
Figure 4. Separated scatter plots of three size clusters.
Downloaded By: [Pennsylvania State University] At: 16:24 12 August 2010
10 X. Zhang et al.
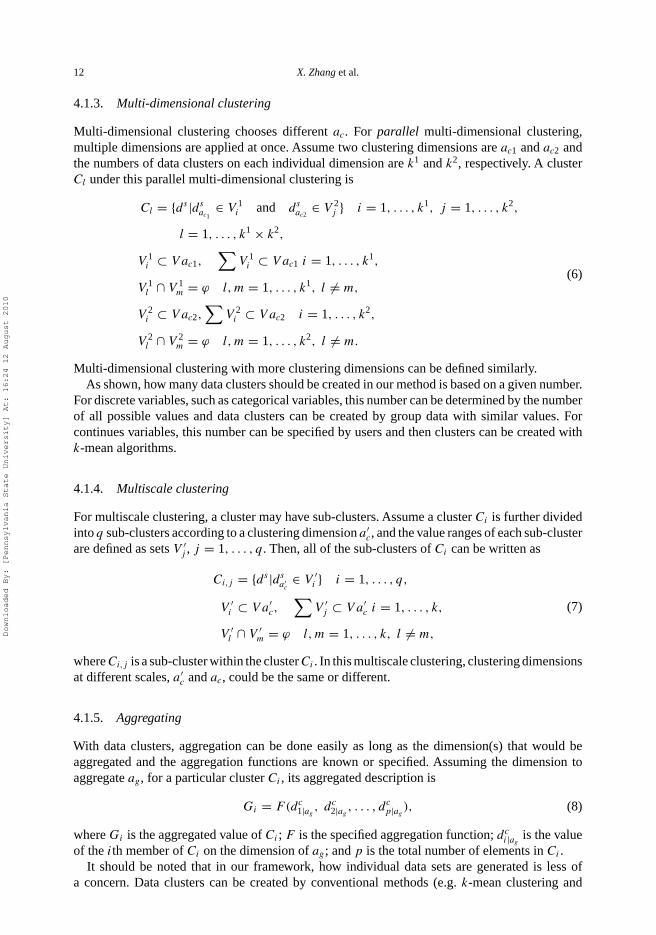
When data are clustered under two dimensions, the designer can zoom in the graph seenin Figure 1(c) and see scatter plots in two dimensions. Figure 5 shows such two-dimensionalscatter plots organised as a spreadsheet (Chi et al. 1997), in which the values of car size changehorizontally and those of car type change vertically. The designer can compare design options intwo dimensions simultaneously.
Changing the view scale from Figure 1(c) to Figure 4 or from Figure 1(c) to Figure 5 also impliesa scale change for data clustering since the levels of the data clusters visualised in Figures 4 and 5are different from that of the data cluster in Figure 1(c). Thus, the notion of scale in our iMSNCAframework differs from the concept of scale in traditional multiscale user interfaces, which isusually regarded as a measure of the rendered size of objects (Bederson et al. 1996, Perlin andFox 1993). Scale in our framework is a measure of interaction activities that include both dataclustering and graph viewing. Zooming here is a tool to resize visual objects as well as a meansto control the level of data clustering.
Although our research on trade space exploration has studied most of these data manipulationtasks (Stump et al. 2003, 2004), it is rare to see systems to support engineering design withinteractive data clustering across different scale levels of analysis. This research investigates thedesign, implementation, and application of the proposed approach.
Figure 5. Part of scatter plots matrix on size and type.
Downloaded By: [Pennsylvania State University] At: 16:24 12 August 2010

Journal of Engineering Design 11
4. Prototype design and implementation
To test the proposed framework, a prototype system is developed. In this section, we introducethe analytical forms of data downsizing, clustering, and aggregating and describe the design andimplementation of the system. Analytic forms are developed to provide a formal definition fordownsizing, clustering, and aggregating tasks and to guide their implementation.
4.1. Analytic forms for data transform
Let us define a raw data set D with n-dimensions:
A = {a1, a2, . . . , an}, (1)
where A is the set of all dimensions; ai is one dimension; and n is the total number of dimensions.Any data record in the data set is
d = (da1, da2, . . . , dan), (2)
where dai is the value of the record on the ai dimension.Then, the data set can be written as
D = {d1, d2, . . . , dm}, (3)
where di is one record and m is the total number of records.
4.1.1. Downsizing
Downsizing is a task to generate a subset, Ds , out of D. Ds is written as
As = {asi |as
i ∈ A, i = 1, 2, . . . , k}ds = (das
1, das2, . . . , das
k)
Ds = {ds1, d
s2, . . . , d
sk },
(4)
where As is the set of all dimension chosen for a data table; asi is its member; k is the total number
of its members; ds is a data record of the subset Ds ; and dasi is its value on the as
i dimension.
4.1.2. Clustering
Assume all possible values of a dimension ai make up a set, Vai . k clusters can be created on thedimension, and the value ranges of each cluster are defined as sets Vi , i = 1 . . . k.
Assume ac is the clustering dimension. Then, a cluster is
Ci = {ds |dsac ∈ Vi}i = 1, . . . , k,
Vi ⊂ V ac, �Vi ⊂ Vac i = 1, . . . , k,
Vl ∩ Vm = φl, m = 1, . . . , k, l �= m,
(5)
where Ci is a cluster.
Downloaded By: [Pennsylvania State University] At: 16:24 12 August 2010
12 X. Zhang et al.
4.1.3. Multi-dimensional clustering
Multi-dimensional clustering chooses different ac. For parallel multi-dimensional clustering,multiple dimensions are applied at once. Assume two clustering dimensions are ac1 and ac2 andthe numbers of data clusters on each individual dimension are k1 and k2, respectively. A clusterCl under this parallel multi-dimensional clustering is
Cl = {ds |dsac1
∈ V 1i and ds
ac2∈ V 2
j } i = 1, . . . , k1, j = 1, . . . , k2,
l = 1, . . . , k1 × k2,
V 1i ⊂ V ac1,
∑V 1
i ⊂ V ac1 i = 1, . . . , k1,
V 1l ∩ V 1
m = ϕ l, m = 1, . . . , k1, l �= m,
V 2i ⊂ V ac2,
∑V 2
i ⊂ V ac2 i = 1, . . . , k2,
V 2l ∩ V 2
m = ϕ l, m = 1, . . . , k2, l �= m.
(6)
Multi-dimensional clustering with more clustering dimensions can be defined similarly.As shown, how many data clusters should be created in our method is based on a given number.
For discrete variables, such as categorical variables, this number can be determined by the numberof all possible values and data clusters can be created by group data with similar values. Forcontinues variables, this number can be specified by users and then clusters can be created withk-mean algorithms.
4.1.4. Multiscale clustering
For multiscale clustering, a cluster may have sub-clusters. Assume a cluster Ci is further dividedinto q sub-clusters according to a clustering dimension a′
c, and the value ranges of each sub-clusterare defined as sets V ′
j , j = 1, . . . , q. Then, all of the sub-clusters of Ci can be written as
Ci,j = {ds |dsa′
c∈ V ′
i } i = 1, . . . , q,
V ′i ⊂ V a′
c,∑
V ′j ⊂ V a′
c i = 1, . . . , k,
V ′l ∩ V ′
m = ϕ l, m = 1, . . . , k, l �= m,
(7)
where Ci,j is a sub-cluster within the cluster Ci . In this multiscale clustering, clustering dimensionsat different scales, a′
c and ac, could be the same or different.
4.1.5. Aggregating
With data clusters, aggregation can be done easily as long as the dimension(s) that would beaggregated and the aggregation functions are known or specified. Assuming the dimension toaggregate ag , for a particular cluster Ci , its aggregated description is
Gi = F(dc1|ag
, dc2|ag
, . . . , dcp|ag
), (8)
where Gi is the aggregated value of Ci ; F is the specified aggregation function; dci|ag
is the valueof the ith member of Ci on the dimension of ag; and p is the total number of elements in Ci .
It should be noted that in our framework, how individual data sets are generated is less ofa concern. Data clusters can be created by conventional methods (e.g. k-mean clustering and
Downloaded By: [Pennsylvania State University] At: 16:24 12 August 2010

Journal of Engineering Design 13
hierarchical clustering), database queries (e.g. using aggregation functions to create data groups),or other advanced statistic approaches. What really matters here is the capability that designersneed to interact with a clustering method in determining what data dimension should be chosen tocluster data, what different scales should be applied in clustering, and how to aggregate clustereddata. In this sense, the clustering concept we discuss here emphasises interactive data clusteringthat involves both raw data and user interests in data analysis. Massive research has been done ondata clustering algorithms, but little attention has been given to user interaction with such clusteringmethods. The focus on this framework is on integrating the user factor with advanced data analysismethods in knowledge discovery, rather than on the development of clustering methods.
4.2. User interface design
Figure 6 shows the overall user interface of the prototype system after a designer provides infor-mation about the database and table where the data of interest are stored. The user interface haseight panels. Panels 1–4 are for data control. When raw data is ported into the system, the namesof all data dimensions are displayed in Panels 1 and 3 for the designer to choose what dimensionsto observe (Panel 1) and to what dimensions data are clustered (Panel 3). In Panel 2, the designercan choose aggregation methods (e.g. simple count, average, sum). Panel 4 allows the designerto choose data filtering.
Panels 5–7 are for results display and interactive view control. Panel 5 shows view graphs andallows the designer to zoom and pan workspace as well as to choose different graphs. Panel 6 isa scale canvas that shows the viewing scale and allows the designer to manipulate the clusteringorder when multiple clustering dimensions are involved, of which we will provide more detailslater. Panel 7 displays the data results in text corresponding different analysis operations.
4.2.1. Choosing dimensions to observe and aggregate
The designer can choose one or two dimensions to observe simultaneously. When two dimensionsare selected, a scatter plot is generated and displayed in the primary view, as shown in Figure 6.When the designer chooses one dimension to observe and another dimension to cluster, visuali-sation results show different clusters and their aggregated values. Based on the data from the car
Figure 6. User interface of the prototype system.
Downloaded By: [Pennsylvania State University] At: 16:24 12 August 2010

14 X. Zhang et al.
Figure 7. Example of four clusters based on different observing and clustering dimensions.
design example, Figure 7 shows a view with torque as the dimension to observe and the numberof cylinders as the clustering dimension. The seven boxes indicate seven clusters and box sizecorresponds to the aggregation result, which is the average torque, of each cluster. It is easy tocompare different clusters based on the box sizes.
4.2.2. Choosing multiple clustering dimensions
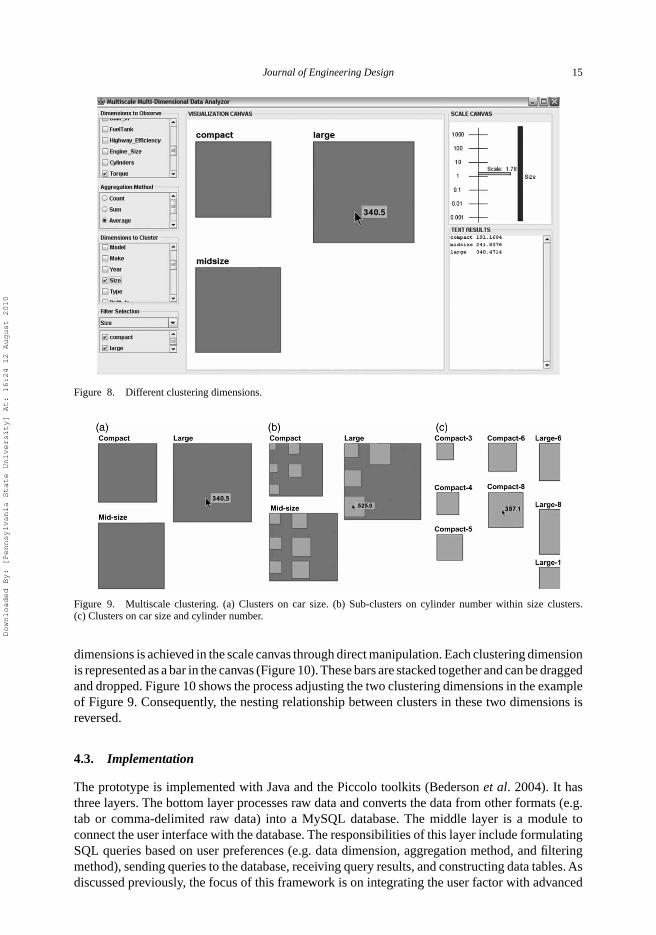
The designer can also choose different dimensions to observe the same data set. Differentdimensions can be observed either independently or combined simultaneously. Keeping multipledimensions independently, the designer can switch from one clustering dimension to another.Figure 8 is a view under the same aggregation method as in Figure 7, but with a different cluster-ing dimension (car size here). As seen, different clusters are produced under different clusteringdimensions.
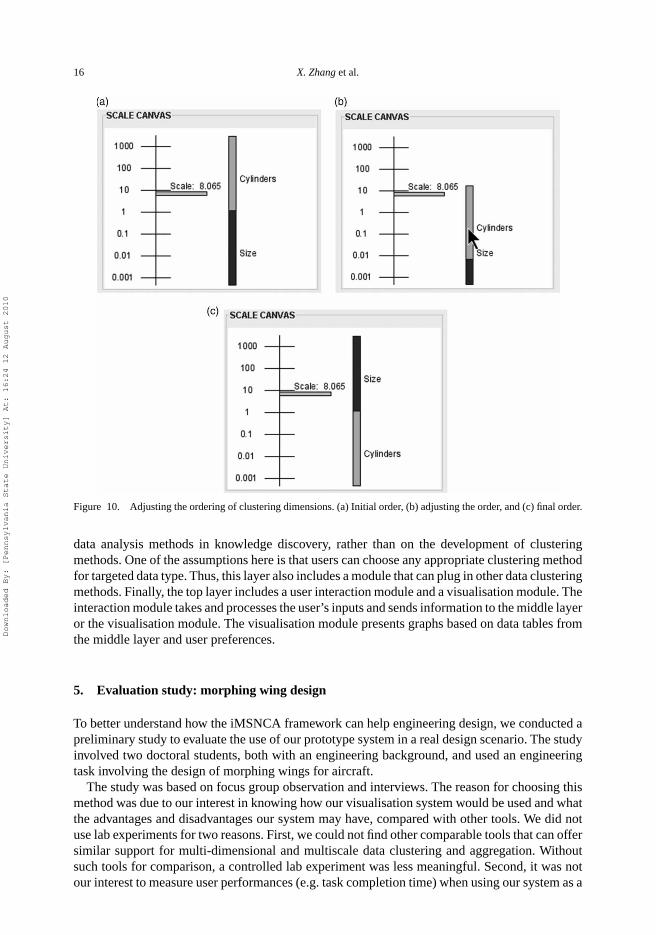
Combining different clustering dimensions together creates multiscale and multi-dimensionalclustering. Figure 9 shows the view results of choosing both car size and the number of cylindersas clustering dimensions. Figure 9(a) is the clustering result under car size only. Zooming in, thedesigner sees each size cluster has several sub-clusters on the number of cylinders (Figure 9(b)).Zooming in further, the designer finds details of individual clusters on car size and the numberof cylinders (Figure 9(c)). The nesting boxes show the relationship between these two clusteringdimensions and provide contextual information about individual clusters and their parent or childclusters. The transition from Figure 9(a) to (c) is continuous and smooth through semantic zooming(Furnas and Bederson 1995, Bederson et al. 1996).
4.2.3. Control multiple clustering dimensions
The designer can manipulate the ordering of the dimensions for clustering when multiple clusteringdimensions are involved (e.g. cylinder number clusters within car size clusters or vice versa).Controlling the ordering allows exploring data from various aspects. The ordering of clustering
Downloaded By: [Pennsylvania State University] At: 16:24 12 August 2010
Journal of Engineering Design 15
Figure 8. Different clustering dimensions.
Figure 9. Multiscale clustering. (a) Clusters on car size. (b) Sub-clusters on cylinder number within size clusters.(c) Clusters on car size and cylinder number.
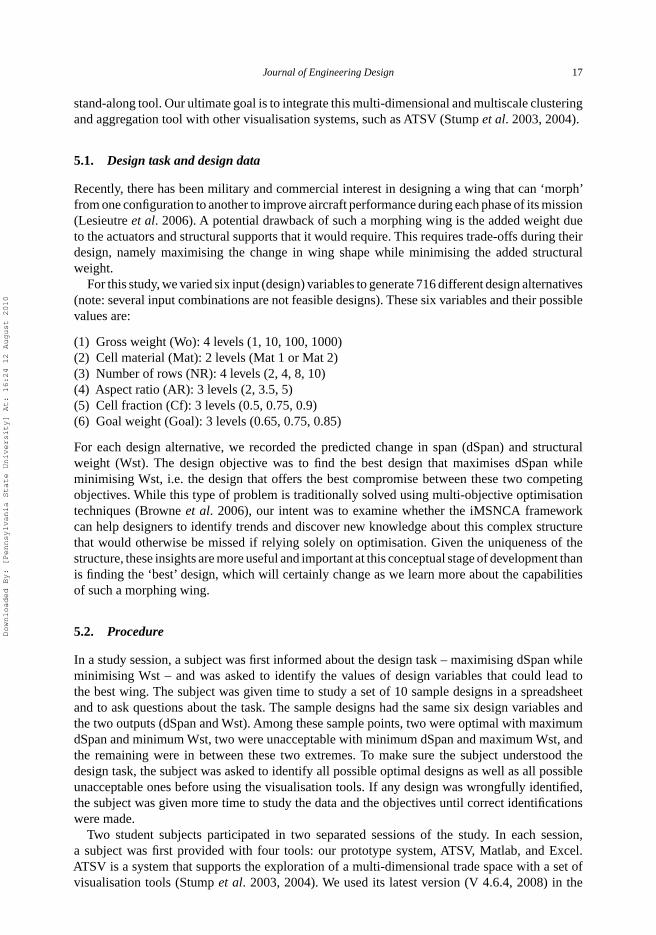
dimensions is achieved in the scale canvas through direct manipulation. Each clustering dimensionis represented as a bar in the canvas (Figure 10). These bars are stacked together and can be draggedand dropped. Figure 10 shows the process adjusting the two clustering dimensions in the exampleof Figure 9. Consequently, the nesting relationship between clusters in these two dimensions isreversed.
4.3. Implementation
The prototype is implemented with Java and the Piccolo toolkits (Bederson et al. 2004). It hasthree layers. The bottom layer processes raw data and converts the data from other formats (e.g.tab or comma-delimited raw data) into a MySQL database. The middle layer is a module toconnect the user interface with the database. The responsibilities of this layer include formulatingSQL queries based on user preferences (e.g. data dimension, aggregation method, and filteringmethod), sending queries to the database, receiving query results, and constructing data tables. Asdiscussed previously, the focus of this framework is on integrating the user factor with advanced
Downloaded By: [Pennsylvania State University] At: 16:24 12 August 2010
16 X. Zhang et al.
Figure 10. Adjusting the ordering of clustering dimensions. (a) Initial order, (b) adjusting the order, and (c) final order.
data analysis methods in knowledge discovery, rather than on the development of clusteringmethods. One of the assumptions here is that users can choose any appropriate clustering methodfor targeted data type. Thus, this layer also includes a module that can plug in other data clusteringmethods. Finally, the top layer includes a user interaction module and a visualisation module. Theinteraction module takes and processes the user’s inputs and sends information to the middle layeror the visualisation module. The visualisation module presents graphs based on data tables fromthe middle layer and user preferences.
5. Evaluation study: morphing wing design
To better understand how the iMSNCA framework can help engineering design, we conducted apreliminary study to evaluate the use of our prototype system in a real design scenario. The studyinvolved two doctoral students, both with an engineering background, and used an engineeringtask involving the design of morphing wings for aircraft.
The study was based on focus group observation and interviews. The reason for choosing thismethod was due to our interest in knowing how our visualisation system would be used and whatthe advantages and disadvantages our system may have, compared with other tools. We did notuse lab experiments for two reasons. First, we could not find other comparable tools that can offersimilar support for multi-dimensional and multiscale data clustering and aggregation. Withoutsuch tools for comparison, a controlled lab experiment was less meaningful. Second, it was notour interest to measure user performances (e.g. task completion time) when using our system as a
Downloaded By: [Pennsylvania State University] At: 16:24 12 August 2010
Journal of Engineering Design 17
stand-along tool. Our ultimate goal is to integrate this multi-dimensional and multiscale clusteringand aggregation tool with other visualisation systems, such as ATSV (Stump et al. 2003, 2004).
5.1. Design task and design data
Recently, there has been military and commercial interest in designing a wing that can ‘morph’from one configuration to another to improve aircraft performance during each phase of its mission(Lesieutre et al. 2006). A potential drawback of such a morphing wing is the added weight dueto the actuators and structural supports that it would require. This requires trade-offs during theirdesign, namely maximising the change in wing shape while minimising the added structuralweight.
For this study, we varied six input (design) variables to generate 716 different design alternatives(note: several input combinations are not feasible designs). These six variables and their possiblevalues are:
(1) Gross weight (Wo): 4 levels (1, 10, 100, 1000)(2) Cell material (Mat): 2 levels (Mat 1 or Mat 2)(3) Number of rows (NR): 4 levels (2, 4, 8, 10)(4) Aspect ratio (AR): 3 levels (2, 3.5, 5)(5) Cell fraction (Cf): 3 levels (0.5, 0.75, 0.9)(6) Goal weight (Goal): 3 levels (0.65, 0.75, 0.85)
For each design alternative, we recorded the predicted change in span (dSpan) and structuralweight (Wst). The design objective was to find the best design that maximises dSpan whileminimising Wst, i.e. the design that offers the best compromise between these two competingobjectives. While this type of problem is traditionally solved using multi-objective optimisationtechniques (Browne et al. 2006), our intent was to examine whether the iMSNCA frameworkcan help designers to identify trends and discover new knowledge about this complex structurethat would otherwise be missed if relying solely on optimisation. Given the uniqueness of thestructure, these insights are more useful and important at this conceptual stage of development thanis finding the ‘best’ design, which will certainly change as we learn more about the capabilitiesof such a morphing wing.
5.2. Procedure
In a study session, a subject was first informed about the design task – maximising dSpan whileminimising Wst – and was asked to identify the values of design variables that could lead tothe best wing. The subject was given time to study a set of 10 sample designs in a spreadsheetand to ask questions about the task. The sample designs had the same six design variables andthe two outputs (dSpan and Wst). Among these sample points, two were optimal with maximumdSpan and minimum Wst, two were unacceptable with minimum dSpan and maximum Wst, andthe remaining were in between these two extremes. To make sure the subject understood thedesign task, the subject was asked to identify all possible optimal designs as well as all possibleunacceptable ones before using the visualisation tools. If any design was wrongfully identified,the subject was given more time to study the data and the objectives until correct identificationswere made.
Two student subjects participated in two separated sessions of the study. In each session,a subject was first provided with four tools: our prototype system, ATSV, Matlab, and Excel.ATSV is a system that supports the exploration of a multi-dimensional trade space with a set ofvisualisation tools (Stump et al. 2003, 2004). We used its latest version (V 4.6.4, 2008) in the
Downloaded By: [Pennsylvania State University] At: 16:24 12 August 2010
18 X. Zhang et al.
study. Matlab and Excel also offer tools for multi-dimensional data visualisation and analysis.One subject rejected Matlab and chose Microsoft Excel instead because the subject thought thegraphing tools in Excel were sufficient to the task. The other subject declined Excel. Each subjectwas provided training on the use of our prototype system and the multi-dimensional visualisationtools inATSV. No training on Matlab or Excel was provided because subjects were already familiarwith these tools.
After training, the subject was given 716 design alternatives and asked to solve the design task.The subject was told that any of the tools—our prototype, ATSV, Matlab, and Excel—could beused to optimise the wing and that the activities associated with the use of these tools would beobserved. After finishing the task, the subject was interviewed about the experience in the study.
Both subjects finished the task. One session lasted about 2 h (the subject who used Excel), andthe other session was about 2.5 h (the subject who used Matlab).
5.3. Results
Both subjects correctly identified the values of the four design variables that could lead to the bestwing design. Although two subjects used all three tools in exploring data, their final decisionswere primarily based on the visualisation with our prototype system. Our observations show thatboth subjects extensively used the following tools provided by our prototype system:
• choosing individual data dimensions for data clustering and aggregation;• switching between different aggregation methods to understand the size of data cluster, and the
average value of a dimension of interest;• combining two or more dimensions in data clustering and aggregation;• changing the granularity of data clusters in exploration, either along one data dimension or
switch between different dimensions.
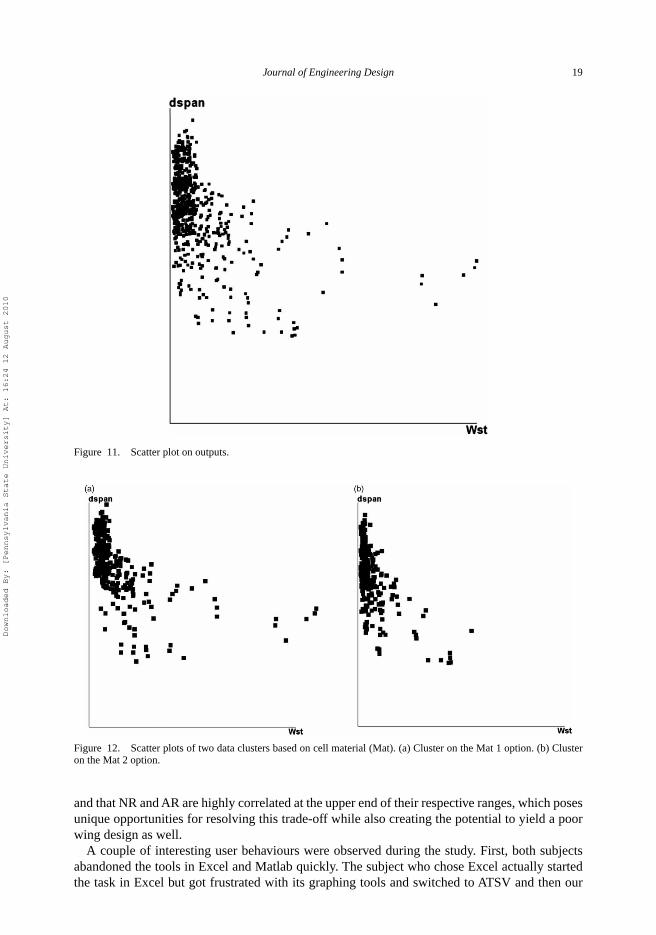
Figures 11–14 show some visual results of a subject who relied on our prototype system to analysevarious design variable combinations. Figure 11 is a 2D scatter plot of the outputs – Wst on thex-axis and dSpan on the y-axis – of all 716 design alternatives.
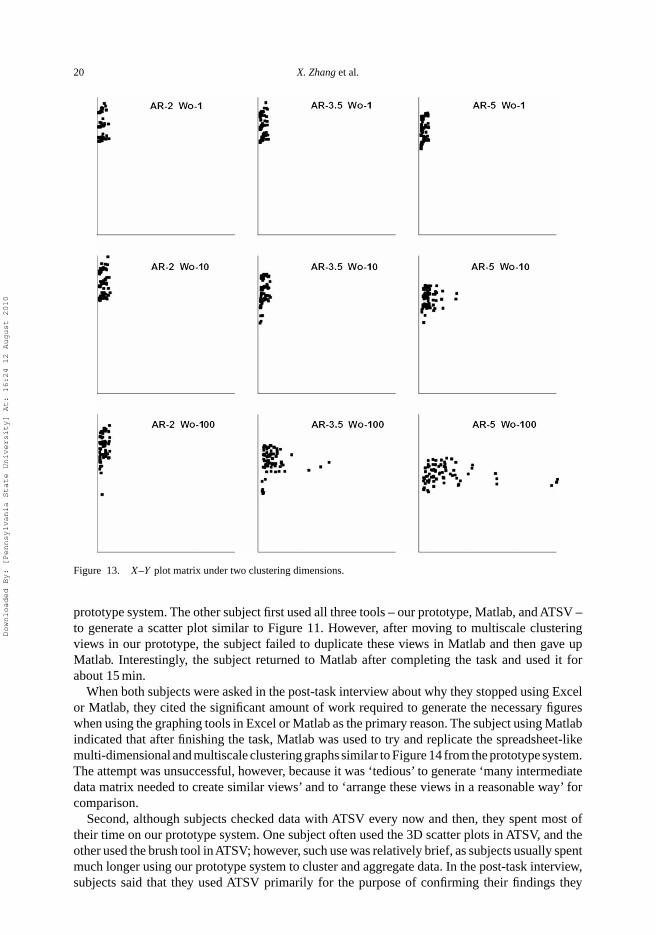
Figure 12 is a view that shows output data clusters based on a design dimension, namely cellmaterial (Mat). As shown in the figure, the Mat 2 option (Figure 12(b)) provides noticeably lowerWst as seen by the points residing close to the y-axis, while for Mat 1 (Figure 12(a)), there are‘gaps’ along the y-axis for very low values of Wst. This difference implies that the Mat2 optionis probably a better choice.
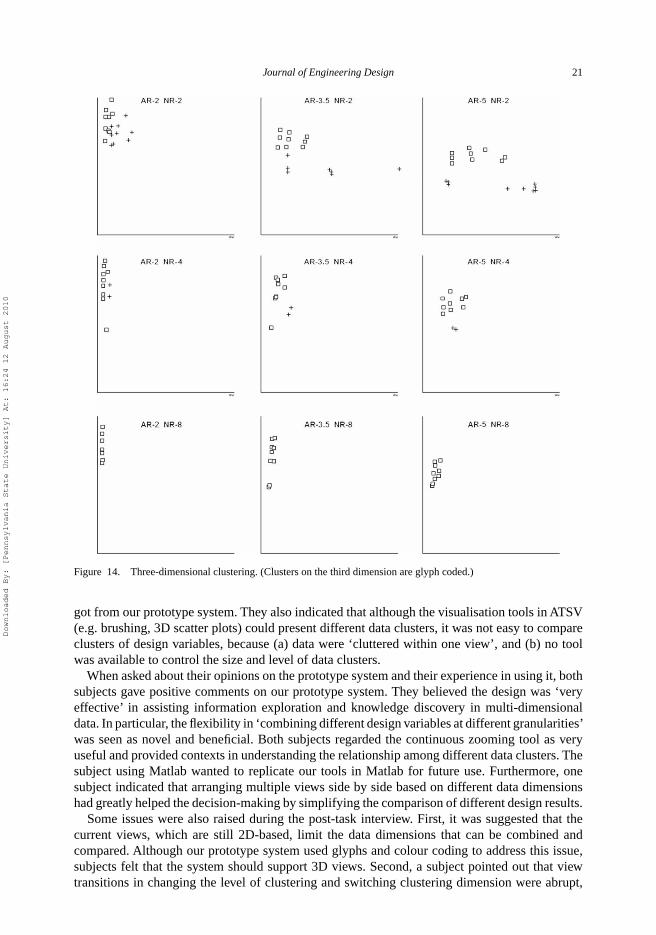
Figure 13 was used to examine two variables, AR and Wo, at once to identify interestingcorrelations between these two dimensions. As shown, when Wo is low (the first row), the impactof AR on the outputs is less significant, compared with designs with high Wo designs (the secondand third rows). This implies that lower values of AR and Wo are much more preferable sincethey yield higher dSpan values for lower Wst. The worst case would be high Wo and high ARat the lower-right corner, which leads to high Wst and low dSpan – the complete opposite of thedesign task given to the subjects.
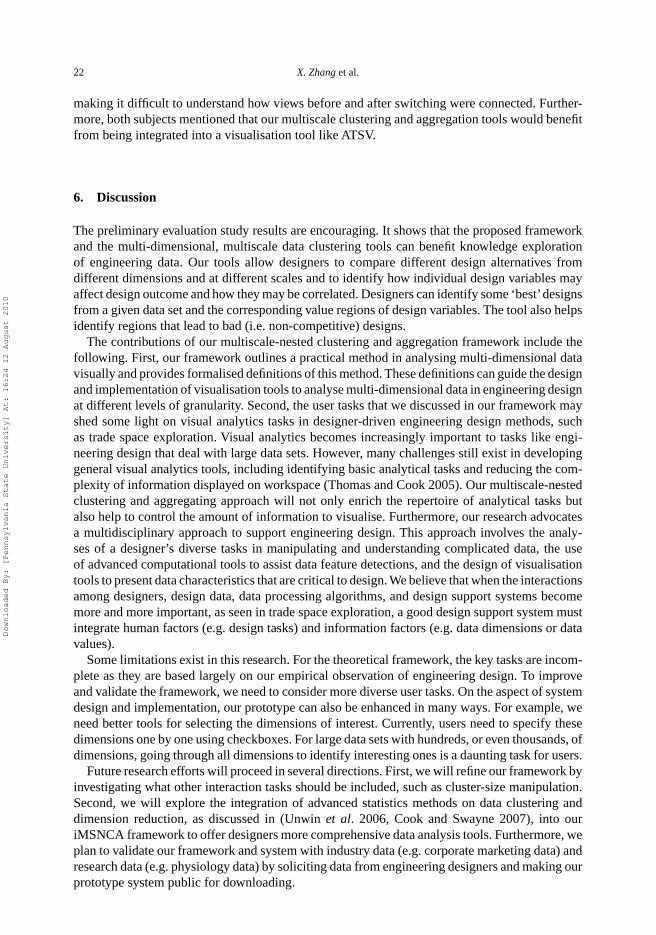
Based on these trends, the subject constructed a plot to ‘zoom in’ on promising design alterna-tives. Figure 14 is a view that shows alternatives with the Mat 2 option and Wo = 1 (square) andWo = 10 (cross), where the data are clustered based on NR and AR. In the figure, AR increasesfrom left to right, and NR increases from top to bottom. As shown, if low Wst values are chosen,then lower NR values are more desired and that lower AR values tend to yield higher values ofdSpan, which satisfy the design goal. The figure also shows that as AR increases, higher NRvalues tend to yield lower Wst values, which is an interesting interaction that would be missedwithout this multi-dimensional clustering. Finally, the figure shows that Mat 2 is a better option,
Downloaded By: [Pennsylvania State University] At: 16:24 12 August 2010
Journal of Engineering Design 19
Figure 11. Scatter plot on outputs.
Figure 12. Scatter plots of two data clusters based on cell material (Mat). (a) Cluster on the Mat 1 option. (b) Clusteron the Mat 2 option.
and that NR and AR are highly correlated at the upper end of their respective ranges, which posesunique opportunities for resolving this trade-off while also creating the potential to yield a poorwing design as well.
A couple of interesting user behaviours were observed during the study. First, both subjectsabandoned the tools in Excel and Matlab quickly. The subject who chose Excel actually startedthe task in Excel but got frustrated with its graphing tools and switched to ATSV and then our
Downloaded By: [Pennsylvania State University] At: 16:24 12 August 2010
20 X. Zhang et al.
Figure 13. X–Y plot matrix under two clustering dimensions.
prototype system. The other subject first used all three tools – our prototype, Matlab, and ATSV –to generate a scatter plot similar to Figure 11. However, after moving to multiscale clusteringviews in our prototype, the subject failed to duplicate these views in Matlab and then gave upMatlab. Interestingly, the subject returned to Matlab after completing the task and used it forabout 15 min.
When both subjects were asked in the post-task interview about why they stopped using Excelor Matlab, they cited the significant amount of work required to generate the necessary figureswhen using the graphing tools in Excel or Matlab as the primary reason. The subject using Matlabindicated that after finishing the task, Matlab was used to try and replicate the spreadsheet-likemulti-dimensional and multiscale clustering graphs similar to Figure 14 from the prototype system.The attempt was unsuccessful, however, because it was ‘tedious’ to generate ‘many intermediatedata matrix needed to create similar views’ and to ‘arrange these views in a reasonable way’ forcomparison.
Second, although subjects checked data with ATSV every now and then, they spent most oftheir time on our prototype system. One subject often used the 3D scatter plots in ATSV, and theother used the brush tool inATSV; however, such use was relatively brief, as subjects usually spentmuch longer using our prototype system to cluster and aggregate data. In the post-task interview,subjects said that they used ATSV primarily for the purpose of confirming their findings they
Downloaded By: [Pennsylvania State University] At: 16:24 12 August 2010
Journal of Engineering Design 21
Figure 14. Three-dimensional clustering. (Clusters on the third dimension are glyph coded.)
got from our prototype system. They also indicated that although the visualisation tools in ATSV(e.g. brushing, 3D scatter plots) could present different data clusters, it was not easy to compareclusters of design variables, because (a) data were ‘cluttered within one view’, and (b) no toolwas available to control the size and level of data clusters.
When asked about their opinions on the prototype system and their experience in using it, bothsubjects gave positive comments on our prototype system. They believed the design was ‘veryeffective’ in assisting information exploration and knowledge discovery in multi-dimensionaldata. In particular, the flexibility in ‘combining different design variables at different granularities’was seen as novel and beneficial. Both subjects regarded the continuous zooming tool as veryuseful and provided contexts in understanding the relationship among different data clusters. Thesubject using Matlab wanted to replicate our tools in Matlab for future use. Furthermore, onesubject indicated that arranging multiple views side by side based on different data dimensionshad greatly helped the decision-making by simplifying the comparison of different design results.
Some issues were also raised during the post-task interview. First, it was suggested that thecurrent views, which are still 2D-based, limit the data dimensions that can be combined andcompared. Although our prototype system used glyphs and colour coding to address this issue,subjects felt that the system should support 3D views. Second, a subject pointed out that viewtransitions in changing the level of clustering and switching clustering dimension were abrupt,
Downloaded By: [Pennsylvania State University] At: 16:24 12 August 2010
22 X. Zhang et al.
making it difficult to understand how views before and after switching were connected. Further-more, both subjects mentioned that our multiscale clustering and aggregation tools would benefitfrom being integrated into a visualisation tool like ATSV.
6. Discussion
The preliminary evaluation study results are encouraging. It shows that the proposed frameworkand the multi-dimensional, multiscale data clustering tools can benefit knowledge explorationof engineering data. Our tools allow designers to compare different design alternatives fromdifferent dimensions and at different scales and to identify how individual design variables mayaffect design outcome and how they may be correlated. Designers can identify some ‘best’designsfrom a given data set and the corresponding value regions of design variables. The tool also helpsidentify regions that lead to bad (i.e. non-competitive) designs.
The contributions of our multiscale-nested clustering and aggregation framework include thefollowing. First, our framework outlines a practical method in analysing multi-dimensional datavisually and provides formalised definitions of this method. These definitions can guide the designand implementation of visualisation tools to analyse multi-dimensional data in engineering designat different levels of granularity. Second, the user tasks that we discussed in our framework mayshed some light on visual analytics tasks in designer-driven engineering design methods, suchas trade space exploration. Visual analytics becomes increasingly important to tasks like engi-neering design that deal with large data sets. However, many challenges still exist in developinggeneral visual analytics tools, including identifying basic analytical tasks and reducing the com-plexity of information displayed on workspace (Thomas and Cook 2005). Our multiscale-nestedclustering and aggregating approach will not only enrich the repertoire of analytical tasks butalso help to control the amount of information to visualise. Furthermore, our research advocatesa multidisciplinary approach to support engineering design. This approach involves the analy-ses of a designer’s diverse tasks in manipulating and understanding complicated data, the useof advanced computational tools to assist data feature detections, and the design of visualisationtools to present data characteristics that are critical to design. We believe that when the interactionsamong designers, design data, data processing algorithms, and design support systems becomemore and more important, as seen in trade space exploration, a good design support system mustintegrate human factors (e.g. design tasks) and information factors (e.g. data dimensions or datavalues).
Some limitations exist in this research. For the theoretical framework, the key tasks are incom-plete as they are based largely on our empirical observation of engineering design. To improveand validate the framework, we need to consider more diverse user tasks. On the aspect of systemdesign and implementation, our prototype can also be enhanced in many ways. For example, weneed better tools for selecting the dimensions of interest. Currently, users need to specify thesedimensions one by one using checkboxes. For large data sets with hundreds, or even thousands, ofdimensions, going through all dimensions to identify interesting ones is a daunting task for users.
Future research efforts will proceed in several directions. First, we will refine our framework byinvestigating what other interaction tasks should be included, such as cluster-size manipulation.Second, we will explore the integration of advanced statistics methods on data clustering anddimension reduction, as discussed in (Unwin et al. 2006, Cook and Swayne 2007), into ouriMSNCA framework to offer designers more comprehensive data analysis tools. Furthermore, weplan to validate our framework and system with industry data (e.g. corporate marketing data) andresearch data (e.g. physiology data) by soliciting data from engineering designers and making ourprototype system public for downloading.
Downloaded By: [Pennsylvania State University] At: 16:24 12 August 2010
Journal of Engineering Design 23
Acknowledgements
The second author acknowledges support from the National Science Foundation (Grant No. CMMI-0620948). Anyopinions, findings, and conclusions or recommendations presented in this report are those of the authors and do notnecessarily reflect the views of the National Science Foundation.
References
Agrawal, G., et al., 2004. Intuitive visualization of Pareto frontier for multi-objective optimization in n-dimensionalperformance space. In: 10th AIAA/ISSMO multidisciplinary analysis and optimization conference, 30 August–1 September, 2004, Albany, NY. Reston, VA: AIAA, 4434.
Balijepalli, A. and Kesavadas, T., 2004. Value-addition of haptics in operator training for complex machining tasks. ASMEJournal of Computing and Information Science in Engineering, 4 (2), 91–97.
Balling, R., 1999. Design by shopping: a new paradigm? In: Proceedings of the Third World Congress of Structural andMultidisciplinary Optimization (WCSMO-3), 17–21 May, Buffalo, NY. Vol. 1. Buffalo, NY: University at Buffalo,295–297.
Bederson, B.B., 2001. PhotoMesa: a zoomable image browser using quantum treemaps and bubblemaps. In: Proceedingsof ACM Symposium on User Interface Software and Technology (UIST) 2001, 11–14 November, 2001, Orlando, FL.71–80.
Bederson, B., et al., 1996. Pad++: a zoomable graphical sketchpad for exploring alternate interface physics. Journal ofVisual Languages and Computing, 7 (1), 3–31.
Bederson, B.B., Grosjean, J., and Meyer, J., 2004. Toolkit design for interactive structured graphics. IEEE Transactionson Software Engineering, 30 (8), 535–546.
Brantley, M., McFadden, W., and Davis, M., 2002. Expanding the trade space: an analysis of requirements tradeoffsaffecting system design. Acquisition Review Quarterly, 9 (1), 1–15.
Browne, J., Lesieutre, G., and Frecker, M., 2006. Scaling of performance, weight and actuation of a 2-D compliantcellular frame structure for a morphing wing. In: Proceedings of International Conference on Adaptive Structuresand Technology, 16–19 October, 2006, Taiwan.
Card, S.K., Mackinlay, J., and Shneiderman, B., 1999. Chapter 1: information visualization. In: S.K. Card, J. Mackinlay,and B. Shneiderman, eds. Readings in information visualization: using vision to think. San Francisco, CA: MorganKauffman, 1–34.
Card, S.K., Robertson, G.G., and Mackinlay, J.D., 1991. The information visualizer: an information workspace. In:Proceedings of the SIGCHI conference on human factors in computing systems: reaching through technology27 April–2 May, 1991. New Orleans, LA. New York: ACM Press, 181–188.
Carr, D.B. and Nicholson, W.L., 1985. Evaluation of graphical techniques for data in dimensions 3 to 5: scatterplot matrix,Glyph and Stereo examples. In: Proceedings of the Statistical Computing Section, 5–8 August, Las Vegas, Nevada.Alexandria, VA: American Statistical Association. 229–235.
Chen, W., Lewis, K.E., and Schmidt, L., 2000, Decision-based design: an emerging design perspective. Journal ofEngineering Valuation & Cost Analysis, Special Edition on Decision-Based Design, 3 (2/3), 57–66.
Chi, E.H., et al., 1997. A spreadsheet approach to information visualization. In: Proceedings of the IEEE Symposium oninformation Visualization (InfoVis) ‘97, 18–25 October, 1997, Phoenix, AZ. 17–24.
Cook, D. and Swayne, D.F., 2007. Interactive and dynamic graphics for data analysis. Springer: New York.Dachselt, R. and Frisch, M., 2007. Mambo: a facet-based zoomable music browser. In: Proceedings of the 6th international
conference on mobile and ubiquitous multimedia, 12–14 December, 2007, Oulu, Finland. 110–117.Dachselt, R., Frisch, M., and Weiland, M. 2008. FacetZoom: a continuous multi-scale widget for navigating hierarchical
metadata. In: Proceedings of ACM Conference on Human Factors in Computing Systems (CHI), 5–10 April, 2008,Florence, Italy. 1353–1356.
Deb, K., 2001. Multi-objective optimization using evolutionary algorithms. New York: John Wiley & Sons.Eddy, J. and Lewis, K., 2002. Visualization of multi-dimensional design and optimization data using cloud visualization.
In: ASME design engineering technical conferences – design automation conference 29 September–2 October, 2002,Montreal, Quebec, Canada. New York: ASME, Paper No. DETC02/DAC-02006.
Evans, P.T., Vance, J.M., and Dark, V.J., 1999. Assessing the effectiveness of traditional and virtual reality interfaces inspherical mechanism design. ASME Journal of Mechanical Design, 121 (1), 507–514.
Furlong, T.J., Vance, J.M., and Larochelle, P.M., 1999. Spherical mechanism synthesis in virtual reality. ASME Journalof Mechanical Design, 121 (1), 515–520.
Furnas, G.W., 1997. Effective view navigation. In: Proceedings of ACM Conference on Human Factors in ComputingSystems (CHI), 22–27 March, 1997, Atlanta, GA. 367–374.
Furnas, G.W. and Bederson, B.B., 1995. Space-scale diagrams: understanding multiscale interfaces. In: Proceedings ofthe ACM Conference on Human Factors in Computing Systems (CHI) ’95, 7–11 May, 1995, Denver, CO. 234–241.
Furnas, G.W. and Zhang, X., 1998. MuSE: a multiscale editor. In: Proceedings of ACM Symposium on User InterfaceSoftware and Technology (UIST), 1–4 November, 1998, San Francisco, CA. 107–116.
Haftka, R., Scott, E.P., and Cruz, J.R., 1998. Optimization and experiments: a survey. Applied Mechanics Review, 51 (3),435–448.
Downloaded By: [Pennsylvania State University] At: 16:24 12 August 2010
24 X. Zhang et al.
Hearst, M.A., 2006. Clustering versus faceted categories for information exploration. Communications of the ACM, 49(1), 59–61.
Hearst, M.A., 2009. Search user interfaces. New York: Cambridge University Press.Hoffman, P., Grinstein, G., and Pinkney, D. 1999. Dimensional anchors: a graphic primitive for multidimensional multi-
variate information visualizations. In: Proceeding of workshop on new paradigms in information visualization andmanipulation, 2–6 November 1999, Kansas City, Mo. 9–16.
Hwang, C.-L. and Masud,A.S., 1979. Multiple objective decision making – methods and applications. NewYork: Springer-Verlag.
Inselberg, A., 1985. The plane with parallel coordinates. Visual Computer, 1 (1), 69–91.Jayaram, S., et al., 2001. Assessment of VR technology and its applications to engineering problems. ASME Journal of
Computing and Information Science in Engineering, 1 (1), 72–83.Kanukolanu, D., Lewis, K.E., andWiner, E.H., 2006.A multidimensional visualization interface to aid in trade-off decisions
during the solution of coupled subsystems under uncertainty. ASME Journal of Computing and Information Sciencein Engineering, 6 (3), pp. 288–299.
Kelsick, J., et al., 2003. Discrete event simulation implemented in a virtual environment. ASME Journal of MechanicalDesign, 125 (3), 428–433.
Kesavadas, T. and Sudhir, A., 2000. Computational steering in simulation of manufacturing systems. In: Proceedings ofthe 2000 IEEE International Conference on Robotics and Automation 24–28 April, 2000, San Francisco, CA. Vol. 3,New York: IEEE, 2654–2658.
Kihonge, J.N., Vance, J.M., and Larochelle, P.M., 2002. Spatial mechanism design in virtual reality with networking.ASME Journal of Mechanical Design, 124 (3), 435–440.
Koch, P.N., Evans, J.P., and Powell, D., 2002. Interdigitation for effective design space exploration using iSIGHT.Structural and Multidisciplinary Optimization, 23 (2), 111–126.
Laidlaw, D.H., et al., 2005. Comparing 2D vector field visualization methods: a user study. IEEE Transactions onVisualization and Computer Graphics, 11 (1), 59–70.
Lamping, J. and Rao, R., 1994. Visualizing large trees using the hyperbolic browser. In: Proceedings of UIST’94, 2–4November, 1994, Marina del Rey, CA. New York: ACM Press, 13–24.
Lesieutre, G.A., Browne, J.A., and Frecker, M.I., 2006. Scaling and performance, weight and actuation of a 2-D com-pliant cellular frame structure for a morphing wing. In: 17th international conference on adaptive structures andtechnologies, proceedings of ICAST2006, 13–17 October, 2006, Taipei, Taiwan, 1–8.
Lucky, R.W., 1989. Silicon dreams: information, man, and machine. New York: St. Martin’s Press.Mulder, J.D., van Liere, R., and van Wijk, J.J., 1998. Computational steering in the CAVE. Future Generation Computer
Systems, 14 (3), 199–207.Nagel, H., 2006. Scientific visualization versus information visualization, workshop on state-of-the-art in scientific and par-
allel computing, Umeå, Sweden [online]. Available from: http://www.hpc2n.umu.se/para06/papers/paper_213.pdf[Accessed 10 March 2010].
Papalambros, P., 2002. The optimization paradigm in engineering design: promises and challenges. Computer-AidedDesign, 34 (12), 939–951.
Perlin, K. and Fox, D., 1993. Pad: an alternative approach to the computer interface. In: Proceedings of the 20th AnnualConference on Computer Graphics and interactive Techniques (SIGGRAPH), ’93, 2–6 August, 1993, Anaheim, CA.57–64.
Phoenix Integration, 1999. ModelCenter v2.01 [online]. Blacksburg, VA. Available from: http://www.phoenix-int.com[Accessed 10 March 2010].
Qu, Y. and Furnas, G.W., 2005. Sources of structure in sensemaking. In: Proceedings of the SIGCHI ’05 conference onhuman factors in computing systems, 2–5 April, 2005, Portland, OR. New York: ASM Press, 1989–1992.
Rao, R. and Card, S.K., 1994. The table lens: merging graphical and symbolic representations in an interactivefocus + context visualization for tabular information. In: Proceedings of the ACM Conference on Human Factors inComputing Systems (CHI) ’95, 24–28 April, 1994, Boston, MA. 318–322.
Robertson, G., Mackinlay, J., and Card, S., 1991. Cone Trees: animated 3D visualizations of hierarchical informa-tion. In: Proceedings of SIGCHI conference on human factors in computing systems: reaching through technology27 April–May 2, 1991, New Orleans, LA. New York: IEEE, 189–194.
Ross, A.M., et al., 2004. Multi-attribute tradespace exploration with concurrent design as a front-end for effective spacesystem design. Journal of Spacecraft and Rockets, 41 (11), 20–28.
Russell, D.M., et al., 1993. The cost structure of sensemaking. In: Proceedings of the SIGCHI conference on humanfactors in computing systems, 24–29 April, 1993, Amsterdam, The Netherlands, 269–276.
Seo, J. and Shneiderman, B., 2005. A rank-by-feature framework for interactive exploration of multidimensional data.Information Visualization, 4 (2), 96–113.
Shahnawaz, V.J., Vance, J.M., and Kutti, S.V., 1999. Visualization of post-processed CFD data in a virtual environment.In: Computers in engineering conference, 12–16 September, 1999. Las Vegas, NV. New York: ASME, Paper No.DETC99/CIE-9042.
Shanteau, J., 1992. Competence in experts: the role of task characteristics. Organizational Behavior and Human DecisionProcesses, 53 (2), 252–266.
Shneiderman, B., 1992. Tree visualization with treemaps: a 2d space filling approach. ACM Transactions on Graphics,11 (1), 92–99.
Simpson, T.W., et al., 2001. Metamodels for computer-based engineering design: survey and recommendations.Engineering with Computers, 17 (2), 129–150.
Downloaded By: [Pennsylvania State University] At: 16:24 12 August 2010
Journal of Engineering Design 25
Smith, W.R., et al., 1999. Goal-oriented computational steering. In: SPIE conference on enabling technology for simulationscience III, 6–8 April, 1999, Orlando, FL. Vol. 3696, Bellingham, CA: SPIE, 250–260.
Sobieszczanski-Sobieski, J., et al., 2003. Bilevel integrated system synthesis for concurrent and distributed processing.AIAA Journal, 41 (10), 1996–2003.
Stump, G., et al., 2003. Design space visualization and its application to a design by shopping paradigm. In: ASME designengineering technical conferences – design automation conference 2–6 September, 2003, Chicago, IL. New York:ASME, Paper No. DETC2003/DAC-48785.
Stump, G., et al., 2004. Trade space exploration of satellite datasets using a design by shopping paradigm. In: Proceedingsof the IEEE Aerospace Conference, 6–13 March, 2004, Big Key, MT. New York: IEEE, 3885–3895.
Thomas, J. and Cook, K., 2005. Illuminating the path: the research and development agenda for visual analytics, LosAlamitos, CA: IEEE Computer Society.
Unwin, A.R., Theus, M., and Hofmann, H., 2006. Graphics of large datasets. Springer: New York, 2006.Volkov, S. and Vance, J.M., 2001. Effectiveness of haptic sensation for the evaluation of virtual prototypes. ASME Journal
of Computing and Information Science in Engineering, 1 (2), 123–128.Wasfy, T. and Wasfy, A., 2003. Strategy for effective visualization of CFD datasets in virtual environments. In: ASME
design engineering technical conferences – computers and information in engineering conference, 2–6 September,2003, Chicago, IL. New York: ASME, Paper No. DETC2003/CIE-48294.
Wilson, T.D. and Schooler, J.W., 1991. Thinking too much: introspection can reduce the quality of preferences anddecisions. Journal of Personality and Social Psychology, 60 (2), 181–192.
Winer, E.H. and Bloebaum, C.L., 2001. Visual design steering for optimization solution improvement. StructuralOptimization, 22 (3), 219–229.
Winer, E.H. and Bloebaum, C.L., 2002a. Development of visual design steering as an aid in large-scale multidisciplinarydesign optimization. Part I: method development. Structural and Multidisciplinary Optimization, 23 (2), 412–424.
Winer, E.H. and Bloebaum, C.L., 2002b. Development of visual design steering as an aid in large-scale multidisciplinarydesign optimization. Part II: method validation. Structural and Multidisciplinary Optimization, 23 (2), 425–435.
Wu, A., et al., 2009. CIVIL: support geocollaboration with information visualization. In: Proceedings of ACM Conferenceon Supporting Group Work (GROUP), 10–13 May, 2009, Sanibel Island, FL. 273–276.
Zhang, X., et al., 2008. CiteSense: supporting sensemaking of research literature. In: Proceeding of ACM Conference onHuman Factors in Computing Systems (CHI), 5–10 April, 2008, Florence, Italy. 677–680.
Downloaded By: [Pennsylvania State University] At: 16:24 12 August 2010