journal of intellectual capital - tu delft ocw · journal of intellectual capital value network...
TRANSCRIPT
Journal of Intellectual CapitalValue network analysis and value conversion of tangible and intangible assetsVerna Allee,
Article information:To cite this document:Verna Allee, (2008) "Value network analysis and value conversion of tangible and intangible assets",Journal of Intellectual Capital, Vol. 9 Issue: 1,pp. 5-24, doi: 10.1108/14691930810845777Permanent link to this document:http://dx.doi.org/10.1108/14691930810845777
Downloaded on: 28 March 2017, At: 12:08 (PT)References: this document contains references to 25 other documents.To copy this document: [email protected] fulltext of this document has been downloaded 7660 times since 2008*
Users who downloaded this article also downloaded:(2009),"Value-creating networks: organizational issues and challenges", The Learning Organization, Vol. 16Iss 6 pp. 427-442 http://dx.doi.org/10.1108/09696470910993918(2002),"FiMIAM: financial method of intangible assets measurement", Journal of Intellectual Capital, Vol. 3Iss 3 pp. 323-336 http://dx.doi.org/10.1108/14691930210435642
Access to this document was granted through an Emerald subscription provided by emerald-srm:474727 []
For AuthorsIf you would like to write for this, or any other Emerald publication, then please use our Emerald forAuthors service information about how to choose which publication to write for and submission guidelinesare available for all. Please visit www.emeraldinsight.com/authors for more information.
About Emerald www.emeraldinsight.comEmerald is a global publisher linking research and practice to the benefit of society. The companymanages a portfolio of more than 290 journals and over 2,350 books and book series volumes, as well asproviding an extensive range of online products and additional customer resources and services.
Emerald is both COUNTER 4 and TRANSFER compliant. The organization is a partner of the Committeeon Publication Ethics (COPE) and also works with Portico and the LOCKSS initiative for digital archivepreservation.
*Related content and download information correct at time of download.
Dow
nloa
ded
by D
EL
FT U
NIV
ER
SIT
Y O
F T
EC
HN
OL
OG
Y A
t 12:
08 2
8 M
arch
201
7 (P
T)
Value network analysis and valueconversion of tangible and
intangible assetsVerna Allee
Verna Allee Associates, Martinez, California, USA
Abstract
Purpose – The purpose of this paper is to provide examples and technical details for conducting avalue network analysis that addresses the conversion and utilisation of intangible assets.
Design/methodology/approach – Value network analysis was first developed in 1993 and wasadapted in 1997 for intangible asset management. It has been tested in applications from shop floorwork groups to business webs and economic regions. It draws from a theory based in living systems,knowledge management, complexity theory, system dynamics, and intangible asset management.
Findings – The paper provides a high level of detail on the analysis method and insights from itspractical application across a range of business issues. Tips are provided for how to integrate themethodology with other business analysis approaches.
Research limitations/implications – The paper does not provide a comparative analysis withother methods because most other value network models are process views, social network analysis orclustering techniques.
Practical implications – Sufficient detail is provided so researchers and practitioners will be ableto apply the method in their own investigations. Further resources are noted, as well as access pointsto the global user community and open source tools.
Originality/value – This paper is the first detailed publication of the value network analysismethod, which has been acclaimed by experts in intangibles, network analysis, knowledgemanagement, and process analysis. It fills a gap between theory and practice for managers, executives,analysts, and researchers.
Keywords Value analysis, Intangible assets, Adaptive system theory, Complexity theory
Paper type Conceptual paper
IntroductionOne of the most important and challenging questions in working with intangibles is“How do we convert intangible assets such as human knowledge, internal structures,ways of working, reputation, and business relationships into negotiable forms ofvalue?”. Value network analysis offers a way to model, analyse, evaluate, and improvethe capability of a business to convert both tangible and intangible assets into otherforms of negotiable value, and to realise greater value for itself. Underlying thisapproach is an understanding that intangible, but nonetheless strong and dynamicrelationships, and the intangible assets that make up and have an impact on thoserelationships, are the foundation of any successful business endeavor. Indeed, thefuture success of a company or organisation as a whole depends on how efficiently acompany can convert one form of value into another.
An example of value conversion occurs when an intangible asset such asprofessional expertise is converted into a more negotiable form of value, perhaps in theform of consulting services. The conversion dynamic also applies to value realisation.
The current issue and full text archive of this journal is available at
www.emeraldinsight.com/1469-1930.htm
Value networkanalysis
5
Journal of Intellectual CapitalVol. 9 No. 1, 2008
pp. 5-24q Emerald Group Publishing Limited
1469-1930DOI 10.1108/14691930810845777
Dow
nloa
ded
by D
EL
FT U
NIV
ER
SIT
Y O
F T
EC
HN
OL
OG
Y A
t 12:
08 2
8 M
arch
201
7 (P
T)

An example is when a tangible value input, such as purchased market intelligencereports, is converted into a non-financial asset of increased levels of marketingcompetency.
A decade of research and practice in intellectual capital has demonstrated that theimpact of organisational (or purposeful network) interventions and actions must beunderstood in both tangible and intangible terms (Sveiby, 1997; Edvinsson andMalone, 1997; Wallman and Blair, 2000; Lev, 2001; Eccles et al., 2001). In particular, theintellectual capital field has raised awareness about the importance of intangibleassets. Intangible assets include relationships, employee know-how and competency,the effectiveness of the organisation’s work groups and structure, the efficiency of theorganisation’s production and service processes, and the level of trust between thepeople or organisations forming the relationships. Trust is an expression of highdegrees of social capital, both within the organisation and externally expressed asreputation and brand. Tangible assets are financial resources and other capital-basedresources that are controlled by the firm.
Networks and roles as value conversion mechanismsUnderstanding the dynamics of value conversion requires expanding beyond the assetview of intangibles to understand the function of intangibles as negotiable goods andas deliverables. At the macro level, the primary conversion mechanism for convertingone form of value to another is the network. There are many different kinds ofconversion enablers for networks, of course, such as alternative currencies (Lietaer,2001). But these are only effective when a healthy value exchange network supportsthem. Because the network is the primary economic mechanism for value conversion,network analysis can be used to describe the value creation dynamics of work groups,organisations, business webs, and purposeful networks engaging in both tangible andintangible value exchanges to support the achievement of specific outcomes and togenerate economic and social good (MacCauley, 1963; Granovetter and Swedberg,2001; Allee, 2002, 2003).
Purposeful networks, such as organisations, consist of specific roles and valueinteractions oriented toward the achievement of a particular task or outcome. Theactive agents of the network are real people who participate in the network by playingparticular roles in which they convert both tangible and intangible assets intonegotiable offerings and fulfill different functions.
These activity-focused networks, therefore, can be considered value conversionnetworks, or value networks. A value network is any set of roles and interactions inwhich people engage in both tangible and intangible exchanges to achieve economic orsocial good. Internal value networks include activity-focused sets of relationshipsbetween individuals (e.g. the chief executive officer and the chief financial officer orteam members) within and among work groups (e.g. those within and between themanufacturing, research and development, or sales departments), and between andamong the various work groups that make up the organization.
External-facing value networks include those between the organization and itssuppliers, its investors (including venture capitalists); its strategic business partners(e.g. a business with a complementary product); and its customers. Other kinds ofnetworks cross organizational and industry boundaries, such as innovation networksor networks of people with the shared purpose of creating a particular social good or
JIC9,1
6
Dow
nloa
ded
by D
EL
FT U
NIV
ER
SIT
Y O
F T
EC
HN
OL
OG
Y A
t 12:
08 2
8 M
arch
201
7 (P
T)
outcomes, such as improving education. Terrorist and criminal networks are also valuenetworks, of course. The network is a value conversion mechanism that achieves notonly positive goods and outcomes, but nefarious and negatives ones as well, accordingto the values and intent of those who serve the network. Still, as long as the principlesof a healthy value network are followed, the network will be sustained and fulfill ispurpose.
Creating value from intangiblesThe idea that intangibles, like other assets, are increased and leveraged throughdeliberate action is now gaining wide acceptance. Reputation now goes beyond brandto include the assets of social citizenship and environmental responsibility, which aredemonstrated in sustainable business values and practices (Allee, 2000; Henderson,2006).
However, understanding intangibles as assets is only the beginning. To understandhow intangibles create value, three other very important dimensions must be grasped:
(1) The first dimension is how intangibles go to market as negotiable forms ofvalue. Intangibles are negotiable goods in the sense that they are negotiableeconomic offerings. One can, of course, exchange knowledge for money in theform of a product or service, thereby converting the intangible to a tangible.One also negotiates exchanges of knowledge for other knowledge, and tradesintangible benefits or favors.
(2) The second dimension is how intangibles are managed as deliverables. Whennegotiating an intangible exchange, the promised intangible can be viewed as adeliverable. These include informal knowledge products and also benefits thatcan be extended from one person or group to another. Intangibles in this senseinclude all unpaid or non-contractual activities that make things work smoothlyand help build relationships. In contrast, tangible deliverables include anythingthat is contracted, mandated or expected by the recipient as part of the deliveryof a product or service and that directly generates revenue.
(3) The third dimension is exactly how both tangible and intangible assets aredynamically converted into other forms of value in the business model, and howvalue inputs are used to increase tangible and intangible assets.
The molecular level of economics is the trade or exchange, whether it involves financialcurrencies or not. Intangibles are used as negotiables in economic exchanges all thetime. One might package an intangible, such as knowledge about our industry, and sellit for money. Or one might engage in a direct knowledge exchange. One person mightshow another how to animate a slide show if the other demonstrates how to build adatabase. Or one might negotiate a direct exchange of favors or benefits. For example,one person might introduce executives from another company to important contacts inthe person’s business web if the executives agree to support a certain initiative before aregulatory body. These exchanges are not outside the realm of economics, but are themolecular level of value creation that ultimately leads to financial wealth and/or socialgood.
A transaction occurs when a deliverable originated by one role is conveyed to andreceived by another. Two or more reciprocal transactions are an exchange. Once anexchange has been negotiated, both parties can be held accountable for the effective
Value networkanalysis
7
Dow
nloa
ded
by D
EL
FT U
NIV
ER
SIT
Y O
F T
EC
HN
OL
OG
Y A
t 12:
08 2
8 M
arch
201
7 (P
T)
execution of any transaction either originates. Between them, they can developperformance metrics for the quality, speed, timeliness, quantity, and usefulness of thecompleted transaction. (Transaction costs can even be tracked, although that is not themost useful view of these types of exchanges.) In this way, the negotiable form of valuehas become a deliverable that can be just as deliberately managed as any othertransaction. However, at no time in this process is it necessary to convert the negotiableinto a financial or tangible form.
Mediums of exchangeIntangibles basically go to market in two ways:
(1) through conversion to monetary value; and
(2) through conversion to a negotiable form of value that can be used moreinformally as a type of barter (Allee, 2003).
Money is basically a medium of exchange whereby goods can be assigned a value inthe form of an agreed-upon measure. Money is an enabler of value conversion becauseit allows people to convert things to units of measure and trade the units in amarketplace, instead of trading physical goods. This way they do not have to carryaround everything they own and make trades for what they need on a daily basis.They can exchange the units of measure instead of the things themselves, and then usethose units to purchase other goods.
Some have suggested that alternative currencies, such as airline miles orcommunity service credits, represent movement into an intangibles economy and couldeven replace monetary systems. However, airline miles and community service creditsare still common units of measure that serve as mediums of exchange, even though thecurrencies are more localized into in-kind credits. Alternative currencies offer a healthydiversity into the larger economic system and could serve as a fall-back economicsystem in times of financial instability. However, the underlying assumption is still thesame as that for financial currencies: Things of value can be converted into like units ofmeasure.
However, the majority of intangible transactions remain in the realm of theintangible and are never converted into units of like measure (i.e. alternative orfinancial units) – nor do they need to be.
Some types of value can readily enter into the tangible realm through directconversion into something that can be sold for money, or by a less direct conversion,such as using an alternative currency as a medium of exchange. However, the effort toconvert every type of value into a common unit of measure is fundamentally the wrongapproach to the intangibles economy. Carried to its extreme, this could lead toproposals for systems of micro-credits for ideas. This would entail treating ideas andknowledge as if they were things instead of emergent properties of networks.
The most visible way intangibles go to market, of course, is when they areconverted to a good or service that has financial value. However, business andeconomic activities actually comprise a very sophisticated barter system involvingintangibles that plays a vital economic role in terms of building business relationships,creating value for the participants in those relationships, and assuring that businesstransactions run smoothly. Any time one agrees to share or exchange knowledge orfavors directly, without conversion to a financial cost, that individual or group is
JIC9,1
8
Dow
nloa
ded
by D
EL
FT U
NIV
ER
SIT
Y O
F T
EC
HN
OL
OG
Y A
t 12:
08 2
8 M
arch
201
7 (P
T)

bringing intangibles to market in the form of barter. Intangibles must be understood asintangibles, which includes understanding how they are converted into othernegotiable forms of value – and just as importantly, understanding when and whythey are not converted.
Value conversionValue conversion is the act of converting or transforming financial to non-financialvalue or transforming an intangible input or asset into a financial value or asset. Thetheme of value conversion runs through social exchange theory and is a key questionin the field of socioeconomics (Homans, 1958). Some advocates of the intangiblesperspective, such as Jan Taug (2004), have expanded the boundaries of exchangetheory by suggesting that relational or social capital is the catalyst forinterconvertability, whereby different capital forms flow in multiple directions. Thisintraconvertability of value is a foundational dynamic of a knowledge-based economy.
Knowledge, an intangible asset, is one of the most interchangeable commodities.Knowledge can be “traded” for more knowledge; it can be traded for another form ofintangible value, such as a favor or benefit; or it can be packaged and sold for profit asa tangible form of negotiable value. Whenever one type of value has been created orrealized from another type of value, a value conversion has been executed.
The value conversion question runs in two directions:
(1) Converting value as inputs, or value realization: how does one convert inputsinto value (financial and non-financial)?. How do value inputs help one build or manage tangible and intangible
assets?. How do value inputs affect one’s financial picture?
(2) Converting value as outputs: how does one utilize tangible and intangible assetsto create value for customers and other participants in an internal or externalvalue network?. What kind of intangible value outputs can one create from both tangible and
intangible assets?. What kind of tangible outputs can one create from intangibles to directly
generate revenue?
When considering value conversion, it is necessary to assess the inputs and outputs foreach role in the network to determine whether value conversion opportunities are beingoverlooked. For example, a financial services company had been providing a series ofstandard reports to its customers. Assessing value conversion opportunities helped thecompany realize that many of the reports it provided for free could be packaged moreattractively, enhanced with expert analysis, and then sold for a fee. Thus, the companyexecuted a value conversion by transforming an intangible asset of knowledge orexpertise that had been formerly used as an intangible (free) output into a tangibleform of value with which it could generate revenue.
Participants in a value network, either individually or collectively, utilize theirtangible and intangible asset base by assuming or creating roles that convert thoseassets into more negotiable forms of value that can be delivered to other roles throughthe execution of a transaction. In turn, the value of deliverables received is realized by
Value networkanalysis
9
Dow
nloa
ded
by D
EL
FT U
NIV
ER
SIT
Y O
F T
EC
HN
OL
OG
Y A
t 12:
08 2
8 M
arch
201
7 (P
T)

participants when they convert them into gains or improvements in tangible orintangible assets. The value conversion strategy model in Figure 1 illustrates thisvalue conversion. This visualization of strategy conversion was co-developed withcolleague Oliver Schwabe (2007).
Using value network analysis to address value conversionThere is a growing interest in network perspectives as people explore new ways ofthinking about organizations and business relationships. The term “value network” isbeing adopted in general business practice, primarily in regard to industry valuenetworks, but also in regard to business webs. SAP, IBM, WalMart, and others refer totheir value networks as a way to describe their efforts to bring coherence to supplychains or to industry clusters. Technology companies are likely to use the term whendiscussing service-oriented architecture (SOA) in their efforts to integrate technologysystems across industries. These communications mostly are oriented towardmarketing and have little if any methodologies of substance behind them.
Early discussions about value nets were usually focused on supply chain, usingframeworks, scorecards, and variations of supply chain models to describe supplychain networks (Parolini, 1999; Bovet and Martha, 2000). Yochai Benkler (2006) movedmore solidly into a value analysis with his landmark book TheWealth of Networks, butfocused primarily on internet-based social production models. Shoshana Zuboff (2002)drew a bit closer to the network value question in The Support Economy with her briefdiscussion of intangibles in federated support networks.
Several analysts and researchers are using social network analysis, bothmetaphorically and analytically, to try to understand networks as economic entitieswith some limited focus on intangible outcomes and exchanges (Cross and Parker,2003; Dawson, 2003; Iansiti and Levien, 2004). Social network analysis (SNA), referredto as organizational network analysis (ONA) when applied to organizations, is beingused in some organizations to understand knowledge flows (one kind of intangible) andthe network patterns of expert communities. This methodology has been a valuabletool in the social sciences since the 1930s, and has been widely used to address avariety of questions about relationships and communication (Nohria and Eccles, 1992).Although this approach provides powerful insights into knowledge exchanges, it falls
Figure 1.Value conversion strategymodel
JIC9,1
10
Dow
nloa
ded
by D
EL
FT U
NIV
ER
SIT
Y O
F T
EC
HN
OL
OG
Y A
t 12:
08 2
8 M
arch
201
7 (P
T)
short in being able to demonstrate a direct linkage between network patterns andvalue.
Value network analysis (VNA) links specific interactions within the value creatingnetwork directly to financial and non-financial scorecards. It does the following:
. provides a fresh perspective for understanding value creating roles andrelationships, both internal and external, upon which an organization depends;
. offers dynamic views of how both financial and non-financial assets can beconverted into negotiable forms of value that have a positive impact on thoserelationships;
. explains how to more effectively realize value for each role and how to utilizetangible and intangible assets for value creation; and
. provides a systematic analysis of how one type of value is converted intoanother.
Exchanging intangiblesKnowledge and intangibles behave differently than do physical resources, and it is amistake to simply treat them as tangibles. This means, in describing the value model ofa business, one must consider two orders of economic exchange – tangible andintangible.
Tangible exchanges of goods, services, and revenueIn value network analysis, tangible exchanges are defined as contractual transactionsinvolving goods, services, or revenue, including but not limited to physical goods,services, contracts, invoices, return receipts of orders, requests for proposals,confirmations, and payments. Knowledge products or services that directly generaterevenue, or that are expected (contractual) and paid for as a part of a service or good(e.g. reports or package inserts) are also considered tangible exchanges. Thedetermination of whether a deliverable is considered a tangible or intangible isdependent on its contractual nature, not its physical nature.
Intangible exchanges of knowledge and benefitsIntangible knowledge and information exchanges flow around and support the coreproduct and service value chain, but are not contractual. Intangibles include those“little extras” people do that help keep things running smoothly and buildrelationships. These include exchanges of strategic information, planning knowledge,process knowledge, technical know-how, collaborative design work, joint planningactivities, and policy development. Although these intangibles may have a strongelement of expectation, they tend to be informal, not part of the contract, and rarelydeliberately negotiated.
Intangible benefits are advantages or favors that can be extended from one personor group to another. For example, a research organization might ask someone tovolunteer time and expertise on a project in exchange for an intangible benefit ofprestige by affiliation. People can and do “trade favors” in order to build relationships.Intangible benefits often reveal the real motivational factors for people to engage inrelationships and specific activities.
Value networkanalysis
11
Dow
nloa
ded
by D
EL
FT U
NIV
ER
SIT
Y O
F T
EC
HN
OL
OG
Y A
t 12:
08 2
8 M
arch
201
7 (P
T)
“Roles” are the agents of value conversionThe organisation or “the firm” is typically referred to as a discrete entity, when in factit consists of real people playing a variety of roles in different activities. Any rolecontrols a set of tangible and intangible assets or resources that support execution ofthe role. People (as individuals groups or organizations) play each role by processingthose assets and resources into negotiable value outputs. Roles also process differentinputs by using them directly as resources for themselves or they convert them intofinancial and non-financial assets that accrue to the firm. Therefore, assessing valueconversion is particularly valuable when focused on a single role and the way that roleengages in value conversion. Roles describe how people contribute to a particularactivity.
The organization chart is an attempt to describe recurring roles or functions in thefirm. However, it is essential to understand value network roles separately fromorganizational roles. In any given activity, these roles may be the same, but it is moreuseful to consider that every “job” or business unit actually involves a number ofdifferent roles in different business activities. It is easier to understand valueconversion by considering the actual roles in an activity, and not confusing the rolewith what person or business unit may be filling the role at any given moment.
Roles and value network strategiesPeople playing roles are responsible for using the assets under their control to createvalue outputs or deliverables that can be traded for other forms of value, whetherfinancial or non-financial. Basically, each role initiates or offers a potential deliverablefor trade that becomes a completed value transaction upon acceptance by another rolein the network. So, although value can be offered at the role level, it is only when thatvalue is accepted or validated by another role in the network that the value conversion iscomplete.
Acceptance of a value offering is contextual and dependent upon the functioning ofthe whole network or system of value. In other words, a deliverable is considered valuein one context but not in another. Value is therefore an emergent property of thenetwork, so understanding the functioning of the network as a whole is essential tounderstanding exactly how and why value is created. Although it is useful at the rolelevel to understand one’s role in the network and manage one’s value inputs andoutputs, the dynamics of value in a network are dependent upon network effects, andone cannot determine value by simply adding up all the roles and their outputs.
Developing a value network strategy requires understanding the shared purposeand values of the network, then carefully selecting the role(s) one chooses to play in thenetwork. The emergent purpose and values of the network are revealed through thepattern of roles and value exchanges in service to fulfilling an economic or social goalor output. The shared purpose and values may be either tacit or explicit but can bededuced from the network patterns. Value is continually being negotiated in thiscontext of overall purpose and values. Sustainability of the network is dependent uponthere being a high level of both transactional and network perceived value. Figure 2builds on Figure 1 by depicting the value conversion strategy of a group of participantsinto the fabric of the value network itself.
JIC9,1
12
Dow
nloa
ded
by D
EL
FT U
NIV
ER
SIT
Y O
F T
EC
HN
OL
OG
Y A
t 12:
08 2
8 M
arch
201
7 (P
T)

Figure 2.Value network strategy
model
Value networkanalysis
13
Dow
nloa
ded
by D
EL
FT U
NIV
ER
SIT
Y O
F T
EC
HN
OL
OG
Y A
t 12:
08 2
8 M
arch
201
7 (P
T)
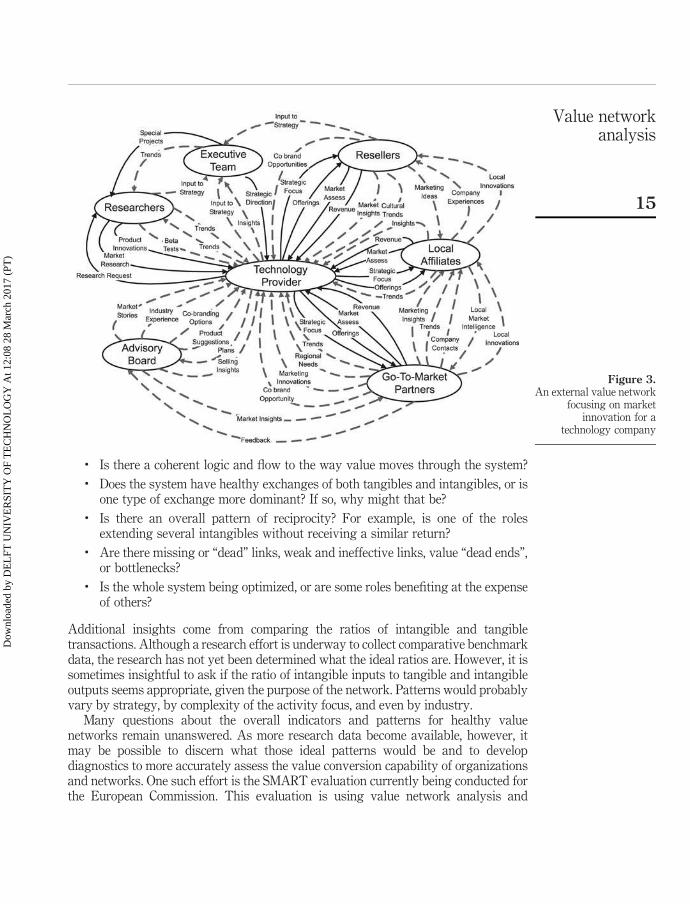
Mapping the networkIn order to fully develop a value network strategy it is necessary to first map out thevalue exchanges across the network. This mapping method relies on only three simpleelements – roles, deliverables, and transactions:
(1) Roles are played by real people or participants in the network who providecontributions and carry out functions. Participants have the power to initiateaction, engage in interactions, add value, and make decisions. They can beindividuals; small groups or teams; business units, whole organisations;collectives, such as business webs or industry groups; communities; or evennation states.
(2) Transactions, or activities, originate with one participant and end with another.The arrow is a directional link that represents movement and denotes thedirection of what passes between two roles. Solid lines are formal contractexchanges around product and revenue, while the dashed lines depict theintangible flows of market information and benefits.
(3) Deliverables are the actual “things” that move from one role to another. Adeliverable can be physical (e.g. a document or a table) or it can be non-physical(e.g. a message or request that is only delivered verbally). It can also be aspecific type of knowledge, expertise, advice, or information about something,or a favor or benefit that is bestowed upon the recipient.
In Figure 3, the nodes depict roles in an activity, and the arrows with labels indicate allthe important transactions through which deliverables are conveyed from one role toanother. The diagram shows an external facing value network focusing on marketinnovation for a technology company.
Analyzing the value networkOnce all of the critical roles, value exchanges and transactions have been identifiedthen it is possible to do full value network analysis. Analyzing a value networkrequires addressing three basic questions. The first question is about assessing thevalue dynamics, health and vitality, and value conversion capability of the system as awhole. The second and third questions concentrate on each specific role as it relates tovalue conversion. The basic questions are:
(1) Exchange analysis – What is the overall pattern of exchanges and value creationin the system as a whole? How healthy is the network and how well is itconverting value?
(2) Impact analysis – What impact does each value input have on the roles involvedin terms of value realization?
(3) Value creation analysis – What is the best way to create, extend, and leveragevalue, either through adding value, extending value to other roles, or convertingone type of value to another?
Exchange analysisAn exchange analysis assesses the overall patterns of value exchange. Some keyquestions are:
JIC9,1
14
Dow
nloa
ded
by D
EL
FT U
NIV
ER
SIT
Y O
F T
EC
HN
OL
OG
Y A
t 12:
08 2
8 M
arch
201
7 (P
T)
. Is there a coherent logic and flow to the way value moves through the system?
. Does the system have healthy exchanges of both tangibles and intangibles, or isone type of exchange more dominant? If so, why might that be?
. Is there an overall pattern of reciprocity? For example, is one of the rolesextending several intangibles without receiving a similar return?
. Are there missing or “dead” links, weak and ineffective links, value “dead ends”,or bottlenecks?
. Is the whole system being optimized, or are some roles benefiting at the expenseof others?
Additional insights come from comparing the ratios of intangible and tangibletransactions. Although a research effort is underway to collect comparative benchmarkdata, the research has not yet been determined what the ideal ratios are. However, it issometimes insightful to ask if the ratio of intangible inputs to tangible and intangibleoutputs seems appropriate, given the purpose of the network. Patterns would probablyvary by strategy, by complexity of the activity focus, and even by industry.
Many questions about the overall indicators and patterns for healthy valuenetworks remain unanswered. As more research data become available, however, itmay be possible to discern what those ideal patterns would be and to developdiagnostics to more accurately assess the value conversion capability of organizationsand networks. One such effort is the SMART evaluation currently being conducted forthe European Commission. This evaluation is using value network analysis and
Figure 3.An external value network
focusing on marketinnovation for a
technology company
Value networkanalysis
15
Dow
nloa
ded
by D
EL
FT U
NIV
ER
SIT
Y O
F T
EC
HN
OL
OG
Y A
t 12:
08 2
8 M
arch
201
7 (P
T)
intellectual capital indicators to assess innovation deployment networks in member statesand regions of the European Union. The final results of this study may well provide atypology of value network patterns that correlate with macro-economic indicators andintellectual capital indicators at the local level (European Commission, 2007).
Impact analysis for value realizationBecause roles are the critical agents for value conversion, it is helpful to explore valuecreation at the level of key roles. An impact analysis shows whether a role is realizingvalue from the inputs it receives. Value realization is the act of a turning a value input,either tangible or intangible, into real gains, benefits, or assets that contribute to thesuccess of the participants and their organization. The impact analysis is designed to:
. assess how specific value inputs are bringing value or benefit to each role;
. assess the overall tangible and intangible cost/benefit for each value input;
. identify value realization opportunities to better leverage value received;
. identify potential opportunities for value conversion; and
. link the key value network transactions and deliverables to financial andnon-financial scorecards.
How to do itThe impact analysis can be effectively executed in a spreadsheet.
. Determine if the impact is going to be evaluated for only the role being examinedor for how value accrues to the company as a whole. If both are being evaluated,two separate analysis tables can be created or extra fields can be added.
. Create a spreadsheet or table by listing the transactions on one axis and the keyimpact categories on the other. Icons, numeric values, or symbols can be used toindicate the degree of positive or negative impact. Actual performance indicators(current or targeted) can be included in the table as well.
What to askIn general, considering each transaction and its deliverable in turn, conduct anexpanded cost benefit analysis. In this way, it is possible to determine whether thetransaction is creating value and what costs and risks are incurred as a result of thetransaction.
(1) Activities generated – What is the immediate visible response to this particularinput? In other words, what activities or behaviors are triggered by this input:. What decisions does it trigger?. What is involved in processing or handling of the input?. What communication is needed as a result of the input?
(2) Costs – What are the costs and risks of these activities? What is at risk whenhandling this input or when not handling it well? What are the demands onresources and assets?Tangible costs and resource needs:. financial investments or operating capital;. time and materials; and
JIC9,1
16
Dow
nloa
ded
by D
EL
FT U
NIV
ER
SIT
Y O
F T
EC
HN
OL
OG
Y A
t 12:
08 2
8 M
arch
201
7 (P
T)
. facilities and equipment.Intangible costs and resource needs. What are the demands on:
. human skills and competence?
. internal structures and systems?
. business relationships?
. brand and identity?Benefits. What are the benefits of this input?
. increased tangible value, by directly generating revenue, improving thequality of product or services, or reducing costs;
. improved current capability, by increasing the speed or quality of valueconversion, generating greater innovation, or improving organizationalenvironment or culture; and
. expanded future capability (intangible value), by adding to or improving thestore of knowledge, enabling greater collaboration, learning, and skilldevelopment, increasing intellectual capital or intangible assets, increasinghuman competence, building internal structures, improving our businessrelationships or brand recognition, fine tuning strategy, reinforcing values,or supporting one’s identity, or being a good citizen, socially andenvironmentally.
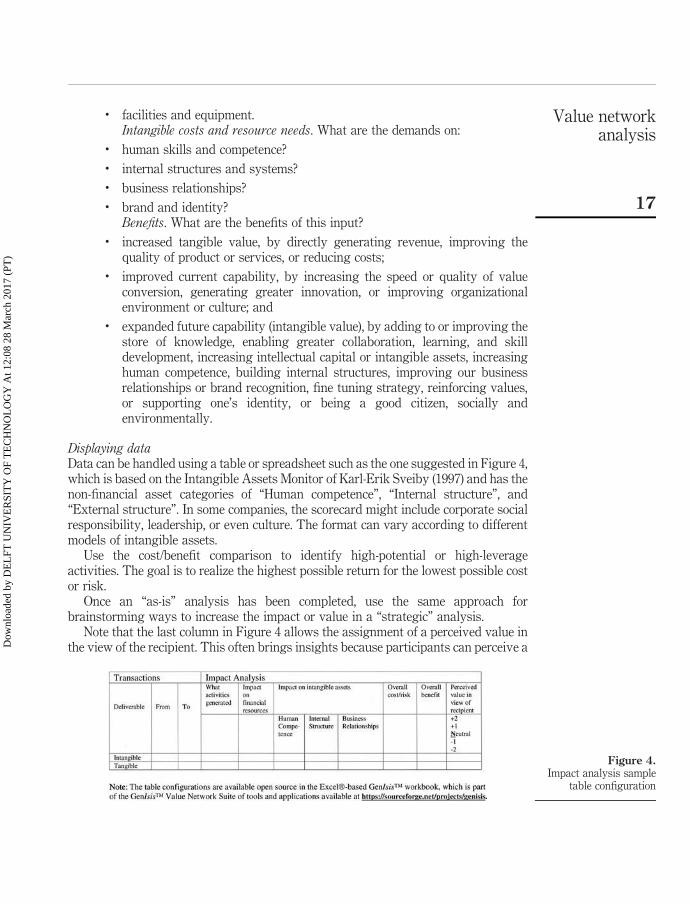
Displaying dataData can be handled using a table or spreadsheet such as the one suggested in Figure 4,which is based on the Intangible Assets Monitor of Karl-Erik Sveiby (1997) and has thenon-financial asset categories of “Human competence”, “Internal structure”, and“External structure”. In some companies, the scorecard might include corporate socialresponsibility, leadership, or even culture. The format can vary according to differentmodels of intangible assets.
Use the cost/benefit comparison to identify high-potential or high-leverageactivities. The goal is to realize the highest possible return for the lowest possible costor risk.
Once an “as-is” analysis has been completed, use the same approach forbrainstorming ways to increase the impact or value in a “strategic” analysis.
Note that the last column in Figure 4 allows the assignment of a perceived value inthe view of the recipient. This often brings insights because participants can perceive a
Figure 4.Impact analysis sample
table configuration
Value networkanalysis
17
Dow
nloa
ded
by D
EL
FT U
NIV
ER
SIT
Y O
F T
EC
HN
OL
OG
Y A
t 12:
08 2
8 M
arch
201
7 (P
T)
particular transaction quite differently. (It is also possible to have participants assessthe perceived value of the network itself.)
A very natural extension of this table would be to include more traditional ROIperformance indicators or performance targets. Other factors that can be included arecosts and benefits in terms of corporate responsibility and brand.
Value creation analysis: converting intangible assets into negotiable valueValue creation analysis looks at how each role adds value to the network. The roots ofthis analysis lie in the principles of value-added accounting and value chain analysis.The theory goes that, at every point along the value chain, one should add value to theproduct or service. In value network terms, this means that when a role receives a valueinput, ideally the people playing that role would find ways to use that input to providegreater value in the form of products and services. The value creation analysisbroadens these questions to consider and assess intangible as well as tangible value.
Value creation analysis is focused on the value creation and output of each role,much as impact analysis looks at how a role gains or benefits from an input. Of course,if participants can both gain value for themselves and also leverage that input for agreater value output, then that is really maximizing value. Like impact analysis, valuecreation analysis is basically an expanded cost/benefit analysis, with a focus on assetutilization. So the key questions are:
. How well are assets being used to create this value output?
. What value features or enhancements are provided with this output?
. What is the level of benefit to the business in providing this output?
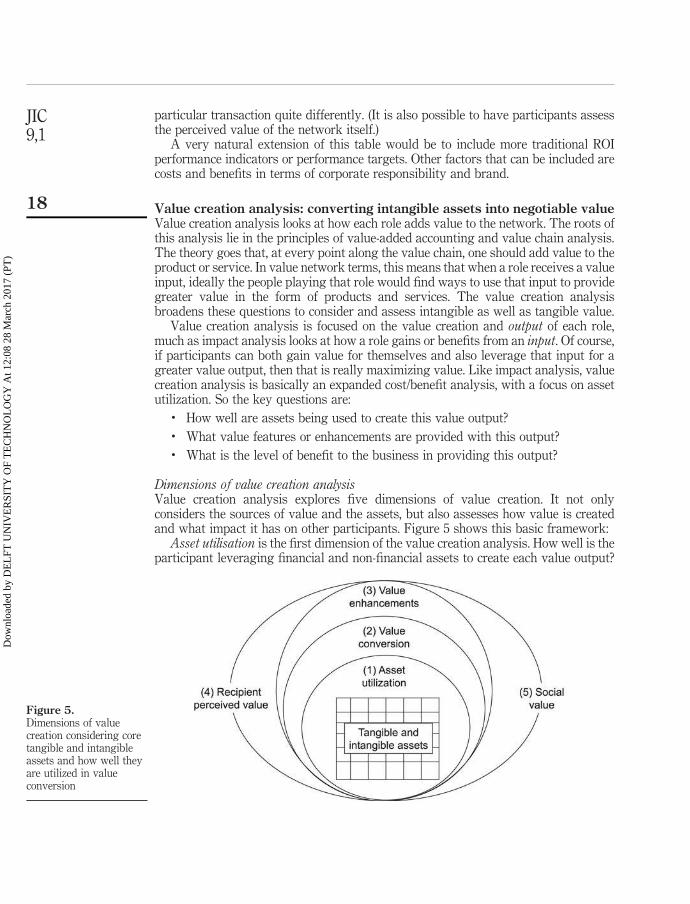
Dimensions of value creation analysisValue creation analysis explores five dimensions of value creation. It not onlyconsiders the sources of value and the assets, but also assesses how value is createdand what impact it has on other participants. Figure 5 shows this basic framework:
Asset utilisation is the first dimension of the value creation analysis. How well is theparticipant leveraging financial and non-financial assets to create each value output?
Figure 5.Dimensions of valuecreation considering coretangible and intangibleassets and how well theyare utilized in valueconversion
JIC9,1
18
Dow
nloa
ded
by D
EL
FT U
NIV
ER
SIT
Y O
F T
EC
HN
OL
OG
Y A
t 12:
08 2
8 M
arch
201
7 (P
T)

The indicators used for this determination can be as simple as a three-pointhigh/medium/low subjective value, such as:
. high – this asset is being leveraged or utilized very well to create this output;
. medium – this asset is being utilized to an average degree; and
. low – this asset is being utilized poorly or not at all.
Indicators also can be much more involved and include hard indicators, such asfinancial costs, person-hours required, equipment costs or system demands, efficiencyfactors around speed and quality, external infrastructure required, and partnershipscosts.
The second dimension involves looking at the value conversion process throughwhich assets are turned into value outputs. Value conversion is achieved by convertingone type of value input into another kind of value as an output.
For example, if a participant receives an item of competitive intelligence (anintangible knowledge input) from another participant, how could the first participantconvert it into a value output?
. add value by contributing insights and providing it as an intangible deliverableto another business partner;
. extend the value by making it available for other value network partners toaccess; or
. convert the competitive intelligence into a tangible value offering that cangenerate revenue.
An example of this last strategy would be to publish an industry analysis to sell as aproduct. Or, conversely, if the participant purchases the competitive intelligence as atangible, it could be converted into intangible value by providing it at no cost as anintangible benefit for a colleague or strategic partner.
The third dimension considers what specific value enhancements or value featuresare created or added that make this value output unique:
. addition of value by enhancing the basic input (e.g. obtaining an industry reportsupplier and adding an expert commentary); or
. extension of a value gain to other participants (e.g. distributing or broadcasting abasically unchanged knowledge output to other participants).
The fourth dimension of value is the transaction’s perceived value from the perspectiveof people who are the direct recipients of this value output. How highly does therecipient of the output value it? Perceived value could simply be a high/medium/lowassessment on the part of the participant who receives the value input. If everyone inthe network has completed an impact analysis, then that would provide the mostaccurate data. If an impact analysis has not been completed or it is not possible to do,whoever is doing the value creation analysis can simply estimate the perceived value.Needless to say, at some point, a reality check is needed to assess the accuracy of thatestimate.
Comparing the cost or utilization factor to the perceived value of the output can helpevaluate investment decisions or value creation strategies. Whenever a value is
Value networkanalysis
19
Dow
nloa
ded
by D
EL
FT U
NIV
ER
SIT
Y O
F T
EC
HN
OL
OG
Y A
t 12:
08 2
8 M
arch
201
7 (P
T)

provided, the participant is looking for the highest possible value for the recipient andthe highest possible benefit for himself or herself, at the lowest possible cost.
Social value is the fifth dimension. This looks at the value (or negative value in termsof costs) that these outputs hold for industry, for society, and for the environment. Inother words, it assesses what accrues to indirect recipients of the value outputs.
How to do itValue creation analysis should be conducted after completion of the visual valuenetwork map and after an initial “as-is” exchange analysis. It can be done either beforeor after an impact analysis, or any time one is ready to focus on the value beingprovided by a single role or participant, or by the network overall:
. determine which role(s) is going to be the focus of the analysis;
. create a spreadsheet or table by listing the transactions on one axis and the keyvalue creation questions on the other axis;
. the table can be customized for any financial and non-financial scorecard; and
. it is also possible to consider the negative costs or impacts of the value output.
What to askThe basic questions are focused on understanding how effectively this role isgenerating value offerings. Sample questions are:
. What are the core value-creating activities for this role?
. What specific value outputs (tangible and intangible) does it generate andprovide to other roles and participants?
. Is it possible to create more value outputs utilizing the same assets?
. Are the outputs providing value for the system as a whole?
. Are resources adequate to achieve the outputs?
. Are some variables or resource constraints affecting a participant’s ability tocreate value?
. How quickly and efficiently does this role add, extend or convert value (speed ofvalue creation)?
The example in Figure 6 uses the format from the GenIsise application (see www.value-networks.com), as mentioned previously. Figure 7 shows text details from theoverview in Figure 6.
Combining impact analysis and value creation analysisBy comparing value outputs with inputs, a number of interesting value creationquestions can be addressed for each role:
Figure 6.Value creation analysisoverview
JIC9,1
20
Dow
nloa
ded
by D
EL
FT U
NIV
ER
SIT
Y O
F T
EC
HN
OL
OG
Y A
t 12:
08 2
8 M
arch
201
7 (P
T)

. Is this role actually creating and adding value, or merely extending it?
. Does a disconnect exist with respect to how the value outputs are perceived bythe provider and the recipients?
. Do apparent discontinuities exist, with value outputs seeming to have little or nocorrelation with assets available or with other inputs?
Integration with other business analysis approachesBecause value network analysis focuses on both tangible and intangible transactions,it is compatible with and enhances other business analysis tools (Figure 8). At theBoeing Company and the Mayo Clinic, practitioners of value network analysis whocombine it with lean manufacturing claim that doing the whole system view of thevalue network assures they have a full grasp of context before moving to processanalyses. The big breakthroughs are more likely to be discovered at the whole systemor network level.
Also at Boeing, the Complex Adaptive Systems group and others combine valuenetwork analysis and system dynamics. System dynamics helps uncover structuralissues, while the value network analysis helps identify what roles and interactions areneeded to fix problems. At Cisco and Telenor, value network analysis is being used inthe customer support environment in combination with organizational networkanalysis (ONA) (Allee and Taug, 2006). After the critical intangible exchanges havebeen identified, the ONA helps determine whether the human pathways are really openfor the exchanges and knowledge sharing to take place. And, of course, value networkanalysis combines smoothly with other approaches to intangible asset management.
Due to the compatibility of value network analysis with other business modelingtools, it can serve as an integrative language for modeling a business or value network.The Value Networks Consortium and the open source movement are now focused on
Figure 7.Value creation analysis
Value networkanalysis
21
Dow
nloa
ded
by D
EL
FT U
NIV
ER
SIT
Y O
F T
EC
HN
OL
OG
Y A
t 12:
08 2
8 M
arch
201
7 (P
T)

Figure 8.Value network analysisand other businessanalysis approaches.Illustration co-developedwith Bob Wiebe of TheBoeing Company
JIC9,1
22
Dow
nloa
ded
by D
EL
FT U
NIV
ER
SIT
Y O
F T
EC
HN
OL
OG
Y A
t 12:
08 2
8 M
arch
201
7 (P
T)

developing standards for a value network information object model that would beXBRL enabled to support Enhanced Business Reporting Language.
ConclusionValue conversion is one of the most challenging questions for those trying tounderstand the economic principles of creating value from intangibles. It is understoodthat intangibles do not work like other resources, yet the struggle to come up with aviable theory of knowledge economics continues. Value network analysis can provide asystematic way for approaching the dynamics of intangible value realization,interconvertability, conversion, and creation. The key to understanding the knowledgeeconomy lies in not only understanding intangibles as assets, but in coming to termswith how they are set into motion in unique configurations of relationships,interactions, and resources in value conversion networks.
References
Allee, V. (2000), “The value evolution”, Journal of Intellectual Capital, Vol. 1, pp. 17-32.
Allee, V. (2002), “A value network approach for measuring and modeling intangibles”, paperpresented at the Transparent Enterprise Conference, Madrid, available at: www.vernaallee.com
Allee, V. (2003), The Future of Knowledge: Increasing Prosperity through Value Networks,Butterworth-Heinemann, Boston, MA.
Allee, V. and Taug, J. (2006), “Collaboration, innovation and value creation at a global telecom”,The Learning Organization, Vol. 13 No. 5, pp. 569-78.
Benkler, Y. (2006), The Wealth of Networks: How Social Production Transforms Markets andFreedom, Yale University Press, New Haven, CT.
Bovet, D. and Martha, J. (2000), Value Nets, Wiley, New York, NY.
Cross, R. and Parker, A. (2003), The Hidden Power of Social Networks, Harvard Business SchoolPress, Boston, MA.
Dawson, R. (2003), Living Networks: Leading Your Company, Customers, and Partners in theHyper-Connected Economy, Prentice-Hall, New York, NY.
Eccles, R.G., Herz, R.H., Keegan, E.M. and Phillips, D.M.H. (2001), The Value ReportingRevolution, PricewaterhouseCoopers, New York, NY.
Edvinsson, L. and Malone, M.S. (1997), Intellectual Capital: Realizing Your Company’s True Valueby Finding its Hidden Brainpower, Harper Business, New York, NY.
European Commission (2007), “Effectiveness of IST-RTD impacts on the EU innovation system”,Tender No. CPP44A-2006, Directorate C Lisbon Strategy and Policies for the InformationSociety, Unit C3, Evaluation and Monitoring, Brussels.
Granovetter, M. and Swedberg, M. (2001), The Sociology of Economic Life, Westview Press,Boulder, CO.
Henderson, H. (2006), Ethical Markets: Growing the Green Economy, Chelsea Green, White RiverJunction, VT.
Homans, G.C. (1958), “Social behavior as exchange”, American Journal of Sociology, Vol. 63,pp. 597-606.
Iansiti, M. and Levien, R. (2004), The Keystone Advantage, Harvard Business School Press,Boston, MA.
Value networkanalysis
23
Dow
nloa
ded
by D
EL
FT U
NIV
ER
SIT
Y O
F T
EC
HN
OL
OG
Y A
t 12:
08 2
8 M
arch
201
7 (P
T)

Lev, B. (2001), Intangibles: Management, Measurement and Reporting, Brookings Institution,Washington, DC.
Lietaer, B. (2001), The Future of Money, Century, London.
MacCauley, S. (1963), “Non-contractual relations in business: a preliminary study”, AmericanSociological Review, Vol. 28 No. 1, pp. 55-67.
Nohria, N. and Eccles, R.G. (1992), Networks and Organizations, Harvard Business School Press,Boston, MA.
Parolini, C. (1999), The Value Net: A Tool for Competitive Strategy, Wiley, Chichester.
Schwabe, O. (2007), blog, available at: www.oliverschwabe.blogspot.com
Sveiby, K-E. (1997), The New Organizational Wealth: Managing & Measuring Knowledge-BasedAssets, Berrett-Koehler, San Francisco, CA.
Taug, J. (2004), “Intangibles and capital conversion in complex organizations”, dissertation,Fielding Graduate Institute, Santa Barbara, CA.
Wallman, S. and Blair, M. (2000), UnSeen Wealth: Report of the Brookings Taskforce onUnderstanding Intangible Sources of Value, The Brookings Institution, Washington, DC.
Zuboff, S. (2002), The Support Economy: Why Corporations are Failing Individuals and the NextEpisode of Capitalism, Viking, New York, NY.
Corresponding authorVerna Allee can be contacted at: [email protected]
JIC9,1
24
To purchase reprints of this article please e-mail: [email protected] visit our web site for further details: www.emeraldinsight.com/reprints
Dow
nloa
ded
by D
EL
FT U
NIV
ER
SIT
Y O
F T
EC
HN
OL
OG
Y A
t 12:
08 2
8 M
arch
201
7 (P
T)
This article has been cited by:
1. SilvestriAntonella Antonella Silvestri [email protected] Antonella Silvestri is based at theDepartment of Business Administration and Law, Universita degli Studi della Calabria, Arcavacatadi Rende, Italy. She is a Senior Lecturer in Accounting and an Assistant Professor of Accounting.She is a department member at the Department of Business Administration and Law, University ofCalabria. Her main research interests are related to the value relevance of accounting and extra-accountinginformation, to international accounting standards applied to insurance companies and to systems ofmeasurement and reporting of intellectual capital. On these research themes, she has published books,book chapters and journal articles, and she has presented papers to national and international congresses.VeltriStefania Stefania Veltri [email protected] Stefania Veltri is based at the Department of BusinessAdministration and Law, Universita degli Studi della Calabria, Arcavacata di Rende, Italy. She is a SeniorLecturer in Accounting and Assistant Professor of Business Economics. She is a department member atthe Department of Business Administration and Law, University of Calabria. Her main research interestsare related to the value relevance of accounting and extra-accounting information and the systems ofmeasurement, management and reporting of intellectual capital. All these arguments are pursued usingboth quantitative and qualitative methods. On these research themes, she has published books, bookchapters and journal articles (such as Journal of Intellectual Capital, Corporate Communications, Journalof Management and Governance), and she has presented papers to national and international congresses.Department of Business Administration and Law, Universita degli Studi della Calabria, Arcavacata diRende, Italy . 2017. Ethical strategic alliances for the sustainable recovering of a territory. CorporateGovernance: The international journal of business in society 17:2, 230-249. [Abstract] [Full Text] [PDF]
2. Michael Leyer, Jutta Stumpf-Wollersheim, Francesco Pisani. 2017. The influence of process-orientedorganisational design on operational performance and innovation: a quantitative analysis in the financialservices industry. International Journal of Production Research 85, 1-12. [CrossRef]
3. Amir Zakery, Abbas Afrazeh. 2017. Analysing intellectual capital management and growth based ondynamic modelling. Knowledge Management Research & Practice 15:1, 101-113. [CrossRef]
4. Ben Roelens, Wout Steenacker, Geert Poels. 2017. Realizing strategic fit within the business architecture:the design of a Process-Goal Alignment modeling and analysis technique. Software & Systems Modeling. [CrossRef]
5. ZakeryAmir Amir Zakery [email protected] AfrazehAbbas Abbas Afrazeh [email protected] DumayJohnJohn Dumay [email protected] Department of Industrial Engineering and Systems Management,Amirkabir University of Technology, Tehran, Iran Department of Accounting and Corporate Governance,Macquarie University, Sydney, Australia . 2017. Analysing and improving the strategic alignment of firms’resource dynamics. Journal of Intellectual Capital 18:1, 217-240. [Abstract] [Full Text] [PDF]
6. References 393-395. [CrossRef]7. Asim Majeed, Rehan Bhana, Anwar Ul Haq, Hanifa Shah, Mike-Lloyd Williams, Andy TillLiving Labs
(LILA): An Innovative Paradigm for Community Development—Project of “XploR” Cane for the Blind31-46. [CrossRef]
8. Indika Kumara, Jun Han, Alan Colman, Malinda Kapuruge. 2017. Software-Defined Service Networking:Performance Differentiation in Shared Multi-Tenant Cloud Applications. IEEE Transactions on ServicesComputing 10:1, 9-22. [CrossRef]
9. Alexandre Barão, José Braga de Vasconcelos, Álvaro RochaKnowledge Management and EngineeringApproach Concepts to Capture Organizational Learning Networks 71-80. [CrossRef]
Dow
nloa
ded
by D
EL
FT U
NIV
ER
SIT
Y O
F T
EC
HN
OL
OG
Y A
t 12:
08 2
8 M
arch
201
7 (P
T)

10. Mervi Hamalainen, Pasi TyrvainenA framework for IoT service experiment platforms in smart-cityenvironments 1-8. [CrossRef]
11. Frederic Vannieuwenborg, Thomas Van der Auwermeulen, Jan Van Ooteghem, An Jacobs, Sofie Verbugge,Didier Colle. 2016. Bringing eCare platforms to the market. Informatics for Health and Social Care 1-25.[CrossRef]
12. Frans Melissen, Elena Cavagnaro, Maartje Damen, Anna Düweke. 2016. Is the hotel industry prepared toface the challenge of sustainable development?. Journal of Vacation Marketing 22:3, 227-238. [CrossRef]
13. Christian Vibe Scheller, Pavel Hruby. 2016. Business Process and Value Delivery Modeling UsingPossession, Ownership, and Availability (POA) in Enterprises and Business Networks. Journal ofInformation Systems 30:2, 5-47. [CrossRef]
14. Xinli Wu, Renwang Li, Yanlong Cao, Yihua Ni, Xing Xu, Xiaoyan Qian. 2016. The value networkoptimization research based on the Analytic Hierarchy Process method and the dynamic programming ofcloud manufacturing. The International Journal of Advanced Manufacturing Technology 84:1-4, 425-433.[CrossRef]
15. Teijo PeltoniemiThe Impact of Digitalization on the Medical Value Network 23-36. [CrossRef]16. Mario Gstrein, Yves Hertig, Bernd Teufel, Stephanie TeufelCrowd Energy – das Kooperationskonzept
für Smart Cities 277-303. [CrossRef]17. J.H.R. van Duin, T. van Dam, B. Wiegmans, L.A. Tavasszy. 2016. Understanding Financial Viability
of Urban Consolidation Centres: Regent Street (London), Bristol/Bath & Nijmegen. TransportationResearch Procedia 16, 61-80. [CrossRef]
18. Anna Aminoff, Katri Valkokari, Outi KettunenMapping Multidimensional Value(s) for Co-creationNetworks in a Circular Economy 629-638. [CrossRef]
19. Alis Oancea, Teresa Florez-Petour, Jeanette Atkinson. 2015. The ecologies and economy of cultural valuefrom research. International Journal of Cultural Policy 1-24. [CrossRef]
20. Frederic Vannieuwenborg, Sofie Verbrugge, Didier ColleIntegrating digital Health services: The role ofthe government and the challenge of cost allocation 81-85. [CrossRef]
21. Lysanne Lessard. 2015. Modeling Value Cocreation Processes and Outcomes in Knowledge-IntensiveBusiness Services Engagements. Service Science 7:3, 181-195. [CrossRef]
22. Sam Solaimani, Harry Bouwman, Timo Itälä. 2015. Networked enterprise business model alignment: Acase study on smart living. Information Systems Frontiers 17:4, 871-887. [CrossRef]
23. Yu-Ting Chen, Ming-Chuan Chiu. 2015. A case-based method for service-oriented value chain andsustainable network design. Advanced Engineering Informatics 29:3, 269-294. [CrossRef]
24. Sharon E. Booth, Shaun B. Kellogg. 2015. Value creation in online communities for educators. BritishJournal of Educational Technology 46:4, 684-698. [CrossRef]
25. Arto Wallin, Marja Harjumaa, Pasi Pussinen, Minna Isomursu. 2015. Challenges of New ServiceDevelopment: Case Video-Supported Home Care Service. Service Science 7:2, 100-118. [CrossRef]
26. Ghadir I. Siyam, David C. Wynn, P. John Clarkson. 2015. Review of Value and Lean in Complex ProductDevelopment. Systems Engineering 18:2, 192-207. [CrossRef]
27. Ben Roelens, Geert Poels. 2015. The Development and Experimental Evaluation of a Focused BusinessModel Representation. Business & Information Systems Engineering 57:1, 61-71. [CrossRef]
28. Stefania Veltri Department of Business Economics, University of Calabria, Arcavacata di Rende (CS),Italy Andrea Venturelli Department of Management, Economics, Mathematics and Statistics, University
Dow
nloa
ded
by D
EL
FT U
NIV
ER
SIT
Y O
F T
EC
HN
OL
OG
Y A
t 12:
08 2
8 M
arch
201
7 (P
T)
of Salento, Lecce, Italy Giovanni Mastroleo Department of Management, Economics, Mathematics andStatistics, University of Salento, Lecce, Italy . 2015. Measuring intellectual capital in a firm belonging toa strategic alliance. Journal of Intellectual Capital 16:1, 174-198. [Abstract] [Full Text] [PDF]
29. Dorine PD van Meeuwen, Quirine J van Walt Meijer, Lianne WL Simonse. 2015. Care Models of eHealthServices: A Case Study on the Design of a Business Model for an Online Precare Service. JMIR ResearchProtocols 4:1, e32. [CrossRef]
30. Freshta PopalyarThreat Model Based Security for Wireless Mesh Networks 325-332. [CrossRef]31. Carl Olsmats, Jari Kaivo-oja. 2014. European packaging industry foresight study—identifying global
drivers and driven packaging industry implications of the global megatrends. European Journal of FuturesResearch 2:1. . [CrossRef]
32. Michel Ehrenhard, Bjorn Kijl, Lambert Nieuwenhuis. 2014. Market adoption barriers of multi-stakeholder technology: Smart homes for the aging population. Technological Forecasting and Social Change89, 306-315. [CrossRef]
33. Manuel Villasalero based at Department of Business Administration, University of Castilla-La Mancha,Ciudad Real, Spain . 2014. Intra-network knowledge roles and division performance in multi-businessfirms. Journal of Knowledge Management 18:6, 1165-1183. [Abstract] [Full Text] [PDF]
34. Joon-Hee Oh, Linda D. Peters, Wesley J. Johnston. 2014. Who's acquiring whom? — Experimentalevidence of firm size effect on B2B mergers and marketing/sales tasks. Industrial Marketing Management43:6, 1035-1044. [CrossRef]
35. Christian Stary based at Business Information Systems–Communications Engineering & KnowledgeManagement Competence Center, Johannes Kepler University of Linz, Linz, Austria . 2014. Non-disruptive knowledge and business processing in knowledge life cycles – aligning value network analysisto process management. Journal of Knowledge Management 18:4, 651-686. [Abstract] [Full Text] [PDF]
36. Joanna Daaboul, Julien Le Duigou, Catherine Da Cunha, Alain Bernard. 2014. Value networks: pullingthe triggers. A combined approach of modelling and simulation for performance evaluation. InternationalJournal of Computer Integrated Manufacturing 27:7, 609-623. [CrossRef]
37. D. Opresnik, M. Hirsch, C. Zanetti, M. Taisch, M. IsajaICT enabled operationalization of collaborativeservitization 1-6. [CrossRef]
38. Nan Zhang, Tapio Levä, Heikki Hämmäinen. 2014. Value networks and two-sided markets of Internetcontent delivery. Telecommunications Policy 38:5-6, 460-472. [CrossRef]
39. Margherita Peruzzini, Eugenia Marilungo, Michele GermaniA QFD-based methodology to supportProduct-Service design in manufacturing industry 1-7. [CrossRef]
40. David Di Zhang, Lee A. Swanson. 2014. Linking Social Entrepreneurship and Sustainability. Journal ofSocial Entrepreneurship 5:2, 175-191. [CrossRef]
41. Nagesh Shukla, John Keast, Darek Ceglarek. 2014. Modelling variations in hospital service delivery basedon real time locating information. Applied Mathematical Modelling 38:3, 878-893. [CrossRef]
42. Samira Keivanpour, Daoud Ait Kadi, Christian Mascle. 2014. Toward a Decision Tool for Eco-DesignStrategy Selection of Aircraft Manufacturers Considering Stakeholders Value Network. SAE InternationalJournal of Materials and Manufacturing 7:1, 73-83. [CrossRef]
43. Dumay John Department of Accounting & Corporate Governance, Faculty of Business & Economics,Macquarie University, New South Wales, Australia . 2014. 15 years of the Journal of Intellectual Capitaland counting. Journal of Intellectual Capital 15:1, 2-37. [Abstract] [Full Text] [PDF]
Dow
nloa
ded
by D
EL
FT U
NIV
ER
SIT
Y O
F T
EC
HN
OL
OG
Y A
t 12:
08 2
8 M
arch
201
7 (P
T)
44. Arto Ojala, Nina HelanderValue Creation and Evolution of a Value Network: A Longitudinal Case Studyon a Platform-as-a-Service Provider 975-984. [CrossRef]
45. Anne Immonen, Marko Palviainen, Eila Ovaska. 2014. Requirements of an Open Data Based BusinessEcosystem. IEEE Access 2, 88-103. [CrossRef]
46. Petri KettunenDirecting High-Performing Software Teams: Proposal of a Capability-Based AssessmentInstrument Approach 229-243. [CrossRef]
47. Manuel Villasalero Department of Business Administration, University of Castilla-La Mancha, CiudadReal, Spain . 2013. Signaling, spillover and learning effects of knowledge flows on division performancewithin related diversified firms. Journal of Knowledge Management 17:6, 928-942. [Abstract] [Full Text][PDF]
48. Marco Montemari Department of Management, Faculty of Economics “G. Fuà”, Università Politecnicadelle Marche, Ancona, Italy Christian Nielsen Department of Business Studies, Aalborg University,Aalborg, Denmark . 2013. The role of causal maps in intellectual capital measurement and management.Journal of Intellectual Capital 14:4, 522-546. [Abstract] [Full Text] [PDF]
49. Leire San-Jose, Jose Luis Retolaza. 2013. Under the Cash Pooling: Does the Cooperation Matter?. Verslas:teorija ir praktika 14:3, 209-216. [CrossRef]
50. Jurgen Munch, Fabian Fagerholm, Petri Kettunen, Max Pagels, Jari PartanenExperiences and Insightsfrom Applying GQM+Strategies in a Systems Product Development Organisation 70-77. [CrossRef]
51. Manuel Hirsch, David Opresnik, Christian Zanetti, Marco TaischLeveraging Assets as a Service forBusiness Intelligence in Manufacturing Service Ecosystems 162-167. [CrossRef]
52. Manuel Hirsch, David OpresnikIn-/tangible assets as a service in manufacturing service ecosystems 1-11.[CrossRef]
53. Donald W. de Guerre, Daniel Séguin, Alicia Pace, Noel Burke. 2013. IDEA: A CollaborativeOrganizational Design Process Integrating Innovation, Design, Engagement, and Action. Systemic Practiceand Action Research 26:3, 257-279. [CrossRef]
54. Mutaz M. Al‐DebeiDepartment of Management Information Systems, The University of Jordan,Amman, Jordan Enas Al‐LoziDepartment of Management Information Systems, Al‐ZaytoonahUniversity of Jordan, Amman, Jordan Guy FitzgeraldDepartment of Information Systems and Computing,Brunel University – West London, London, UK. 2013. Engineering innovative mobile data services.Business Process Management Journal 19:2, 336-363. [Abstract] [Full Text] [PDF]
55. Hari N. Kuchibhotla, Dewayne R. Brown, Qing-An Zeng, Derrek B. DunnAn empirical analysis ofcollective actions in university anchored community wireless networks 1-5. [CrossRef]
56. Ramiro Gonçalves, José Martins, Jorge Pereira, Manuel Au-Yong Oliveira, João José P. Ferreira. 2013.Enterprise Web Accessibility Levels Amongst the Forbes 250: Where Art Thou O Virtuous Leader?.Journal of Business Ethics 113:2, 363-375. [CrossRef]
57. Morteza Alaeddini, Sepideh Salekfard. 2013. Investigating the role of an enterprise architecture projectin the business-IT alignment in Iran. Information Systems Frontiers 15:1, 67-88. [CrossRef]
58. Alexandre Barao, Alberto Rodrigues da SilvaWhat is the Value of Your Network? 265-269. [CrossRef]59. M. M. Yao, D. Wu, X. B. Wu, Z. H. Wu, S. C. ChenBusiness model innovation of modern service
company: A value network perspective 76-80. [CrossRef]60. Frederic Vannieuwenborg, Laurent Mainil, Sofie Verbrugge, Mario Pickavet, Didier ColleBusiness models
for the mobile application market from a developer's viewpoint 171-178. [CrossRef]
Dow
nloa
ded
by D
EL
FT U
NIV
ER
SIT
Y O
F T
EC
HN
OL
OG
Y A
t 12:
08 2
8 M
arch
201
7 (P
T)
61. Zhongjie Wang, Qian Wu, Xiaofei XuValue-Added Analysis of Bi-Lateral e-Business Services 185-192.[CrossRef]
62. Anni-Kaisa Kähkönen, Katrina Lintukangas. 2012. The underlying potential of supply management invalue creation. Journal of Purchasing and Supply Management 18:2, 68-75. [CrossRef]
63. Anni‐Kaisa KähkönenSchool of Business, Lappeenranta University of Technology, Lappeenranta,Finland. 2012. Value net – a new business model for the food industry?. British Food Journal 114:5,681-701. [Abstract] [Full Text] [PDF]
64. SUSANA NICOLA, EDUARDA PINTO FERREIRA, J. J. PINTO FERREIRA. 2012. ANOVEL FRAMEWORK FOR MODELING VALUE FOR THE CUSTOMER, AN ESSAY ONNEGOTIATION. International Journal of Information Technology & Decision Making 11:03, 661-703.[CrossRef]
65. S. Waddell. 2012. Global finance as an action research domain: Testing the boundaries. Action Research10:1, 40-60. [CrossRef]
66. Linda D. Peters The Role of the Knowledgeable Customer in Business Network Learning, Value Creation,and Innovation 127-169. [Abstract] [Full Text] [PDF] [PDF]
67. Arto OjalaSenior Researcher at the Cloud Software Program in the Department of Computer Scienceand Information Systems at the University of Jyväskylä, Jyväskylä, Finland Pasi TyrväinenProfessor ofInformation Systems at the University of Jyväskylä, Jyväskylä, Finland. 2011. Value networks in cloudcomputing. Journal of Business Strategy 32:6, 40-49. [Abstract] [Full Text] [PDF]
68. Rachel Ellaway. 2011. eMedical Teacher. Medical Teacher 33:5, 428-430. [CrossRef]69. Alberto S. Lima, J. Neuman de Souza, A.C. Callado, J. Augusto Oliveira, Jacques Sauve, Antao MouraA
business-driven IT services improvement model 1095-1102. [CrossRef]70. Robert R. Harmon, Haluk DemirkanThe Corporate Sustainability Dimensions of Service-Oriented
Information Technology 601-614. [CrossRef]71. Tzu‐Ju Ann PengBusiness Administration Department, College of Commerce, National Chang‐
Chi University, Taipei, Taiwan, Republic of China, and Centre for Business Performance, Schoolof Management, Cranfield University, Cranfield, UK. 2011. Resource fit in inter‐firm partnership:intellectual capital perspective. Journal of Intellectual Capital 12:1, 20-42. [Abstract] [Full Text] [PDF]
72. Orestes VlismasDepartment of Accounting and Finance, Athens University of Economics and Business,Athens, Greece George VenierisDepartment of Accounting and Finance, Athens University of Economicsand Business, Athens, Greece. 2011. Towards an ontology for the intellectual capital domain. Journal ofIntellectual Capital 12:1, 75-110. [Abstract] [Full Text] [PDF]
73. Aaron M. AnvuurBartlett School of Construction and Project Management, University College London,London, UK Mohan M. KumaraswamyCentre for Infrastructure and Construction Industry Development(CICID), The University of Hong Kong, Hong Kong Gangadhar MaheshCentre for Infrastructureand Construction Industry Development (CICID), The University of Hong Kong, Hong Kong. 2011.Building “relationally integrated value networks” (RIVANS). Engineering, Construction and ArchitecturalManagement 18:1, 102-120. [Abstract] [Full Text] [PDF]
74. Steve WaddellSeeing the whole 69-92. [CrossRef]75. Patrick Zwickl, Peter Reichl, Antonio GhezziOn the Quantification of Value Networks: A Dependency
Model for Interconnection Scenarios 63-74. [CrossRef]76. Toke Koldborg Jensen, Jette Nielsen, Erling P. Larsen, Jens Clausen. 2010. The Fish Industry—Toward
Supply Chain Modeling. Journal of Aquatic Food Product Technology 19:3-4, 214-226. [CrossRef]
Dow
nloa
ded
by D
EL
FT U
NIV
ER
SIT
Y O
F T
EC
HN
OL
OG
Y A
t 12:
08 2
8 M
arch
201
7 (P
T)
77. Mohan M. KumaraswamyDepartment of Civil Engineering, The University of Hong Kong, Hong KongAaron M. AnvuurBartlett School of Construction and Project Management, University College London,London, UK Hedley J. SmythBartlett School of Construction and Project Management, UniversityCollege London, London, UK. 2010. Pursuing “relational integration” and “overall value” through“RIVANS”. Facilities 28:13/14, 673-686. [Abstract] [Full Text] [PDF]
78. B.D. Eaton, S.M. Elaluf-Calderwood, C. SorensenA methodology for analysing business model dynamicsfor mobile services using control points and triggers 1-8. [CrossRef]
79. Darshan A. DesaiAdjunct Assistant Professor, Borough of Manhattan Community College, New York,New York, USA and Graduate School of Business, Touro College, New York, New York, USA. 2010. Co‐creating learning: insights from complexity theory. The Learning Organization 17:5, 388-403. [Abstract][Full Text] [PDF]
80. Angelo Corallo, Mariangela LazoiValue network collaborations for innovations in an aerospace company1-8. [CrossRef]
81. Tsung-Yi Chen, Derchian Tsaih, Yuh-Min Chen. 2010. A knowledge-commercialised business modelfor collaborative innovation environments. International Journal of Computer Integrated Manufacturing23:6, 543-564. [CrossRef]
82. Maria SolitanderDepartment of Management and Organization, Hanken School of Economics, Helsinki,Finland Annika TidströmDepartment of Management and Organization, University of Vaasa, Vaasa,Finland. 2010. Competitive flows of intellectual capital in value creating networks. Journal of IntellectualCapital 11:1, 23-38. [Abstract] [Full Text] [PDF]
83. Zhongjie Wang, Xiaofei Xu, Dianhui Chu, Chao Ma, Xu ShaoValue Annotation for Service ModelAnalysis 219-225. [CrossRef]
84. Paul Johannesson, Birger Andersson, Hans Weigand. 2010. Resource Analysis and Classification forPurpose Driven Value Model Design. International Journal of Information System Modeling and Design1:1, 56-78. [CrossRef]
85. Monique Janneck, Henning StaarVirtual Micro-Politics: Informal Tactics of Influence and Power in Inter-Organizational Networks 1-10. [CrossRef]
86. B.D. Eaton, Silvia M. Elaluf-Calderwood, Carsten SørensenThe Role of Control Points in DeterminingBusiness Models for Future Mobile Generative Systems 459-463. [CrossRef]
87. Celene Navarrete, J. Ramon Gil-Garcia, Sehl Mellouli, Theresa A. Pardo, Jochen SchollMultinationalE-Government Collaboration, Information Sharing, and Interoperability: An Integrative Model 1-10.[CrossRef]
88. Michel DionDépartement de Management, Faculté d'administration, Université de Sherbrooke,Sherbrooke, Canada. 2009. Corporate crime and the dysfunction of value networks. Journal of FinancialCrime 16:4, 436-445. [Abstract] [Full Text] [PDF]
89. Peter A. SmithVerna AlleeValue Networks LLC, San Francisco, California, USA. 2009. Value‐creatingnetworks: organizational issues and challenges. The Learning Organization 16:6, 427-442. [Abstract][Full Text] [PDF]
90. Frank Steiner, Robert HarmonThe impact of intangible value on the design and marketing of newproducts and services: An exploratory approach 2066-2079. [CrossRef]
91. Abbas MonnavarianAssociate Professor based in the Faculty of Management, University of Tehran,Tehran, Iran Azadeh AminiStudent based in the Faculty of Management, University of Tehran, Tehran,
Dow
nloa
ded
by D
EL
FT U
NIV
ER
SIT
Y O
F T
EC
HN
OL
OG
Y A
t 12:
08 2
8 M
arch
201
7 (P
T)
Iran. 2009. Do interactions within networks lead to knowledge management?. Business Strategy Series 10:3,139-155. [Abstract] [Full Text] [PDF]
92. Rob Allan, Rob Crouchley, Ali RobertsonCollaborative and Distributed Innovation and Research inBusiness Activity 310-329. [CrossRef]
93. Rongbin W.B. Lee, Cherie C.Y. Lui, Jessica Y.T. Yip, Eric. Y.H. TsuiExploration in Intellectual CapitalPractice 225-238. [CrossRef]
94. Yusof Ismail, Suhaimi Mhd SarifMicro-Level Stickiness as a Threat to Client Centric Knowledge Transferamong ICT Firms in Malaysian Technology Parks 165-188. [CrossRef]
95. Abdelnasser AbdelaalThe Adoption of the Internet to Support Arab Academics 201-214. [CrossRef]96. Abdelnasser AbdelaalThe Adoption of the Internet to Support Arab Academics 786-799. [CrossRef]97. Carlos Agostinho, Ricardo Jardim-Goncalves, Adolfo Steiger-GarcaoUnderpinning EISB with Enterprise
Interoperability Neighboring Scientific Domains 41-76. [CrossRef]98. Carlos Agostinho, Ricardo Jardim-Goncalves, Adolfo Steiger-GarcaoUnderpinning EISB with Enterprise
Interoperability Neighboring Scientific Domains 1550-1581. [CrossRef]99. Mutaz M. Al-Debei, Anas Aloudat, Enas Al-Lozi, Mohammad Mourhaf Al AsswadThe Role of Value
Networks in the Design of Mobile Platforms 123-137. [CrossRef]
Dow
nloa
ded
by D
EL
FT U
NIV
ER
SIT
Y O
F T
EC
HN
OL
OG
Y A
t 12:
08 2
8 M
arch
201
7 (P
T)