journal of luminescence - dskpdfugcdskpdf.unipune.ac.in/journal/uploads/ph/ph100080-a-3.pdf ·...
TRANSCRIPT

Journal of Luminescence 132 (2012) 2619–2625
Contents lists available at SciVerse ScienceDirect
Journal of Luminescence
0022-23
http://d
n Corr
E-m
geetash
journal homepage: www.elsevier.com/locate/jlumin
Studies on luminescence properties and energy transfer in Ce/Dy co-dopedCaS nano-phosphors
Geeta Sharma a,n, S.W. Gosavi a, S.P. Lochab c, Nafa Singh b
a Department of Physics, University of Pune, Pune 07, Indiab Department of Physics, Kurukshetra Institute of Technology and Management, Kurukshetra, Indiac Inter University Accelerator Center, Aruna Asaf Ali Marg, New Delhi 110067, India
a r t i c l e i n f o
Article history:
Received 14 October 2011
Received in revised form
20 April 2012
Accepted 27 April 2012Available online 7 May 2012
Keywords:
Energy transfer
Luminescence
Nanophosphors
13/$ - see front matter & 2012 Elsevier B.V. A
x.doi.org/10.1016/j.jlumin.2012.04.052
esponding author. Tel.: þ91 8275485117.
ail addresses: [email protected],
[email protected] (G. Sharma).
a b s t r a c t
Luminescence properties of CaS:Ce co-doped with dysprosium has been studied. Ce/Dy co-doped CaS
nanophosphors (CaS:Ce0.25Dy0.75, CaS:Ce0.50Dy0.50, CaS:Ce0.75Dy0.25) were synthesized using the solid
state diffusion method. The phase purity of the samples was confirmed using XRD data. The particle
size was calculated using Debye–Scherrer formula and was found to be varying between 50 and 60 nm
for all the three samples (CaS:Ce0.25Dy0.75, CaS:Ce0.50Dy0.50 and CaS:Ce0.75Dy0.25). TEM image analysis of
CaS:Ce0.50Dy0.50 shows nearly spherical particles with diameter varying between 50 and60 nm. One
way energy transfer from Dy3þ to Ce3þ in CaS host has been investigated using photoluminescence
studies. Thermoluminescence of these nanophosphors has been studied for 0.5 Gy–21 kGy dose of
gamma rays and the dose linearity of CaS:Ce0.50Dy0.50 has been compared with CaSO4:Dy (standard TL
dosimeter). Linear behavior over a large dose range between 0.5 Gy and 21 kGy was found for
CaS:Ce0.50Dy0.50 as compared to CaSO4:Dy (nanocrystalline and microcrystalline) but it is found to be
less sensitive than microcrystalline CaSO4:Dy. To identify the peaks of Ce3þ and Dy3þ in CaS, the TL
spectra of CaS, CaS:Ce, CaS:Dy and CaS:Ce0.50Dy0.50 were recorded. The addition of dopants does not add
new peaks in CaS but aid to enhance the TL emission. The peaks in CaS may be associated to intrinsic
traps in the host lattice.
& 2012 Elsevier B.V. All rights reserved.
1. Introduction
The search for better luminescent materials for display appli-cations is a never ending quest. There are numerous luminescentnanocrystalline oxides and sulfides [1–6] and a lot many can beachieved either by forming an admixture of host lattices [5–9] orby doping. A large number of phosphors can be achieved byintroducing transition metal ions or rare earth elements to thesulfide and oxide hosts. Co-doping is another good option toincrease the luminescence efficiency of these phosphor materials.
CaS based phosphors are well known for their applications intelevision screens, fluorescence lamps, thermoluminescence dosim-etery and high pressure mercury lamps [10–15]. CaS is a wide bandgap semiconductor hence can accommodate a variety of dopants[16–19]. Its emission color can be tuned over a large part of thevisible spectrum, by changing the dopants. Ce3þ is an important rareearth ion which gives green emission with CaS, with very broad bandemission [20]. The tunable green emission may be achieved by the
ll rights reserved.
incorporation of an additional co-doping element. Few studies on co-doped CaS:Ce phosphors have been reported using samarium.Paulose et al. have studied the relaxation kinetics of Sm:Ce dopedCaS phosphors [21]. Ping et al. have studied the optically stimulatedluminescence in SrS:Eu, Sm and CaS:Eu, Sm [22].
In this work, Dy3þ co-doped CaS:Ce nanocrystalline powderswere synthesized using the solid state diffusion method, withvarying concentration of Ce3þ and Dy3þ in it (CaS:CexDy1�x{x¼0.25,0.50, 0.75}). The tunability of Ce3þ related green emission in CaS:Cenanocrystalline system, with blue emitting Dy3þ , which is based onthe one way energy transfer from Dy3þ to Ce3þ , has been investi-gated using photoluminescence. The thermoluminescence character-istics of these phosphors have been studied using gamma as theexcitation source. The thermoluminescent characteristics of thesenanophosphors have been compared with the standard TL dosimeter(CaSO4:Dy). An attempt has been made to identify the peaks asso-ciated with Ce3þ and Dy3þ in CaS using thermoluminescence.
2. Experimental section
Solid state diffusion method [20] was used for synthesizingCaS:Ce, Dy (0.2 mol %) with varying concentrations of cerium and

G. Sharma et al. / Journal of Luminescence 132 (2012) 2619–26252620
dysprosium in the host lattice (such that the total concentrationof dopants, i.e. Ce plus Dy remained constant and only Ce/Dy ratiovaried). Samples with following cerium and dysprosium concen-tration: CaS:Ce0.25Dy0.75, CaS:Ce0.50Dy0.50, CaS:Ce0.75Dy0.25 weresynthesized. Calcium sulfate, dysprosium nitrate, cerium nitrate,sodium thoisulfate, carbon powder and ethanol were used asstarting materials. Carbon reduces sulfate to sulfide at hightemperature whereas sodium thoisulfate (15%) acted as a fluxfor the reaction. The calculated quantities of calcium sulfate,carbon powder, cerium nitrate, dysprosium nitrate and the fluxwere taken and mixed thoroughly with the help of an agate pestleand mortar. The charge was placed in a clean, closed graphitecrucible and a thin layer of carbon powder was spread over it. Thecarbon layer over the charge created a reducing environment.This whole arrangement was placed in a muffle furnace and thecharge was fired at 950 1C for 2 h. After 2 h it was taken out andrapidly crushed while red hot. The details of the synthesisprocedure are also discussed elsewhere in our earlier work [20].
The powder X-Ray Diffraction pattern were recorded by in-situXRD setup (procured from Bruker AXS) having a 3 kW X-rayssource. The photoluminescence measurements were carried outon a Fluoro Max-3 (Jobin–Yvon, Edision, NJ, and USA) equippedwith a photomultiplier tube and a xenon lamp of power 150 W.For recording TL, nanoparticles were irradiated with differentdoses of 60Co g-rays at room temperature. Prior to gammaexposure, the samples were annealed at 400 1C for 10 min andthen quenched on a metallic plate at room temperature to eraseany residual information. TL glow curves were recorded at aheating rate of 10 K/s on a Harshaw TLD reader (Model 3500)fitted with 931B photomultiplier tube (PMT) by taking 5 mg ofsample each time.
Fig. 1. (a) XRD pattern of CaS:CexDy1�x and (b)TEM image of CaS:Ce0.50Dy0.50.
Table 1Calculated structural parameters of CaS:CeXDy1�X using XRD results.
Sample specification FWHM 2y(deg.) Particle Size
(nm)
Lattice Constant
(A)
CaS:Ce0.25Dy0.75 0.1407 31.353 58 5.7016
CaS:Ce0.50Dy0.50 0.1529 31.360 53 5.7003
CaS:Ce0.75Dy0.25 0.1503 31.355 54 5.7012
3. Results and discussion
3.1. Structure of the sample Host
Fig. 1(a) shows the XRD pattern of CaS:CexDy1�x (x¼0.25, 0.50,0.75). The XRD patterns matched perfectly with standard dataavailable in JCPDS (77-2011). The particle size was calculated usingDebye Scherrer formula after correcting for instrumental broadeningand was found to be between 50 and 60 nm for all the threesamples. Table 1 shows the variation in particle size calculated fromthe most intense, (2 0 0) peak and lattice constant with varyingfraction of cerium and dysprosium. We observed an irregularvariation in the particle size as a function of dopant concentration.Lattice constant also differ slightly with varying dopant ratio. Thevalue of 2y and FWHM are also shown in Table 1.
Fig. 1(b) shows the TEM image of CaS:Ce0.50Dy0.50. TEMmicrograph shows nanoparticles having nearly spherical shapewith an average diameter of 50–60 nm. The inset of Fig. 1(b) is theSAED pattern of the nanoparticles formed. The closed ringstructure in SAED pattern confirms the cubic crystalline phaseof the sample. The TEM result is in close agreement with the XRDresult.
3.2. Photoluminescence and the excitation spectra
The tunable emission might be achieved by incorporating co-activators such as red emitting (Sm3þ) or blue emitting (Dy3þ)component into a CaS:Ce system. Hence CaS:CexDy1�x systemwas synthesized with x¼0.25, 0.50, 0.75. The general PL char-acteristics of CaS:Ce (0.2 mol%)and CaS:Dy (0.2 mol%) are shownin Figs. 2(a) and (b). The emission of Ce3þ usually includes twobands, due to transitions between 5d excited state to 2F7/2 and2F5/2 states. The emission spectrum of CaS:Ce consists of peaks at
505 nm and a shoulder at 565 nm [23]. Its excitation peaks arefound at 450 nm and 350 nm in Fig. 2(b). The excitation band at450 nm can be attributed to the 5d crystal field split levelscorresponding to T2g, where as the small 350 nm excitation peakmay be associated with an unknown defect level or it may be dueto the charge transfer transition from the top of the valence bandto the T2g component of the Ce3þ 5d excited state (e.g. transitionfrom the ground state /Ce4þ (T0
2g), S2�(3p6)S to an excited state/Ce3þ(T1
2g), S�(3p5)S, converting a Ce4þ ion back to a Ce3þ inthe T2g excited state). This transition gives rise to a weak peakbecause there is a very small amount of cerium existing as Ce4þ
in CaS [26]. The Dy3þ emission in CaS are in form of a broad bandvarying from 400 nm to 500 nm with peak at 482 nm and anotherpeak at 580 nm. These peaks are observed due to 4F9/2-
6H15/2
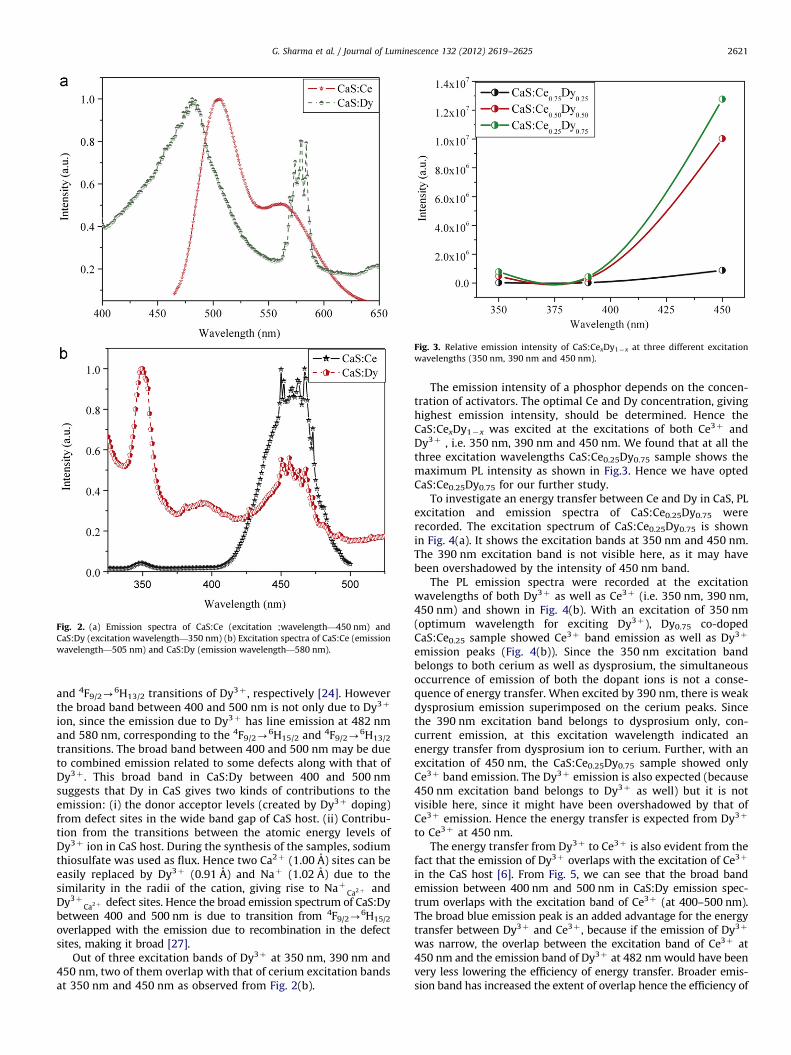
Fig. 2. (a) Emission spectra of CaS:Ce (excitation ;wavelength—450 nm) and
CaS:Dy (excitation wavelength—350 nm) (b) Excitation spectra of CaS:Ce (emission
wavelength—505 nm) and CaS:Dy (emission wavelength—580 nm).
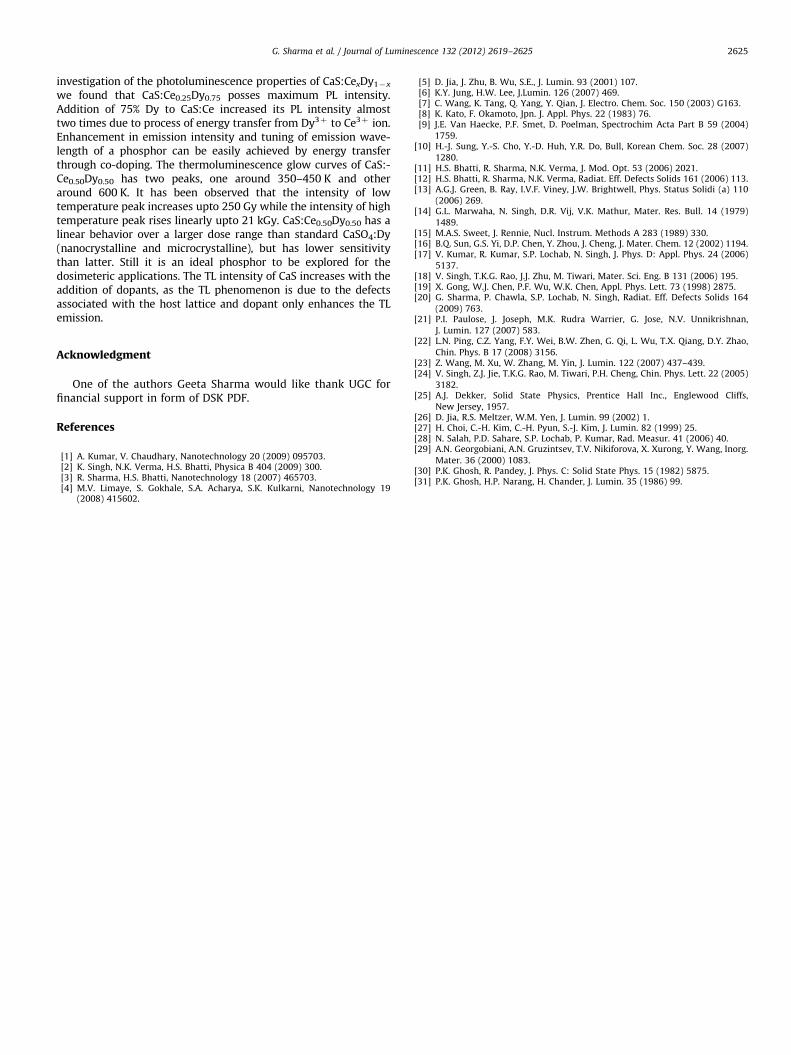
Fig. 3. Relative emission intensity of CaS:CexDy1�x at three different excitation
wavelengths (350 nm, 390 nm and 450 nm).
G. Sharma et al. / Journal of Luminescence 132 (2012) 2619–2625 2621
and 4F9/2-6H13/2 transitions of Dy3þ , respectively [24]. However
the broad band between 400 and 500 nm is not only due to Dy3þ
ion, since the emission due to Dy3þ has line emission at 482 nmand 580 nm, corresponding to the 4F9/2-
6H15/2 and 4F9/2-6H13/2
transitions. The broad band between 400 and 500 nm may be dueto combined emission related to some defects along with that ofDy3þ . This broad band in CaS:Dy between 400 and 500 nmsuggests that Dy in CaS gives two kinds of contributions to theemission: (i) the donor acceptor levels (created by Dy3þ doping)from defect sites in the wide band gap of CaS host. (ii) Contribu-tion from the transitions between the atomic energy levels ofDy3þ ion in CaS host. During the synthesis of the samples, sodiumthiosulfate was used as flux. Hence two Ca2þ (1.00 A) sites can beeasily replaced by Dy3þ (0.91 A) and Naþ (1.02 A) due to thesimilarity in the radii of the cation, giving rise to Naþ Ca2þ andDy3þ
Ca2þ defect sites. Hence the broad emission spectrum of CaS:Dybetween 400 and 500 nm is due to transition from 4F9/2-
6H15/2
overlapped with the emission due to recombination in the defectsites, making it broad [27].
Out of three excitation bands of Dy3þ at 350 nm, 390 nm and450 nm, two of them overlap with that of cerium excitation bandsat 350 nm and 450 nm as observed from Fig. 2(b).
The emission intensity of a phosphor depends on the concen-tration of activators. The optimal Ce and Dy concentration, givinghighest emission intensity, should be determined. Hence theCaS:CexDy1�x was excited at the excitations of both Ce3þ andDy3þ , i.e. 350 nm, 390 nm and 450 nm. We found that at all thethree excitation wavelengths CaS:Ce0.25Dy0.75 sample shows themaximum PL intensity as shown in Fig.3. Hence we have optedCaS:Ce0.25Dy0.75 for our further study.
To investigate an energy transfer between Ce and Dy in CaS, PLexcitation and emission spectra of CaS:Ce0.25Dy0.75 wererecorded. The excitation spectrum of CaS:Ce0.25Dy0.75 is shownin Fig. 4(a). It shows the excitation bands at 350 nm and 450 nm.The 390 nm excitation band is not visible here, as it may havebeen overshadowed by the intensity of 450 nm band.
The PL emission spectra were recorded at the excitationwavelengths of both Dy3þ as well as Ce3þ (i.e. 350 nm, 390 nm,450 nm) and shown in Fig. 4(b). With an excitation of 350 nm(optimum wavelength for exciting Dy3þ), Dy0.75 co-dopedCaS:Ce0.25 sample showed Ce3þ band emission as well as Dy3þ
emission peaks (Fig. 4(b)). Since the 350 nm excitation bandbelongs to both cerium as well as dysprosium, the simultaneousoccurrence of emission of both the dopant ions is not a conse-quence of energy transfer. When excited by 390 nm, there is weakdysprosium emission superimposed on the cerium peaks. Sincethe 390 nm excitation band belongs to dysprosium only, con-current emission, at this excitation wavelength indicated anenergy transfer from dysprosium ion to cerium. Further, with anexcitation of 450 nm, the CaS:Ce0.25Dy0.75 sample showed onlyCe3þ band emission. The Dy3þ emission is also expected (because450 nm excitation band belongs to Dy3þ as well) but it is notvisible here, since it might have been overshadowed by that ofCe3þ emission. Hence the energy transfer is expected from Dy3þ
to Ce3þ at 450 nm.The energy transfer from Dy3þ to Ce3þ is also evident from the
fact that the emission of Dy3þ overlaps with the excitation of Ce3þ
in the CaS host [6]. From Fig. 5, we can see that the broad bandemission between 400 nm and 500 nm in CaS:Dy emission spec-trum overlaps with the excitation band of Ce3þ (at 400–500 nm).The broad blue emission peak is an added advantage for the energytransfer between Dy3þ and Ce3þ , because if the emission of Dy3þ
was narrow, the overlap between the excitation band of Ce3þ at450 nm and the emission band of Dy3þ at 482 nm would have beenvery less lowering the efficiency of energy transfer. Broader emis-sion band has increased the extent of overlap hence the efficiency of

Fig. 5. (a) PLE of CaS:Ce (0.2 mol%) (b) and PL of CaS:Dy (0.2 mol%).
Fig. 6. PL emission spectrum of CaS:Ce (0.2 mol%) and CaS:Ce0.25Dy0.75 (0.2 mol%)
at an excitation wavelength of 450 nm.
Fig. 4. (a) The excitation spectrum of CaS:Ce0.25Dy0.75 (at an emission wavelength
of 580 nm) and (b) PL emission spectrum of CaS:Ce0.25Dy0.75 at an excitation
wavelengths of (i) 350 nm; (ii) 390 nm; and (iii) 450 nm.
Fig. 7. TL glow curves of CaS:CexDy1�x (x¼0.25, 0.50,0.75) for a dose of 21 kGy.
G. Sharma et al. / Journal of Luminescence 132 (2012) 2619–26252622
energy transfer between Dy3þ and Ce3þ . To check if the reverseprocess, i.e. the energy transfer occurs from Ce3þ to Dy3þ , theemission band of Ce3þ should overlap well with the excitation ofDy3þ in CaS matrix. However the Ce3þ in CaS host shows noemission around 350 nm, 390 nm or 450 nm. Hence no energytransfer occurs from Ce3þ to Dy3þ .
The process of energy transfer from Dy3þ to Ce3þ is furthersupported by the fact that the emission intensity of Dy0.75 co-doped CaS:Ce0.25 sample is almost two times the emissionintensity of the CaS:Ce phosphors when excited at 450 nm asevident from Fig. 6. The increase in the emission intensity ofCaS:Ce with an addition of 75% Dy also indicated the processof energy transfer from Dy3þ to Ce3þ in CaS. The intensity ofexcitation spectrum of CaS:Ce also increases with the addition ofDy to it (not shown here) which is in agreement with our result.Hence Dy3þ to Ce3þ is the only path way for the energy transferin CaS:Ce0.25Dy0.75. Addition of Dy results in the enhancement ofPL intensity of CaS:Ce, hence making it more suitable phosphorfor luminescent applications.
3.3. Thermoluminescence
Fig. 7 shows the TL glow curves of CaS:CexDy1�x (x¼0.25,0.50,0.75) for a dose of 21 kGy. All the three glow curves show

Fig. 9. TL glow curves of CaS:Ce0.50Dy0.50 for medium dose range (42–250 Gy).
Fig. 10. TL glow curves of CaS:Ce0.50Dy0.50 for high dose range (1.3–21 kGy).
G. Sharma et al. / Journal of Luminescence 132 (2012) 2619–2625 2623
similar structure, but differ in intensity. The glow curves have ahigh temperature peak around 600 K and low intensity plateauranging between 350 K and 475 K. With increase in the concen-tration of Dy in CaS:CexDy1�x there is no effect on the intensity oflow temperature peaks while on the other hand the intensity ofhigh temperature peak increases and is maximum for CaS:-Ce0.50Dy0.50 and then decreases for CaS:Ce0.75Dy0.25 sample, dueto concentration quenching phenomenon [25]. Hence CaS:-Ce0.50Dy0.50 shows the maximum TL intensity, and is opted forthe further study.
The TL characteristics of CaS:Ce0.50Dy0.50 has been studied for0.5 Gy–21 kGy of gamma exposure. The TL property of the phos-phor has been studied in the three dose range, low (0.5–21 Gy);medium (42–250 Gy) and high dose range (1.3–21 KGy).In the low dose range the glow curves show a low temperaturepeak between 350 K and 450 K (Its position is varying with theincreasing dose) and a high temperature peak, whose peakposition lies outside the region of our study till 4.3 Gy whereaswith increase in dose to 21 Gy the peak shift to 600 K (Fig. 8). Theintensity of both the peaks increases with the increasing doseupto 21 Gy.
In the middle range the glow curves have two peaks, a lowtemperature peak at 400 K and a high temperature peak at 600 K(Fig.9). The peak position of low temperature peak has shiftedfrom 375 K to 400 K from low dose range to medium range, whilethe intensity of both the low as well as high temperature peak hasincreased from the low dose range. It is observed that in the highdose range varying from 1.3 kGy to 21 kGy, the shape of the glowcurves has changed drastically as shown in Fig. 10. The lowtemperature peak has maintained its position at 400 K but thehigh temperature peak which was at 600 K for the medium doseregion has now shifted to 588 K. The intensity of both the low andhigh temperature peaks increases with rapid rise in the intensityof latter such that it overshoots the intensity of former.
For a phosphor to be used for the dosimeteric purposes, itsdose response should be linear. Hence we have studied thevariation in the intensity of low temperature and high tempera-ture peak with the dose (0.5 Gy–21 kGy). Fig. 11 shows thevariation in intensity of low and high temperature peaks withdose. It has been observed that the intensity of low temperaturepeak increases upto 250 Gy and after that the increase in intensityis very low, hence this region may be the region of saturation.While the intensity of high temperature peak rises linearly upto21 kGy.
Fig. 8. TL glow curves of CaS:Ce0.50Dy0.50 for low dose range (0.5–21 Gy).
CaSO4:Dy is a well known standard TLD material. Salah et al.has studied in detail the TL behavior of CaSO4:Dy (microcrystal-line and nanocrystalline) and has found that nanocrystallineCaSO4:Dy shows a linear behavior upto 10 kGy of gamma expo-sure while the microcrystalline CaSO4:Dy has a linear behavioronly upto 1 kGy of the gamma exposure [28]. CaS:Ce0.50Dy0.50
shows a linear behavior upto 21 kGy of the dose (Fig. 11). Tocheck the sensitivity of CaS:Ce0.50Dy0.50 it was compared with astandard grade CaSO4:Dy(which was procured from BhabhaAtomic Research centre (BARC), Mumbai, India and is used forroutine dosimeteric purposes). Fig. 12 shows the TL glow curvesfor CaS:Ce0.50Dy0.50 and CaSO4:Dy (microcrystalline) for a gammadose of 20 Gy. It is observed that intensity of CaSO4:Dy is about 25times more than that of CaS:Ce0.50Dy0.50.
CaS:Ce0.50Dy0.50 shows linear behavior over larger dose range(0.5 Gy–21 kGy) than CaSO4:Dy (nanocrystalline as well as micro-crystalline). However it is less sensitive than CaSO4:Dy, still it canbe explored as TL dosimeter in this particular range owing to itslarger linear dose response. The microcrystalline CaSO4:Dy phos-phor is more sensitive, however it saturates or even decreasesover 1 kGy. Hence CaS:Ce0.50Dy0.50 could be a good substitute forthe higher doses.

Fig. 11. Variation in the intensity of Low temperature and high temperature peak
with the dose (0.5 Gy–21 kGy).
Fig. 12. TL glow curves for CaS:Ce0.50Dy0.50 and CaSO4:Dy (microcrystalline) for a
gamma dose of 20 Gy.
Fig. 13. TL spectra of pure CaS (without dopant), CaS:Ce, CaS: Dy and CaS:Ce0.50Dy0.50.
Fig. 14. Normalized TL spectra of pure CaS (without dopant), CaS: Ce, CaS:Dy and
CaS:Ce0.50Dy0.50.
G. Sharma et al. / Journal of Luminescence 132 (2012) 2619–26252624
To identify the peaks related to Ce3þ and Dy3þ in the TLspectra of CaS:Ce0.50Dy0.50, the glow curves of pure CaS (withoutdopant), CaS:Ce, CaS:Dy and CaS:Ce0.50Dy0.50 were recorded.Fig. 13 shows the TL spectra of pure CaS (without dopant), CaS:Ce,CaS:Dy and CaS:Ce0.50Dy0.50. Pure CaS shows a prominent peak at645 K and two very weak peaks at 455 K and 350 K. CaS:Ce showsan intense peak at 560 K and a broad, less intense shoulder on thelower temperature side from 400 K to 475 K. Addition of Dy3þ
instead of Ce3þ in CaS shifts the most intense peak to 605 K andthe intensity of 400 K peak rises. In the spectrum of CaS:-Ce0.50Dy0.50 the peak position of the most intense peak is nowaveraged between the position of high temperature peak ofCaS:Ce and CaS:Dy,i.e. it is observed at 588 K and very weaklow temperature peaks are also present at 350 K and 450 K. Theintensity of low temperature peaks in CaS:Ce0.50Dy0.50 has nota-bly reduced. To compare the peaks, normalized TL spectra of pureCaS (without dopant), CaS:Ce, CaS:Dy and CaS:Ce0.50Dy0.50 aredisplayed in Fig. 14.
The peaks in pure CaS, may be associated to intrinsic traps(related to sulfur vacancies and Ca2þ vacancies) in the host lattice[29]. The low temperature peaks at 350 K and 455 K may be due
to shallow electron traps recombining at hole traps while the hightemperature peak at 645 K may be associated with some deeptraps, giving rise to a high temperature peak. As observed abovethe addition of dopants such as Ce3þ and Dy3þ does not add newpeaks but only slightly shifts the peak position and variation in TLintensity is also observed. Intensity of CaS is found to be very lowdue to the absence of strong emission centers, and has been foundto increase after the addition of dopants. CaS:Ce0.50Dy0.50 showsthe most intense TL peak. This suggests that the associated trapsare the property of the host lattice and these traps may be due tointrinsic point defects, e.g. vacancies and interstitials. The dopantsonly aid to form these defects. These results are in agreementwith those reported by Gosh et al. [30,31].
4. Conclusions
CaS:CexDy1�x (0.25, 0.50, 0.75) nanophosphors having diameterbetween 50 and 60 nm were synthesized using the solid statediffusion method. These nanoparticles posses nearly sphericalmorphology as evident from their TEM micrograph. From the
G. Sharma et al. / Journal of Luminescence 132 (2012) 2619–2625 2625
investigation of the photoluminescence properties of CaS:CexDy1�x
we found that CaS:Ce0.25Dy0.75 posses maximum PL intensity.Addition of 75% Dy to CaS:Ce increased its PL intensity almosttwo times due to process of energy transfer from Dy3þ to Ce3þ ion.Enhancement in emission intensity and tuning of emission wave-length of a phosphor can be easily achieved by energy transferthrough co-doping. The thermoluminescence glow curves of CaS:-Ce0.50Dy0.50 has two peaks, one around 350–450 K and otheraround 600 K. It has been observed that the intensity of lowtemperature peak increases upto 250 Gy while the intensity of hightemperature peak rises linearly upto 21 kGy. CaS:Ce0.50Dy0.50 has alinear behavior over a larger dose range than standard CaSO4:Dy(nanocrystalline and microcrystalline), but has lower sensitivitythan latter. Still it is an ideal phosphor to be explored for thedosimeteric applications. The TL intensity of CaS increases with theaddition of dopants, as the TL phenomenon is due to the defectsassociated with the host lattice and dopant only enhances the TLemission.
Acknowledgment
One of the authors Geeta Sharma would like thank UGC forfinancial support in form of DSK PDF.
References
[1] A. Kumar, V. Chaudhary, Nanotechnology 20 (2009) 095703.[2] K. Singh, N.K. Verma, H.S. Bhatti, Physica B 404 (2009) 300.[3] R. Sharma, H.S. Bhatti, Nanotechnology 18 (2007) 465703.[4] M.V. Limaye, S. Gokhale, S.A. Acharya, S.K. Kulkarni, Nanotechnology 19
(2008) 415602.
[5] D. Jia, J. Zhu, B. Wu, S.E., J. Lumin. 93 (2001) 107.[6] K.Y. Jung, H.W. Lee, J.Lumin. 126 (2007) 469.[7] C. Wang, K. Tang, Q. Yang, Y. Qian, J. Electro. Chem. Soc. 150 (2003) G163.[8] K. Kato, F. Okamoto, Jpn. J. Appl. Phys. 22 (1983) 76.[9] J.E. Van Haecke, P.F. Smet, D. Poelman, Spectrochim Acta Part B 59 (2004)
1759.[10] H.-J. Sung, Y.-S. Cho, Y.-D. Huh, Y.R. Do, Bull, Korean Chem. Soc. 28 (2007)
1280.[11] H.S. Bhatti, R. Sharma, N.K. Verma, J. Mod. Opt. 53 (2006) 2021.[12] H.S. Bhatti, R. Sharma, N.K. Verma, Radiat. Eff. Defects Solids 161 (2006) 113.[13] A.G.J. Green, B. Ray, I.V.F. Viney, J.W. Brightwell, Phys. Status Solidi (a) 110
(2006) 269.[14] G.L. Marwaha, N. Singh, D.R. Vij, V.K. Mathur, Mater. Res. Bull. 14 (1979)
1489.[15] M.A.S. Sweet, J. Rennie, Nucl. Instrum. Methods A 283 (1989) 330.[16] B.Q. Sun, G.S. Yi, D.P. Chen, Y. Zhou, J. Cheng, J. Mater. Chem. 12 (2002) 1194.[17] V. Kumar, R. Kumar, S.P. Lochab, N. Singh, J. Phys. D: Appl. Phys. 24 (2006)
5137.[18] V. Singh, T.K.G. Rao, J.J. Zhu, M. Tiwari, Mater. Sci. Eng. B 131 (2006) 195.[19] X. Gong, W.J. Chen, P.F. Wu, W.K. Chen, Appl. Phys. Lett. 73 (1998) 2875.[20] G. Sharma, P. Chawla, S.P. Lochab, N. Singh, Radiat. Eff. Defects Solids 164
(2009) 763.[21] P.I. Paulose, J. Joseph, M.K. Rudra Warrier, G. Jose, N.V. Unnikrishnan,
J. Lumin. 127 (2007) 583.[22] L.N. Ping, C.Z. Yang, F.Y. Wei, B.W. Zhen, G. Qi, L. Wu, T.X. Qiang, D.Y. Zhao,
Chin. Phys. B 17 (2008) 3156.[23] Z. Wang, M. Xu, W. Zhang, M. Yin, J. Lumin. 122 (2007) 437–439.[24] V. Singh, Z.J. Jie, T.K.G. Rao, M. Tiwari, P.H. Cheng, Chin. Phys. Lett. 22 (2005)
3182.[25] A.J. Dekker, Solid State Physics, Prentice Hall Inc., Englewood Cliffs,
New Jersey, 1957.[26] D. Jia, R.S. Meltzer, W.M. Yen, J. Lumin. 99 (2002) 1.[27] H. Choi, C.-H. Kim, C.-H. Pyun, S.-J. Kim, J. Lumin. 82 (1999) 25.[28] N. Salah, P.D. Sahare, S.P. Lochab, P. Kumar, Rad. Measur. 41 (2006) 40.[29] A.N. Georgobiani, A.N. Gruzintsev, T.V. Nikiforova, X. Xurong, Y. Wang, Inorg.
Mater. 36 (2000) 1083.[30] P.K. Ghosh, R. Pandey, J. Phys. C: Solid State Phys. 15 (1982) 5875.[31] P.K. Ghosh, H.P. Narang, H. Chander, J. Lumin. 35 (1986) 99.