journal of organizational knowledge · pdf filejournal of organizational knowledge management...
TRANSCRIPT


Journal of Organizational
Knowledge Management
Vol. 2010 (2011), Article ID
955926, 284 minipages.
DOI:10.5171/2011.955926
www.ibimapublishing.com

Copyright © 2011 Reza Sigari Tabrizi,
Yeap Peik Foong and Nazli Ebrahimi.
This is an open access article
distributed under the Creative
Commons Attribution License unported
3.0, which permits unrestricted use,
distribution, and reproduction in any
medium, provided that original work is
properly cited.
The Criteria for
Measuring Knowledge
Management Initiatives:
A Rare Glimpse into
Malaysian Organizations

Authors
Reza Sigari Tabrizi1,
Yeap Peik Foong1 and
Nazli Ebrahimi2

1Multimedia University,
Cyberjaya, Malaysia
2University of Malaya, KL,
Malaysia

Abstract
Many challenges are facing
measuring KM initiatives
and one of the key
challenges is to provide
a comprehensive set of
criteria to measure success
of KM programs. The aim of
this research is to address
the problem of identifying
the criteria for measuring
KM outcomes among
Malaysia companies and
seeks to develop widely-
accepted criteria based on
the systematic review of
the literature in order to
measure success of
knowledge management
programs for Malaysian
organizations. Hence,
attempts were made to
discover the most favored
criteria among Malaysia
organizations and to
investigate the relationship
between KM criteria and
organization’s mission,
goals, and objectives. In

addition, the relationship
between KM criteria and
success of KM programs
were examined using
regression analysis. The
current population study

was composed of 79
Malaysian organizations
from different types of
sectors. According to
results achieved by
statistical analyses, the

most favored criteria
among respondents who
participated in this survey
were enhanced
collaboration, improved
communication, improved
learning/adaptation
capability, sharing best
practices, better decision-
making, enhanced product
or service quality,
enhanced intellectual
capital, and increased
empowerment of
employees. Finally, it is
hoped that the current
study provides a better
picture for Malaysia

organizations to identify
and develop a
comprehensive set of
criteria to measure success
of KM initiatives.
Keywords: Knowledge
Management, Knowledge
Management Outcomes, KM
Criteria, Measuring KM
Outcomes

Introduction
The current business
environment is affected by
a cutthroat competition,
new launched products,

and fast technology
development (Davenport &
Prusak, 1998). The
backward-looking
performance indicators are
no longer sufficient since

the knowledge era has
begun and organizations
need forward-looking
indicators to move nimbly
(Van Buren, 1999).
According to Lubit (2001),
today’s core competencies
and high performance have
two primary bases, which
are knowledge and
intellectual capital. In fact,
sustainability of
competitive advantage that
has derived from special
knowledge inside
companies is
predominantly
characterized by exhaustive

competition among rivals
and shortened product
lifecycles (Lubit, 2001).
Macintosh (1998) stated
that exploiting knowledge
assets of a company is

a crucial issue to creating
sustainable competitive
advantage. Hence,
Sustainability of companies’
competitive advantage in
chaos and uncertain

business environment is
highly related to
implementing special
knowledge to their core
business processes and

activities (Ndlela L. T. & du
Toit, 2001).
Many organizations
allocated such resources to
implement knowledge

management programs.
However, latest research
surveys have represented
that despite companies
have claimed to implement
KM programs, not many of

them are tagged as KM’s
successful implementer
(Chong, Yew, & Lin, 2006).
For the sake of
implementing successful
KM program, considering
performance measurement
is imperative and timely
since not many
organizations developed a
well-organized
performance measures to

appraise their knowledge
assets (Longbottom &
Chourides, 2001). Hence, to
organize a well-developed
and formal performance
measures is a crucial need
for KM implementation
within organizations
(Chong, Yew, & Lin, 2006).
In order to determine
outcomes, structuring
criteria for knowledge
management efforts is an
essential task of
organization (Anantatmula
& Kanungo, 2005).
Needless to stress, the
importance of determining

criteria of measuring
knowledge management
efforts is significant.

Statement of the Problem
An important wide-
accepted KM principle is a
comprehensive set of
criteria to measure

outcomes of knowledge
management efforts. It can
be clearly seen that
outcomes may not be
identified without criteria;
thus, structuring a set of

criteria for knowledge
management is imperative
and timely (Chong, Yew, &
Lin, 2006). Similar to a
project or imitative that
needs to meet a set of
criteria to be selected; KM
projects can also be
evaluated through a set of
criteria (Anantatmula &
Kanungo, 2005). As such,
companies have to
establish metrics that are
associated with KM criteria.
Knowledge Management
Criteria
Perkmann (2002)
investigated knowledge
value from two different

perspectives, which were
the macro view and the
micro view. According to
Perkmann (2002), the
macro perspective
measures intangible assets
of a company by using
means like Balance
Scorecard, Score Board,
Skandia navigators. The
main advantage of macro
perspectives is to evaluate

knowledge management
programs from non-
financial approaches
(Perkmann, 2002). In line
with measuring knowledge
value, Perkmann (2002)
reported a measurement
paradox of quantitative
approaches. For example, it
can be clearly seen that ROI
as a financial ratio can only
measure the financial gains

of a specific project
whereas there are many
unintentional outcomes
that may not be reflected by
financial aspects. By
contrast, Perkmann (2002)

introduced a heuristic
measure, which is named
“Sveiby’s Collaboration
Climate Index” (CCI). The
assumption behind the CCI
is an excellent collaborative

environment that facilitates
knowledge sharing and
hence increases
organization’s intellectual
assets (Perkmann, 2002).
Nonetheless, the CCI is

a useful tool to find out the
determinants, which are
crucial for collaboration
and knowledge sharing
(Perkmann, 2002). In case
of determining knowledge

management outcomes,
KPMG consulting (2000)
has published a report on
benefits of knowledge
management program.
KPMG (2000) conducted

this research among 423
organizations in three
different regions, which
were United Kingdom,
mainland Europe, United
States.

Over 81 percent of the
target organizations had
knowledge management
program, 38 percent had a
KM program in place, 30
percent were preparing

and 13 percent recognized
the need to implement KM
program (KPMG, 2000).
Participants in KPMG
(2000) research study
indicated the percentage of

the KM drivers inside
organizations. According to
KPMG (2000), 32 percent of
board members, and 41
percent of senior
management were

belonged as knowledge
management greatest
drivers. This states that top
management of companies
supported knowledge
management initiatives

(KPMG, 2000). KPMG
(2000) asked the
respondents for their
perspectives about the
potential role of KM
program that can
contribute in gaining
particular organizational
goals. According to KPMG
(2000), respondents
believed that knowledge
management program can

play a role in achieving best
results with respect to
improving competitive
advantage, marketing,
improving customer focus,
profit growth, product

innovation, revenue
growth, reducing costs,
employee development,
investment, and achieving
mergers respectively.
BP AMOCO illustrated a set
of parameters to assess
knowledge management
performance (Barrow,
2001 ). These parameters
include efficient
communication, employees’
motivation, employees’
morality, efficient
knowledge sharing and
transferring, efficient
production management,

effective project
management, effective
energy management,
improving resource
management, high product
quality, high service quality,

enhancing brand image,
and improve company’s
efGiciency (Barrow, 2001).
Lynn, Reilly, and Akgün
(2000) conducted a survey
among such companies to

find out the outcomes of
knowledge management
programs in new product
teams. According to Lynn et
al. (2000), the outcomes of
knowledge management

programs include cycle
time reduction in launching
new products, lower time-
to-reach market, lower
error and mistake in
introducing new products,

improving project
documentation, more speed
in retrieving information,
efficient storage, access to
best practices, and vision
clearness.

Chong et al. (2006)
exploited a list of KM
outcomes that are grouped
based on the previous
works. According to Chong
et al. (2006), outcomes can

be incorporated into five
different categories:
• Efficient Knowledge
Processes
• Effective Personnel
Development
• Customer Satisfaction
• Effective External
Relationship
• Firm’s Achievement

Knowledge process
includes defining, creating,
capturing, sharing,
disseminating, and using
knowledge assets (Van
Buren, 1999). It needs to
acquire personal
knowledge to turn into
organization’s knowledge
for sharing it through
corporation (Chong et al.,
2006). According to Chong

et al. (2006), through
systematic knowledge
activity knowledge assets
can be exploited effectively.
One of the main objectives
of knowledge management
programs is to attract
valuable experiences of
knowledge workers (Chong
& Choi, 2005). Today’s high
performance of
organizations has two
primary bases, which are
knowledge and intellectual
capital (Lubit, 2001).
Ordonez de Pablos (2006)
explained how intellectual
capital relies on human,
organizational, relational,
and technological capitals.
As Chong et al. (2006)
stated, most valuable
knowledge hold in
employee’s head, therefore,

organizations are required
to motivate their
knowledge workers to
share knowledge through
commitment programs.
Along with these programs,
companies require to
establish strong
relationships with external
environments involving
suppliers and partners
(Chong & Choi, 2005).

Inside external zones,
companies also need to
acquire customer’s
experiences and knowledge
(Van Buren, 1999).

Creating criteria for
measuring knowledge
management success is
vital since criteria support
to create a foundation for
evaluating the value and
assessing its outcomes
(Anantatmula, 2005). In
order to exploit criteria for
evaluating knowledge
management success,
Anantatmula (2005)

designed a questionnaire in
which a list 26 KM
outcomes was portrayed.
The research targeted
knowledge workers as
respondents from various
types of firms. The current
research study adopted the
questionnaire of
Anantatmula.

Research Methodology
This section explains and
discusses the systematic
procedures that were
performed in this survey.

Research Objectives
In this paper, an effort will
be made to discover the
criteria for measuring
knowledge management
success among Malaysian
organizations. The focal
objective of this study is to
present criteria list that
was adopted by Malaysian
organizations to measure
KM efforts. Specially, the
following objectives were
deployed to cover overall
objectives of this paper.

• To ascertain the most
favored criteria for
measuring KM success
• To find out the
dependency of the criteria

on organization’s mission,
goals, and objectives
• To analyze the
relationship between the
criteria for measuring

knowledge management
results and the success of
KM programs.
Research Questions
• What criteria are the
most favored for measuring
KM success?
• Are the criteria based on
organization’s mission,
goals, and objectives?
• Is there any significant
relationship between the

criteria for measuring
knowledge management
results and the success of
KM programs?
Hypotheses of the Study
The research hypotheses
were depicted from
research objectives as
bellow:

• H10: The criteria for
measuring KM success are
not dependent on mission,
goals, and objectives.

• H11: The criteria for
measuring KM success are
dependent on mission,
goals, and objectives.

• H20: There is no
significant relationship
between the criteria for
measuring knowledge
management results and
the success of KM
programs.
• H21: There is a significant
relationship between the
criteria for measuring

knowledge management
results and the success of
KM programs.

Data Analysis
In this research study, the
SPSS software was used to
analyze the questionnaire
data. For this study, the
proposed methods to find
out hidden patterns were
Descriptive Analysis,
Multiple Regression
Analysis, and Wilcoxon
Signed Ranks Test.

Data Collection Method
For the purpose of this
preliminary study, the
following data collection
method was used. This
research study employed
mixed-mode sampling
approach in order of data
collection. The first step of
data collection was to
choose a population to be

sampled. The population
framework was limited to
web sites’ forums, Yahoo
discussion groups,
Facebook discussion
groups, email lists that have

aggregated many different
Malaysian executives,
knowledge workers,
knowledge management
experts, and expats. Hence,
generalizability across all

Malaysian organizations is
limited because of inherent
constraints of the sample.
Then, the online
questionnaire was shared
among all participants

(Groups’ members and
email lists’ contacts) and
Ginally 79 of respondents
answered the shared
questionnaires. As
expected, questionnaires
were received with no
missing variables under the
population frame.

Participants
The participants of the
survey’s target population
consist of KM professionals,
Malaysian executives, and

Expats executives who
activated in Malaysia. These
respondents were working
in different types of
organizations including
Governmental, Non-

governmental, For-profit,
and Non-profit sectors. The
questionnaire was
developed on Google
Document platform. The
questionnaire then was

shared with respondents
using email lists and
writing messages on their
Social Networks’ walls.
Questionnaire
All surveys employ a
questionnaire to collect
relevant data.
Questionnaires present

a research instrument to
collect information about
employee’s knowledge,
motivations, mind-sets, and
organizational behavior
(Boynton & Greenhalgh,

2004). Questionnaire of
Anantatmula provided a
comprehensive list of KM
Criteria, thus; the survey
instrument in this research
study was adopted from
(Anantatmula, 2005). For
this paper, all of the
responses were collected
using online questionnaire.
The SPSS for windows
version 16 was employed
to generate summary
outputs, graphs, and data
analysis. The structure of
the questionnaire was
elaborated as bellow:

• The main objective of the
questionnaire was to
discover the criteria for
measuring knowledge
management success.

• The questionnaire
consists of 19 questions
including 16 close-ended
questions as well as 3 open-
ended questions.
• The questionnaire was
divided into three sections,
which were KM Criteria,
Individual Background, and
Organizational Background.
• In cover page,
respondents were provided
to get a brief explanation
about the research topic.

• There was only one page
that included all 26 criteria
to arm the respondents’
easiness to navigate
between criteria and less
time consuming to answer.
• In the last part of the
questionnaire, respondents
can give their email address
to receive research
findings.

• After submitting the
online questionnaire,
respondents can view latest
summary of the survey.

Research Results
The statistical package
employed for the survey
data analysis was SPSS for
Windows Version 16.0.

Descriptive analysis was
used to portray main
attributes of the survey's
data. Then, Wilcoxon
Signed Ranks test was
utilized to examine a

hypothesis about the
median of our target
population. Finally, the KM
criteria were regressed
against success of KM
programs using the

Multiple Regression
Analysis.

Demographic and
Background Results
Types of Organizations

In the current survey,
selected companies were
activating in different types
of organizations in
Malaysia. As shown in
Table 1, 53.16% of all
organizations were
operating as For-profit,
24.05% of which were
operating as Non-Profit
organizations. The
remaining 22.78% were

operating as Governmental
organizations.

Operation Sectors of
Organizations
The operation sectors of
organizations were
depicted in Table 2. Among

the organizations
investigated in this
research study, 8.86% were
operating in manufacturing
sector. In addition, 30.38%
of which were operating in

Service industry, 21.52%
are in Energy/Utilities,
1.27% are in
Telecommunication,
15.19% are in Finance/
Banking/ Insurance, 5.06%

are in Education, 8.86% are
in R&D, and Ginally 8.86%
are in trading sector.
Table 1: Types of
Organizations
Please see Table 1 in full
PDF version

Table 2: Operation
Sectors of Organizations
Please see Table 2 in full
PDF version

Respondents’ Role in
Organizations
There were 79 participants
to the survey, all of whom
specified their role in their
company. Table 3
represents respondents’
role in organizations. As
can be seen in Table 3,
13.92% of all respondents
held position of CEO,

11.39% of whom held
position of CIO/CKO,
15.19% were manager of
HR, 26.58% were project
manager, 21.52% project
member and Ginally 11.39%

of respondents held
position of Professional
Executive.

Table 3: Respondents’
Role in Organizations
Please see Table 3 in full
PDF version
Table 4: Experience in
Knowledge Management
Please see Table 4 in full
PDF version

Experience in Knowledge
Management
Table 4 represents the KM
Experience gained by each

participant during the years
of working.
According to the above-
tabulated results, 24.05%
of all respondents had

between 1 to 2 years
experience, 40.51% of
whom had between 3 to 5
years, 30.38% had between
6 to 10 years whereas only
5.06% of all respondents
had more than 10 years
experience in knowledge
management.

Expertise in Knowledge
Management
In this section, participants
were asked to state their
degree of expertise in

knowledge management.
The respondents’
responses were illustrated
in Table 5. According to
Table 5, 20.25% of all
respondents had Average
level in KM, 24.05% of
whom had above average
whereas 55.7% of all
respondents had excellent
level of expertise in
knowledge management.
Table 5: Expertise in
Knowledge Management
Please see Table 5 in full
PDF version
Analytical Results
Most Favored Criteria
Question 1 of the survey
provided a list of 26 KM

criteria. Participants were
requested to clarify
whether they have
employed any of 26 criteria
to measure knowledge
management efforts in their
companies or not.
Respondents were also
demanded to identify
importance and
effectiveness of each
criterion based on the

Likert scale. Both
Importance and
Effectiveness have equal
Likert scale with 5 showing
very high and 1 indicating
very low. In order to

calculate favored criteria,
the mean scores of both
Important and
Effectiveness were
computed for each
criterion. Hence, the values

nearer to 5 represent the
most favored criteria. The
list of favored scores for
each criterion was
represented in Table 6.

According to Table 6, a
criterion with average of
3.85 or above can be
considered as most favored
criterion. As can be seen in
Table 6, the most favored
criteria include Enhanced
collaboration (M=4.12,
SD=1.02), Improved
communication (M=4.07,
SD=1.01), Improved
learning/adaptation

capability (M=3.94,
SD=0.98), Sharing best
practices (M=3.89,
SD=0.95), Better decision
making (M=3.89, SD=1.06),
Enhanced product or

service quality (M=3.89,
SD=0.48), Enhanced
intellectual capital (M=3.86,
SD=1.01), and Increased
empowerment of

employees (M=3.85,
SD=0.39).

KM Criteria and Mission,
Objectives, and Goals
As noted in research
methodology, H1 examines
the dependency of criteria
for measuring knowledge
management efforts on
organization’s mission,
goals, and objectives.
Hence, respondents were
asked to assign a score to

the dependency of criteria
for measuring knowledge
management success on
organization’s mission,
goals, and objectives. The
first step to examine the H1

is to test the normality
assumption. According to
Royston (1992), the
Shapiro-Wilk test is valid
when sample size is greater
than 3 and lesser than or

equal to 2000. For this
variable, the p-value for
Shapiro-Wilk test of
normality is 0.000, which is
less than 0.05. Thus, the
normality assumption was

not met. Hence, the
research hypothesis was
tested using Wilcoxon
Signed Ranks test. The
Wilcoxon Signed Ranks test
is applied in place of one-
sample t-test when the
normality assumption is
not met (Chan, 2003). The
results were represented in
Table 7 and Table 8.

Table 6: The List of
Criteria Based on Their
Favored Rate
Please see Table 6 in full
PDF version
Table 7: Table of Ranks in
Wilcoxon Signed Ranks
Test
Please see Table 7 in full
PDF version
Table 8: Wilcoxon Signed
Ranks Test
Please see Table 8 in full
PDF version
In this study, the test value
was assumed equal to 3.
According to Table 8, the p-
value (Sig) equals to .000
which is less than 0.05;
thus, the test would lead to

reject H10 at level of α=0.05.
As shown in Table 7, most
of the respondents would
select 4 and 5 scores as
their responses to this
question. Therefore, the
criteria for measuring
knowledge management
success are significantly
based on organization’s
mission, goals, and
objectives.

KM Criteria and Success of
KM Programs Using
Multiple Regression
The H2 examines the
relationship between the

criteria for measuring
knowledge management
results and the success of
KM programs. It is
important to indicate that
for Multiple Regression

Analysis, the normality
assumption should be
tested. Therefore, the
Shapiro-Wilk test was
examined (3< n ≤2000).
The Shapiro-Wilk statistics
provided the p-value of
0.062, which was greater
than 0.05. Thus, data can be
assumed to be normally
distributed. Hence, the
Favored Criteria variables

(See Section of Most
Favored Criteria) were
regressed against success
of KM programs using
stepwise Multiple
Regression Analysis. The
statement of “Do you think
that knowledge
management programs met
the expected results?” was
used to measure success of
KM programs.

Favored Criteria and
Success of KM Programs
The summaries of
regression analysis were
depicted in Table 9, 10, and

11. As shown in Table 9,
SPSS generated four
models. The model 4 was
selected as final model to
analyze the relationship
between Success of KM
programs as dependent
variable and Favored
Criteria as independent
variables.
Table 9: - Model
Summary - Criteria Favor
on Meet Expected Results
Please see Table 9 in full
PDF version
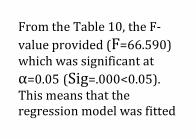
From the Table 10, the F-
value provided (F=66.590)
which was significant at
α=0.05 (Sig=.000<0.05).
This means that the
regression model was fitted
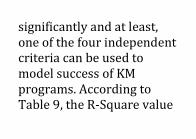
significantly and at least,
one of the four independent
criteria can be used to
model success of KM
programs. According to
Table 9, the R-Square value
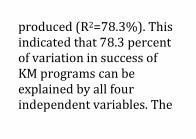
produced (R2=78.3%). This
indicated that 78.3 percent
of variation in success of
KM programs can be
explained by all four
independent variables. The
Durbin-Watson of 1.984
falls between 1.5 and 2.5
(1.5<D-W<2.5)
representing no
autocorrelation among the
error terms. Hence, it

confirms that all error
terms are independent.
The collinearity statistics
indicate that tolerance
statistics for Enhanced

Intellectual Capital,
Improved Productivity,
Return on Investment of
KM efforts, and Enhanced
Product or Service Quality
are all more than 0.1, and

VIF (Variation Inflation
Factors) are all lower than
10. Therefore, these show
no multicollinearity
problem.Hence, H2 was
strongly supported and this
represents that there is a
significant relationship
between the criteria for
measuring KM results and
the success of KM
programs.
The results of Table 11 also
confirmed that there were
four criteria including
Enhanced Intellectual
Capital, Improved
Productivity, Return on

Investment of KM efforts,
and Enhanced Product or
Service Quality that were
positively linked with
success of KM programs. As
can be seen in Table 11, the
four criteria namely
Enhanced Intellectual
Capital (p<0.01), Improved
Productivity (p<0.1),
Return on Investment of
KM efforts (p<0.05), and
Enhanced Product or
Service Quality (p<0.05) all
directly contributed in the
success of KM programs.
Furthermore, the results
also represented that the
most important criteria
that were involved in
predicting success of KM
programs was Enhanced
Intellectual Capital and was
statistically significant at
α=0.01 (p<0.01).

Table 10: ANOVA -
Criteria Favor on Meet
Expected Results
Please see Table 10 in full
PDF version
Table 11: Coef=icients -
Criteria Favor on Meet
Expected Results a
Please see Table 11 in full
PDF version
Discussion of Findings
Based on the data collection
from participants who were
working for Malaysian
organizations, effort was

done to fulfill the objectives
of this paper that is mainly,
to determine the criteria
for measuring knowledge
management programs. As
stated earlier, the

accessibility of criteria as a
platform to measure KM
efforts would be delivering
a great value to knowledge
management programs
inside organizations.
Most Favored Criteria
As shown in Table 6, the
most favored criteria
among respondents
included: Enhanced

collaboration (M=4.12,
SD=1.02), Improved
communication (M=4.07,
SD=1.01), Improved
learning/adaptation
capability (M=3.94,

SD=0.98), Sharing best
practices (M=3.89,
SD=0.95), Better decision
making (M=3.89, SD=1.06),
Enhanced product or
service quality (M=3.89,

SD=0.48), Enhanced
intellectual capital (M=3.86,
SD=1.01), and Increased
empowerment of
employees (M=3.85,
SD=0.39). It can be clearly
seen that establishing the
measurements for these
criteria needs critical
thinking. Care must be
taken that the intangible
feature of above selected
criteria makes it difficult to
establish measurements for
these criteria. For the sake
of developing measures for
some of the above favored
criteria, Anantatmula

(2005) proposed the
following statements.
• Developing and
promoting communication
channels such as computer
networks, organizational
wiki pages, internal email
system, and organizational
social networks. This may
help to develop a coherence
transformation of
employee’s knowledge to
organizational knowledge
and vice versa.
• Establishing quantitative
methods such as frequency

of decision-making
functions, and quantity of
documented practices is a
helpful procedure to
measure communication
aspect.
• Encouraging employees
to contribute to
organizational activities
such as decision-making
situations, and team
working to solve
management problems, is a
valuable way to enhance
collaboration inside
organizations. It can be
observed that the results
and outputs of teams and

committees are not
relatively difficult to
measure and evaluate.
Apart from above-
mentioned solutions,
companies can integrate
some performance monitor
tools with their network
infrastructure to quantify
number of shared
organizations’ practices,

frequency of participation
in workshops, seminars,
problem solving
committees, and quantity of
achieved degrees and
certifications. It can be also
useful to provide feedback
systems and suggestion box
for measuring
empowerment of
employees (Anantatmula,
2005). Conducting

organizational surveys to
measure satisfaction and
empowerment level of
employees is another way
to measure this criterion
(Anantatmula, 2005).

Finally, Total Quality
Management as a strong
instrument geared to
ensure that company can
measure the enhancing of

product or service quality
(Anantatmula, 2005).
KM Criteria and
Organization’s Mission,
Goals and Objectives
According to literature
review, criteria for

measuring knowledge
management efforts must
associate and align with
organizational mission,
objectives, and goals. In this
study, respondents were

asked to give a score to
their criteria depending on
organizations’ goals,
mission, and objectives.
According to the findings
achieved from statistical

analysis, the criteria for
measuring knowledge
management success were
significantly based on
organization’s mission,
goals, and objectives.
KM Criteria and Success of
KM Programs
In order to analyze the
relationship between KM
Criteria and success of KM
programs, the Favored
Criteria variables were
regressed against “Meet
Expected Results” using
Stepwise Multiple
Regression Analysis.

According to the results
achieved from Multiple
Regression Analysis, a set
of criteria that contributed
in the success of KM
programs were as bellow:

• Enhanced Intellectual
Capital
• Improved Productivity

• Return on Investment of
KM efforts
• Enhanced Product or
Service Quality

All above-mentioned
criteria have significant
positive relationship with
the success of knowledge
management programs.
Indeed, these criteria are
aligned toward the success
of KM efforts. The findings
provided supporting
evidence that success in KM
efforts is highly dependent
on developing

measurement tools to
evaluate these four criteria.
Limitations
Likewise each survey, this
survey has its limitations
some of which are; time
restriction and budget
constraint. These
limitations as well as
transportation problem
compelled researchers to
select a medium sample
size. This is why

researchers limited
survey’s population
framework to email lists,
Yahoo Discussion Groups,
and Internet Forums etc.
Hence, generalizability

across all Malaysian
organizations was limited
because of inherent
constraints of the sample.
Furthermore, due to the
above-mentioned
limitations, this research
study concentrated on only
26 KM criteria.

Recommendations for
Future Researches
This study investigated the
problem of determining the
criteria to measure

knowledge management
initiatives among Malaysian
firms. The results and
findings can present viable
and practical area of
researches for future

studies. The
recommendations for
future researches are
stated as bellow:
• A study on the same topic
with a larger pool of
participants and a broad
range of KM criteria.

• Break downing the most
favored criteria to less
abstract components in
order to establish a clear
measurement foundation
for these criteria.

• Expanding the research
to other countries in order
of having multinational
comparison.

• Developing research to
special industry in order to
get a better picture for
investigation of that
particular industry.
Conclusion
This paper attempted to
determine criteria for
measuring knowledge
management success

among Malaysian
organizations. The major
contribution of this study
was to persuade managers
to implement knowledge
management programs
toward organization’s
mission, goals, and
objectives. Hence, defining
well-organized and clear
mission, goals, and
objectives is an imperative

task of top management.
This may help organization
to meet its expected results
of KM programs. Analyzing
the relationship between
KM Criteria and the success
of KM programs, led us to
discover that by setting
well-defined criteria and
being aware of the
importance of each
criterion in measuring KM

success, managers can
adjust their programs on
where they should spend
their efforts and which area
requires more
concentration in order to
get high achievement.
In conclusion, increasing
the effectiveness of
implementing KM

programs and improving
the quality of KM programs
to satisfy the goals and the
mission of the company will
be the main value of the
study, which can lead in
gaining competitive
advantage in current
chaotic business
environment.
Acknowledgement
We wish to express a
sincere thank to Dr. VS
Anantatmula who so
graciously, agreed to use
his questionnaire in this
survey. We also would like
to acknowledge the
academic efforts of Dr.
Chong Siong Choy in the

knowledge management
field.

References
Anantatmula, V. S. (2005).
Outcomes of Knowledge
Management Initiatives.
International Journal of

Knowledge Management ,
50-67.
Anantatmula, V. & Kanungo,
S. (2005). Establishing and
Structuring Criteria for

Measuring Knowledge
Management Efforts. 38th
Hawaii International
Conference on System
Sciences, (pp. 1-11).

Barrow, D. C. (2001 ).
Sharing Know-How At Bp
Amoco. Research-
Technology Management ,
18-25.

Boynton, P. M. &
Greenhalgh, T. (2004).
Hands-on Guide to
Questionnaire
Research:Selecting,
Designing, and Developing

your Questionnaire. BMJ ,
1312-1315.
Chan, Y. H. (2003).
"Biostatistics
102:Quantitative Data –

Parametric & Non-
parametric Tests,"
Singapore Med J , 44 (8),
391-396.

Chong, S. & Choi, Y. (2005).
Critical Factors of
Knowledge Management
Implementation Success.
Journal of Knowledge
Management Practice , 6
(6).
Choy, C. S., Yew, W. K. & Lin,
B. (2006). Criteria for
Measuring KM Performance
Outcomes in Organisations.
Industrial Management &
Data Systems , 106 (7), 917-
936.

Davenport, T. & Prusak, L.
(1998). Working
Knowledge: How
Organisations Manage
What They Know. Boston,

Massachusetts: Harvard
Business School Press.
KPMG. (2000). KM Articles:
Knowledge Management
Research Report. Retrieved
February 15, 2010, from

www.providersedge.com
http://www.providersedge
.com/docs/km_articles/KP
MG_KM_Research_Report__
2000.pdf

Longbottom, D. &
Chourides, P. (2001).
Knowledge Management: a
Survey of Leading UK
Companies. Proceedings of
the Second MAAQE
International Conference,
(pp. 113-26.). Versailles
France.
Lubit, R. (2001). "Tacit
Knowledge and Knowledge

Management: The Keys to
Sustainable Competitive
Advantage,"Organizational
Dynamics , 29 (4), 164–178.
Lynn, G. S., Reilly, R. R. &
Akgün, A. E. (2000).
Knowledge Management in
New Product
Teams:Practices and
Outcomes. IEEE

Transactions on
Engineering Management,
47 (2), 221-231.
Macintosh, A. (1998).
Position Paper on
Knowledge Asset
Management. Retrieved
from Artificial Intelligence
Applications Institute.
http://www.aiai.ed.ac.uk/n
alm/kam.html.
Ndlela, L. T. & du Toit, A. S.
A. (2001). Establishing a
Knowledge Management
Programme for Competitive
Advantage in an Enterprise.
International Journal of

Information Management ,
21, 151-165.
Ordonez de Pablos, P.
(2006). Transnational
Corporations and Strategic

Challenges An Analysis of
Knowledge Flows and
Competitive Advantage. The
Learning Organization , 13
(6), 544-559.
Perkmann, M. (2002).
Measuring Knowledge
Value? Evaluating the
Impact of Knowledge
Projects. KIN brief.

Royston, P. (1992),
Approximating the Shapiro-
Wilk W-Test for Non-
normality. Statistics and
Computing 20:11-119.

Van Buren, M. E. (1999). A
Yardstick for Knowledge
Management. Training &
Development , 71-78.