journal of quantitative spectroscopy & radiative transfer · b institute of applied physics,...
TRANSCRIPT
Journal of Quantitative Spectroscopy & Radiative Transfer ∎ (∎∎∎∎) ∎∎∎–∎∎∎
Contents lists available at ScienceDirect
Journal of Quantitative Spectroscopy & Radiative Transfer
http://d0022-40
n CorrE-m
Pleasinten
journal homepage: www.elsevier.com/locate/jqsrt
Room temperature linelists for CO2 asymmetric isotopologues with ab initiocomputed intensities
Emil J. Zak a, Jonathan Tennyson a,n, Oleg L. Polyansky a,b, Lorenzo Lodi a, Nikolay F. Zobov b,Sergei A. Tashkun c, Valery I. Perevalov c
a Department of Physics and Astronomy, University College London, London WC1E 6BT, UKb Institute of Applied Physics, Russian Academy of Sciences, Ulyanov Street 46, Nizhny Novgorod 603950, Russiac V.E. Zuev Institute of Atmospheric Optics, SB RAS, 1, Academician Zuev Square, Tomsk 634021, Russia
a r t i c l e i n f o
Article history:Received 1 December 2016Received in revised form26 January 2017Accepted 29 January 2017
x.doi.org/10.1016/j.jqsrt.2017.01.03773/& 2017 The Author. Published by Elsevier
esponding author.ail address: [email protected] (J. Tennyson
e cite this article as: Zak EJ, et alsities. J Quant Spectrosc Radiat Tran
a b s t r a c t
The present paper reports room temperature line lists for six asymmetric isotopologues of carbondioxide: 16O12C18O (628), 16O12C17O (627), 16O13C18O (638),16O13C17O (637), 17O12C18O (728) and17O13C18O (738), covering the range 0–8000 cm�1. Variational rotation-vibration wavefunctions andenergy levels are computed using the DVR3D software suite and a high quality semi-empirical potentialenergy surface (PES), followed by computation of intensities using an ab initio dipole moment surface(DMS). A theoretical procedure for quantifying sensitivity of line intensities to minor distortions of thePES/DMS renders our theoretical model as critically evaluated. Several recent high quality measurementsand theoretical approaches are discussed to provide a benchmark of our results against the most accurateavailable data. Indeed, the thesis of transferability of accuracy among different isotopologues with theuse of mass-independent PES is supported by several examples. Thereby, we conclude that the majorityof line intensities for strong bands are predicted with sub-percent accuracy. Accurate line positions aregenerated using an effective Hamiltonian, constructed from the latest experiments. This study completesthe list of relevant isotopologues of carbon dioxide; these line lists are available to remote sensing studiesand inclusion in databases.
& 2017 The Author. Published by Elsevier Ltd. This is an open access article under the CC BY license(http://creativecommons.org/licenses/by/4.0/).
1. Introduction
Recently we reported room temperature line lists for the main12C16O2 [1] and other symmetric [2] isotopologues of carbon di-oxide. These studies covered the 0–8000 cm�1 spectral region and10�30 cm/molecule cut-off on transition intensities at 296 K. Thepurpose of the line lists provided was to deliver as complete aspossible description of the infra-red spectra of CO2 with highlyaccurate line intensities. These intensities have been proven todisplay sub-percent accuracy for several strong bands of the mainisotopologue [3–7]. Tentative indication of similar accuracy hasbeen recently reported for the 30013–00001 band of less abundantsymmetric 636 isotopologue [2,6]. Together with our reliabilityanalysis of the transition intensities on a purely theoretical basis,we presented semi-empirical line positions taken from the effec-tive Hamiltonian (EH) calculations. This constituted a compre-hensive study, readily applicable to numerous problems, such asdetermination of isotopic ratios of carbon in geophysical samples,
Ltd. This is an open access article
).
. Room temperature linelissfer (2017), http://dx.doi.or
quantification of 14C in fossil fuels or concentration measurementsof carbon dioxide by ground based and space missions.
A number of spectroscopic measurements on carbon dioxiderequire simultaneous knowledge of accurate line positions andline intensities for both its most abundant and rare isotopologues.A primary example of such situation is experimental retrieval ofthe concentration of 14CO2 in an environmental sample. The P(20)line of the asymmetric stretching fundamental ν3 band usuallyutilized for this purpose nearly overlaps with the P(19) line of ahot band originating from 13CO2. The quality of the elucidatedconcentration is therefore sensitive to the accuracy of both lines.
Another application that requires a priori knowledge of lineintensities of multiple isotopologues at the same time is de-termination of 13C/12C and 16O/17O/18O ratios. These ratios remaincrucial for modelling the Earth's geophysical processes, but also forexample, in investigating processes of formation of radiation fieldsin the Martian atmosphere, which is 96% rich in carbon dioxide[8]. The low natural abundances of 13C, 17O and 18O usually inhibithigh accuracy measurements of integral intensities on these CO2
species due in part to spectral congestion from more abundantisotopologues. Only recently, studies by Jacquemart et al. [9],Borkov et al. [10,11] and Karlovets et al. [13–17] on isotopically
under the CC BY license (http://creativecommons.org/licenses/by/4.0/).
ts for CO2 asymmetric isotopologues with ab initio computedg/10.1016/j.jqsrt.2017.01.037i
Table
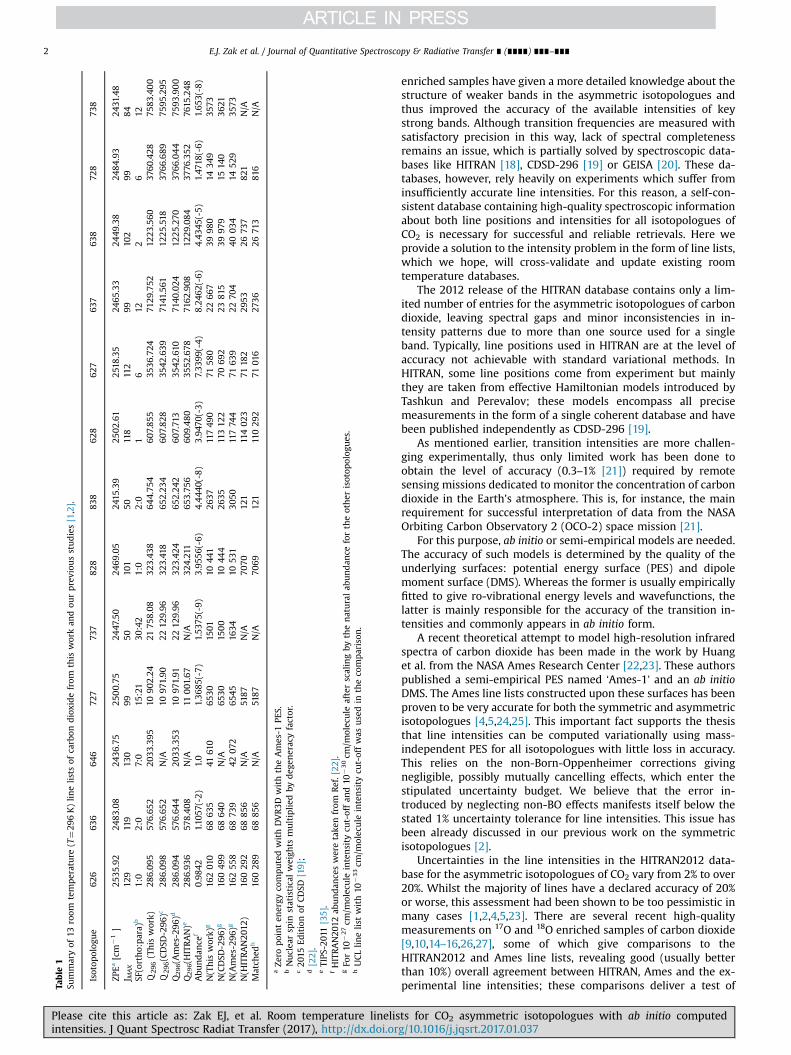
1Su
mmaryof
13room
temperature
(T¼29
6K)lin
elis
tsof
carbon
dioxidefrom
this
workan
dou
rpreviou
sstudies[1,2].
Isotop
olog
ue
626
636
646
727
737
828
838
628
627
637
638
728
738
ZPEa
[cm
�1]
2535
.92
2483
.08
2436
.75
2500.75
2447
.50
2469
.05
2415
.39
2502
.61
2518
.35
2465
.33
2449
.38
2484
.93
2431
.48
J MAX
129
119
130
9950
101
50118
112
9910
299
84SF
(ortho:para)
b1:0
2:0
7:0
15:21
30:42
1:0
2:0
16
122
612
Q29
6(This
work)
286.09
557
6.65
220
33.395
1090
2.24
2175
8.08
323.43
864
4.75
460
7.85
535
36.724
7129
.752
1223
.560
3760
.428
7583
.400
Q29
6(CDSD
-296
)c28
6.09
857
6.65
2N/A
1097
1.90
2212
9.96
323.41
865
2.23
460
7.82
835
42.639
7141
.561
1225
.518
3766
.689
7595
.295
Q296(A
mes-296
)d28
6.09
457
6.64
420
33.353
1097
1.91
2212
9.96
323.42
465
2.24
260
7.71
335
42.610
7140
.024
1225
.270
3766
.044
7593
.900
Q296(H
ITRAN)e
286.93
657
8.40
8N/A
11001
.67
N/A
324.21
165
3.75
660
9.480
3552
.678
7162
.908
1229
.084
3776
.352
7615
.248
Abu
ndan
cef
0.98
421.10
57(-2)
1.0
1.36
85(-7)
1.53
75(-9)
3.95
56(-6)
4.444
0(-8)
3.94
70(-3)
7.33
99(-4)
8.24
62(-6)
4.43
45(-5)
1.47
18(-6)
1.65
3(-8)
N(This
work)
g16
201
068
635
4161
065
3015
0110
441
2637
11749
071
580
2266
739
980
1434
935
73N(CDSD
-296
)g16
049
968
640
N/A
6530
1500
1044
426
3511312
270
692
2381
539
979
1514
036
21N(A
mes-296
)g16
255
868
739
4207
265
4516
3410
531
3050
11774
471
639
2270
440
034
1452
935
73N(H
ITRAN20
12)
16029
268
856
N/A
5187
N/A
7070
121
11402
371
182
2953
2673
782
1N/A
Match
edh
16028
968
856
N/A
5187
N/A
7069
121
11029
271
016
2736
2671
381
6N/A
aZe
ropointen
ergy
computedwithDVR3D
withtheAmes-1
PES.
bNuclea
rsp
instatisticalweigh
tsmultiplie
dby
deg
eneracyfactor.
c20
15Ed
itionof
CDSD
[19];
d[22].
eTIPS
-201
1[35].
fHITRAN20
12ab
undan
cesweretake
nfrom
Ref.[22
].gFo
r10
�27cm
/molecule
intensity
cut-offan
d10
�30cm
/molecule
afterscalingby
thenaturalab
undan
cefortheother
isotop
olog
ues.
hUCLlin
elis
twith10
�33cm
/molecule
intensity
cut-offwas
usedin
theco
mparison
.
E.J. Zak et al. / Journal of Quantitative Spectroscopy & Radiative Transfer ∎ (∎∎∎∎) ∎∎∎–∎∎∎2
Please cite this article as: Zak EJ, et al. Room temperature linelisintensities. J Quant Spectrosc Radiat Transfer (2017), http://dx.doi.or
enriched samples have given a more detailed knowledge about thestructure of weaker bands in the asymmetric isotopologues andthus improved the accuracy of the available intensities of keystrong bands. Although transition frequencies are measured withsatisfactory precision in this way, lack of spectral completenessremains an issue, which is partially solved by spectroscopic data-bases like HITRAN [18], CDSD-296 [19] or GEISA [20]. These da-tabases, however, rely heavily on experiments which suffer frominsufficiently accurate line intensities. For this reason, a self-con-sistent database containing high-quality spectroscopic informationabout both line positions and intensities for all isotopologues ofCO2 is necessary for successful and reliable retrievals. Here weprovide a solution to the intensity problem in the form of line lists,which we hope, will cross-validate and update existing roomtemperature databases.
The 2012 release of the HITRAN database contains only a lim-ited number of entries for the asymmetric isotopologues of carbondioxide, leaving spectral gaps and minor inconsistencies in in-tensity patterns due to more than one source used for a singleband. Typically, line positions used in HITRAN are at the level ofaccuracy not achievable with standard variational methods. InHITRAN, some line positions come from experiment but mainlythey are taken from effective Hamiltonian models introduced byTashkun and Perevalov; these models encompass all precisemeasurements in the form of a single coherent database and havebeen published independently as CDSD-296 [19].
As mentioned earlier, transition intensities are more challen-ging experimentally, thus only limited work has been done toobtain the level of accuracy (0.3–1% [21]) required by remotesensing missions dedicated to monitor the concentration of carbondioxide in the Earth's atmosphere. This is, for instance, the mainrequirement for successful interpretation of data from the NASAOrbiting Carbon Observatory 2 (OCO-2) space mission [21].
For this purpose, ab initio or semi-empirical models are needed.The accuracy of such models is determined by the quality of theunderlying surfaces: potential energy surface (PES) and dipolemoment surface (DMS). Whereas the former is usually empiricallyfitted to give ro-vibrational energy levels and wavefunctions, thelatter is mainly responsible for the accuracy of the transition in-tensities and commonly appears in ab initio form.
A recent theoretical attempt to model high-resolution infraredspectra of carbon dioxide has been made in the work by Huanget al. from the NASA Ames Research Center [22,23]. These authorspublished a semi-empirical PES named ‘Ames-1’ and an ab initioDMS. The Ames line lists constructed upon these surfaces has beenproven to be very accurate for both the symmetric and asymmetricisotopologues [4,5,24,25]. This important fact supports the thesisthat line intensities can be computed variationally using mass-independent PES for all isotopologues with little loss in accuracy.This relies on the non-Born-Oppenheimer corrections givingnegligible, possibly mutually cancelling effects, which enter thestipulated uncertainty budget. We believe that the error in-troduced by neglecting non-BO effects manifests itself below thestated 1% uncertainty tolerance for line intensities. This issue hasbeen already discussed in our previous work on the symmetricisotopologues [2].
Uncertainties in the line intensities in the HITRAN2012 data-base for the asymmetric isotopologues of CO2 vary from 2% to over20%. Whilst the majority of lines have a declared accuracy of 20%or worse, this assessment had been shown to be too pessimistic inmany cases [1,2,4,5,23]. There are several recent high-qualitymeasurements on 17O and 18O enriched samples of carbon dioxide[9,10,14–16,26,27], some of which give comparisons to theHITRAN2012 and Ames line lists, revealing good (usually betterthan 10%) overall agreement between HITRAN, Ames and the ex-perimental line intensities; these comparisons deliver a test of
ts for CO2 asymmetric isotopologues with ab initio computedg/10.1016/j.jqsrt.2017.01.037i
E.J. Zak et al. / Journal of Quantitative Spectroscopy & Radiative Transfer ∎ (∎∎∎∎) ∎∎∎–∎∎∎ 3
consistency between the measurement and the databases. Herewe use the established accuracy of the measurements and thetheoretical studies to perform a critical analysis of the intensitiescomputed using our ab initio dipole moment surface [1,3].
Line positions, derived from a variational approach and basedon semi-empirical potential energy surface (PES), are accurate to0.03–0.2 cm�1. Although the Ames-1 line lists [22,23] show thebest agreement with experiment among all variational calcula-tions, semi-empirical approaches based on effective Hamiltonianscan provide line positions with an accuracy at least one order ofmagnitude better [28]. On the other hand, effective Hamiltonianmodels strongly depend on the quality of the input data, thus theaccuracy and completeness of this technique are limited by ex-isting experiment.
The main source of errors in line intensity is DMS. In instanceswhen two ro-vibrational energy levels become close for a given Jvalue, several types of resonance interactions between these levelsare possible, depending on the symmetry of states. These re-sonances make energy levels, wavefunctions and line intensitiesvery sensitive to minor inaccuracies of the PES. In such cases, thecomputed intensity may not reflect the true accuracy of the DMS,thus a very accurate representation of the wavefunction is then
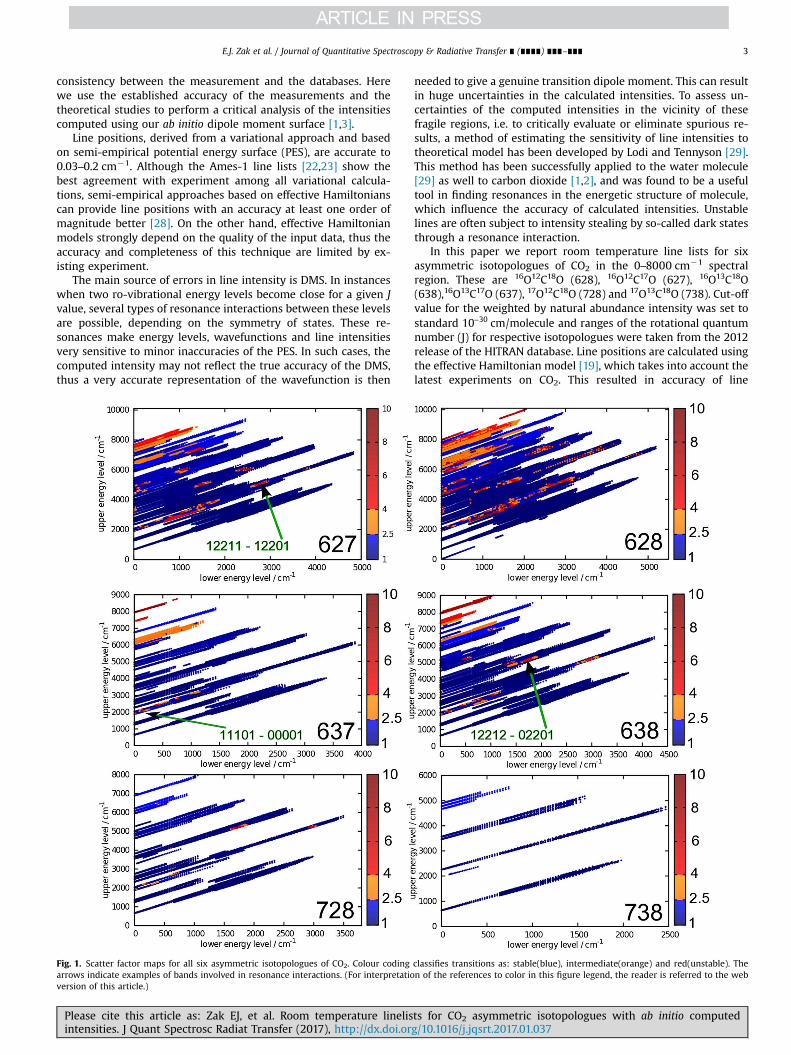
Fig. 1. Scatter factor maps for all six asymmetric isotopologues of CO2. Colour codingarrows indicate examples of bands involved in resonance interactions. (For interpretatioversion of this article.)
Please cite this article as: Zak EJ, et al. Room temperature linelisintensities. J Quant Spectrosc Radiat Transfer (2017), http://dx.doi.or
needed to give a genuine transition dipole moment. This can resultin huge uncertainties in the calculated intensities. To assess un-certainties of the computed intensities in the vicinity of thesefragile regions, i.e. to critically evaluate or eliminate spurious re-sults, a method of estimating the sensitivity of line intensities totheoretical model has been developed by Lodi and Tennyson [29].This method has been successfully applied to the water molecule[29] as well to carbon dioxide [1,2], and was found to be a usefultool in finding resonances in the energetic structure of molecule,which influence the accuracy of calculated intensities. Unstablelines are often subject to intensity stealing by so-called dark statesthrough a resonance interaction.
In this paper we report room temperature line lists for sixasymmetric isotopologues of CO2 in the 0–8000 cm�1 spectralregion. These are 16O12C18O (628), 16O12C17O (627), 16O13C18O(638),16O13C17O (637), 17O12C18O (728) and 17O13C18O (738). Cut-offvalue for the weighted by natural abundance intensity was set tostandard −10 cm/molecule30 and ranges of the rotational quantumnumber (J) for respective isotopologues were taken from the 2012release of the HITRAN database. Line positions are calculated usingthe effective Hamiltonian model [19], which takes into account thelatest experiments on CO2. This resulted in accuracy of line
classifies transitions as: stable(blue), intermediate(orange) and red(unstable). Then of the references to color in this figure legend, the reader is referred to the web
ts for CO2 asymmetric isotopologues with ab initio computedg/10.1016/j.jqsrt.2017.01.037i
E.J. Zak et al. / Journal of Quantitative Spectroscopy & Radiative Transfer ∎ (∎∎∎∎) ∎∎∎–∎∎∎4
positions of 0.001 cm�1 or better, and serves as an update to theCDSD-296 database [19] which is the most accurate and completerelease available. Reducing the symmetry of CO2 by asymmetricisotopic substitution introduces both extra allowed transitions andsome extra complications in the variational nuclear motion cal-culations. These are discussed in the next section. Theoretical erroranalysis performed in Section 3.2 renders selected line intensitiesas reliable from the point of view of the variational method.
2. Methodology
A summary of potential energy surfaces and dipole momentsurfaces used in the present work is given in Refs. [1,3,22]. Inparticular, our DMS (‘U’ below) has been demonstrated to giveresults of comparable accuracy to the state-of-the-art experiments[3]. In brief, we compute four independent line lists for each iso-topologue, by utilizing pairs of PESs and DMSs. The first PES de-noted as (Ames-1 or ‘A’) is a high-quality semi-empirical functionpublished by Huang et al. [22]. The second PES denoted as (Fittedor ‘F’) is also a semi-empirical surface, generated by fitting an abinitio potential to experimental energy levels for = −J 0 2 [1].Together with our ab initio DMS (denoted as ‘U’) [3], we use theN-2 DMS from Huang et al. [22] (denoted as ‘A’). This gives a set of
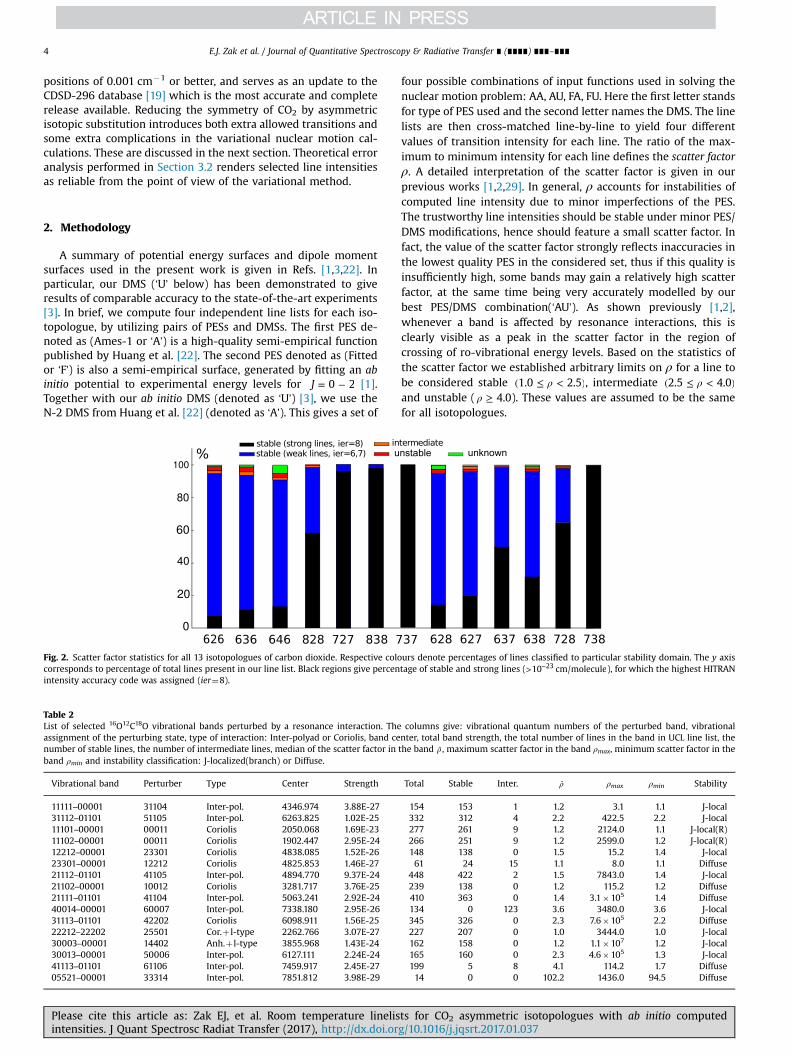
Fig. 2. Scatter factor statistics for all 13 isotopologues of carbon dioxide. Respective colocorresponds to percentage of total lines present in our line list. Black regions give percenintensity accuracy code was assigned (ier¼8).
Table 2List of selected 16O12C18O vibrational bands perturbed by a resonance interaction. Theassignment of the perturbing state, type of interaction: Inter-polyad or Coriolis, band cenumber of stable lines, the number of intermediate lines, median of the scatter factor inband ρmin and instability classification: J-localized(branch) or Diffuse.
Vibrational band Perturber Type Center Strength
11111–00001 31104 Inter-pol. 4346.974 3.88E-2731112–01101 51105 Inter-pol. 6263.825 1.02E-2511101–00001 00011 Coriolis 2050.068 1.69E-2311102–00001 00011 Coriolis 1902.447 2.95E-2412212–00001 23301 Coriolis 4838.085 1.52E-2623301–00001 12212 Coriolis 4825.853 1.46E-2721112–01101 41105 Inter-pol. 4894.770 9.37E-2421102–00001 10012 Coriolis 3281.717 3.76E-2521111–01101 41104 Inter-pol. 5063.241 2.92E-2440014–00001 60007 Inter-pol. 7338.180 2.95E-2631113–01101 42202 Coriolis 6098.911 1.56E-2522212–22202 25501 Cor.þ l-type 2262.766 3.07E-2730003–00001 14402 Anh.þ l-type 3855.968 1.43E-2430013–00001 50006 Inter-pol. 6127.111 2.24E-2441113–01101 61106 Inter-pol. 7459.917 2.45E-2705521–00001 33314 Inter-pol. 7851.812 3.98E-29
Please cite this article as: Zak EJ, et al. Room temperature linelisintensities. J Quant Spectrosc Radiat Transfer (2017), http://dx.doi.or
four possible combinations of input functions used in solving thenuclear motion problem: AA, AU, FA, FU. Here the first letter standsfor type of PES used and the second letter names the DMS. The linelists are then cross-matched line-by-line to yield four differentvalues of transition intensity for each line. The ratio of the max-imum to minimum intensity for each line defines the scatter factorρ. A detailed interpretation of the scatter factor is given in ourprevious works [1,2,29]. In general, ρ accounts for instabilities ofcomputed line intensity due to minor imperfections of the PES.The trustworthy line intensities should be stable under minor PES/DMS modifications, hence should feature a small scatter factor. Infact, the value of the scatter factor strongly reflects inaccuracies inthe lowest quality PES in the considered set, thus if this quality isinsufficiently high, some bands may gain a relatively high scatterfactor, at the same time being very accurately modelled by ourbest PES/DMS combination(‘AU’). As shown previously [1,2],whenever a band is affected by resonance interactions, this isclearly visible as a peak in the scatter factor in the region ofcrossing of ro-vibrational energy levels. Based on the statistics ofthe scatter factor we established arbitrary limits on ρ for a line tobe considered stable ρ( ≤ < )1.0 2.5 , intermediate ρ( ≤ < )2.5 4.0and unstable ( ρ ≥ 4.0). These values are assumed to be the samefor all isotopologues.
urs denote percentages of lines classified to particular stability domain. The y axistage of stable and strong lines (> −10 cm/molecule23 ), for which the highest HITRAN
columns give: vibrational quantum numbers of the perturbed band, vibrationalnter, total band strength, the total number of lines in the band in UCL line list, thethe band ρ̃ , maximum scatter factor in the band ρmax, minimum scatter factor in the
Total Stable Inter. ρ̃ ρmax ρmin Stability
154 153 1 1.2 3.1 1.1 J-local332 312 4 2.2 422.5 2.2 J-local277 261 9 1.2 2124.0 1.1 J-local(R)266 251 9 1.2 2599.0 1.2 J-local(R)148 138 0 1.5 15.2 1.4 J-local61 24 15 1.1 8.0 1.1 Diffuse
448 422 2 1.5 7843.0 1.4 J-local239 138 0 1.2 115.2 1.2 Diffuse410 363 0 1.4 3.1�105 1.4 Diffuse134 0 123 3.6 3480.0 3.6 J-local345 326 0 2.3 7.6�105 2.2 Diffuse227 207 0 1.0 3444.0 1.0 J-local162 158 0 1.2 1.1�107 1.2 J-local165 160 0 2.3 4.6�105 1.3 J-local199 5 8 4.1 114.2 1.7 Diffuse14 0 0 102.2 1436.0 94.5 Diffuse
ts for CO2 asymmetric isotopologues with ab initio computedg/10.1016/j.jqsrt.2017.01.037i
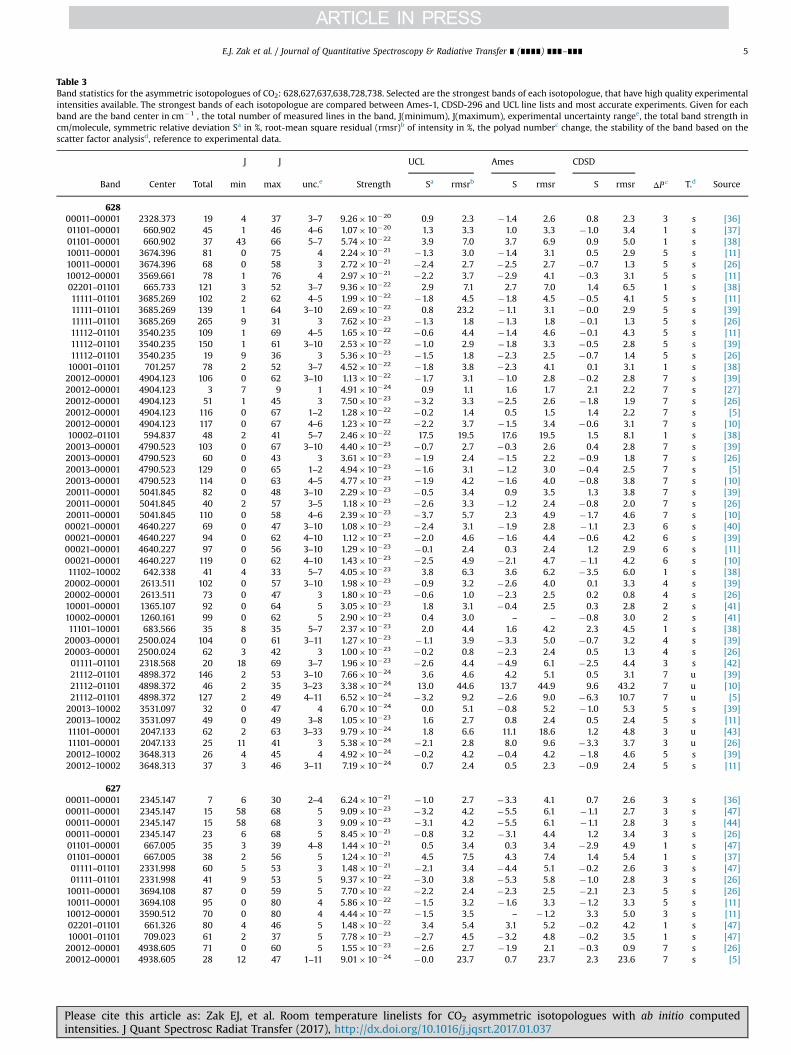
Table 3Band statistics for the asymmetric isotopologues of CO2: 628,627,637,638,728,738. Selected are the strongest bands of each isotopologue, that have high quality experimentalintensities available. The strongest bands of each isotopologue are compared between Ames-1, CDSD-296 and UCL line lists and most accurate experiments. Given for eachband are the band center in cm�1 , the total number of measured lines in the band, J(minimum), J(maximum), experimental uncertainty rangee, the total band strength incm/molecule, symmetric relative deviation Sa in %, root-mean square residual (rmsr)b of intensity in %, the polyad numberc change, the stability of the band based on thescatter factor analysisd, reference to experimental data.
J J UCL Ames CDSD
Band Center Total min max unc.e Strength Sa rmsrb S rmsr S rmsr ΔP c T.d Source
62800011–00001 2328.373 19 4 37 3–7 9.26�10�20 0.9 2.3 �1.4 2.6 0.8 2.3 3 s [36]01101–00001 660.902 45 1 46 4–6 1.07�10�20 1.3 3.3 1.0 3.3 �1.0 3.4 1 s [37]01101–00001 660.902 37 43 66 5–7 5.74�10�22 3.9 7.0 3.7 6.9 0.9 5.0 1 s [38]10011–00001 3674.396 81 0 75 4 2.24�10�21 �1.3 3.0 �1.4 3.1 0.5 2.9 5 s [11]10011–00001 3674.396 68 0 58 3 2.72�10�21 �2.4 2.7 �2.5 2.7 �0.7 1.3 5 s [26]10012–00001 3569.661 78 1 76 4 2.97�10�21 �2.2 3.7 �2.9 4.1 �0.3 3.1 5 s [11]02201–01101 665.733 121 3 52 3–7 9.36�10�22 2.9 7.1 2.7 7.0 1.4 6.5 1 s [38]11111–01101 3685.269 102 2 62 4–5 1.99�10�22 �1.8 4.5 �1.8 4.5 �0.5 4.1 5 s [11]11111–01101 3685.269 139 1 64 3–10 2.69�10�22 0.8 23.2 �1.1 3.1 �0.0 2.9 5 s [39]11111–01101 3685.269 265 9 31 3 7.62�10�23 �1.3 1.8 �1.3 1.8 �0.1 1.3 5 s [26]11112–01101 3540.235 109 1 69 4–5 1.65�10�22 �0.6 4.4 �1.4 4.6 �0.1 4.3 5 s [11]11112–01101 3540.235 150 1 61 3–10 2.53�10�22 �1.0 2.9 �1.8 3.3 �0.5 2.8 5 s [39]11112–01101 3540.235 19 9 36 3 5.36�10�23 �1.5 1.8 �2.3 2.5 �0.7 1.4 5 s [26]10001–01101 701.257 78 2 52 3–7 4.52�10�22 �1.8 3.8 �2.3 4.1 0.1 3.1 1 s [38]20012–00001 4904.123 106 0 62 3–10 1.13�10�22 �1.7 3.1 �1.0 2.8 �0.2 2.8 7 s [39]20012–00001 4904.123 3 7 9 1 4.91�10�24 0.9 1.1 1.6 1.7 2.1 2.2 7 s [27]20012–00001 4904.123 51 1 45 3 7.50�10�23 �3.2 3.3 �2.5 2.6 �1.8 1.9 7 s [26]20012–00001 4904.123 116 0 67 1–2 1.28�10�22 �0.2 1.4 0.5 1.5 1.4 2.2 7 s [5]20012–00001 4904.123 117 0 67 4–6 1.23�10�22 �2.2 3.7 �1.5 3.4 �0.6 3.1 7 s [10]10002–01101 594.837 48 2 41 5–7 2.46�10�22 17.5 19.5 17.6 19.5 1.5 8.1 1 s [38]20013–00001 4790.523 103 0 67 3–10 4.40�10�23 �0.7 2.7 �0.3 2.6 0.4 2.8 7 s [39]20013–00001 4790.523 60 0 43 3 3.61�10�23 �1.9 2.4 �1.5 2.2 �0.9 1.8 7 s [26]20013–00001 4790.523 129 0 65 1–2 4.94�10�23 �1.6 3.1 �1.2 3.0 �0.4 2.5 7 s [5]20013–00001 4790.523 114 0 63 4–5 4.77�10�23 �1.9 4.2 �1.6 4.0 �0.8 3.8 7 s [10]20011–00001 5041.845 82 0 48 3–10 2.29�10�23 �0.5 3.4 0.9 3.5 1.3 3.8 7 s [39]20011–00001 5041.845 40 2 57 3–5 1.18�10�23 �2.6 3.3 �1.2 2.4 �0.8 2.0 7 s [26]20011–00001 5041.845 110 0 58 4–6 2.39�10�23 �3.7 5.7 2.3 4.9 �1.7 4.6 7 s [10]00021–00001 4640.227 69 0 47 3–10 1.08�10�23 �2.4 3.1 �1.9 2.8 �1.1 2.3 6 s [40]00021–00001 4640.227 94 0 62 4–10 1.12�10�23 �2.0 4.6 �1.6 4.4 �0.6 4.2 6 s [39]00021–00001 4640.227 97 0 56 3–10 1.29�10�23 �0.1 2.4 0.3 2.4 1.2 2.9 6 s [11]00021–00001 4640.227 119 0 62 4–10 1.43�10�23 �2.5 4.9 �2.1 4.7 �1.1 4.2 6 s [10]11102–10002 642.338 41 4 33 5–7 4.05�10�23 3.8 6.3 3.6 6.2 �3.5 6.0 1 s [38]20002–00001 2613.511 102 0 57 3–10 1.98�10�23 �0.9 3.2 �2.6 4.0 0.1 3.3 4 s [39]20002–00001 2613.511 73 0 47 3 1.80�10�23 �0.6 1.0 �2.3 2.5 0.2 0.8 4 s [26]10001–00001 1365.107 92 0 64 5 3.05�10�23 1.8 3.1 �0.4 2.5 0.3 2.8 2 s [41]10002–00001 1260.161 99 0 62 5 2.90�10�23 0.4 3.0 – – �0.8 3.0 2 s [41]11101–10001 683.566 35 8 35 5–7 2.37�10�23 2.0 4.4 1.6 4.2 2.3 4.5 1 s [38]20003–00001 2500.024 104 0 61 3–11 1.27�10�23 �1.1 3.9 �3.3 5.0 �0.7 3.2 4 s [39]20003–00001 2500.024 62 3 42 3 1.00�10�23 �0.2 0.8 �2.3 2.4 0.5 1.3 4 s [26]01111–01101 2318.568 20 18 69 3–7 1.96�10�23 �2.6 4.4 �4.9 6.1 �2.5 4.4 3 s [42]21112–01101 4898.372 146 2 53 3–10 7.66�10�24 3.6 4.6 4.2 5.1 0.5 3.1 7 u [39]21112–01101 4898.372 46 2 35 3–23 3.38�10�24 13.0 44.6 13.7 44.9 9.6 43.2 7 u [10]21112–01101 4898.372 127 2 49 4–11 6.52�10�24 �3.2 9.2 �2.6 9.0 �6.3 10.7 7 u [5]20013–10002 3531.097 32 0 47 4 6.70�10�24 0.0 5.1 �0.8 5.2 �1.0 5.3 5 s [39]20013–10002 3531.097 49 0 49 3–8 1.05�10�23 1.6 2.7 0.8 2.4 0.5 2.4 5 s [11]11101–00001 2047.133 62 2 63 3–33 9.79�10�24 1.8 6.6 11.1 18.6 1.2 4.8 3 u [43]11101–00001 2047.133 25 11 41 3 5.38�10�24 �2.1 2.8 8.0 9.6 �3.3 3.7 3 u [26]20012–10002 3648.313 26 4 45 4 4.92�10�24 �0.2 4.2 �0.4 4.2 �1.8 4.6 5 s [39]20012–10002 3648.313 37 3 46 3–11 7.19�10�24 0.7 2.4 0.5 2.3 �0.9 2.4 5 s [11]
62700011–00001 2345.147 7 6 30 2–4 6.24�10�21 �1.0 2.7 �3.3 4.1 0.7 2.6 3 s [36]00011–00001 2345.147 15 58 68 5 9.09�10�23 �3.2 4.2 �5.5 6.1 �1.1 2.7 3 s [47]00011–00001 2345.147 15 58 68 3 9.09�10�23 �3.1 4.2 �5.5 6.1 �1.1 2.8 3 s [44]00011–00001 2345.147 23 6 68 5 8.45�10�21 �0.8 3.2 �3.1 4.4 1.2 3.4 3 s [26]01101–00001 667.005 35 3 39 4–8 1.44�10�21 0.5 3.4 0.3 3.4 �2.9 4.9 1 s [47]01101–00001 667.005 38 2 56 5 1.24�10�21 4.5 7.5 4.3 7.4 1.4 5.4 1 s [37]01111–01101 2331.998 60 5 53 3 1.48�10�21 �2.1 3.4 �4.4 5.1 �0.2 2.6 3 s [47]01111–01101 2331.998 41 9 53 5 9.37�10�22 �3.0 3.8 �5.3 5.8 �1.0 2.8 3 s [26]10011–00001 3694.108 87 0 59 5 7.70�10�22 �2.2 2.4 �2.3 2.5 �2.1 2.3 5 s [26]10011–00001 3694.108 95 0 80 4 5.86�10�22 �1.5 3.2 �1.6 3.3 �1.2 3.3 5 s [11]10012–00001 3590.512 70 0 80 4 4.44�10�22 �1.5 3.5 – �1.2 3.3 5.0 3 s [11]02201–01101 661.326 80 4 46 5 1.48�10�22 3.4 5.4 3.1 5.2 �0.2 4.2 1 s [47]10001–01101 709.023 61 2 37 5 7.78�10�23 �2.7 4.5 �3.2 4.8 �0.2 3.5 1 s [47]20012–00001 4938.605 71 0 60 5 1.55�10�23 �2.6 2.7 �1.9 2.1 �0.3 0.9 7 s [26]20012–00001 4938.605 28 12 47 1–11 9.01�10�24 �0.0 23.7 0.7 23.7 2.3 23.6 7 s [5]
E.J. Zak et al. / Journal of Quantitative Spectroscopy & Radiative Transfer ∎ (∎∎∎∎) ∎∎∎–∎∎∎ 5
Please cite this article as: Zak EJ, et al. Room temperature linelists for CO2 asymmetric isotopologues with ab initio computedintensities. J Quant Spectrosc Radiat Transfer (2017), http://dx.doi.org/10.1016/j.jqsrt.2017.01.037i
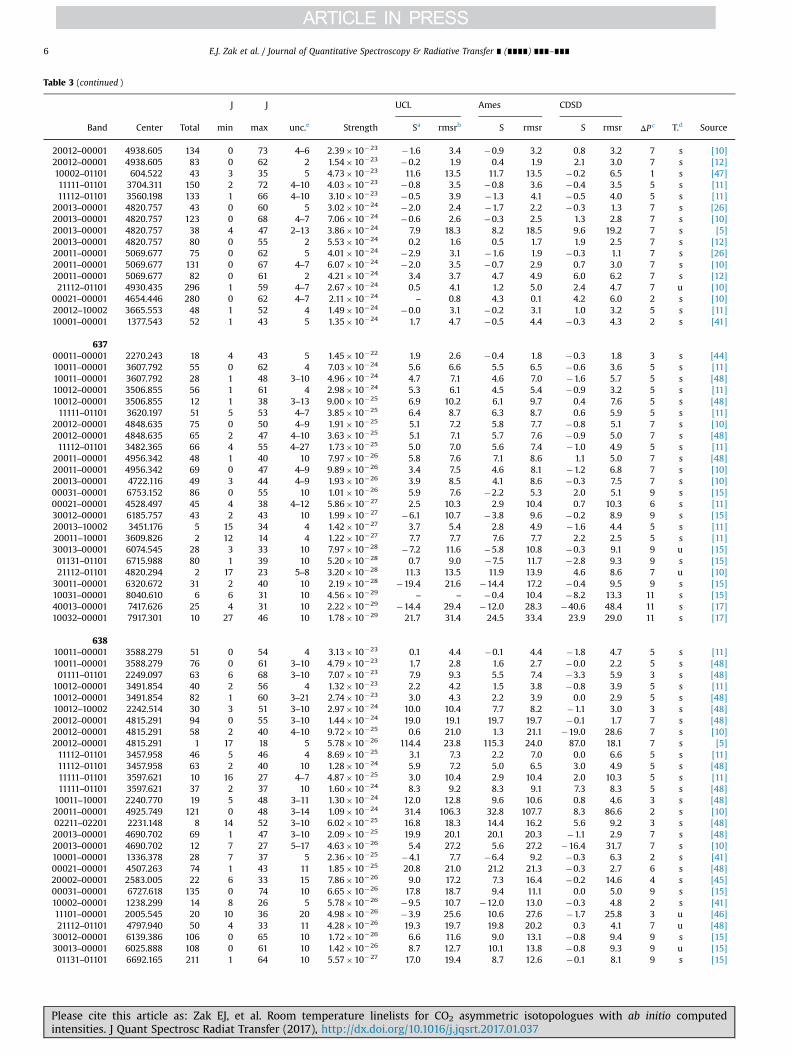
Table 3 (continued )
J J UCL Ames CDSD
Band Center Total min max unc.e Strength Sa rmsrb S rmsr S rmsr ΔP c T.d Source
20012–00001 4938.605 134 0 73 4–6 2.39�10�23 �1.6 3.4 �0.9 3.2 0.8 3.2 7 s [10]20012–00001 4938.605 83 0 62 2 1.54�10�23 �0.2 1.9 0.4 1.9 2.1 3.0 7 s [12]10002–01101 604.522 43 3 35 5 4.73�10�23 11.6 13.5 11.7 13.5 �0.2 6.5 1 s [47]11111–01101 3704.311 150 2 72 4–10 4.03�10�23 �0.8 3.5 �0.8 3.6 �0.4 3.5 5 s [11]11112–01101 3560.198 133 1 66 4–10 3.10�10�23 �0.5 3.9 �1.3 4.1 �0.5 4.0 5 s [11]
20013–00001 4820.757 43 0 60 5 3.02�10�24 �2.0 2.4 �1.7 2.2 �0.3 1.3 7 s [26]20013–00001 4820.757 123 0 68 4–7 7.06�10�24 �0.6 2.6 �0.3 2.5 1.3 2.8 7 s [10]20013–00001 4820.757 38 4 47 2–13 3.86�10�24 7.9 18.3 8.2 18.5 9.6 19.2 7 s [5]20013–00001 4820.757 80 0 55 2 5.53�10�24 0.2 1.6 0.5 1.7 1.9 2.5 7 s [12]20011–00001 5069.677 75 0 62 5 4.01�10�24 �2.9 3.1 �1.6 1.9 �0.3 1.1 7 s [26]20011–00001 5069.677 131 0 67 4–7 6.07�10�24 �2.0 3.5 �0.7 2.9 0.7 3.0 7 s [10]20011–00001 5069.677 82 0 61 2 4.21�10�24 3.4 3.7 4.7 4.9 6.0 6.2 7 s [12]21112–01101 4930.435 296 1 59 4–7 2.67�10�24 0.5 4.1 1.2 5.0 2.4 4.7 7 u [10]
00021–00001 4654.446 280 0 62 4–7 2.11�10�24 – 0.8 4.3 0.1 4.2 6.0 2 s [10]20012–10002 3665.553 48 1 52 4 1.49�10�24 �0.0 3.1 �0.2 3.1 1.0 3.2 5 s [11]10001–00001 1377.543 52 1 43 5 1.35�10�24 1.7 4.7 �0.5 4.4 �0.3 4.3 2 s [41]
63700011–00001 2270.243 18 4 43 5 1.45�10�22 1.9 2.6 �0.4 1.8 �0.3 1.8 3 s [44]10011–00001 3607.792 55 0 62 4 7.03�10�24 5.6 6.6 5.5 6.5 �0.6 3.6 5 s [11]10011–00001 3607.792 28 1 48 3–10 4.96�10�24 4.7 7.1 4.6 7.0 �1.6 5.7 5 s [48]10012–00001 3506.855 56 1 61 4 2.98�10�24 5.3 6.1 4.5 5.4 �0.9 3.2 5 s [11]10012–00001 3506.855 12 1 38 3–13 9.00�10�25 6.9 10.2 6.1 9.7 0.4 7.6 5 s [48]11111–01101 3620.197 51 5 53 4–7 3.85�10�25 6.4 8.7 6.3 8.7 0.6 5.9 5 s [11]
20012–00001 4848.635 75 0 50 4–9 1.91�10�25 5.1 7.2 5.8 7.7 �0.8 5.1 7 s [10]20012–00001 4848.635 65 2 47 4–10 3.63�10�25 5.1 7.1 5.7 7.6 �0.9 5.0 7 s [48]11112–01101 3482.365 66 4 55 4–27 1.73�10�25 5.0 7.0 5.6 7.4 �1.0 4.9 5 s [11]
20011–00001 4956.342 48 1 40 10 7.97�10�26 5.8 7.6 7.1 8.6 1.1 5.0 7 s [48]20011–00001 4956.342 69 0 47 4–9 9.89�10�26 3.4 7.5 4.6 8.1 �1.2 6.8 7 s [10]20013–00001 4722.116 49 3 44 4–9 1.93�10�26 3.9 8.5 4.1 8.6 �0.3 7.5 7 s [10]00031–00001 6753.152 86 0 55 10 1.01�10�26 5.9 7.6 �2.2 5.3 2.0 5.1 9 s [15]00021–00001 4528.497 45 4 38 4–12 5.86�10�27 2.5 10.3 2.9 10.4 0.7 10.3 6 s [11]30012–00001 6185.757 43 2 43 10 1.99�10�27 �6.1 10.7 �3.8 9.6 �0.2 8.9 9 s [15]20013–10002 3451.176 5 15 34 4 1.42�10�27 3.7 5.4 2.8 4.9 �1.6 4.4 5 s [11]20011–10001 3609.826 2 12 14 4 1.22�10�27 7.7 7.7 7.6 7.7 2.2 2.5 5 s [11]30013–00001 6074.545 28 3 33 10 7.97�10�28 �7.2 11.6 �5.8 10.8 �0.3 9.1 9 u [15]01131–01101 6715.988 80 1 39 10 5.20�10�28 0.7 9.0 �7.5 11.7 �2.8 9.3 9 s [15]21112–01101 4820.294 2 17 23 5–8 3.20�10�28 11.3 13.5 11.9 13.9 4.6 8.6 7 u [10]30011–00001 6320.672 31 2 40 10 2.19�10�28 �19.4 21.6 �14.4 17.2 �0.4 9.5 9 s [15]10031–00001 8040.610 6 6 31 10 4.56�10�29 – – �0.4 10.4 �8.2 13.3 11 s [15]40013–00001 7417.626 25 4 31 10 2.22�10�29 �14.4 29.4 �12.0 28.3 �40.6 48.4 11 s [17]10032–00001 7917.301 10 27 46 10 1.78�10�29 21.7 31.4 24.5 33.4 23.9 29.0 11 s [17]
63810011–00001 3588.279 51 0 54 4 3.13�10�23 0.1 4.4 �0.1 4.4 �1.8 4.7 5 s [11]10011–00001 3588.279 76 0 61 3–10 4.79�10�23 1.7 2.8 1.6 2.7 �0.0 2.2 5 s [48]01111–01101 2249.097 63 6 68 3–10 7.07�10�23 7.9 9.3 5.5 7.4 �3.3 5.9 3 s [48]
10012–00001 3491.854 40 2 56 4 1.32�10�23 2.2 4.2 1.5 3.8 �0.8 3.9 5 s [11]10012–00001 3491.854 82 1 60 3–21 2.74�10�23 3.0 4.3 2.2 3.9 0.0 2.9 5 s [48]10012–10002 2242.514 30 3 51 3–10 2.97�10�24 10.0 10.4 7.7 8.2 �1.1 3.0 3 s [48]20012–00001 4815.291 94 0 55 3–10 1.44�10�24 19.0 19.1 19.7 19.7 �0.1 1.7 7 s [48]20012–00001 4815.291 58 2 40 4–10 9.72�10�25 0.6 21.0 1.3 21.1 �19.0 28.6 7 s [10]20012–00001 4815.291 1 17 18 5 5.78�10�26 114.4 23.8 115.3 24.0 87.0 18.1 7 s [5]11112–01101 3457.958 46 5 46 4 8.69�10�25 3.1 7.3 2.2 7.0 0.0 6.6 5 s [11]11112–01101 3457.958 63 2 40 10 1.28�10�24 5.9 7.2 5.0 6.5 3.0 4.9 5 s [48]11111–01101 3597.621 10 16 27 4–7 4.87�10�25 3.0 10.4 2.9 10.4 2.0 10.3 5 s [11]11111–01101 3597.621 37 2 37 10 1.60�10�24 8.3 9.2 8.3 9.1 7.3 8.3 5 s [48]10011–10001 2240.770 19 5 48 3–11 1.30�10�24 12.0 12.8 9.6 10.6 0.8 4.6 3 s [48]20011–00001 4925.749 121 0 48 3–14 1.09�10�24 31.4 106.3 32.8 107.7 8.3 86.6 2 s [10]02211–02201 2231.148 8 14 52 3–10 6.02�10�25 16.8 18.3 14.4 16.2 5.6 9.2 3 s [48]20013–00001 4690.702 69 1 47 3–10 2.09�10�25 19.9 20.1 20.1 20.3 �1.1 2.9 7 s [48]20013–00001 4690.702 12 7 27 5–17 4.63�10�26 5.4 27.2 5.6 27.2 �16.4 31.7 7 s [10]10001–00001 1336.378 28 7 37 5 2.36�10�25 �4.1 7.7 �6.4 9.2 �0.3 6.3 2 s [41]00021–00001 4507.263 74 1 43 11 1.85�10�25 20.8 21.0 21.2 21.3 �0.3 2.7 6 s [48]20002–00001 2583.005 22 6 33 15 7.86�10�26 9.0 17.2 7.3 16.4 �0.2 14.6 4 s [45]00031–00001 6727.618 135 0 74 10 6.65�10�26 17.8 18.7 9.4 11.1 0.0 5.0 9 s [15]10002–00001 1238.299 14 8 26 5 5.78�10�26 �9.5 10.7 �12.0 13.0 �0.3 4.8 2 s [41]11101–00001 2005.545 20 10 36 20 4.98�10�26 �3.9 25.6 10.6 27.6 �1.7 25.8 3 u [46]21112–01101 4797.940 50 4 33 11 4.28�10�26 19.3 19.7 19.8 20.2 0.3 4.1 7 u [48]
30012–00001 6139.386 106 0 65 10 1.72�10�26 6.6 11.6 9.0 13.1 �0.8 9.4 9 s [15]30013–00001 6025.888 108 0 61 10 1.42�10�26 8.7 12.7 10.1 13.8 �0.8 9.3 9 u [15]01131–01101 6692.165 211 1 64 10 5.57�10�27 17.0 19.4 8.7 12.6 �0.1 8.1 9 s [15]
E.J. Zak et al. / Journal of Quantitative Spectroscopy & Radiative Transfer ∎ (∎∎∎∎) ∎∎∎–∎∎∎6
Please cite this article as: Zak EJ, et al. Room temperature linelists for CO2 asymmetric isotopologues with ab initio computedintensities. J Quant Spectrosc Radiat Transfer (2017), http://dx.doi.org/10.1016/j.jqsrt.2017.01.037i
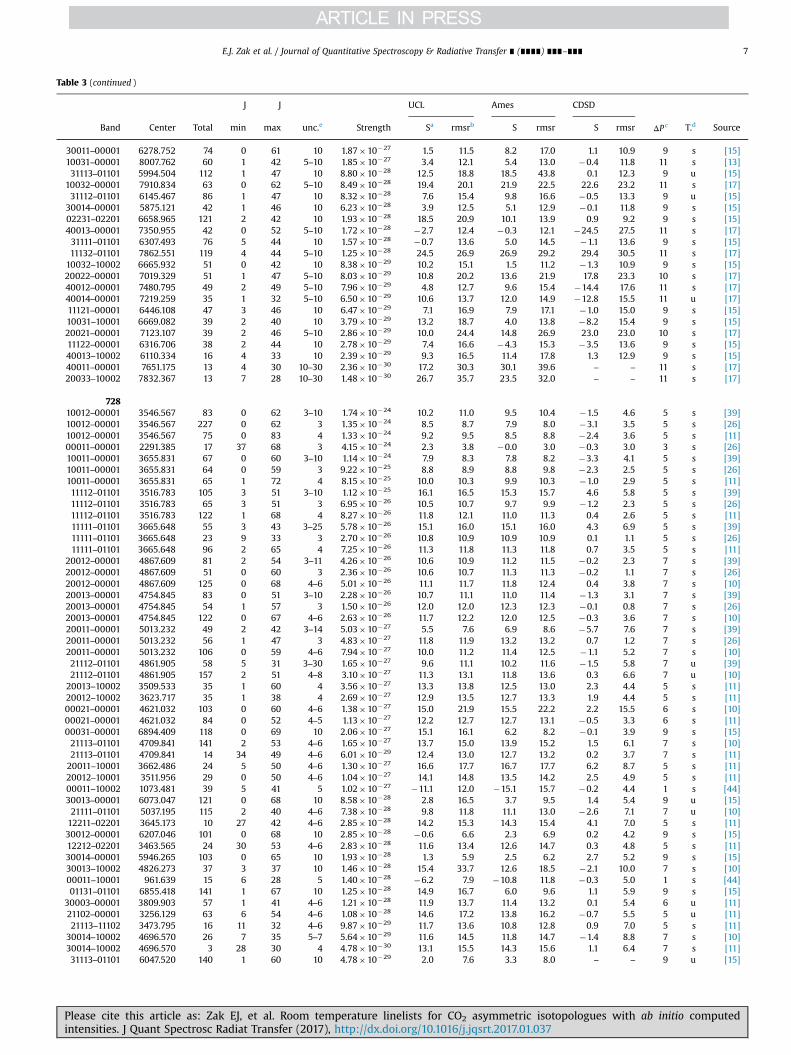
Table 3 (continued )
J J UCL Ames CDSD
Band Center Total min max unc.e Strength Sa rmsrb S rmsr S rmsr ΔP c T.d Source
30011–00001 6278.752 74 0 61 10 1.87�10�27 1.5 11.5 8.2 17.0 1.1 10.9 9 s [15]10031–00001 8007.762 60 1 42 5–10 1.85�10�27 3.4 12.1 5.4 13.0 �0.4 11.8 11 s [13]31113–01101 5994.504 112 1 47 10 8.80�10�28 12.5 18.8 18.5 43.8 0.1 12.3 9 u [15]
10032–00001 7910.834 63 0 62 5–10 8.49�10�28 19.4 20.1 21.9 22.5 22.6 23.2 11 s [17]31112–01101 6145.467 86 1 47 10 8.32�10�28 7.6 15.4 9.8 16.6 �0.5 13.3 9 u [15]
30014–00001 5875.121 42 1 46 10 6.23�10�28 3.9 12.5 5.1 12.9 �0.1 11.8 9 s [15]02231–02201 6658.965 121 2 42 10 1.93�10�28 18.5 20.9 10.1 13.9 0.9 9.2 9 s [15]40013–00001 7350.955 42 0 52 5–10 1.72�10�28 �2.7 12.4 �0.3 12.1 �24.5 27.5 11 s [17]31111–01101 6307.493 76 5 44 10 1.57�10�28 �0.7 13.6 5.0 14.5 �1.1 13.6 9 s [15]11132–01101 7862.551 119 4 44 5–10 1.25�10�28 24.5 26.9 26.9 29.2 29.4 30.5 11 s [17]10032–10002 6665.932 51 0 42 10 8.38�10�29 10.2 15.1 1.5 11.2 �1.3 10.9 9 s [15]20022–00001 7019.329 51 1 47 5–10 8.03�10�29 10.8 20.2 13.6 21.9 17.8 23.3 10 s [17]40012–00001 7480.795 49 2 49 5–10 7.96�10�29 4.8 12.7 9.6 15.4 �14.4 17.6 11 s [17]40014–00001 7219.259 35 1 32 5–10 6.50�10�29 10.6 13.7 12.0 14.9 �12.8 15.5 11 u [17]11121–00001 6446.108 47 3 46 10 6.47�10�29 7.1 16.9 7.9 17.1 �1.0 15.0 9 s [15]10031–10001 6669.082 39 2 40 10 3.79�10�29 13.2 18.7 4.0 13.8 �8.2 15.4 9 s [15]20021–00001 7123.107 39 2 46 5–10 2.86�10�29 10.0 24.4 14.8 26.9 23.0 23.0 10 s [17]11122–00001 6316.706 38 2 44 10 2.78�10�29 7.4 16.6 �4.3 15.3 �3.5 13.6 9 s [15]40013–10002 6110.334 16 4 33 10 2.39�10�29 9.3 16.5 11.4 17.8 1.3 12.9 9 s [15]40011–00001 7651.175 13 4 30 10–30 2.36�10�30 17.2 30.3 30.1 39.6 – – 11 s [17]20033–10002 7832.367 13 7 28 10–30 1.48�10�30 26.7 35.7 23.5 32.0 – – 11 s [17]
72810012–00001 3546.567 83 0 62 3–10 1.74�10�24 10.2 11.0 9.5 10.4 �1.5 4.6 5 s [39]10012–00001 3546.567 227 0 62 3 1.35�10�24 8.5 8.7 7.9 8.0 �3.1 3.5 5 s [26]10012–00001 3546.567 75 0 83 4 1.33�10�24 9.2 9.5 8.5 8.8 �2.4 3.6 5 s [11]00011–00001 2291.385 17 37 68 3 4.15�10�24 2.3 3.8 �0.0 3.0 �0.3 3.0 3 s [26]10011–00001 3655.831 67 0 60 3–10 1.14�10�24 7.9 8.3 7.8 8.2 �3.3 4.1 5 s [39]10011–00001 3655.831 64 0 59 3 9.22�10�25 8.8 8.9 8.8 9.8 �2.3 2.5 5 s [26]10011–00001 3655.831 65 1 72 4 8.15�10�25 10.0 10.3 9.9 10.3 �1.0 2.9 5 s [11]11112–01101 3516.783 105 3 51 3–10 1.12�10�25 16.1 16.5 15.3 15.7 4.6 5.8 5 s [39]11112–01101 3516.783 65 3 51 3 6.95�10�26 10.5 10.7 9.7 9.9 �1.2 2.3 5 s [26]11112–01101 3516.783 122 1 68 4 8.27�10�26 11.8 12.1 11.0 11.3 0.4 2.6 5 s [11]11111–01101 3665.648 55 3 43 3–25 5.78�10�26 15.1 16.0 15.1 16.0 4.3 6.9 5 s [39]11111–01101 3665.648 23 9 33 3 2.70�10�26 10.8 10.9 10.9 10.9 0.1 1.1 5 s [26]11111–01101 3665.648 96 2 65 4 7.25�10�26 11.3 11.8 11.3 11.8 0.7 3.5 5 s [11]
20012–00001 4867.609 81 2 54 3–11 4.26�10�26 10.6 10.9 11.2 11.5 �0.2 2.3 7 s [39]20012–00001 4867.609 51 0 60 3 2.36�10�26 10.6 10.7 11.3 11.3 �0.2 1.1 7 s [26]20012–00001 4867.609 125 0 68 4–6 5.01�10�26 11.1 11.7 11.8 12.4 0.4 3.8 7 s [10]20013–00001 4754.845 83 0 51 3–10 2.28�10�26 10.7 11.1 11.0 11.4 �1.3 3.1 7 s [39]20013–00001 4754.845 54 1 57 3 1.50�10�26 12.0 12.0 12.3 12.3 �0.1 0.8 7 s [26]20013–00001 4754.845 122 0 67 4–6 2.63�10�26 11.7 12.2 12.0 12.5 �0.3 3.6 7 s [10]20011–00001 5013.232 49 2 42 3–14 5.03�10�27 5.5 7.6 6.9 8.6 �5.7 7.6 7 s [39]20011–00001 5013.232 56 1 47 3 4.83�10�27 11.8 11.9 13.2 13.2 0.7 1.2 7 s [26]20011–00001 5013.232 106 0 59 4–6 7.94�10�27 10.0 11.2 11.4 12.5 �1.1 5.2 7 s [10]21112–01101 4861.905 58 5 31 3–30 1.65�10�27 9.6 11.1 10.2 11.6 �1.5 5.8 7 u [39]21112–01101 4861.905 157 2 51 4–8 3.10�10�27 11.3 13.1 11.8 13.6 0.3 6.6 7 u [10]20013–10002 3509.533 35 1 60 4 3.56�10�27 13.3 13.8 12.5 13.0 2.3 4.4 5 s [11]20012–10002 3623.717 35 1 38 4 2.69�10�27 12.9 13.5 12.7 13.3 1.9 4.4 5 s [11]00021–00001 4621.032 103 0 60 4–6 1.38�10�27 15.0 21.9 15.5 22.2 2.2 15.5 6 s [10]00021–00001 4621.032 84 0 52 4–5 1.13�10�27 12.2 12.7 12.7 13.1 �0.5 3.3 6 s [11]00031–00001 6894.409 118 0 69 10 2.06�10�27 15.1 16.1 6.2 8.2 �0.1 3.9 9 s [15]21113–01101 4709.841 141 2 53 4–6 1.65�10�27 13.7 15.0 13.9 15.2 1.5 6.1 7 s [10]21113–01101 4709.841 14 34 49 4–6 6.01�10�29 12.4 13.0 12.7 13.2 0.2 3.7 7 s [11]20011–10001 3662.486 24 5 50 4–6 1.30�10�27 16.6 17.7 16.7 17.7 6.2 8.7 5 s [11]20012–10001 3511.956 29 0 50 4–6 1.04�10�27 14.1 14.8 13.5 14.2 2.5 4.9 5 s [11]00011–10002 1073.481 39 5 41 5 1.02�10�27 �11.1 12.0 �15.1 15.7 �0.2 4.4 1 s [44]30013–00001 6073.047 121 0 68 10 8.58�10�28 2.8 16.5 3.7 9.5 1.4 5.4 9 u [15]21111–01101 5037.195 115 2 40 4–6 7.38�10�28 9.8 11.8 11.1 13.0 �2.6 7.1 7 u [10]12211–02201 3645.173 10 27 42 4–6 2.85�10�28 14.2 15.3 14.3 15.4 4.1 7.0 5 s [11]30012–00001 6207.046 101 0 68 10 2.85�10�28 �0.6 6.6 2.3 6.9 0.2 4.2 9 s [15]12212–02201 3463.565 24 30 53 4–6 2.83�10�28 11.6 13.4 12.6 14.7 0.3 4.8 5 s [11]30014–00001 5946.265 103 0 65 10 1.93�10�28 1.3 5.9 2.5 6.2 2.7 5.2 9 s [15]30013–10002 4826.273 37 3 37 10 1.46�10�28 15.4 33.7 12.6 18.5 �2.1 10.0 7 s [10]00011–10001 961.639 15 6 28 5 1.40�10�28 �6.2 7.9 �10.8 11.8 �0.3 5.0 1 s [44]01131–01101 6855.418 141 1 67 10 1.25�10�28 14.9 16.7 6.0 9.6 1.1 5.9 9 s [15]
30003–00001 3809.903 57 1 41 4–6 1.21�10�28 11.9 13.7 11.4 13.2 0.1 5.4 6 u [11]21102–00001 3256.129 63 6 54 4–6 1.08�10�28 14.6 17.2 13.8 16.2 �0.7 5.5 5 u [11]21113–11102 3473.795 16 11 32 4–6 9.87�10�29 11.7 13.6 10.8 12.8 0.9 7.0 5 s [11]
30014–10002 4696.570 26 7 35 5–7 5.64�10�29 11.6 14.5 11.8 14.7 �1.4 8.8 7 s [10]30014–10002 4696.570 3 28 30 4 4.78�10�30 13.1 15.5 14.3 15.6 1.1 6.4 7 s [11]31113–01101 6047.520 140 1 60 10 4.78�10�29 2.0 7.6 3.3 8.0 – – 9 u [15]
E.J. Zak et al. / Journal of Quantitative Spectroscopy & Radiative Transfer ∎ (∎∎∎∎) ∎∎∎–∎∎∎ 7
Please cite this article as: Zak EJ, et al. Room temperature linelists for CO2 asymmetric isotopologues with ab initio computedintensities. J Quant Spectrosc Radiat Transfer (2017), http://dx.doi.org/10.1016/j.jqsrt.2017.01.037i
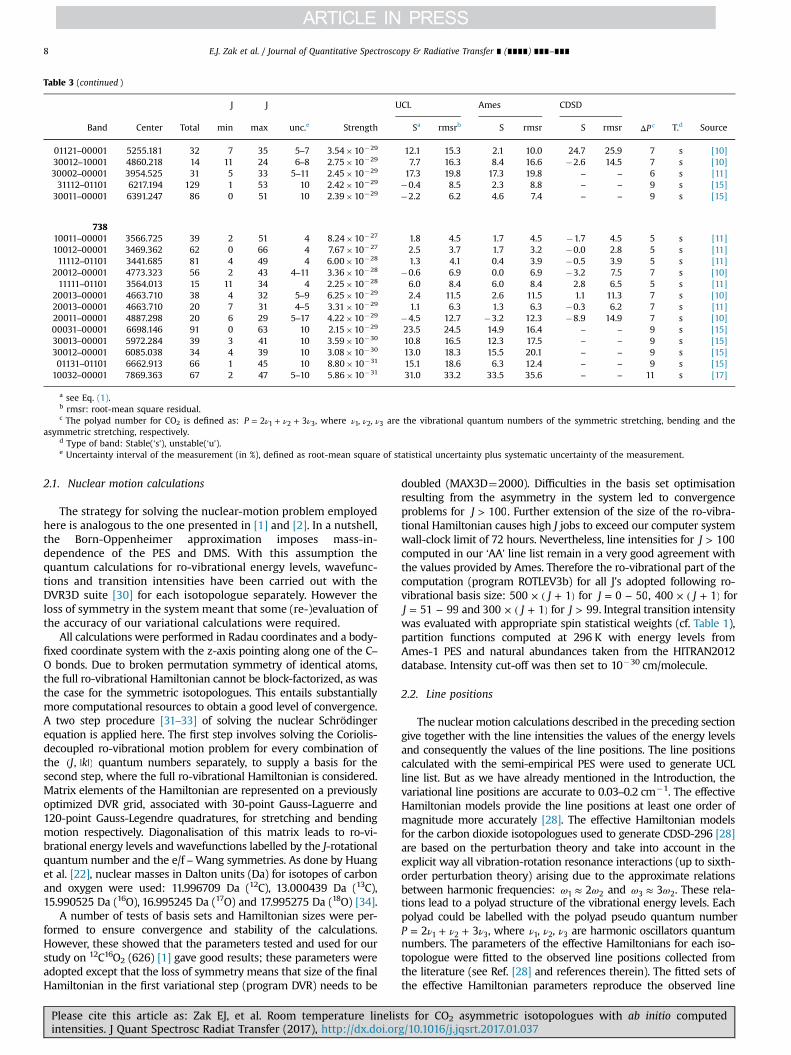
Table 3 (continued )
J J UCL Ames CDSD
Band Center Total min max unc.e Strength Sa rmsrb S rmsr S rmsr ΔP c T.d Source
01121–00001 5255.181 32 7 35 5–7 3.54�10�29 12.1 15.3 2.1 10.0 24.7 25.9 7 s [10]30012–10001 4860.218 14 11 24 6–8 2.75�10�29 7.7 16.3 8.4 16.6 �2.6 14.5 7 s [10]30002–00001 3954.525 31 5 33 5–11 2.45�10�29 17.3 19.8 17.3 19.8 – – 6 s [11]31112–01101 6217.194 129 1 53 10 2.42�10�29 �0.4 8.5 2.3 8.8 – – 9 s [15]30011–00001 6391.247 86 0 51 10 2.39�10�29 �2.2 6.2 4.6 7.4 – – 9 s [15]
73810011–00001 3566.725 39 2 51 4 8.24�10�27 1.8 4.5 1.7 4.5 �1.7 4.5 5 s [11]10012–00001 3469.362 62 0 66 4 7.67�10�27 2.5 3.7 1.7 3.2 �0.0 2.8 5 s [11]11112–01101 3441.685 81 4 49 4 6.00�10�28 1.3 4.1 0.4 3.9 �0.5 3.9 5 s [11]
20012–00001 4773.323 56 2 43 4–11 3.36�10�28 �0.6 6.9 0.0 6.9 �3.2 7.5 7 s [10]11111–01101 3564.013 15 11 34 4 2.25�10�28 6.0 8.4 6.0 8.4 2.8 6.5 5 s [11]
20013–00001 4663.710 38 4 32 5–9 6.25�10�29 2.4 11.5 2.6 11.5 1.1 11.3 7 s [10]20013–00001 4663.710 20 7 31 4–5 3.31�10�29 1.1 6.3 1.3 6.3 �0.3 6.2 7 s [11]20011–00001 4887.298 20 6 29 5–17 4.22�10�29 �4.5 12.7 �3.2 12.3 �8.9 14.9 7 s [10]00031–00001 6698.146 91 0 63 10 2.15�10�29 23.5 24.5 14.9 16.4 – – 9 s [15]30013–00001 5972.284 39 3 41 10 3.59�10�30 10.8 16.5 12.3 17.5 – – 9 s [15]30012–00001 6085.038 34 4 39 10 3.08�10�30 13.0 18.3 15.5 20.1 – – 9 s [15]01131–01101 6662.913 66 1 45 10 8.80�10�31 15.1 18.6 6.3 12.4 – – 9 s [15]
10032–00001 7869.363 67 2 47 5–10 5.86�10�31 31.0 33.2 33.5 35.6 – – 11 s [17]
a see Eq. (1).b rmsr: root-mean square residual.c The polyad number for CO2 is defined as: ν ν ν= + +P 2 31 2 3, where ν ν ν, ,1 2 3 are the vibrational quantum numbers of the symmetric stretching, bending and the
asymmetric stretching, respectively.d Type of band: Stable(‘s’), unstable(‘u’).e Uncertainty interval of the measurement (in %), defined as root-mean square of statistical uncertainty plus systematic uncertainty of the measurement.
E.J. Zak et al. / Journal of Quantitative Spectroscopy & Radiative Transfer ∎ (∎∎∎∎) ∎∎∎–∎∎∎8
2.1. Nuclear motion calculations
The strategy for solving the nuclear-motion problem employedhere is analogous to the one presented in [1] and [2]. In a nutshell,the Born-Oppenheimer approximation imposes mass-in-dependence of the PES and DMS. With this assumption thequantum calculations for ro-vibrational energy levels, wavefunc-tions and transition intensities have been carried out with theDVR3D suite [30] for each isotopologue separately. However theloss of symmetry in the system meant that some (re-)evaluation ofthe accuracy of our variational calculations were required.
All calculations were performed in Radau coordinates and a body-fixed coordinate system with the z-axis pointing along one of the C–O bonds. Due to broken permutation symmetry of identical atoms,the full ro-vibrational Hamiltonian cannot be block-factorized, as wasthe case for the symmetric isotopologues. This entails substantiallymore computational resources to obtain a good level of convergence.A two step procedure [31–33] of solving the nuclear Schrödingerequation is applied here. The first step involves solving the Coriolis-decoupled ro-vibrational motion problem for every combination ofthe ( | |)J k, quantum numbers separately, to supply a basis for thesecond step, where the full ro-vibrational Hamiltonian is considered.Matrix elements of the Hamiltonian are represented on a previouslyoptimized DVR grid, associated with 30-point Gauss-Laguerre and120-point Gauss-Legendre quadratures, for stretching and bendingmotion respectively. Diagonalisation of this matrix leads to ro-vi-brational energy levels and wavefunctions labelled by the J-rotationalquantum number and the e/f –Wang symmetries. As done by Huanget al. [22], nuclear masses in Dalton units (Da) for isotopes of carbonand oxygen were used: 11.996709 Da (12C), 13.000439 Da (13C),15.990525 Da (16O), 16.995245 Da (17O) and 17.995275 Da (18O) [34].
A number of tests of basis sets and Hamiltonian sizes were per-formed to ensure convergence and stability of the calculations.However, these showed that the parameters tested and used for ourstudy on 12C16O2 (626) [1] gave good results; these parameters wereadopted except that the loss of symmetry means that size of the finalHamiltonian in the first variational step (program DVR) needs to be
Please cite this article as: Zak EJ, et al. Room temperature linelisintensities. J Quant Spectrosc Radiat Transfer (2017), http://dx.doi.or
doubled (MAX3D¼2000). Difficulties in the basis set optimisationresulting from the asymmetry in the system led to convergenceproblems for >J 100. Further extension of the size of the ro-vibra-tional Hamiltonian causes high J jobs to exceed our computer systemwall-clock limit of 72 hours. Nevertheless, line intensities for >J 100computed in our ‘AA’ line list remain in a very good agreement withthe values provided by Ames. Therefore the ro-vibrational part of thecomputation (program ROTLEV3b) for all J's adopted following ro-vibrational basis size: × ( + )J500 1 for = −J 0 50, × ( + )J400 1 for
= −J 51 99 and × ( + )J300 1 for >J 99. Integral transition intensitywas evaluated with appropriate spin statistical weights (cf. Table 1),partition functions computed at 296 K with energy levels fromAmes-1 PES and natural abundances taken from the HITRAN2012database. Intensity cut-off was then set to 10�30 cm/molecule.
2.2. Line positions
The nuclear motion calculations described in the preceding sectiongive together with the line intensities the values of the energy levelsand consequently the values of the line positions. The line positionscalculated with the semi-empirical PES were used to generate UCLline list. But as we have already mentioned in the Introduction, thevariational line positions are accurate to 0.03–0.2 cm�1. The effectiveHamiltonian models provide the line positions at least one order ofmagnitude more accurately [28]. The effective Hamiltonian modelsfor the carbon dioxide isotopologues used to generate CDSD-296 [28]are based on the perturbation theory and take into account in theexplicit way all vibration-rotation resonance interactions (up to sixth-order perturbation theory) arising due to the approximate relationsbetween harmonic frequencies: ω ω≈ 21 2 and ω ω≈ 33 2. These rela-tions lead to a polyad structure of the vibrational energy levels. Eachpolyad could be labelled with the polyad pseudo quantum number
ν ν ν= + +P 2 31 2 3, where ν ν ν, ,1 2 3 are harmonic oscillators quantumnumbers. The parameters of the effective Hamiltonians for each iso-topologue were fitted to the observed line positions collected fromthe literature (see Ref. [28] and references therein). The fitted sets ofthe effective Hamiltonian parameters reproduce the observed line
ts for CO2 asymmetric isotopologues with ab initio computedg/10.1016/j.jqsrt.2017.01.037i

E.J. Zak et al. / Journal of Quantitative Spectroscopy & Radiative Transfer ∎ (∎∎∎∎) ∎∎∎–∎∎∎ 9
positions with residuals which are close to the experimental un-certainties (the weighted dimensionless standard deviation variesbetween 1 and 2 depending on an isotopologue). The very good ex-trapolation abilities of these effective Hamiltonians have been de-monstrated many times (see, for example, Refs. [9–11,13–16,24–26])except for a few cases of the interpolyad resonance anharmonic in-teractions. These interactions, due to symmetry constraints, can takeplace only in the asymmetric isotopologues. In the recommendedUCL-IAO line list, described below, the variational line positions aresubstituted by EH line positions and in a few cases when the lines areaffected by the interpolyad resonance interactions the variational line
Fig. 3. Comparison of Ames and UCL line lists with the CDSD-296 database for six isotoAmes intensities from CDSD intensity, respectively. Symmetric relative deviation (see Eqnatural abundance. (For interpretation of the references to color in this figure legend, t
Please cite this article as: Zak EJ, et al. Room temperature linelisintensities. J Quant Spectrosc Radiat Transfer (2017), http://dx.doi.or
positions are substituted by the experimental data if such data exist.In the absence of the experimental data the variational line positionsare substituted by EH line positions.
3. Results and discussion
3.1. Summary of all CO2 line lists
Table 1 summarizes line lists computed by us for all 13 iso-topologues of CO2 from this work and our previous studies [1,2].
pologues of CO2. Red and blue points denote relative percent deviation of UCL and. (1)) is plotted against line intensity (in cm/molecule) from CDSD-296 scaled by thehe reader is referred to the web version of this article.)
ts for CO2 asymmetric isotopologues with ab initio computedg/10.1016/j.jqsrt.2017.01.037i
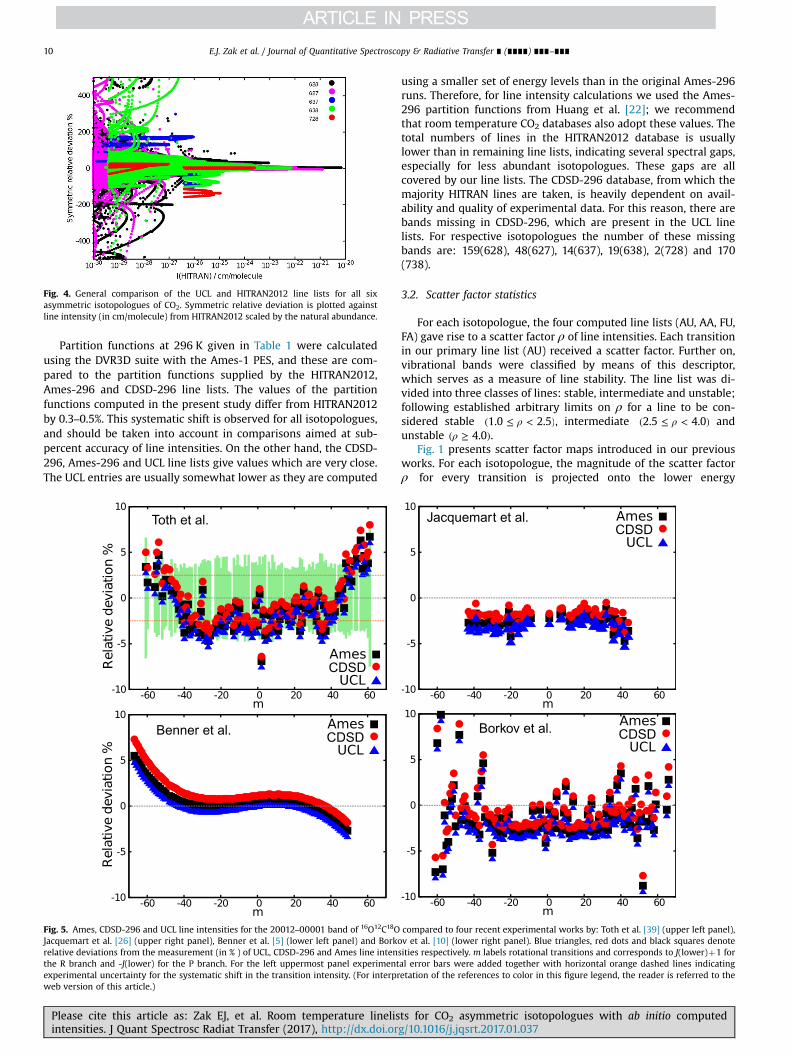
Fig. 4. General comparison of the UCL and HITRAN2012 line lists for all sixasymmetric isotopologues of CO2. Symmetric relative deviation is plotted againstline intensity (in cm/molecule) from HITRAN2012 scaled by the natural abundance.
E.J. Zak et al. / Journal of Quantitative Spectroscopy & Radiative Transfer ∎ (∎∎∎∎) ∎∎∎–∎∎∎10
Partition functions at 296 K given in Table 1 were calculatedusing the DVR3D suite with the Ames-1 PES, and these are com-pared to the partition functions supplied by the HITRAN2012,Ames-296 and CDSD-296 line lists. The values of the partitionfunctions computed in the present study differ from HITRAN2012by 0.3–0.5%. This systematic shift is observed for all isotopologues,and should be taken into account in comparisons aimed at sub-percent accuracy of line intensities. On the other hand, the CDSD-296, Ames-296 and UCL line lists give values which are very close.The UCL entries are usually somewhat lower as they are computed
Fig. 5. Ames, CDSD-296 and UCL line intensities for the 20012–00001 band of 16O12C18OJacquemart et al. [26] (upper right panel), Benner et al. [5] (lower left panel) and Borkorelative deviations from the measurement (in % ) of UCL, CDSD-296 and Ames line intenthe R branch and -J(lower) for the P branch. For the left uppermost panel experimentexperimental uncertainty for the systematic shift in the transition intensity. (For interprweb version of this article.)
Please cite this article as: Zak EJ, et al. Room temperature linelisintensities. J Quant Spectrosc Radiat Transfer (2017), http://dx.doi.or
using a smaller set of energy levels than in the original Ames-296runs. Therefore, for line intensity calculations we used the Ames-296 partition functions from Huang et al. [22]; we recommendthat room temperature CO2 databases also adopt these values. Thetotal numbers of lines in the HITRAN2012 database is usuallylower than in remaining line lists, indicating several spectral gaps,especially for less abundant isotopologues. These gaps are allcovered by our line lists. The CDSD-296 database, from which themajority HITRAN lines are taken, is heavily dependent on avail-ability and quality of experimental data. For this reason, there arebands missing in CDSD-296, which are present in the UCL linelists. For respective isotopologues the number of these missingbands are: 159(628), 48(627), 14(637), 19(638), 2(728) and 170(738).
3.2. Scatter factor statistics
For each isotopologue, the four computed line lists (AU, AA, FU,FA) gave rise to a scatter factor ρ of line intensities. Each transitionin our primary line list (AU) received a scatter factor. Further on,vibrational bands were classified by means of this descriptor,which serves as a measure of line stability. The line list was di-vided into three classes of lines: stable, intermediate and unstable;following established arbitrary limits on ρ for a line to be con-sidered stable ρ( ≤ < )1.0 2.5 , intermediate ρ( ≤ < )2.5 4.0 andunstable ρ( ≥ )4.0 .
Fig. 1 presents scatter factor maps introduced in our previousworks. For each isotopologue, the magnitude of the scatter factorρ for every transition is projected onto the lower energy
compared to four recent experimental works by: Toth et al. [39] (upper left panel),v et al. [10] (lower right panel). Blue triangles, red dots and black squares denotesities respectively. m labels rotational transitions and corresponds to J(lower)þ1 foral error bars were added together with horizontal orange dashed lines indicatingetation of the references to color in this figure legend, the reader is referred to the
ts for CO2 asymmetric isotopologues with ab initio computedg/10.1016/j.jqsrt.2017.01.037i
E.J. Zak et al. / Journal of Quantitative Spectroscopy & Radiative Transfer ∎ (∎∎∎∎) ∎∎∎–∎∎∎ 11
level – upper energy level plane. Color coding represents the valueof the scatter factor, hence informs about the stability of a parti-cular line. Few examples of unstable bands are marked with ar-rows in Fig. 1. Elevated values of the scatter factor correlatesstrongly with the presence of an interaction with an energeticallyproximate state. Thus, the stability analysis presented here may beutilized in extracting pairs of states, the potential candidates beinginvolved in a mutual Coriolis or anharmonic interaction. In-tensities of bands containing such states are likely to be far fromexperimental values, therefore we consider such bands as unreli-able from the point of view of our calculations. The final re-commended line lists (see Section 3.5) include line intensities forunstable bands borrowed from the empirically tuned effectivedipole moment calculations or directly from measurement. Fig. 1shows that the number of intermediate and unstable lines growsas the energy of the upper state increases. This fact is explained bythe growth of the number of the energy level crossings and bydeficiencies of the ‘Fitted’ PES, which slowly diverges from theAmes-1 PES with ;increasing energy, thus gives a poorer re-presentation of the ro-vibrational wavefunction for high energylevels. This causes elevated values of the scatter factor, as seen inthe scatter factor maps. At the same time new instability regionsbecome visible with growing total number of transitions, i.e moreabundant isotopologues have more unstable lines. For instance,the line list for the least abundant 738 isotopologue, contains nounstable lines. For 738 only very strong bands enter the line listsubject to the 10�30 cm/molecule intensity cut-off. Strong lines areless prone to significant (percentage-wise) intensity stealing,
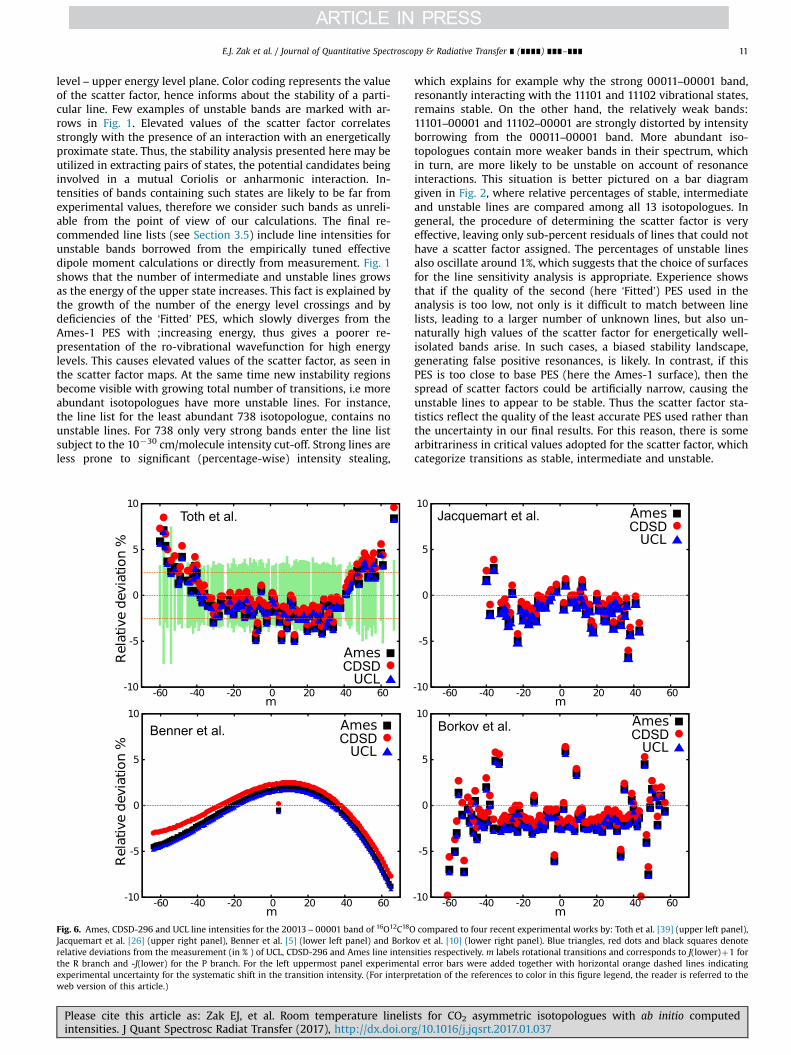
Fig. 6. Ames, CDSD-296 and UCL line intensities for the 20013 – 00001 band of 16O12C18OJacquemart et al. [26] (upper right panel), Benner et al. [5] (lower left panel) and Borkorelative deviations from the measurement (in % ) of UCL, CDSD-296 and Ames line intensthe R branch and -J(lower) for the P branch. For the left uppermost panel experimentexperimental uncertainty for the systematic shift in the transition intensity. (For interprweb version of this article.)
Please cite this article as: Zak EJ, et al. Room temperature linelisintensities. J Quant Spectrosc Radiat Transfer (2017), http://dx.doi.or
which explains for example why the strong 00011–00001 band,resonantly interacting with the 11101 and 11102 vibrational states,remains stable. On the other hand, the relatively weak bands:11101–00001 and 11102–00001 are strongly distorted by intensityborrowing from the 00011–00001 band. More abundant iso-topologues contain more weaker bands in their spectrum, whichin turn, are more likely to be unstable on account of resonanceinteractions. This situation is better pictured on a bar diagramgiven in Fig. 2, where relative percentages of stable, intermediateand unstable lines are compared among all 13 isotopologues. Ingeneral, the procedure of determining the scatter factor is veryeffective, leaving only sub-percent residuals of lines that could nothave a scatter factor assigned. The percentages of unstable linesalso oscillate around 1%, which suggests that the choice of surfacesfor the line sensitivity analysis is appropriate. Experience showsthat if the quality of the second (here ‘Fitted’) PES used in theanalysis is too low, not only is it difficult to match between linelists, leading to a larger number of unknown lines, but also un-naturally high values of the scatter factor for energetically well-isolated bands arise. In such cases, a biased stability landscape,generating false positive resonances, is likely. In contrast, if thisPES is too close to base PES (here the Ames-1 surface), then thespread of scatter factors could be artificially narrow, causing theunstable lines to appear to be stable. Thus the scatter factor sta-tistics reflect the quality of the least accurate PES used rather thanthe uncertainty in our final results. For this reason, there is somearbitrariness in critical values adopted for the scatter factor, whichcategorize transitions as stable, intermediate and unstable.
compared to four recent experimental works by: Toth et al. [39] (upper left panel),v et al. [10] (lower right panel). Blue triangles, red dots and black squares denoteities respectively. m labels rotational transitions and corresponds to J(lower)þ1 foral error bars were added together with horizontal orange dashed lines indicatingetation of the references to color in this figure legend, the reader is referred to the
ts for CO2 asymmetric isotopologues with ab initio computedg/10.1016/j.jqsrt.2017.01.037i

Fig. 7. Ames, CDSD-296 and UCL line intensities for the 30013–00001 band of16O12C18O compared to three recent experimental works by: Toth et al. [39] (up-permost panel), Devi et al. [4] (middle panel) and Karlovets et al. [16] (lowestpanel). Blue triangles, red dots and black squares denote relative deviations fromthe measurement (in % ) of UCL, CDSD-296 and Ames line intensities respectively.m labels rotational transitions and corresponds to J(lower)þ1 for the R branch and-J(lower) for the P branch. For the uppermost panel experimental error bars wereadded together with horizontal orange dashed lines indicating experimental un-certainty for the systematic shift in the transition intensity. (For interpretation ofthe references to color in this figure legend, the reader is referred to the webversion of this article.)
E.J. Zak et al. / Journal of Quantitative Spectroscopy & Radiative Transfer ∎ (∎∎∎∎) ∎∎∎–∎∎∎12
3.3. Resonances
A method of detecting lines perturbed by resonance interac-tions discussed in the previous sections was introduced in ourprevious works [1,2,29]. Table 2 gathers information about vibra-tional bands perturbed by a resonance interaction with other vi-brational state.
Effective reproduction of experimental line intensities for ‘re-sonance bands’ is a challenge for variational calculations. Transi-tion dipole moment being then very sensitive to small inaccuraciesof the ro-vibrational wavefunction, requires almost perfect re-production of the PES in this region, which is currently beyondreach of the variational methodology.
3.3.1. Band statistics vs. experimentTable 3 compares measured band intensities to the calculated
values from the Ames-1, UCL and CDSD-296 line lists. In general,the dipole moment surfaces of Ames and UCL appear to be of si-milar quality, generating band intensities that differ by few per-cent. A more detailed analysis reveals that both line lists followsimilar intensity trends within a single band as well as betweenbands. The small discrepancies between Ames-1 and UCL howeverdeserve further investigation at single line resolution followed bybenchmarking against other studies. This is done in Section 3.4.For less abundant isotopologues, such as 638 and 728, deviationsof theoretical line intensities from experimental values often ex-ceed stated uncertainty of measurements [10,11,15,26], whichsuggests inaccuracies in retrieval procedure or in isotopic abun-dances in measured samples. Band intensities given by the CDSD-296 database match more closely the experimentally determinedvalues than the remaining two line lists. The effective dipolemoment calculations, on which the CDSD-296 database relies, aresupplied with experimental entries, some of which have beentaken from the references listed in Table 3. For this reason, CDSD-296 generates smaller overall deviations from experiment. Un-fortunately, none of these measurements provide sub-percentuncertainty budget for intensities. This means one can concludeonly approximately on the mutual relation between the experi-ments and theoretical studies (most of the measurements give 5–20% uncertainty for the line intensities). Therefore, a comparisonto a preferably sub-percent accurate study is needed. One suchmeasurement has been performed by Durry et al. [27] on three ro-vibrational lines of 628. This experiment is discussed in the fol-lowing section.
Fig. 3 gives an overview of the relative agreement of the Amesand UCL line lists to CDSD-296.
For strong lines, both Ames and UCL line lists give a goodoverall match to CDSD-296. For weaker lines, intensity dis-crepancies between the line lists and CDSD become more visible,reaching several hundreds percent. Both Ames and UCL line listsfollow similar pattern, which gradually diverges; the Ames line listgives a slightly larger scatter of intensities, especially for weaklines. A few bands for the 637 and 728 isotopologue are system-atically shifted toward large negative deviations in intensity, hencemay demand a closer attention, and perhaps a re-evaluation in thefuture editions of CDSD.
Fig. 4 gives an overview comparison between UCL and HI-TRAN2012 intensities for all six asymmetric isotopologues of CO2.The plots use the symmetric relative deviation, S, defined by
= − ·( )
SII
II
12
100%.1
THEOR
EXP
EXP
THEOR
The characteristic funnel-like shape is followed by the majority oflines. The 728, 637 and 638 isotopologues however, contain fewmoderately strong bands, exhibiting suspiciously high systematic
Please cite this article as: Zak EJ, et al. Room temperature linelisintensities. J Quant Spectrosc Radiat Transfer (2017), http://dx.doi.or
deviations from the UCL line list. For this reason, we believe thatintensities of these CDSD-296 bands cannot be trusted, and requirerefinement by additional experimental data or a theoretical ap-proach. It should be noted that the majority of lines in HI-TRAN2012 comes from the Effective Hamiltonian calculation alsoenclosed in the CDSD-296 database.
3.4. Comparison to experiment
Experimental knowledge of intensities of the asymmetric iso-topologues of CO2 has been recently significantly improved by
ts for CO2 asymmetric isotopologues with ab initio computedg/10.1016/j.jqsrt.2017.01.037i

E.J. Zak et al. / Journal of Quantitative Spectroscopy & Radiative Transfer ∎ (∎∎∎∎) ∎∎∎–∎∎∎ 13
measurements on isotopically enriched samples. This is particu-larly important for atmospherically relevant bands in the 1.6 μmand 2.04 μm spectral regions. Space missions [49] and ground-based observations dedicated to detection and quantification ofthe total carbon dioxide content in the Earth's atmosphere arebased on simultaneous measurements on these two regions. Thus,due to their practical importance, the 20012–00001, 20013–00001and 30013–00001 bands should be assessed carefully for allabundant isotopololgues, as lines from different species are likelyto interfere. A line-by-line comparison with recent measurementsof these three bands for the 628 isotopolgue is given below.
In Fig. 5, the four panels represent comparisons between Ames,CDSD, UCL line intensities and high-quality experiments by Tothet al. [39], Jacquemart et al. [26], Benner et al. [5] and Borkov et al.[10]. The three studies (Ames, CDSD and UCL) are denoted withblack squares, red dots and blue triangles, respectively. All graphsshow provisional sub-10% agreement between theory and ex-periment. Another common observation for all four panels is thatfor the 20012–00001 band line intensities are ordered as
< <UCL Ames CDSD, and differences between the studies usuallydo not exceed 1%. This suggests similar quality of the line lists forthis band. Toth et al. provides 72% systematic uncertainty andJ-dependent 0.5–7% statistical uncertainty on line intensities(marked with green error bars in the upper left panel of Fig. 5).UCL intensities match the stated experimental error bar, showing2-3% systematic shift for ∈ ( − )m 30, 30 and characteristic, arc-like behavior for higher absolute values of m. Comparisons toJacquemart et al. and Borkov et al. reveal small, 1–4 % systematicshift with respect to all three line lists. A markedly different si-tuation is depicted in the left lower panel, in the study by Benneret al. Here an arc pattern of residual intensity is observed. Similarartifact has been also found in measurements on the main iso-topologue of CO2 by the same authors, and can be attributed toissue connected to the Herman-Wallis factors used in the retrievalprocedure [2].
Analogous conclusions can be drawn from Fig. 6, where theUCl, CDSD and Ames line lists are compared to measurements onthe 20013–00001 band. Note that all three line lists give an aver-age negative systematic shift with respect to the experimentalvalues. Line intensities of the 20012–00001 and 20013–00001bands together with the line intensities of other five bands pub-lished by Toth et al. [39] were used for the determination of theconcentration of the 16O12C18O isotopologue in the sample used byJacquemart et al. [26] and Borkov et al. [10]. This may indicate that
Fig. 8. Experimental line intensities measured by Durry et al. [27] for the P branchof the 20012 – 00001 band of 16O12C18O depicted against respective transition in-tensities taken from Ames, CDSD-296 and UCL line lists. m labels rotational tran-sitions and corresponds to J(lower)þ1 for the R branch and -J(lower) for the Pbranch.
Please cite this article as: Zak EJ, et al. Room temperature linelisintensities. J Quant Spectrosc Radiat Transfer (2017), http://dx.doi.or
the experimental studies underestimate the concentration of the628 isotopologue, causing the intensities of individual lines to besystematically overestimated.
Intensities for the 30013–00001 band of 16O12C18O (called ‘theweak CO2 band’) have been accurately determined in three studies.The uppermost panel in the Fig. 7 compares UCL, CDSD and Amesline intensities for this band to measurements by Toth et al. [39].All three theoretical studies match the experimental error bars.UCL intensities (blue triangles) provide an almost zero systematicshift for this band. The J-dependent scatter of relative deviationsbetween theory and experiment is most likely caused by the sta-tistical fluctuations of the experiment. A very similar picture
Fig. 9. Ames, CDSD-296 and UCL line intensities for the 00011–00001 band of16O12C17O compared to three experimental works by: Jacquemart et al. [26] (up-permost panel), Claveau et al. [47] (middle panel) and Johns et al. [36] (lowestpanel). Blue triangles, red dots and black squares denote relative deviations fromthe measurement (in % ) of UCL, CDSD-296 and Ames line intensities respectively.m labels rotational transitions and corresponds to J(lower)þ1 for the R branch and-J(lower) for the P branch. (For interpretation of the references to color in thisfigure legend, the reader is referred to the web version of this article.)
ts for CO2 asymmetric isotopologues with ab initio computedg/10.1016/j.jqsrt.2017.01.037i
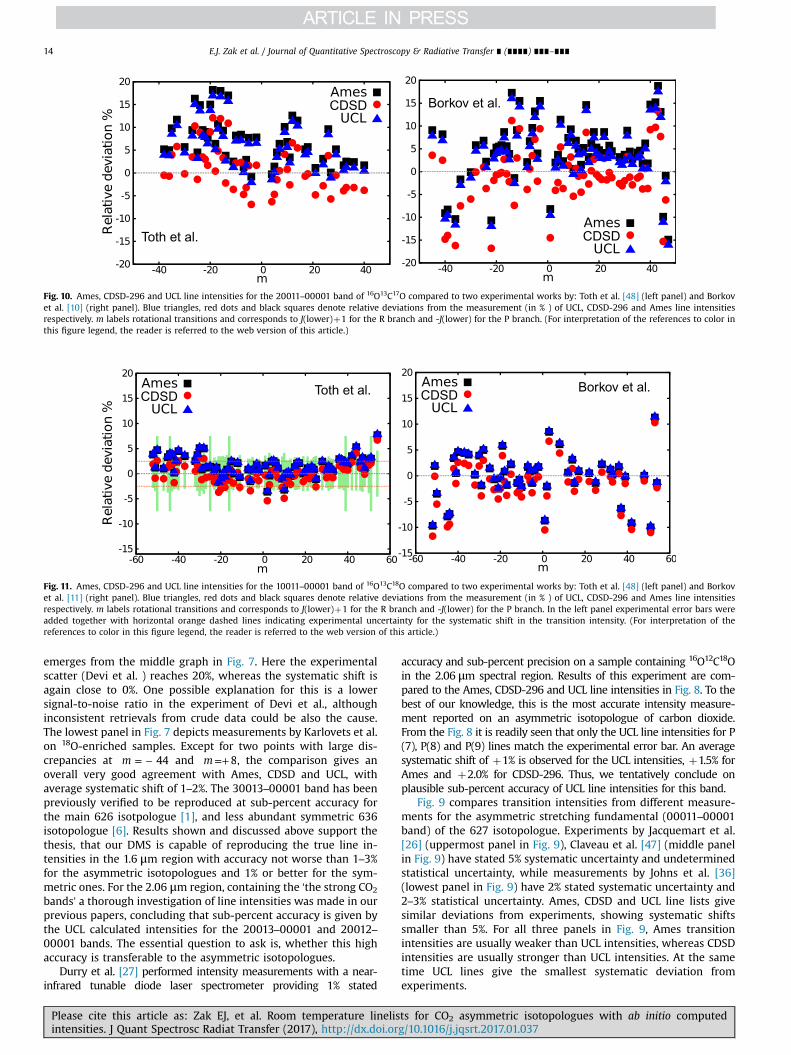
Fig. 10. Ames, CDSD-296 and UCL line intensities for the 20011–00001 band of 16O13C17O compared to two experimental works by: Toth et al. [48] (left panel) and Borkovet al. [10] (right panel). Blue triangles, red dots and black squares denote relative deviations from the measurement (in % ) of UCL, CDSD-296 and Ames line intensitiesrespectively. m labels rotational transitions and corresponds to J(lower)þ1 for the R branch and -J(lower) for the P branch. (For interpretation of the references to color inthis figure legend, the reader is referred to the web version of this article.)
Fig. 11. Ames, CDSD-296 and UCL line intensities for the 10011–00001 band of 16O13C18O compared to two experimental works by: Toth et al. [48] (left panel) and Borkovet al. [11] (right panel). Blue triangles, red dots and black squares denote relative deviations from the measurement (in % ) of UCL, CDSD-296 and Ames line intensitiesrespectively. m labels rotational transitions and corresponds to J(lower)þ1 for the R branch and -J(lower) for the P branch. In the left panel experimental error bars wereadded together with horizontal orange dashed lines indicating experimental uncertainty for the systematic shift in the transition intensity. (For interpretation of thereferences to color in this figure legend, the reader is referred to the web version of this article.)
E.J. Zak et al. / Journal of Quantitative Spectroscopy & Radiative Transfer ∎ (∎∎∎∎) ∎∎∎–∎∎∎14
emerges from the middle graph in Fig. 7. Here the experimentalscatter (Devi et al. ) reaches 20%, whereas the systematic shift isagain close to 0%. One possible explanation for this is a lowersignal-to-noise ratio in the experiment of Devi et al., althoughinconsistent retrievals from crude data could be also the cause.The lowest panel in Fig. 7 depicts measurements by Karlovets et al.on 18O-enriched samples. Except for two points with large dis-crepancies at = −m 44 and =+m 8, the comparison gives anoverall very good agreement with Ames, CDSD and UCL, withaverage systematic shift of 1–2%. The 30013–00001 band has beenpreviously verified to be reproduced at sub-percent accuracy forthe main 626 isotpologue [1], and less abundant symmetric 636isotopologue [6]. Results shown and discussed above support thethesis, that our DMS is capable of reproducing the true line in-tensities in the 1.6 μm region with accuracy not worse than 1–3%for the asymmetric isotopologues and 1% or better for the sym-metric ones. For the 2.06 μm region, containing the ‘the strong CO2
bands’ a thorough investigation of line intensities was made in ourprevious papers, concluding that sub-percent accuracy is given bythe UCL calculated intensities for the 20013–00001 and 20012–00001 bands. The essential question to ask is, whether this highaccuracy is transferable to the asymmetric isotopologues.
Durry et al. [27] performed intensity measurements with a near-infrared tunable diode laser spectrometer providing 1% stated
Please cite this article as: Zak EJ, et al. Room temperature linelisintensities. J Quant Spectrosc Radiat Transfer (2017), http://dx.doi.or
accuracy and sub-percent precision on a sample containing 16O12C18Oin the 2.06 μm spectral region. Results of this experiment are com-pared to the Ames, CDSD-296 and UCL line intensities in Fig. 8. To thebest of our knowledge, this is the most accurate intensity measure-ment reported on an asymmetric isotopologue of carbon dioxide.From the Fig. 8 it is readily seen that only the UCL line intensities for P(7), P(8) and P(9) lines match the experimental error bar. An averagesystematic shift of þ1% is observed for the UCL intensities, þ1.5% forAmes and þ2.0% for CDSD-296. Thus, we tentatively conclude onplausible sub-percent accuracy of UCL line intensities for this band.
Fig. 9 compares transition intensities from different measure-ments for the asymmetric stretching fundamental (00011–00001band) of the 627 isotopologue. Experiments by Jacquemart et al.[26] (uppermost panel in Fig. 9), Claveau et al. [47] (middle panelin Fig. 9) have stated 5% systematic uncertainty and undeterminedstatistical uncertainty, while measurements by Johns et al. [36](lowest panel in Fig. 9) have 2% stated systematic uncertainty and2–3% statistical uncertainty. Ames, CDSD and UCL line lists givesimilar deviations from experiments, showing systematic shiftssmaller than 5%. For all three panels in Fig. 9, Ames transitionintensities are usually weaker than UCL intensities, whereas CDSDintensities are usually stronger than UCL intensities. At the sametime UCL lines give the smallest systematic deviation fromexperiments.
ts for CO2 asymmetric isotopologues with ab initio computedg/10.1016/j.jqsrt.2017.01.037i
E.J. Zak et al. / Journal of Quantitative Spectroscopy & Radiative Transfer ∎ (∎∎∎∎) ∎∎∎–∎∎∎ 15
Fig. 10 displays comparison between two experimental studiesby Toth et al. [48] (left panel) and Borkov et al. [10] (right panel)respectively, and three line lists: Ames, CDSD and UCL. The formerexperiment has stated 2.5% systematic uncertainty and 10% sta-tistical uncertainty, while the latter experiment has 4% systematicuncertainty and 0.5–7% statistical uncertainty. The agreement be-tween measurements and line lists reflects the relatively highuncertainties, showing similar statistical scatter for all three linelists, but essentially smaller systematic deviation for the CDSD linelist, which was constructed by fitting to measurements by Tothet al. Systematic deviation from experiment is again very similar(around 1%) for UCL and Ames intensities. Also, CDSD, Ames andUCL follow the same pattern, indicating that the statistical scattervisible in Fig. 10 is of experimental origin.
In Fig. 11, which compares Ames, CDSD and UCL line lists toexperiments by Toth et al. [48] (left panel) and Borkov et al. [11](right panel), large deviations of Ames and UCL from measuredline intensities are visible for several lines of the P branch of the10011–00001 band in 16O13C18O. The Ames and UCL line listsprovide similar values of transition intensities for these lines(agreement within 2%), whereas CDSD intensities do not exhibitany unusual deviation. This observation can be rationalized by thefact that effective operators used to construct the CDSD databasewere parametrized by experimental intensities from Ref. [48]. The
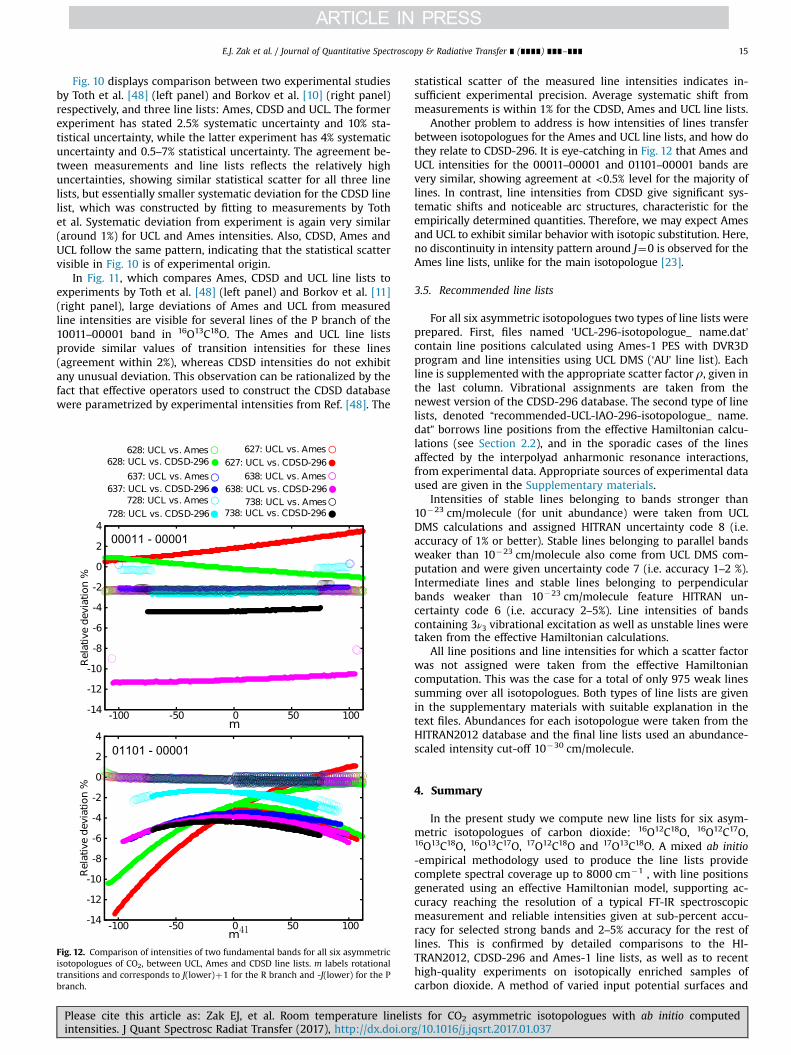
Fig. 12. Comparison of intensities of two fundamental bands for all six asymmetricisotopologues of CO2, between UCL, Ames and CDSD line lists. m labels rotationaltransitions and corresponds to J(lower)þ1 for the R branch and -J(lower) for the Pbranch.
Please cite this article as: Zak EJ, et al. Room temperature linelisintensities. J Quant Spectrosc Radiat Transfer (2017), http://dx.doi.or
statistical scatter of the measured line intensities indicates in-sufficient experimental precision. Average systematic shift frommeasurements is within 1% for the CDSD, Ames and UCL line lists.
Another problem to address is how intensities of lines transferbetween isotopologues for the Ames and UCL line lists, and how dothey relate to CDSD-296. It is eye-catching in Fig. 12 that Ames andUCL intensities for the 00011–00001 and 01101–00001 bands arevery similar, showing agreement at <0.5% level for the majority oflines. In contrast, line intensities from CDSD give significant sys-tematic shifts and noticeable arc structures, characteristic for theempirically determined quantities. Therefore, we may expect Amesand UCL to exhibit similar behavior with isotopic substitution. Here,no discontinuity in intensity pattern around J¼0 is observed for theAmes line lists, unlike for the main isotopologue [23].
3.5. Recommended line lists
For all six asymmetric isotopologues two types of line lists wereprepared. First, files named ‘UCL-296-isotopologue_ name.dat’contain line positions calculated using Ames-1 PES with DVR3Dprogram and line intensities using UCL DMS (‘AU’ line list). Eachline is supplemented with the appropriate scatter factor ρ, given inthe last column. Vibrational assignments are taken from thenewest version of the CDSD-296 database. The second type of linelists, denoted “recommended-UCL-IAO-296-isotopologue_ name.dat” borrows line positions from the effective Hamiltonian calcu-lations (see Section 2.2), and in the sporadic cases of the linesaffected by the interpolyad anharmonic resonance interactions,from experimental data. Appropriate sources of experimental dataused are given in the Supplementary materials.
Intensities of stable lines belonging to bands stronger than10�23 cm/molecule (for unit abundance) were taken from UCLDMS calculations and assigned HITRAN uncertainty code 8 (i.e.accuracy of 1% or better). Stable lines belonging to parallel bandsweaker than 10�23 cm/molecule also come from UCL DMS com-putation and were given uncertainty code 7 (i.e. accuracy 1–2 %).Intermediate lines and stable lines belonging to perpendicularbands weaker than 10�23 cm/molecule feature HITRAN un-certainty code 6 (i.e. accuracy 2–5%). Line intensities of bandscontaining ν3 3 vibrational excitation as well as unstable lines weretaken from the effective Hamiltonian calculations.
All line positions and line intensities for which a scatter factorwas not assigned were taken from the effective Hamiltoniancomputation. This was the case for a total of only 975 weak linessumming over all isotopologues. Both types of line lists are givenin the supplementary materials with suitable explanation in thetext files. Abundances for each isotopologue were taken from theHITRAN2012 database and the final line lists used an abundance-scaled intensity cut-off 10�30 cm/molecule.
4. Summary
In the present study we compute new line lists for six asym-metric isotopologues of carbon dioxide: 16O12C18O, 16O12C17O,16O13C18O, 16O13C17O, 17O12C18O and 17O13C18O. A mixed ab initio-empirical methodology used to produce the line lists providecomplete spectral coverage up to 8000 cm�1 , with line positionsgenerated using an effective Hamiltonian model, supporting ac-curacy reaching the resolution of a typical FT-IR spectroscopicmeasurement and reliable intensities given at sub-percent accu-racy for selected strong bands and 2–5% accuracy for the rest oflines. This is confirmed by detailed comparisons to the HI-TRAN2012, CDSD-296 and Ames-1 line lists, as well as to recenthigh-quality experiments on isotopically enriched samples ofcarbon dioxide. A method of varied input potential surfaces and
ts for CO2 asymmetric isotopologues with ab initio computedg/10.1016/j.jqsrt.2017.01.037i
E.J. Zak et al. / Journal of Quantitative Spectroscopy & Radiative Transfer ∎ (∎∎∎∎) ∎∎∎–∎∎∎16
dipole moment surfaces is presented here as a useful tool in thesearch of energy levels perturbed by vibration-rotation resonanceinteractions including interpolyad-type resonances. This sensitiv-ity analysis of the line intensities validates the majority of com-puted line intensities as reliable, which means that nearly all en-tries in our line lists can be given an uncertainty based on purelytheoretical considerations. We hope that the methodology pre-sented and evaluated here will be of use in theoretical approachesto other molecules. Line lists reported in the present paper, to-gether with line profile parameters from other works [50], arerecommended for use in remote sensing studies and inclusions indatabases. This paper completes our analysis of the transition in-tensities of all 12 stable isotopologues of CO2 plus the radioactive14C16O2 isotopologue up to 8000 cm�1 [1,2]. It would be clearlyuseful to extend this work to higher wavenumbers but that re-quires further work on the DMS to ensure appropriate accuracy ofthese shorter wavelength transitions.
Acknowledgments
This work is supported by the UK Natural Environment Re-search Council (NERC) through Grant NE/J010316, the ERC underthe Advanced Investigator Project 267219 and the Russian Fund forFundamental Science. The authors acknowledge the use of the UCLLegion High Performance Computing Facility (Legion@UCL), andassociated support services, in the completion of this work.
Appendix A. Supplementary data
Supplementary data associated with this article can be found inthe online version at http://dx.doi.org/10.1016/j.jqsrt.2017.01.037.
References
[1] Zak E, Tennyson J, Polyansky OL, Lodi L, Tashkun SA, Perevalov VI. A roomtemperature CO2 line list with ab initio computed intensities. J Quant SpectroscRadiat Transf 2016;177:31–42. http://dx.doi.org/10.1016/j.jqsrt.2015.12.022.
[2] Zak EJ, Tennyson J, Polyansky OL, Lodi L, Tashkun SA, Perevalov VI. Roomtemperature line lists for CO2 symmetric isotopologues with ab initio computedintensities. J Quant Spectrosc Radiat Transf 2017;189:267–280. http://dx.doi.org/10.1016/j.jqsrt.2016.11.022.
[3] Polyansky OL, Bielska K, Ghysels M, Lodi L, Zobov NF, Hodges JT, et al. Highaccuracy CO2 line intensities determined from theory and experiment. Phys RevLett 2015;114:243001. http://dx.doi.org/10.1103/PhysRevLett.114.243001.
[4] Devi VM, Benner DC, Sung K, Brown LR, Crawford TJ, Miller CE, et al. Lineparameters including temperature dependences of self- and air-broadened lineshapes of 12C 16O2: 1.6-μm region. J Quant Spectrosc Radiat Transf2016;177:117–144. http://dx.doi.org/10.1016/j.jqsrt.2015.12.020.
[5] Benner DC, Devi VM, Sung K, Brown LR, Miller CE, Payne VH, et al. Lineparameters including temperature dependences of air- and self-broadened lineshapes of 12C16O2:2.06-μm region. J Mol Spectrosc 2016;326:21–47. http://dx.doi.org/10.1016/j.jms.2016.02.012.
[6] Kiseleva M, Mandon J, Persijn S, Petersen J, Nielsen L, Harren FJM. Tractable linestrength measurements of methane and carbon dioxide in the near infraredwavelength region at 1.65 μm using cavity ring down spectroscopy. In: Pro-ceedings of the 13th ASA-HITRAN conference. Reims; 2016. p. P1–6.
[7] Brunzendorf J, Werwein V, Serduykov A, Werhahn O, Ebert V. CO2 line strengthmeasurements in the 20012–00001 band near 2 μm. In: The 24th colloquiumon high resolution molecular spectroscopy; 2015. p. O17.
[8] Shved GM. On the abundances of carbon dioxide isotopologues in the atmo-spheres of mars and earth. Sol Syst Res 2016;50:161–164. http://dx.doi.org/10.1134/S0038094616020064.
[9] Jacquemart D, Borkov Y, Lyulin OM, Tashkun SA, Perevalov VI. Fourier transformspectroscopy of CO2 isotopologues at 1.6 μm: line positions and intensities. JQuant Spectrosc Radiat Transf 2015;160:1–9. http://dx.doi.org/10.1016/j.jqsrt.2015.03.016.
[10] Borkov YG, Jacquemart D, Lyulin OM, Tashkun SA, Perevalov VI. Infraredspectroscopy of 17O- and 18O-enriched carbon dioxide: line positions and in-tensities in the 4681–5337 cm�1 region. J Quant Spectrosc Radiat Transf2015;159:1–10. http://dx.doi.org/10.1016/j.jqsrt.2015.02.019.
[11] Borkov YG, Jacquemart D, Lyulin OM, Tashkun SA, Perevalov VI. Infrared
Please cite this article as: Zak EJ, et al. Room temperature linelisintensities. J Quant Spectrosc Radiat Transfer (2017), http://dx.doi.or
spectroscopy of 17O- and 18O-enriched carbon dioxide: line positions and in-tensities in the 3200–4700 cm�1 region. Global modeling of the line positionsof 16O12C17O2 and 17O12C17O. J Quant Spectrosc Radiat Transf 2014;137:57–76.http://dx.doi.org/10.1016/j.jqsrt.2013.11.008.
[12] Jacquemart D. Private communication; 2014.[13] Karlovets EV, Kassi S, Tashkun SA, Perevalov VI, Campargue A. High sensitivity
cavity ring down spectroscopy of carbon dioxide in the 1.19–1.26 μm region. JQuant Spectrosc Radiat Transf 2014;144:137–153. http://dx.doi.org/10.1016/j.jqsrt.2014.04.001.
[14] Karlovets EV, Campargue A, Mondelain D, Béguier S, Kassi S, Tashkun SA, et al.High sensitivity cavity ring down spectroscopy of 18O enriched carbon dioxidebetween 5850 and 7000 cm�1: I. Analysis and theoretical modeling of the16o12c18 spectrum. J Quant Spectrosc Radiat Transf 2013;130:116–133. http://dx.doi.org/10.1016/j.jqsrt.2013.05.019.
[15] Karlovets EV, Campargue A, Mondelain D, Kassi S, Tashkun SA, Perevalov VI.High sensitivity Cavity Ring Down spectroscopy of 18O enriched carbon di-oxide between 5850 and 7000 cm�1: Part III Analysis and theoretical mod-eling of the 12C17O2, 16O12C17O, 17O12C18O, 16O13C17O and 17O13C18O spectra. JQuant Spectrosc Radiat Transf 2014;136:89–107. http://dx.doi.org/10.1016/j.jqsrt.2013.11.006.
[16] Karlovets E, Campargue A, Mondelain D, Kassi S, Tashkun S, Perevalov V. Highsensitivity Cavity Ring Down spectroscopy of 18O enriched carbon dioxidebetween 5850 and 7000 cm�1: Part III Analysis and theoretical modeling ofthe 12C18O2, 13C18O2 and 16O13C18O spectra. J Quant Spectrosc Radiat Transf2014;136:71–88. http://dx.doi.org/10.1016/j.jqsrt.2013.11.005.
[17] Kassi S, Karlovets E, Tashkun S, Perevalov V, Campargue A. Analysis and the-oretical modeling of the 18O enriched carbon dioxide spectrum by CRDS near1.35 μm: (i) 16O12C18O, 16O12C17O, 16O12C16O and 16O13C16O. J Quant SpectroscRadiat Transf 2017;187:414–425. http://dx.doi.org/10.1016/j.jqsrt.2016.09.002.
[18] Rothman LS, Gordon IE, Babikov Y, Barbe A, Benner DC, Bernath PF, et al. TheHITRAN 2012 molecular spectroscopic database. J Quant Spectrosc RadiatTransf 2013;130:4–50. http://dx.doi.org/10.1016/jqsrt.2013.07.002.
[19] Tashkun SA, Perevalov VI, Gamache RR, Lamouroux J. CDSD-296, high re-solution carbon dioxide spectroscopic databank: version for atmospheric ap-plications. J Quant Spectrosc Radiat Transf 2015;152:45–73. http://dx.doi.org/10.1016/j.jqsrt.2014.10.017.
[20] Jacquinet-Husson N, Armante R, Scott NA, Chédin A, Crépeau L, BoutammineC, et al. The 2015 edition of the GEISA spectroscopic database. J Mol Spectrosc2016;327:31–72. http://dx.doi.org/10.1016/j.jms.2016.06.007.
[21] Miller CE, Crisp D, DeCola PL, Olsen SC, Randerson JT, Michalak AM, et al.Precision requirements for space-based X-CO2 data. J Geophys Res 2007;112:D10314. http://dx.doi.org/10.1029/2006JD007659.
[22] Huang X, Schwenke DW, Tashkun SA, Lee TJ. An isotopic-independent highlyaccurate potential energy surface for CO2 isotopologues and an initial 12C16O2
infrared line list. J Chem Phys 2012;136:124311. http://dx.doi.org/10.1063/1.3697540.
[23] Huang X, Gamache RR, Freedman RS, Schwenke DW, Lee TJ. Reliable infraredline lists for 13 CO2 isotopologues up to E¼18,000 cm�1 and 1500 K, with lineshape parameters. J Quant Spectrosc Radiat Transf 2014;147:134–144. http://dx.doi.org/10.1016/j.jqsrt.2014.05.015.
[24] Tan Y, Zhao X-Q, Liu A-W, Hu S-M, Lyulin OM, Tashkun SA, et al. Cavity ring-down spectroscopy of CO2 overtone bands near 830 nm. J Quant SpectroscRadiat Transf 2015;165:22–27. http://dx.doi.org/10.1016/j.jqsrt.2015.06.010.
[25] Vasilchenko S, Konefal M, Mondelain D, Kassi S, Čermák P, Tashkun SA. TheCO2 absorption spectrum in the 2.3 μm transparency window by high sen-sitivity CRDS: (i) rovibrational lines. J Quant Spectrosc Radiat Transf2016;184:233–240. http://dx.doi.org/10.1016/j.jqsrt.2016.07.002.
[26] Jacquemart D, Gueye F, Lyulin OM, Karlovets EV, Baron D, Perevalov VI. In-frared spectroscopy of CO2 isotopologues from 2200 to 7000 cm�1: I—Char-acterizing experimental uncertainties of positions and intensities. J QuantSpectrosc Radiat Transf 2012;113:961–975. http://dx.doi.org/10.1016/j.jqsrt.2012.02.020.
[27] Durry G, Li JS, Vinogradov I, Titov A, Joly L, Cousin J, et al. Near infrared diodelaser spectroscopy of C2H2, H2O, CO2 and their isotopologues and the appli-cation to TDLAS, a tunable diode laser spectrometer for the martian PHOBOS-GRUNT space mission. Appl Phys B 2010;99:339–351. http://dx.doi.org/10.1007/s00340-010-3924-y.
[28] V.I.PerevalovS.A.TashkunCDSD-296 (Carbon Dioxide Spectroscopic Databank): up-dated and enlarged version for atmospheric applications, enlarged version for at-mospheric applications. The 10th HITRAN Database Conference, Harvard-Smith-sonian Center for Astrophysics, 22-24 June 2008, Cambridge, MA, USA, 2008.
[29] Lodi L, Tennyson J. Line lists for H218O and H2
17O based on empirically-ad-justed line positions and ab initio intensities. J Quant Spectrosc Radiat Transf2012;113:850–858.
[30] Tennyson J, Kostin MA, Barletta P, Harris GJ, Polyansky OL, Ramanlal J, et al.DVR3D: a program suite for the calculation of rotation-vibration spectra oftriatomic molecules. Comput Phys Commun 2004;163:85–116.
[31] Tennyson J. TRIATOM, SELECT and ROTLEV – for the calculation of ro-vibra-tional levels of triatomic molecules. Comput Phys Commun 1986;42:257–270.
[32] Sutcliffe BT, Miller S, Tennyson J. An effective computational approach to thecalculation of vibration-rotation spectra of triatomic molecules. Comput PhysCommun 1988;51:73–82.
[33] Sutcliffe BT, Tennyson J. A general treatment of vibration-rotation coordinatesfor triatomic molecules. Intern J Quantum Chem 1991;39:183–196.
[34] Audi G, Wapstra AH. The 1995 update to the atomic mass evaluation. NuclPhys A 1995;595:409–480. http://dx.doi.org/10.1016/0375-9474(95)00445-9.
ts for CO2 asymmetric isotopologues with ab initio computedg/10.1016/j.jqsrt.2017.01.037i
E.J. Zak et al. / Journal of Quantitative Spectroscopy & Radiative Transfer ∎ (∎∎∎∎) ∎∎∎–∎∎∎ 17
[35] Laraia AL, Gamache RR, Lamouroux J, Gordon IE, Rothman LS. Total internalpartition sums to support planetary remote sensing. Icarus 2011;215:391–400.http://dx.doi.org/10.1016/j.icarus.2011.06.004.
[36] Johns JWC. Absolute intensity and pressure broadening measurements of CO2
in the 4.3-μm region. J Mol Spectrosc 1987;125:442–464. http://dx.doi.org/10.1016/0022-2852(87)90109-3.
[37] Johns JWC, Vander Auwera J. Absolute intensities in CO2: the ν2 fundamentalnear 15 μm. J Mol Spectrosc 1990;140:71–102. http://dx.doi.org/10.1016/0022-2852(90)90008-e.
[38] Teffo J-L, Daumont L, Claveau C, Valentin A, Tashkun SA, Perevalov VI. Infraredspectra of the 16O12C17O and 16O12C18O species of carbon dioxide: the region500–1500 cm�1. J Mol Spectrosc 2002;213:145–152. http://dx.doi.org/10.1006/jmsp.2002.8561.
[39] Toth R, Miller C, Brown L, Devi VM, Benner DC. Line positions and strengths of16O12C18O, 18O12C18O and 17O12C18O between 2200 and 7000 cm�1. J MolSpectrosc 2007;243:43–61. http://dx.doi.org/10.1016/j.jms.2007.03.005.
[40] Kshirsagar RJ, Giver LP, Chackerian C, Brown LR. The rovibrational intensitiesof the 2ν3 band of at 4639 cm�1. J Quant Spectrosc Radiat Transf1999;61:695–701. http://dx.doi.org/10.1016/s0022-4073(98)00058-2.
[41] Toth RA. Line positions and strengths of CO2 in the 1200–1430 cm�1 region.Appl Opt 1985;24:261. http://dx.doi.org/10.1364/ao.24.000261.
[42] Teffo J-L, Daumont L, Claveau C, Valentin A, Tashkun S, Perevalov V. Infraredspectra of the and species of carbon dioxide: II. the 1500-3000 cm�1 region. JMol Spectrosc 2003;219:271–281. http://dx.doi.org/10.1016/s0022-2852(03)00057-2.
[43] Rinsland CP, Benner DC. Absolute intensities of spectral lines in carbon dioxidebands near 2050 cm�1. Appl Opt 1984;23:4523. http://dx.doi.org/10.1364/ao.23.004523.
Please cite this article as: Zak EJ, et al. Room temperature linelisintensities. J Quant Spectrosc Radiat Transfer (2017), http://dx.doi.or
[44] Claveau C, Teffo J-L, Hurtmans D, Valentin A, Gamache R. Line positions andabsolute intensities in the laser bands of carbon-12 oxygen-17 isotopic speciesof carbon dioxide. J Mol Spectrosc 1999;193:15–32. http://dx.doi.org/10.1006/jmsp.1998.7704.
[45] Devi VM, Rinsland CP, Benner DC. Absolute intensity measurements of CO2
bands in the 2395–2680-cm�1 region. Appl Opt 1984;23:4067. http://dx.doi.org/10.1364/ao.23.004067.
[46] Rinsland CP, Benner DC, Devi VM. Measurements of absolute line intensities incarbon dioxide bands near 52 μm. Appl Opt 1985;24:1644. http://dx.doi.org/10.1364/ao.24.001644.
[47] Claveau C, Teffo J-L, Hurtmans D, Valentin A. Infrared fundamental and firsthot bands of (OCO) - O12C17O isotopic variants of carbon dioxide. J MolSpectrosc 1998;189:153–195. http://dx.doi.org/10.1006/jmsp.1998.7546.
[48] Toth R, Miller C, Brown L, Devi VM, Benner DC. Line strengths of 16O13C16O,16O13C18, 16O13C17O and 18O13C18O, between 2200 and 6800 cm�1. J MolSpectrosc 2008;251:64–89. http://dx.doi.org/10.1016/j.jms.2008.01.009.
[49] Wunch D, Wennberg PO, Toon GC, Connor BJ, Fisher B, Osterman GB, et al. Amethod for evaluating bias in global measurements of CO2 total columns fromspace. Atmos Chem Phys 2011;11:12317–12337. http://dx.doi.org/10.5194/acp-11-12317-2011.
[50] Lamouroux J, Tran H, Laraia AL, Gamache RR, Rothman LS, Gordon IE, et al.Updated database plus software for line-mixing in CO2 infrared spectra andtheir test using laboratory spectra in the 1.5–2.3 μm region. J Quant SpectroscRadiat Transf 2010;111:2321–2331. http://dx.doi.org/10.1016/j.jqsrt.2010.03.006.
ts for CO2 asymmetric isotopologues with ab initio computedg/10.1016/j.jqsrt.2017.01.037i