journal of sciences disk and box dimensions: selected … and box dimensions: selected case studies...
TRANSCRIPT

International Journal of Science and Technology Volume 1 No. 5, May, 2012
IJST © 2012 – IJST Publications UK. All rights reserved. 234
Disk and Box Dimensions: Selected Case Studies of Fractals
with Ifs Codes
Salau, T. A.O.1, Ajide, O.O.
2
1, 2 Department of Mechanical Engineering,
University of Ibadan, Nigeria
ABSTRACT
Disk and box count methods enjoyed higher popularity among known methods for estimating the fractal dimension of
computable fractals in dimensional Euclidean space for their relative ease of implementation among others. The present study
investigated the suitability of disk and box count methods using Monte Carlo approach for the estimation of fractal dimension
of some selected fractals with IFS.
Six (6) fractals with IFS were identified from literature. Algorithms (coded in FORTRAN) based on Monte Carlo approach
was developed for disk and box count methods. Common factors to all studied fractals are seed value for random number
generation (9876), start coordinates (1,0.5), transient solutions (1000), steady solutions (5000), total number of corresponding
scale of examinations (20) and ten (10) trial times. The FORTRAN programme computes both transient and steady solutions
of fractals with IFS, Estimated dimension and other relevant quantities of this study while graphs were plotted using
Microsoft office Excel 2003.
Programming for the disk overlay is less skill demanding than box overlay as experienced from this study. Estimated
dimensions vary from transient to steady for cases. Dimension variation transient from lower dimension value to higher
steady dimension value except for some cases investigated with box method. Estimated disk dimension was consistently on
the lower side of actual dimension with absolute relative error (%) range of 0.5 to 19.6 for cases. Similarly 66.7 percent of
estimated box dimensions were on the lower side of actual dimension with absolute relative error (%) range of 0.9 to 17.2 for
cases. The average absolute error (%) for disk and box methods was 6.7 and 6.8 respectively. Actual dimension was
sandwiched between estimated disk dimensions and box dimensions in 33.3% for cases.
Preference can be given to use of disk count method for solving fractal dimension problems for its capability to estimate
fractal dimension consistently and the fact that the method is averagely less error prone compared with box method.
Keywords: Fractal, Fractal Dimension, IFS Codes, Monte Carlo
1. INTRODUCTION Fractals are tenuous spatial objects whose geometric
characterization includes irregularity, scale-independence,
and self-similarity (Guoqiang, 2001). Fractal dimension
can be termed as the basic notion for describing structures
that have scaling symmetry. The application of fractals for
dynamics characterization is presently attracting more
researchers interest in almost all disciplines (engineering,
medicine, agriculture, languages e.t.c ).A critical study of
a book by Edward(1996) on invitation to dynamical
systems reinforces the interest in fractal characterisation.
Dimensionality curse and dimensionality reduction are
two key issues that have retained high interest for data
mining, machine learning, multimedia indexing and
clustering (Caetano et al, 2010). The authors presented
fast, scalable algorithms that quickly select the most
important dimensions for a given set of n-dimensional
vectors. The major idea of this research paper is to use the
fractal dimension of a dataset as a good approximation of
its intrinsic dimension and to drop attributes that do not
affect it. The authors applied this method on real and
synthetic datasets where it gave fast and correct results.
Speech signals can be described as being generated by
mechanical system with inherently nonlinear dynamics
(Martinez et al, 2003). The hallmark of Martinez et al
paper was to describe the complexity of speech signal
using the fractal dimension of variety of Spanish voiced
sounds (vowels, nasals) and unvoiced sounds (fricatives).
The authors concluded that the fractals measure expand

International Journal of Science and Technology (IJST) – Volume 1 No. 5, May, 2012
IJST © 2012 – IJST Publications UK. All rights reserved. 235
the distinguishing features in characterizing voiced and
unvoiced sounds that lead to better speech recognition
performances. Jorge (2010) investigated the fractal
dimension of the leaf vascular system of three Relbunium
species. Tree ramification, root and venation systems are
some examples of patterns studied using this geometry
and fractal dimension has quantified and graded the
complexity of these structures. The paper focus on
determination of fractal dimension of the leaf vascular
system in three species of Relbunium. The results of the
study showed that significant differences in the fractal
dimension of three species (1.387 in R.megapotamicium,
1.561 in R.hirtum and 1.763 in R.hypocarpium). This
implies that this type of measurement can be used as a
taxonomic character to differentiate species and to
quantify and grade venation of leaves. According Aura
and Felipe (2005), fractal codification of images is based
on self-similarity and self affine sets. The codification
process consists of construction of an operator which will
represent the image to be encoded. The authors observed
that the major disadvantage of the automatic form of
fractal compression is its encoding time. Most of the time
spent in construction of such operator is on finding the
most suitable parts of the image to be encoded. The paper
showed how a new idea for decreasing the encoding time
can be implemented. A vivid description and quantitative
measurement of irregular fragments or complex shapes of
materials can be done using fractal. Alabi et al (2007) did
a fractal analysis in order to characterize the surface finish
quality of machined work pieces. The results of the study
showed an improvement in the characterization of
machine surfaces using fractal. Bozica has previously
used fractal analysis in the characterization of grinded
ceramics surface textures by surface profile fractal
dimension .In the recent study (Bozica et al, 2009),the
authors did a fractal analysis for biosurface comparison
and behaviour prediction. Skyscrappers method was
employed for calculating fractal dimension of surface
using the image processing toolbox as well as a
customized algorithm of matlab environment. Scanning
probe microscope was used in recording the surface as an
image. The results of the study showed that fractal
dimension values confirm changes of the surface
roughness during cleaning and wearing process. The
authors concluded that examination of real surface
roughness could provide comparison and functional
behaviour prediction. David (1999) employed wavelet
packet transforms to develop an engineering model for
multi-fractal characterization of mutation dynamics in
pathological and non-pathological gene sequences. The
work examines the model’s behaviour in both
pathological (mutations) and non-pathological (healthy)
base pair sequences of the cystic fibrosis gene. The results
of the study suggest that there is scope for more multi-
fractal models to be developed. Hagiwara et al (1999)
research paper is based on the fractal application of the
fractal dimension in the evaluation of cutting ability of
grain edge. The authors observed earlier that grain edge
shape plays an important role in cutting ability and
microscopic evaluation of grain edge shape which must
be taken into consideration for better abrasive machining.
In this study, the role of fractal geometry of abrasive grain
in lapping is evaluated. The results of the study showed
that when grain surface consists of micro edges and has a
large fractal dimension, the surface finish becomes better.
The paper concluded that fractal dimension that
characterizes the grain edge geometry can be a better
index of cutting ability. Alabi et al in 2008 did a study on
fractal dynamics of a bouncing ball on accelerating lift
tabletop with both constrained to vertical motion. The
results of this study further show case how fractal can be
used in characterization of engineering dynamics. It is
generally accepted that DC positive corona discharge is a
complex phenomenon and its discharge figures undergoes
a great change when compared to negative corona
discharge (Sato et al,1999).The authors research paper
describes the experimental results and analysis of the
fractal dimension of DC positive corona discharge figure
using the fractal theory. It is evident from the study that
the fractal dimensions of discharge figures is estimated
from about 1.1 to 1.6.The fractal behaviour of the
tungsten phase boundary of WNiFe presintered materials
and powder allgomerates can be characterized by
developing a box dimension method (Marchionni and
Chaix, 2003).Zhao et al ( 2011) explained that the service
performance of precision parts has close relationship with
the surface micro-topography. In this recent paper of the
authors, fractal theory is applied to describing the ground
surface quality in ultrasonic vibration grinding and the
influence of different grinding parameters on the fractal
dimension. Equally, the relationship between the fractal
dimension and surface roughness is analyzed. The
experimental results revealed that there is a close
relationship between the fractal dimension and surface
roughness. The author concluded that the reliability of
surface quality described by the fractal dimension is
verified through measurement of the bearing ratio of the
surface profile. Mazza et al (2011) presented a method for
the quantitative determination of a morphology descriptor
of free clusters with complex nanostructure. The finding
of the authors showed that the clusters have an open
fractal-like structure with fractal dimension depending on
their thermal history during growth and evolving towards
softer aggregates for longer residence times where lower
temperature conditions characterize the growth
environment.
Existing literature survey shows that disk and box
methods are among the most popular techniques for

International Journal of Science and Technology (IJST) – Volume 1 No. 5, May, 2012
IJST © 2012 – IJST Publications UK. All rights reserved. 236
estimating the fractal dimension of computable fractals in
dimensional Euclidean space. The major reason attributed
to this popularity is relative ease of implementation.
Despite this popularity, there is still a research gap. The
pertinent question on the suitability of box and disc
techniques for characterizing fractals with IFS codes has
not been addressed.
The objective of this paper is to demonstrate the
suitability of disk and box dimension methods for
estimating the dimension of some selected fractals with
IFS codes. The implementation of disk and box counts
methods are achieved using Monte Carlo approach.
II. MATERIALS AND METHOD
Six (6) fractals with known IFS functions were identified
from literature (see table 1 for their details). The Actual
dimension of these fractals indicated in table 1 was picked
from literature. In view of the fact that fractal properties
can be obtained from power related function informed
equation (2) given below:
XD
Y
(1)
Proportional related equation (1) can be re-written as in
equation (2) below.
XD
KY (2)
Where for the present study we let:
X = Number of Disks or Boxes (same size) used to
overlay the characteristic length (AB) of a fractal image in
2-dimensional Euclidean space.
Y = Number of either Disk or Box required to overlay
fractal image with corresponding characteristic length
(AB) in 2-dimension Euclidean space.
D = Fractal dimension. This will be referred in this study
as Estimated Disk dimension for Disk count method and
Estimated Box dimension for Box count method.
K = Constant of proportionality
Take logarithm (any base) of both sides of equation (2) to
make it a linear function, this yields equation (3).
CDxy (3)
Where y, x, and C are logarithms of Y, X, and K
respectively.
Two separate algorithms based on disk count and box
count method and which incorporated equation (3) was
developed to enable estimation of dimension for selected
fractals of this study. The algorithms was coded in
FORTRAN language and can compute transient and
steady solutions of fractals with IFS, implement disk and
box count methods using Monte Carlo approach,
prescribe fractal dimension based on equation (3) and
other relevant quantities required for results reported in
this study. Microsoft office Excel 2003 was used for the
plot of all graphs used in this report.
III. RESULTS AND DISCUSSION
Figures and tables were used to present the results of this
study.
Common Parameters: Iseed =9876=seed value for
generating random number
Coordinate of start point = (1, 0.5)
Transient solution=first 1000 solution points
Steady solution=First 5000 solution points after transient
solution.
Table 1: Fractals and Associated IFS Codes
Function Koch
1 0.3333 0.0000 0.0000 0.3333 0.0000 0.0000
2 0.1667 -0.2887 0.2887 0.1667 0.3333 0.0000
3 0.1667 0.2887 -0.2887 0.1667 0.5000 0.2887
4 0.3333 0.0000 0.0000 0.3333 0.6667 0.0000
Function Sierpinski Triangle
1 0.5000 0.0000 0.0000 0.5000 0.0000 0.0000
2 0.5000 0.0000 0.0000 0.5000 0.5000 0.0000
3 0.5000 0.0000 0.0000 0.5000 0.2500 0.5000
Function Gasket

International Journal of Science and Technology (IJST) – Volume 1 No. 5, May, 2012
IJST © 2012 – IJST Publications UK. All rights reserved. 237
1 0.5000 0.0000 0.0000 0.5000 0.0000 0.0000
2 0.5000 0.0000 0.0000 0.5000 0.5000 0.0000
3 0.5000 0.0000 0.0000 0.5000 0.2500 0.5000
Function Xmas Tree
1 0.3333 0.0000 0.0000 0.3333 0.0000 0.0000
2 0.3333 0.0000 0.0000 0.3333 0.6667 0.0000
3 0.3333 0.0000 0.0000 0.3333 0.0000 0.6667
4 0.3333 0.0000 0.0000 0.3333 0.6667 0.6667
5 0.3333 0.0000 0.0000 0.3333 0.3333 0.3333
Function Fractal-T
1 0.5000 0.0000 0.0000 0.5000 0.0000 0.0000
2 0.5000 0.0000 0.0000 0.5000 0.5000 0.5000
3 0.2500 0.0000 0.0000 0.2500 0.0000 0.7500
4 0.2500 0.0000 0.0000 0.2500 0.2500 0.5000
5 0.2500 0.0000 0.0000 0.2500 0.5000 0.2500
Function Fractal-L
1 0.5000 0.0000 0.0000 -0.5000 0.0000 0.5000
2 -0.5000 0.0000 0.0000 -0.5000 1.0000 1.0000
3 0.3333 0.0000 0.0000 0.3333 0.6667 0.0000
4 0.2500 0.0000 0.0000 0.2500 0.2500 0.5000
Length (AB) represents the longest distance between
coordinate pair of attractors. It characterises attractor and
thus vary from one attractor to the other. Referring to
Xmas tree (one of the fractal images studied) length (AB)
was found to be 1.4079unit. Thus a size 4 disk and a size
4 box for fractal image (Xmas Tree) has radius 0.1760unit
and a square length 0.3520unit respectively as can be seen
in figure 1.
Figure 1: Scattered Representation of a Disk and a Box with Common Centre (Xmas Tree).
-0.20
-0.15
-0.10
-0.05
0.00
0.05
0.10
0.15
0.20
-0.20 -0.10 0.00 0.10 0.20
A Disk and a Box with a Common Centre

International Journal of Science and Technology (IJST) – Volume 1 No. 5, May, 2012
IJST © 2012 – IJST Publications UK. All rights reserved. 238
Figure 2: Scattered Characteristic Length (AB) of Xmas Overlaid with Disks.
Figure 2 represents the characteristic length (AB
=1.4079unit) of fractal image (Xmas Tree) overlaid with
four (4) disks of radius 0.1769unit each. This disk was
referred in this study as size 4 for corresponding fractal
images studied.
Figure 3: Scattered Characteristic Length (AB) of Xmas Overlaid with Boxes.
Figure 3 represents the characteristic length (AB
=1.4079unit) of fractal image (Xmas Tree) overlaid with
four (4) square boxes of length 0.3520unit each. This box
was referred in this study as size 4 for corresponding
fractal images studied.
-0.20
-0.10
0.00
0.10
0.20
0 0.2 0.4 0.6 0.8 1 1.2 1.4
Characteristic Length (AB) of Xmas Tree Overlaid with Disks
-0.20
-0.15
-0.10
-0.05
0.00
0.05
0.10
0.15
0.20
0.0 0.2 0.4 0.6 0.8 1.0 1.2 1.4
Characteristic Length (AB) of Xmas Tree Overlaid with Square Boxes

International Journal of Science and Technology (IJST) – Volume 1 No. 5, May, 2012
IJST © 2012 – IJST Publications UK. All rights reserved. 239
Figure 4: Fractal Image (Xmas Tree) overlaid optimally with size 4 Disks
Figure 5: Fractal Image (Xmas Tree) overlaid optimally with size 4 Boxes
Xmas Tree Overlaid with 18-Disks of Size 4
Xmas Tree Overlaid with 14-Boxes of Size 4
International Journal of Science and Technology (IJST) – Volume 1 No. 5, May, 2012
IJST © 2012 – IJST Publications UK. All rights reserved. 240
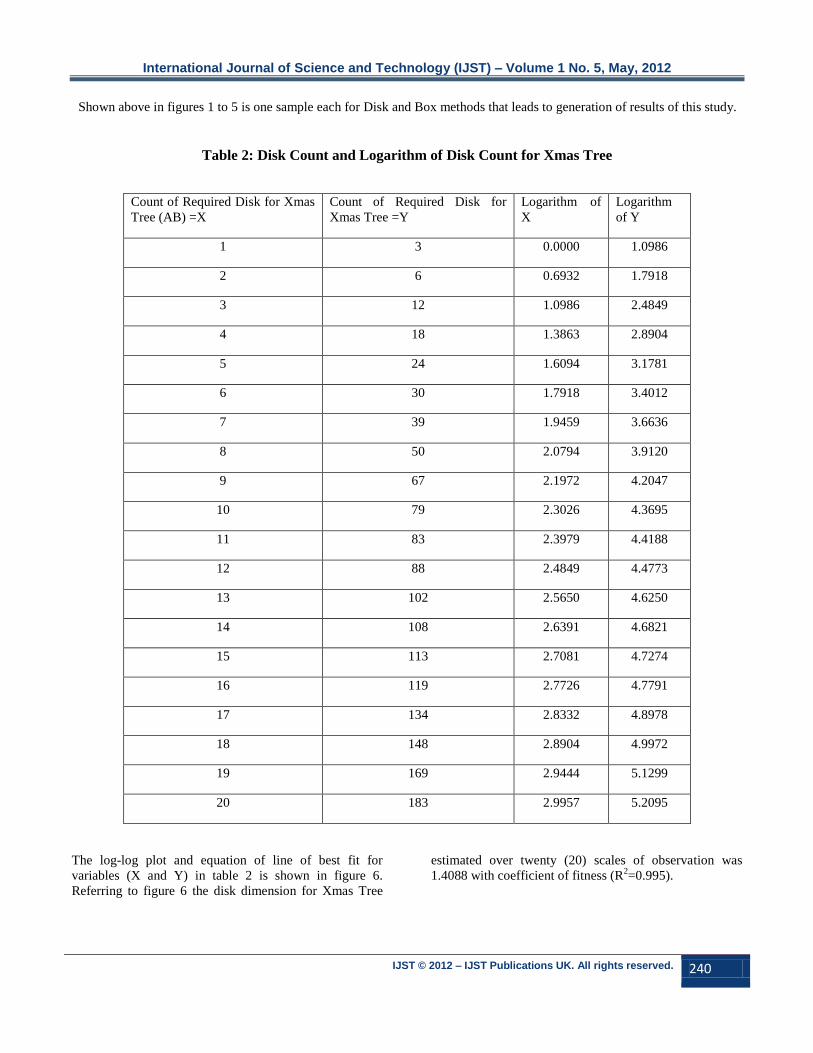
Shown above in figures 1 to 5 is one sample each for Disk and Box methods that leads to generation of results of this study.
Table 2: Disk Count and Logarithm of Disk Count for Xmas Tree
Count of Required Disk for Xmas
Tree (AB) =X
Count of Required Disk for
Xmas Tree =Y
Logarithm of
X
Logarithm
of Y
1 3 0.0000 1.0986
2 6 0.6932 1.7918
3 12 1.0986 2.4849
4 18 1.3863 2.8904
5 24 1.6094 3.1781
6 30 1.7918 3.4012
7 39 1.9459 3.6636
8 50 2.0794 3.9120
9 67 2.1972 4.2047
10 79 2.3026 4.3695
11 83 2.3979 4.4188
12 88 2.4849 4.4773
13 102 2.5650 4.6250
14 108 2.6391 4.6821
15 113 2.7081 4.7274
16 119 2.7726 4.7791
17 134 2.8332 4.8978
18 148 2.8904 4.9972
19 169 2.9444 5.1299
20 183 2.9957 5.2095
The log-log plot and equation of line of best fit for
variables (X and Y) in table 2 is shown in figure 6.
Referring to figure 6 the disk dimension for Xmas Tree
estimated over twenty (20) scales of observation was
1.4088 with coefficient of fitness (R2=0.995).

International Journal of Science and Technology (IJST) – Volume 1 No. 5, May, 2012
IJST © 2012 – IJST Publications UK. All rights reserved. 241
Figure 6: Log=Log Plot of Disks Required for overlaying of Xmas Tree
Table 3: Box Count and Logarithm of Box Count for Xmas Tree
Count of Required Box for Xmas
Tree (AB) =X
Count of Required Box for
Xmas Tree =Y
Logarithm of
X
Logarithm
of Y
1 1 0.0000 0.0000
2 4 0.6932 1.3863
3 8 1.0986 2.0794
4 14 1.3863 2.6391
5 20 1.6094 2.9957
6 23 1.7918 3.1355
7 34 1.9459 3.5264
8 40 2.0794 3.6889
9 51 2.1972 3.9318
10 64 2.3026 4.1589
11 76 2.3979 4.3307
y = 1.4088x + 0.9648 R² = 0.995
0.0000
1.0000
2.0000
3.0000
4.0000
5.0000
6.0000
0.0000 0.5000 1.0000 1.5000 2.0000 2.5000 3.0000 3.5000
Logarith
m o
f Y
Logarithm of X
Xmas Tree Disk

International Journal of Science and Technology (IJST) – Volume 1 No. 5, May, 2012
IJST © 2012 – IJST Publications UK. All rights reserved. 242
12 81 2.4849 4.3945
13 88 2.5650 4.4773
14 93 2.6391 4.5326
15 99 2.7081 4.5951
16 108 2.7726 4.6821
17 111 2.8332 4.7095
18 117 2.8904 4.7622
19 120 2.9444 4.7875
20 136 2.9957 4.9127
The log-log plot and equation of line of best fit for
variables (X and Y) in table 3 is shown in figure 7.
Referring to figure 6 the box dimension for Xmas Tree
estimated over twenty (20) scales of observation was
1.6037 with coefficient of fitness (R2=0.9887).
Figure 7: Log-Log Plot of Boxes required for overlaying of Xmas Tree
y = 1.6037x + 0.2915 R² = 0.9887
0.0000
1.0000
2.0000
3.0000
4.0000
5.0000
6.0000
0.0000 0.5000 1.0000 1.5000 2.0000 2.5000 3.0000 3.5000
Lo
gari
thm
of
Y
Logarithm of X
Xmas Tree (Box)

International Journal of Science and Technology (IJST) – Volume 1 No. 5, May, 2012
IJST © 2012 – IJST Publications UK. All rights reserved. 243
Table 4: Variation of Estimated Disk Dimension with Increasing Number of Scale
Number of
Scales
Attractors
1 2 3 4 5 6
2.0000 1.0000 1.0000 1.0000 1.0000 1.0000 1.2224
3.0000 1.0000 1.2337 1.2337 1.2337 1.3293 1.3226
4.0000 1.0000 1.3020 1.3020 1.3020 1.4921 1.3675
5.0000 1.0000 1.3846 1.3846 1.3224 1.4991 1.3944
6.0000 1.0000 1.4362 1.4362 1.3253 1.5332 1.4047
7.0000 1.0179 1.4598 1.4598 1.3418 1.5378 1.4173
8.0000 1.0498 1.4726 1.4726 1.3662 1.5552 1.4260
9.0000 1.0557 1.4837 1.4837 1.4057 1.5683 1.4335
10.0000 1.0713 1.4916 1.4916 1.4342 1.5717 1.4364
11.0000 1.0894 1.5010 1.5010 1.4410 1.5713 1.4362
12.0000 1.1033 1.5061 1.5061 1.4371 1.5731 1.4406
13.0000 1.1139 1.5118 1.5118 1.4380 1.5714 1.4463
14.0000 1.1250 1.5148 1.5148 1.4335 1.5716 1.4496
15.0000 1.1357 1.5165 1.5165 1.4246 1.5723 1.4525
16.0000 1.1417 1.5191 1.5191 1.4140 1.5737 1.4558
17.0000 1.1462 1.5187 1.5187 1.4083 1.5751 1.4587
18.0000 1.1527 1.5194 1.5194 1.4052 1.5768 1.4618
19.0000 1.1562 1.5207 1.5207 1.4069 1.5763 1.4615
20.0000 1.1612 1.5216 1.5216 1.4088 1.5764 1.4624
International Journal of Science and Technology (IJST) – Volume 1 No. 5, May, 2012
IJST © 2012 – IJST Publications UK. All rights reserved. 244
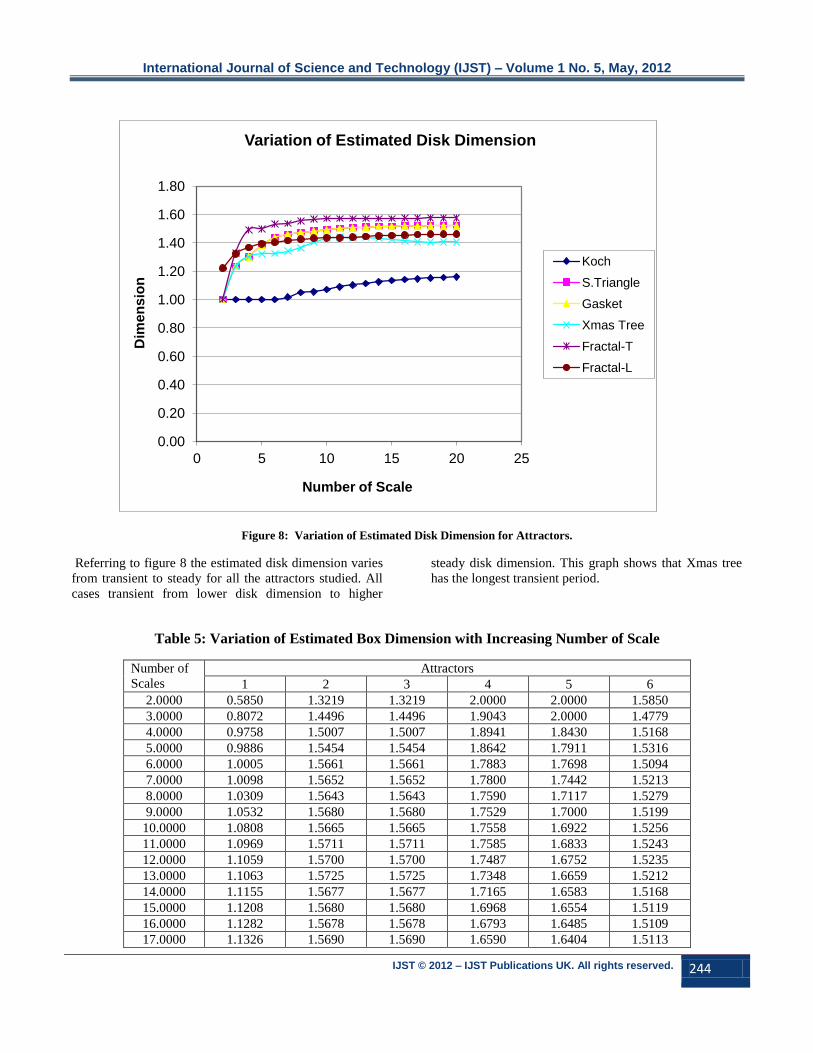
Figure 8: Variation of Estimated Disk Dimension for Attractors.
Referring to figure 8 the estimated disk dimension varies
from transient to steady for all the attractors studied. All
cases transient from lower disk dimension to higher
steady disk dimension. This graph shows that Xmas tree
has the longest transient period.
Table 5: Variation of Estimated Box Dimension with Increasing Number of Scale
Number of
Scales
Attractors
1 2 3 4 5 6
2.0000 0.5850 1.3219 1.3219 2.0000 2.0000 1.5850
3.0000 0.8072 1.4496 1.4496 1.9043 2.0000 1.4779
4.0000 0.9758 1.5007 1.5007 1.8941 1.8430 1.5168
5.0000 0.9886 1.5454 1.5454 1.8642 1.7911 1.5316
6.0000 1.0005 1.5661 1.5661 1.7883 1.7698 1.5094
7.0000 1.0098 1.5652 1.5652 1.7800 1.7442 1.5213
8.0000 1.0309 1.5643 1.5643 1.7590 1.7117 1.5279
9.0000 1.0532 1.5680 1.5680 1.7529 1.7000 1.5199
10.0000 1.0808 1.5665 1.5665 1.7558 1.6922 1.5256
11.0000 1.0969 1.5711 1.5711 1.7585 1.6833 1.5243
12.0000 1.1059 1.5700 1.5700 1.7487 1.6752 1.5235
13.0000 1.1063 1.5725 1.5725 1.7348 1.6659 1.5212
14.0000 1.1155 1.5677 1.5677 1.7165 1.6583 1.5168
15.0000 1.1208 1.5680 1.5680 1.6968 1.6554 1.5119
16.0000 1.1282 1.5678 1.5678 1.6793 1.6485 1.5109
17.0000 1.1326 1.5690 1.5690 1.6590 1.6404 1.5113
0.00
0.20
0.40
0.60
0.80
1.00
1.20
1.40
1.60
1.80
0 5 10 15 20 25
Dim
en
sio
n
Number of Scale
Variation of Estimated Disk Dimension
Koch
S.Triangle
Gasket
Xmas Tree
Fractal-T
Fractal-L

International Journal of Science and Technology (IJST) – Volume 1 No. 5, May, 2012
IJST © 2012 – IJST Publications UK. All rights reserved. 245
18.0000 1.1366 1.5696 1.5696 1.6392 1.6360 1.5110
19.0000 1.1448 1.5683 1.5683 1.6182 1.6342 1.5131
20.0000 1.1461 1.5681 1.5681 1.6037 1.6314 1.5139
Figure 9: Variation of Estimated Box Dimension for Attractors
Referring to figure 8 the box estimated dimension varies
from transient to steady for all the attractors studied.
Some cases transient from lower disk dimension to higher
steady disk dimension and vice versa. This graph shows
that Xmas tree has the longest transient period.
Table 6: Actual and Estimated Dimensions
Attra
ctor
Estima
ted
Disk
Dimen
sion
Actual
Dimen
sion
Estima
ted
Box
Dimen
sion
Absolute
Relative Error
(%)
Is
Dis
k
Err
or
low
er
tha
n
Box
Err
or?
Estima
ted
Disk
Dimen
sion
Estima
ted
Box
Dimen
sion
Koch 1.1612 1.2619 1.1461 8.0 9.2 Yes
Trian
gle 1.5216 1.5850 1.5681 4.0 1.1 No
Gask
et 1.5216 1.8928 1.5681 19.6 17.2 No
Xmas
Tree 1.4088 1.4650 1.6037 3.8 9.5 Yes
0.00
0.50
1.00
1.50
2.00
2.50
0 5 10 15 20 25
Dim
en
sio
n
Number of Scale
Variation of Estimated Box Dimension
Koch
S.Triangle
Gasket
Xmas Tree
Fractal-T
Fractal-L
International Journal of Science and Technology (IJST) – Volume 1 No. 5, May, 2012
IJST © 2012 – IJST Publications UK. All rights reserved. 246
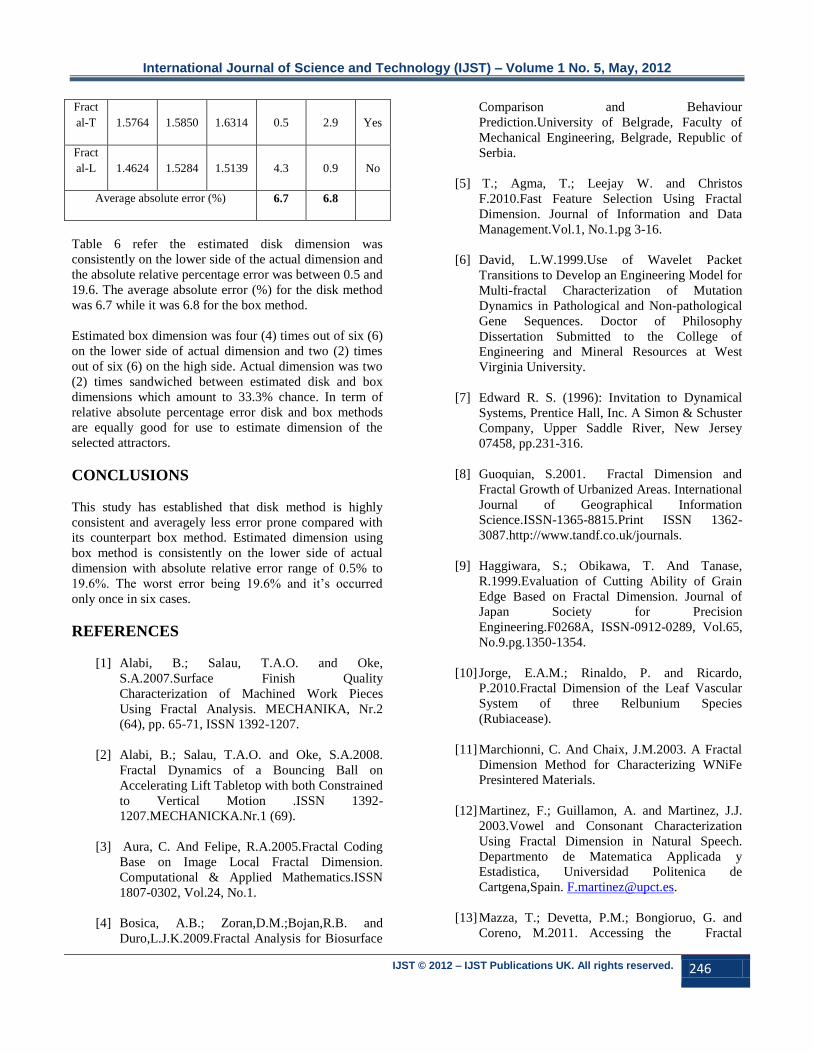
Fract
al-T 1.5764 1.5850 1.6314 0.5 2.9 Yes
Fract
al-L 1.4624 1.5284 1.5139 4.3 0.9 No
Average absolute error (%) 6.7 6.8
Table 6 refer the estimated disk dimension was
consistently on the lower side of the actual dimension and
the absolute relative percentage error was between 0.5 and
19.6. The average absolute error (%) for the disk method
was 6.7 while it was 6.8 for the box method.
Estimated box dimension was four (4) times out of six (6)
on the lower side of actual dimension and two (2) times
out of six (6) on the high side. Actual dimension was two
(2) times sandwiched between estimated disk and box
dimensions which amount to 33.3% chance. In term of
relative absolute percentage error disk and box methods
are equally good for use to estimate dimension of the
selected attractors.
CONCLUSIONS
This study has established that disk method is highly
consistent and averagely less error prone compared with
its counterpart box method. Estimated dimension using
box method is consistently on the lower side of actual
dimension with absolute relative error range of 0.5% to
19.6%. The worst error being 19.6% and it’s occurred
only once in six cases.
REFERENCES
[1] Alabi, B.; Salau, T.A.O. and Oke,
S.A.2007.Surface Finish Quality
Characterization of Machined Work Pieces
Using Fractal Analysis. MECHANIKA, Nr.2
(64), pp. 65-71, ISSN 1392-1207.
[2] Alabi, B.; Salau, T.A.O. and Oke, S.A.2008.
Fractal Dynamics of a Bouncing Ball on
Accelerating Lift Tabletop with both Constrained
to Vertical Motion .ISSN 1392-
1207.MECHANICKA.Nr.1 (69).
[3] Aura, C. And Felipe, R.A.2005.Fractal Coding
Base on Image Local Fractal Dimension.
Computational & Applied Mathematics.ISSN
1807-0302, Vol.24, No.1.
[4] Bosica, A.B.; Zoran,D.M.;Bojan,R.B. and
Duro,L.J.K.2009.Fractal Analysis for Biosurface
Comparison and Behaviour
Prediction.University of Belgrade, Faculty of
Mechanical Engineering, Belgrade, Republic of
Serbia.
[5] T.; Agma, T.; Leejay W. and Christos
F.2010.Fast Feature Selection Using Fractal
Dimension. Journal of Information and Data
Management.Vol.1, No.1.pg 3-16.
[6] David, L.W.1999.Use of Wavelet Packet
Transitions to Develop an Engineering Model for
Multi-fractal Characterization of Mutation
Dynamics in Pathological and Non-pathological
Gene Sequences. Doctor of Philosophy
Dissertation Submitted to the College of
Engineering and Mineral Resources at West
Virginia University.
[7] Edward R. S. (1996): Invitation to Dynamical
Systems, Prentice Hall, Inc. A Simon & Schuster
Company, Upper Saddle River, New Jersey
07458, pp.231-316.
[8] Guoquian, S.2001. Fractal Dimension and
Fractal Growth of Urbanized Areas. International
Journal of Geographical Information
Science.ISSN-1365-8815.Print ISSN 1362-
3087.http://www.tandf.co.uk/journals.
[9] Haggiwara, S.; Obikawa, T. And Tanase,
R.1999.Evaluation of Cutting Ability of Grain
Edge Based on Fractal Dimension. Journal of
Japan Society for Precision
Engineering.F0268A, ISSN-0912-0289, Vol.65,
No.9.pg.1350-1354.
[10] Jorge, E.A.M.; Rinaldo, P. and Ricardo,
P.2010.Fractal Dimension of the Leaf Vascular
System of three Relbunium Species
(Rubiacease).
[11] Marchionni, C. And Chaix, J.M.2003. A Fractal
Dimension Method for Characterizing WNiFe
Presintered Materials.
[12] Martinez, F.; Guillamon, A. and Martinez, J.J.
2003.Vowel and Consonant Characterization
Using Fractal Dimension in Natural Speech.
Departmento de Matematica Applicada y
Estadistica, Universidad Politenica de
Cartgena,Spain. [email protected].
[13] Mazza, T.; Devetta, P.M.; Bongioruo, G. and
Coreno, M.2011. Accessing the Fractal

International Journal of Science and Technology (IJST) – Volume 1 No. 5, May, 2012
IJST © 2012 – IJST Publications UK. All rights reserved. 247
Dimension of Free Clusters in Supersonic
Beams. New Journal of physics.
http://www.njp.org/
[14] Sato, Y.; Okumura, K. and Kawamura, T.
1999.Prediction of Fractal Dimensions of DC
Positive Corona Discharge by Fractal Theory.
Paper of Technical Meeting on Electrical
Discharge, IEE, Japan.Vol.ED-99, No.60-68, pg
13-18.
[15] Zhao, B.; Zhao,M. and Wang,Y.2011.Research
on the Surface Quality in Two Dimensional
Ultrasonic Vibration Grinding Based on Fractal
Theory. Advanced Science Letters, Vol. 4,
Number 3 pg702-707(6).American Scientific
Publishers.