journal of shivaji university (humanities and social sciences)
TRANSCRIPT


i
Journal of Shivaji University (Humanities and Social Sciences) ISSN : 0368 - 4199
Vol-53 / Issue -2 / July-Dec. 2020
JOURNAL OF SHIVAJI UNIVERSITY(Humanities & Social Sciences)
(Double blind and peer reviewed)ISSN : 0368-4199
SHIVAJI UNIVERSITYKOLHAPUR – 416004 (INDIA)
— Contact Details —
Prof. (Dr.) M. S. DeshmukhManaging Editor,
Journal of Shivaji University(Humanities and Social Sciences),
Department of Economics,Shivaji University, Kolhapur - 416004
E-mail: [email protected]: 0231- 2609179
Website:http://www.unishivaji.ac.in/journals/
VOLUME No. 53 ISSUE - 2 of 2020

ii
Journal of Shivaji University (Humanities and Social Sciences) ISSN : 0368 - 4199
Vol-53 / Issue -2 / July-Dec. 2020
Disclaimer
The views expressed in the articles included in this volume are those of respective authors and the Editorial Board and Publisher of the journal are not responsible for the same. The articles published in this Journal of Shivaji University (Humanities and Social Sciences), is subject to copy right of the publisher. No material can be reproduced without prior permission of the publisher.
© SHIVAJI UNIVERSITY, KOLHAPURISSN: 0368-4199
Published by: Dr. V. D. NandavadekarRegistrar,Shivaji University Kolhapur
Printed by:Press Superintendent,Shivaji University Press,KOLHAPUR – 416004
Year of Publication : December, 2020
(The Managing Editor, on behalf of the Editorial Board of the Journal of Shivaji University (Humanities and Social Sciences) Volume-53 issue-2 July - December 2020 wishes to express his thanks to the contributing authors and the experts for acting as referees for the papers included in this volume.)

iii
Journal of Shivaji University (Humanities and Social Sciences) ISSN : 0368 - 4199
Vol-53 / Issue -2 / July-Dec. 2020
CONTENTS
Sr. No. Title Page
No.
1
Backward and Forward Marketing Patterns, Hurdles and Resultant Net Negative Returns for Agricultural Produce by the Farmers’ Suicides Affected Victim’s Households from Maharashtra
Dr. Dnyandev C. Talule
1-23
2Agricultural Sustainability and Livelihood Security of Sangli District: An Empirical Illustration Using SLSI Approach
Dr. M. S. Deshmukh, Digvijay Patil, Ajay Kumbhar24-54
3 Impact of Covid-19 on Indian Print Media Dr. Shivaji Jadhav
55-65
4Understanding Indian Feminism Through Historical Perspective
Dr. S. R. Kattimani66-73
5The Role of social Media in disaster management: A study of social Media Page ‘Kolhapur Flood Victims’
Dr. Sumedha S. Salunkhe74-81
6ñdÀN> ^maV A{^¶mZ Ho$ à{V {d{^ÝZ dJm|© Ho$ {dÚm{W©¶m| H$s emar[aH$ Ed§
n¶m©daUr¶ OmJê$H$Vm H$m Aܶ¶Z (B§Xm¡a {Oco Ho$ n[aàoú¶ ‘|)
S>m°. draoÝÐ O¡Z
82-91
7
Central State Fiscal Transfers: A Case Study of General Category States across Twelfth, Thirteenth and Fourteenth Finance Commissions
Shrivardhini D. Talule
92-124

1
Journal of Shivaji University (Humanities and Social Sciences) ISSN : 0368 - 4199
Vol-53 / Issue -2 / July-Dec. 2020
Backward and Forward Marketing Patterns, Hurdles and Resultant Net Negative Returns for Agricultural Produce by
the Farmers’ Suicides Affected Victim’s Households from Maharashtra
1
Dr. Dnyandev C. Talule
1. Professor and Head, Department of Economics, Shivaji University, Kolhapur (MH), India, 416 004, Email: [email protected], Contact: +91-9423750555.
Abstract:
Marathwada and Vidarbha are known as the regions most affected by farmer suicides. At all in last thirty years at India level the pandemic of farmer suicides has taken the toll of more than 3.5 lac lives. Incidentally the five states at all India level are that the most affected by farmer suicides are the progressive states. These are the States which are known for their agricultural and industrial development but are trapped in high incidences of farmer suicides. These states are Andhra Pradesh (now includes Telangana), Karnataka, Kerala, Punjab and Maharashtra. Farmer suicides are also recorded from other parts of the country like Gujarat and Bundelkhand in Madhya Pradesh but they could not find the limelight. Mostly the farmer suicides in these parts have remained unnoticed. Suicide by farmers across these states of Maharashtra is not the outcome of poverty. Mostly it is an outcome of the negative gap between the expected and the actual income received from cultivation. As the agricultural economy of Maharashtra is a typical combination of vast drought prone areas coexisting with the regions having assured irrigation the suicide by farmers from the water starved regions of the state could not be stopped. These regions are Marathwada and Vidarbha. It has become a complex phenomenon to understand as to why in last thirty years the state has been unable to arrest incidences of farm suicide. Hence these regions of the state have emerged as the most affected regions of farmer suicides and the same is continuing for last thirty years. The first farmer suicide case of Maharashtra was confirmed in 1986. It was from Yavatmal district of western Vidarbha. “Karpe, a farmer from drought-prone Yavatmal district of Maharashtra, committed suicide along with his wife and four children on March 19, 1986. A suicide note he left behind said, “It is impossible to survive as a farmer.” Karpe had mixed rat the killer; zinc phosphate in food and served it to his family before consuming it himself. The event triggered a spate of farmer suicides in Maharashtra. Karpe’s suicide was the first documented farmer suicide in the State and today Maharashtra is known as a farmer suicide zone”.
(Business Line, March 19, 2019)
Ever since the Yavatmal district has been at the top of the list of farmer suicides at all India level. It was on March 19, 1986 that over three decades have passed. A farmer

2
Journal of Shivaji University (Humanities and Social Sciences) ISSN : 0368 - 4199
Vol-53 / Issue -2 / July-Dec. 2020
named Sahebrao Karpe Patil ended his life with his wife and four children; two sons and two daughters. He lived in a small village in Yavatmal district whose crops have failed consecutively for two years. This pushed him into a debt trap and so he could not receive any income from his cultivation. He was warned that if he does not pay the dues his electricity connection would be disconnected soon. Due to which he feared the ruining of his standing crop as well. With no way out; he by giving the Rat killer (Zink Phosphate) to his wife and four children (two daughters and two sons) and consuming himself the same had killed the entire family. For committing the mass family suicide, he travelled all the way from his village in Yavatmal district to a distant place in Wardha district; the village called Duttapur. There he along with his family had committed the mass suicide. During the same period in a southern state of Kerala in July 1986 a rubber growing farmer had ended his life through suicide. These incidences in fact had marked the beginning of the pandemic of farmer suicides in India.
Mainly the present paper is based on the primary data pulled in from across two districts; respectively the Usmanabad and Yavatmal from Marathwada and Vidarbha region of the state of Maharashtra. These two districts have always remained in the list of the most affected districts of farmer suicides from respective regions of the state. The district of Yavatmal happens to be the most affected district at all India level. The present study is in fact a census study on farmer suicides reported from these two districts. The study period comprises of four years from Jan 2014 to Dec. 2017.
Keywords : Farmer sucide, Borrowing, Agricultural Produce
I. Introduction:
The present paper attempts to address the backward and forward marketing challenges faced by the farmers’ suicides affected households from Usmanabad and Yavatmal districts respectively from the regions of Marathwada and Vidarbha. The paper also throws the light on the per acre and per quintal net returns received by the victim’s households both at the Minimum Support and Market Prices. In the backward marketing linkages, the paper analyses the overall debt pattern of the victim’s households and the debt related indicators are brought out. Both the districts have reported an increasing number of farmer suicides during the four-year period of Jan 2014 to Dec. 2017. Even if the farmer suicides are reported from every district of Marathwada and Vidarbha, it is in striking contrast with the other districts of both the regions that the number of farmer suicides from these two districts are relatively higher while the district of Yavatmal ranks highest at the all India level farmer suicides. Other reason that strikes to the mind is that while the farmer suicides in rest of the parts of the country have declined, the number of suicides in both these districts have been increasing. The main thrust of the present study is in ascertaining whether these farmer suicides have taken place mainly due to

3
Journal of Shivaji University (Humanities and Social Sciences) ISSN : 0368 - 4199
Vol-53 / Issue -2 / July-Dec. 2020
the agricultural credit problems, the problems accruing to the low crop yields and the losses from cultivation. The paper also attempts to assess the relative significance of the institutional and private farm credit in the agricultural indebtedness of these two districts and reasons for the same. For this purpose, the study attempts to find out the reasons for credit accumulation by farmers from both the districts located in Marathwada and Vidarbha regions of the state of Maharashtra. In all there have been 824 and 4056 farmer suicides respectively from Usmanabad and Yavatmal district during the eighteen-year period from 2001 to 2018. A limited proportion of these of these cases categorized as genuine farm suicide cases by the state government of Maharashtra for giving the compensation of rupees one lakh. All these suicides affected farmer households were spread across 1105 villages and 22 tehsils from these two districts of Usmanabad and Yavatmal from Marathwada and Vidarbha. This being the census study for over a period of Jan. 2014 to Dec. 2017 all suicides affected households during this period from both the districts were contacted in person and all information related to these households was carefully elucidated in personal interviews. The total number of such households covered is 1519. Hence there was no question of applying some strata and selecting the sample of suicide affected farmer households. It makes this as the first of its kind for Maharashtra. In past one such study was conducted for Punjab in 2011. This is the first-ever census survey conducted on suicides by farmers in the two most affected districts of Maharashtra respectively the Usmanabad and Yavatmal from Marathwada and Vidarbha region of the state. It tries to arrive at the number of farmer suicides, the reasons (whether they were caused by economic distress alone or they were due to the interplay of the forces of economic distress, social conflict, cultural backwardness and lack of community/state support) and also the present economic status of the families of the victims belonging to both these districts.
By now it is clear that on the lines of many other states in the country the agriculture of Marathwada and Vidarbha region has been passing through a difficult phase since the early 1990s. But the roots to these conditions are traced to the late 1980s as the first farmer suicide in the state was reported in the way back of March 1986. By giving a Rat Killer (Zink Phosphate) to his wife and four children and by consuming himself a farmer from Yavatmal district had killed the entire family including himself. It is clear that the yield levels of major crops i.e. Cotton, Tur (Arhar), Soyabeans and Sorghum cultivated by farmers of Marathwada and Vidarbha remain at lower levels than their counterparts in western Maharashtra. Consistently the crop wise per acre net returns for cultivating these crops was Rs. 7542.45 for cotton, Rs. 2702.86 for Soyabeans and Rs. 5370.36 for Tur. This was in 2012 (Parchure and Talule; 2012). Decline in yields and negative returns from cultivation of these major crops has pushed these farmers of both the regions into a debt trap and thereby towards suicides. Most of the suicide affected farm households

4
Journal of Shivaji University (Humanities and Social Sciences) ISSN : 0368 - 4199
Vol-53 / Issue -2 / July-Dec. 2020
are observed to have been under the debt trap. There are several reasons for high number of farmer suicides from both these districts of Usmanabad and Yavatmal. Mainly the cultivation pattern of these district is dominated by monocropping pattern dominated by cotton. This has undergone various technological and institutional transformations which made cultivation unremunerative. For example, the seed industry was liberalized in the late 1990s without any safeguard for farmers. On several occasions in past twenty years the farmers have faced the issues of spurious seeds and lost their crops but the seed suppliers were not assigned with the legal responsibility for farm losses. This is a repetitive phenomenon of Maharashtra. Technological changes in cotton seed research in favour of GM varieties promised the higher yields per hectare and profit of rupees ten thousand. But ultimately in case of studied suicide affected farmer households from these districts it shows net losses. Majority of the farmers from these districts have cultivated the cash crops like cotton, soyabeans and tur. The negative returns from the cultivation of these crops reveals that the suicide affected farmers were caught in a negative income trap as the cultivation became unremunerative for them. Vital reasons for the farming to become unremunerative were the cultivation of commercial crops with dependence on monsoon, stagnation of yields, absence of irrigation and the higher dependence on underground (well) irrigation with deep water tables, drying aquifers and erratic electricity supply during the peak agricultural season. Most of the agriculture of these district falls under the rainfed tract. Those who have the irrigation cover was based on the household level private irrigation investments in wells, pump sets and pipeline. Irritability of these infrastructures depended on the water aquifers (deeper than 100 feet) and the erratic power supply. Under such circumstances mostly the male member often responsible for managing the household economy falls under stress more than a female which resulted in comparatively larger number of male farmer suicides. In all this context thinking on farmer suicides leads us to a set of following questions.
1. Does an accumulating debt on account of repeated crop failures and negative returns from cultivation lead to a social isolation and thereby the egoistic suicide by these farmers?
2. What are the per family and per acre debt size, repayment, interest amount and debt pendency ratios?
3. What is the comparative composition of institutional and non-institutional debt structure and the interest rates charged by these lenders from the suicide hit farm households?
4. What is the per acre average yield and crop wise net returns from cultivation realized by the suicide hit farm households?
5. Do they have to undertake distress sell of their produce during the glut induced price falls and absence of MSP mechanism during such times so they incur losses from cultivation?

5
Journal of Shivaji University (Humanities and Social Sciences) ISSN : 0368 - 4199
Vol-53 / Issue -2 / July-Dec. 2020
II. Data and Methodology:
predominantly the present report is relied on the primary data on farmer suicides committed in the two most suicide affected districts from Marathwada and Vidarbha, we have surveyed the suicide affected farmer households for a period between Jan 1, 2013 to Dec. 31. 2017. Because this is the census study on two most affected districts of farmer suicides from Maharashtra and the period it covers is for four year from 2014 to 2017. Respectively the primary data is collected from the farmer suicide affected households which consisted the districts of Usmanabad from Marathwada and Yavatmal district from Vidarbha region of Maharashtra. Predominantly the primary data consists of three stage level information i. e. 1) the household level information obtained from the suicide affected households deemed eligible for state compensation for rupees one lac, 2) the information on deemed ineligible farmer suicides for state compensation and 3) the farm household level socio-economic information which were affected by farmer suicides during the four-year period between 2013 and 2017. In all 1519 farmer households affected of suicides during the four-year period from 2014 to 2017 which were identified as farmer suicides by the state government of Maharashtra were contacted in person and the household level information were gathered. This being the census study on farmer suicides on two most affected districts of the state during the four-year period from 2013 to 2017, all suicide victim’s households were surveyed from where farmer suicides were reported during this period. The primary survey, spanned in terms of geographic spread and the number of households it consisted is furnished in figures 1 and 2. Primary survey for the present census study of two most affected districts of farmer suicides from Maharashtra is conducted from the district of Usmanabad from Marathwada and Yavatmal district from Vidarbha region. The survey has covered twenty-two tehsils and one thousand one hundred and five (1105) villages from across these tehsils of two districts. Total number of farmer suicides affected households it covered is 1519. In fact, the district specific lists of farmer suicides from these two districts show more than 1519 cases. But as the several farmer suicides affected families have already migrated from their respective villages they could not be contacted. Therefore, the number of households actually surveyed is less than the actual number of suicide cases reported from these districts which covered the period of four year from 2014 to 2017. Hence the district wise respective numbers of surveyed suicide affected households are 1063 for Yavatmal and 456 for Usmanabad district from Vidarbha and Marathwada region of Maharashtra. All these households from both the districts were visited for obtaining the household level primary data. A questionnaire was specially structured for this purpose and was administered through personal interview method. Families of all these farmers were approached personally and efforts were made to assess and compare the level of socio-economic and psychological distress faced by the concerned farmer families.

6
Journal of Shivaji University (Humanities and Social Sciences) ISSN : 0368 - 4199
Vol-53 / Issue -2 / July-Dec. 2020
The information of economic aspects such as the level of debt overdue from institutional and non-institutional sources owed by these suicides affected farmer families, level of income and assets owned and the distress sail of the same including the land for debt repayment were carefully gathered. The information on social aspects of all these farm households such as the social discord, behavioural change experienced in case of the

7
Journal of Shivaji University (Humanities and Social Sciences) ISSN : 0368 - 4199
Vol-53 / Issue -2 / July-Dec. 2020
suicide victim farmer, social isolation, disputes both in the family and society, suicidal tendency, addition to drugs, etc…was sought to be obtained from the family. Also, the information on economic aspects of all these families was obtained for comparison. The entire information collected was verified through the informal group discussions with elderly persons or sometimes the elected village representatives for correctness and authentication. In addition to this the village level information of the farmer suicides affected villages pertaining to their developmental infrastructure was gathered separately. Village level information exercise was carried out to ascertain the socio-economic characteristics and developmental indices of all these 1105 villages which was gathered from village Panchayat and the office of the revenue Patwari.
III. Review and the Context:
Studies on farmer suicides have attempted to bring out the reasons for crisis and the reasons for the suicidal behaviour of farmers from different states in India. Mostly the studies have focused on the states of Maharashtra, Punjab, Kerala Karnataka and Andhra Pradesh. Because these are the states which have emerged as hot-spots of farmer suicides in country. In fact, the situation assessment survey of farmers carried out by the NSSO has brought out several startling facts on farm level crisis in India. The survey revealed that more than half of the Indian farmers were in debt and much of the debt was a consequence of the gap between agricultural expenses and net returns from it (NSSO; 2003). This made the agricultural activity the unrewarding profession. In Punjab agricultural policy changes over a decade were found responsible for the crisis (Jodhka; 2006). Cash expenditure on crop production in Punjab rose steadily while the yield level showed a declining trend. In Punjab the compound growth rate of cash expenditure on crop production between 1974-75 and 1991-92 was nearly 9 per cent for wheat and more than 11 per cent for paddy (Shergil H S; 1998). This was the major cause for farm indebtedness in the state and agricultural crisis. Borrowing from formal sources also invited trouble for farmers in Punjab (Kaur and Gill; 2002). While one group of scholars attributed the farmer suicides mainly to the Agro-economic problems like crop failures, indebtedness and negative return from cultivation, etc. (Shiva and Jafri, 1998; Deshpande; 2002), others have attributed the same to the politico-economic issues, blaming the state policies and neglect for tragedies (Assadi; 1998, Revathi; 1998, Vasavi; 1999, Sarma; 2004). It was also pointed out that the suicides were the outcome of historical factors associated with cotton cultivation (Prasad; 1999) while growing indebtedness was causing strain on farmers in most of the suicide prone states (Parthasarathy and Shameem; 1998).
As largely the studies on farmer suicides are done by economists it reveals that the economic rationality remains the dominant line of enquiry who either ignored or tangentially touched upon the sociological issues (Mohanty; 2013). Because the analysis of causes and types

8
Journal of Shivaji University (Humanities and Social Sciences) ISSN : 0368 - 4199
Vol-53 / Issue -2 / July-Dec. 2020
of suicides has remained a central tradition in the sociological discourse where exists rich conceptual literature (Durkheim; 1897-1952). Durkheim has classified the suicides into five different types. Suicides due to the negative returns and economic usury also caused the farmers fit into the anomic suicide while the disintegration of joint family structure and uneconomic size of holding may lead to social isolation and thereby an egoistic suicide. In Maharashtra the contribution of agriculture to GSDP has come down from 40 per cent in 1960-61 to 13 per cent in 2004-05 but the population dependent on agriculture was 58.5 per cent (2019-19 is also13 per cent) (Shrijit Mishra; 2006). In Karnataka the agrarian distress and farm household level debt were the major causes of curse (Deshpande; 2002) while the debt burden in Andhra Pradesh coupled with increasing cost of cultivation and declining yield, crop failures and low returns from cultivation pushed farmers into a suicide trap (P Narsimha Rao and K C Suri; 2006). In Kerala the agrarian crisis and farm distress were found closely linked to the neo liberal policy regime of the 1990s (S Mohankumar and RK Sharma; 2006) while V Shridhar (2004) underlined that the individuals and communities were under pressure to cope with the changes brought about by a churn in socio economic conditions of Andhra Pradesh. Many other studies which have underlined the economic rationality and held responsible the economic-politico factors for farmers suicides in different states of India are as; Assadi Muzaffar (1998), Kumar Pramod and LS Sharma (1998), Patnaik Utsa (2002), Choudhary (2002), Deshpande and Prabhu (2005), Sainath P (2007), Mohankumar and Binni (2005), Dandekar et. al. (2005), MS Swaminathan (2006), Gnyanmudra (2007), etc.
Internationally the studies on farmer suicides have assessed the impact of change in macro-economic policies of countries and its impact on socio economic relations is rural agrarian economy and its dominance in the suicidal causes. Stone GD (2002) assessed the impact of biotechnology on agrarian situation and farmers distress leading to suicides while Murphy, Lilliston and Lake (2005) assessed the agrarian distress from the WTO and Agreement on Agriculture (AoA) point of view and studied the impact of a decade of United States dumping in agriculture markets and thereby prices falls and cost benefit effectiveness in developing countries. Studies that have underlined the policy fatigue and government inactiveness which caused the agrarian distress and pushed farmers towards suicides are; also available in public domain. Basically, these studies have underlined the changes in the patterns of government spending and financial measures which have affected the conditions of cultivation. In factors market farmers have to pay the prices dictated by the suppliers while in product market purchaser determines prices with the farmer as a mute receiver (Deshpande RS; 2008). The situation in suicide prone states during the 1990s became bad to worst. It was mainly due to the policy failure and successive droughts (Vasavi; 1999, P Jeromy; 2006, Gill and Singh; 2006, Mishra; 2006, P Sainath; 2007).

9
Journal of Shivaji University (Humanities and Social Sciences) ISSN : 0368 - 4199
Vol-53 / Issue -2 / July-Dec. 2020
IV. Results and Discussion:
Entire analysis that makes up the present section of the paper is predominantly based on the primary data on farmer suicides committed in the rural areas of Usmanabad and Yavatmal districts of Marathwada and Vidarbha region of Maharashtra. This covers the period of four years from 2014 to 2017 (01.01.2014 to 31.12.2017). This was the period when the number of farmer suicides from these two districts respectively from Marathwada and Vidarbha were the highest.
4.1 Land, Debt, Repayment and Debt Outstanding Related Indicators:

10
Journal of Shivaji University (Humanities and Social Sciences) ISSN : 0368 - 4199
Vol-53 / Issue -2 / July-Dec. 2020
Farming communities need loans both for the cultivation and non-agricultural purposes. Non-agricultural consumption loans are required during the lean season and droughts whereas the agricultural loans are required for routine cultivation costs and investment purposes. Weak performance of formal sources has failed to wipe out the role and prevalence of informal credit sources from rural and village economy. Due to the discriminatory treatment at formal credit institutions, farmers have to resort to the private credit sources. Political interference in cooperatives has exposed a big chunk of average cultivators to the exploitation of private moneylenders. Besides their inability of elimination of private credit sources, the formal credit institutions have also failed in controlling the interest rates charged by these private lenders. Therefore, the proportion of borrowing across all farmer households from informal credit sources has increased fast. Size of total debt borrowed by the victim’s households and its pending are the main reasons for falling them into a vicious circle of debt trap and thereby the suicide by these farmers from Usmanabad and Yavatmal district of Maharashtra. As expected the average debt overdues (Rs. 100463.77) of per suicide affected household had certainly outstripped their income capacity. All other aspects from debt related data indicate the fact that the debt burden and continuance of the same has been pushing these farmers into a pandemic circle of suicidal trap. Actual use of credit, its timing, its adequacy and its price (interest rate) have deeper repercussions on the lives of these farmers. Smaller the size of landholding greater is dependency on borrowing for cultivation and thereby the reliance on private credit sources. Simultaneous multiple borrowing by the small and marginal landholders from all such sources has limited their repayment capacity which
11
Journal of Shivaji University (Humanities and Social Sciences) ISSN : 0368 - 4199
Vol-53 / Issue -2 / July-Dec. 2020
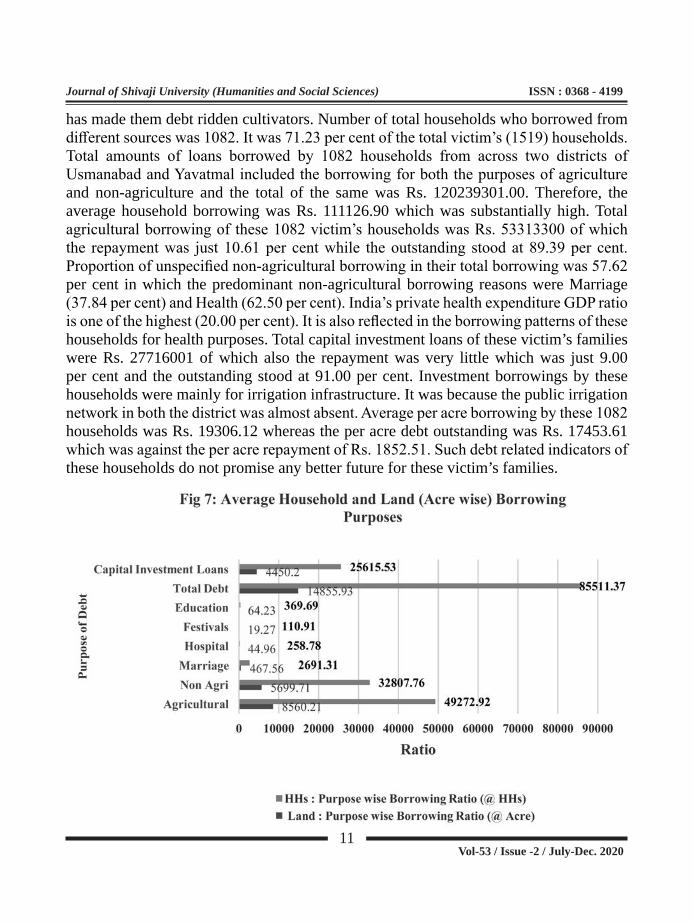
has made them debt ridden cultivators. Number of total households who borrowed from different sources was 1082. It was 71.23 per cent of the total victim’s (1519) households. Total amounts of loans borrowed by 1082 households from across two districts of Usmanabad and Yavatmal included the borrowing for both the purposes of agriculture and non-agriculture and the total of the same was Rs. 120239301.00. Therefore, the average household borrowing was Rs. 111126.90 which was substantially high. Total agricultural borrowing of these 1082 victim’s households was Rs. 53313300 of which the repayment was just 10.61 per cent while the outstanding stood at 89.39 per cent. Proportion of unspecified non-agricultural borrowing in their total borrowing was 57.62 per cent in which the predominant non-agricultural borrowing reasons were Marriage (37.84 per cent) and Health (62.50 per cent). India’s private health expenditure GDP ratio is one of the highest (20.00 per cent). It is also reflected in the borrowing patterns of these households for health purposes. Total capital investment loans of these victim’s families were Rs. 27716001 of which also the repayment was very little which was just 9.00 per cent and the outstanding stood at 91.00 per cent. Investment borrowings by these households were mainly for irrigation infrastructure. It was because the public irrigation network in both the district was almost absent. Average per acre borrowing by these 1082 households was Rs. 19306.12 whereas the per acre debt outstanding was Rs. 17453.61 which was against the per acre repayment of Rs. 1852.51. Such debt related indicators of these households do not promise any better future for these victim’s families.

12
Journal of Shivaji University (Humanities and Social Sciences) ISSN : 0368 - 4199
Vol-53 / Issue -2 / July-Dec. 2020
Per acre purpose wise credit of all the borrowing (1082) households was 8560.21, 5699.71, 467.56, 44.96, 19.17 and rupees 64.23 respectively for agricultural cultivation, unspecified non-cultivation, marriages, health and education. The same for every victim’s household comes as 49272.92, 32807.76, 2691.31, 258.78, 110.91 and rupees 369.69. Therefore, the exclusive non-cultivation borrowings like marriage, health, festivals and education were not vary high. It means that most of the borrowings by these households were exclusively for the agricultural purposes which included the running cultivation costs and capital expenses.
This picture corresponded to our earlier study on farmer suicides in Yavatmal district in 2012 (Parchure and Talule; 2012 / NABARD) where it was found that 96.72 per cent of the borrowed amounts by victim’s families were put into an exclusive agricultural and productive purposes only. Such financial behaviour of suicide affected farming communities proves the falsehood of ill-informed urban bias against the farming community and their wrong opinion about the unproductive use of credit amounts by cultivators.
Victim’s households cultivating under both the conditions of irrigated and rainfed need to borrow for meeting their cultivation expenses. On the contrary the borrowing requirements of households with irrigation facilities are more (49.55 per cent) than those who practice rainfed cultivation (43.39 per cent). These farmers needed loans for their routine operational expenses and capital investments mainly in irrigation infrastructures of wells, tube wells and pipelines. Operational expenses of these farmers consisted of seeds, fertilizers, electricity bills, irrigation charges and the hired machine, Labour
13
Journal of Shivaji University (Humanities and Social Sciences) ISSN : 0368 - 4199
Vol-53 / Issue -2 / July-Dec. 2020
and bullock power used during their cultivation. They needed these loans because the amounts of crop loans were not sufficient to cover all such cultivation expenses. Irrigated farmers borrowed more than their rainfed counterparts because both their capital and variable cost expenditure needs were more than the rainfed agriculture.
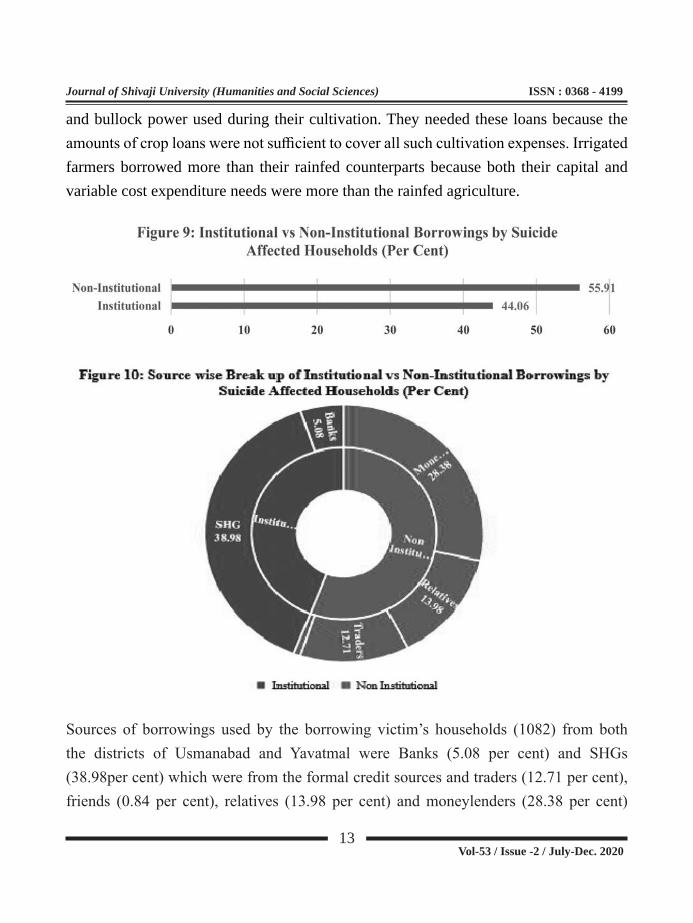
Sources of borrowings used by the borrowing victim’s households (1082) from both the districts of Usmanabad and Yavatmal were Banks (5.08 per cent) and SHGs (38.98per cent) which were from the formal credit sources and traders (12.71 per cent), friends (0.84 per cent), relatives (13.98 per cent) and moneylenders (28.38 per cent)

14
Journal of Shivaji University (Humanities and Social Sciences) ISSN : 0368 - 4199
Vol-53 / Issue -2 / July-Dec. 2020
respectively from the informal private credit sources. Both the categories of irrigated and rain fed landholders needed to borrow for different purposes. In fact, the farmers with irrigated lands have borrowed more (49.55 per cent) than their rain fed (43.39 per cent) counterparts. This was mainly on account of their capital investment requirements for creating irrigation infrastructure at their individual household level. Majority of the borrowings by victim’s households were associated with private credit sources. Because, it shows that the highest amount of borrowing was associated with moneylenders. But the respondents refrain to reveal about the usurious practices of moneylenders which was due to their stronghold they retain on the rural farm economy and society which is due to their ancestral dominance and contemporary political links. It is more in case of Vidarbha region where traditionally the stronghold of moneylenders is high. Farmers continue to borrow from these moneylenders because the loans are available on demand. Besides this the borrowers also have to pay commissions of about 10.00 per cent of their credit amounts to the agents operating at banks and cooperatives. Also, the time taken in processing the claim file is often longer and the credit ability of most of these small and marginal farmers is low which is due to their previous loan overdues. Borrowing by all categories of cultivators and both for the productive and unproductive purposes was associated with farmer suicides across all villages from both the districts of Usmanabad and Yavatmal. Most of the loans borrowed were for the purposes of agricultural cultivation and capital investments and not for unproductive purposes as is usually assumed by urban middle-class bias. This is true for across all survey villages from both these districts. Reasons for these farmers to borrow from private sources were prevalence of commission agents at banks and cooperatives and the commission amounts that they have to pay to these agents, delay in processing of loan file and the approval of bank loan application and the pendency of overdues of previous loans which also reduced the credit worthiness of these borrowers from formal credit sources.

15
Journal of Shivaji University (Humanities and Social Sciences) ISSN : 0368 - 4199
Vol-53 / Issue -2 / July-Dec. 2020
4.2 On Field Cultivation Cost (A2+FL) and Net Returns at MSP and MP Received By The Victim’s Households:
For majority of the crops cultivated by victim’s families have received net negative returns at market prices and notional net positive returns at minimum support prices. Because, in Maharashtra the minimum support prices are not implemented. Therefore, the absence of minimum support prices in the state could result in the pressure on market prices for agriculture produce. Hence the market prices for most of the crops in Maharashtra APMCs remain below the threshold of minimum support prices. Therefore, mainly the increase in borrowing across all landholding categories for farm operations was due to the outstripping by input prices and cultivation costs of the output prices and income which caused the net negative returns from cultivation and pushed these farmers into a debt trap.

16
Journal of Shivaji University (Humanities and Social Sciences) ISSN : 0368 - 4199
Vol-53 / Issue -2 / July-Dec. 2020
Looking at the on-field cost of production incurred and at A2+FL, the net returns at both the MSP and market prices received by these suicides affected farmers’ households we find that for several crops these farmers have received net negative returns from cultivation. Mainly these negative returns were for the major crops cultivated by these farmers. Crops which earned the net negative returns at the minimum support prices were sorghum, bajra and wheat and the net negative returns at the respective market prices were for cotton, tur and safflower. In Maharashtra the net negative returns at MSP are hypothetical because such procurement mechanism is not available in the state. Because, unlike Punjab and Haryana the agricultural marketing system of Maharashtra is not equipped with to handle the procurement at MSP through private traders at APMCs. And the state procurement system is not sufficient to handle the procurement of all crops for which the MSP mechanism in other states is available. Maharashtra farmers do not have the experience of such mechanism swinging into action even during the glut and severe price falls in agricultural markets. In past the Maharashtra farmers have experienced it for several times which was mostly in case of cotton, tur, soyabeans, gram and onions. Suicide affected districts of Marathwada and Vidarbha have faced this situation for the

17
Journal of Shivaji University (Humanities and Social Sciences) ISSN : 0368 - 4199
Vol-53 / Issue -2 / July-Dec. 2020
crops like cotton, tur, soya beans and gram. As the cotton, soyabeans, tur and sorghum have their predominance in cropping pattern of these farmers most of the losses from cultivation are faced for these crops only. Mainly the crops like sorghum and bajra are cultivated for consumption purposes therefore post the family requirement hardly any marketable surplus of these crops is available at their disposal for sell. The gap between cultivation costs and MSP and market prices for the crops like cotton, tur, bajra, wheat, gram and safflower cultivated by these farmers is substantially big. As these crops were cultivated by most of the affected farmers the net negative returns from cultivation of these crops have caused economic hardships to these farmers. Such unremunerative state of cultivation and inadequacy of formal credit have forced these farmers to borrow from private credit sources at higher rates of interests which are charged on monthly basis. Mostly the reason for such net negative returns from cultivation were on account of low crop yields which was in absence of irrigation. Sugarcane and onions were cultivated by these farmers only on their irrigated lands. But hardly these crops were cultivated by these suicides affected farmers because most of them do not have any access to irrigation network. Cultivation of soyabeans (Rs. 4575.06), moong (Rs. 915.45), urad (Rs. 5855.51), sugarcane (Rs. 17366.17), groundnut (Rs. 23350.59) and onions (Rs. 13298.09) could earn for them the net per acre positive returns. But the cultivation of these crops was hardly undertaken by any suicide affected farmers’ household because the predominantly they cultivate cotton and tur plus soyabeans. Average respective per acre on field costs of cultivation (at A2+FL) incurred by these farmers for cotton, tur, sorghum, bajra, wheat, gram and safflower were 26135.29, 25580.18, 14698.13, 11712.86, 15702.37, 17499.76 and rupees 14019.61. Except limited monopoly procurement of cotton in Maharashtra the MSP mechanism is almost unavailable for rest of the crops. Absence of procurement of these crops at MSP has always kept market prices lower than the declared MSPs for these crops at all India level. Therefore, the per acre net returns at market price for cultivating these crops have been lower than the hypothetical net returns at MSP. Because, farmers have to sell their produce at the market prices which are lower than the MSPs at national level and the MSP is not available to them. As a result, the sales of cotton, tur and safflower at market prices which were lower than the respective MSPs have
18
Journal of Shivaji University (Humanities and Social Sciences) ISSN : 0368 - 4199
Vol-53 / Issue -2 / July-Dec. 2020
resulted in the per acre net negative returns for rupees 4775.29, 4512.98 and 2865.61. If the facility of sale at MSPs for these crops was available then the cultivators would have received the respective per acre net profits for rupees 1080.71, 2139.83 and 4661.65. Per acre profits in case of the availability of MSP for crops would have been rupees 1080.71, 3480.66, 2139.83, 5606.05, 5279.51, 4661.65 and 50346.84 for cotton, soyabeans, tur, moong, urad, safflower and groundnut which are greater than the market price profits. But in absence of MSP in Maharashtra these profits become notional. Therefore, the profits and losses for these farmers depended on the market prices for these crops and for most of the times the market prices remained lower than the crop wise MSPs. Trends in crop wise returns underlined the fact that the rainfed farmers incurred heavy losses as compared to the irrigated farmers. Because the cultivation of these farmers depended on dry land agriculture which was affected by often shortfalls in monsoon. Net returns from the sale at market prices below their expectations for most of these crops were mainly on account of the increase in input costs and low yield levels as well as the market prices were not remunerative because the pressure of MSP was absent. Besides many other factors the farm crisis of Maharashtra is also the outcome of the failure of marketing, post-harvest handling, processing and the absence of MSP for crops which are cultivated by these farmers of suicide affected districts of this state. As these farmers continue to face frequent crop failures and inadequate crop yields the victim’s households across irrigated, unirrigated and fallow landholding from both the districts were debt ridden which has underlined their indebtedness as the main cause for suicide. Therefor the suicide affected families also have expressed the implementation of MSP and remunerative market prices for their crops so that the cultivation losses could be minimized. But it looks impossible as the state polity and administration is not prepared for the same.
V. Concluding Remarks:
Marginalizing of Indian agriculture sector ever since the 1980s in the national planning and declining state investment in rural and agricultural infrastructure and extension had caused an increase in cultivation cost at an individual farm level. This has resulted in the manifestation of farm level crisis which was deepened further during the period of the economic reforms. It has its resultant impacts which were in the form of farmer suicides in different states of the country. These states included Andhra Pradesh (Inclusive of

19
Journal of Shivaji University (Humanities and Social Sciences) ISSN : 0368 - 4199
Vol-53 / Issue -2 / July-Dec. 2020
Telangana), Karnataka, Maharashtra, Kerala and Punjab. Therefore, the continuous increase in suicide mortality rates amongst farming communities of these states has become a serious issue. It was accelerated after the beginning of the reforms period in India. Suicide by Maharashtra farmers was neither the outcome of poverty amongst the farming community nor was it on account of their inefficiency and unproductive use of credit money which have pushed them into the death trap. It was on account of the punctured socio-economic pride which was mainly on account of the accumulated economic tensions as they continuously faced through unexpected losses from cultivation for a long time. It was coupled with the negligence of agriculture in national and state policy kind of a thing since the 1986. This has led many farmers to commit suicide. It was not due to the productive inefficiency either of the land or farmer. But it was mainly on account of the increase in the costs of inputs as the demand for them had shot up rapidly which had also caused an increase in the cost of cultivation. Therefore, the cultivation cost had outstripped the revenue from output and resulted into the accumulation of farm debt burden. This was faced by several farm households of Maharashtra. Such financial situation has compelled many farmers to end their life through suicide. Post green revolution extensive use of nitrogen fertilizers, pesticides, insecticides and chemical inputs in Integrated Pest Management had its environmental and economic implications on the farming economy of commercial crop cultivators. Cropping patterns of suicide hit belts of Maharashtra are predominated by commercial crops like Cotton. This is the crop which need all expensive inputs like the seeds, chemical fertilizers and pesticides. Besides these chemical inputs, the crop yield is also irrigation determined. Unavailability of crucial inputs like irrigation happens to be the main obstacle which resulted in the yield and income uncertainties of these farmers. Repetition of crop cultivation like Cotton which requires heavy doses of farm manures has also caused the declining returns to scale in agriculture. In fact, the Agro-climatic conditions of Vidarbha and Marathwada regions of Maharashtra are suitable for twenty-seven different types of cereals and pulses. But due to the inadequate cropping education and extension, majority of farmers have been continuing with mono cropping pattern for which the cultivation cost has increased. It was mainly due to the declining returns to scale on the one hand and yielding of lower revenue as the market price for Cotton declined from Rs.2700 per quintal in 2005 to Rs. 1900 in the year 2007 on the other. Against the on field per acre cultivation cost (at A2+FL) of rupees 5444.85 in 2019, per quintal market price for cotton was rupees 4450 with which the Usmanabad and Yavatmal district suicide affected farmer households have faced the per acre losses for rupees 4775.29. For selling their crop, Maharashtra cotton farmers have depended on open markets because the state operated monopoly cotton purchasing scheme has failed. Similar marketing difficulties were faced by other crop cultivators. These crops were soyabeans, tur, sorghum, wheat, bajra, groundnut, onions and gram. Because, for these crops also (except onions) the

20
Journal of Shivaji University (Humanities and Social Sciences) ISSN : 0368 - 4199
Vol-53 / Issue -2 / July-Dec. 2020
MSP was available on paper but abstained in reality. Unlike Punjab and Haryana, the MSP mechanism in Maharashtra is not in place. Because of the absence of state MSP procurement, Maharashtra farmers have depended on markets for selling their crops. But the market prices which they received for their crops have been less than the MSP. This has caused the crop wise per acre net negative returns of rupees 4775.29, 4541.98, 2062.13, 3522.86, 1242.37, 2838.26 and 2865.61 for cotton, tur, sorghum, bajra, wheat, gram and safflower. If the MSP was available for Maharashtra farmers cultivating these crops then they would have received the per acre net positive returns of rupees 1080.71, 3480.66, 2139.83, 5605.05, 5279.51, 5279.51 and 4661.65 for cotton, soya beans, tur, moong, urad and safflower.
Unsatisfactory performance of formal lending institutions has further contributed to the farm level vagaries of Usmanabad and Yavatmal cultivators from Maharashtra. This has exposed more than half of them (55.91 per cent) to the exploitation by private traders and local moneylenders. These lenders have been charging heavy interest rates on monthly basis which ranged between 36 and 120 per cent per annum (because these were 3 and 10 per cent per month). 73.60 per cent of the suicide affected farmer households from Usmanabad and Yavatmal district did not even know about the prevalence of Minimum Support Price mechanism whereas 32.32 per cent of cultivators suffered crop failures on account of input market imperfections. They were supplied with spurious seeds (23.96 per cent), faced stunted crop growth, (6.98 per cent) and the delay in pesticide supply (1.38 per cent). Use of credit, time of credit availability, credit adequacy and credit price had caused the long-term impacts on the lives of these farmers of Marathwada and Vidarbha region from Maharashtra. Rural institutional credit sector in Marathwada and Vidarbha neither could eliminate nor was it able to control the lending rates and dominance of lending by traders and moneylenders. 55.91 per cent of the victim’s families had borrowed from private credit sources which consisted traders, friends, relatives and moneylenders. As the interest rates on these borrowings ranged from 36 to 120 per cent per annum they have doubled the principal credit amounts within a short period of time. Suicide by these farmers from Usmanabad and Yavatmal district was not the outcome of poverty but it was mainly due to the punctured socioeconomic and cultural pride which had made it difficult for them to continue with non-profiteering cultivation. This has mounted the socio, psychological and cultural pressures on their minds which changed their behaviour and were pushed into a suicidal trap. Shift in their cultivation in favour of crops like cereals, pulses, oilseeds and vegetables for which the Agro-climatic conditions of Marathwada and Vidarbha are suitable is necessary. But for this the state needs to put in place the agricultural information and extension services. This also demands the shift on policy front for creating quality rural infrastructure.

21
Journal of Shivaji University (Humanities and Social Sciences) ISSN : 0368 - 4199
Vol-53 / Issue -2 / July-Dec. 2020
References:
1. Anita Gill and Lakhwinder Singh (2006), Crisis of Agrarian Capitalism, Farmers Suicides and Responses of Public Policy: Evidence, Diagnosis and Alternatives, GAPS Series, Working Paper: 05.05.2006.
2. Assadi M (1998), Farmers Suicides: Signs of Distress in Rural Economy, Economic and Political Weekly, ISSN: 0012-9976, OCLC: 46735231, XXXIV (XXXIII), Vol. XXXIII, No. xxxiii, PP. 747-748.
3. B B Mohanty (2013), Farmers Suicides in India: Durkheim’s Types, Economic and Political Weekly, ISSN: 0012-9976, OCLC: 46735231, Vol. XLVIII, No. XXI, PP. 45-53.
4. Choudhary P A et. al (2002), Report of the Farmers Commission, Andhra Pradesh, Hyderabad.
5. Dandekar et. al. (2005), Causes of Farmers Suicides in Maharashtra: An Enquiry, TISS, Rural Campus, Tuljapur, High Court Report, Mumbai.
6. Deshpande R S (2002), Suicide by Farmers in Karnataka: Agrarian Distress and Possible Advisory Steps, Economic and Political Weekly, ISSN: 0012-9976, OCLC: 46735231, No. XXXVII, No. XXV, PP. 2601-2610.
7. Deshpande R S (2008), Farmers’ Distress and Indebtedness: Miseries and Myths, ADRT, ISEC, Bangalore, Symbiosis, Draft Paper: 11.01.2008.
8. Deshpande, R S and Prabhu Nagesh (2005), Farmers Distress: Proof Beyond Question, Economic and Political Weekly, ISSN: 0012-9976, OCLC: 46735231, Vol. XXXIV, No. XXXXV, P. 4663-65.
9. Durkheim, Emile (1893-1933), The Division of Labour in Society (New York: Free Press), (1897-1952): Suicide: A Study in Sociology (London Routledge and Kegan Paul).
10. E Revathi (1998), Farmers’ Suicide: Missing Issues, Economic and Political Weekly, 33(20), 1207.
11. Ganapati, M.N. and Venkoba Rao (1966), A Study of Suicide in Madurai, Journal of Indian Medical Association, Vol. 46, PP. 18-23.
12. GoI (2013), NSSO, New Delhi.

22
Journal of Shivaji University (Humanities and Social Sciences) ISSN : 0368 - 4199
Vol-53 / Issue -2 / July-Dec. 2020
13. Gyanmudra (2007), Farmer’s Suicide: Dynamics and Strategy of Prevention, NIRD, Hyderabad, Nov. 28-29.
14. Hegde R S (1980), Suicide in Rural Community, Indian Journal of Psychiatry, Vol. 22, PP. 368-370
15. Kaur and Gill (2002), Role of Informal Rural Financial Markets in Punjab: A Case Study, Working Paper: NABARD, DEAR, Mumbai.
16. Kumar Pramod and L S Sharma (1998), Suicides in Rural Punjab: Institute for Development and Communication, Chandigarh.
17. M S Swaminathan (2006), GoI, Report on Farmers Suicides.
18. Mishra S (2006), Suicides of Farmers in Maharashtra: GoM, IGIDR, Mumbai.
19. Mohankumar and Binni (2005), Impact of Market Uncertainty on Investment and Employment in Rubber Small Holding Sector: An Analysis of Trends in the Post Reforms Phases, Economic and Political Weekly, ISSN: 0012-9976, OCLC: 46735231, XL (XXXXVI), PP. 4850-56.
20. Mohankumar and R K Sharma (2006), Analyses of Farmers Suicides in Kerala, Economic and Political Weekly, ISSN: 0012-9976, OCLC: 46735231, Vol. XLI. No. 1XVI. PP. 1553-58.
21. Murphy S B, Lilliston and M B Lake (2005), WTO Agreement on Agriculture, a Decade of Dumping (United States Dumping on Agricultural Market), Institute for Rural and Trade Policy, Minneapolis.
22. Nandi et. al. (1979), Is Suicide Preventable by Restricting the Availability of Lethal Agents? A Rural Survey of West Bengal, Indian Journal of Psychiatry, Vol. 21, PP. 251-255.
23. P Jeromy (2006), Farmers’ Indebtedness and Suicides: Impact of Agricultural Trade Liberalization in Kerala, Economic and Political Weekly, ISSN: 0012-9976, OCLC: 46735231, Aug. 2007. PP. 3241-47.
24. P Narsimha Rao and K C Suri (2006), Dimensions of Agrarian Distress in Andhra Pradesh, Economic and Political Weekly, ISSN: 0012-9976, OCLC: 46735231, Vol. XLI. No. 1XVI. PP. 1546-52.
25. P Sainath (2007), Maharashtra: Graveyard of Farmers, The Hindu: 14.11.2007.

23
Journal of Shivaji University (Humanities and Social Sciences) ISSN : 0368 - 4199
Vol-53 / Issue -2 / July-Dec. 2020
26. Parthasarathy G and Shameem (19998), Suicides of Cotton Farmers in Andhra Pradesh: An Exploratory Study, Economic and Political Weekly, ISSN: 0012-9976, OCLC: 46735231, Vol. XXXIII. No. XIII. PP. 720-26.
27. Patnaik Utsa (2002), Deflation and d’eja vu’ in V K Radhakrishna and M Swaminathan (eds) Agrarian Studies: Essays on Agrarian Relations in Less Developed Countries, Tulika, New Delhi.
28. Prasad C. Shambhu (1999), Suicide Deaths and Quality of Indian Cotton, Perspectives from History of Technology and Khadi Movement, Economic and Political Weekly, ISSN: 0012-9976, OCLC: 46735231, Vol. XXXIV, No. V, PP. 12-21.
29. Sarma E A S (2004), Is Rural Economy Braking Down? Farmers Suicides in Andhra Pradesh, Economic and Political Weekly, ISSN: 0012-9976, OCLC: 46735231, XXXIV (XXXIII), Vol. XXXIX. No. XXVIII. PP. 3087-90.
30. Shergil H S (1998), Rural Credit and Indebtedness in Punjab, Institute for Development Communication, Chandigarh, Monograph Series IX.
31. Shiva Vandana and A H Jafri (1998), Seeds of Suicides: The Ecological and Human Costs of Globalization of Agriculture, Research Foundation for Science, Technology and Ecology, New Delhi.
32. Shridhar V (2004), Neoliberalism Spurned, Frontline, 21(12), PP 23-38 (2004a): From Debt to Death, Frontline XXI (XIII) PP. 13-16.
33. Stone G D (2002), Biotechnology and Suicides in India.
34. Surinder S. Jodhka (2006), Beyond ‘Crises’ Rethinking Contemporary Punjab Agriculture, Economic and Political Weekly, ISSN: 0012-9976, OCLC: 46735231, Vol. XLI. No. XVI, PP. 1530-37.
35. Vasavi A R (1999), Agrarian Distress: Market, State and Suicides, Economic and Political Weekly, ISSN: 0012-9976, OCLC: 46735231, XXXIV (XXXIII), PP. 2263-68.
24
Journal of Shivaji University (Humanities and Social Sciences) ISSN : 0368 - 4199
Vol-53 / Issue -2 / July-Dec. 2020
Agricultural Sustainability and Livelihood Security of Sangli District : An Empirical Illustration Using SLSI Approach2
Dr. M. S. Deshmukh1, Digvijay Patil2, Ajay Kumbhar3
1. Professor, Department of Economics, Shivaji University, Kolhapur, Maharashtra- 416004; Email: [email protected] Contact: +91 9869276565
2. Research Scholar, Department of Economics, Shivaji University, Kolhapur, Maharashtra-416004; Email: [email protected] Contact: +91 9765199191
3. Research Scholar, Department of Economics, Shivaji University, Kolhapur, Maharashtra-416004; Email: [email protected] Contact: +91 8600275293
Abstract:
This paper aims to propose and empirically illustrate practical utility and policy relevance of SLSI to evaluate the relative agricultural sustainability of Sangli district of Maharashtra. The farming problems such as drought, fragmentation and marginalization of land, poor irrigation facilities, indebtedness of the farmers, deficiency of markets and increasing disparity in different socio-economic indicators among the blocks have created hindrances to the successful development of sustainable agriculture in Sangli district of Maharashtra. Sustainable livelihood security index (SLSI) as a composite index of its three components such as ecological security index (ESI), economic efficiency index (EEI), and social equity index (SEI) is used to recognise essential conditions and regional disparities among the states for sustainable agricultural development. We have made an attempt to undertake a comparative study of two time period i.e. period I (2009 to 2014) and period II (2015 to 2019) to examine the progress of different indicators of sustainable agricultural development. The empirical results reveal that sustainable livelihood security index has increasing trend i.e. 0.514 in period I to 0.531 in period II, also the study found that maximum and minimum SLSI values were 0.719 to 0.347 during period I and 0.684 to 0.358 during period II respectively. The empirical illustration shows that there were wide regional inequalities in different blocks of Sangli district. Most of the blocks of Sangli district are comes under medium category of SLSI which indicates that the constructive efforts required for the environmental and socio-economic development of the Sangli district.

25
Journal of Shivaji University (Humanities and Social Sciences) ISSN : 0368 - 4199
Vol-53 / Issue -2 / July-Dec. 2020
Keywords: Sustainable livelihood security index (SLSI), Ecological security, Economic efficiency, Social equity, Agricultural sustainability.
I. Introduction:
Since the critical dimension of sustainable development in general and sustainable development of agriculture (SDA) in particular are ecology, economics and inter and intra- generational equity (Barbier 1989; Daly, 1990; Swaminathan 1991) any approach for developing indicator for SDA should necessarily reflect all three dimensions i.e. ecological security index (ESI), economic efficiency index (EEI), and social equity index (SEI). Brundtland Commission defined sustainable development as the “ability to make development sustainable to ensure that it meets the needs of the present without compromising the ability of future generations to meet their own needs (World commission on Environment and development 1987) also FAO defines the Sustainable agricultural development is “the management and conservation of the natural resource base, and the orientation of technological and institutional change in such a manner as to ensure the attainment and continued satisfaction of human needs for present and future generations” (FAO 1991). Agriculture is a core occupation in India as far as employment and income is concerned, nearly 48% households were involved in agriculture and allied activities and the share of agriculture in GDP was 19.90% in 2020-21 (MOSP 2020-21). It is considered as an engine of growth for developing countries including India. In the process it has been facing numerous challenges to achieve foremost important goals like ecological sustainability, adequate food production, health, financial affluence and livelihood sustainability. In order to examine sustainability of a region, Swaminathan has defined ‘Sustainable Livelihood Security Index’ (SLSI) as which are ecologically secure, economically efficient and socially equitable are assessed. It implies the protection or assurance of the means of livelihood for the masses not only at present time but also in future. (Swaminathan M.S 1991). The sustainable livelihood security index (SLSI) is worked as a litmus to check whether or not certain essential circumstances for sustainable development are present in a given region or not. The SLSI is used to evaluate the existing condition and the further policy necessities relating to sustainable development (Singh, P. K., and Hiremath. B. N. 2010). Providing sustainable livelihood security to the people assure that they will meet their own needs resulting to reduce pressure on the environment and it will be possible for more people to meet their livelihood needs

26
Journal of Shivaji University (Humanities and Social Sciences) ISSN : 0368 - 4199
Vol-53 / Issue -2 / July-Dec. 2020
in the future (Chamber R 1986). In present research paper an attempt is made to assess agricultural sustainability and livelihood security of different states of India by using sustainable livelihood security index (SLSI) as a policy tool.
Agriculture practices has been influencing the environment and in turn, it impacted by the environment. Hence, environmental friendliness of agriculture is most important factor as far as sustainability of human beings is concerned. (Harron, Iffat and Shahzad 2014). After green revolution the agricultural production was increased tremendously due to excess use of high yielding variety of seeds (HYVs), chemical fertilizers, pesticides and excessive use of water resulting degradation of land, soil quality and environment too.
2. ProfileofStudyArea:
Sangli district is located on the south and southeast of Maharashtra. The north latitude (NL) 16.45-17.22 and East Longitude (EL) 73.42-75.40. The district’s area is around 8,572 square feet. That means there are districts of Satara in the north and north east, Solapur in the north and northeast, Bijapur (Karnataka) in the east, Belgaum in the south, Kolhapur in the south, and Ratnagiri in the west. Shirala taluka on the west comes in the main line of Sahyadri. The western part of the district is mountainous. The district has different geographical, economic and social status. Jat, Atpadi, Kavthe Mahankal are the permanent drought-hit talukas. Many villages in Palus, walwa, Miraj talukas are always at risk of flood. Shirala, Khedgaon, Khanapur are hill stations. At one end there is a forest in Shirala taluka. On the other hand, lots of desert land in Jat taluka. Sangli’s half-maternal behavior works in the Kannada language on the Maharashtra-Karnataka border. The east-west length of the district is 205 km and the north-south length is 96 km. Sangli districts major rivers are Krishna and Warana. The length of Krishna River in the district is 105 kms. The temperature of the district is between 14 degree centigrade and maximum of 42 degrees centigrade. The district’s average rainfall is 400-450 mm. The description of the district indicating geographical area, size of population, literacy level, density of population, irrigation sources etc. A complete resource mapping about ecological security, economic efficiency and social equity of the district is presented in the chapter. The Sangli district is very rich in flora & fauna in different zones. Besides other commodities, graphs and sugarcane are the proof of identity mark of the location in the Maharashtra due to its agro-ecological situation and productivity. The total size of population of the Sangli is 28.2 lakhs. The male number is 14.35 lakhs & female 13.86

27
Journal of Shivaji University (Humanities and Social Sciences) ISSN : 0368 - 4199
Vol-53 / Issue -2 / July-Dec. 2020
lakhs constituting a male / female ratio of 1000: 966. The Literacy rate is 82.41% and population density is 330 per sq. km. The marginal farmers (60.66%), followed by small farmers (22.00%), medium & large (17.32%). Out of total Geographical area of 8.61 lakh hector of the district, the cultivable area is 5.41 lakh hector. Thus nearly 73.00% area is under cultivation & rest of 8.00% is occupied as barren, non-agricultural use, forest, land under misc. plantation & pasture land. The most of the land out of cultivable land used for food grain production (66.13%), Sugarcane (14.47%) and fruits and other crops (9.66%).
The Sangli district has wide network of cooperative dairies, currently 524 are working with a potential of 14.02 lakh litter collection per day and having 17 cold storage facilities. Similarly, total 4253 co-operative societies are working among that 767 are Farmers co-operatives, 1107 are Non-Farmers co-operatives, 45 marketing organizations, 1277 are manufacturing organizations, 34 nationalized banks and 1057 are Social service organizations. Sangli is one of the leading sugar producers in Maharashtra having 13 co-operative sugar factories with production flour of 72.65 lakh tonne and 58.74 lakh tonne of sugar production. The role of women in the agriculture sector in general and for

28
Journal of Shivaji University (Humanities and Social Sciences) ISSN : 0368 - 4199
Vol-53 / Issue -2 / July-Dec. 2020
farm activities is very important. The entire rural household economy is dominated by women as they are anchoring various economic activities. The agricultural sector which provides employment and source of living for large number of people needs progressive policy intervention. We have tried to undertake a comparative study of the two periods, period-I (2010-14) and period-II (2015-19) to examine the progress of different aspects of sustainable development in all ten blocks of Sangli district
III. Research Methodology and Database :
3.1 Analytical Framework :
The present research paper is purely based on secondary data, which is collected from various socio-economic surveys of Sangli district, census reports of Government of India and online available database. The researcher had adopted the UNDP methodology to construct the sustainable livelihood security index in India. SLSI as a cross-sectional tool to assess the comparative sustainability standing and basic prerequisite of sustainable development of agriculture in the given region (Saleth. R. M., and M. S. Swaminathan 1993). The systematic approach essential for operationalizing sustainable livelihood security (SLS) in the form of sustainable livelihood security index (SLSI) is classified by three propositions of sustainable development of agriculture (SDA). First, three-dimensional conceptions of the SDA (i) ecological security (ii) economic efficiency (iii) social equity in both intra and interregional contexts. Second, for assessing the contextual as well as dynamic nature of SDA analysis, sustainability needs to be relative rather than absolute in both time and space. Third, in an operational approach, the multidimensional conceptions of SDA require the SLSI to be a composite of three interacting component indices, that is, ecological security index, economic efficiency index and social equity index. (Hatai L. D., and C. Sen 2008).
3.2 Construction of Sustainable Livelihood Security Index :
Let X ijk and SLSI ijk represent the value of ith variable, jth component and kth block and index for ith variable representing the jth component of the SLSI of kth block respectively. Then, we have, for positive implication we used equation (1) and for negative implication we have used equation (2)

29
Journal of Shivaji University (Humanities and Social Sciences) ISSN : 0368 - 4199
Vol-53 / Issue -2 / July-Dec. 2020
……… (1)
…….. (2)
……… (3)
Where,
i = variables (1,2,3………. I)
j = components (1,2,3………. J)
k = blocks (1,2,3………. K)
The numerator in equation (1) and (2) shows that, it measures the extent by which the Kth block did better in the ith variable representing the jth components of SLSI as compared to the state showing the worst performance in that component, and the denominator indicates the range (i.e., the difference between the maximum and the minimum values of the variable representing a given component).
The equation (3) displays three component indices of SLSI, viz. ESI, EEI and SEI were calculated for all variables, the indices for various components of SLSI were calculates as a simple mean by assigning equal weights to the indices of their respective variables. The SLSI has range of 0 to 1 in which a value closer to zero shows low level of sustainability and value near to 1 denotes high level of sustainability.
IV. Results and Discussion:
Sangli district is one of the major district of western Maharashtra as far as agricultural production is concerned. It has both drought and non-drought prone blocks which is the biggest obstacle for successful development of sustainable agriculture in Sangli district. We have made an attempt to assess comparative study of agricultural sustainability for two different time periods i.e. Period I (2009-14) and Period II (2015-19).

30
Journal of Shivaji University (Humanities and Social Sciences) ISSN : 0368 - 4199
Vol-53 / Issue -2 / July-Dec. 2020
4.1 Constructing Ecological Security Index of Sangli District In Maharashtra:
Ecological Security Index (ESI) is one of the key dimensions and of Sustainable Livelihood Security Index (SLSI). It is a fundamental requirement for economic development and social progress. However, human activities have led to significant changes in the ecological environment that can directly affect the ecological security in a region. The speedy development of urbanization, the impacts created by land use transfer has a great impact on regional environment and ecosystem services.
4.1.1 Average values of Ecological Security Indicators of Sangli district in Maharashtra
The selection of the variables to assess sustainability of Sangli district in Maharashtra is based on ecological security and availability of block-wise data. We have used population density as negative (-ve) variable to construct Ecological Security Index (ESI) because it plays vital role for the ecological balance, more the population density higher will be the pressure on natural resources and lower will be the ecological security. Higher population density also causes extent of pollution which again responsible for degradation of environment. Higher or growing population density can threaten sustainability of protected forest areas and ecologically fragile or marginal land. Hence the variable population density was selected in view of its capacity to reflect the extent of human pressure on overall ecological security (Harron, Iffat and Shahzad 2014). Forest cover area (+ve) is an important indicator for ecological balance, more the total forest area higher will be ecological security and vice versa. It is a great source to lift income and livelihood for rural peoples. Also, it helps to control pollution within atmosphere resulting ecological security. Similarly, the total livestock is third important indicator taken as negative (–ve) and it also put pressure on grazing land which in turn increases the burden on natural resources. Therefore, variables used for estimation of Ecological Security Index (ESI) are forest cover, density of population and total livestock for the period -I (2010-14).
Speaking about the ecological security indicator Miraj has highest population density while jath has lowest. The Shirala block has highest area under forest coverage (27.6%) followed by Kadegoan (23.8 %) and Khanapur (23%) and K. Mahankal (2.1%) has lowest forest area during period-I (2010-14). Moreover, Kadegaon has highest livestock population (17.4%) followed by Jath (15.5%) and Palus has lowest (4.4%) during period-I

31
Journal of Shivaji University (Humanities and Social Sciences) ISSN : 0368 - 4199
Vol-53 / Issue -2 / July-Dec. 2020
(2010-14) assessment.
4.1.2 Estimating Ecological Security Index (ESI) of Sangli District in Maharashtra
As far as Density of Population and total livestock is concerned it is used as negative indicator because it has an adverse effect on the sustainability. Based on this raw data the ecological Security Index (ESI) value is calculated by using formula of sustainable livelihood security index (SLSI) for both positive and negative indicators, which indicates and recognizes the essential conditions for sustainable development in the various blocks of Sangli district.
Table – 1Estimating Ecological Security Index (ESI) of Sangli District in Maharashtra
Period-I (2010-2014)
Sr. No. Taluka Total Forest
Area Index
Density of Population
Index
Total Livestock
Index
Ecological Security
Index
ESI Ranking
1 Shirala 1.000 0.844 0.874 0.906 1
2 Walva 0.160 0.165 0.332 0.219 10
3 Palus 0.160 0.496 1.000 0.552 4
4 Khanapur 0.819 0.880 0.909 0.870 2
5 Atpadi 0.535 0.393 0.716 0.548 5
6 Tasgaon 0.195 0.797 0.616 0.536 6
7 Miraj 0.198 0.000 0.527 0.242 9
8 K. Mahankal 0.000 0.912 0.563 0.492 8
9 Jath 0.335 1.000 0.147 0.494 7
10 Kadegaon 0.850 0.864 0.000 0.571 3
Total Sangli (Avg.) 0.425 0.635 0.568 0.543 -
Source : Authors calculations
32
Journal of Shivaji University (Humanities and Social Sciences) ISSN : 0368 - 4199
Vol-53 / Issue -2 / July-Dec. 2020
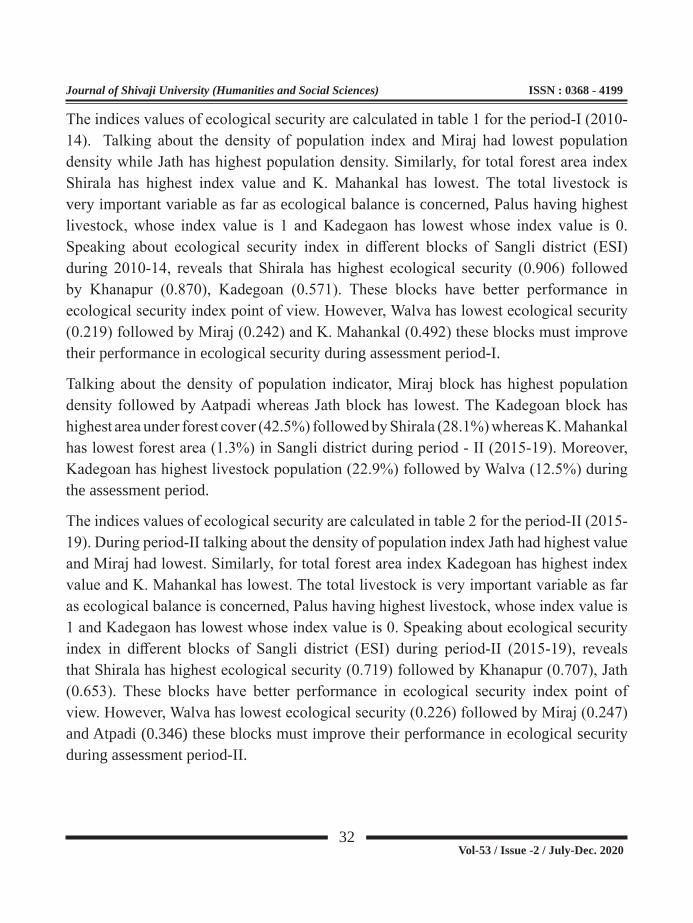
The indices values of ecological security are calculated in table 1 for the period-I (2010-14). Talking about the density of population index and Miraj had lowest population density while Jath has highest population density. Similarly, for total forest area index Shirala has highest index value and K. Mahankal has lowest. The total livestock is very important variable as far as ecological balance is concerned, Palus having highest livestock, whose index value is 1 and Kadegaon has lowest whose index value is 0. Speaking about ecological security index in different blocks of Sangli district (ESI) during 2010-14, reveals that Shirala has highest ecological security (0.906) followed by Khanapur (0.870), Kadegoan (0.571). These blocks have better performance in ecological security index point of view. However, Walva has lowest ecological security (0.219) followed by Miraj (0.242) and K. Mahankal (0.492) these blocks must improve their performance in ecological security during assessment period-I.
Talking about the density of population indicator, Miraj block has highest population density followed by Aatpadi whereas Jath block has lowest. The Kadegoan block has highest area under forest cover (42.5%) followed by Shirala (28.1%) whereas K. Mahankal has lowest forest area (1.3%) in Sangli district during period - II (2015-19). Moreover, Kadegoan has highest livestock population (22.9%) followed by Walva (12.5%) during the assessment period.
The indices values of ecological security are calculated in table 2 for the period-II (2015-19). During period-II talking about the density of population index Jath had highest value and Miraj had lowest. Similarly, for total forest area index Kadegoan has highest index value and K. Mahankal has lowest. The total livestock is very important variable as far as ecological balance is concerned, Palus having highest livestock, whose index value is 1 and Kadegaon has lowest whose index value is 0. Speaking about ecological security index in different blocks of Sangli district (ESI) during period-II (2015-19), reveals that Shirala has highest ecological security (0.719) followed by Khanapur (0.707), Jath (0.653). These blocks have better performance in ecological security index point of view. However, Walva has lowest ecological security (0.226) followed by Miraj (0.247) and Atpadi (0.346) these blocks must improve their performance in ecological security during assessment period-II.

33
Journal of Shivaji University (Humanities and Social Sciences) ISSN : 0368 - 4199
Vol-53 / Issue -2 / July-Dec. 2020
Table - 2Estimating Ecological Security Index (ESI) Indices of Sangli district in
Maharashtra Period-II (2015-2019)
Sr. No. Taluka
Total Forest Area
Density of Population
Total Livestock
Ecological Security
Index
ESI Ranking
1 Shirala 0.378 0.845 0.935 0.719 1
2 Walva 0.061 0.044 0.573 0.226 10
3 Palus 0.061 0.439 1.000 0.500 6
4 Khanapur 0.310 0.882 0.928 0.707 2
5 Atpadi 0.149 0.001 0.889 0.346 8
6 Tasgaon 0.091 0.780 0.618 0.496 7
7 Miraj 0.051 0.000 0.689 0.247 9
8 K. Mahankal 0.000 0.913 0.779 0.564 5
9 Jath 0.192 1.000 0.713 0.635 3
10 Kadegaon 1.000 0.861 0.000 0.620 4
Total Sangli (Avg) 0.229 0.576 0.712 0.506 -
Sources : Authors calculations
As per as ranking of ecological security index is concerned Shirala block is at number one followed by Khanapur, Jath, Kadegoan, K. Mahankal and least ranked block is Walva in Sangli district during period-II.
4.1.3 The Categorization of various Blocks based on Ecological Security Index (ESI) in Sangli District:
The categorization of different blocks based on Ecological Security Index value is explained in table 3. The indices are calculated for two periods i.e. Period I (2010-14) and Period II (2015-19) in Sangli District.

34
Journal of Shivaji University (Humanities and Social Sciences) ISSN : 0368 - 4199
Vol-53 / Issue -2 / July-Dec. 2020
Table 3The Categorization of various Blocks based on Ecological Security Index (ESI) in
Sangli District
Sr. No
Category ofESI Value
Blocks/PeriodPeriod I (2010-14) Period II (2015-19)
1 Very High(0.81 & Above) Shirala, Khanapur NIL
2 High(0.61 to 0.80) NIL Shirala, Khanapur, Jath and
Kadegoan
3 Medium(0.41 to 0.60)
Palus, Atpadi, Tasgoan, K. Mahankal, Jath and
Kadegoan
Palus, Tasgoan and K. Mahankal
4 Low(0.21 to 0.40) Walva and Miraj Walva, Atpadi and Miraj
5 Very Low(Below 0.20) NIL NIL
Source: Classified by Author
4.1.4 Net Change in Ecological Security Index (ESI) value during Assessment Period of Sangli District in Maharashtra:
The comparative analysis of ecological security index and net change in ESI value during two periods i.e. period-I and period-II. There are five blocks that have shown the positive change in ESI value, five blocks have shown negative change in ESI index. As far as highest positive increment is concerned Jath (+0.014) and K. Mahankal (+0.072) has shown increase in ESI and for negative increment, Aatpadi (-0.202) and Shirala (-0.187) shown highest decrease in ESI value during assessment period. The ecological security index has shown a decrease of (-0.037) during assessment periods i.e. Period I (2010-14) and Period II (2015-19) in Sangli District.
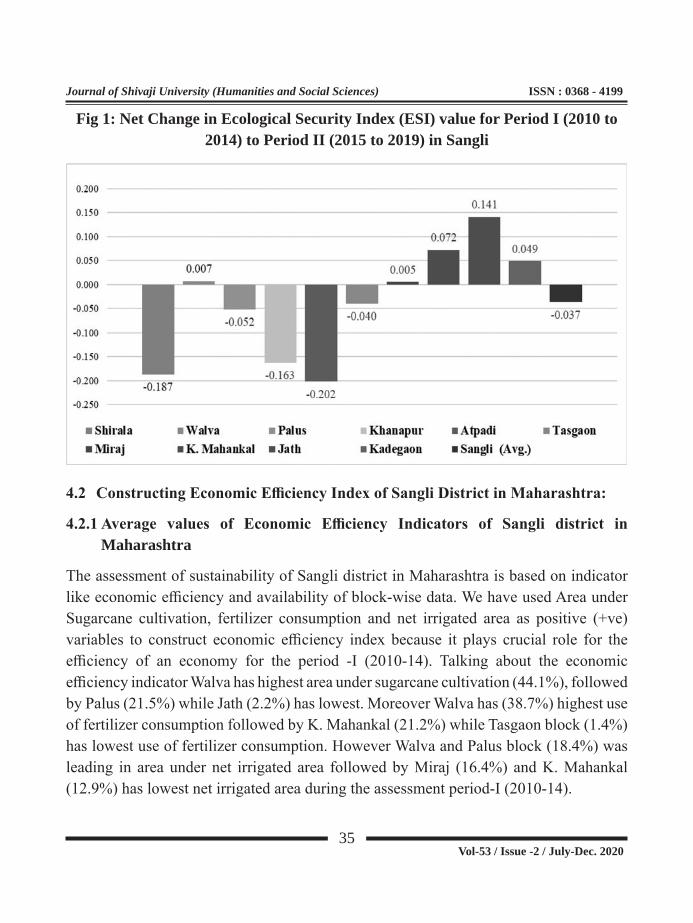
35
Journal of Shivaji University (Humanities and Social Sciences) ISSN : 0368 - 4199
Vol-53 / Issue -2 / July-Dec. 2020
Fig 1: Net Change in Ecological Security Index (ESI) value for Period I (2010 to 2014) to Period II (2015 to 2019) in Sangli
4.2 ConstructingEconomicEfficiencyIndexofSangliDistrictinMaharashtra:
4.2.1Average values of Economic Efficiency Indicators of Sangli district inMaharashtra
The assessment of sustainability of Sangli district in Maharashtra is based on indicator like economic efficiency and availability of block-wise data. We have used Area under Sugarcane cultivation, fertilizer consumption and net irrigated area as positive (+ve) variables to construct economic efficiency index because it plays crucial role for the efficiency of an economy for the period -I (2010-14). Talking about the economic efficiency indicator Walva has highest area under sugarcane cultivation (44.1%), followed by Palus (21.5%) while Jath (2.2%) has lowest. Moreover Walva has (38.7%) highest use of fertilizer consumption followed by K. Mahankal (21.2%) while Tasgaon block (1.4%) has lowest use of fertilizer consumption. However Walva and Palus block (18.4%) was leading in area under net irrigated area followed by Miraj (16.4%) and K. Mahankal (12.9%) has lowest net irrigated area during the assessment period-I (2010-14).

36
Journal of Shivaji University (Humanities and Social Sciences) ISSN : 0368 - 4199
Vol-53 / Issue -2 / July-Dec. 2020
4.2.2EstimatingEconomicEfficiencyIndex(ESI)ofSangliDistrictinMaharashtra:
The indices values of economic efficiency are calculated in table 4 for the period-I (2010-14). While estimating economic efficiency index during period-I, the Walva has highest Area under sugarcane cultivation index and fertilizer consumption index as well whereas Jath and Tasgoan has lowest respectively. Similarly, net irrigated area index value of Walva block is highest and Tasgoan is lowest during first period of assessment. Speaking about economic efficiency index in different blocks of Sangli district (EEI) during 2010-14 reveals that Walva has highest economic efficiency index (1.00) followed by Palus (0.636), K. Mahankal (0.393), and Miraj (0.360). These blocks have better performance in economic efficiency index point of view. However, Jath has lowest economic efficiency (0.090) followed by Tasgaon (0.010) and Atpadi (0.084), these blocks need more attention for better performance in economic efficiency of Sangli District during assessment period-I.
Table - 4EstimatingEconomicEfficiencyIndexIndicesofSangli district in Maharashtra
Period-I (2010-2014)
Sr. No. Taluka
Area under cultivation of
sugarcane
Fertilizer Consumption
Net Irrigated
Area
Economic Efficiency
Index
ESI Ranking
1 Shirala 0.228 0.245 0.020 0.166 72 Walva 1.000 1.000 1.000 1.000 13 Palus 0.459 0.450 1.000 0.636 24 Khanapur 0.158 0.304 0.270 0.244 55 Atpadi 0.088 0.164 0.000 0.084 86 Tasgaon 0.008 0.000 0.020 0.010 97 Miraj 0.243 0.088 0.750 0.360 48 K. Mahankal 0.322 0.531 0.320 0.393 39 Jath 0.000 0.026 0.240 0.090 10
10 Kadegaon 0.014 0.020 0.270 0.100 6Total Sangli (Avg.) 0.252 0.283 0.390 0.308 -Source: Compiled by author
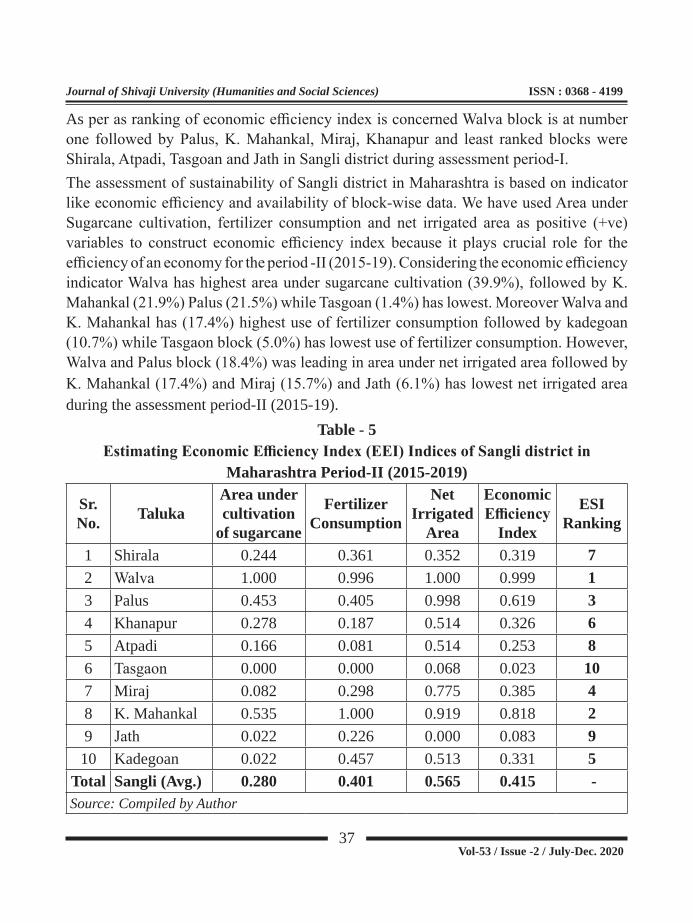
37
Journal of Shivaji University (Humanities and Social Sciences) ISSN : 0368 - 4199
Vol-53 / Issue -2 / July-Dec. 2020
As per as ranking of economic efficiency index is concerned Walva block is at number one followed by Palus, K. Mahankal, Miraj, Khanapur and least ranked blocks were Shirala, Atpadi, Tasgoan and Jath in Sangli district during assessment period-I.The assessment of sustainability of Sangli district in Maharashtra is based on indicator like economic efficiency and availability of block-wise data. We have used Area under Sugarcane cultivation, fertilizer consumption and net irrigated area as positive (+ve) variables to construct economic efficiency index because it plays crucial role for the efficiency of an economy for the period -II (2015-19). Considering the economic efficiency indicator Walva has highest area under sugarcane cultivation (39.9%), followed by K. Mahankal (21.9%) Palus (21.5%) while Tasgoan (1.4%) has lowest. Moreover Walva and K. Mahankal has (17.4%) highest use of fertilizer consumption followed by kadegoan (10.7%) while Tasgaon block (5.0%) has lowest use of fertilizer consumption. However, Walva and Palus block (18.4%) was leading in area under net irrigated area followed by K. Mahankal (17.4%) and Miraj (15.7%) and Jath (6.1%) has lowest net irrigated area during the assessment period-II (2015-19).
Table - 5EstimatingEconomicEfficiencyIndex(EEI)IndicesofSanglidistrictin
Maharashtra Period-II (2015-2019)
Sr.No. Taluka
Area under cultivation
of sugarcane
Fertilizer Consumption
Net Irrigated
Area
Economic Efficiency
Index
ESI Ranking
1 Shirala 0.244 0.361 0.352 0.319 72 Walva 1.000 0.996 1.000 0.999 13 Palus 0.453 0.405 0.998 0.619 34 Khanapur 0.278 0.187 0.514 0.326 65 Atpadi 0.166 0.081 0.514 0.253 86 Tasgaon 0.000 0.000 0.068 0.023 107 Miraj 0.082 0.298 0.775 0.385 48 K. Mahankal 0.535 1.000 0.919 0.818 29 Jath 0.022 0.226 0.000 0.083 910 Kadegoan 0.022 0.457 0.513 0.331 5
Total Sangli (Avg.) 0.280 0.401 0.565 0.415 -Source: Compiled by Author
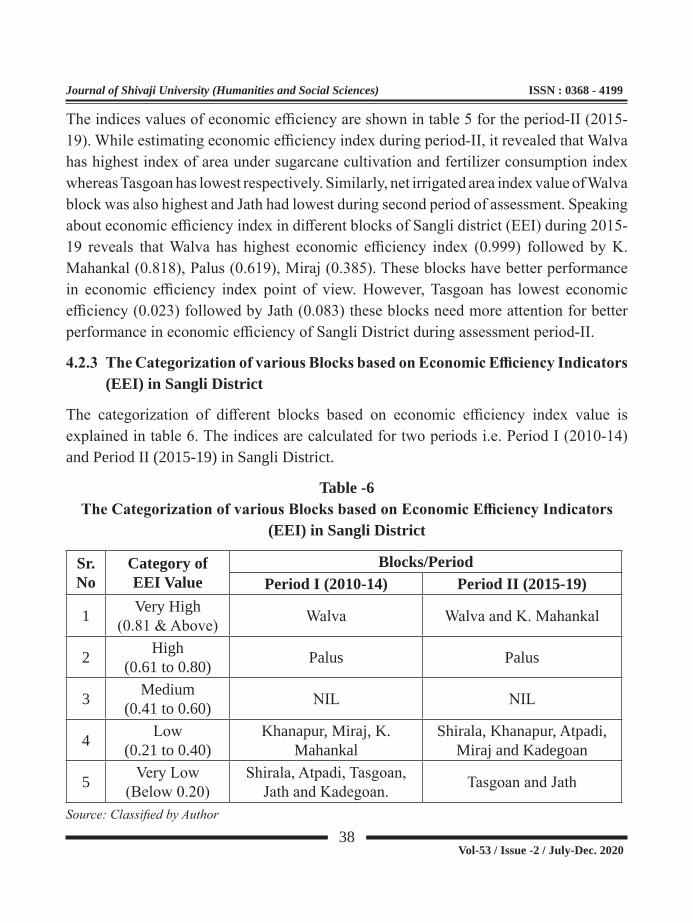
38
Journal of Shivaji University (Humanities and Social Sciences) ISSN : 0368 - 4199
Vol-53 / Issue -2 / July-Dec. 2020
The indices values of economic efficiency are shown in table 5 for the period-II (2015-19). While estimating economic efficiency index during period-II, it revealed that Walva has highest index of area under sugarcane cultivation and fertilizer consumption index whereas Tasgoan has lowest respectively. Similarly, net irrigated area index value of Walva block was also highest and Jath had lowest during second period of assessment. Speaking about economic efficiency index in different blocks of Sangli district (EEI) during 2015-19 reveals that Walva has highest economic efficiency index (0.999) followed by K. Mahankal (0.818), Palus (0.619), Miraj (0.385). These blocks have better performance in economic efficiency index point of view. However, Tasgoan has lowest economic efficiency (0.023) followed by Jath (0.083) these blocks need more attention for better performance in economic efficiency of Sangli District during assessment period-II.
4.2.3TheCategorizationofvariousBlocksbasedonEconomicEfficiencyIndicators(EEI) in Sangli District
The categorization of different blocks based on economic efficiency index value is explained in table 6. The indices are calculated for two periods i.e. Period I (2010-14) and Period II (2015-19) in Sangli District.
Table -6TheCategorizationofvariousBlocksbasedonEconomicEfficiencyIndicators
(EEI) in Sangli District
Sr.No
Category ofEEI Value
Blocks/PeriodPeriod I (2010-14) Period II (2015-19)
1 Very High(0.81 & Above) Walva Walva and K. Mahankal
2 High(0.61 to 0.80) Palus Palus
3 Medium(0.41 to 0.60) NIL NIL
4 Low(0.21 to 0.40)
Khanapur, Miraj, K. Mahankal
Shirala, Khanapur, Atpadi, Miraj and Kadegoan
5 Very Low(Below 0.20)
Shirala, Atpadi, Tasgoan, Jath and Kadegoan. Tasgoan and Jath
Source: Classified by Author

39
Journal of Shivaji University (Humanities and Social Sciences) ISSN : 0368 - 4199
Vol-53 / Issue -2 / July-Dec. 2020
4.2.4NetChangeinEconomicEfficiencyIndicators(EEI)valueduringAssessmentPeriod of Sangli District in Maharashtra
The comparative analysis of economic efficiency index and net change in ESI value during two periods i.e. period-I and period-II is shown in fig 2.
Figure 2NetChangeinEconomicEfficiencyIndex(EEI)valueforPeriodI(2010to2014)
to Period II (2015 to 2019) in Sangli
As shown in fig 2 there are eight blocks that have shown the positive change in EEI value and two blocks have shown negative changes in EEI index. As far as positive increment is concerned K. Mahankal (+0.425), Kadegoan (0.230), Atpadi (0.169), and Shirala (+0.153) has shown highest increase in EEI and for negative increment, Palus (-0.018) and Jath (-0.007) shown decrease in EEI value during assessment period. The economic efficiency index has shown an increase of (+0.107) during assessment periods i.e. Period I (2010-14) and Period II (2015-19) in Sangli District.
4.3 Constructing Social Equity Index of Sangli District in Maharashtra
Social equity indicators are one of the major assets, determines the livelihood status and sustainability. It includes the three major components, i.e., sex ratio, infant mortality rate and household below poverty line. Moreover, sex ratio is also one of the indicators of

40
Journal of Shivaji University (Humanities and Social Sciences) ISSN : 0368 - 4199
Vol-53 / Issue -2 / July-Dec. 2020
social equity, most of the developing countries facing the problem of gender inequality, females must be recognized as working population and pull them into the work force to support the development process of a country. Infant Mortality Rate and Household below Poverty line are negative indicators of social equity and plays a crucial role in assessment the social conditions and dimensions of standard of living and social equity level.
4.3.1 Average values of Social Equity Indicators of Sangli district in Maharashtra
Talking about the third indicator of sustainability i.e. social equity. We have used sex ratio as positive (+ve) variable and infant mortality rate, household below poverty line.as negative (-ve) variables to construct social equity for the period -I (2010-14. The blocks like Shirala and Kadegoan has highest sex ratio while Palus, Tasgoan and Miraj as lowest. K. Mahankal has highest infant mortality rate followed by Miraj and Jath blocks while Palus, Kadegoan, and Shirala blocks have lower IMR. Talking about the households below poverty line indicator, Walva has highest (15.48%) area households below poverty line followed by K. Mahankal (13.55%), Miraj (13.07%), whereas lowest in Atpadi (6.23%) in assessment period-I (2010-14).
4.3.2 Estimating Social Equity Index Indices of Sangli District in Maharashtra
The indices values of social equity are calculated in table 7 for the period-I (2010-14). The Shirala has highest sex ratio index followed by Kadegoan (0.490) and K. Mahankal (0.330) whereas, Tasgoan has lowest followed by Palus (0.030) and Khanapur (0.150). Moreover, Atpadi has highest IMR index followed by Shirala (0.976) and Palus (0.969) whereas K. Mahankal has lowest followed by Miraj (0.365). Similarly, households below poverty line index value of Atpadi block is highest followed by Khanapur (0.968) and Palus (0.869) whereas Walva block is lowest during first period of assessment. Speaking about social equity index (SEI) in different blocks of Sangli district during 2010-14 reveals that Shirala has highest social equity index (0.917) followed by Atpadi (0.754), Khanapur (0.687) and Kadegoan (0.659) these blocks have performed better in social equity index value. However, K. Mahankal has lowest social equity index (0.178) followed by Miraj (0.263) and Walva (0.320). Therefore, these blocks need more efforts for better performance in social equity of Sangli district during assessment period-I.
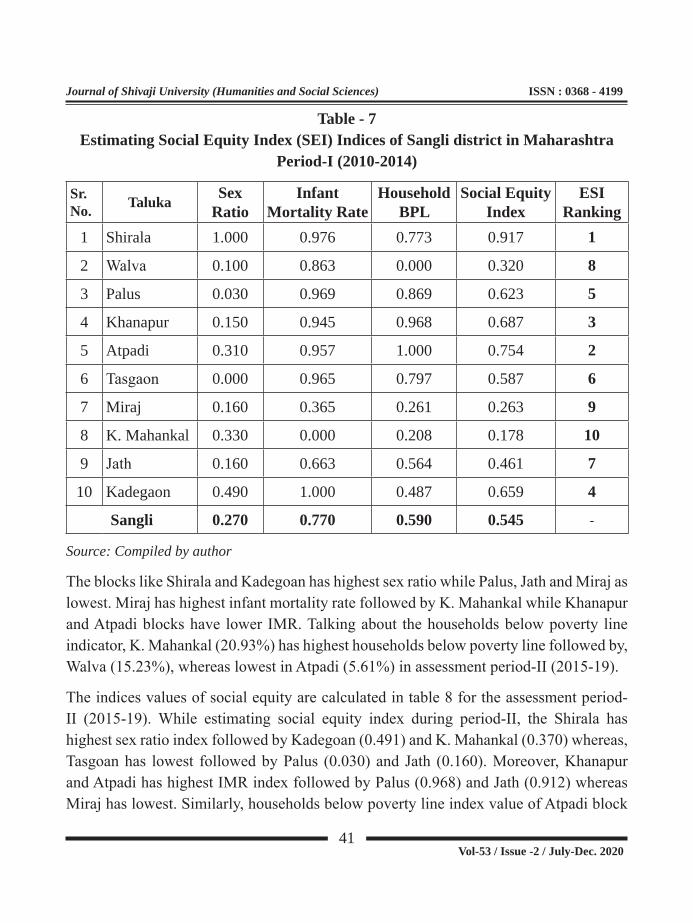
41
Journal of Shivaji University (Humanities and Social Sciences) ISSN : 0368 - 4199
Vol-53 / Issue -2 / July-Dec. 2020
Table - 7Estimating Social Equity Index (SEI) Indices of Sangli district in Maharashtra
Period-I (2010-2014)
Sr. No. Taluka Sex
RatioInfant
Mortality RateHousehold
BPLSocial Equity
IndexESI
Ranking1 Shirala 1.000 0.976 0.773 0.917 1
2 Walva 0.100 0.863 0.000 0.320 8
3 Palus 0.030 0.969 0.869 0.623 5
4 Khanapur 0.150 0.945 0.968 0.687 3
5 Atpadi 0.310 0.957 1.000 0.754 2
6 Tasgaon 0.000 0.965 0.797 0.587 6
7 Miraj 0.160 0.365 0.261 0.263 9
8 K. Mahankal 0.330 0.000 0.208 0.178 10
9 Jath 0.160 0.663 0.564 0.461 7
10 Kadegaon 0.490 1.000 0.487 0.659 4
Sangli 0.270 0.770 0.590 0.545 -
Source: Compiled by author
The blocks like Shirala and Kadegoan has highest sex ratio while Palus, Jath and Miraj as lowest. Miraj has highest infant mortality rate followed by K. Mahankal while Khanapur and Atpadi blocks have lower IMR. Talking about the households below poverty line indicator, K. Mahankal (20.93%) has highest households below poverty line followed by, Walva (15.23%), whereas lowest in Atpadi (5.61%) in assessment period-II (2015-19).
The indices values of social equity are calculated in table 8 for the assessment period-II (2015-19). While estimating social equity index during period-II, the Shirala has highest sex ratio index followed by Kadegoan (0.491) and K. Mahankal (0.370) whereas, Tasgoan has lowest followed by Palus (0.030) and Jath (0.160). Moreover, Khanapur and Atpadi has highest IMR index followed by Palus (0.968) and Jath (0.912) whereas Miraj has lowest. Similarly, households below poverty line index value of Atpadi block

42
Journal of Shivaji University (Humanities and Social Sciences) ISSN : 0368 - 4199
Vol-53 / Issue -2 / July-Dec. 2020
is highest followed by Khanapur (0.928) and Palus (0.905) whereas K. Mahankal block is lowest during second period of assessment. Speaking about social equity index (SEI) in different blocks of Sangli district during 2015-19 reveals that Shirala has highest social equity index (0.920) followed by Atpadi (0.753), Khanapur (0.692) and Jath (0.674) these blocks have performed better in social equity index. However, Miraj has lowest social equity index (0.308) followed by K. Mahankal (0.368) and Walva (0.454). Therefore, these blocks need more efforts for better performance in social equity of Sangli district during assessment period-II.
Table -8Estimating Social Equity Index (SEI) Indices of Sangli district in Maharashtra
Period-II (2015-2019)Sr.No. Taluka Sex
RatioInfant
Mortality RateHousehold
BPLSocial Equity
IndexSEI
Ranking1 Shirala 1.000 0.972 0.787 0.920 12 Walva 0.120 0.866 0.372 0.454 83 Palus 0.030 0.968 0.905 0.634 54 Khanapur 0.150 1.000 0.928 0.692 35 Atpadi 0.260 1.000 1.000 0.753 26 Tasgaon 0.000 0.995 0.853 0.616 77 Miraj 0.170 0.000 0.751 0.308 108 K. Mahankal 0.370 0.737 0.000 0.368 99 Jath 0.160 0.912 0.956 0.674 410 Kadegoan 0.491 0.802 0.585 0.626 6
Sangli 0.270 0.830 0.710 0.605 -Source: Compiled by author
4.3.3 The Categorization of various Blocks based on Social Equity Indicators (SEI) in Sangli District
The categorization of different blocks based on social equity index value is explained in table 9. The indices are calculated for two periods i.e. Period I (2010-14) and Period II (2015-19) in Sangli district.

43
Journal of Shivaji University (Humanities and Social Sciences) ISSN : 0368 - 4199
Vol-53 / Issue -2 / July-Dec. 2020
Table 9The Categorization of various Blocks based on Social Equity Indicators (SEI) in
Sangli DistrictSr.No
Category ofSEI Value
Blocks/PeriodPeriod I (2010-14) Period II (2015-19)
1 Very High(0.81 & Above) Shirala Shirala
2 High(0.61 to 0.80)
Palus, Khanapur, Atpadi and Kadegoan
Palus, Khanapur, Atpadi, Tasgoan, Jath and Kadegoan.
3 Medium(0.41 to 0.60) Tasgoan and Jath Walva
4 Low(0.21 to 0.40) Walva and Miraj Miraj and K. Mahankal
5 Very Low(Below 0.20) K. Mahankal
Source: Classified by Author
4.3.4 Net Change in Social Equity Indicators (SEI)) value during Assessment Period of Sangli District in Maharashtra
The comparative analysis of social equity index and net change in SEI value during two periods i.e. period-I and period-II is shown in fig 3. There is only one block that have shown the negative change in SEI value, rest eleven blocks have shown positive changes in SEI index. As far as positive increment is concerned Jath (+0.214) and K. Mahankal (+0.190) has shown highest increase in SEI during assessment periods and only Kadegoan (-0.033) has shown negative change in SEI in assessment period i.e. Period I (2010-14) and Period II (2015-19) in Sangli district.

44
Journal of Shivaji University (Humanities and Social Sciences) ISSN : 0368 - 4199
Vol-53 / Issue -2 / July-Dec. 2020
Figure 3Net Change in Social Equity Index (SEI) value for Period I (2010 to 2014) to
Period II (2015 to 2019)
4.4 Estimating Sustainable Livelihood Security Index (SLSI) of Sangli District In Maharashtra
The performance of sustainable livelihood security index (SLSI) and its component indices (ESI, EEI and SEI) of the different blocks of Sangli district is explained for both the periods i.e. period-I (2010-2014) and period-II (2015-2019).
4.4.1 Estimating Sustainable Livelihood Security Index (SLSI) of Sangli district in Maharashtra Period-I (2010-2014)
The assessment of sustainable livelihood security index (SLSI) and its component indices (ESI, EEI and SEI) of the different blocks are shown in Table 10 The results shows that SLSI has wide regional disparity in the sustainability in the different blocks of Sangli district. Speaking about the three indicators of sustainability in different blocks of Sangli district during the period -I. Ecological security Index (ESI) of Sangli district is 0.543, in which Shirala has highest ecological security (0.906) followed by Khanapur (0.870), Kadegoan (0.571), and Palus (0.552). These blocks have better performance in ecological security index. However, Walva has lowest ecological security (0.219) followed by Miraj (0.242). The economic efficiency index of Sangli district is 0.308, in which Walva has
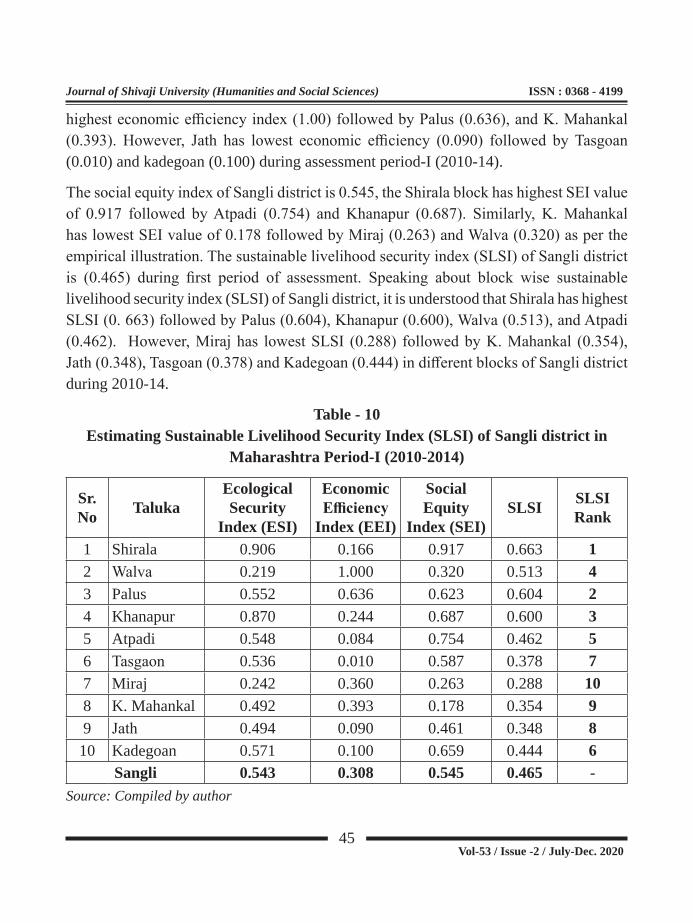
45
Journal of Shivaji University (Humanities and Social Sciences) ISSN : 0368 - 4199
Vol-53 / Issue -2 / July-Dec. 2020
highest economic efficiency index (1.00) followed by Palus (0.636), and K. Mahankal (0.393). However, Jath has lowest economic efficiency (0.090) followed by Tasgoan (0.010) and kadegoan (0.100) during assessment period-I (2010-14).
The social equity index of Sangli district is 0.545, the Shirala block has highest SEI value of 0.917 followed by Atpadi (0.754) and Khanapur (0.687). Similarly, K. Mahankal has lowest SEI value of 0.178 followed by Miraj (0.263) and Walva (0.320) as per the empirical illustration. The sustainable livelihood security index (SLSI) of Sangli district is (0.465) during first period of assessment. Speaking about block wise sustainable livelihood security index (SLSI) of Sangli district, it is understood that Shirala has highest SLSI (0. 663) followed by Palus (0.604), Khanapur (0.600), Walva (0.513), and Atpadi (0.462). However, Miraj has lowest SLSI (0.288) followed by K. Mahankal (0.354), Jath (0.348), Tasgoan (0.378) and Kadegoan (0.444) in different blocks of Sangli district during 2010-14.
Table - 10Estimating Sustainable Livelihood Security Index (SLSI) of Sangli district in
Maharashtra Period-I (2010-2014)
Sr. No Taluka
Ecological Security
Index (ESI)
Economic Efficiency
Index (EEI)
Social Equity
Index (SEI)SLSI SLSI
Rank
1 Shirala 0.906 0.166 0.917 0.663 12 Walva 0.219 1.000 0.320 0.513 43 Palus 0.552 0.636 0.623 0.604 24 Khanapur 0.870 0.244 0.687 0.600 35 Atpadi 0.548 0.084 0.754 0.462 56 Tasgaon 0.536 0.010 0.587 0.378 77 Miraj 0.242 0.360 0.263 0.288 108 K. Mahankal 0.492 0.393 0.178 0.354 99 Jath 0.494 0.090 0.461 0.348 810 Kadegoan 0.571 0.100 0.659 0.444 6
Sangli 0.543 0.308 0.545 0.465 -Source: Compiled by author
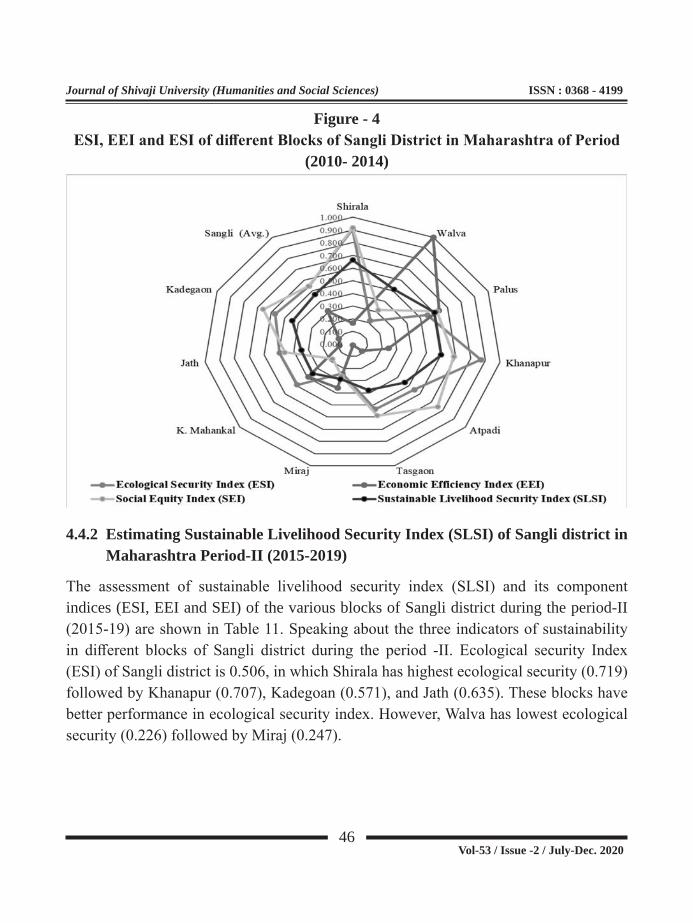
46
Journal of Shivaji University (Humanities and Social Sciences) ISSN : 0368 - 4199
Vol-53 / Issue -2 / July-Dec. 2020
Figure - 4 ESI,EEIandESIofdifferentBlocksofSangliDistrictinMaharashtraofPeriod
(2010- 2014)
4.4.2 Estimating Sustainable Livelihood Security Index (SLSI) of Sangli district in Maharashtra Period-II (2015-2019)
The assessment of sustainable livelihood security index (SLSI) and its component indices (ESI, EEI and SEI) of the various blocks of Sangli district during the period-II (2015-19) are shown in Table 11. Speaking about the three indicators of sustainability in different blocks of Sangli district during the period -II. Ecological security Index (ESI) of Sangli district is 0.506, in which Shirala has highest ecological security (0.719) followed by Khanapur (0.707), Kadegoan (0.571), and Jath (0.635). These blocks have better performance in ecological security index. However, Walva has lowest ecological security (0.226) followed by Miraj (0.247).

47
Journal of Shivaji University (Humanities and Social Sciences) ISSN : 0368 - 4199
Vol-53 / Issue -2 / July-Dec. 2020
Table - 11Estimating Sustainable Livelihood Security Index (SLSI) of Sangli district in
Maharashtra Period-II (2015-2019)
Sr. No. Taluka
Ecological Security
Index (ESI)
Economic Efficiency
Index (EEI)
Social Equity
Index (SEI)SLSI SLSI
Ranking
1 Shirala 0.719 0.319 0.920 0.653 1
2 Walva 0.226 0.999 0.454 0.560 5
3 Palus 0.500 0.619 0.634 0.584 2
4 Khanapur 0.707 0.326 0.692 0.575 4
5 Atpadi 0.346 0.253 0.753 0.451 8
6 Tasgaon 0.496 0.023 0.616 0.378 9
7 Miraj 0.247 0.385 0.308 0.313 10
8 K. Mahankal 0.564 0.818 0.368 0.583 3
9 Jath 0.635 0.083 0.674 0.464 7
10 Kadegoan 0.620 0.331 0.626 0.526 6
Sangli 0.506 0.415 0.605 0.509
Source: Compiled by author
The economic efficiency index of Sangli district is 0.415, in which Walva has highest economic efficiency index (0.999) followed by K. Mahankal (0.818) and Palus (0.619). However, Tasgoan (0.023) has lowest economic efficiency followed by Jath (0.083) and Atpadi (0.253) during assessment period-II (2015-19). The social equity index of Sangli district is 0.605, the Shirala block has highest SEI value of 0.920 followed by Atpadi (0.753) and Khanapur (0.692). Similarly, Miraj has lowest SEI value of 0.308 followed by K. Mahankal (0.368) and Walva (0.454) as per the empirical illustration.
The sustainable livelihood security index (SLSI) of Sangli district is (0.509) during second period of assessment. Speaking about block wise sustainable livelihood security index (SLSI) of Sangli district, it is understood that Shirala has highest SLSI (0. 653)
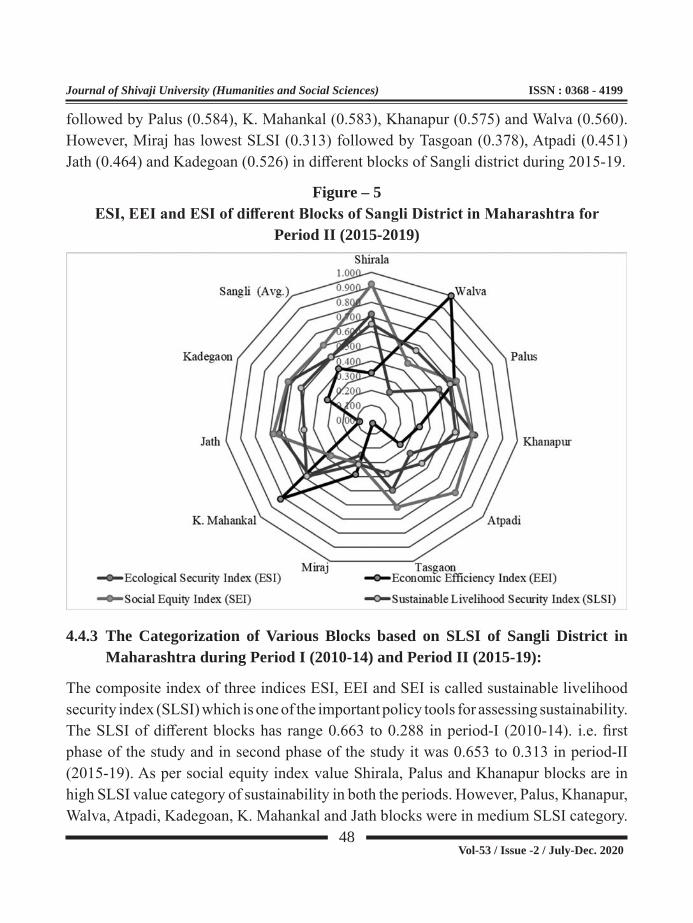
48
Journal of Shivaji University (Humanities and Social Sciences) ISSN : 0368 - 4199
Vol-53 / Issue -2 / July-Dec. 2020
followed by Palus (0.584), K. Mahankal (0.583), Khanapur (0.575) and Walva (0.560). However, Miraj has lowest SLSI (0.313) followed by Tasgoan (0.378), Atpadi (0.451) Jath (0.464) and Kadegoan (0.526) in different blocks of Sangli district during 2015-19.
Figure – 5ESI,EEIandESIofdifferentBlocksofSangliDistrictinMaharashtrafor
Period II (2015-2019)
4.4.3 The Categorization of Various Blocks based on SLSI of Sangli District in Maharashtra during Period I (2010-14) and Period II (2015-19):
The composite index of three indices ESI, EEI and SEI is called sustainable livelihood security index (SLSI) which is one of the important policy tools for assessing sustainability. The SLSI of different blocks has range 0.663 to 0.288 in period-I (2010-14). i.e. first phase of the study and in second phase of the study it was 0.653 to 0.313 in period-II (2015-19). As per social equity index value Shirala, Palus and Khanapur blocks are in high SLSI value category of sustainability in both the periods. However, Palus, Khanapur, Walva, Atpadi, Kadegoan, K. Mahankal and Jath blocks were in medium SLSI category.

49
Journal of Shivaji University (Humanities and Social Sciences) ISSN : 0368 - 4199
Vol-53 / Issue -2 / July-Dec. 2020
Moreover, Tasgoan and Miraj blocks was in low SLSI category. No block was found in either very high or very low SLSI category of sustainability during both the assessment periods.
Table- 12Categorization of Various Blocks based on SLSI of Sangli District in Maharashtra
during Period I (2010-14) and Period II (2015-19)
Sr. No. Category of SLSI Value
Block Period I (2010-2014) Period II (2015-2019)
1. Very High(0.81 Above) NIL NIL
2. High(0.61 to 0.80)
Shirala, Palus and Khanapur Shirala
3. Medium(0.41 to 0.60)
Walva, Atpadi and Kadegoan
Palus, Khanapur, Walva, Atpadi, Kadegoan, K.
Mahankal and Jath
4. Low (0.21 to 0.40) Tasgoan, Miraj and K. Mahankal and Jath Tasgoan and Miraj
5. Very Low(Below 0.20) NIL NIL
Source: Compiled by author
4.4.4 Estimating Net Change in Sustainable Livelihood Security Index (SLSI) of Sangli district in Maharashtra during Period I (2010-2014) to Period-II (2015-2019):
Table 13 reveals that the comparative analysis of SLSI and Net change in SLSI value during Period I (2010-2014) to Period-II (2015-2019). Six blocks which have shown a positive change in SLSI value, rest four blocks have negative changes in SLSI index of Sangli district during assessment period. The SLSI index value of Sangli district had increased from 0.465 to 0.509 i.e. positive change of +0.043 during Period I (2010-2014) to Period-II (2015-2019).

50
Journal of Shivaji University (Humanities and Social Sciences) ISSN : 0368 - 4199
Vol-53 / Issue -2 / July-Dec. 2020
Table – 13 Estimating Net Change in Sustainable Livelihood Security Index (SLSI) of Sangli
district in Maharashtra during Period I (2010-2014) to Period-II (2015-2019)
Sr. No.
Sustainable Livelihood Security Index (SLSI) Net Change in SLSITaluka Period I (2010-2014) Period II (2015-2019)
1 Shirala 0.663 0.653 -0.0102 Walva 0.513 0.560 0.0473 Palus 0.604 0.584 -0.0194 Khanapur 0.600 0.575 -0.0255 Atpadi 0.462 0.451 -0.0116 Tasgaon 0.378 0.378 0.0017 Miraj 0.288 0.313 0.0258 K. Mahankal 0.354 0.583 0.2299 Jath 0.348 0.464 0.11610 Kadegoan 0.444 0.526 0.082
Sangli 0.465 0.509 0.043
Source: Compiled by author
As far as positive SLSI increment is concerned Walva (+0.047), Tasgoan (+0.001), Miraj (+0.025), K. Mahankal (+0.229), Jath (+0.116) and Kadegoan (+0.082). The blocks shown negative changes in SLSI are Shirala (-0.010), Palus (-0.019), Khanapur (-0.025) and Atpadi (-0.011) during assessment period. The sustainable livelihood security index of Sangli district has shown positive increment of +0.043 in net change in SLSI during Period I (2010-2014) to Period-II (2015-2019)
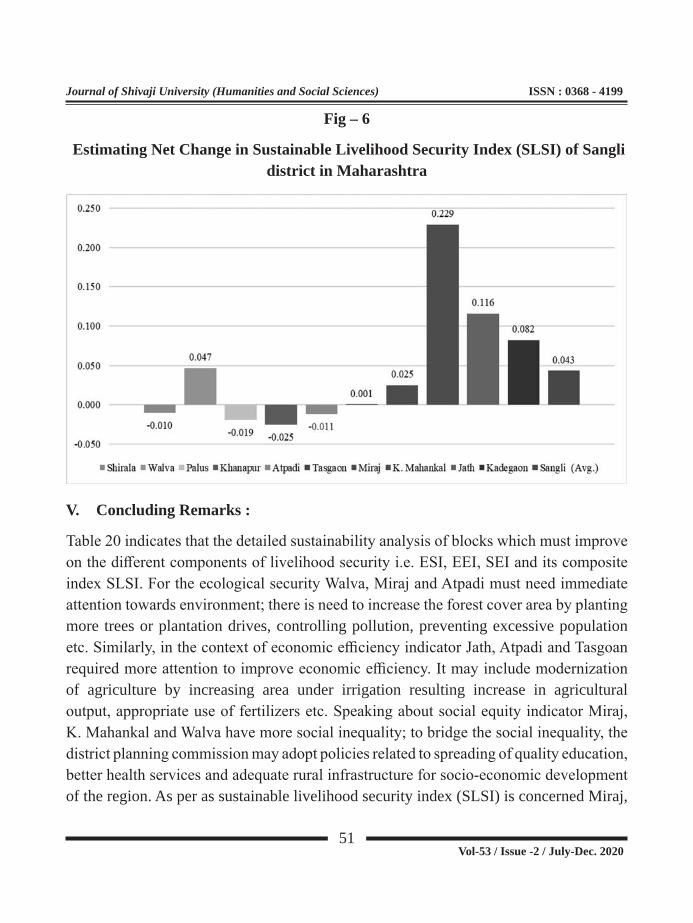
51
Journal of Shivaji University (Humanities and Social Sciences) ISSN : 0368 - 4199
Vol-53 / Issue -2 / July-Dec. 2020
Fig – 6
Estimating Net Change in Sustainable Livelihood Security Index (SLSI) of Sangli district in Maharashtra
V. Concluding Remarks :
Table 20 indicates that the detailed sustainability analysis of blocks which must improve on the different components of livelihood security i.e. ESI, EEI, SEI and its composite index SLSI. For the ecological security Walva, Miraj and Atpadi must need immediate attention towards environment; there is need to increase the forest cover area by planting more trees or plantation drives, controlling pollution, preventing excessive population etc. Similarly, in the context of economic efficiency indicator Jath, Atpadi and Tasgoan required more attention to improve economic efficiency. It may include modernization of agriculture by increasing area under irrigation resulting increase in agricultural output, appropriate use of fertilizers etc. Speaking about social equity indicator Miraj, K. Mahankal and Walva have more social inequality; to bridge the social inequality, the district planning commission may adopt policies related to spreading of quality education, better health services and adequate rural infrastructure for socio-economic development of the region. As per as sustainable livelihood security index (SLSI) is concerned Miraj,
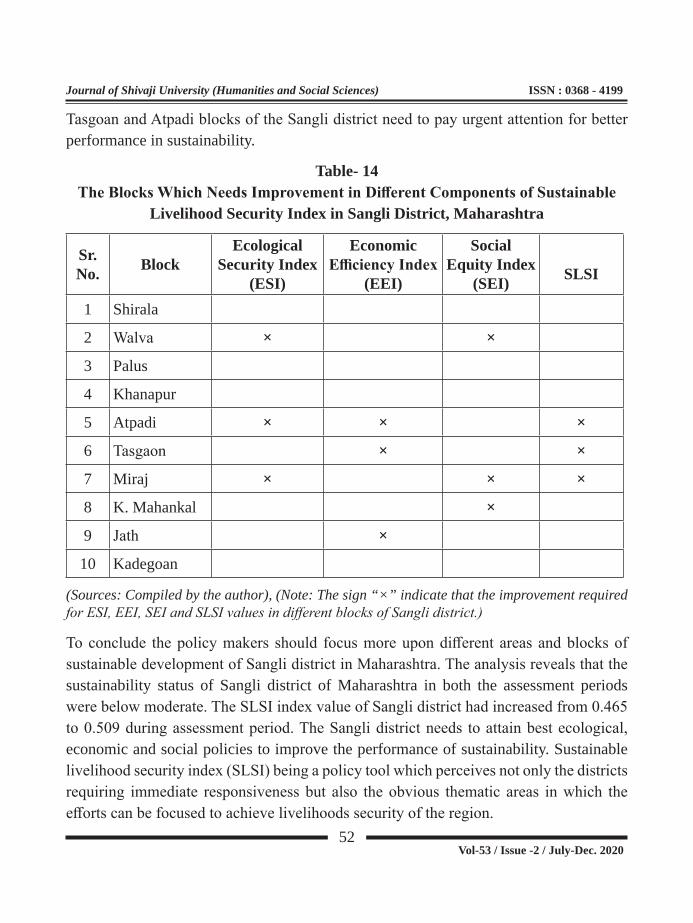
52
Journal of Shivaji University (Humanities and Social Sciences) ISSN : 0368 - 4199
Vol-53 / Issue -2 / July-Dec. 2020
Tasgoan and Atpadi blocks of the Sangli district need to pay urgent attention for better performance in sustainability.
Table- 14TheBlocksWhichNeedsImprovementinDifferentComponentsofSustainable
Livelihood Security Index in Sangli District, Maharashtra
Sr. No. Block
Ecological Security Index
(ESI)
Economic EfficiencyIndex
(EEI)
Social Equity Index
(SEI) SLSI
1 Shirala
2 Walva × ×
3 Palus
4 Khanapur
5 Atpadi × × ×
6 Tasgaon × ×
7 Miraj × × ×
8 K. Mahankal ×
9 Jath ×
10 Kadegoan
(Sources: Compiled by the author), (Note: The sign “×” indicate that the improvement required for ESI, EEI, SEI and SLSI values in different blocks of Sangli district.)
To conclude the policy makers should focus more upon different areas and blocks of sustainable development of Sangli district in Maharashtra. The analysis reveals that the sustainability status of Sangli district of Maharashtra in both the assessment periods were below moderate. The SLSI index value of Sangli district had increased from 0.465 to 0.509 during assessment period. The Sangli district needs to attain best ecological, economic and social policies to improve the performance of sustainability. Sustainable livelihood security index (SLSI) being a policy tool which perceives not only the districts requiring immediate responsiveness but also the obvious thematic areas in which the efforts can be focused to achieve livelihoods security of the region.

53
Journal of Shivaji University (Humanities and Social Sciences) ISSN : 0368 - 4199
Vol-53 / Issue -2 / July-Dec. 2020
5. References:
1. Barbier, E.B. (1987). The concept of sustainable Economic Development, Environment Conservation, Vol.14-2, pp 101-110
2. Chambers, R. (1986). Sustainable livelihoods: An opportunity for the World Commission on Environment and Development. Institute of Development Studies, University of Sussex, Brighton, UK.
3. Conway, G. (1985). Agro Ecosystem Analysis, Agricultural Administration, Vol.20-1, pp-31-35
4. Daly, Herman, E. (1992). Allocation, Distribution and scale: Towards an Economics that is Efficient, Just and Sustainable, Ecological Economics, Vol. 6-2, pp-185-193
5. FAO (1991). Sustainable agriculture and rural development in Asia and Pacific, Regional document No.2, FAO/ Netherlands conference on Agriculture and Environment, Hertogenbosch. The Netherlands, 15-19 April.
6. Government of India (2001). Census Report, Office of the Registrar General & Census Commissioner, India
7. Government of India (2011). Census Report, Office of the Registrar General & Census Commissioner, India.
8. Government of Maharashtra (2009-19). Socio-Economic of Sangli District, Directorate of Economics and Statistics, Planning Department, Government of Maharashtra, Mumbai.
9. Hatai, L. D., and C. Sen. (2008). An economic analysis of agricultural sustainability in Orissa. Agricultural Economics Research Review, pg: 273–282.
10. Harron, Iffat and Shahzad (2014). Assessing spatiotemporal variation in Agricultural Sustainability Using Sustainable Livelihood Security Index: Empirical Illustration from Vaishali District of Bihar, India, Agro ecology and sustainable food system, 11 May 2014, published by Taylor & Francis.
11. Kareemulla, Venkattakumar and Samuel (2017). An analysis on agricultural sustainability in India. Current Science, 25 January 2017, pg: 258-266

54
Journal of Shivaji University (Humanities and Social Sciences) ISSN : 0368 - 4199
Vol-53 / Issue -2 / July-Dec. 2020
12. MOSP (2018-2019). Ministry of Statistics and Programme implementation, Government of India
13. Swaminathan, M. S. (1991). From Stockholm to Rio de Janeiro: The road to sustainable agriculture, M. S Swaminathan Research institution. Madras, India.
14. Singh, P. K., and B. N. Hiremath. (2010). Sustainable livelihood security index in a developing country: A tool for development planning. Ecological Indicators, October- 2010, pg: 442–451.
15. Saleth, R. M., and M. S. Swaminathan. (1993). Sustainable livelihood security at the household level: Concept and evaluation methodology. In Proceedings of an interdisciplinary dialogue on eco technology and rural employment, April 12–15, pg: 105–122. Madras, India.
16. World Commission on Environment and Development. (1987), our common future, Oxford University Press. New York.
Acknowledgement: The authors are thankful to Indian Council of Social Science Research (ICSSR), New Delhi for providing the financial support to major research project titled “An analysis of sustainable livelihood security in western Maharashtra”

55
Journal of Shivaji University (Humanities and Social Sciences) ISSN : 0368 - 4199
Vol-53 / Issue -2 / July-Dec. 2020
IMPACT OF COVID-19 ON INDIAN PRINT MEDIA 3Dr. Shivaji Jadhav
1. Assistant Professor, Department of Journalism and Mass Communication, Shivaji University, Kolhapur (Maharashtra) Email – [email protected]
Abstract
India has a glorious tradition of print media since pre-independence times. The Indian print media had a significant role to play in securing independence. After independence, various forms of media have made a great contribution in inculcating democratic values. Accurate, factual and objective reporting is the key to maintaining the credibility of the print media. Indian readers are more trusted in print media than electronic and web media. With the spread of the Corona, the country’s print media has faced many challenges. The print media is in a dilemma on many levels such as news gathering, advertising, distribution, finance. Some journalists have even been tested positive for COVID-19. Many media groups have slashed production costs. Newspapers showed exit doors to many employees on account Covid-19. Some newspapers announced furlough. All major newspaper groups in the country have slashed the salaries of their employees. The print media is in big financial trouble due to declining advertising income. The effects of corona on the Indian print media are studied in the present research paper.
Keywords : Corona, Indian Print Media, Cost Cutting, Financial Crisis
I. Introduction
The British era marked the beginning of newspapers in India. The first newspaper in India, started by James August Hickey, had to constantly fight for freedom of expression. The pre-independence Indian newspapers also carried on the struggle for independence. Indian readers have strong faith in the print media. There were many crises in the print media but with the support of the readers, the print media in the country continued to expand. Many newspapers and magazines are regularly published at national, regional

56
Journal of Shivaji University (Humanities and Social Sciences) ISSN : 0368 - 4199
Vol-53 / Issue -2 / July-Dec. 2020
and local levels. Regional and district journalism in particular raised the issue of local development. The print media in India has contributed to increasing public participation in the development process. Locally published small and medium newspapers as well as Indian language journalism have given impetus to India’s development. According to Tara S. Nair (2003) the political movement in India shifted from the center to the states between the 1960s and the 1990s. It was during this period that powerful classes and groups emerged. This transition was accelerated by the changing role of language while local issues were gaining importance. This transformed the Indian print media into a large economic and social structure.
After 1990, India became involved in the process of globalization. In the years that followed, the Indian print media changed dramatically. The Indian media world opened up to foreign media groups for the first time. This led to a major revolution in content and technology in the Indian media. As a result, there was professionalism in the print media. Newspapers run as a mission or goal became a commodity. This made the management of print media more commercial. India, the largest democracy in the world today, supports over 82,000 registered newspapers with a cumulative daily circulation of 11 crore and is estimated to represent an industry turnover of Rs. 32,000 crore. As India has been improving its literacy rate up to 75 per cent, more citizens now develop the capacity and resources to access newspapers and digital forums. The country’s print media has been hit by a number of crises, including the global recession, domestic disasters and inflation. But through all of this, the print media persevered. However, the current Pandemic of COVID-19 has broken the backbone of newspapers.
II. Objectives and Data Collection
Covid-19 is adversely affecting all regions of the world. The media sector is no exception. Two objectives have been set for the presented research paper. 1. To study the impact of COVID-19 on the print media in India and 2. To know what measures have been taken by the print media in India to overcome the situation created by COVID-19. Secondary sources have been used for this research paper. Research conducted in various countries around the world, Corona’s impact on the media and the corresponding information

57
Journal of Shivaji University (Humanities and Social Sciences) ISSN : 0368 - 4199
Vol-53 / Issue -2 / July-Dec. 2020
disseminated from various newspapers as well as official websites have been used as references. It is presented in the research paper by analyzing the information based on secondary sources. It is also based on some reference texts.
III. Results and Discussions :
Lockdown disrupts newspapers
According to Unnithan P S Gopikrishnan (2020), India’s first Covid-19 patient was found on January 30, 2020 in Kerala. A student from Wuhan University in China returned to Kerala and tested positive. The Union Ministry of Health tweeted this information. After this, COVID-19 was introduced in India. As the number of COVID-19 patients increased, a lockdown was declared by the Central and State Governments. This hit the country’s print media. As mentioned by Ranjona Banerjee (2020), the lockdown cooled the production of newspapers and magazines. There were also problems with the distribution system. As a result, the print media across the country was disrupted. Fear of the corona virus spreading through newspapers was expressed on social media. Many readers stopped handling newspapers. Distributors also refused to distribute newspapers. Transportation of newspapers were also shut down due to the lockdown. In this unfavorable situation, the management had no choice but to stop the production of newspapers.
Indian readers are much habituated to newspapers. There is a very large class reading newspapers every morning with tea. The lockdown of this class caused a commotion. Most of the Indian readers trust the information coming from the newspapers. Although information is available through electronic and web media, the credibility of print media in the country is still highly regarded. As reported by Gaurav Laghate (2020), the viewership of electronic media and mobile consummation increased during the period when the distribution of newspapers was stopped. At the same time, Indians used web media extensively to meet the need for information. According to figures released by the Broadcasting Audience Research Council in March 2020, the number of Indian TV viewers increased by 8 per cent during the lockdown. Smartphone access has increased

58
Journal of Shivaji University (Humanities and Social Sciences) ISSN : 0368 - 4199
Vol-53 / Issue -2 / July-Dec. 2020
by 6.2 per cent. This meant that the reader turned to electronic and web media during the time when newspapers were closed. At the same time, the newspapers also tried to provide objective and reliable information to the readers through their web editions. Although the production of the newspaper was stopped, the journalists of the print media were collecting information and distributing the information through web editions. Most of the newspapers in the country made e-papers available to the readers. The issue was designed to be able to read newspapers on mobile. Some magazines published mobile editions.
Newspaper circulation declined
Covid-19 caused many adverse effects on newspapers as well as periodicals. As observed by Amrita Nayak-Datta (2020), the most significant of these was the reduction in circulation of most newspapers and magazines. Newspapers in India are constantly competing to increase circulation, but due to the lockdown the newspapers could not reach the readers. Corona virus does not spread through newspapers, explained Union Information and Broadcasting Minister Prakash Javadekar in a tweet. The production and distribution of newspapers in the country resumed thereafter. However, due to doubts in the minds of the readers about the newspaper, many readers stopped the subscription which is delivered to home. This is also one of the reasons for the decline in circulation. Newspapers were shut down from March 23, 2020 to March 31, 2020 in Mumbai and other parts of Maharashtra. This created panic in the minds of the readers about the newspaper. No matter how many times it has been said since then that the corona virus does not spread through newspapers, the general reader still does not believe it. This has been a major setback for the print media in India. The government included newspapers in the category of essential commodities. As a result, newspapers began to be published as before. A statement was also published on behalf of the major newspapers in India, stating that corona is not transmitted through newspapers. These included Dainik Bhaskar, Dainik Jagran, Inadu, Hindustan Times, Amar Ujala, Sakshi, Deccan Herald and other media groups. Some newspapers disinfected the newspaper by spraying sanitizer on it while it was in print. Newspaper vendors were provided with masks, sanitizers and hand
59
Journal of Shivaji University (Humanities and Social Sciences) ISSN : 0368 - 4199
Vol-53 / Issue -2 / July-Dec. 2020
gloves, but it was not used much. According to Gaurav Vivek Bhatnagar (2020), print orders of newspapers in the capital Delhi had declined by 90 per cent. This gives an idea of how much the newspaper circulation in India had declined during this period. Although the publication of newspapers was reversed in later times, it was not possible for the newspapers to reach the circulation figure as in the past.
Financial crisis due to lack of advertisements
All public events were canceled or postponed due to COVID-19. Many sports competitions were either suspended or postponed. All economic cycles, including real estate, bullion markets, political events, came to a standstill. This hit the print media hard. Advertisements in newspapers and magazines stopped and the print media faced a major financial crisis. The production cost of print media is high. Thus media get into trouble if sufficient amount of revenue is not generated. Advertising business was badly affected by this. As a result, small and medium newspapers with large media groups have found themselves in trouble. According to figures released by the Indian Newspaper Society (INS), the print media has suffered a staggering loss of Rs 4,500 crore in the two months of March and April 2020. In the next seven months, the loss is expected to be more than Rs 15,000 crore, the agency said; more than 3 million people are connected to the print media business in India. The print media has provided direct employment to over 10 lakh people. More than 20 lakh people are indirectly dependent on this industry. Therefore, the Indian Newspaper Society has taken a stand that the central government should take this sector seriously. Newsprint currently has a 5 per cent customs duty. The INS has requested the central government to waive the tax. The organization has written a letter requesting the central government to help the country’s print media. According to a report published by Anushree Bhattacharya (2020), advertising revenue for all national, regional and local newspapers has declined. As a result of Kovid-19, the country’s print media will face a serious financial crisis in the near future.
Cost cutting in the newspaper
After the decline in advertising revenue, the print media in India began to gain control

60
Journal of Shivaji University (Humanities and Social Sciences) ISSN : 0368 - 4199
Vol-53 / Issue -2 / July-Dec. 2020
over spending. Management began working on how to minimize production costs. The management emphasized on publishing the newspaper with minimum manpower to avoid unnecessary expenses. The number of pages of newspapers was reduced to compensate the costs. Weekly supplements with newspapers stopped. The print media is in crisis in many parts of the world, including India. The US weekly India Abroad had to close down due to COVID-19. This newspaper has been running for the last fifty years. The newspaper was started by Gopal Raju in 1970 with the needs of American Indians in mind. According to Simran Sabharwal (2020), the print edition of ‘Sportstar’, a fortnightly magazine published by the prestigious ‘The Hindu’ group in India, has been suspended for some time. The Hindu group tweeted this information. The fortnightly, which has been publishing for the last 43 years due to the Corona virus, had to be suspend, the tweet said. In Kerala, the Times of India is shutting down two of the four editions, according to a report published by the web portal News Laundry. Kochi Post has claimed that two editions of Malabar and Thiruvananthapuram will be closed. This shows the serious impact of COVID-19on the print media. The country’s leading newspaper, Hindustan Times, did not publish Sunday’s supplement HT Weekend separately but instead in its main issue. The decision was announced by the management as the number of staff in the office was low. The Indian Newspaper Society (INS) in a letter to the Union Ministry of Information and Broadcasting has mentioned that many newspapers in the country have reduced the number of pages. The financial crisis of newspapers is growing every day. INS has also requested the central government to intervene.
Newspapers instructed their employees to work from home to prevent corona infection. The country’s leading newspapers encouraged journalists to work from home. Meetings were held using video conferencing, Google Duo or Zoom app as well as some other web platforms. Covid-19 caused many changes in the style of work of the newspaper. Most newspapers decided to work from home but many journalists have to work on the field. Many journalists are risking their lives while reporting on the corona virus. Visiting Containment zones resulted in journalists being affected with COVID-19. This includes journalists in print as well as electronic media in India. In April 2020, a health check-up

61
Journal of Shivaji University (Humanities and Social Sciences) ISSN : 0368 - 4199
Vol-53 / Issue -2 / July-Dec. 2020
camp for journalists was held in Mumbai. At the same time, 53 journalists were found to be corona positive. This gives an idea of how much risk journalists in the country are taking while collecting information. This number could increase if all journalists in the country undergo a health check-up.
Jobs gone, wages cut
Newspapers in India found themselves in financial difficulties due to Kovid-19. Newspapers showed exit doors to many employees on account Covid-19. Some newspapers announced furlough. All major newspaper groups in the country have slashed the salaries of their employees. The Indian Express Group has announced a pay cut for its employees. Corona has adversely affected advertising revenue. Therefore, the Indian Express has given an explanation that the salaries of the employees have to be reduced. There will be no reduction in the salaries of employees with an annual salary of less than Rs 5 lakh. The salaries of employees with an annual income of Rs 5 lakh to Rs 7.50 lakh have been reduced by 10 per cent. The salaries of employees earning Rs 7.50 lakh to Rs 10 lakh have been reduced by 15 per cent, while those earning Rs 10 lakh to Rs 20 lakh have been deducted by 20 per cent. 25 per cent deduction has been made for employees earning Rs 20 lakh to Rs 25 lakh and 35 per cent for employees earning more than Rs 35 lakh. The decision will be for a while, Express management said.
Bennett Coleman & Company Limited (BCCL), the publisher of the Times of India, has also announced a pay cut for its employees. From April 1st 2020, the BCCL has decided to reduce the salaries of employees of major newspapers such as the Times of India, Economic Times and Navbharat Times by five to ten per cent. 5 per cent of total remuneration would be cut for those earning above Rs 10 lakh per annum; and 10%per cent would be cut for those earning more than Rs 1 crore per annum. For those with salaries above Rs 6.5 lakh, 10 per cent of their pay has been moved to a ‘special performance incentive pool’. The payment of this will depend on a target the company has to achieve a profit before interest, taxes, depreciation and amortization for 2020-21. According to a report in Maharashtra’s leading newspaper Dainik Lokmat, Corona has made it difficult for newspapers to reach households. The newspaper business is in

62
Journal of Shivaji University (Humanities and Social Sciences) ISSN : 0368 - 4199
Vol-53 / Issue -2 / July-Dec. 2020
trouble due to the closure of advertisements. Against this backdrop, the Maharashtra Times has decided to close three editions in Maharashtra, Kolhapur, Nagar and Jalgaon. The decision has left hundreds of journalists and non-journalists unemployed.
The Hindu announced pay cuts for those earning above Rs 6 lakh per year. Those earning between Rs 6 lakh and Rs 10 lakh per annum would see a pay cut of 8 per cent; those earning between Rs 10 lakh and Rs 15 lakh would see a cut of 12 per cent; Rs 15 lakh to Rs 25 lakh is 16 per cent; Rs 25 lakh to Rs 35 lakh is 20 per cent; and those earning above Rs 35 lakh would see a cut of 25 per cent. From April 1st 2020, Hindustan Times said that 5 per cent of the salary earned by those whose CTC (Cost to Company) is Rs 6-10 lakh would be variable. For those earning between Rs 10 lakh and Rs 20 lakh, 10per cent will be variable, and for people earning above Rs 20 lakh, 15per cent will be variable. This will not affect those earning below Rs 6 lakh. Like with the print media, the electronic media has also suffered financially. NDTV has slashed the salaries of all employees with a monthly salary of Rs 50,000 by 10 to 40 per cent. Malayalam channel JaiHind TV, also announced steep pay cuts. Those earning uptoRs 10,000 gross salary would see pay cuts of 30per cent; 35per cent for those earning between Rs 10,000 and Rs 15,000; and 40per cent for those earning between Rs 15,000 and Rs 30,000. Those earning above Rs 30,000 would see a 50per cent pay cut.
Along with the print and electronic media, the web of web media has also been shaken tremendously. Employees are also receiving jobs through web media. The salaries of some employees are being slashed. According to BestMediaInfo Bureau, reeling under financial stress since its inception, RaghavBahl’s Quintillion Media, which runs general news website thequint.com and business news website bloombergquint.com, has undertaken drastic cost-cutting measures to survive the economic impact of the COVID-19 crisis. While The Quint has sent estimated 50 per cent employees on a leave without pay until April 15 further notice. Bloomberg Quint has gone for heavy salary cuts of up to 75per cent. In a related development, Hindi news channel News Nation has asked its entire English digital team of 15 people to leave.
According to Tasmayee Laha Roy (2020), COVID-19 will change the face of the media
63
Journal of Shivaji University (Humanities and Social Sciences) ISSN : 0368 - 4199
Vol-53 / Issue -2 / July-Dec. 2020
in the years to come. In just fifteen days, hundreds of journalists lost their jobs. News of layoffs hasn’t stopped since. In such a situation, journalists face a big challenge. With the revenue of newspapers and magazines declining, it is time for journalists to lose their jobs. Journalists’ associations are also upset over these issues. Newspaper owners have appealed to the government for help. Journalists’ associations are also demanding that the government help journalists. There are hundreds of vacancies for journalists in television and radio under the Ministry of Information and Broadcasting. The Central Government should fill these vacancies immediately. This will provide an opportunity to many journalists who are currently unemployed, said Padma Shri awardee and senior journalist Alok Mehta. Traditional newspaper advertisers from sectors like the automobile industry, construction, home appliances, private education, travel, hospitality, and others have faced the shutdown equally. Once consumers lose the capacity to buy such products at least for the next few months, the advertisers may more selectively use their resources. Finally, the newspapers may have to depend on government advertisements only in the post-Coronavirus period.
Newspapers have not yet received some advertising bills from the government. Newspapers have demanded that the bills be paid immediately. Various newspapers across the country are owed Rs 350 crore by the government for advertising bills. INS has demanded that the central government pay the money immediately. The Advertising Agencies Association of India (AAAI) echoed INS’s demand for a bailout package, requesting the government to allow advertisers to treat advertising money as investments and allow it to spread expenditure incurred in advertising over three years. Apart from newspaper associations, some political parties have also urged Prime Minister Narendra Modi to help the newspaper industry. DMK leader M. K. Stalin urged Prime Minister Narendra Modi to waive customs duty on newsprint, take steps to pay government’s advertising dues to newspapers and hike advertisement rates by 100 per cent, saying as the industry has taken a severe hit owing to the COVID-19 induced lockdown. It will be important to see what the government decides on this.

64
Journal of Shivaji University (Humanities and Social Sciences) ISSN : 0368 - 4199
Vol-53 / Issue -2 / July-Dec. 2020
IV. Conclusion
COVID-19 has raised the question of the existence of the print media in India. The newspaper business has found itself in the throes of a massive recession. Advertising revenue has almost stagnated. The lockdown has also disrupted newspaper distribution. This has also hampered the revenue earned from the sale of newspapers. Newspapers are stuck on all sides. The journalists and other employees working in the newspapers have been hit the hardest. Many journalists have lost their jobs. Many journalists have had their salaries cut. Some publishing houses have temporarily suspended the publication of newspapers and magazines. Employees are also being laid off in electronic and web media. This is an unprecedented situation for the media industry in India. Leading media groups, journalists’ associations and some political parties have demanded that the central and state governments intervene and help the media to rectify the situation. The country’s media industry can only survive if the government helps. Otherwise, the industry, which is currently at a huge loss, is likely to go bankrupt in the near future. The future of the industry depends on how the government responds to demands made by various newspaper groups, journalists associations as well as political parties.
References
1. Amrita Nayak Dutta (2020), Covid-19 hits print media hard — ads and circulation dip, editions see major digital push, https://theprint.in/india/covid-19-hits-print-me-dia-hard-ads-and-circulation-dip-editions-see-major-digital-push/388514/
2. Banerji Ranjona (2020), Media, locked down!,https://www.mxmindia.com/2020/04/ranjona-banerji-media-locked-down/#inbox/_blank
3. BestMediaInfo Bureau (2020), RaghavBahl’s The Quint sends 50% workforce on leave without pay, https://bestmediainfo.com/2020/04/raghav-bahl-s-the-quint-sends-50-workforce-on-leave-without-pay/
4. Bhatnagar Gaurav Vivek (2020), COVID-19 Makes Readers, Advertisers Wary, Newspapers Slash Editions, Salaries to Cope, https://thewire.in/media/print-news-papers-coronavirus-salaries
65
Journal of Shivaji University (Humanities and Social Sciences) ISSN : 0368 - 4199
Vol-53 / Issue -2 / July-Dec. 2020
5. Joy Shemin(2020), COVID-19 lockdown: Newspapers lost Rs 4-5k Crore in 2 months, INS demands stimulus, https://www.deccanherald.com/national/covid-19-lockdown-newspapers-lost-rs-4-5k-crore-in-2-months-ins-demands-stimu-lus-829830.html
6. Laghate Gaurav (2020), Covid-19 impact: TV, mobile consumption witness ma-jor spike, https://economictimes.indiatimes.com/industry/media/entertainment/media/covid-19-impact-tv-mobile-consumption-witness-major-spike/article-show/74848508.cms?from=mdr
7. Nair Tara. (2003), Growth and Structural Transformation of Newspaper Industry in India: An Empirical Investigation, Economic and Political Weekly, Vol. 38, No. 39, pp. 4182-4189.
8. Roy TasmayeeLaha (2020), Will COVID-19 change the Indian media landscape for-ever?, https://www.exchange4media.com/coronavirus-news/will-covid-19-change-the-india-media-landscape-for-ever-104023.html
9. SabherwalSimran (2020), The Hindu Group’s Sportstar suspends print edition un-til April 15,https://www.exchange4media.com/media-print-news/the-hindu-groups-sports-magazine-sportstar-suspends-print-edition-until-april-15-103562.html
10. Unnithan P S Gopikrishnan (2020), Kerala reports first confirmed coronavirus case in India, https://www.indiatoday.in/india/story/kerala-reports-first-confirmed-novel-coronavirus-case-in-india-1641593-2020-01-30

66
Journal of Shivaji University (Humanities and Social Sciences) ISSN : 0368 - 4199
Vol-53 / Issue -2 / July-Dec. 2020
Understanding Indian Feminism Through Historical Perspective4
Dr. S. R. Kattimani
1. Assistant Professor, Department of History, Vivekanand College, Kolhapur (Maharashtra) Email – [email protected], Contact : +91 9860090689
Abstract:-
Women have had a special place in society since the beginning of human civilization. The role of women in the society is symbolic of teachers, pastoralists, assistant artisans, maids, etc. This paper intends to illustrate the changing role of women in different eras in India. Assessing the status of Indian women from a historical perspective is a need of the time. Because the history of the contribution of women from all arenas of life is neglected and incomplete. The truth is that they struggled with constant adversity and restored themselves. It is well said that, one is not born as a woman but rather becomes a woman. Although women’s empowerment is a key issue in a modern country like India, it is often ridiculed. People with chauvinist tendencies make a lot of fun of feminist topics. The secondary importance of women is often highlighted in the media and advertisements. This paper throws light on Understanding Indian Feminism through Historical Perspective.
Keywords:- Symbolic, Maids, Adversity, Empowerment, Feminism…
I. Introduction:-
In the history of ancient India, the status of women and their socio-familial contributions were considered important even in prehistoric times. Although, nature has gifted women with the power of creativity i.e. the power to give birth to offspring, it has made some distinctions between man and woman. Still, women have proved their worth over time. In invention of agricultural activity, the role of women was important, just as in the process of village formation and human socialization in the Neolithic Age. Historical evidences show that there was a matriarchal family system in India during the Indus

67
Journal of Shivaji University (Humanities and Social Sciences) ISSN : 0368 - 4199
Vol-53 / Issue -2 / July-Dec. 2020
II. Result and Discussion :-
Valley Civilization:
In the case of the position of woman in ancient India and in the context of women, we see that in Smriti Grantha, a woman is referred as a womb. And by glorifying her motherhood she was later worshiped. When we look at the nature of male-centric psychological expression, we see that culturalization and socialization have a significant effect on the expression of individuals. No expression can be socially neutral when this culture is absolute. Individuals express their feelings according to their temperament as well as their gender within the socio-cultural framework. Therefore, in understanding feminism from an Indian perspective, we have to consider the following.
Vedic Woman:-
Vedic literature shows that in the Vedic period, women had an important place in society, in families and in politics and had the right to education. We understand from the historical literature that there were Vidushi women like Gargi, Maitreyi, Lopamudra in the society. In ancient literature we find the concept of Swayamvar i.e. marry a woman with groom of her choice out of the set of suitable candidates; Which shows women had freedom of marriage. Women also play an important role in the Vedic political organization ‘Sabha and Samiti’. Overall, in the Vedic period, women had social, political, family and educational rights and freedom.
Contributions of Jainism and Buddhism to Women’s Development:
Due to the social and religious rigidity, complexity and rituals of women’s liberation in the post-Vedic Period B.C. In the early sixth century, new religions, Jainism and Buddhism emerged in India. Historical evidence shows that Jainism and Buddhism adopted a liberal approach to women. For women these two religions made available an access to the disciplined spiritual practices which means the salvation through sadhana. Like male monks, female monks (Nuns) were made independent by removing obstacles in the way of living in monasteries, meditating and attaining salvation. The Therigatha in Buddhism is the best evidence of this.
68
Journal of Shivaji University (Humanities and Social Sciences) ISSN : 0368 - 4199
Vol-53 / Issue -2 / July-Dec. 2020
Buddhist Sangha’s:-
While interpreting Buddhism and philosophy in the context of Indian feminism from a feminist point of view, one has to use Pali texts like Therigatha Paramthadipani as well as Sanskrit texts written by Buddhist scholars like Nagarjuna and Subandhu, Dignag and Dharmakirti. Gautama Buddha admitted women to the Sangha. The women like Khema, Uppalvanna, Dhammadinna etc. who joined the Sangha proved Buddha’s faith. The women of the Buddhist community were not only qualified to attain Nirvana, but were also very intelligent and communicative. In Buddhism, women were never underestimated because they were women, whereas in the Buddhist community, women lived very safe lives.
On the one hand, the Buddhist Sangha was a guide for those who wanted to attain Nirvana, and on the other hand, it was the one who established ethics in the society through Buddhism. Buddhism was a role model for the society by his own conduct. There has never been any discrimination in the Buddhist community regarding caste or gender. In short, in Indian culture, it can be said that Gautama Buddha and Buddhism were the first to open the door of salvation for women by treating them with respect.
Maurya & Gupta Period:-
The Maurya and Gupta periods are considered important in the formation of Indian women and in their social, political and economic developments. It is during this period that the restrictions on women created during the post-Vedic period became more oppressive. In the course of time, women’s right to education was taken away from them. Many social, political, and religious restrictions were imposed on her. During this period, the political importance and participation of women remained nominal. A Woman was considered a consumable item. Her personal freedom was taken away and she was paralyzed.
Post Gupta Period:-
The post-Gupta period saw political chaos in India. Taking advantage of this, many foreign rulers and invaders invaded India. At the time of this foreign invasion, social restrictions on Indian women became even stronger. From the inscriptions of Iran, we

69
Journal of Shivaji University (Humanities and Social Sciences) ISSN : 0368 - 4199
Vol-53 / Issue -2 / July-Dec. 2020
find the first written evidence of Sati, the wife of Bhanu Gupta, the Gupta king’s general, was killed. Earlier in the Mahabharata, Madri, the princess of the Madra Kingdom and the wife of the Pandu king, is an example of sati.
Due to foreign invasions, the female yoke was created by many social constraints such as pardha practice, child marriage. Looking at the historical pages from post-Vedic times, it can be seen that women’s economic dependence has brought a hammer on her social and political freedom. Financially, women were deprived of independence as they were dependent on their father, husband in their youth and on son in her old age. These restrictions appear to be exacerbated by the small contribution of women in trade, commerce and industry.
Sultanate Period:-
In the early days of the Sultanate, India was ruled by female politicians like Razia Sultana. But this proportion is very small. Razia Sultana was assassinated because male-dominating chiefs did not like it. Due to the political instability created during the Sultanate period, many oppressive restrictions were imposed on women in India during this period. Archaeological and literary evidence shows that women played an important role in the contemporary Vijayanagara Empire and in the Rajput kingdoms.
Mughal Period:-
In the Mughal period, some women like Nurjaha and Mumtaz seem to have made their mark in politics. But the proportion is also very small. Even during the Mughal period, Indian women remained socially, politically, economically, religiously and culturally neglected & deprived. During the Peshwa period, more restrictions were imposed on women. Texts like Manusmriti were strictly followed. Her life was marred by restrictions such as child marriage, sati, hairdressing, veil, polygamy and she was bound by many social chains.
Women’s Life during British Era:-
In the modern world, many revolutions have taken place in Europe since the Industrial

70
Journal of Shivaji University (Humanities and Social Sciences) ISSN : 0368 - 4199
Vol-53 / Issue -2 / July-Dec. 2020
Revolution. Religious and social revival movements in Europe took place in modern times. Modern methods of education, new discoveries show that modernity has been adopted by Europeans. Therefore, women in Europe and Britain appear to have more privileges than Indian women.
In European countries, these restrictions were imposed on women at that time, and in order to overcome these restrictions, women’s liberation movements appear to have taken place in European countries. After the arrival of the British in India, modern education was developed and spread. By adopting this teaching of the British, the Indian middle class became rationalists. This led to social and religious reform movements as well as gave birth to women reformers in India.
British liberalism gave impetus to women’s movements. In the nineteenth century, women like Savitribai Phule, Tarabai Shinde, Pandita Ramabai, Ramabai Ranade, Laxmibai Tilak, Dr. Anandibai Joshi contributed to the social development of women in India. In the uprising of 1857, women like Rani Lakshmibai , Begum Jhalkaribai, Begum Hazrat Mahal, Maina Peshwa, dancer Aziz Begum and Zeenat Mahal proved the courage of an Indian woman.
Involvement of women in Indian freedom struggle:-
Mahatma Gandhi, the Father of the Nation of India, seems to have done a lot of thinking and writing on women’s issues during the Indian War of Independence. Therefore, it is seen that women have played a significant role in the non-cooperation movement, civil disobedience and Quit India movement called by Gandhiji against the British. During this period, women freedom fighters took part in anti-British movements. In which Pandit Nehru’s sister Vijayalakshmi Pandit, Sucheta Kripalani, Kamaladevi Chattopadhyay, Dr. Sushila Nair, Aruna Asaf Ali, Sarojini Naidu, Kasturba Gandhi, Hansaben Mehta, Rajkumari Kaur, Urmila Devi, Pandita Sumati Shah, Anusaya Kale, Mridula Sarabhai, Avantika Gokhale, Sarladevi Chaudhary, Smt. Kamalaben Patel contributed to the freedom struggle.
The contribution of foreign women in the Indian freedom struggle is also significant.

71
Journal of Shivaji University (Humanities and Social Sciences) ISSN : 0368 - 4199
Vol-53 / Issue -2 / July-Dec. 2020
Leading the way are women like Anne Besant, Madame Cama, Sister Nivedita, Neil Sen Gupta, Miraben. Indian and foreign women who participated in India’s freedom struggle had to suffer a lot. On some occasions women had to stay in jail but they proved their contribution. So, women’s contribution to Indian independence is significant.
Women’s Participation in the Revolutionary Movement:
The contribution of revolutionary men in the Indian freedom struggle is very important and so is that of women revolutionaries. The Indian revolutionaries, in their style of terrorizing the Indians, contributed to the freedom struggle by adopting the repressive tactics adopted by the British. Which appears to include a large number of women revolutionaries.
Indian women participated in national programs such as Swarajya, Swadeshi, Bahishkar, Rashtriya Shikshan. At the same time, Indian revolutionary women took part in terrorist activities such as setting up secret organizations, wielding weapons, training them, looting government treasury offices, and marking tyrannical officials. Among them are Veena Das, Suhasini Ganguly, Shanti Ghosh, Suniti Chaudhary, Ujwala Mujumdar, Sushiladidi Ghosh, Parul Mukherjee, Preetilata Vaddedar, Yamunabai Savarkar, Yesubai Savarkar, Rajmati Patil, Lilatai Patil, Kalpana Dutt, Durgadevi Bahra, Yamuna Dasyakarya .
The Azad Hind Sena, formed by Subhash Chandra Bose, is an important contributor to India’s independence. The Azad Hind Fauj consisted of brave women like Capt. Lakshmi Sehgal, Smt. M.A Chidambaram, Pratima Sen, Shakuntala Gandhi, Smt. Gurudayal Kaur and Jyotirmoyee Gangoli. These women set an example to the world of women’s militancy through the Azad Hind Fauj against the British. Indian women seem to have made significant contributions on the occasion of the merger of the Sansthan through the Stree Praja Parishad movement during the Partition of India.
In post-independence India, women in the Satyashodhak Samaj, women in the Swabhimani movement, women in the Dalit movement, women in the farmers, tribal and labor movements, women in the anti-inflation, anti-emergency movement, women in the Chipko movement, Narmada Bachao movement and environmental activists, Muslim

72
Journal of Shivaji University (Humanities and Social Sciences) ISSN : 0368 - 4199
Vol-53 / Issue -2 / July-Dec. 2020
Satyashodhak Samaj, Women in the feticide and daughter rescue movement, women on the path to empowerment in politics have proved their capability and importance to the society .
Even so, women have been neglected by Indian society. The woman’s place in the family is limited to the Chul and the Mul. Influenced by the idea of an agrarian personality, the society imposed many restrictions on women which are still an obstacle in the way of her liberation.
III. Concluding Remarks:
The Government of India has supported women through a number of laws in the post-independence period. The Government of India has sought to empower women through legislation to protect their social, political, economic, religious and cultural rights. Even so, women continue to face problems such as dowry, sexual abuse, and domestic violence. When we look at the root of all this, it is the patriarchal attitude of the society that is the main reason why we see obstacles in the development of women. The patriarchal attitude cannot be eradicated by law, but the society needs to be socialized. For this, men need to understand the importance of women.
Therefore, it has become necessary to study how the social, political, economic, religious and cultural position of women has changed and how they have been bound by the historical test. Some selfish and hypocritical people in the society-imposed restrictions on women from time to time on their dignity.
The rationalist reformers have proved that women are just as efficient and capable as men. Although feminism is a concept in the West, it is a fact that women in India are still living under the shadow of economic, social, psychological and cultural oppression. Therefore, this fact cannot be ignored. The problems of Indian woman cannot be assessed on the basis of Western concepts, her social, political, economic, religious, cultural status, her constitution, her personality and mental state need to be focused in Indian context.
In conclusion we could say that from her childhood, the patriarchal society has inculcated on woman’s mind that her field of work is cooking and nourishment of child. What

73
Journal of Shivaji University (Humanities and Social Sciences) ISSN : 0368 - 4199
Vol-53 / Issue -2 / July-Dec. 2020
society needs is to change its attitude, not to make laws; because just making laws will not empower women, there is a need to change the mindset of the society for the proper implementation of these laws. In order to give economic and social independence to women, it is necessary to increase the social and political will of patriarchal tendencies so that women can be truly empowered.
References-
1. Kidwai Naina Lal (2015), 30 Women In Power, Their Voices, Their Stories, Roopa Publications, Mumbai.
2. Varde Dinkar Sakharam (2018), Historical Women, Varda Publications, Pune.
3. Mamata Gangwar (2009), Itihas Ke Aaine Me Mahila Shashaktikaran, Sarasvati Publi cations, Kanpur.
4. Shukla Supria (2008), Hardys Heroic Women, Vidya Publications, Kanpur.
5. Singh Sushila (1997), Feminism-Theory, Criticism, Analysis, Pencraft International, Delhi.
6. Tandon Neeru (2008), Feminism –A Paradigm Shift, Atalantic Publishers, New Delhi.
7. Patil Padmja & Jadhav Shobhana (2007), Bhartiya Itihasatil Striya, Phadke Publication, Kolhapur.
8. Parik Ambika (2009), Prachin Bharat Me Naari, Avishkar Publishers & Distributors, Jaipur.
9. Jharta Bhawana , Women and Politics in India, Deep & Deep Publication, New Delhi.
74
Journal of Shivaji University (Humanities and Social Sciences) ISSN : 0368 - 4199
Vol-53 / Issue -2 / July-Dec. 2020
The Role of social Media in disaster management:A study of social Media Page ‘Kolhapur Flood Victims’5
Dr. Sumedha S. Salunkhe
1. Assistant Professor, Department of Journalism and Mass Communication, Shivaji University, Kolhapur (MH) Email: [email protected] Contact: +91 9850423410
Abstract:
Social media has changed the daily habits of our lives. Most of the events and happening are being shared on facebook, whatsapp, tweeter, etc. This social media is now also helping to aware and gather people for doing social cause. Kolhapur being one of the enriched districts of Maharashtra has a strong background of social activities. The heavy rains in August 2019 hovered most of the parts in Kolhapur with uncontrolled flood situations causing huge loss. Considering this as one of the worst natural disasters of Western Maharashtra, many social activist groups, NGO’s, individuals were seen actively participating to help the flood victims. The social media was seen extensively used by people to help and reach the flood victims in the floods of Kolhapur. A facebook page named ‘Kolhapur Flood Victims’ played very important role through charitable activity for the flood victims. Vasant Manwadkar and Dr. Rajendra Parijat raised fund to help victims of flood in Kolhapur district. Present research will focus on the processing of facebook page and how they raised the fund and helped the people affected by flood. Present study will explore how social media group can help to solve social problems. The case study method will be adopted for the research.
Keywords: social media, disaster management, facebook, flood, Kolhapur.
I. Introduction :
Social media has changed the daily habits of our lives. Most of the events and happening are being shared on facebook, whatsapp, tweeter, etc. This social media is now also helping to aware and mobilize people for social cause. According to Global Web Index report, “digital consumers in India spent an average of two hours and 22 munities daily using social media. India has become top facebook using country in the world. Facebook being one of the most popular social media platforms all over the world, 30 cores Indian users which summed up almost 22 % of country’s population.”

75
Journal of Shivaji University (Humanities and Social Sciences) ISSN : 0368 - 4199
Vol-53 / Issue -2 / July-Dec. 2020
Kolhapur being one of the enriched districts of Maharashtra has a strong background of social activities. The heavy rains in August 2019 hovered most of the parts in Kolhapur with uncontrolled flood situations causing huge loss. Considering this as one of the worst natural disasters of Western Maharashtra, many social activist groups, NGO’s, individuals were seen actively participating to help the flood victims. The social media was seen extensively used by people to help and reach the flood victims in the floods of Kolhapur. A facebook page named ‘Kolhapur Flood Victims’ played very important role through charitable activity for the flood victims. Vasant Manwadkar and Dr. Rajendra Parijat raised fund to help victims of flood in Kolhapur district. Present research will focus on the processing of facebook page and how they raised the fund and helped the people affected by flood. Present study will explore how social media group can help to solve social problems.
II. Objectives of Research :
● To study the role of Social Media in disaster management.
● To study the contribution of Kolhapur Flood Victims facebook page in Kolhapur Flood situation.
● To study the about facebook fund raiser.
III. Research Methodology
Case study method is adopted for the present research.
Present research is about new media. The data is collected by primary and secondary data collection. Interview and observation methods are used.
Conceptual Framework-
The present research is about the role of social media in disaster management. As we know the social media has gained very important position in day today life. Though it is used for bad purpose it has its good features also. Convergence theory is close to this. “The rapid growth of telecommunications and computing technology, especially apparent in the emergence of the Internet as a major social and economic phenomenon of the 1990s, presents yet another aspect of globalization that holds profound implications for possible societal convergence…….. While new computing and communication technologies compress the time and space dimensions of social interaction (Giddens 1990), and have the potential to undercut national identities and cultural differences

76
Journal of Shivaji University (Humanities and Social Sciences) ISSN : 0368 - 4199
Vol-53 / Issue -2 / July-Dec. 2020
along the lines envisioned by McLuhan’s (1960) “global village,” the same forces of advanced technology that can level traditional differences may ultimately reinforce the boundaries of nation, culture, and social class.”(Russel Matthew, 2014)
Social media has brought the ‘global village’ in actual reality. Now we have crossed the boundaries of nations with these social networking sites. Facebook is one of the social networking site through which we can connect with the people across the world. Facebook has provided facility of ‘Fundraiser’. Through which one can raise fund for various purposes.
IV. Results And Discussions:
Disaster Management
Disaster Management is a part of public relations. Disaster Management is a strategic planning and procedure that is administered and employed to protect critical infrastructures from severe damages when natural or human made calamities and catastrophic even occur.
“The United Nations defines a disaster as a serious disruption of the functioning of a community or a society. Disasters involve widespread human, material, economic or environmental impacts, which exceed the ability of the affected community or society to cope using its own resources.”
There are four main types of disaster.
Natural disaster, Environmental emergences, complex emergences, Pandemic emergencies.
Natural disasters: including floods, hurricanes, earthquakes and volcano eruptions that have immediate impacts on human health and secondary impacts causing further death and suffering from (for example) floods, landslides, fires, tsunamis.
Kolhapur District-
“Kolhapur city is situated on the banks of Panchganga river and is surrounded by Sahyadri mountain ranges. It is a city known for its historical forts, temples and royal places of erstwhile royals. It is one of the best places to explore the splendor and magnificence of India.
Kolhapur is about 387 km from the Mumbai, the financial capital of India and is famous
77
Journal of Shivaji University (Humanities and Social Sciences) ISSN : 0368 - 4199
Vol-53 / Issue -2 / July-Dec. 2020
for the Indian handcrafted leather slippers the Kolhapuri chappals and its unique local jewelry a special type of necklace called KolhapuriSaaj.
Kolhapur is famous for the Shri. Mahalakshmi temple.The Bhonsle dynasty was the ruling family of Kolhapurprincely state and they pride themselves for being the descendants of Chhatrapati Shivaji Maharaj the Great.
Situated at an altitude of 1900 feet, Kolhapur enjoys a pleasant climate for the major portion of the year best time to visit Kolhapur is from October to March, but avoids the summer months of April and May when temperature is on a rise.”(India G. o., 2019)
Rainfall, Climate and Forest Resources
The western part of the district is made up of Sahyadri mountain ranges and steep cliffs with extremely heavy rainfall, dense forests rich with floral and faunal biodiversity. The weather in this region is cold and these areas are well known hill stations and tourist spots. Shahuwadi, Gaganbawada, Radhanagri, Chandgad, Budhargad are regions in district those receive very heavy rainfall. Towards the east proportion of rainfall is very meager.
Population-
According to census of India 2011, Total population of Kolhapur district is 38,76,001.
“Kolhapur district has now 12 tahsils and 23 Towns 1216 villages spread over Shahuwadi (145), Panhala (129), Hatkangale (58), Shirol (54), Karvir (121), Bavda (45), Radhanagari (114), Kagal (84), Bhudargad (117), Ajra (99), Gadhinglaj (93), and Chandgad (157) tahsils.”
“Sex ratio of the district is 957 (number of females per 1000 males) is well above the state average 929. The literacy rate of the district is 81.5, which is lower than state literacy rate 82.3.”(India, 2011)
Social Media in Natural Disasters-
“Online social networking services and social media like Facebook, Twitter, Google+, Etc. can act and try to solve many problems during natural disasters [5]. During disasters all the conventional communications generally stop functioning at this time interval while social media or networking services stay active.”(DimiterVelev and PlamenaZlateva, 2012.)

78
Journal of Shivaji University (Humanities and Social Sciences) ISSN : 0368 - 4199
Vol-53 / Issue -2 / July-Dec. 2020
Kolhapur and flood
Kolhapur faced flood situation in 2019. Continues heavy rainfall and released dam water covered half of the Kolhapur city in the month of August 2019. The widespread rains have reportedly submerged large areas of land, fields, villages, towns, and cities, while both road and rail transport is severely affected. As Mumbai-Bengaluru National Highway No. 4 remains closed, 29 other state highways and 56 roads have also been shut.
Around 22 NDRF and SDRF teams are deployed in these regions. Besides, teams of Indian Army, Navy, Air Force and Coast Guard are also engaged in rescue and relief efforts.
Facebook-
Facebook is an American online social media and social networking service owned by Facebook, Inc. Founded in 2004 by Mark Zuckerberg with fellow Harvard College students and roommates Eduardo Saverin, Andrew McCollum, Dustin Moskovitz, and Chris Hughes, its name comes from the face book directories often given to American university students. Membership was initially limited to Harvard students, gradually expanding to other North American universities and, since 2006, anyone over 13 years old. ‘As of 2020, Facebook claimed 2.8 billion monthly active users, and ranked seventh in global internet usage.’(https://investor.fb.com/home/default.aspx, 2021)
Facebook Fundraiser –
Fundraiser is one of the features of facebook which provides links to donate. There are many activities on fundraiser to help people who in trouble situation or wants to do something for society. Facebook fundraisers make it easy to support friends, family and the causes that are important to you. The categories for fundraisers are 1. Animals, 2. Art and Culture, 3. Business, 4. Community and social Action, 5. Crisis Relief, 6. Education, 7. Environment, 8. Faith, 9. Funeral and loss, 10. Health and Medical, 11. International, 12. Personal emergency, 13. Sports. The present fund raiser activity comes under Crisis Relief. Vasant Manwadkar and Dr. Rajendra Parijat started this fundraising activity.
Vasant Manvadkar-
Vasant Manvadkar is software engineer from Frisco, Texas. His home town is Kolhapur. He has completed his engineering from Walchand College of Engineering, Sangli.He is founder and CEO at Microtek Systems Inc. USA.

79
Journal of Shivaji University (Humanities and Social Sciences) ISSN : 0368 - 4199
Vol-53 / Issue -2 / July-Dec. 2020
Dr. Rajendra Parijat-
Dr. Rajendra Parijat is Associate Professor at CSIBER, college in Kolhapur. He is sole owner of trademark knowledge tourism. He teaches project, change and service sector management, life, professional skills development career management to MBA, M. Com students.
Kolhapur Flood Victims
The fundraiser page Kolhapur flood Victims raised 7,17,000/- Rs. Out of this Rs. 2,60,333/- are collected from Facebook fundraiser. Facebook friends of Vasant Manwadkar and Dr. Rajendra Parijat donated the fund for Kolhapur flood victims. 90% of amount is collected from friends and relatives. The amount is collected from local bank account, Facebook fundraiser, Indian Banks and American Channels. The details on donation links are given in the fundraiser page.
During the telephonic interview with Vasant Manwadkar he told that, “My motherland is Kolhapur I was observing the situation of Kolhapur from abroad, I wanted to do something and help people. Then I and Dr. Rajendra Parijat created the facebook fund rase page. We found that friends and family members on facebookare responding positively. But there is problem in online transfer. Most of the people do not trust on online transfer is safe. We collected 7,17,000/- Rs. from the fundraiser page Kolhapur flood Victims.” Vasant Manwadkarhadgiven the instructions to facebook users how and where to donate. For donersfacebook fundraiser is available as well as friends and family members from Kolhapur can donate the money on local bank account which was given on fundraiser page description. (Vasant, 2019)
During the interview with Dr. Rajendra Parijattold that,“The flood situation in Kolhapur was very much disturbing. Every person wants to help people in disaster. But how to help was the question. When Vasant Manwadkarcontacted,we decided to create a facebook fundraiser page for this situation. People helped through this. we raise the fund and helped the people.” Dr. Parijat was connected with the families who are in need and what kind of help they want.(Rajendra, 2019)
Vasant Manwadkar and Dr. Rajendra Parijat themselves donated the amount which was also used to help people in need.
Distribution of Amount
The amount is distributed among the flood victims. Vasant Manwadkar and Dr. Rajendra

80
Journal of Shivaji University (Humanities and Social Sciences) ISSN : 0368 - 4199
Vol-53 / Issue -2 / July-Dec. 2020
Parijatselected families and organizations who want the help.
1. First donation is given to resident of Chikhli who is handicap. She has 3 kids and she lost her husband recently. Her yearly income is less than 50,000/- rupees. Maharashtra government has given her a space away from river to build new home near her village. We have decided to build new home for her and her kids. We requested one architect to design a plan and identified one builder to build this home. We donated Rs. 2 Lakh rupees to initiate this construction work.
2. White Army – has given 25, 000/- Rs. “White Army” of Jeevan Mukti Seva Sanstha, Kolhapur as Angel Organization.White Army has undertaken following activities, besides several other Rescue and Relief operations.
To find out dead bodies and to arrange for their funerals, at the time of Disaster. To rescue the people who are stranded due to disaster and to supply them food,
Medicines, cloths etc.To conduct Medical treatment center/camp for injured people. To help in rehabilitation work.
3. Mandedurg village in Chandgad- Mandedurg village in Chandgadtehshil Kolhapur district. Donated Rs. 2 Lakh rupees to initiate this construction work. Identified one family who lost their home. He has one handicapped kid. His yearly income is less than 1,00,000 rupees. He is going to sell some portion of his agricultural land to build his home. Donated Rs. 2 Lakh rupees to initiate this construction work.
4. Aapti ,Phanala – Donated 25,000/- Rupees to build common shade for animals.
5. Student from Sangli was given donation of 25000 Rs. Some donors are from sangli district. 6.50,000 Rs given to person from Nittur, chandghad. (Fundraiser, Kolhapur Flood Victims, 2019)
Sr. No Places there funds were Donated Amount
1. Chikhali 2,00,000/-2. White Army 25000/-3. Mandedurg 2,00,000/-4. Apti,Phanala 25,000/- 5. Sangli 25,000/-6. Nittur, Chandghad. 50,000/-

81
Journal of Shivaji University (Humanities and Social Sciences) ISSN : 0368 - 4199
Vol-53 / Issue -2 / July-Dec. 2020
V. Conclusion
Social media has re-defined communication in today’s modern world. According to studynew technology can be used effectively and positively.
Social Media can be used as to communicate in crisis situation. Facebook has many active users and they use this social media for good practices also. Facebook fundraiser is one of the best options to help people in crisis. Kolhapur flood victim fundraiser page played very important role to help flood affected people.
References
1. Kahate Atul, (Atul, 2001) Facebook,ManovikasPrakashan, 2001, P.No.25,26.
2. Sunetra Sen Narayan, Shalini Narayanan, (Sunetra Sen Narayan, 2018)India Connected, Sage bhasha Publication, Delhi 2018.
3. Russel Matthew,(Russel Matthew, 2014) Mining The Social Web, O’Relly Media, United States of America. 2014.
4. https://www.encyclopedia.com/social-sciences/encyclopedias-almanacs-transcripts-and-maps/convergence-theories dated 10-11-2019
5. (https://investor.fb.com/home/default.aspx, 2021) https://investor.fb.com/investor-news/press-release-details/2021/Facebook-Reports-First-Quarter-2021-Results/default.aspx,Facebook Reports First Quarter 2021 Results”. Facebook Investor Relations. March 31, 2021. Retrieved March 31, 2021.
6. Census of India 2011 https://cdn.s3waas.gov.in/s33d2d8ccb37df977cb6d9da15b 76c3f3a/uploads/2016/09/2018051580.pdf
7. https://kolhapur.gov.in/en/(India G. o., 2019)
8. https://www.researchgate.net/publication/271585520, Dimiter Velevand Plamena Zlateva, Use of Social Media in Natural Disaster Management, June 2012.
9. www.facebook.com dated 6 -11- 2019 to 30-11-2019
10. http://whitearmy.org/about-founder-president/ Dated 20-11-2019
11. ManvadkarVasant ,(Vasant, 2019) Date- 11 -11-2019 8:00pm on telephone.
12. Parijat Rajendra, (Rajendra, 2019) CSIBER College, Kolhapur. Date- 30-11-2019.

82
Journal of Shivaji University (Humanities and Social Sciences) ISSN : 0368 - 4199
Vol-53 / Issue -2 / July-Dec. 2020
ñdÀN> ^maV A{^¶mZ Ho$ à{V {d{^ÝZ dJm|© Ho$ {dÚm{W©¶m| H$s emar[aH$ Ed§ n¶m©daUr¶ OmJê$H$Vm H$m Aܶ¶Z (B§Xm¡a {Oco Ho$ n[aàoú¶ ‘|)
6
S>m°. draoÝÐ O¡Z
gh àmܶmnH$, {ejm {d^mJ, Amo[a¶§Q>c ¶y{Zd{g©Q>r, B§Xm¡a ‘ܶàXoe, Email : [email protected]
emoYgma
ñdÀN>Vm H$m grYm gå~ÝY h‘mao emar[aH$ Ed§ ‘mZ{gH$ ñdmñ϶ go Ow‹S>m hþAm h¡& AV: ¶h H$hZm JcV Zht
hmoJm H$s EH$ ñdÀN> eara ‘| hr EH$ ñdñW ‘Z H$m {Zdmg hmoVm h¡ ñdÀN>Vm Zm Ho$dc h‘mao Ka g‹S>H$ VH$
Ho$ {cE hr Oê$ar Zht hmoVr h¡& ¶h Xoe Amoa amîQ´> H$s Amdí¶H$Vm hmoVr h¡& Bggo Zm Ho$dc h‘mam Ka Am±JZ
hr ñdÀN> ahoJm nyam Xoe hr ñdÀN> ahoJm& Bgr H$mo ‘ÔoZOa aIVo hþE ^maV gaH$ma Ûmam McmB© Om ahr ñdÀN>
^maV A{^¶mZ Omo {H$ h‘mao Xoe Ho$ à˶oH$ Jm§d Am¡a eha ‘| àma§^ H$s JB© h¡& Omo Xoe Ho$ à˶oH$ Jcr Jm§d H$s
à˶oH$ g‹S>H$m| go coH$a em¡Mmc¶ H$m {Z‘m©U H$amZm Am¡a Xoe Ho$ ~w{Z¶mXr T>m§Mo H$mo ~XcZm hr Bg A{^¶mZ
H$m CÔoí¶ h¡&
g§Ho$V eãX- ñdÀN>Vm, n¶m©daUr¶, OmJê$H$Vm, {hV¡fr CËnmX, g§ajU&
I. n[aM¶ …
{ejm Am¡a ñdÀN>Vm H$m Amng ‘| Jham gå~ÝY h¡ Am¡a ñdñW Am¡a {e{jV ZmJ[aH$ hr gånyU© ñdÀN>Vm H$mo
nyar Vah go g‘P gH$Vo h¢ Am¡a Xÿgam| H$mo ^r Bg ~mao OmJê$H$ H$a gH$Vo h¢& ñdÀN> ^maV A{^¶mZ ¶m ŠbrZ
B§{S>¶m {‘eZ ^maV gaH$ma Ûmam Mcm¶m Om ahm EH$ g’$mB© A{^¶mZ h¡, Omo{H$ ^maV Ho$ àYmZ‘§Ìr ZaoÝÐ ‘moXr
Ûmam ‘hmË‘m Jm±Yr H$s 145 dt OÝ‘{V{W na CZHo$ ñdÀN> ^maV Ho$ gnZo H$mo gmH$ma H$aZo Ho$ {cE ewê$ {H$¶m
J¶m Wm& BgHo$ VhV gaH$ma Ûmam {d{^ÝZ à¶mg {H$¶o Om aho h¢ Am¡a àYmZ‘§Ìr ‘moXr Zo Xoe Ho$ ZmJ[aH$mo H$mo
AnZm nyam ¶moJXmZ XoZo H$mo H$hm h¡ Vm{H$ ̂ maV OëX go OëX EH$ ñdÀN> Xoe ~Z gHo$& BgH$s ewéAmV àYmZ‘§Ìr
Zo amo‹S> gm’$ H$a Bg A{^¶mZ H$m AmJmO {H$¶m Wm& ¶h A{^¶mZ 2 AŠQy>~a 2014 Omo{H$ ~mny H$s 145 dt
O¶§Vr h¡, na ewê$ {H$¶m J¶m& 2019 ‘| ~mny H$s 150 dt O¶§Vr na BgH$s nyU©Vm H$mo c{jV {H$¶m J¶m h¡&
Bg A{^¶mZ H$m ‘w»¶ cú¶ Ho$dc gm‘mݶ g’$mB© hr Zht ~pëH$ cmoJm| H$s {Z¶{‘V H$Mam à~§YZ g‘ñ¶mE± Xÿa
H$aZo Ho$ gmW hr em¡Mmc¶ Am{X g‘ñ¶mAm| H$m g‘mYmZ H$aZm cú¶ {ZYm©[aV {H$¶m J¶m&

83
Journal of Shivaji University (Humanities and Social Sciences) ISSN : 0368 - 4199
Vol-53 / Issue -2 / July-Dec. 2020
ñdÀN> ^maV A{^¶mZ H$m {dÚmc¶m| ‘| à^md
Am{YH$m[aH$ ê$n go 1 Aà¡c 1999 go ewê$, ^maV gaH$ma Zo ì¶mnH$ J«m‘rU ñdÀN>Vm H$m¶©H«$‘ H$m nwZJ©R>Z
{H$¶m Am¡a nyU© ñdÀN>Vm A{^¶mZ ewê$ {H$¶m, {OgH$mo ~mX ‘| (1 Aà¡c 2012 H$mo) àYmZ‘§Ìr ‘Z‘mohZ qgh
Ûmam {Z‘©c ^maV A{^¶mZ Zm‘ {X¶m J¶m& ñdÀN> ^maV A{^¶mZ Ho$ ê$n ‘| 24 {gV§~a 2014 H$mo H|$Ðr¶
‘§{Ì‘§S>c H$s ‘§Oyar go {Z‘©c ^maV A{^¶mZ H$m nwZJ©R>Z {H$¶m J¶m Wm& ‘mZd g§gmYZ {dH$mg ‘§Ìmc¶ Ho$
AYrZ ñdÀN> ^maV-ñdÀN> {dÚmc¶ A{^¶mZ H|$Ðr¶ {dÚmc¶m| Am¡a ZdmoX¶ {dÚmc¶ g§JR>Z ‘| Am¶mo{OV
{H$¶m Om ahm h¡& Bg Xm¡amZ H$s OmZo dmcr J{V{d{Y¶m| ‘| em{‘c h¢-
1. ñHy$c H$jmAm| Ho$ Xm¡amZ à{V{XZ ~ƒm| Ho$ gmW g’$mB© Am¡a ñdÀN>Vm Ho$ {d{^ÝZ nhcwAm| na {deof ê$n
go ‘hmË‘m Jm§Yr H$s ñdÀN>Vm Am¡a AÀN>o ñdmñ϶ go Ow‹S>t {ejmAm| Ho$ g§~§Y ‘| ~mV H$a|&
2. H$jm, à¶moJemcm Am¡a nwñVH$mc¶m| Am{X H$s g’$mB© H$aZm&
3. ñHy$c ‘| ñWm{nV {H$gr ^r ‘y{V© ¶m ñHy$c H$s ñWmnZm H$aZo dmco ì¶{º$ Ho$ ¶moJXmZ Ho$ ~mao ‘| ~mV H$aZm
Am¡a Bg ‘y{V©¶m| H$s g’$mB© H$aZm&
4. em¡Mmc¶m| Am¡a nrZo Ho$ nmZr dmco joÌm| H$s g’$mB© H$aZm&
5. agmoB© Am¡a gm‘mZ J«h H$s g’$mB© H$aZm&
6. Ioc Ho$ ‘¡XmZ H$s g’$mB© H$aZm
7. ñHy$c ~JrMm| H$m aIaImd Am¡a g’$mB© H$aZm&
8. ñHy$c ^dZm| H$m dm{f©H$ aIaImd a§JmB© Ed§ nwVmB© Ho$ gmW&
9. {Z~§Y,dmX-{ddmX, {MÌH$cm, g’$mB© Am¡a ñdÀN>Vm na à{V¶mo{JVmAm| H$m Am¶moOZ&
10. "~mc ‘§{Ì‘§S>cm| H$m {ZJamZr Xc ~ZmZm Am¡a g’$mB© A{^¶mZ H$s {ZJamZr H$aZm&
gaH$ma Ûmam n¶m©daU g§ajU Ho$ à{V OmJê$H$Vm-
n¶m©daU Zo Zr{V {Z‘mVm©Amo d¡km{ZH$mo Am¡a {díd Ho$ AZoH$ Xoemo ‘| Am‘ AmX‘r H$m ܶmZ AmH${f©V {H$¶m h¡& do
AH$mc, gyIm, B§YZ H$s H$‘r, OcmZo H$s cH$‹S>r Am¡a Mmam, dm¶w Am¡a Oc àXÿfU, amgm¶{ZH$mo Am¡a {d{H$aUm|
H$s ^¶mdh g‘ñ¶m, àm.{VH$ g§gmYZmo, dݶ OrdZ H$m cwá hmoZm Ed§ dZñn{V VWm Ord O§VwAm| H$mo IVao O¡go
‘wXXmo Ho$ à{V A{YH$ gVH©$ hmoVo Om aho h¡& cmoJ AmO dm¶w, Oc, ‘¥Xm Am¡a nm¡Ym| O¡go àm.{VH$ n¶m©daUr¶
g§gmYZmo H$s ajm H$aZo H$s Amdí¶H$Vm Ho$ à{V gOJ h¡ VWm ¶h àm.{VH$ gånXm h¡ ‘Zwî¶ H$s Amdí¶H$VmE§
~‹T> JB© h¡ Am¡a CZHo$ AZwê$n n¶m©daU ‘| n[adV©Z {H$E Om aho h¡& ^{dî¶ H$mo g§^d ~ZmZo Ho$ {cE n¶m©daU
H$s ajm Ed§ ~Mmd A{Zdm¶© h¡&

84
Journal of Shivaji University (Humanities and Social Sciences) ISSN : 0368 - 4199
Vol-53 / Issue -2 / July-Dec. 2020
· n¶m©daU AXmcV| : n¶m©daU H$mo nÐÿ{fV H$aZo dmcr ’¡$pŠQ´>¶m| Ho$ {dê$Õ VoOr go ݶm¶ {XcmZo Ho$ {cE
{deof AXmcVmo H$m JR>Z {H$¶m Om ahm h¡&
· n¶m©daU {hV¡fr CËnmX : gaH$ma ~mOma ‘| {~H$Zo dmco CËnmXmo§ Ho$ {cE g»V {Z¶‘ cmJy H$a ahr h¡& BZ
‘mZH$mo na Iam CVaZo dmco CËnmXmo H$mo CË.îQ>Vm H$m à‘mU nÌ O¡go AmB©. Eg. AmB© ‘mH©$ {X¶m OmVm h¡&
· noQ´>moc H$mo erem‘wº$ H$aZm : Voc emoYH$ H$maImZmo H$mo erem‘wº$ noQ´>moc ~ZmZo Ho$ {cE no«[aV {H$¶m Om ahm
h¡& ^maVr¶ noQ´>moc ‘| erem (c¡S>) H$s ‘mÌm A{YH$V‘ hmoVr h¡ Omo ‘moQ>a Jm{S>¶mo Ho$ ‘mܶ‘ go A{YH$m§e
àXÿfU ’¡$cmVm h¡&
· hm{ZH$maH$ H$sQ>ZmeH$m| na à{V~§Y : AmR> amgm¶{ZH$ H$sQ>ZmeH$mo, {OZ‘| S>rS>rQ>r, ~rEMgr, EpëS´>Z Am¡a
‘ocm{W¶Z em{‘c h¡, H$mo ~mOma go hQ>m {X¶m J¶m h¡ VWm BZHo$ ñWmZ na gwa{jV O¡{dH$ H$sQ>ZmeH$m| H$mo
cmZo H$s ¶moOZm h¡&
· amîQ´>r¶ Hy$S>m à~§YZ n[afX : BgH$m ‘w»¶ H$m¶© 40 {‘{c¶Z Q>Z ’$cmB© Eoe H$mo Omo {H$ W‘©c ßbm§Q>mo Ho$
{ZH$Q> nhmS> Ho$ ê$n ‘| nS>r h¡& B©Q>mo ‘| VWm eha Ho$ Hy$‹S>m H$H©$Q> H$mo COm© ‘| Am¡a grda Ho$ ‘c H$mo Cd©aH$
‘| n[ad{V©V H$aZm h¡&
· npãcH$ cm¶{~ëQ>r BÝí¶moa|g : (OZ Xm{¶Ëd ~r‘m) BgHo$ A§VJ©V g^r H$ån{Z¶m| Ho$ {cE 48 K§Q>o ‘|
npãcH$ cm¶{~ëQ>r BÝí¶moa|g H$m ^wJVmZ H$aZm H$mZyZr ê$n go A{Zdm¶© h¡&
· ‘moQ>a dmhZmo Ûmam àXÿfU : ‘moQ>a dmhZmo Ûmam àXÿfU ’¡$cmZo Ho$ {dê$Õ àXÿfU {damoYr A{^¶mZ H$mo g»Vr
go cmJy {H$¶m Om ahm h¡& {ZpíMV ‘mnXÊS>mo H$m nmcZ Z H$aZo dmco dmhZm| na ^mar Ow‘m©Zm ^r hmo gH$Vm
h¡&
· g‘wÐ VQ> Ho$ {ZH$Q> hmoQ>c : Eogo hmoQ>cm| Ho$ {dê$Õ g»V H$ma©dmB© H$s JB© h¡ Omo H$mZyZmo H$s AZXoIr H$aVo
hþE g‘wÐr VQ> na A{VH«$‘U H$aVo h¡&
· amîQ´>r¶ ZXr H$m¶© ¶moOZm : amîQ´>r¶ ZXr àm{YH$aU ~ZmZo H$m àñVmd h¡ Omo amîQ´>r¶ ñVa na Oc à¶moJ Ed§
Hy$‹S>m à~§YZ Ho$ {cE Zr{V ~ZmEJm&
· gm¡a COm© Am¶moJ : COm© joÌ àXÿfU ’¡$cmZo H$m ‘w»¶ H$maH$ h¡ Bg{cE ‘w»¶ COm© òmoV H$mo ~‹T>mZo Ho$ ñWmZ
na J«m‘rU ñVa na {dHo$pÝXÌ COm© {Z‘m©U H$s ¶moOZm h¡&
85
Journal of Shivaji University (Humanities and Social Sciences) ISSN : 0368 - 4199
Vol-53 / Issue -2 / July-Dec. 2020
II. emoY H$s Amdí¶H$Vm
{dÚm{W©¶m| ‘| ñdÀN> ^maV A{^¶mZ cJmVma McmZo H$s Amdí¶H$Vm h¢, O~ VH$ {H$ cú¶ àmá Z hmo Om¶o&
^maV Ho$ cmoJm| Ho$ {cE ¶h ~hþV hr Amdí¶H$ h¡ {H$ dh ^mdZmË‘H$ emar[aH$, ‘mZ{gH$, gm‘m{OH$ Am¡a
~m¡{ÕH$ ê$n go AÀN>m ‘hgyg H$a|& dmñV{dH$ ‘m¶Zo ‘| ^maV ‘| ahZ ghZ H$s pñW{V A{J«‘ ~ZmZm Oê$ar h¡,
Omo {H$ ñdÀN>Vm cmH$a ewê$ H$s Om gH$Vr h¢& g^r ~~m©X MrO| d¡km{ZH$ à{H«$¶mAm| Ûmam R>mog An{eîQ>m| Ho$
argmB©pŠb¨J Ho$ ‘mܶ‘ go nwZ: Cn¶moJ cm¶H$ ~ZmZm Amdí¶H$ h¡& An{eîQ> à~§YZ H$mo cmJy H$aZm Mm{hE& BZ
V϶m| go h‘mao {dÚm{W©¶m| {H$VZm OmJê$H$ h¡ BgH$m| OmZZo H$m à¶mg Bg emoY H$m à{VnmÚ {df¶ h¡&
emoY H$m ‘hËd
ñdÀN>Vm Ed§ n¶m©daU OmJê$H$Vm Ho$ {df¶ AmO ^r d¡km{ZH$ qM{VV h¡ {H$ OZ OZ VH$ Bg MoVZm H$mo H¡$go
OmJ¥V {H$¶m OmE& {ejmWu Ohm± AZdaV Aܶ¶ZaV h¢, CZ‘| Bg OmJê$H$Vm H$m kmZ H$a ~¥{Õ H$aZm A^rîQ> h¡&
emoY H$m CX²Xoí¶
1. gm‘mݶ dJ© Ho$ {dÚm{W©¶m| H$m ñdÀN> ^maV A{^¶mZ Ho$ AÝVJ©V emar[aH$ Ed§ n¶m©daUr¶ OmJê$H$Vm H$m
Aܶ¶Z H$aZm&
2. AZwgy{MV Om{V dJ© Ho$ {dÚm{W©¶m| H$m ñdÀN> ^maV A{^¶mZ Ho$ AÝVJ©V emar[aH$ Ed§ n¶m©daUr¶
OmJê$H$Vm H$m Aܶ¶Z H$aZm&
3. AZwgy{MV OZOm{V dJ© Ho$ {dÚm{W©¶m| H$m ñdÀN> ^maV A{^¶mZ Ho$ AÝVJ©V Ho$ emar[aH$ Ed§ n¶m©daUr¶
OmJê$H$Vm H$m Aܶ¶Z H$aZm§&
4. Aݶ {nN>‹S>m dJ© Ho$ {dÚm{W©¶m| H$m ñdÀN> ^maV A{^¶mZ Ho$ AÝVJ©V emar[aH$ Ed§ n¶m©daUr¶ OmJê$H$Vm
H$m Aܶ¶Z H$aZm&
emoY H$s n[aH$ënZm
1. gm‘mݶ dJ© Ho$ {dÚm{W©¶m| H$m ñdÀN> ^maV A{^¶mZ Ho$ AÝVJ©V emar[aH$ Ed§ n¶m©daUr¶ OmJê$H$Vm ‘|
H$moB© gmW©H$ AÝVa Zht h¡&
2. AZwgy{MV Om{V dJ© Ho$ {dÚm{W©¶m| H$m ñdÀN> ^maV A{^¶mZ Ho$ AÝVJ©V emar[aH$ Ed§ n¶m©daUr¶
OmJê$H$Vm ‘| H$moB© gmW©H$ AÝVa Zht h¡&
3. AZwgy{MV OZOm{V dJ© Ho$ {dÚm{W©¶m| H$m ñdÀN> ^maV A{^¶mZ Ho$ AÝVJ©V Ho$ emar[aH$ Ed§ n¶m©daUr¶
OmJê$H$Vm ‘| H$moB© gmW©H$ AÝVa Zht h¡&

86
Journal of Shivaji University (Humanities and Social Sciences) ISSN : 0368 - 4199
Vol-53 / Issue -2 / July-Dec. 2020
4. Aݶ {nN>‹S>m dJ© Ho$ {dÚm{W©¶m| H$m ñdÀN> ^maV A{^¶mZ Ho$ AÝVJ©V emar[aH$ Ed§ n¶m©daUr¶ OmJê$H$Vm
‘| H$moB© gmW©H$ AÝVa Zht h¡&
gr‘m§H$Z
àñVwV emoY ‘ܶàXoe amÁ¶ Ho$ BÝXm¡a {Oco Ho$ ‘mܶ{‘H$ ñVar¶ {dÚmWu Omo {H$ H$jm 6 go 8dt VH$ Aܶ¶ZaVm|
H|${ÐV h¡& ݶmXe© H$m AmH$ma 80 {dÚm{W©¶m| Ho$ ê$n ‘| gw{ZpíMV {H$¶m J¶m& Omo {H$ gm‘mݶ, AZwgy{MV Om{V,
AZwgy{MV OZOm{V, Aݶ {nN>‹S>m dJ© Ho$ ~mcH$ Ed§ ~m{cH$mAm| ‘| g‘mZ ê$n go {d^m{OV hmoJm&
emoYmonH$aU
dV©‘mZ emoY ‘| emoYmWu Ûmam ñd{Z{‘©V OmJê$H$Vm CnH$aU H$m Cn¶moJ {H$¶m, Omo {H$ emar[aH$ Ed§ n¶m©daUr¶
OmJê$H$Vm H$mo Aܶ¶Z H$aVm h¡& Bg‘| 1 go 32 (emar[aH$ OmJê$H$Vm) 33 go 58 (n¶m©daUr¶ OmJê$H$Vm)
VrZ {~ÝXþ ‘mnZr Ho$ ê$n ‘| h¢& Omo {H$ gH$mamË‘H$ Am¡a ZH$mamË‘H$ AmBQ>‘ Ho$ {d^ŠV h¡, gH$mamË‘H$ H$s
ñH$mo[a¨H$ 3,2,1, go VWm ZH$mamË‘H$ H$s 1,2,3 go H$s h¡& emar[aH$ d n¶m©daUr¶ OmJê$H$Vm gyMr H$s ì¶m»¶m
156 go na A{V CËV‘& 104 go 156-AÀN>m& 58 go 104 - Am¡gV& 58 ¶m Bggo H$‘- Amg§VmofOZH$&
III. à{VeV Ho$ AmYma na {dícofU
àñVwV emoY ‘| emar[aH$ d n¶m©daUr¶ OmJê$H$Vm H$m Aܶ¶Z H$aZo hoVw à{VeV {d{Y H$m à¶moJ {H$¶m
J¶m&{Og‘| gd©àW‘ Vm{cH$m Ho$ ‘mܶ‘ go {dÚm{W©¶m| H$s emar[aH$ d n¶m©daUr¶ OmJê$H$Vm H$mo {d{^ÝZ dJm|©
Ho$ ‘mܶ‘ go Xem©¶m J¶m h¡&
Vm{cH$m H«$‘m§H$-1 {dÚm{W©¶m| H$s emar[aH$ d n¶m©daUr¶ OmJê$H$Vm H$m à{VeV {dícofU
gm‘mݶ AZwgy{MV Om{V AZwgy{MV OZOm{V Aݶ {nN>‹S>m dJ©
N>mÌ N>mÌmAm| N>mÌ N>mÌmAm| N>mÌ N>mÌmAm| N>mÌ N>mÌmAm|
em. n. em. n. em. n. em. n. em. n. em. n. em. n. em. n.
83.1
3
66.5
6
84.4
8
67.7
1
81.3
5
64.5
8
83.4
4
64.3
8
82.6
0
66.7
7
81.1
5
65.8
3
83.4
5
62.7
3
83.9
0
68.9
4
Vm{cH$m H«$‘m§H$-1 go ñnîQ> h¡ {H$ gm‘mݶ dJ© Ho$ {dÚm{W©¶m| Ho$ A§VJ©V N>mÌm| Zo emar[aH$ OmJê$H$Vm Ho$ AmYma
na 83.13 à{VeV à{V{H«$¶m 춺$ H$s h¡ VWm n¶m©daU OmJê$H$Vm Ho$ AmYma na 66.56 à{VeV à{V{H«$¶m
A{^춺$ H$s h¡ VWm gm‘mݶ dJ© H$s N>mÌmAm| Zo emar[aH$ OmJê$H$Vm Ho$ AmYma na 84.48 VWm n¶m©daU
OmJê$H$Vm Ho$ AmYma na 67.71 à{V{H«$¶m A{^춺$ H$s h¡&

87
Journal of Shivaji University (Humanities and Social Sciences) ISSN : 0368 - 4199
Vol-53 / Issue -2 / July-Dec. 2020
AZwgy{MV Om{V dJ© Ho$ {dÚm{W©¶m| Ho$ A§VJ©V N>mÌm| Zo emar[aH$ OmJê$H$Vm Ho$ AmYma na 81.35 à{VeV
à{V{H«$¶m A{^춺$ H$s h¡ VWm n¶m©daUr¶ OmJê$H$Vm Ho$ AmYma na 64.58 à{VeV A{^춺$ H$s h¡& VWm
AZwgy{MV Om{V dJ© H$s N>mÌmAm| Zo emar[aH$ OmJê$H$Vm Ho$ AmYma na 83.44 à{VeV VWm n¶m©daUr¶
OmJê$H$Vm Ho$ AmYma na 64.38 à{V{H«$¶m A{^춺$ H$s h¡& AZwgy{MV OZOm{V Ho$ {dÚm{W©¶m| Ho$ A§VJ©V
N>mÌm| Zo emar[aH$ OmJê$H$Vm Ho$ AmYma na 82.60 à{VeV à{V{H«$¶m A{^춺$ H$s h¡ VWm n¶m©daU OmJê$H$Vm
Ho$ AmYma na 66.77 à{VeV à{V{H«$¶m 춺$ H$s h¡& AZwgy{MV OZOm{V H$s N>mÌmAm| Zo emar[aH$ OmJê$H$Vm
Ho$ AmYma na 81.15 à{VeV VWm n¶m©daUr¶ OmJê$H$Vm Ho$ AmYma na 65.83 à{VeV à{V{H«$¶m A{^춺$
H$s h¡&
Aݶ {nN>‹S>m dJ© Ho$ {dÚm{W©¶m| Ho$ A§VJ©V N>mÌm| Zo emar[aH$ OmJê$H$Vm Ho$ AmYma na 83.45 à{VeV à{V{H«$¶m
춺$ H$s h¡ VWm n¶m©daU OmJê$H$Vm Ho$ AmYma na 62.73 à{VeV à{V{H«$¶m A{^춺$ H$s h¡& Aݶ {nN>‹S>m
dJ© ‘| N>mÌmAm| Zo emar[aH$ OmJê$H$Vm Ho$ AmYma na 83.90 à{VeV VWm n¶m©daUr¶ OmJê$H$Vm Ho$ AmYma
na 68.94 à{VeV à{V{H«$¶m A{^춺$ H$s h¡&
AmaoI H«$. 1 Ho$ AdcmoH$Z go kmV hmoVm h¡ {H$ Mmam| dJ© Ho$ {dÚmWu emar[aH$ OmJê$H$Vm ‘| cJ^J 80 à{VeV
A§H$ àmá H$aVo h¡, co{H$Z n¶m©daUr¶ OmJê$H$Vm ‘| CZH$m à{VeVm§H$ cJ^J 65 go 68 à{VeV VH$ hr OmVm
h¡& Omo {H$ CZH$s eara {H$ à{V A{YH$ OmJê$H$Vm H$mo àX{e©V H$aVm h¡&
AmaoI H«$. 1 {dÚm{W©¶m| H$s emar[aH$ d n¶m©daUr¶ OmJê$H$Vm H$m à{VeV {dícofU-

88
Journal of Shivaji University (Humanities and Social Sciences) ISSN : 0368 - 4199
Vol-53 / Issue -2 / July-Dec. 2020
n[aH$ënZmAm| H$m g˶mnZ
àñVwV emoY H$mo g’$c Ed§ nyU© ~ZmZo Ho$ {cE àXÎmm| H$m g§H$cZ {H$¶m J¶m& CZ àXÎmm| H$mo ñdÀN> ^maV
A{^¶mZ Ho$ à{V {d{^ÝZ dJm|© Ho$ N>mÌ d N>mÌmAm| H$s emar[aH$ OmJê$H$Vm d n¶m©daUr¶ OmJê$H$Vm Ho$ ‘mܶ‘
go g§H${cV {H$¶m J¶m h¡&
n[aH$ënZm- gm‘mݶ dJ© Ho$ {dÚm{W©¶m| H$m ñdÀN> faV A{^¶mZ Ho$ A§VJ©V emar[aH$ Ed§ n¶m©daUr¶ OmJê$H$Vm
‘| H$moB© gmW©H$ A§Va Zht h¡& gm‘mݶ dJ© Ho$ {dÚm{W©¶m| H$m ñdÀN> ^maV A{^¶mZ Ho$ A§VJ©V emar[aH$
OmJê$H$Vm H$m Aܶ¶Z {H$¶m J¶m VWm g§~§{YV Am§H$‹S>m| H$m g§J«h {H$¶m J¶m& ‘ܶ‘mZ H$m A§Va {ZH$mcZo Ho$
~mX O-‘mZ {ZH$mcm J¶m& nwZ: O-‘mZ H$mo ñdV§ÌVm Ho$ ñVa na {‘cmZ H$aZo O Vm{cH$m ‘mZ Ho$ 0.01 Ed§
0.05 ñVa na ‘mZ go {‘cmZ {H$¶m J¶m& {OgH$m dU©Z {ZåZ Vm{cH$m H«$‘m§H$ 1 ‘| Xem©¶m J¶m h¡&
Vm{cH$m H«$‘m§H$ 1 gm‘mݶ dJ© Ho$ {dÚm{W©¶m| H$m ñdÀN> ^maV A{^¶mZ Ho$ A§VJ©V emar[aH$ Ed§ n¶m©daÊr¶
OmJê$H$Vm dU©Z-
Ma g§»¶m ‘mܶ àm‘m{UH$ {dMcZ
t ‘mZ t H$m Vm{cH$m ‘mZ
(N) (M) (SD) 0.05 0.01emar. OmJ. 80 79.8 7.28
0.50 1.990 2.639n¶m©. OmJ. 80 81.1 3.77
{ZîH$f©- ¶hm± O H$m ‘mZ XmoZm| ñVam| na gmW©H$ Zht h¡& ¶hm± O H$m ‘mZ 0.05 Am¡a 0.01 {dídmg ñVamo Ho$
‘mZ go H$‘ h¡ AV: Bg n[aH$ënZm H$mo ñdr.V {H$¶m OmVm h¡ AV: Cº$ n[aH$ënZm Ho$ AmYma na H$hm Om
gH$Vm h¡ H$s gm‘mݶ dJ© Ho$ {dÚm{W©¶m| H$m ñdÀN> ^maV A{^¶mZ Ho$ A§VJ©V emar[aH$ Ed§ n¶m©daU OmJê$H$Vm
‘| H$moB© gmW©H$ A§Va Zht h¡&
n[aH$ënZm- 2
Vm{cH$m-2 AZwgy{MV Om{V dJ© Ho$ {dÚm{W©¶m| H$m ñdÀN> ^maV A{^¶mZ Ho$ A§VJ©V emar[aH$ Ed§ n¶m©daUr¶
OmJê$H$Vm go àmá àmám§H$mo H$m ‘ܶ‘mZ Ho$ AmYma na Aܶ¶Z
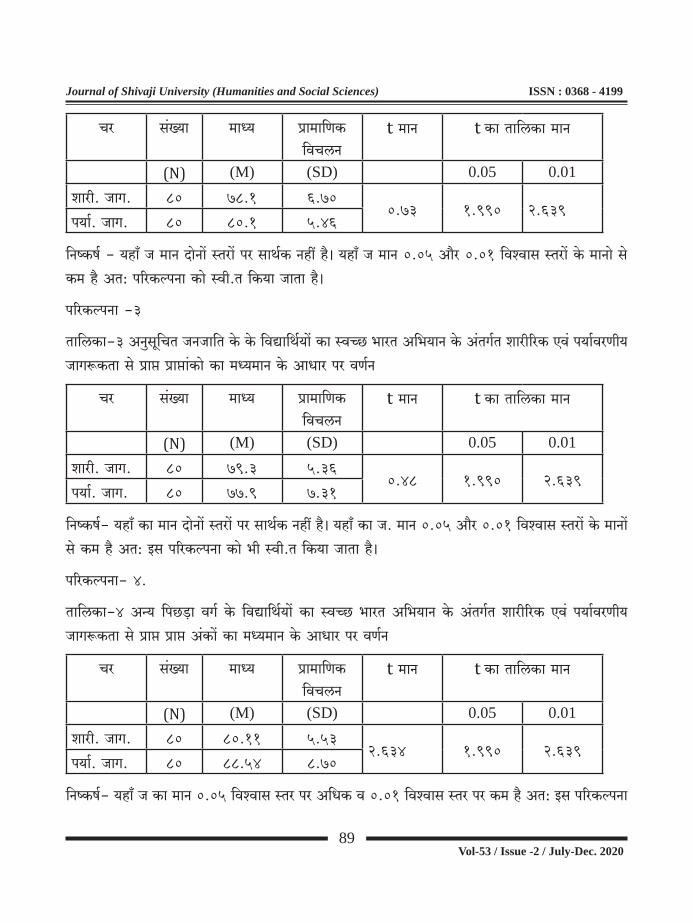
89
Journal of Shivaji University (Humanities and Social Sciences) ISSN : 0368 - 4199
Vol-53 / Issue -2 / July-Dec. 2020
Ma g§»¶m ‘mܶ àm‘m{UH$ {dMcZ
t ‘mZ t H$m Vm{cH$m ‘mZ
(N) (M) (SD) 0.05 0.01emar. OmJ. 80 78.1 6.70
0.73 1.990 2.639n¶m©. OmJ. 80 80.1 5.46
{ZîH$f© - ¶hm± O ‘mZ XmoZm| ñVam| na gmW©H$ Zht h¡& ¶hm± O ‘mZ 0.05 Am¡a 0.01 {dídmg ñVam| Ho$ ‘mZmo go
H$‘ h¡ AV: n[aH$ënZm H$mo ñdr.V {H$¶m OmVm h¡&
n[aH$ënZm -3
Vm{cH$m-3 AZwgy{MV OZOm{V Ho$ Ho$ {dÚm{W©¶m| H$m ñdÀN> ^maV A{^¶mZ Ho$ A§VJ©V emar[aH$ Ed§ n¶m©daUr¶
OmJê$H$Vm go àmá àmám§H$mo H$m ‘ܶ‘mZ Ho$ AmYma na dU©Z
Ma g§»¶m ‘mܶ àm‘m{UH$ {dMcZ
t ‘mZ t H$m Vm{cH$m ‘mZ
(N) (M) (SD) 0.05 0.01emar. OmJ. 80 79.3 5.36
0.48 1.990 2.639n¶m©. OmJ. 80 77.9 7.31
{ZîH$f©- ¶hm± H$m ‘mZ XmoZm| ñVam| na gmW©H$ Zht h¡& ¶hm± H$m O. ‘mZ 0.05 Am¡a 0.01 {dídmg ñVam| Ho$ ‘mZm|
go H$‘ h¡ AV: Bg n[aH$ënZm H$mo ^r ñdr.V {H$¶m OmVm h¡&
n[aH$ënZm- 4.
Vm{cH$m-4 Aݶ {nN>‹S>m dJ© Ho$ {dÚm{W©¶m| H$m ñdÀN> ^maV A{^¶mZ Ho$ A§VJ©V emar[aH$ Ed§ n¶m©daUr¶
OmJê$H$Vm go àmá àmá A§H$m| H$m ‘ܶ‘mZ Ho$ AmYma na dU©Z
Ma g§»¶m ‘mܶ àm‘m{UH$ {dMcZ
t ‘mZ t H$m Vm{cH$m ‘mZ
(N) (M) (SD) 0.05 0.01emar. OmJ. 80 80.11 5.53
2.634 1.990 2.639n¶m©. OmJ. 80 88.54 8.70
{ZîH$f©- ¶hm± O H$m ‘mZ 0.05 {dídmg ñVa na A{YH$ d 0.01 {dídmg ñVa na H$‘ h¡ AV: Bg n[aH$ënZm

90
Journal of Shivaji University (Humanities and Social Sciences) ISSN : 0368 - 4199
Vol-53 / Issue -2 / July-Dec. 2020
H$mo 0.05 {dídmg ñVa na {ZañV VWm 0.01 {dídmg ñVa na ñdr.V {H$¶m OmVm h¡& AV: Cº$ n[aH$ënZm Ho$
AmYma na H$hm Om gH$Vm h¡& Aݶ {nN>‹S>m dJ© Ho$ {dÚm{W©¶m| H$m ñdÀN> ^maV A{^¶mZ Ho$ A§VJ©V emar[aH$
Ed§ n¶m©daUr¶ OmJê$H$Vm H$m Aܶ¶Z ¶{X BÝht Am±H$‹S>m| Ho$ gmW 95 ~ma VH$ Vmo H$moB© A§Va Zhr Am¶oJm,
BgHo$ ~mX 99 ~ma VH$ XþhamZo na A§Va Am gH$Vm h¡&
IV. àñVwV emoY Ho$ {ZîH$f©
gm‘mݶ dJ©, AZwgy{MV Om{V dJ©, AZwgy{MV OZOm{V dJ© Ho$ {dÚm{W©¶m| H$m ñdÀN> ^maV A{^¶mZ Ho$ A§VJ©V
emar[aH$ Ed§ n¶m©daUr¶ OmJê$H$Vm ‘| H$moB© gmW©H$ A§Va Zht h¡& co{H$Z Aݶ {nN>‹S>m dJ© Ho$ {dÚm{W©¶m| H$m
ñdÀN> ^maV A{^¶mZ Ho$ A§VJ©V emar[aH$ Ed§ n¶m©daUr¶ OmJê$H$Vm ‘| gmW©H$ A§Va h¡&
e¡{jH$ {Z{hVmW© {dÚm{W©¶m| Ho$ {cE
1. n¶m©daUr¶ MoVZm Ho$ ApñVËd H$mo ~ZmE aIZo Ho$ {cE ha g§^d à¶ËZ H$aZm Mm{hE&
2. n¶m©daUr¶ g‘ñ¶mAm| Ho$ {cE {dÚm{W©¶m| H$mo J¡a {Oå‘oXma Zhr hmoZm Mm{hE&
3. emar[aH$ {ejm {dÚm{W©¶m| Ho$ emar[aH$ d ‘mZ{gH$ {dH$mg ‘| ghm¶Vm H$aVr h¡&
4. n¶m©daU g§ajU d ñdmñ϶ {ejm ‘| ghg§~§Y ñWm{nV H$aVr h¡&
5. {dÚmWu e¡{jH$ joÌ go g§~§{YV Cƒ {ejm àmá H$a Cgr joÌ ‘| AnZm ^{dî¶ {Z‘m©U H$a nmE§Jo&
{ejH$m| Ho$ {cE gwPmd
1. {ejH$ H$mo Cƒ {Xem ‘| n[adV©Z cmZo Ho$ {cE {dÚm{W©¶m| H$mo ghm¶Vm àXmZ H$aZo hoVw OmZH$mar àmá hmo
gH$Vr h¡&
2. {ejH$ {ZX}eZ XoH$a {dÚmWu ‘| dm§N>Zr¶ ~Xcmd H$a gH$Vo h¢&
3. {ejH$ AnZo VWm {dÚmWu Ho$ ‘ܶ gH$mamË‘H$ g§~§Y H$m {Z‘m©U H$a N>mÌ Ho$ OrdZ H$m {Z‘m©Vm ~Z gH$Vo
h¢&
4. {ejH$m| H$mo n¶m©daUr¶ d emar[aH$ OmJê$H$Vm Ho$ ‘hËd Ho$ ~mao ‘| ~Vm H$a Cgo OmJê$H$ H$aZo hoVw
àmoËgm{hV H$aZm Mm{hE&
5. {ejH$m| Ûmam ao{c¶m ZwŠH$‹S> ZmQ>H$ g^m VWm d¥jmamonU
6. H$m¶©H«$‘m| H$m Am¶moOZ H$aHo$ n¶m©daU g§ajU d emar[aH$ ñdÀN>Vm go {dÚm{W©¶m| H$mo AdJV H$amVo ahZm
Mm{hE&

91
Journal of Shivaji University (Humanities and Social Sciences) ISSN : 0368 - 4199
Vol-53 / Issue -2 / July-Dec. 2020
g§X^© J«§W gyMr
1. g§nyU© ñdÀN>Vm A{^¶mZ na {Xem {ZX}e Ûmam no¶Oc Amny{V© {d^mJ J«m‘rU {dH$mg ‘§Ìmc¶ ^maV
gaH$ma, ZB© {X„r
2. emoY Xn©U S>mBQ> H$moQ>m gÌ 2011-12
3. g§nyU© ñdÀN>Vm A{^¶mZ nwpñVH$m amÁ¶ Oc Ed§ ñdÀN>Vm {‘eZ amOñWmZ O¶nwa
4. M§XZo, {dcmg, à.{V Am¡a ‘mZd, {X„r g§X^© àH$meZ&
5. n¶m©daU Q>mBåg, {gV§~a 2000&
6. qgh, Ho$Xma ZmW, 21 dt gXr H$s dm{ZH$s, ZQ>amO npãceg©, ZB© {X„r
7. lrdmñVd, ‘ZmoO; n¶m©daU àXÿfU Ho$ IVao, ½cmo~c J«rÝg, Bcmhm~mX
8. http://india.gov.in/spotlight/swachhbharat-abhiyan-ek-kadam-chchta-ki-or
9. http://en.wikipedia.org/wiki/swachh_bharat_abhiyan
10. http://www.piblishingindia.com
11. http://www.enviromentmagazine.or
12. https://societyhealth.vcu.edu/media/society-health/pdf/EHI4StateBrief.pdf
13. https://bit.ly/3a6P2B1
14. https://www.quora.com/Why-is-India-spending-so-little-on-health-and-education
15. https://www.moneycontrol.com/news/india/its-official-rampur-in-uttar-pradesh-is-the-worst-city-to-live-in-2850571.html.

92
Journal of Shivaji University (Humanities and Social Sciences) ISSN : 0368 - 4199
Vol-53 / Issue -2 / July-Dec. 2020
Central State Fiscal Transfers: A Case Study of General Category States across Twelfth, Thirteenth and
Fourteenth Finance Commissions
7
Shrivardhini D. Talule1
1. Intern, Gokhale Institute of Politics and Economics (Deemed to be a University), BMCC Road, Deccan, Pune (MH), India, 411 004, Email: shrivardhinitalule2gmail.com, Contact: +91-9112847361.
Abstract:
Outstripping expenditure responsibilities of own taxes and revenue collection by sub-national governments is a common feature of fiscal federal structures across the world. This underlines the broad base of revenue collection authority of the national governments and the expenditure base of sub-national governments with their greater developmental expenditure responsibilities. This has increased the dependence of sub-national governments on the central fiscal transfers in mitigating the broad base of expenditure requirements both on the revenue and capital accounts. It is with this conclusive observation the present paper deals with the central transfer structure for a period between 2005-06 and 2019-20 which spans across three Finance Commissions (TFC, THFC and FFC) as does speak the title. The present paper is segmented into six sections with first sections dwelling upon the introduction, the second section sets the tone of review of literature. Third section of the present paper highlights the significance of the study and lists out the objectives while fourth section dwells upon in detail the sources of the data and tabulation methodology. Fifth section of the paper discusses the tabulation results and the last section (6th) concludes the entire exercise.
Keyword : Finance Commission, Revenue, Expenditure, Development, Fiscal, Taxes, Federalism.
I. Introduction:
Seventh schedule of the Indian constitution enlists the powers and expenditure responsibilities of national and subnational2 governments. Higher responsibilities of subnational governments of development expenditure with narrow revenue base and the broad base of revenue with lesser responsibilities of the national governments generates the dependence of subnationals on national governments with existence of

93
Journal of Shivaji University (Humanities and Social Sciences) ISSN : 0368 - 4199
Vol-53 / Issue -2 / July-Dec. 2020
healthy relations between the two (Rao, 2019). As Such fiscal scenario creates hard budget constraints at the subnational level, vertical fiscal transfers system becomes an inevitable instrument and feature in federations which softens the budget constraint and enables horizontal equity (Buchanan, 1950 and Boadway and Flatters, 1982). This is also evident in most of the developed nations following federal structure. In India, the statutory mechanism of Finance Commission for reducing the vertical imbalance and mitigating the subnational level development disparities is put in place. Article 275 of the constitution acknowledges these vertical imbalances and calls for setting up the Finance Commission every five years. Transfers from the centre to states comprise of entitled and discretionary transfers and the loans granted to the states from the centre. Of which the entitled transfers are awarded by statutorily autonomous Finance Commission. Prior to its dissolution, besides designing and funding its own development schemes the Planning Commission used to award discretionary transfers and dispersed required loans to the states. However, after its dissolution, the discretionary specific purpose transfers are awarded by the respective central ministries. The Finance Commission grants are crucial in mitigating the vertical imbalances while the erstwhile Planning Commission grants ensured the necessary policy reach required for inclusive regional development. The dissolution of the Planning Commission has thus created vacuum in the inclusive regional development strategy outreach of the central government (Kelkar, 2019). The Fourteenth Finance Commission (FFC) unprecedently increased the divisible pool of taxes from 32 to 42 percent. This, thus enabled the states in undertaking the required sectoral expenditure at their discretion which were otherwise deficient of spending. But, the transfers under the purview of central ministries are not immune to the political economy of fiscal federalism (Rao et. al., 2007). As this will further disable the states fiscally, in scenarios wherein the political alignments and misalignments play a vital role while determining the discretionary transfers. The introduction of the Goods and Services Tax (GST) has significantly cut down the own revenue base of the state governments. Thus, drastically increasing their dependence on central transfers.
It is with background pertinent to India’s federal architecture the present paper studies the patterns of states’ dependence across the general category states, excluding the states of Goa3 and Telangana4 . The paper further investigates the relations between the transfers
2. The terms ‘National’ and ‘Subnational’ Governments are used interchangeably with ‘Centre’ and ‘State’ Governments respectively.
94
Journal of Shivaji University (Humanities and Social Sciences) ISSN : 0368 - 4199
Vol-53 / Issue -2 / July-Dec. 2020
and states’ development expenditure pattern across the Twelfth (TFC), Thirteenth (THFC) and Fourteenth Finance Commission (FFC). It has covered the period of fifteen years ranging between 2005-06 and 2019-20.
While doing so the general category states are divided into the high, middle and low income category. This was to focus as to how the subnational level dependence on national transfers differs across their income base.
II. Review and the Context:
A large plethora of studies on the significance and political economy of central fiscal transfers and fiscal federalism in India and abroad are available in the public academic domain. To name few of the scholars in public economics are M. Govinda Rao, D.K. Shrivastava, A.K. Bagchi, Indira Rajaraman, Pulin Nayak, Nirvikar Singh, Avinash Dixit, Y.V. Reddy and C. Rangarajan are worth mentioning. For strengthening the conceptual understanding of this topic, the present author has reviewed six exemplary studies published in the form of acclaimed journal papers and professional reports.
(Rao, 2019) provide a theoretical base of the intergovernmental transfer system in India along with an empirical analysis of the same. The study further provides a detailed analysis of the three centrally funded schemes of Nation Health Mission (NHM), Sarva Shiksha Abhiyan (SSA) and Mahatma Gandhi Rural National Employment Guarantee Act (MGNREGA). The analysis studies the interrelationships between per capita GSDP and per capita expenditures for non-special category states using the regression model for estimating dependence between the two variables. The revenue raising capabilities of the States also play a significant risk in determining the per capita expenditure and transfer dependence of the States. The major revenue collection goes to the central government while the major chunk of expenditure in the form of providing public services falls under the jurisdiction of the state governments. Due to high order inequalities between Indian states, intergovernmental transfers are also an integral part of the Indian fiscal system. Non-special category states have varying degree of fiscal dependence on the inter-
3 The state of Goa besides being a small state has peculiar economic characteristics different than the other general category states (for example; incomparable high per capita GSDP). And despite being a general category state, Goa has been receiving central transfers on the lines of special category states. This makes us to exclude Goa from present study.
4 Telangana was created as a separate state by Parliament in 2014. Therefore, no comparable data pertaining to this state was available. Hence, the state is does not become the part of the present study.
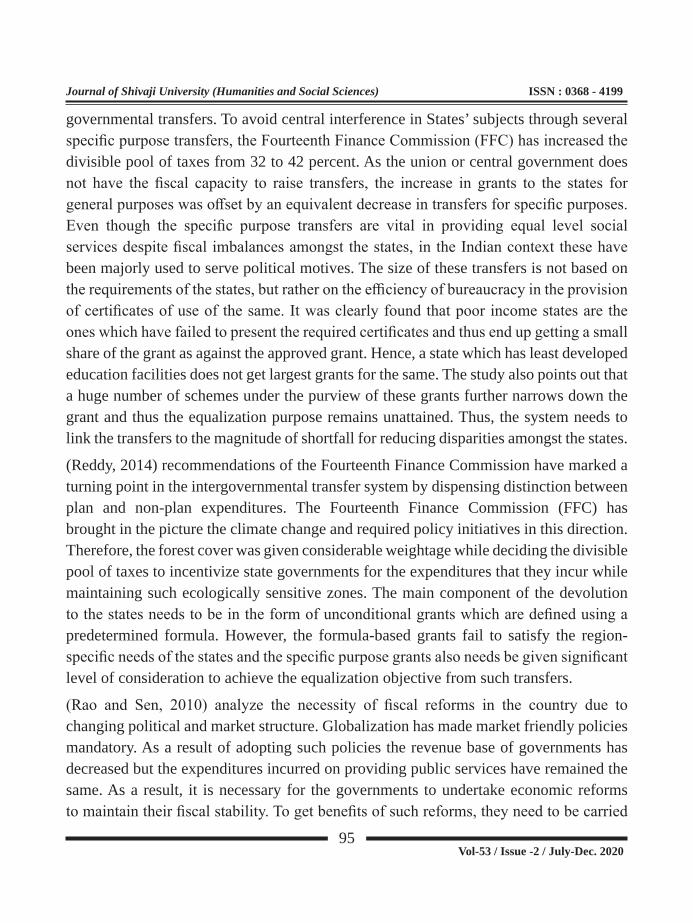
95
Journal of Shivaji University (Humanities and Social Sciences) ISSN : 0368 - 4199
Vol-53 / Issue -2 / July-Dec. 2020
governmental transfers. To avoid central interference in States’ subjects through several specific purpose transfers, the Fourteenth Finance Commission (FFC) has increased the divisible pool of taxes from 32 to 42 percent. As the union or central government does not have the fiscal capacity to raise transfers, the increase in grants to the states for general purposes was offset by an equivalent decrease in transfers for specific purposes. Even though the specific purpose transfers are vital in providing equal level social services despite fiscal imbalances amongst the states, in the Indian context these have been majorly used to serve political motives. The size of these transfers is not based on the requirements of the states, but rather on the efficiency of bureaucracy in the provision of certificates of use of the same. It was clearly found that poor income states are the ones which have failed to present the required certificates and thus end up getting a small share of the grant as against the approved grant. Hence, a state which has least developed education facilities does not get largest grants for the same. The study also points out that a huge number of schemes under the purview of these grants further narrows down the grant and thus the equalization purpose remains unattained. Thus, the system needs to link the transfers to the magnitude of shortfall for reducing disparities amongst the states.
(Reddy, 2014) recommendations of the Fourteenth Finance Commission have marked a turning point in the intergovernmental transfer system by dispensing distinction between plan and non-plan expenditures. The Fourteenth Finance Commission (FFC) has brought in the picture the climate change and required policy initiatives in this direction. Therefore, the forest cover was given considerable weightage while deciding the divisible pool of taxes to incentivize state governments for the expenditures that they incur while maintaining such ecologically sensitive zones. The main component of the devolution to the states needs to be in the form of unconditional grants which are defined using a predetermined formula. However, the formula-based grants fail to satisfy the region-specific needs of the states and the specific purpose grants also needs be given significant level of consideration to achieve the equalization objective from such transfers.
(Rao and Sen, 2010) analyze the necessity of fiscal reforms in the country due to changing political and market structure. Globalization has made market friendly policies mandatory. As a result of adopting such policies the revenue base of governments has decreased but the expenditures incurred on providing public services have remained the same. As a result, it is necessary for the governments to undertake economic reforms to maintain their fiscal stability. To get benefits of such reforms, they need to be carried
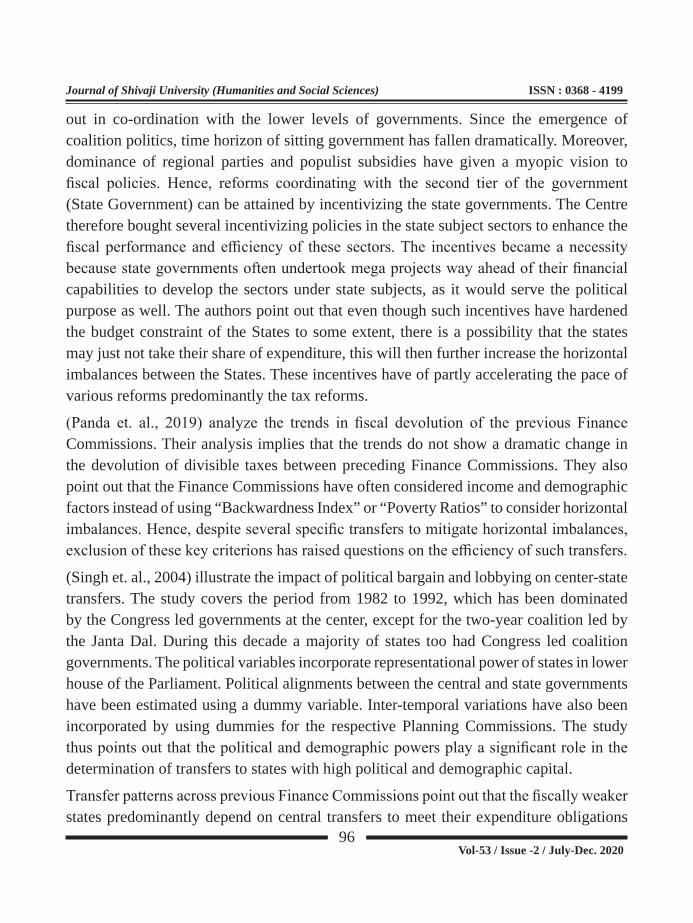
96
Journal of Shivaji University (Humanities and Social Sciences) ISSN : 0368 - 4199
Vol-53 / Issue -2 / July-Dec. 2020
out in co-ordination with the lower levels of governments. Since the emergence of coalition politics, time horizon of sitting government has fallen dramatically. Moreover, dominance of regional parties and populist subsidies have given a myopic vision to fiscal policies. Hence, reforms coordinating with the second tier of the government (State Government) can be attained by incentivizing the state governments. The Centre therefore bought several incentivizing policies in the state subject sectors to enhance the fiscal performance and efficiency of these sectors. The incentives became a necessity because state governments often undertook mega projects way ahead of their financial capabilities to develop the sectors under state subjects, as it would serve the political purpose as well. The authors point out that even though such incentives have hardened the budget constraint of the States to some extent, there is a possibility that the states may just not take their share of expenditure, this will then further increase the horizontal imbalances between the States. These incentives have of partly accelerating the pace of various reforms predominantly the tax reforms.
(Panda et. al., 2019) analyze the trends in fiscal devolution of the previous Finance Commissions. Their analysis implies that the trends do not show a dramatic change in the devolution of divisible taxes between preceding Finance Commissions. They also point out that the Finance Commissions have often considered income and demographic factors instead of using “Backwardness Index” or “Poverty Ratios” to consider horizontal imbalances. Hence, despite several specific transfers to mitigate horizontal imbalances, exclusion of these key criterions has raised questions on the efficiency of such transfers.
(Singh et. al., 2004) illustrate the impact of political bargain and lobbying on center-state transfers. The study covers the period from 1982 to 1992, which has been dominated by the Congress led governments at the center, except for the two-year coalition led by the Janta Dal. During this decade a majority of states too had Congress led coalition governments. The political variables incorporate representational power of states in lower house of the Parliament. Political alignments between the central and state governments have been estimated using a dummy variable. Inter-temporal variations have also been incorporated by using dummies for the respective Planning Commissions. The study thus points out that the political and demographic powers play a significant role in the determination of transfers to states with high political and demographic capital.
Transfer patterns across previous Finance Commissions point out that the fiscally weaker states predominantly depend on central transfers to meet their expenditure obligations

97
Journal of Shivaji University (Humanities and Social Sciences) ISSN : 0368 - 4199
Vol-53 / Issue -2 / July-Dec. 2020
(Rao et. al., 2014). It further emphasizes that even though the transfers under plan schemes are executed on the basis of a predetermined formula, the determination of formula is in itself discretionary. Thus, the transfers under plan schemes are categorized as discretionary transfers.
The overall conclusion that emerges from the afore reviewed six academic contributions is that all Indian states, despite their G/NSDP and G/NSDP per capita depend heavily on central transfers for attaining their developmental goals. But at the same time political economy of such transfers under fiscal federal structure with fiscally dominant Central Government cannot be ruled out. Because, the transfers being discretionary of nature the political alignment and dis-alignments between the Centre and states are equally predominant.
III. SignificanceoftheStudyandObjectives:
3.1 SignificanceoftheStudy:
As the central fiscal transfers are crucial in ensuring horizontal and vertical equity under fiscal federal structure like India, studying their pattern for considerably long period of time is important. Because, such studies help in bringing out not only the patterns of transfer but they form the mirror of state-specific development indices. The present study being conducted to ascertain the central transfers with special reference to the general category states across high, medium and low-income backgrounds, brings out not only the transfer patterns but also the dependence of these states on transfers in mitigating their developmental obligations is highlighted (for example Bihar, Uttar Pradesh, West Bengal, etc.). As the study spans over a period of three Finance Commissions respectively the Twelfth (TFC), Thirteenth (THFC) and Fourteenth (FFC) it also underlines the pattern of discretionary design of these commissions especially in respect of transfers. Panel data and correlation exercise carried out in the present study has brought out adequately the role and significance of transfers with respect to selected different income category states. It needs to be noted that the present study is original in nature of its data, tabulation and interpretation exercise for the chosen period of fifteen years (2005-06 TO 2019-20). The study also forms an extension of earlier few studies conducted on similar line which have chosen the period preceding the period of three Finance Commissions (TFC THFC and FFC) chosen for the present study. Therefore, the present study also succeeds in fulfilling the existing research gap in the domain of central-state fiscal transfers in India.

98
Journal of Shivaji University (Humanities and Social Sciences) ISSN : 0368 - 4199
Vol-53 / Issue -2 / July-Dec. 2020
3.2 ObjectivesoftheStudy:
The present study aims at the two objectives mentioned below.
1. To study the dependence of general category states on the central fiscal transfers across Twelfth (TFC), Thirteenth (THFC) and Fourteenth Finance Commission (FFC).
2. To ascertain whether the central transfers have their impact on the developmental expenditure of the selected states.
IV. Data Sources and Methodology:
Predominantly, the present paper relies on the secondary data sourced in from the RBI Annual reports on State Finance: A Study of Budgets. The data spans over for a period of fifteen year i.e., from 2005-06 to 2019-20. Thus, covering the periods of the Twelfth, Thirteenth and Fourteenth Finance Commission. Since, the study concentrates only on the revenue account expenditure and receipts of the states, the compiled data for the respective states consists of the following:
1. Development expenditure on Revenue Accounts.
2. Share in Central Taxes
3. Grants from the Centre.
Grants from the Centre covers three types of grants viz;
1. Central Plan Schemes
2. State Plan Schemes
3. Centrally Sponsored Schemes and
4. Non Plan Grants.
The central fiscal transfers are further divided into two broad categories of Statutory and Non-Statutory Transfers. Wherein, the Share in Central Taxes and non-plan grants comprise of statutory transfers and central plan schemes, the state plan schemes and centrally sponsored schemes were taken as non-statutory transfers.
As one of the objectives of the study is to empirically examine the relationship between the state-specific developmental expenditure on revenue account and central fiscal transfers to states, panel data analysis was carried out to ascertain the same. Wherein

99
Journal of Shivaji University (Humanities and Social Sciences) ISSN : 0368 - 4199
Vol-53 / Issue -2 / July-Dec. 2020
the individual state’s account for cross sectional dimension (k) and the respective years account for the time dimension (t). The individuality aspect of states, was tried to be captured either in a fixed effects or random effects model.
The estimated regression equation is as following:
Yit = bo + b1X1it + b2X2it + … +bkXkit + ai + eit
Yit : Dependent variable
Xk : Independent variable and k = 1, 2... k
Xkit : ith observation of kth independent variable at time t.
: Intercept term
: Unobserved explanatory variable which has captured individuality aspect of cross-sectional units.
eit : Residual error term.
The dependent variable Y represents states’ development expenditure (DEXP_n) and the independent variables represent the following:
X1 : Share in central taxes (SICT_n)
X2 : State Plan Schemes (SPS_n)
X3 : Central Plan Schemes (CPS)
X4 : Centrally Sponsored Schemes (CSS)
X5 : Non Plan Grants (NPG_n).
Hausman test was conducted for the choice of Fixed Effects vis-à-vis the Random Effects model. The results pertaining to the same are presented in section based on the empirical analysis of relationship between the development expenditure and transfers of the present paper (Section 5.4 and 5.4.1). As the main thrust of the present study is on analyzing the calculations of dependency analysis on which the analysis and findings of the same rest, are in the following chronology;
1. Proportion of state-specific total central transfers in total revenue receipts of states was calculated for which the statistical formula used was:
P1

100
Journal of Shivaji University (Humanities and Social Sciences) ISSN : 0368 - 4199
Vol-53 / Issue -2 / July-Dec. 2020
2. Proportion of state specific share of central taxes in total revenue receipts of states was calculated for which the statistical. Formula used was:
P2 =
3. Proportion of statutory transfers in total revenue receipts of states was calculated for which the statistical formula used was:
P3 =
4. Proportion of non-statutory transfers in total revenue receipts pf states was calculated for which the statistical formula used was:
P4 =
5. Proportion of state’s own revenue in total revenue receipts of state was calculated for which the statistical formula used was:
P5 =
VI. Results and Discussion:
This section of the paper analyses the decomposition of transfers to the states respectively for Twelfth (TFC), Thirteenth (THFC) and Fourteenth Finance (FFC) Commission. The transfers and respective states’ own revenue have been decomposed by dividing the states into three categories of High, Medium and Low-Income states. The Table 1 in annexure provides the understanding for such categorization of these states on the basis of their income see Table 1 in the Annexure.

101
Journal of Shivaji University (Humanities and Social Sciences) ISSN : 0368 - 4199
Vol-53 / Issue -2 / July-Dec. 2020
5.1 High Income States and Dependence on Transfers:
Source: Constructed Based on Annexure Table 1.
Notes:
1. P2 = Proportion of Shared taxes in Total Revenue Receipts
2. P3 = Proportion of Statutory Transfers in Total Revenue Receipts
3. P4 = Proportion of Non-Statutory Transfers in Total Revenue Receipts
Owing to high revenue raising capacities of these states (See Figure 1(a)), their own revenues make higher contributions to the revenue receipts than the total transfers from the Centre. This trend has been consistent for years under Twelfth (TFC) and Thirteenth Finance (THFC) Commission. The proportion of total transfers went up during the Fourteenth Finance Commission (FFC). The average transfers to the states increased by 4, 6, 7, 9 and 6 percentage points for Haryana, Maharashtra, Gujarat, Kerala, Punjab and Tamil Nadu respectively (See also Annexure Table 2). The increase in the transfers is predominantly accounted by the increased share of central taxes to the states. The proportion of non-statutory transfers to states remains negligible relative to the total revenue receipts of states with Tamil Nadu being the only exception. As for Tamil Nadu the aggregate share of non-statutory transfers went up from 8 to 12 percent in the Fourteenth Finance Commission (FFC) (See also Annexure Table 2). For Punjab, the significant increase in transfers is evident during the period of 2018-19 and 2019-20. As the share of total transfers shot up to 37 percent in 2018-19, the same stood at 44 percent
102
Journal of Shivaji University (Humanities and Social Sciences) ISSN : 0368 - 4199
Vol-53 / Issue -2 / July-Dec. 2020
in 2019-20. The rise in the share of total transfers was predominantly in terms of non-plan grants to the state. The proportion of share in central taxes hardly rose by 1 percent in 2018-19 and fell by 4 percentage points in 2019-20. The overall pattern of dependence of states on central transfers and states’ own revenue is clearly evident from figure 1 and Annexure Table
2.
Source: Constructed Based on Annexure Table 2.
Notes:
1. P1 = Proportion of Total transfers in Total Revenue Receipts of States
2. P5 = Proportion of State's Own Revenue in Total Revenue Receipts of States
5.2 Middle Income States and Dependence on Transfers:
The list of middle-income states comprises of Karnataka, Andhra Pradesh, West Bengal, Rajasthan, Chhattisgarh and Odisha. As the per capita state domestic product of (PCSDP) Karnataka is slightly lower than Tamil Nadu (the lowest PCSDP state in high income group), the state can be classified as the high-middle-income category state.

103
Journal of Shivaji University (Humanities and Social Sciences) ISSN : 0368 - 4199
Vol-53 / Issue -2 / July-Dec. 2020
Source: Constructed Based on Annexure Table 3.
Notes:
1. P2 = Proportion of Shared taxes in Total Revenue Receipts
2. P3 = Proportion of Statutory Transfers in Total Revenue Receipts
3. P4 = Proportion of Non-Statutory Transfers in Total Revenue Receipts
Source: Constructed Based on Annexure Table 4.

104
Journal of Shivaji University (Humanities and Social Sciences) ISSN : 0368 - 4199
Vol-53 / Issue -2 / July-Dec. 2020
Notes:
1. P1 = Proportion of Total transfers in Total Revenue Receipts of States
2. P5 = Proportion of State's Own Revenue in Total Revenue Receipts of States
Middle income states receive higher transfers from the Centre as compared to high-income states. Like the high-income states, the pattern of transfers over the course of Twelfth (TFC) and Thirteenth Finance (THFC) Commission has remained consistent. However, the average transfers to states during Fourteenth Finance Commission (FFC) show a significant rise. The average transfers to states like Karnataka, Andhra Pradesh, West Bengal, Rajasthan, Chhattisgarh and Odisha went up by 8, 12, 6, 6, 11 and 6 percentage points respectively (See Annexure Table 3 and Figure 2(a)). West Bengal and Odisha are found to be highly dependent on central transfers throughout the period of fifteen years. Hence, it is evident that the Own-revenue collection of these states has been lower than the proportional transfers. West Bengal and Odisha report the share of their own-revenue as low as 43 percent and 44 percent respectively of total revenue receipts.
5.3 Low-Income States and Dependence on Transfers:
Source: Constructed Based on Annexure Table 5.

105
Journal of Shivaji University (Humanities and Social Sciences) ISSN : 0368 - 4199
Vol-53 / Issue -2 / July-Dec. 2020
Notes:
1. P2 = Proportion of Shared taxes in Total Revenue Receipts
2. P3 = Proportion of Statutory Transfers in Total Revenue Receipts
3. P4 = Proportion of Non-Statutory Transfers in Total Revenue Receipts
Jharkhand, Madhya Pradesh, Uttar Pradesh and Bihar belong to the low-income category states. These states receive comparatively high transfers from the Centre in terms of both statutory as well as non-statutory transfers. Being the poorest state in the country Bihar has received highest transfers throughout the period (See Annexure Table 6 and Figure 3). This provides an evidentiary argument regarding the weak base of states’ own-revenue. However, the data points out that the transfers to Bihar have decreased during the Thirteenth Finance Commission (THFC) by 6 percent and again increased by 1 percent during the Fourteenth Finance Commissions (FFC) (see Annexure Table 5 and Figure 3(a)). The average total transfers as percentage of total revenue receipts of this state have decreased from 78 percent to 72 percent from Twelfth (TFC) to Thirteenth Finance (THFC) Commission. The average transfers show a small increase in the percentage of total transfers by 1 percent, (See Annexure Table 5). But this rise is quite negligible when compared with the rise in transfers for other states, during the same period. The remainder states in low-income category show similar pattern regarding the increased share of total transfers in revenue receipts of states. Similar, to high- and medium-income category states, the low-income states too witness such increase in transfers. These increments are in terms of shared central taxes during Fourteenth Finance Commission (FFC). The data also evidences that unlike the previous two income group category states, non-statutory transfers to have a considerable share in total transfers. the average share of non-statutory transfers for the entire period of fifteen years is 11 percent.
106
Journal of Shivaji University (Humanities and Social Sciences) ISSN : 0368 - 4199
Vol-53 / Issue -2 / July-Dec. 2020
Source: Constructed Based on Annexure Table 6.
Notes:
1. P1 = Proportion of Total transfers in Total Revenue Receipts of States
2. P5 = Proportion of State's Own Revenue in Total Revenue Receipts of States
5.4 Empirical Analysis of Relationship between Development Expenditure and Transfers Received by the States:
In this section we empirically determine whether the increasing transfers from the Centre have an impact on the development expenditure of states. Panel data model has been used to understand the intricacies between the development expenditure of states (which is taken as a control variable) and share in central taxes, state plan schemes, central plan schemes, centrally sponsored schemes and non-plan grants.
5.4.1 Relationship between Development Expenditure (DEXP_n) and Determinants of Central Transfers:

107
Journal of Shivaji University (Humanities and Social Sciences) ISSN : 0368 - 4199
Vol-53 / Issue -2 / July-Dec. 2020
Table 1: Correlation between the Dependent* and Independent** Variables
DEXP_n SICT_n SPS_n CPS CSS NPG_n
DEXP_n 1.0000
SICT_n 0.7532 1.0000
SPS_n 0.1052 0.1845 1.0000
CPS 0.1610 0.0320 0.18381 1.0000
CSS 0.7393 0.7616 -0.2745 -0.0213 1.0000
NPG_n 0.8150 0.6377 -0.0423 0.0291 0.7301 1.0000
Source: Author’s Compilations Using Stata.
Notes:
1. * = DEXP_n
2. ** = SICT_n, SPS_n, CPS, CSS and NPG_n.
Correlation results depicted in the above Table 1 illustrate that there is a high degree of correlation between the development expenditure of states and select categories of transfers. High positive correlation between DEXP_n and SICT_n implies linear relationship between the two. DEXP_n also shows high degree of positive correlation with the centrally sponsored schemes (CSS) and Non Plan Grants (NPG_n). This, thus implies that shared central taxes, centrally sponsored schemes and non-plan grants play a greater role in mitigating developmental deficiencies of states. State and central plan schemes too show positive correlation with development expenditure, but the magnitude of their impact is quite lower than these two categories. Inter-transfer correlation coefficients highlight some interesting facts. SPS and CSS do not have a linear relationship. At the same time CSS is negatively correlated with CPS as well. The non-plan grants too have negative relationship with the state plan schemes. Such non-linear relationship between select variables implies that an increase in one has led to a proportionate decline in the other. The results discussed above thus provided basis for estimating the impact these transfers have on development expenditure of the selected states, through panel data analysis. Owing to significant linear relationship between the development expenditure and transfer variables, we now proceed with the estimation of significance of the impact
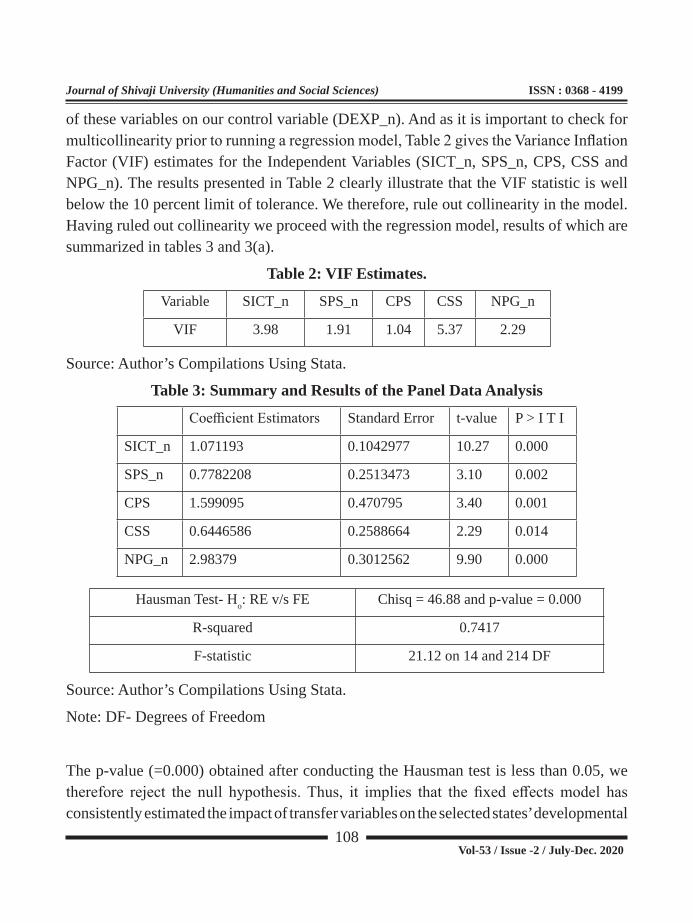
108
Journal of Shivaji University (Humanities and Social Sciences) ISSN : 0368 - 4199
Vol-53 / Issue -2 / July-Dec. 2020
of these variables on our control variable (DEXP_n). And as it is important to check for multicollinearity prior to running a regression model, Table 2 gives the Variance Inflation Factor (VIF) estimates for the Independent Variables (SICT_n, SPS_n, CPS, CSS and NPG_n). The results presented in Table 2 clearly illustrate that the VIF statistic is well below the 10 percent limit of tolerance. We therefore, rule out collinearity in the model. Having ruled out collinearity we proceed with the regression model, results of which are summarized in tables 3 and 3(a).
Table 2: VIF Estimates.
Variable SICT_n SPS_n CPS CSS NPG_n
VIF 3.98 1.91 1.04 5.37 2.29
Source: Author’s Compilations Using Stata.
Table 3: Summary and Results of the Panel Data Analysis
Coefficient Estimators Standard Error t-value P > I T I
SICT_n 1.071193 0.1042977 10.27 0.000
SPS_n 0.7782208 0.2513473 3.10 0.002
CPS 1.599095 0.470795 3.40 0.001
CSS 0.6446586 0.2588664 2.29 0.014
NPG_n 2.98379 0.3012562 9.90 0.000
Hausman Test- Ho: RE v/s FE Chisq = 46.88 and p-value = 0.000
R-squared 0.7417
F-statistic 21.12 on 14 and 214 DF
Source: Author’s Compilations Using Stata.
Note: DF- Degrees of Freedom
The p-value (=0.000) obtained after conducting the Hausman test is less than 0.05, we therefore reject the null hypothesis. Thus, it implies that the fixed effects model has consistently estimated the impact of transfer variables on the selected states’ developmental

109
Journal of Shivaji University (Humanities and Social Sciences) ISSN : 0368 - 4199
Vol-53 / Issue -2 / July-Dec. 2020
expenditure. SICT_n and NPG_n have positive and statistically significant coefficients. This implies that both the shared central taxes and non-plan grants, which jointly account for the entitlement transfers received by the states, are instrumental in enhancing their developmental expenditure. Estimates pertaining to State and Central Plan Schemes and Centrally Sponsored Schemes being positive and statistically significant, show that the discretionary transfers are vital in determining the states’ development expenditure on revenue account. However, these transfers are not that significant as in case of the shared central taxes and non-plan grants. The model gives R-squared value of 0.7417. The model brings out with an accuracy of 74 percent that the transfer variables are significant determinants of states’ development expenditure. This is for all the selected states for the present study. Therefore, in the fiscal federal structure like India entitled and discretionary transfers have the major role in bringing the horizontal equity among states. This is particularly in respect of their development indices. It is clearer from the example from low-income category states of Bihar and Uttar Pradesh. Both these states receive the greater amounts of these transfers (see also annex tables 5 and 6 and figure 3(a)). Obviously, this is with an objective of enabling them for achieving better developmental indices. The case of middle-income state of West Bengal shows that the state is also equally dependent on transfers like its low-income category counterparts of Bihar and Uttar Pradesh. This implies that the development attainments of West Bengal are also predominantly transfer determined (see also Annexure Table 3 and 4 and figure 2(a)).
VI. Concluding Remarks :
Narrow base of own tax revenue and relatively greater responsibilities of providing social services is constitutionally assigned to the subnational governments in India. This is not an exception when compared with several federations in the world. Therefore, vertical fiscal transfers from national to subnational level become critical in India. India is a country where the horizontal fiscal imbalances have been growing besides the vertical imbalances mainly accrued to the design of tax powers and the provision of public goods expenditure which is assigned in the constitution. Vertical transfers for ensuring horizontal equity and balanced regional development are also equally important for the integrity of its federal structure. For this purpose, the institutional architecture of transfers in the form of the Finance Commission, erstwhile Planning Commission and discretionary transfer structures have been taking the central stage. No doubt that the Fourteenth Finance Commission (FFC) has attempted to change the architecture of

110
Journal of Shivaji University (Humanities and Social Sciences) ISSN : 0368 - 4199
Vol-53 / Issue -2 / July-Dec. 2020
vertical transfers, the discretionary transfers in the form of ministerial and plan grants remain equally important. Now, given the stark income inequalities between Indian states, central fiscal transfers play a vital role in mitigating the same. The design and implementation of transfers system needs to be oriented towards inclusive subnational growth along with mitigating horizontal imbalances.
Decomposition of state-wise dependence on central transfers implies that the transfer system tries to ensure the required horizontal equity. Aggregate transfers to high income states across three Finance Commissions (TFC, THFC and FFC), range between 18 and 13 percent for Haryana. For other high-income group states, it was 21 and 27 percent for Maharashtra, 25 and 28 percent for Gujarat, 28 and 31 percent for Kerala, 21 and 34 percent for Punjab and 27 and 30 percent for Tamil Nadu. This pattern, thus implies that the total transfers as percentage of states’ revenue receipts have increased significantly. While the range of these increments is similar across the states, Punjab shows drastic changes in the of transfers that it receives as percentage of its revenue receipts. State’s own revenue percentage of Punjab has shrunk from 80 to 56 percent. This drastic increase in state’s dependence on central transfers may further have implications on its fiscal prudence. The low- and middle-income category states show a high degree of dependence on transfers than their high-income category counterparts. Except for West Bengal and Odisha, the middle-income states mirror similar dependence patter. Share of own revenues of West Bengal and Odisha have declined from 50 to 43 percent and 46 to 44 percent respectively. The degree of dependence shown by these two middle income states is similar to that realized across all low-income category states. The low-income category states relatively receive highest transfers due to their miserable own revenue base. The transfers, thus play a major role while achieving horizontal equity. Central transfers to sub-national governments can also prove to be crucial in enhancing their developmental expenditure. Thereby helping them in reaching comparable levels of developmental indices.
It is significant to note that the major part of increase in transfers seen across high, medium and low-income category states, is during the Fourteenth Finance Commission (FFC). Thus, mirroring the increased pool of devolved taxes to states. Since, the federal transfers’ system underwent institutional change before the commencement of the Fourteenth Finance Commission (FFC), during which the states have seen rise in their entitled transfers. As a result of this institutional change, the magnitude of discretionary

111
Journal of Shivaji University (Humanities and Social Sciences) ISSN : 0368 - 4199
Vol-53 / Issue -2 / July-Dec. 2020
transfers has experienced a relative decline. However, this does not have to imply that the magnitude or the role of discretionary transfers became redundant. The entire analysis of the data for fifteen years for all general category states shows that the transfers have a significant role in determining the developmental expenditure of these states. No doubt that the low-income category states depend more on transfers, the high-income states are also not an exception to it. Because, their public expenditure liabilities are also higher for mitigating the development requirements.
References:
1. Boadway, Robin and Frank Flatters (1982): Equalization in a Federal State: An Economic Analysis, Economic Council of Canada, Canadian Government Publishing House.
2. Buchanan, James M (1950): Federalism and Fiscal Equity, American Economic Review, Vol 40, No 4, pp 583–99.
3. Kelkar, Vijay (2019), Towards India’s New Fiscal Federalism, Working Paper No. 252, National Institute of Public Finance and Policy (NIPFP), New Delhi, January 25, 2019.
4. Panda, Manoj; Dasgupta, Purnamita; Joe, William (2019), Resource Sharing between Centre and States and Allocation across States: Some Issues in Balancing Equity and Efficiency, Institute of Economic Growth (IEG), New Delhi (Study Prepared for The Fifteenth Finance Commission of India).
5. Rao M. Govinda and Sen, K. Tapas (2011), Federalism and Fiscal Reform in India, Working Paper No. 2011-84, National Institute of Public Finance and Policy (NIPFP), New Delhi.
6. Rao, C. Bhujanga and Shrivastava D.K., (2014), Dependence of States on Central Transfers: State-wise Analysis, Working Paper No. 2014-137, National Institute of Public Finance and Policy (NIPFP), New Delhi.
7. Rao, M. Govinda (2015), Central Transfers to States in India Rewarding Performance While Ensuring Equity, NITI AAYOG, GoI, New Delhi.
8. Rao, M. Govinda (2919), Redesigning the Fiscal Transfer System in India, Economic and Political Weekly, August 03, 2019, Vol. XXXXXIV, No. XXXI.

112
Journal of Shivaji University (Humanities and Social Sciences) ISSN : 0368 - 4199
Vol-53 / Issue -2 / July-Dec. 2020
9. Rao, M. Govinda and Nirvikar Singh (2007), The Political Economy of India’s Fiscal Federal System and its Reforms, The Journal of Fiscal Federalism, Feb 2007.
10. Reddy, Y.V (2015), Fourteenth Finance Commission Continuity, Change and Way Forward, Economic and Political Weekly, May 23, 2015, Vol. XXXXX, No. XXI.
11. Singh, Nirvikar and Vasishtha, Garima (2004), Some Patterns in Centre-State Fiscal Transfers in India: An Illustrative Analysis, Economic and Political Weekly, November 06, 2004, Vol. XXXIX, No. XXXXV.
Annexure:
Table 1: Dependence of High-Income General Category States on Central Transfers.
State Finance Commission P1 P2 P3 P4 P5
Haryana12th FC 0.18 0.08 0.11 0.06 0.8213th FC 0.19 0.09 0.14 0.07 0.8114th FC 0.23 0.11 0.18 0.05 0.77
Maharashtra12th FC 0.21 0.10 0.14 0.08 0.7913th FC 0.21 0.11 0.14 0.07 0.7914th FC 0.27 0.14 0.20 0.07 0.73
Gujarat12th FC 0.25 0.14 0.17 0.07 0.7513th FC 0.21 0.12 0.14 0.06 0.7914th FC 0.28 0.16 0.20 0.08 0.72
Kerala12th FC 0.28 0.18 0.22 0.06 0.7213th FC 0.24 0.15 0.18 0.07 0.7614th FC 0.31 0.19 0.26 0.05 0.69
Punjab12th FC 0.21 0.09 0.15 0.05 0.7913th FC 0.23 0.12 0.17 0.09 0.7714th FC 0.34 0.18 0.28 0.06 0.72
Tamil Nadu12th FC 0.27 0.16 0.20 0.06 0.7313th FC 0.24 0.15 0.19 0.08 0.7614th FC 0.30 0.16 0.22 0.12 0.70
Source: Author’s Computations Based on Annexure Table 2.
Notes:
1. P1 = Proportion of Total transfers in Total Revenue Receipts of States
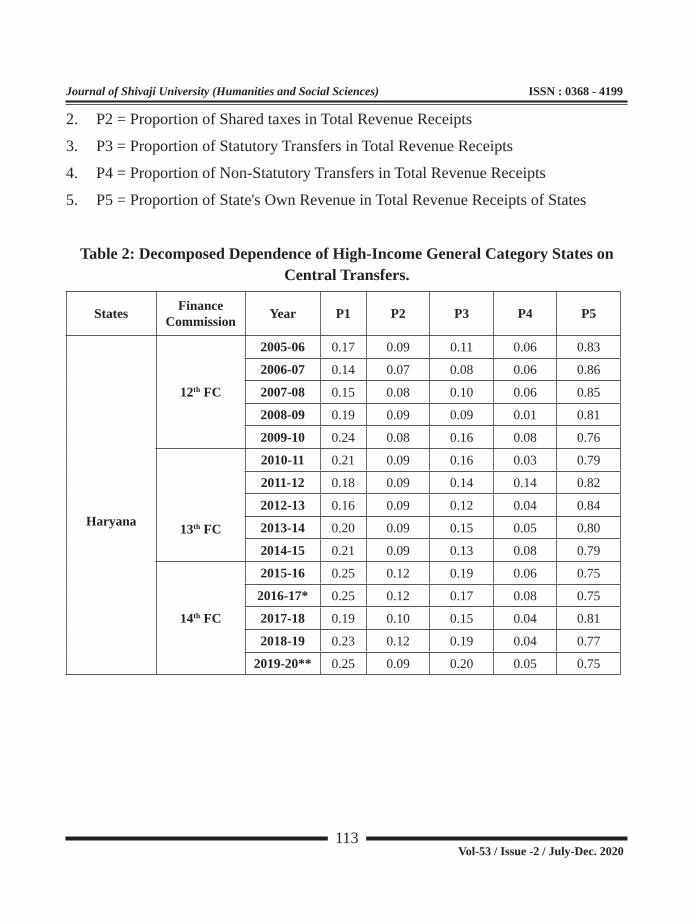
113
Journal of Shivaji University (Humanities and Social Sciences) ISSN : 0368 - 4199
Vol-53 / Issue -2 / July-Dec. 2020
2. P2 = Proportion of Shared taxes in Total Revenue Receipts
3. P3 = Proportion of Statutory Transfers in Total Revenue Receipts
4. P4 = Proportion of Non-Statutory Transfers in Total Revenue Receipts
5. P5 = Proportion of State's Own Revenue in Total Revenue Receipts of States
Table 2: Decomposed Dependence of High-Income General Category States on Central Transfers.
States FinanceCommission Year P1 P2 P3 P4 P5
Haryana
12th FC
2005-06 0.17 0.09 0.11 0.06 0.83
2006-07 0.14 0.07 0.08 0.06 0.86
2007-08 0.15 0.08 0.10 0.06 0.85
2008-09 0.19 0.09 0.09 0.01 0.81
2009-10 0.24 0.08 0.16 0.08 0.76
13th FC
2010-11 0.21 0.09 0.16 0.03 0.79
2011-12 0.18 0.09 0.14 0.14 0.82
2012-13 0.16 0.09 0.12 0.04 0.84
2013-14 0.20 0.09 0.15 0.05 0.80
2014-15 0.21 0.09 0.13 0.08 0.79
14th FC
2015-16 0.25 0.12 0.19 0.06 0.75
2016-17* 0.25 0.12 0.17 0.08 0.75
2017-18 0.19 0.10 0.15 0.04 0.81
2018-19 0.23 0.12 0.19 0.04 0.77
2019-20** 0.25 0.09 0.20 0.05 0.75

114
Journal of Shivaji University (Humanities and Social Sciences) ISSN : 0368 - 4199
Vol-53 / Issue -2 / July-Dec. 2020
Maharsahtra
12th FC
2005-06 0.19 0.10 0.14 0.05 0.81
2006-07 0.23 0.10 0.15 0.08 0.77
2007-08 0.19 0.10 0.12 0.07 0.81
2008-09 0.24 0.10 0.13 0.11 0.76
2009-10 0.22 0.09 0.14 0.09 0.78
13th FC
2010-11 0.21 0.11 0.13 0.08 0.79
2011-12 0.21 0.11 0.13 0.08 0.79
2012-13 0.21 0.11 0.15 0.06 0.79
2013-14 0.20 0.11 0.15 0.05 0.80
2014-15 0.23 0.11 0.14 0.09 0.77
14th FC
2015-16 0.24 0.15 0.18 0.07 0.76
2016-17* 0.30 0.15 0.19 0.11 0.70
2017-18 0.23 0.14 0.17 0.05 0.77
2018-19 0.27 0.15 0.21 0.06 0.73
2019-20** 0.30 0.12 0.23 0.07 0.70
Gujarat
12th FC
2005-06 0.24 0.13 0.16 0.08 0.76
2006-07 0.24 0.14 0.18 0.06 0.76
2007-08 0.26 0.15 0.19 0.08 0.74
2008-09 0.26 0.15 0.16 0.05 0.74
2009-10 0.23 0.14 0.16 0.07 0.77
13th FC
2010-11 0.21 0.13 0.14 0.03 0.79
2011-12 0.21 0.12 0.14 0.08 0.79
2012-13 0.20 0.12 0.15 0.02 0.80
2013-14 0.21 0.12 0.15 0.06 0.79
2014-15 0.23 0.11 0.14 0.09 0.77
14th FC
2015-16 0.25 0.16 0.18 0.07 0.75
2016-17* 0.30 0.17 0.19 0.10 0.70
2017-18 0.28 0.15 0.21 0.07 0.72
2018-19 0.31 0.17 0.24 0.06 0.69
2019-20** 0.24 0.14 0.17 0.07 0.76
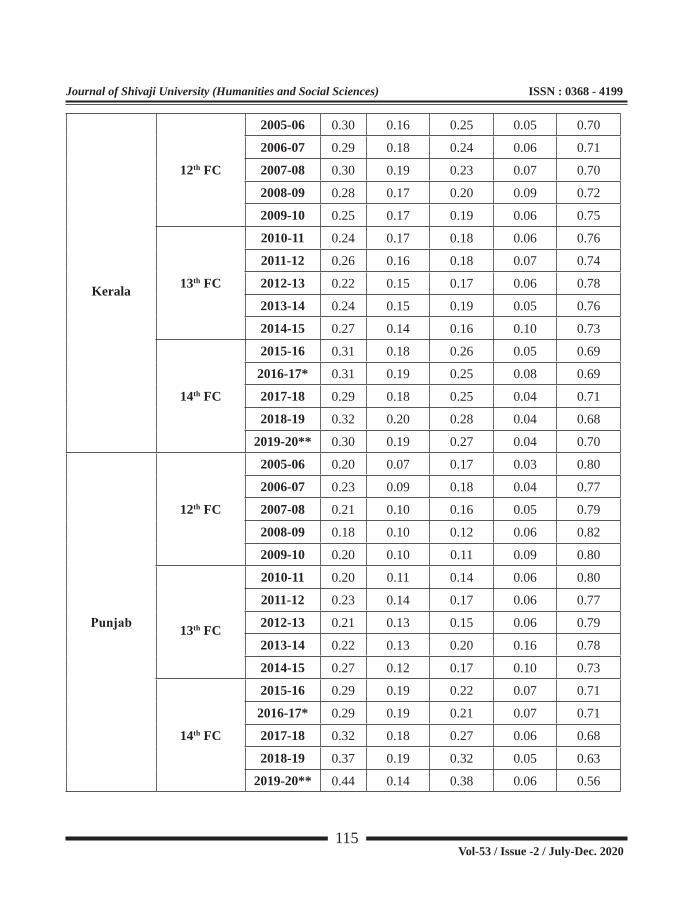
115
Journal of Shivaji University (Humanities and Social Sciences) ISSN : 0368 - 4199
Vol-53 / Issue -2 / July-Dec. 2020
Kerala
12th FC
2005-06 0.30 0.16 0.25 0.05 0.70
2006-07 0.29 0.18 0.24 0.06 0.71
2007-08 0.30 0.19 0.23 0.07 0.70
2008-09 0.28 0.17 0.20 0.09 0.72
2009-10 0.25 0.17 0.19 0.06 0.75
13th FC
2010-11 0.24 0.17 0.18 0.06 0.76
2011-12 0.26 0.16 0.18 0.07 0.74
2012-13 0.22 0.15 0.17 0.06 0.78
2013-14 0.24 0.15 0.19 0.05 0.76
2014-15 0.27 0.14 0.16 0.10 0.73
14th FC
2015-16 0.31 0.18 0.26 0.05 0.69
2016-17* 0.31 0.19 0.25 0.08 0.69
2017-18 0.29 0.18 0.25 0.04 0.71
2018-19 0.32 0.20 0.28 0.04 0.68
2019-20** 0.30 0.19 0.27 0.04 0.70
Punjab
12th FC
2005-06 0.20 0.07 0.17 0.03 0.80
2006-07 0.23 0.09 0.18 0.04 0.77
2007-08 0.21 0.10 0.16 0.05 0.79
2008-09 0.18 0.10 0.12 0.06 0.82
2009-10 0.20 0.10 0.11 0.09 0.80
13th FC
2010-11 0.20 0.11 0.14 0.06 0.80
2011-12 0.23 0.14 0.17 0.06 0.77
2012-13 0.21 0.13 0.15 0.06 0.79
2013-14 0.22 0.13 0.20 0.16 0.78
2014-15 0.27 0.12 0.17 0.10 0.73
14th FC
2015-16 0.29 0.19 0.22 0.07 0.71
2016-17* 0.29 0.19 0.21 0.07 0.71
2017-18 0.32 0.18 0.27 0.06 0.68
2018-19 0.37 0.19 0.32 0.05 0.63
2019-20** 0.44 0.14 0.38 0.06 0.56
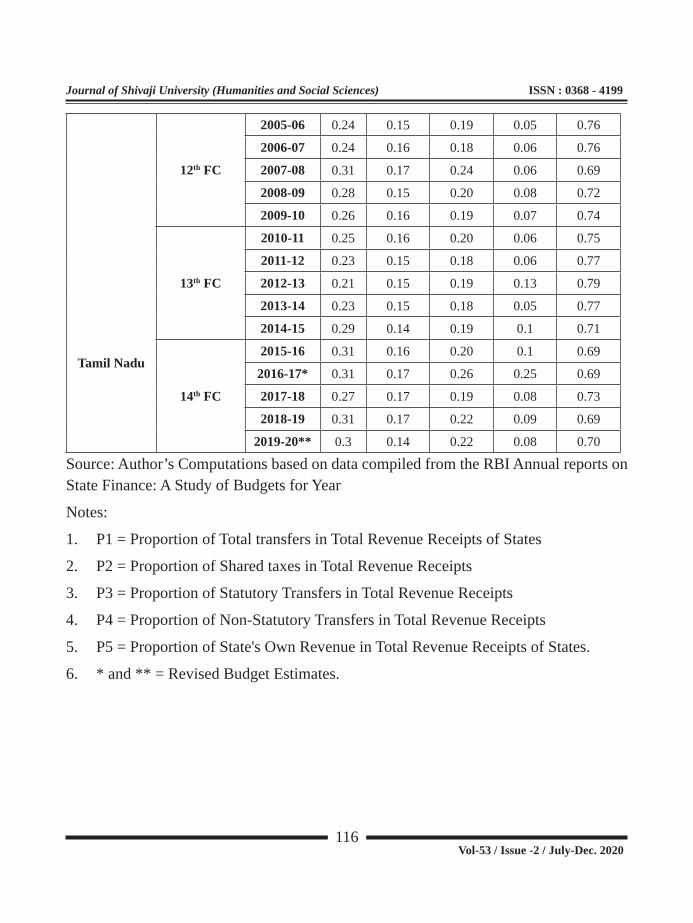
116
Journal of Shivaji University (Humanities and Social Sciences) ISSN : 0368 - 4199
Vol-53 / Issue -2 / July-Dec. 2020
Tamil Nadu
12th FC
2005-06 0.24 0.15 0.19 0.05 0.76
2006-07 0.24 0.16 0.18 0.06 0.76
2007-08 0.31 0.17 0.24 0.06 0.69
2008-09 0.28 0.15 0.20 0.08 0.72
2009-10 0.26 0.16 0.19 0.07 0.74
13th FC
2010-11 0.25 0.16 0.20 0.06 0.75
2011-12 0.23 0.15 0.18 0.06 0.77
2012-13 0.21 0.15 0.19 0.13 0.79
2013-14 0.23 0.15 0.18 0.05 0.77
2014-15 0.29 0.14 0.19 0.1 0.71
14th FC
2015-16 0.31 0.16 0.20 0.1 0.69
2016-17* 0.31 0.17 0.26 0.25 0.69
2017-18 0.27 0.17 0.19 0.08 0.73
2018-19 0.31 0.17 0.22 0.09 0.69
2019-20** 0.3 0.14 0.22 0.08 0.70
Source: Author’s Computations based on data compiled from the RBI Annual reports on State Finance: A Study of Budgets for Year
Notes:
1. P1 = Proportion of Total transfers in Total Revenue Receipts of States
2. P2 = Proportion of Shared taxes in Total Revenue Receipts
3. P3 = Proportion of Statutory Transfers in Total Revenue Receipts
4. P4 = Proportion of Non-Statutory Transfers in Total Revenue Receipts
5. P5 = Proportion of State's Own Revenue in Total Revenue Receipts of States.
6. * and ** = Revised Budget Estimates.

117
Journal of Shivaji University (Humanities and Social Sciences) ISSN : 0368 - 4199
Vol-53 / Issue -2 / July-Dec. 2020
Table 3: Dependence of Medium-Income General Category States on Central Transfers
States Fin Commission P1 P2 P3 P4 P5
Karnataka
12th FC 0.28 0.15 0.20 0.08 0.72
13th FC 0.27 0.16 0.16 0.07 0.73
14th FC 0.35 0.20 0.20 0.06 0.65
Andhra Pradesh
12th FC 0.32 0.20 0.23 0.09 0.68
13th FC 0.32 0.25 0.22 0.14 0.68
14th FC 0.47 0.25 0.32 0.14 0.53
West Bengal
12th FC 0.50 0.32 0.38 0.12 0.50
13th FC 0.51 0.31 0.37 0.14 0.49
14th FC 0.57 0.35 0.44 0.13 0.43
Rajasthan
12th FC 0.42 0.27 0.31 0.11 0.58
13th FC 0.39 0.25 0.29 0.10 0.61
14th FC 0.45 0.27 0.32 0.13 0.55
Chhattisgarh
12th FC 0.43 0.27 0.31 0.12 0.57
13th FC 0.42 0.24 0.26 0.15 0.58
14th FC 0.53 0.32 0.39 0.16 0.47
Odisha
12th FC 0.54 0.34 0.40 0.14 0.46
13th FC 0.50 0.31 0.36 0.14 0.50
14th FC 0.56 0.33 0.40 0.16 0.44
Source: Author’s Computations from Annex Table 4.
Notes:
1. P1 = Proportion of Total transfers in Total Revenue Receipts of States
2. P2 = Proportion of Shared taxes in Total Revenue Receipts
3. P3 = Proportion of Statutory Transfers in Total Revenue Receipts
4. P4 = Proportion of Non-Statutory Transfers in Total Revenue Receipts
5. P5 = Proportion of State's Own Revenue in Total Revenue Receipts of States.

118
Journal of Shivaji University (Humanities and Social Sciences) ISSN : 0368 - 4199
Vol-53 / Issue -2 / July-Dec. 2020
Table 4: Decomposed Dependence of Middle-Income General Category States on Central Transfers.
State Finance Commission Year P1 P2 P3 P4 P5
Karnataka
12th FC
2005-06 0.26 0.14 0.20 0.06 0.742006-07 0.26 0.13 0.16 0.10 0.742007-08 0.29 0.16 0.20 0.08 0.712008-09 0.29 0.17 0.20 0.08 0.712009-10 0.31 0.15 0.22 0.09 0.69
13th FC
2010-11 0.28 0.16 0.22 0.08 0.722011-12 0.28 0.16 0.19 0.09 0.722012-13 0.26 0.16 0.19 0.07 0.742013-14 0.26 0.15 0.17 0.03 0.742014-15 0.28 0.14 0.18 0.11 0.72
14th FC
2015-16 0.32 0.20 0.25 0.07 0.682016-17* 0.33 0.22 0.25 0.05 0.672017-18 0.34 0.19 0.26 0.08 0.662018-19 0.37 0.21 0.30 0.06 0.63
2019-20** 0.38 0.17 0.22 0.02 0.62
Andhra Pradesh
12th FC
2005-06 0.31 0.20 0.23 0.08 0.692006-07 0.31 0.20 0.23 0.09 0.692007-08 0.34 0.21 0.23 0.11 0.662008-09 0.32 0.19 0.22 0.09 0.682009-10 0.34 0.19 0.24 0.10 0.66
13th FC
2010-11 0.31 0.19 0.24 0.07 0.692011-12 0.31 0.19 0.23 0.08 0.692012-13 0.27 0.20 0.20 0.07 0.732013-14 0.28 0.20 0.23 0.05 0.722014-15 0.41 0.17 0.22 0.43 0.59
14th FC
2015-16 0.49 0.25 0.28 0.14 0.512016-17* 0.50 0.24 0.35 0.15 0.502017-18 0.46 0.25 0.32 0.15 0.542018-19 0.45 0.28 0.34 0.11 0.55
2019-20** 0.45 0.25 0.33 0.12 0.55

119
Journal of Shivaji University (Humanities and Social Sciences) ISSN : 0368 - 4199
Vol-53 / Issue -2 / July-Dec. 2020
West Bengal
12th FC
2005-06 0.52 0.28 0.41 0.11 0.482006-07 0.50 0.33 0.39 0.11 0.502007-08 0.52 0.36 0.39 0.13 0.482008-09 0.47 0.31 0.35 0.13 0.532009-10 0.48 0.32 0.35 0.12 0.52
13th FC
2010-11 0.50 0.34 0.39 0.11 0.502011-12 0.55 0.32 0.38 0.18 0.452012-13 0.49 0.31 0.37 0.12 0.512013-14 0.48 0.32 0.37 0.11 0.522014-15 0.53 0.28 0.32 0.20 0.47
14th FC
2015-16 0.60 0.34 0.45 0.15 0.402016-17* 0.61 0.35 0.44 0.16 0.392017-18 0.54 0.34 0.42 0.12 0.462018-19 0.55 0.37 0.44 0.11 0.45
2019-20** 0.57 0.36 0.45 0.12 0.43
Rajasthan
12th FC
2005-06 0.39 0.25 0.30 0.10 0.612006-07 0.41 0.26 0.31 0.10 0.592007-08 0.44 0.28 0.31 0.13 0.562008-09 0.44 0.27 0.31 0.13 0.562009-10 0.41 0.26 0.31 0.10 0.59
13th FC
2010-11 0.41 0.28 0.32 0.09 0.592011-12 0.39 0.26 0.31 0.08 0.612012-13 0.36 0.26 0.28 0.08 0.642013-14 0.37 0.25 0.30 0.08 0.632014-15 0.43 0.22 0.27 0.17 0.57
14th FC
2015-16 0.47 0.28 0.33 0.13 0.532016-17* 0.49 0.29 0.34 0.15 0.512017-18 0.45 0.26 0.29 0.16 0.552018-19 0.44 0.30 0.35 0.10 0.56
2019-20** 0.43 0.23 0.29 0.11 0.57

120
Journal of Shivaji University (Humanities and Social Sciences) ISSN : 0368 - 4199
Vol-53 / Issue -2 / July-Dec. 2020
Chhattisgarh
12th FC
2005-06 0.40 0.28 0.29 0.11 0.602006-07 0.43 0.28 0.31 0.12 0.572007-08 0.45 0.29 0.33 0.12 0.552008-09 0.44 0.27 0.31 0.13 0.562009-10 0.44 0.24 0.32 0.12 0.56
13th FC
2010-11 0.43 0.24 0.28 0.15 0.572011-12 0.43 0.24 0.29 0.14 0.572012-13 0.40 0.24 0.27 0.14 0.602013-14 0.39 0.25 0.25 0.07 0.612014-15 0.46 0.22 0.22 0.24 0.54
14th FC
2015-16 0.52 0.34 0.39 0.12 0.482016-17* 0.54 0.35 0.39 0.22 0.462017-18 0.53 0.31 0.37 0.16 0.472018-19 0.55 0.35 0.42 0.13 0.45
2019-20** 0.55 0.27 0.37 0.18 0.45
Odisha
12th FC
2005-06 0.54 0.35 0.42 0.11 0.462006-07 0.52 0.34 0.41 0.11 0.482007-08 0.57 0.36 0.41 0.16 0.432008-09 0.55 0.34 0.39 0.16 0.452009-10 0.54 0.32 0.38 0.15 0.46
13th FC
2010-11 0.52 0.32 0.38 0.14 0.482011-12 0.51 0.30 0.37 0.14 0.492012-13 0.47 0.32 0.35 0.12 0.532013-14 0.48 0.31 0.37 0.12 0.522014-15 0.51 0.28 0.32 0.19 0.49
14th FC
2015-16 0.55 0.34 0.39 0.16 0.452016-17* 0.60 0.35 0.39 0.18 0.402017-18 0.54 0.33 0.39 0.15 0.462018-19 0.55 0.35 0.41 0.13 0.45
2019-20** 0.57 0.27 0.41 0.16 0.43
Source: Author’s Computations based on the data compiled from the RBI Annual reports on State Finance: A Study of Budgets for Years.

121
Journal of Shivaji University (Humanities and Social Sciences) ISSN : 0368 - 4199
Vol-53 / Issue -2 / July-Dec. 2020
Notes:
1. P1 = Proportion of Total transfers in Total Revenue Receipts of States
2. P2 = Proportion of Shared taxes in Total Revenue Receipts
3. P3 = Proportion of Statutory Transfers in Total Revenue Receipts
4. P4 = Proportion of Non-Statutory Transfers in Total Revenue Receipts
5. P5 = Proportion of State's Own Revenue in Total Revenue Receipts of States.
6. * and ** = Revised Budget Estimates.
Table 5: Dependence of Low-Income General Category States on Central Transfers
States Finance Commission P1 P2 P3 P4 P5
Jharkhand
12th FC 0.53 0.35 0.40 0.14 0.46
13th FC 0.53 0.32 0.41 0.17 0.47
14th FC 0.57 0.37 0.43 0.14 0.43
Madhya Pradesh
12th FC 0.48 0.31 0.35 0.13 0.52
13th FC 0.46 0.29 0.33 0.14 0.54
14th FC 0.56 0.36 0.41 0.15 0.44
Uttar Pradesh
12th FC 0.53 0.39 0.43 0.098 0.47
13th FC 0.52 0.37 0.412 0.098 0.48
14th FC 0.54 0.39 0.432 0.112 0.45
Bihar
12th FC 0.78 0.56 0.63 0.15 0.22
13th FC 0.72 0.52 0.56 0.16 0.28
14th FC 0.73 0.49 0.55 0.18 0.27
Source: Author’s Computations from Annex Table 6.
Notes:
1. P1 = Proportion of Total transfers in Total Revenue Receipts of States
2. P2 = Proportion of Shared taxes in Total Revenue Receipts
3. P3 = Proportion of Statutory Transfers in Total Revenue Receipts
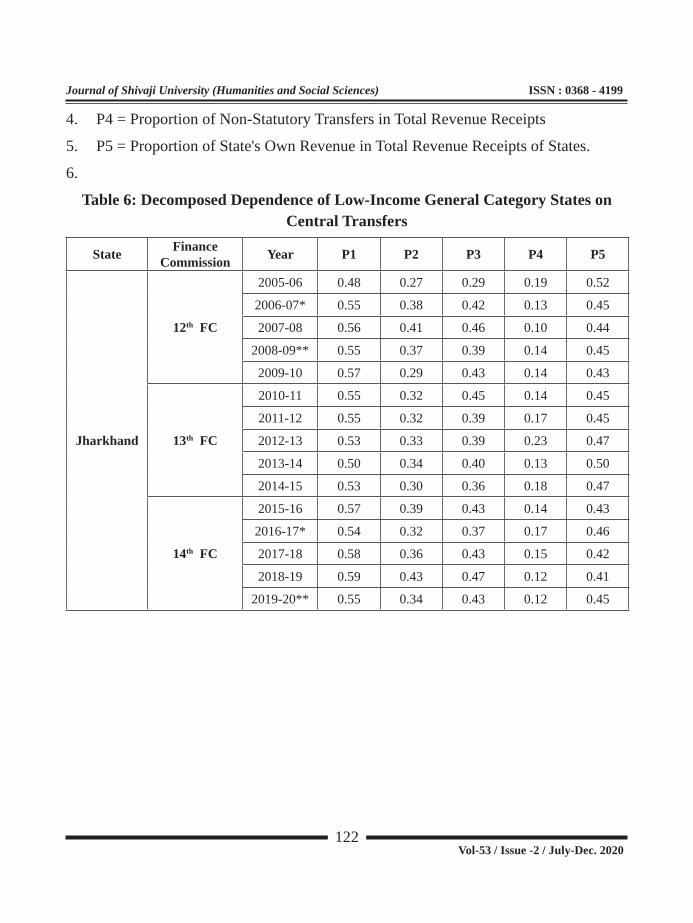
122
Journal of Shivaji University (Humanities and Social Sciences) ISSN : 0368 - 4199
Vol-53 / Issue -2 / July-Dec. 2020
4. P4 = Proportion of Non-Statutory Transfers in Total Revenue Receipts
5. P5 = Proportion of State's Own Revenue in Total Revenue Receipts of States.
6.
Table 6: Decomposed Dependence of Low-Income General Category States on Central Transfers
State Finance Commission Year P1 P2 P3 P4 P5
Jharkhand
12th FC
2005-06 0.48 0.27 0.29 0.19 0.52
2006-07* 0.55 0.38 0.42 0.13 0.45
2007-08 0.56 0.41 0.46 0.10 0.44
2008-09** 0.55 0.37 0.39 0.14 0.45
2009-10 0.57 0.29 0.43 0.14 0.43
13th FC
2010-11 0.55 0.32 0.45 0.14 0.45
2011-12 0.55 0.32 0.39 0.17 0.45
2012-13 0.53 0.33 0.39 0.23 0.47
2013-14 0.50 0.34 0.40 0.13 0.50
2014-15 0.53 0.30 0.36 0.18 0.47
14th FC
2015-16 0.57 0.39 0.43 0.14 0.43
2016-17* 0.54 0.32 0.37 0.17 0.46
2017-18 0.58 0.36 0.43 0.15 0.42
2018-19 0.59 0.43 0.47 0.12 0.41
2019-20** 0.55 0.34 0.43 0.12 0.45

123
Journal of Shivaji University (Humanities and Social Sciences) ISSN : 0368 - 4199
Vol-53 / Issue -2 / July-Dec. 2020
Madhya Pradesh
12th FC
2005-06 0.45 0.31 0.35 0.11 0.55
2006-07 0.49 0.31 0.35 0.14 0.51
2007-08 0.52 0.33 0.37 0.15 0.48
2008-09 0.49 0.32 0.35 0.14 0.51
2009-10 0.43 0.27 0.30 0.12 0.57
13th FC
2010-11 0.48 0.30 0.33 0.14 0.52
2011-12 0.45 0.29 0.32 0.12 0.55
2012-13 0.47 0.30 0.30 0.17 0.53
2013-14 0.46 0.30 0.35 0.11 0.54
2014-15 0.47 0.27 0.32 0.15 0.53
14th FC
2015-16 0.54 0.36 0.40 0.14 0.46
2016-17* 0.57 0.37 0.41 0.16 0.43
2017-18 0.56 0.34 0.37 0.19 0.44
2018-19 0.57 0.37 0.43 0.14 0.43
2019-20** 0.56 0.33 0.43 0.14 0.44
Uttar Pradesh
12th FC
2005-06 0.52 0.4 0.45 0.07 0.48
2006-07 0.51 0.38 0.43 0.09 0.49
2007-08 0.55 0.43 0.47 0.08 0.45
2008-09 0.54 0.4 0.44 0.11 0.46
2009-10 0.51 0.33 0.37 0.14 0.49
13th FC
2010-11 0.53 0.39 0.42 0.11 0.47
2011-12 0.52 0.38 0.42 0.1 0.48
2012-13 0.51 0.39 0.42 0.06 0.49
2013-14 0.51 0.37 0.42 0.09 0.49
2014-15 0.51 0.34 0.38 0.13 0.49
14th FC
2015-16 0.54 0.4 0.44 0.1 0.46
2016-17* 0.56 0.38 0.43 0.13 0.44
2017-18 0.54 0.39 0.44 0.1 0.46
2018-19 0.54 0.41 0.44 0.09 0.46
2019-20** 0.54 0.36 0.41 0.14 0.46

124
Journal of Shivaji University (Humanities and Social Sciences) ISSN : 0368 - 4199
Vol-53 / Issue -2 / July-Dec. 2020
Bihar
12th FC
2005-06 0.77 0.58 0.65 0.12 0.23
2006-07 0.80 0.58 0.65 0.15 0.20
2007-08 0.80 0.59 0.65 0.15 0.20
2008-09 0.78 0.54 0.61 0.16 0.22
2009-10 0.73 0.51 0.58 0.15 0.27
13th FC
2010-11 0.76 0.54 0.58 0.17 0.24
2011-12 0.74 0.54 0.59 0.14 0.26
2012-13 0.71 0.54 0.58 0.13 0.29
2013-14 0.69 0.51 0.55 0.13 0.31
2014-15 0.72 0.47 0.51 0.20 0.28
14th FC
2015-16 0.71 0.51 0.54 0.17 0.29
2016-17* 0.76 0.46 0.50 0.26 0.24
2017-18 0.72 0.50 0.60 0.11 0.28
2018-19 0.73 0.55 0.61 0.12 0.27
2019-20** 0.74 0.42 0.48 0.24 0.26
Source: Author’s Computations based on data compiled from the RBI Annual reports on State Finance: A Study of Budgets for Years
Notes:
1. P1 = Proportion of Total transfers in Total Revenue Receipts of States
2. P2 = Proportion of Shared taxes in Total Revenue Receipts
3. P3 = Proportion of Statutory Transfers in Total Revenue Receipts
4. P4 = Proportion of Non-Statutory Transfers in Total Revenue Receipts
5. P5 = Proportion of State's Own Revenue in Total Revenue Receipts of States.
6. * and ** = Revised Budget Estimates.