journal of steroid biochemistry and molecular biologydownload.xuebalib.com/xuebalib.com.9595.pdf ·...
TRANSCRIPT

R
Ea
Sa
b
a
ARR1A
K2ILsV2
C
S
0h
Journal of Steroid Biochemistry & Molecular Biology 136 (2013) 139– 145
Contents lists available at SciVerse ScienceDirect
Journal of Steroid Biochemistry and Molecular Biology
jo ur nal home page: www.elsev ier .com/ locate / j sbmb
eview
valuation of two automated immunoassays for 25-OH vitamin D: Comparisongainst LC–MS/MS
hilen A. Hsua, Joshua Soldob,∗, Manjula Guptaa
Cleveland Clinic, Department of Clinical Pathology, Cleveland, OH 44195, United StatesDiaSorin Inc., Stillwater, MN 55082, United States
r t i c l e i n f o
rticle history:eceived 10 July 2012eceived in revised form2 November 2012ccepted 18 November 2012
eywords:5-Hydroxyvitamin D
mmunoassayiquid chromatography–tandem masspectrometry (LC–MS/MS)itamin D25-OHD2
a b s t r a c t
Background/methods: A total of 95 human serum specimens, and a 12 specimen precision panel, weremeasured by 2 automated immunoassays (investigation use only DiaSorin LIAISON® 25 OH VitaminD TOTAL Assay [LSN], and Siemens ADVIA Centaur® Vitamin D Total (VitD) assay [Centaur]) and theresults compared against LC–MS/MS [LCMS] used as the reference method (Esoterix Inc.). For functionalsensitivity and precision, 12 serum specimens [range 1.2–148 ng/mL] were run in six replicates [N = 30]or four replicates [N = 20], respectively, for 5 consecutive days.Results: Passing–Bablok fit and Difference plot analysis [N = 92] showed that although both immunoassayshad comparable correlation coefficient [r] values to LCMS (0.936 and 0.933), the LSN assay results werestatistically equivalent to those given by LCMS (slope 0.93, intercept −2.5), whereas the results of theCentaur assay showed overall significant assay bias compared to LCMS (slope 1.30, intercept −15.8)and this bias was more significant for doses <30 ng/mL by LCMS [bias −30.4%; 95% limits of agreement−72.4% to 11.7%]. For specificity, based on 25-OHD2 and 25-OHD3 levels assessed by LCMS, we divided thespecimens into 2 groups, one with detectable 25-OHD2 [Group 1, N = 41] and the other with no detectible25OHD2 [Group 2, N = 51]. The 2 groups showed comparable correlation coefficient [r] values between themethods, but showed significant differences in slope: Centaur [1.48 with group 1 and 1.18 with group 2]compared to LSN [0.91 with Group 1 and 0.96 with Group 2]. LSN demonstrated better precision [total CVrange 5.5–10.0%] compared to Centaur [total CV range 11.0–16.3%]. Functional sensitivity was calculatedper EP-17A: 2.15 ng/mL by LSN and 4.57 ng/mL by Centaur.Conclusions: Though there was good overall correlation, substantial bias was present in Centaur. Although
LSN had a slope and intercept that was not significantly different than LCMS, Centaur had a significantlyhigher slope in specimens containing measurable 25-OHD2 levels, a large negative intercept and a signifi-cant negative dose bias for doses <30 ng/mL by LCMS, suggesting the Centaur assay would report a higherfrequency of patients with apparent vitamin D insufficiency/deficiency at the low end and apparentvitamin D toxicity at the high end compared against LCMS.This article is part of a Special Issue entitled ‘Vitamin D Workshop’.© 2012 Elsevier Ltd. All rights reserved.
ontents
1. Introduction . . . . . . . . . . . . . . . . . . . . . . . . . . . . . . . . . . . . . . . . . . . . . . . . . . . . . . . . . . . . . . . . . . . . . . . . . . . . . . . . . . . . . . . . . . . . . . . . . . . . . . . . . . . . . . . . . . . . . . . . . . . . . . . . . . . . . . . . . . 1402. Materials and methods. . . . . . . . . . . . . . . . . . . . . . . . . . . . . . . . . . . . . . . . . . . . . . . . . . . . . . . . . . . . . . . . . . . . . . . . . . . . . . . . . . . . . . . . . . . . . . . . . . . . . . . . . . . . . . . . . . . . . . . . . . . . . . . 140
2.1. Specimens . . . . . . . . . . . . . . . . . . . . . . . . . . . . . . . . . . . . . . . . . . . . . . . . . . . . . . . . . . . . . . . . . . . . . . . . . . . . . . . . . . . . . . . . . . . . . . . . . . . . . . . . . . . . . . . . . . . . . . . . . . . . . . . . . . . . 1402.2. Methods . . . . . . . . . . . . . . . . . . . . . . . . . . . . . . . . . . . . . . . . . . . . . . . . . . . . . . . . . . . . . . . . . . . . . . . . . . . . . . . . . . . . . . . . . . . . . . . . . . . . . . . . . . . . . . . . . . . . . . . . . . . . . . . . . . . . . . 140
3. Results . . . . . . . . . . . . . . . . . . . . . . . . . . . . . . . . . . . . . . . . . . . . . . . . . . . . . . . . . . . . . . . . . . . . . . . . . . . . . . . . . . . . . . . . . . . . . . . . . . . . . . . . . . . . . . . . . . . . . . . . . . . . . . . . . . . . . . . . . . . . . . . . 1403.1. Precision and sensitivity . . . . . . . . . . . . . . . . . . . . . . . . . . . . . . . . . . . . . . . . . . . . . . . . . . . . . . . . . . . . . . . . . . . . . . . . . . . . . . . . . . . . . . . . . . . . . . . . . . . . . . . . . . . . . . . . . . . . . 140
3.2. Specificity . . . . . . . . . . . . . . . . . . . . . . . . . . . . . . . . . . . . . . . . . . . . . . . . . . . . . . . . . . .3.3. Over range specimens . . . . . . . . . . . . . . . . . . . . . . . . . . . . . . . . . . . . . . . . . . . . . .
3.4. Accuracy . . . . . . . . . . . . . . . . . . . . . . . . . . . . . . . . . . . . . . . . . . . . . . . . . . . . . . . . . . . .
∗ Corresponding author at: Corporate Director Scientific Affairs, DiaSorin Inc.,tillwater, MN 55082, United States. Tel.: +1 651 351 5549.
E-mail address: [email protected] (J. Soldo).
960-0760/$ – see front matter © 2012 Elsevier Ltd. All rights reserved.ttp://dx.doi.org/10.1016/j.jsbmb.2012.11.005
. . . . . . . . . . . . . . . . . . . . . . . . . . . . . . . . . . . . . . . . . . . . . . . . . . . . . . . . . . . . . . . . . . . . . . . . . . 141
. . . . . . . . . . . . . . . . . . . . . . . . . . . . . . . . . . . . . . . . . . . . . . . . . . . . . . . . . . . . . . . . . . . . . . . . . . 141
. . . . . . . . . . . . . . . . . . . . . . . . . . . . . . . . . . . . . . . . . . . . . . . . . . . . . . . . . . . . . . . . . . . . . . . . . . 141

140 S.A. Hsu et al. / Journal of Steroid Biochemistry & Molecular Biology 136 (2013) 139– 145
4. Discussion . . . . . . . . . . . . . . . . . . . . . . . . . . . . . . . . . . . . . . . . . . . . . . . . . . . . . . . . . . . . . . . . . . . . . . . . . . . . . . . . . . . . . . . . . . . . . . . . . . . . . . . . . . . . . . . . . . . . . . . . . . . . . . . . . . . . . . . . . . . . 142Conflict of interest . . . . . . . . . . . . . . . . . . . . . . . . . . . . . . . . . . . . . . . . . . . . . . . . . . . . . . . . . . . . . . . . . . . . . . . . . . . . . . . . . . . . . . . . . . . . . . . . . . . . . . . . . . . . . . . . . . . . . . . . . . . . . . . . . . . 145Acknowledgements . . . . . . . . . . . . . . . . . . . . . . . . . . . . . . . . . . . . . . . . . . . . . . . . . . . . . . . . . . . . . . . . . . . . . . . . . . . . . . . . . . . . . . . . . . . . . . . . . . . . . . . . . . . . . . . . . . . . . . . . . . . . . . . . . . 145
. . . . . .
1
rmrhid
titsftvb
Mhriv[
o5mt
filhmOLmltpmrA(a2
2
2
lostp
References . . . . . . . . . . . . . . . . . . . . . . . . . . . . . . . . . . . . . . . . . . . . . . . . . . . . . . . . . . . .
. Introduction
The role of vitamin D in bone and mineral metabolism was firstecognized as a factor that could cure rickets [1]. However, vita-in D is now recognized as a pro-hormone which has multiple
oles in maintaining optimal health. More recently, several studiesave suggested that vitamin D insufficiency is associated with an
ncreasing risk of many chronic diseases including cardiovascularisease, cancer, infectious diseases and autoimmune diseases [2].
Vitamin D3 (cholecalciferol) and vitamin D2 (ergocalciferol) arehe most abundant forms of vitamin D in the body. Vitamin D3s synthesized in the skin from 7-dehydrocholesterol in responseo sunlight. The best nutrition sources of D3 are oily fish primaryalmon and mackerel. The best nutrition sources of D2 are yeast,ungi, and some vegetables. Vitamin D (D3 and D2) is convertedo 25-hydroxyvitamin D in the liver. The measurement of 25-OHitamin D (25-OHD) concentration in the serum or plasma is theest indicator of vitamin D nutritional status [3].
The optimal level of 25-OHD is subject to substantial debate.any, but not all experts accept >30 ng/mL as sufficient for bone
ealth. Vitamin D toxicity is a recognized problem but a rare occur-ence. Instead, a recent growing public health problem is vitamin Dnsufficiency. Several research studies have identified widespreaditamin D insufficiency in apparent healthy populations worldwide4–12].
Vitamin D deficiency is commonly treated with vitamin D2r D3 supplements ranging in dose from 50,000 IU/month to0,000 IU/week [2,13–15]. Fortified foods and nutrition supple-ents may contain either form. To ensure accurate assessment of
he total vitamin D both 25-OHD3 and 25-OHD2 must be measured.With the recognition of the high prevalence of vitamin D insuf-
ciency/deficiency in the general population, testing for 25-OHDevels has now become common clinical practice. The increasingigh-test volume requires a simple, reproducible, high-throughputethod that will accurately measure the total circulating 25-HD comprised of all circulating 25-OHD2 and 25-OHD3. WhileC–MS/MS [LCMS] traceable to NIST 972 standard referenceaterial is considered a reference assay [16], the automated chemi-
uminescent immunoassay platform [DiaSorin, LIAISON] has beenhe method of choice in our lab. In this study, we compared theerformance of the new FDA cleared Siemens ADVIA Centaur® Vita-in D Total (VitD) assay and an investigation use only (IUO) of the
ecently FDA cleared DiaSorin LIAISON® 25 OH Vitamin D TOTALssay against a liquid chromatography–tandem mass spectrometry
LC–MS/MS) assay used as the reference method. The IUO LIAISONssay was commercially available outside the U.S. in September011 and was subsequently FDA cleared in January 2012.
. Materials and methods
.1. Specimens
In November 2011, human serum specimens [N = 95] were col-ected from our routine workflow that spanned the assay range
f the current LIAISON® 25 OH Vitamin D TOTAL Assay and withufficient volumes for testing by DiaSorin LIAISON, Siemens Cen-aur, and Esoterix Inc. LC–MS/MS total 25-OHD. Each specimen wasartitioned into 2 aliquots – 1 being used for evaluation by the. . . . . . . . . . . . . . . . . . . . . . . . . . . . . . . . . . . . . . . . . . . . . . . . . . . . . . . . . . . . . . . . . . . . . . . . . 145
automated immunoassays and 1 for LC–MS/MS. All specimens andaliquots were frozen at −20 ◦C until the day of testing.
DiaSorin Inc. (Stillwater, MN) provided us with a panel of12 serum specimens purchased as human serum units fromGolden West Biologicals, Inc. (Temecula, CA) and tested by LCMS,for functional sensitivity and precision testing. Seven specimenswere labeled MF1–MF7 (105 aliquots; 15 aliquots per speci-men) that contained low 25-OHD concentrations by LC–MS/MS(1.2–16 ng/mL; 3–40 nmol/L), and 5 specimens were labeledMP1–MP5 (50 aliquots; 10 aliquots per specimen) that containedlow to high 25-OHD concentrations by LCMS (13.9–148 ng/mL;34.8–370 nmol/L). Specimens MP4 (103 ng/mL; 256 nmol/L) andMP5 (148 ng/mL or 370 nmol/L) by LCMS were prepared by spik-ing exogenous 25-OHD3 into the specimens, while specimensMF1–MF7 and MP1–MP3 were endogenous (non-spiked) humanserum specimens. All specimens and aliquots were frozen at −20 ◦Cuntil the day of testing.
2.2. Methods
In December 2011, a total of 95 frozen (−20 ◦C) human serumspecimens were thawed and tested in our laboratory using two dif-ferent automated immunoassays, an investigation use only (IUO)of the modified DiaSorin (Stillwater, MN, USA) LIAISON® 25 OHVitamin D TOTAL Assay [LSN], and the Siemens Healthcare Diagnos-tics (Tarrytown, NY, USA) ADVIA Centaur® Vitamin D Total (VitD)assay [Centaur]. All testing on the automated immunoassays wasperformed within the same day. Testing by Esoterix Inc. (CalabasasHills, CA, USA) LC–MS/MS Vitamin D [LCMS] was subsequently per-formed using aliquots taken from each serum specimen.
Precision and functional sensitivity studies were performed perCLSI EP-15-A2 over a 5-day period at the study site using fresh pre-cision panel specimen aliquots on each day of testing. The precisionspecimens were run in 4 replicates each day [N = 20], whereas thefunctional sensitivity specimens were run in 6 replicates each day[N = 30].
Passing–Bablok regression, Difference plot, Bland–Altman biasplot and 5-day precision analyses were performed using Analyze-itfor Microsoft Excel (version 2.26). Functional sensitivity calcu-lations were performed per CLSI EP-17A using a second orderpolynomial fit of the LSN and Centaur MF1–MF7 precision paneldata, and was defined as the dose at which the CV = 20% by thepolynomial fit equation.
3. Results
3.1. Precision and sensitivity
The precision panel was tested by LSN and Centaur for 5 con-secutive days using one reagent lot and one analyzer from eachmanufacturer, and doses were calculated using Day 1 calibration.A fresh aliquot of each specimen was used each day. In addition,a LCMS value was obtained for each panel specimen. The total CV(inter-assay CV) and repeatability CV (intra-assay CV) for the 12specimens were determined per CLSI EP15-A2 (Table 1).
For total 25-OHD serum concentrations less than 34.6 ng/mL(86.5 nmol/L) by LCMS, LSN total CV ranged from 5.9% at 30.5 ng/mL(76.3 nmol/L) to 18.8% at 2.5 ng/mL (6.3 nmol/L) and did not reachor exceed 10% CV until 7.0 ng/mL (17.5 nmol/L), and mean LSN
S.A. Hsu et al. / Journal of Steroid Biochemistry & Molecular Biology 136 (2013) 139– 145 141
Table 1Centaur demonstrated assay bias and inter- and intra-assay CV > 10% for doses <34.6 ng/mL by LCMS where clinically important decisions are made.
Precision specimen LCMS n LSN Centaur
ng/mL (nmol/L) Meanng/mL (nmol/L)
Total CV Repeatability CV Meanng/mL (nmol/L)
Total CV Repeatability CV
MF1 1.2 (3.0)
30
2.5 (6.3) 18.8% 13.9% 5.7 (14.3) 17.4% 14.3%MF2 2.3 (5.8) 3.4 (8.4) 18.1% 17.7% 6.8 (17.0) 17.4% 16.6%MF3 5.1 (12.8) 4.4 (11.1) 15.2% 8.4% 9.6 (24.0) 16.3% 13.3%MF4 4.5 (11.3) 4.9 (12.2) 12.4% 10.2% 7.9 (19.8) 13.7% 11.8%MF5 7.0 (17.5) 7.0 (17.5) 10.0% 9.5% 6.8 (17.0) 15.9% 11.2%MF6 9.7 (24.3) 9.0 (22.4) 6.8% 5.5% 7.6 (19.0) 14.7% 13.3%MF7 16.0 (40.0) 13.8 (34.5) 7.5% 7.5% 10.5 (26.3) 16.0% 14.9%
MP1 13.9 (34.5)
20
12.4 (31.0) 6.4% 5.6% 9.4 (23.5) 16.3% 14.2%MP2 25.5 (63.8) 22.2 (55.5) 5.5% 5.5% 17.8 (44.5) 11.0% 8.4%MP3 34.6 (86.5) 30.5 (76.3) 5.9% 5.2% 20.8 (52.0) 11.2% 10.3%MP4 103.0 (257.5) 70.6 (176.5) 4.2% 4.2% 80.9 (202.3) 4.1% 3.9%MP5 148.1 (370.3) 136.7 (341.8) 2.5% 2.5% 122.5 (306.3) 2.8% 2.7%
T SI EP1d uots w
dta2tf<
o(dah
3
wO2sp
LdibtwL
t2Optitdb1GwTsc
otal and repeatability precision (inter- and intra-assay CV) were completed per CLay for 5 consecutive days for a total of 30 replicates. Fresh MP1-MP5 specimen aliq
oses closely matched LCMS with minimal bias (Table 1). Forotal 25-OHD serum concentrations less than 34.6 ng/mL by LCMS,ll Centaur doses exceeded 11% CV and ranged from 11.2% at0.8 ng/mL (52.0 nmol/L) to 17.4% at 5.7 ng/mL (14.3 nmol/L). Addi-ionally, the Centaur assay showed significant negative assay biasor doses <34.6 ng/mL by LCMS and did not report any doses5 ng/mL (12.5 nmol).
Functional sensitivity was calculated per EP-17A using a secondrder polynomial fit of the LSN and Centaur precision panel dataspecimens MF1–MF7; N = 30 per specimen), and was defined as theose at which the CV = 20% by the polynomial fit equation. LSN had
calculated functional sensitivity 2.15 ng/mL (Fig. 1A) and Centaurad a calculated functional sensitivity 4.57 ng/mL (Fig. 1B).
.2. Specificity
For specificity, based on 25-OHD2 and 25-OHD3 levels by LCMS,e divided the specimens in to two groups, one with detectible 25-HD2 by LCMS [Group 1, N = 41], and the other with no detectible5OHD2 by LCMS [Group 2, N = 51] (Table 2). Regression analysishowed comparable correlation coefficient [r] values when com-aring the methods in each group (Table 3).
LSN Group 1 and Group 2 Passing–Bablok fits indicated theSN assay was statistically equivalent to LCMS with or withoutetectible 25-OHD2 (Table 3). LSN Difference plot analysis resulted
n a Group 1 mean LSN bias of −17.9%, and a Group 2 mean LSNias of −13.9%, both with uniform bias across the range of dosesested (Fig. 2A andB). Both Group 1 and Group 2 Difference plotsere very similar with or without detectible 25-OHD2 indicating
SN has equimolar specificity for both 25-OHD2 and 25-OHD3.Centaur Group 1 and Group 2 Passing–Bablok fits indicated
he Centaur assay had a significantly larger slope with detectible5-OHD2 by LCMS as compared to the slope without detectible 25-HD2, suggesting the presence of 25-OHD2 results in a significantositive assay bias or higher values compared to specimens con-aining only 25-OHD3 (Table 3). Difference plot analysis resultedn a group 1 mean Centaur bias of 0.80%, and a group 2 mean Cen-aur bias of −22.6%, both with non-uniform bias across the range ofoses tested (Fig. 2C and D). When there was detectable 25-OHD2y LCMS the upper 95% Limits of Agreement was 53.8% compared to9.3% when there was no detectable 25-OHD2 by LCMS. Moreover,roup 2 had a lower 95% Limits of Agreement of −64.4% when there
as no detectable 25-OHD2 by LCMS while Group 1 was −52.2%.hese results further suggest the presence of 25-OHD2 results in aignificant Centaur positive assay bias, or higher specimen levels,ompared to specimens containing only 25-OHD3.
5-A2. Fresh MF1–MF7 precision specimen aliquots were tested in 6 replicates perere tested in 4 replicates per day for 5 consecutive days for a total of 20 replicates.
3.3. Over range specimens
Three out of 95 specimens had values above the assay range (>150 ng/mL or >375 nmol/L) in one or both immunoassays and werediluted and read in order to calculate a dilution-corrected value(Table 4). Specimen A had no detectable 25-OHD2 by LCMS, and fol-lowing dilution, led to a corrected value of 198 ng/mL (495 nmol/L)by LSN, and 161.2 ng/mL (403 nmol/L) by Centaur, as compared to177 ng/mL (442.5 nmol/L) by LCMS (Table 4). This corrected valueis consistent with the neat specimen being outside of the LSN andCentaur assay range. Specimens B and C initially read above theCentaur assay range, but gave dilution corrected values substan-tially below 150 ng/mL (375 nmol/L) and in much better agreementwith the LCMS values, suggesting that the Centaur neat readings arefalsely out of range high. Specimens B and C also had very high levelsof detectable 25-OHD2 by LCMS (90 and 120 ng/mL, respectively),further suggesting the presence of 25-OHD2 results in a significantCentaur positive assay bias.
LSN agreed well with LCMS for Specimen B (96.6 ng/mLand 101 ng/mL, respectively). However, LSN read Specimen C38.4% lower than LCMS (79.2 ng/mL and 129 ng/mL, respectively)(Table 4). Although LSN had a mean bias of −17.9% with a 95% Limitsof Agreement of −48.2% to 12.3% with Group 1 compared againstLCMS, and the LSN result for Specimen C was within the reported95% limits of agreement for Group 1, all study results were single-ton (only a single replicate), and not duplicate (Fig. 2A). It is notknown if the LSN, LCMS or both would have resulted in a differentdose upon retest. A low LSN dose, or high LCMS dose, could havebeen due to random variability of the methods being compared, orit could have been specimen specific.
3.4. Accuracy
Three out of 95 specimens had values above the assay range inone or both immunoassays and were not included in the analysis.Regression analysis showed comparable correlation coefficient [r]values when comparing the methods (Table 5).
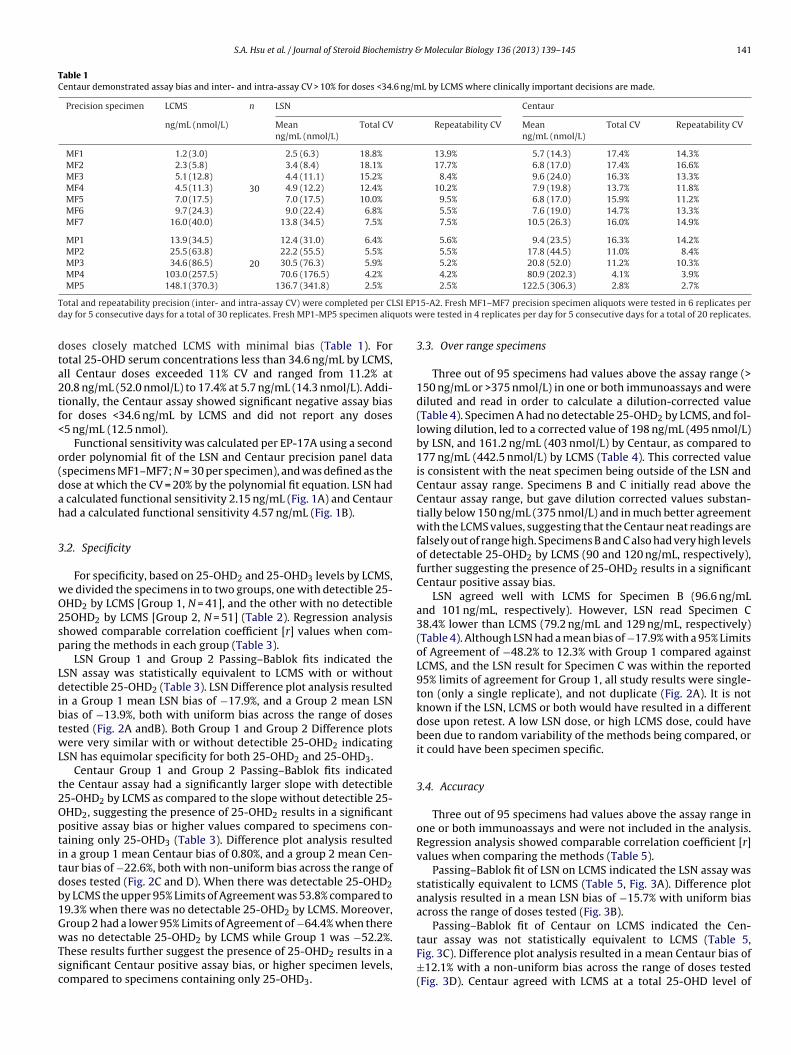
Passing–Bablok fit of LSN on LCMS indicated the LSN assay wasstatistically equivalent to LCMS (Table 5, Fig. 3A). Difference plotanalysis resulted in a mean LSN bias of −15.7% with uniform biasacross the range of doses tested (Fig. 3B).
Passing–Bablok fit of Centaur on LCMS indicated the Cen-
taur assay was not statistically equivalent to LCMS (Table 5,Fig. 3C). Difference plot analysis resulted in a mean Centaur bias of±12.1% with a non-uniform bias across the range of doses tested(Fig. 3D). Centaur agreed with LCMS at a total 25-OHD level of
142 S.A. Hsu et al. / Journal of Steroid Biochemistry & Molecular Biology 136 (2013) 139– 145
F g/mL( r CLSIo replic
4trn
−7ae(t3−
at
TS
S
TC2
S2
TC
Od
ig. 1. While LSN demonstrated a good %CV versus dose correlation from 2.5 to 13.8 nB). Total and repeatability precision (inter- and intra-assay CV) were completed perder polynomial fit. Fresh MF1–MF7 precision specimen aliquots were tested in 6
4 ng/mL (110 nmol/L) only (calculated by the position at whichhe Passing–Bablok fit crosses the line of identity), with Centaureading systematically higher than LCMS above this level, and sig-ificantly lower below this level.
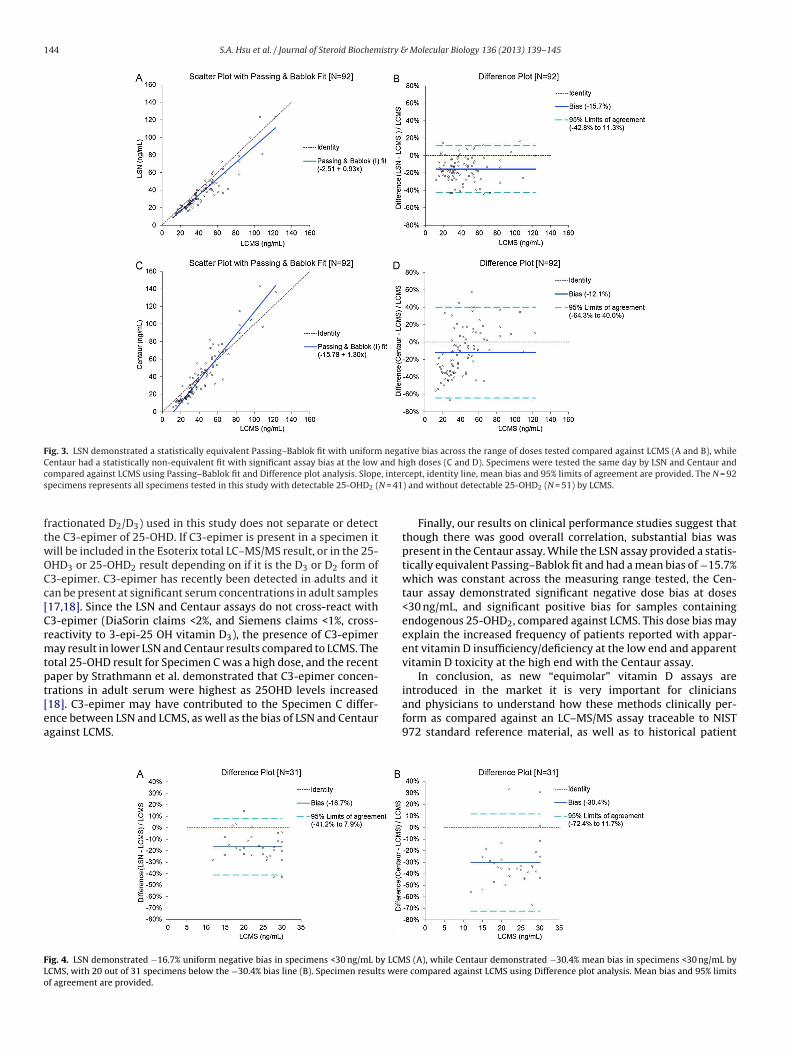
For doses <30 ng/mL by LCMS, the LSN assay exhibited a uniform16.7% mean bias with a 95% limits of agreement from −41.2% to.9% (Fig. 4A), while Centaur assay exhibited −30.4% mean bias with
95% limits of agreement from −72.4% to 11.7% (Fig. 4B). Furtherxamination of the results indicated that 20 out of 31 specimens64.5%) were more than 29.1% lower (mean −41.7%, 95% CI −46.0%o −37.4%) by Centaur compared against LCMS, while only 2 out of1 LSN samples (6.5%) were more than 28.3% lower (−43.0% and
43.2%) compared against LCMS.To further assess the patient outcomes from LSN and Centaurssay usage, we plotted the frequency of patients by dose for allhree methods (Fig. 5A–C). Results show similar histograms for
able 2pecimens tested by LCMS were divided into two groups, one with detectable 25-OHD2 a
Group n Detectable 25-OHD2 25-O
ng/m
1 41 Yes 1.0–2 51 No <1
pecimens were tested by Esoterix Inc. LC–MS/MS 25-OH vitamin D (test number 500337
able 3entaur demonstrated statistically non-equivalent Passing–Bablok fit and poor correlatio5-OHD2 and 25-OHD3.
Group Predictor (x) Dependent (y) n r Slope
1LCMS LSN 41 0.911 0.91
LCMS Centaur 41 0.898 1.48
2LCMS LSN 51 0.964 0.96
LCMS Centaur 51 0.962 1.18
pecimens were tested the same day by LSN and Centaur and compared against LCMS us5-OHD2, and Group 2 did not have detectable 25-OHD2, by LCMS. Slope and intercept 95
able 4entaur neat versus dilution corrected results suggest non-equitable recovery of 25-OHD
Over-range specimen LSNng/mL (nmol/L)
Centaurng/mL (nmol/
Neat Dilution corrected Neat
A >150 (>375) 198.0 (495) >150 (>375)
B 96.6 (241.5) N/A >150 (>375)
C 79.2 (182.3) N/A >150 (>375)
ut of range high (>150 ng/mL) specimens were diluted per manufacturer’s instructions.
ilution factor. Neat results are the initial non-diluted results.
(A), Centaur demonstrated poor correlation with no specimens reported <5.7 ng/mL EP15-A2, and functional sensitivity was calculated per CLSI EP-17A using a secondates per day for 5 consecutive days for a total of 30 replicates.
LSN and LCMS, with LSN reporting 17 patients <20 ng/mL (mean15.9 ng/mL, 95% CI 14.4–17.4 ng/mL) as compared to 8 patients byLCMS (mean 16.3 ng/mL, 95% CI 14.4–18.1 ng/mL). However, theCentaur histogram was not similar to LCMS, with Centaur reporting26 patients <20 ng/mL (mean 13.8 ng/mL, 95% CI 12.4–15.3 ng/mL).
4. Discussion
As a result of significantly increased testing demand for vitaminD this past decade, many clinical laboratories and hospitals haveneeded to move to fully automated, high throughput vitamin Dtesting methodologies to keep up with demand and ensure timely
reporting of results. Moreover, with many physicians treating suf-ficient or insufficient patients with vitamin D2 (e.g. DrisdolTM)supplementation, it is also important that vitamin D testing meas-ures total circulating 25-OHD (25-OHD2 and 25-OHD3) levels. Thend the other without detectable 25-OHD2.
HD2 25-OHD3
L nmol/L ng/mL nmol/L
77.0 2.5–192.5 2.4–117.0 6.0–292.5<2.5 11.0–95.0 27.5–237.5
for fractionated D2/D3) where the limit of quantitation for 25-OHD2 is ≤1 ng/mL.
n [r] in specimens with detectable 25-OHD2 suggesting non-equitable recovery of
95% CI Constant (intercept) 95% CI
0.74 1.11 −3.80 −11.9 2.421.22 1.78 −20.4 −32.1 −9.12
0.87 1.04 −2.89 −5.31 −0.351.06 1.28 −11.8 −15.4 −8.22
ing Passing–Bablok fit and correlation analysis. Group 1 specimens had detectable% confident intervals (CI) are provided.
2 and 25-OHD3 for specimens containing high serum concentrations of 25-OHD2.
L)LCMSng/mL (nmol/L)
Dilution corrected 25-OHD2 25-OHD3 Total
161.2 (403) <1.0 (<2.5) 177 (442.5) 177 (442.5)93.3 (233.3) 90 (225) 11 (27.5) 101 (252.5)100.0 (250) 120 (300) 9 (22.5) 129 (322.5)
Dilution corrected results were calculated by multiplying the dilution result by the

S.A. Hsu et al. / Journal of Steroid Biochemistry & Molecular Biology 136 (2013) 139– 145 143
Fig. 2. LSN demonstrated similar negative bias compared to LCMS in specimens with or without 25-OHD2 (A and B), while Centaur demonstrated wide, non-uniform biasi t 25-Oa t are pd
mVa
m(2Viam
obtntLSscsa2m
TT
Ss
n specimens with detectable 25-OHD2 (C) and negative bias in specimens withougainst LCMS using Difference plot analysis. Mean bias and 95% limits of agreemenid not have detectable 25-OHD2, by LCMS.
ethod of choice for our lab has been the DiaSorin LIAISON® 25 OHitamin D TOTAL Assay, which has an equimolar claim for 25-OHD2nd 25-OHD3 and reports a total 25-OHD result.
With the recent availability of a new fully automated vita-in D assay from Siemens, the ADVIA Centaur® Vitamin D Total
VitD) assay, which also has an equimolar claim for 25-OHD2 and5-OHD3, and a modified version of DiaSorin LIAISON® 25 OHitamin D TOTAL Assay, we investigated the precision, sensitiv-
ty, specificity and the clinical performance of both of these newssays compared against LC–MS/MS (Esoterix Inc.) as the referenceethod.The LSN assay demonstrated a total CV from 5.5 to 10.0%
ver the clinically significant assay range from 7.0 to 34.6 ng/mLy LCMS, with a functional sensitivity of 2.15 ng/mL that meetshe DiaSorin claim ≤4.0 ng/mL. However, the Centaur assay didot have desirable 5-day precision [CV from 11.0 to 16.3% overhe clinically significant assay range from 7.0 to 34.6 ng/mL byCMS] nor did its functional sensitivity [4.57 ng/mL] meet theiemens claim ≤3.7 ng/mL. In addition, the Centaur assay demon-trated a significant negative assay bias for total 25-OHD serumoncentrations <34.6 ng/mL by LCMS. Poor immunoassay preci-ion and negative bias at serum concentrations <34.6 ng/mL has
potential to affect patient management since it is at lower5OHD concentrations where clinically important decisions areade.
able 5hough there was good overall correlation of LSN and Centaur against LCMS, substantial
Predictor (x) Dependent (y) n r Slope 9
LCMS LSN 92 0.936 0.93 0LCMS Centaur 92 0.933 1.30 1
pecimens were tested the same day by LSN and Centaur and compared against LCMS uslope and intercept are provided.
HD2 (D). Specimens were tested the same day by LSN and Centaur and comparedrovided. The N = 41 specimens had detectable 25-OHD2, and the N = 51 specimens
On assessment of the specificity of the LSN and Centaur assaysfor 25-OHD2 and 25-OHD3, the LSN assay demonstrated statisti-cally equivalent Passing–Bablok fits, similar Difference plots andbias across the range of doses tested compared against LCMS forsamples with detectible 25-OHD2 (Group 1) and samples with nodetectible 25OHD2 (Group 2). However, the Centaur assay pro-vided statistically non-equivalent Passing–Bablok fits comparedagainst LCMS for both Group 1 and Group 2, and demonstrateddissimilar Difference plots for Group 1 and Group 2 with signifi-cant non-uniform assay bias in Group 2. Further review of theseresults suggests the likelihood of a significant over-recovery of 25-OHD2 by the Centaur assay which may be the contributing factor tothe observed positive bias, and may variably impact the reported‘equimolar’ 25-OHD2 and 25-OHD3 levels. While LSN had a negativemean dose bias in both Group 1 and Group 2, the Difference plotswere very similar with uniform bias across the assay range, sug-gesting LSN recovers 25-OHD2 and 25-OHD3 equitably. The resultsof this specificity study warrant further investigation to confirmthese findings.
The over-range Specimen B and Specimen C further indicatethe Centaur assay over-recovers 25-OHD2 since Centaur read thesespecimens >150 ng/mL neat, but LCMS read them 90 and 120 ng/mL,
respectively. LSN and LCMS agreed well with Specimen B, how-ever LSN read Specimen C 38.4% lower than LCMS. The EsoterixInc. LC–MS/MS 25-OH Vitamin D assay (Test Number 500337 forbias was present in the Centaur assay.
5% CI Constant (intercept) 95% CI
.84 1.01 −2.51 −5.64 −0.32
.20 1.43 −15.8 −19.8 −11.8
ing Passing–Bablok fit and correlation analysis. 95% confident intervals (CI) around
144 S.A. Hsu et al. / Journal of Steroid Biochemistry & Molecular Biology 136 (2013) 139– 145
Fig. 3. LSN demonstrated a statistically equivalent Passing–Bablok fit with uniform negative bias across the range of doses tested compared against LCMS (A and B), whileCentaur had a statistically non-equivalent fit with significant assay bias at the low and high doses (C and D). Specimens were tested the same day by LSN and Centaur andc , inters N = 41
ftwOCc[Crmtpt[ea
FLo
ompared against LCMS using Passing–Bablok fit and Difference plot analysis. Slopepecimens represents all specimens tested in this study with detectable 25-OHD2 (
ractionated D2/D3) used in this study does not separate or detecthe C3-epimer of 25-OHD. If C3-epimer is present in a specimen itill be included in the Esoterix total LC–MS/MS result, or in the 25-HD3 or 25-OHD2 result depending on if it is the D3 or D2 form of3-epimer. C3-epimer has recently been detected in adults and itan be present at significant serum concentrations in adult samples17,18]. Since the LSN and Centaur assays do not cross-react with3-epimer (DiaSorin claims <2%, and Siemens claims <1%, cross-eactivity to 3-epi-25 OH vitamin D3), the presence of C3-epimeray result in lower LSN and Centaur results compared to LCMS. The
otal 25-OHD result for Specimen C was a high dose, and the recentaper by Strathmann et al. demonstrated that C3-epimer concen-
rations in adult serum were highest as 25OHD levels increased18]. C3-epimer may have contributed to the Specimen C differ-nce between LSN and LCMS, as well as the bias of LSN and Centaurgainst LCMS.ig. 4. LSN demonstrated −16.7% uniform negative bias in specimens <30 ng/mL by LCMCMS, with 20 out of 31 specimens below the −30.4% bias line (B). Specimen results werf agreement are provided.
cept, identity line, mean bias and 95% limits of agreement are provided. The N = 92) and without detectable 25-OHD2 (N = 51) by LCMS.
Finally, our results on clinical performance studies suggest thatthough there was good overall correlation, substantial bias waspresent in the Centaur assay. While the LSN assay provided a statis-tically equivalent Passing–Bablok fit and had a mean bias of −15.7%which was constant across the measuring range tested, the Cen-taur assay demonstrated significant negative dose bias at doses<30 ng/mL, and significant positive bias for samples containingendogenous 25-OHD2, compared against LCMS. This dose bias mayexplain the increased frequency of patients reported with appar-ent vitamin D insufficiency/deficiency at the low end and apparentvitamin D toxicity at the high end with the Centaur assay.
In conclusion, as new “equimolar” vitamin D assays are
introduced in the market it is very important for cliniciansand physicians to understand how these methods clinically per-form as compared against an LC–MS/MS assay traceable to NIST972 standard reference material, as well as to historical patientS (A), while Centaur demonstrated −30.4% mean bias in specimens <30 ng/mL bye compared against LCMS using Difference plot analysis. Mean bias and 95% limits

S.A. Hsu et al. / Journal of Steroid Biochemistry & Molecular Biology 136 (2013) 139– 145 145
F CMS (( ur to
mip2m
C
A
iS
R
[
[
[
[
[
[
[
[
ig. 5. LSN demonstrated a similar distribution of specimens by dose compared to LC). A histogram distribution plot summary was generated for LCMS, LSN and Centa
eans in their laboratory. To support consistent and reliable clin-cal practice, the latest generation of immunoassays should berecise and accurate as compared against LC–MS/MS at lower5OHD concentrations where clinically important decisions areade.
onflict of interest
None.
cknowledgements
We thank DiaSorin Inc. for the support of this study and arendebted to Joshua Soldo (DiaSorin Inc.) and Samantha Rann (Dia-orin S.p.A.) for their assistance.
eferences
[1] J.W. Pike, F.H. Glorieux (Eds.), Vitamin D, 2nd ed., Elsevier Academic Press,Amsterdam, 2005.
[2] M.F. Holick, N.C. Binkley, H.A. Bischoff-Ferrari, C.M. Gordon, D.A. Hanley, R.P.Heaney, M.H. Murad, C.M. Weaver, Endocrine Society 2011 Evaluation, Treat-ment, and prevention of vitamin D deficiency: an endocrine society clinicalpractice guideline, Journal of Clinical Endocrinology and Metabolism 96 (7)(2011) 1911–1930.
[3] Standing Committee on the Scientific Evaluation of Dietary Reference Intakes1997 Dietary Reference Intakes: Calcium, Phosphorus, Vitamin D, and Fluoride,National Academy Press, 1997.
[4] M.-H. Gannage-Yared, R. Chemali, N. Yaacoub, G. Halaby, Hypovitaminosis D
in a sunny country: relation to lifestyle and bone markers, Journal of Bone andMineral Research 15 (2000) 1856–1862.[5] X. Du, H. Greenfield, D.R. Fraser, K. Ge, A. Trube, Y. Wang, Vitamin D deficiencyand associated factors in adolescent girls in Beijing, American Journal of ClinicalNutrition 74 (2001) 494–500.
[
A and B), while Centaur had an increased frequency of specimens <20 or >60 ng/mLcompare the frequency of specimens by dose.
[6] M. Bassir, S. Laborie, A. Lapillonne, O. Claris, M.-C. Cappuis, B.L. Salle, Vitamin Ddeficiency in Iranian mothers and their neonates: a pilot study, Acta Paediatrica90 (2001) 577–579.
[7] C.J.E. Lamberg-Allardt, T.A. Outila, M.U.M. Kärkkäinen, H.J. Rita, L.M. Valsta,Vitamin D deficiency and bone health in healthy adults in Finland: could thisbe a concern in other parts of Europe? Journal of Bone and Mineral Research16 (2001) 2066–2073.
[8] D. Rucker, J.A. Allan, G.H. Fick, D.A. Hanley, Vitamin D insufficiency in a popu-lation of healthy Western Canadians, CMAJ 166 (2002) 1517–1524.
[9] B. Dawson-Hughes, R.P. Heaney, M.F. Holick, P. Lips, P.J. Meunier, R. Vieth,Estimates of optimal vitamin D status, Osteoporosis International 16 (2005)713–716.
10] M.F. Holick, D. Vitamin, Vitamin D: the underappreciated D-lightful hormonethat is important for skeletal and cellular health, Current Opinion in Endocrinol-ogy and Diabetes 9 (2002) 87–98.
11] W.B. Grant, M.F. Holick, Benefits and requirements of vitamin D for optimalhealth: a review, Alternative Medicine Review 10 (2005) 94–111.
12] M.B. Snijder, N.M. van Schoor, S.M.F. Pluijm, R.M. van Dam, M. Visser, P. Lips,Vitamin D status in relation to one-year risk of recurrent falling in oldermen and women, Journal of Clinical Endocrinology and Metabolism 91 (2006)980–985.
13] C. Marcocci, F. Cetani, Primary hyperparathyroidism, NEJM 365 (25) (2011)2389–2397.
14] R. Eastell, A. Arnold, M.L. Brandi, E.M. Brown, P. D‘Amour, D.A. Hanley, D.S. Rao,M.R. Rubin, D. Goltzman, S.J. Silverberg, S.J. Marx, M. Peacock, L. Mosekilde, R.Bouillon, E.M. Lewiecki, Diagnosis of asymptomatic PHPT: Proceedings of the3rd International Workshop, Journal of Clinical Endocrinology and Metabolism94 (2) (2009) 340–350.
15] National Kidney Foundation, Clinical Practice Guidelines, 2006 http://www.kidney.org/professionals/kdoqi/guidelines (accessed 8.24.06).
16] K.W. Phinney, M. Bedner, S.S. Tai, V.V. Vamathevan, L.C. Sander, K.E. Sharp-less, et al., Development and certification of a standard reference material forvitamin D metabolites in human serum, Annali di Chimica 84 (2010) 956–962.
17] G. Lensmeyer, M. Poquette, D. Wiebe, N. Binkley, The C-3 epimer of 25-
hydroxyvitamin D3 is present in adult serum, Journal of Clinical Endocrinologyand Metabolism 97 (1) (2012) 163–168.18] F.G. Strathmann, K. Sadilkova, T.J. Laha, S.E. LeSourd, J.A. Bornhorst, A. Hoofna-gle, 3-Epi-25 hydroxyvitamin D concentrations are not correlated with age ina cohort of infants and adults, Clinica Chimica Acta 413 (2012) 203–206.

本文献由“学霸图书馆-文献云下载”收集自网络,仅供学习交流使用。
学霸图书馆(www.xuebalib.com)是一个“整合众多图书馆数据库资源,
提供一站式文献检索和下载服务”的24 小时在线不限IP
图书馆。
图书馆致力于便利、促进学习与科研,提供最强文献下载服务。
图书馆导航:
图书馆首页 文献云下载 图书馆入口 外文数据库大全 疑难文献辅助工具