journal of strength and conditioning research publish
TRANSCRIPT
Journal of Strength and Conditioning Research Publish Ahead of PrintDOI: 10.1519/JSC.0000000000001836
The high-bar and low-bar back-squats: A biomechanical analysis
Daniel J Glassbrook1, Scott R Brown1, Eric R Helms1, J Scott Duncan1, Adam G Storey1,2
1 Sports Performance Research Institute New Zealand (SPRINZ), Auckland University of
Technology, Auckland, New Zealand
2 High Performance Sport New Zealand (HPSNZ), Auckland, New Zealand
Brief running head: High-bar vs Low-bar squats
Abstract word count: 218
Word count excluding tables and references: 6900
Number of tables: 13
Number of figures: 2
Category: Original research
Date of journal submission: 09 September 2016
Resubmission date: 24 December 2016
Corresponding author: Daniel J Glassbrook, Sports Performance Research Institute New
Zealand (SPRINZ), Auckland University of Technology, 17 Antares Place, Level 2, Mairangi
Bay, Auckland, New Zealand 0632, Phone: (+64) 279565101, Fax: (+64) 99219960, Email:
ACCEPTED
Copyright ª 2017 National Strength and Conditioning Association

High-bar vs Low-bar squats 1
ABSTRACT
No prior study has compared the joint angle and ground reaction force (Fv) differences
between the high-bar back-squat (HBBS) and low-bar back-squat (LBBS) above 90% 1RM.
Six male powerlifters (height: 179.2 ± 7.8 cm; bodyweight: 87.1 ± 8.0 kg; age: 27.3 ± 4.2
years) of international level, six male Olympic weightlifters (height: 176.7 ± 7.7 cm;
bodyweight: 83.1 ± 13 kg; age: 25.3 ± 3.1 years) of national level, and six recreationally
trained male athletes (height: 181.9 ± 8.7 cm; bodyweight: 87.9 ± 15.3 kg; age: 27.7 ± 3.8
years) performed the LBBS, HBBS, and both LBBS and HBBS (respectively) up to and
including 100% 1RM. Small to moderate (d = 0.2-0.5) effect size differences were observed
between the powerlifters and Olympic weightlifters in joint angles and Fv, although none
were statistically significant. However, significant joint angle results were observed between
the experienced powerlifters/weightlifters and the recreationally trained group. Our findings
suggest that practitioners seeking to place emphasis on the stronger hip musculature should
consider the LBBS. Also, when the goal is to lift the greatest load possible, the LBBS may be
preferable. Conversely, the HBBS is more suited to replicate movements that exhibit a more
upright torso position, such as the snatch and clean, or to place more emphasis on the
associated musculature of the knee joint.
KEY WORDS: Joint angles; ground reaction forces; EMG; powerlifting; Olympic
weightlifting
ACCEPTED
Copyright ª 2017 National Strength and Conditioning Association

High-bar vs Low-bar squats 2
INTRODUCTION
The squat is one of the most common exercises in strength and conditioning. The movement
is widely accepted as valid and reliable for the assessment, and improvement of lower-
extremity/trunk strength, function, and resilience to injury (4, 9, 10), as well as an effective
exercise in injury rehabilitation (19). These benefits are possible through the contributions of
the quadriceps, hamstrings, gluteal, triceps surae, and lumbar erector muscle groups to the
completion of the movement (9, 25). In fact, it is predicted that more than 200 muscles are
active throughout the completion of a single repetition (31, 36). The squat itself is in essence
a simple movement, despite the great number of active muscles throughout. In strength and
conditioning, load can be applied to the squat movement via several methods, for example
dumbbells, kettlebells, and a range of other weighted implements. However, perhaps most
commonly load is applied via a barbell, and in one of two ways: 1) as a front-squat, where a
barbell is placed anteriorly on the shoulder and 2) as a back-squat, where the barbell is placed
posteriorly to the shoulder and across the trapezius musculature (16). The focus of this article
will be the back-squat.
There are two different variations of the back-squat, differentiated by the placement of the
barbell on the trapezius musculature. The traditional “high-bar” back-squat (HBBS) is
performed with the barbell placed across the top of the trapezius, just below the process of
the C7 vertebra, and is commonly used by Olympic weightlifters to simulate the catch
position of the Olympic weightlifting competition lifts; the snatch and clean and jerk (41).
Conversely, the “low-bar” back squat (LBBS) places the barbell on the lower trapezius, just
over the posterior deltoid and along the spine of the scapula (41). The LBBS is commonly
used in competitive powerlifting (where the back-squat is one of the three competition lifts),
as it may enable higher loads to be lifted (32). This could be due to the maximization of
ACCEPTED
Copyright ª 2017 National Strength and Conditioning Association

High-bar vs Low-bar squats 3
posterior displacement of the hips, and increased force through the hip joints in comparison
to the knee joints (37). The differences in bar position between the HBBS and LBBS result in
an altered center of mass. Therefore, movement strategies result in order to maintain the
bodies center of mass within its base of support. These movement strategies may manifest as:
changes in 1) joint angles of the lower extremity kinetic chain and, 2) ground reaction forces
(Fv).
When comparing the HBBS to LBBS, several differences present themselves. In
powerlifting, there are competition regulations that each lifter must comply with in order for
each lift to count towards their competition total (21). One such regulation is for sufficient
‘depth’ to be reached in the squat. That is, there must be sufficient flexion of the knees and
lowering of the hips towards the ground, so that “the top surface of the legs at the hip joint
are lower than the top of the knees” (21). In comparison, the HBBS is not directly included as
a competition lift in Olympic weightlifting. Therefore, in training Olympic weightlifters
typically squat to a depth that replicates the final catch position of the snatch and clean and
jerk. This often manifests as a deeper squat position than powerlifting regulation depth,
characterized by greater flexion at the hip, knee and ankle joints. Prior research has shown
that the angle at peak knee flexion is generally smaller in the HBBS (e.g. 70-90°), in
comparison to the LBBS (e.g. 100-120°) (5, 11, 13, 17, 18, 20, 24, 27, 37, 38). Interestingly,
some studies have reported the reverse (17, 24, 37). These conflicting results (although not
explicitly stated by the authors), are likely to be the raw joint angles and not the actual angle
(Figure 1).
**Figure 1 around here**
ACCEPTED
Copyright ª 2017 National Strength and Conditioning Association

High-bar vs Low-bar squats 4
Moreover, prior research specifically comparing the HBBS to the LBBS shows that the
LBBS is defined by a smaller absolute trunk angle, and therefore greater forward lean in
order to maintain the barbell over the center of mass (2, 14, 41). The unique position of the
LBBS results in 1) a decreased trunk lever arm when placing the bar lower on the back, 2) a
greater emphasis on the stronger musculature of the hip rather than the musculature of the
knee joint and, 3) an increase in stability and a potential decrease in stress placed on the
lumbar region and ankle, when compared to the HBBS (34, 37). These factors may contribute
to understanding why the LBBS typically allows for greater loads to be lifted. However, these
kinematic findings are not definitive and there are mixed results in the literature for the size
of HBBS and LBBS trunk angles at peak hip flexion (5, 11, 13, 17, 20, 24, 27, 29, 37).
Similarly, no conclusive differences between the HBBS and LBBS ankle joint angles can be
drawn, in reference to prior literature (13, 17, 24, 34, 37).
As the position of the barbell on the trapezius influences the joint angles of the back-squat,
there is also a resultant influence on the Fv produced. The position of the upper body (i.e. hip
joint angle) has a large impact on the location and magnitude of the resultant Fv due to its
larger mass. Due to the LBBS tending to allow for greater loads to be lifted, it would be
expected that the Fv produced would be greater than with the HBBS. However, the two
studies which have specifically compared the Fv profiles of the HBBS and LBBS, provide
contradictory results to this expectation (15, 37). The results of these two studies may
indicate that, although the LBBS typically allows for greater load to be lifted through
apparent mechanical advantages such as a decreased trunk lever arm, these mechanical
advantages are not effectively displayed by Fv. Furthermore, the results of these studies
specifically may have arisen due to the level of expertise of the participant with performing
the LBBS as the authors chose to target the HBBS in recruitment, as the focus for expertise.
ACCEPTED
Copyright ª 2017 National Strength and Conditioning Association

High-bar vs Low-bar squats 5
Therefore, further research is warranted to understand the Fv differences between the HBBS
and LBBS, in particular with loads greater than 90% 1RM.
The existing literature provides some insight into the kinematic and kinetic differences
between the HBBS and LBBS. However, there is no consensus as to the differences between
the two back-squat barbell positional variations. At present, no prior study has compared the
joint angles and Fv of the HBBS and LBBS above 90% 1RM and some results may have
been confounded by inadequate familiarization. Thus, the purpose of this study was to
compare and contrast the differences in joint angles and Fv of the HBBS and LBBS, up to
and including maximal effort, in an effort to create a full profile of the two BBS variations in
groups both well versed and newly introduced to these movements. The results of this
investigation will add to the current body of knowledge of Olympic weightlifting and
powerlifting practice alike, as well as providing an understanding of why the LBBS may
allow for a greater load to be lifted.
METHODS
Experimental Approach to the Problem
In order to determine why the LBBS may allow for greater loads to be lifted than the HBBS,
both squat styles were performed by experienced and in-experienced lifters. The HBBS was
performed by experienced Olympic weightlifters, and the LBBS by experienced powerlifters,
up to and including 100% of 1RM. Recreationally trained athletes served as a comparison
group and performed both the HBBS and LBBS. It is assumed that the experienced Olympic
weightlifters and powerlifters have a better technique than the recreationally trained athlete,
ACCEPTED
Copyright ª 2017 National Strength and Conditioning Association

High-bar vs Low-bar squats 6
however it is important to acknowledge this may not be strictly true in practice. A profile of
each squat was created through analysis of kinematic joint angles and kinetic Fv differences.
Subjects
Six male powerlifters (height: 179.2 ± 7.8 cm; bodyweight: 87.1 ± 8.0 kg; age: 27.3 ± 4.2
years) of international (i.e. Oceania championships) level volunteered to participate in the
LBBS group. In addition, six male Olympic weightlifters (height: 176.7 ± 7.7 cm;
bodyweight: 83.1 ± 13 kg; age: 25.3 ± 3.1 years) who had previously qualified for national
championship level competition volunteered to participate in the HBBS group. All
powerlifters routinely performed the LBBS in training and competition, and all Olympic
weightlifters routinely performed the HBBS in training. Finally, six recreationally trained
male athletes (height: 181.9 ± 8.7 cm; bodyweight: 87.9 ± 15.3 kg; age: 27.7 ± 3.8 years)
volunteered as a comparison group and each participant was required to perform both the
LBBS and HBBS in a randomized order, after two familiarization sessions with both types of
squat. All participants were free of injury and had ≥ 1 year’s strength training experience
(powerlifters: 5.05 ± 4.56 years; Olympic weightlifters: 3.75 ± 2.72 years; recreational: 8.67
± 3.5 years) consisting of ≥ 3 training sessions per week for the powerlifters and Olympic
weightlifters. The comparison group volunteers were required to train the back-squat in ≥ 1
training sessions per week. Due to small participant numbers (n = 6 for each group), the
results of this study may not provide a full representation of the differences between each
squat type. Some differences may be due to sampling error.
Prior to testing, written informed consent was received from each participant and all testing
conditions were examined and approved by the Auckland University of Technology Ethics
Committee (14/398).
ACCEPTED
Copyright ª 2017 National Strength and Conditioning Association

High-bar vs Low-bar squats 7
Procedures
Powerlifters and Olympic weightlifters
The powerlifters (POW) and Olympic weightlifters (OLY) were required to attend only one
session of approximately three hours in duration. A full ‘level two’ anthropometric
assessment was performed on all athletes by an experienced International Society for the
Advancement of Kinanthropometry (ISAK) anthropometrist followed by a LBBS 1RM test
for the POW, and a HBBS 1RM test for the OLY.
Comparison group
The recreationally trained athletes (COM) were required to attend four separate sessions over
the course of one week: two guided one-hour familiarization sessions, one personal
familiarization session and one three-hour long testing session (Figure 2). The first
familiarization session comprised of the 1RM testing protocol for HBBS and LBBS with
loads up to 60% of self-reported or predicted 1RM. Self-reported 1RM values (performed
within the last six months) for either back-squat variation were used to estimate load
progressions. Pilot testing determined that the load of the unknown back-squat variation
would be around 90% of the known back-squat 1RM regardless of which squat style was
routinely performed. Thus, the loads for the familiarization session were estimated from one
known 1RM for one back-squat variation and a predicted 1RM at 90% of the known 1RM.
The second familiarization session was performed two days later and comprised the same
HBBS and LBBS protocol in the same order as the first familiarization session, up to 80%
1RM of the self-reported and predicted 1RM for either back-squat variation.
ACCEPTED
Copyright ª 2017 National Strength and Conditioning Association

High-bar vs Low-bar squats 8
**Figure 2 around here**
In both the first and second familiarization sessions for each participant, the resistance
exercise-specific rating of perceived exertion (RPE) scale (43) (appendix 7) was used to
ensure that intensity and predicted attempt weight values were correct. In the first
familiarization session, an RPE value of 3 or less (i.e. “light to little effort”) was expected to
be reported in line with the percentages of the 1RM (50, and 60%). If this was not achieved,
the predicted weight values were changed for the second familiarization session. In the
second familiarization session, the same RPE values of 3 or less were employed for the 50%,
and 60% of predicted 1RM sets. After that, a self-reported RPE of 5 or less (i.e. “light effort
with at-least 6 more repetitions possible”) was expected for the 70%, and 80% of 1RM sets.
If these RPE values were not achieved, the predicted 1RMs for both back-squat variations
were changed for the final testing session. In the period between the second familiarization
session and final testing session, a self-directed familiarization session was included for each
participant to re-inforce the skills learned in the previous familiarization sessions, and to
provide a chance to practice each bar position prior to the testing. Each participant was asked
not to exceed an RPE of 5 in this session, and to do no more than three sets. The final testing
session was performed three days later and comprised of a full anthropometric assessment,
followed by a 1RM test of both the HBBS and LBBS in random order so that half of the
comparison group performed the HBBS first, and the other half performed the LBBS first.
This randomized order was employed to minimize any fatigue affect from performing two
maximal squat tests in one testing session.
ACCEPTED
Copyright ª 2017 National Strength and Conditioning Association

High-bar vs Low-bar squats 9
Back-squat 1RM testing protocol
All squats were completed in line with the International Powerlifting Federation’s
competition rules (21). Both the HBBS and LBBS were deemed to be successful lifts if the
athlete was able to safely lower the bar to a minimum accepted depth (the top surface of the
legs at the hip joint are lower than the top of the knees) or lower, through a bending of the
knees, and then recover at will to a stance with knees locked, without the aid of any spotters.
The OLY participants were instructed to squat to the usual depth they perform in training.
Specific focus was placed on ensuring correct depth was obtained, the legs were completely
locked out at the conclusion of each repetition, and no downward movement was observed on
the ascent.
Prior to testing, each participants beltless 1RM was estimated. If in normal training, the
participant did not use a weight belt, the athlete’s predicted beltless 1RM was used. If the
participant used a weight belt in normal training, and had a known belted 1RM, this belted
1RM was used to predict the athletes beltless 1RM. Pilot testing determined that the beltless
1RM is approximately 90% of a belted 1RM. Weightlifting shoes (comprised of a hard sole
and slightly raised heel) were required to be worn by all participants and the heel height was
required to be within the range of 1.5-2.0 centimeters. All participants were accustomed to
wearing weightlifting shoes. No other supportive aids beyond the use of wrist wraps were
allowed to be worn during the test. Before all testing procedures, each participant completed
a standardized dynamic warm up.
The 1RM testing protocol was adapted from Matuszak, Fry, Weiss, Ireland and McKnight
(26), and consisted of the participants performing 8 repetitions at 50% of the predicted 1RM,
3 repetitions at 60%, 2 repetitions at 70%, and 1 repetition at 80, and 90%. Additional warm
ACCEPTED
Copyright ª 2017 National Strength and Conditioning Association

High-bar vs Low-bar squats 10
up sets, prior to the initial 8 repetition set with 50% 1RM, were permitted with < 50% 1RM
load if the participant desired to do so as to better replicate their normal warm up procedures.
After the 90% of predicted 1RM lift, the participant was consulted as to what weight they
would like to attempt for a maximal 1RM lift. An experienced strength coach along with the
use of a Gymaware Powertool (Kinetic Performance Technology, Canberra, Australia) to
measure the mean concentric velocity of the movement, assisted athletes in attempt selection
to get as close to a true beltless 1RM as possible. Prior research has shown that maximal
squat attempts performed by experienced lifters are typically performed at approximately 0.2
m·s-1 (0.24 ± 0.04 m·s-1) (43). Commonly a lift at 95% 1RM was performed prior to
attempting the predicted maximal 1RM. After each successful attempt, small weight
increments (1-5 kg) were made in order to obtain a true maximum. Between 3 and 5 minutes’
rest was allowed between sets before the next weight was attempted.
Biomechanical instrumentation
Two embedded force platforms (Model AM6501, Bertec Corp., Columbus, Ohio, USA),
were used to collect all kinetic squat data at a sampling rate of 1000Hz. The kinetic variables
of interest included mean bar velocity (m·s-1); peak Fv (N·kg-1); ; RFD (0-50ms) (N·s-1); RFD
(0-100ms) (N·s-1); , for both the eccentric and concentric phases. The RFD variables were
chosen in line with previous squat research (8). Mean bar velocity was chosen over peak bar
velocity for a better representation of each athlete’s ability to move load throughout the
whole lifting phase (concentric/eccentric) (22). RFD is the change in force over a given time
(33), and the eccentric phase of each movement is where the body lowers and slows to a point
of zero velocity, immediately prior to the start of the concentric ascent. The eccentric RFD is
measured in the time before this change from the eccentric phase to the concentric phase. The
two force platforms were arranged next to each other in the middle of the collection space to
ACCEPTED
Copyright ª 2017 National Strength and Conditioning Association

High-bar vs Low-bar squats 11
increase the chances of obtaining complete foot contact from each foot during the required
movements. Kinematics were collected by nine infra-red cameras (T10S, Vicon Motion
System Ltd., Oxford, UK) strategically placed around the force platforms in the collection
space. The cameras were arranged so that each marker was always visible to a minimum of
three cameras to allow for reconstruction of three-dimensional trajectories. The collection
space was calibrated with an error of no greater than 0.2 (route mean squared in camera
pixels; the difference between the 2D image of each marker on the camera sensor and the 3D
reconstructions of those markers projected back to the cameras sensor) for each camera prior
to each data collection session and a point of origin was positioned at the corner of one of the
force platforms to establish a local relationship between the camera positions and the
laboratory origin. Data from eight reflective markers (10mm diameter) placed in specific
locations were used to analyze bar path and joint angles throughout the squat movement
using Vicon Nexus software (Version 1.8.5, Vicon Motion System Ltd., Oxford, UK). The
joint angles were calculated as the angle between a parent segment (i.e. thigh or femur) and a
child segment (i.e. shank or tibia). Markers were placed in the center of both ends of the
barbell and on the right side of the athletes’ bodies in specific anatomical locations following
previous research (28) (Figure 1). The markers were placed on the following locations:
acromion process, greater trochanter, lateral epicondyle of the femur, lateral malleolus, top of
the heal lift of the lifting shoe and in-line with the lateral malleolus and base of the fifth
metatarsal to create five rigid segments.
ACCEPTED
Copyright ª 2017 National Strength and Conditioning Association

High-bar vs Low-bar squats 12
Data reduction
Subsequent to the testing sessions, the two force platforms were combined and all data were
filtered with a low-pass fourth-order zero-lag Butterworth filter using a cut-off frequency of
16 Hz_ENREF_12 in a custom-made LabVIEW program (Version 14.0, National Instruments
Corp., Austin, TX, USA) based on residual analysis and visual inspection of the kinematic
and kinetic data. Kinematic variables of interest were gathered through an individual analysis
within the start and finish of the squat to calculate the range-of-motion (peak flexion – initial
or finishing flexion) and peak flexion angles for the hip, knee and ankle joints. Peak joint
flexion was recorded as the angle at the lowest point of the lift, and peak extension at the
highest point of the lift. The hip range-of-motion in the sagittal plane was derived from the
anterior angle between the thorax (trunk) and the thigh, the knee range-of-motion was derived
from the posterior angle between the thigh and the shank and the ankle range-of-motion was
derived from the angle between the shank and the foot. In all cases, the actual angle is
presented as opposed to the raw angle (see Figure 1). To obtain kinetic variables of interest,
all repetitions were individually analyzed during the eccentric phase (from the initiation of a
negative [downward] velocity of the right-side bar marker to the instant the marker reached
zero velocity [full depth]), and concentric phase (from the initiation of a positive [upward]
velocity of the right-side bar marker to the instant the marker reached zero velocity a second
time [the top]).
To obtain kinematic variables of interest, all repetitions were individually analyzed within the
start and finish of the squat movement to calculate the range-of-motion (peak flexion – initial
flexion) and peak flexion angles for the hip, knee and ankle joints. From the sagittal plane,
the hip range-of-motion was derived from the anterior angle between the thorax (trunk) and
the thigh, the knee range-of-motion was derived from the posterior angle between the thigh
ACCEPTED
Copyright ª 2017 National Strength and Conditioning Association

High-bar vs Low-bar squats 13
and the shank and the ankle range-of-motion was derived from the angle between the shank
and the foot. In all cases, the actual angle is presented as opposed to, the raw (Figure 1).
Statistical analysis
Prior to analyses, data were split into four categories according to trials where a single squat
was completed and the %1RM load achieved in testing: (1) 74-83%, (2) 84-93%, (3) 94-99%,
and (4) 100%. This was necessary due to the variation in the number of single repetition trials
completed before a true 1RM was achieved between participants. If multiple trials were
completed within a 1RM range for a participant, the results were averaged so each participant
effectively had one trail per category. Generalized linear mixed models using a normal
distribution with an identity link and unstructured covariance structure were used to estimate
the difference in outcome variables between bar height and subject group across all four load
groups while adjusting for the random effect of subject. In an unstructured covariance matrix
each variance and each covariance value is estimated uniquely from the data, resulting in the
best possible model fit (39). Robust standard errors, constructed using the ‘sandwich
estimator’ of the covariance structure, were used to control for possible misspecifications of
the correlation structure. An alpha of 0.05 was used to determine significant associations.
Multiple pairwise comparisons were corrected for inflation of Type 1 error using the
Bonferroni method (e.g., for all pairwise comparisons in a fixed factor with three groups,
significance level was divided by 3). For all variables Cohen’s d statistic was calculated as
the estimated marginal means divided by the square root of N multiplied by the Standard
Error (i.e. the standard deviation) to provide additional information on the magnitude of the
associations, with 0.2, 0.5, and 0.8 representing small, moderate, and large effects,
respectively (3). The analysis used IBM SPSS Statistics v. 23.0.0.0 (IBM, Armonk, NY,
USA) software.
ACCEPTED
Copyright ª 2017 National Strength and Conditioning Association

High-bar vs Low-bar squats 14
RESULTS
Initially, a comparison of the HBBS performed by the OLY and comparison group
(HBCOM), and the LBBS performed by the POW and COM group (LBCOM) was completed
to determine if the comparison group data could be combined with the OLY and/or the POW
for the high and low bar positions, respectively. Significant joint angle differences were
observed in knee flexion (p = 0.04), and ankle range of motion (ROM) (p = 0.04) at 100% of
1RM for HBBS (OLY vs. HBCOM), and in knee ROM (p = 0.02) at 100% 1RM for the
LBBS (POW vs. LBCOM). Significant differences for several kinetic variables across all
four percentage ranges of 1RM for both HBBS (OLY vs. HBCOM) and LBBS (POW vs.
LBBS) were also observed. Therefore, in the following sections, the data has been analyzed
with all four groups displayed independently.
Load
The mean loads are presented in Tables 1 and 2. No significant differences were observed
between OLY and POW, and HBCOM and LBCOM. However, on average the POW group
lifted greater loads compared to the OLY group across all ranges of load (d = 0.3, 0.2, 0.2 and
0.2 for ranges of 74-83%, 84-93%, 94-99%, and 100% 1RM respectively). Small effect sizes
indicated that greater loads and loads relative to body weight were lifted by the LBCOM than
the HBCOM group for the 74-83% (d = 0.3 and 0.3, respectively), and 84-93% (d = 0.3 and
0.4, respectively) 1RM ranges, but only for load at 100% 1RM (d = 0.4). Moderate effect
sizers indicated that greater loads were lifted by the LBCOM in comparison to the HBCOM
group at 94-99% 1RM in both load and load relative to body weight (d = 0.5 and 0.6,
respectively), and at 100% 1RM in load relative to body weight (d = 0.5).
ACCEPTED
Copyright ª 2017 National Strength and Conditioning Association

High-bar vs Low-bar squats 15
**Tables 1 and 2 around here**
Centre of pressure
The mean distances of the bar from the center of pressure (COP) are presented in Table 3. In
the experienced OLY and POW groups, there is a distinct difference between the two bar
positions. The LBBS performed by the POW shows a greater average distance from the bar to
the COP. In the less experienced COM group, the same difference is generally observed
between the HBBS and LBBS, but is much less pronounced.
**Table 3 around here**
Kinematics
Differences in the estimated marginal means for the kinematic variables are presented in
Tables 4 and 5. No significant differences were observed between the OLY and POW groups,
in any condition. A significantly larger knee flexion angle was observed in the HBCOM
when compared to the OLY group (p = 0.04; d = 0.7; % Diff = 14.3) at 100% 1RM.
Conversely, the OLY group displayed a significantly larger ankle ROM than the HBCOM
group at 100% (p = 0.04; d = 0.07; % Diff = 18.3). The only significant difference between
the POW and LBCOM groups was observed at 100% 1RM, with the POW group
demonstrating a significantly larger knee ROM (p = 0.02; d = 0.8; % Diff = 18.9). The
majority of significant results were observed between the HBCOM and LBCOM. Significant
differences were observed in knee ROM at 74-83% 1RM (p = 0.04), peak hip flexion at 84-
93% 1RM (p = 0.02), peak hip flexion at 94-99% 1RM (p < 0.00) and peak hip flexion (p <
0.00), peak knee flexion (p = 0.01), and knee ROM at 100% 1RM (p = 0.02). In all cases the
ACCEPTED
Copyright ª 2017 National Strength and Conditioning Association

High-bar vs Low-bar squats 16
HBCOM group displayed larger angles, except for peak knee flexion at 100% 1RM where
the LBCOM was greater. No significant interactions between load and group were detected.
**Tables 4 and 5 around here**
Kinetics
Kinetic differences in estimated marginal means are presented in Tables 6-13. The only
significant difference observed between the OLY and POW groups, across all percentage
ranges of 1RM was in the eccentric phase RFD (0-50ms) at 74-83%1RM (p = 0.03). Small
effects were observed for a variety of variables across all four ranges of load (%1RM).
Moderate kinetic effects showing a greater OLY RFD were also observed in the eccentric
phase of the squat at 74-83% 1RM 0-50ms (d = 0.6), and 0-100ms (d = 0.6). Moderately
larger effects were also observed in the concentric phase in the OLY at 84-93% 1RM at 0-
50ms (d = 0.6), and at 94-99% 1RM (0-50ms) (d = 0.6). Only one significant difference
between the HBCOM and LBCOM was observed. The HBCOM group produced a
significantly greater peak Fv in the eccentric phase at 94-99% 1RM (p = 0.05; d = 0.9; % Diff
= 2.4), refer to Tables 10 and 11. A large number of significant differences (p < 0.05) were
observed across all load ranges, in both the eccentric and concentric phases for OLY vs
HBCOM, and POW vs LBCOM (Tables 6, 8, 10, 12). In all cases of significant difference,
the more experienced OLY and POW groups produced larger forces than those produced by
the less experienced HBCOM and LBCOM groups respectively.
**Tables 6-13 around here**
ACCEPTED
Copyright ª 2017 National Strength and Conditioning Association

High-bar vs Low-bar squats 17
DISCUSSION
The purpose of this study was to compare and contrast the differences in kinematics and
kinetics between the HBBS and LBBS in order to understand why the LBBS might typically
allow for greater loads to be lifted (32). Originally the HBBS and LBBS were compared by
combining experienced populations (OLY and POW) with the same bar position in resistance
trained individuals (HBCOM and LBCOM). However, initial analyses revealed differences
between groups using the same bar position (i.e. between HBCOM and OLY, and LBCOM
and POW, respectively). Therefore, each group was compared independently in order to
examine the kinematic and kinetic differences that arise as a function of bar position (i.e.
high-bar and low-bar position) and experience level (i.e. OLY high-bar vs. POW low-bar).
To the best of our knowledge, this is the first study to compare the kinematic and kinetic
differences of the HBBS and LBBS using loads ≥ 90%1RM. The main findings of this
investigation were; 1) statistically significant results were observed in both joint angles and
kinetics between the OLY and HBCOM, and POW and LBCOM groups; 2) although not
significant, a small effect size indicated that greater loads were lifted for each of the
percentage 1RM ranges for the LBBS when comparing the POW vs OLY (d = 0.2-0.3). In
addition, small (d ≥ 0.2) and moderate (d ≥ 0.5) effect sizes indicated that the LBCOM group
lifted greater loads and loads relative to body weight across all ranges of %1RM; 3) no
significant differences were observed in kinematics between the OLY and POW groups, in
any conditions, and only one significant difference was observed between the OLY and POW
groups in kinetics. However, small (d ≥ 0.2), moderate (d ≥ 0.5) and large (d ≥ 0.8) effects
were observed across all ranges of load between OLY and POW; 4) significantly larger joint
angles were observed on the HBCOM, in comparison to the LBCOM in knee ROM at 74-
83% and 100 % 1RM, peak flexion at 84-93%, 94-99% and 100% 1RM. The LBCOM
ACCEPTED
Copyright ª 2017 National Strength and Conditioning Association

High-bar vs Low-bar squats 18
however did produce a larger knee flexion angle at 100% 1RM, than the HBCOM; 5) only
one significant difference was observed between the HBCOM and LBCOM groups in
kinetics. The HBCOM group produced a significantly larger peak Fv at 94-99% 1RM in the
eccentric phase.
Surprisingly, no significant differences were observed between the experienced OLY and
POW groups for any joint angles. It was expected that the OLY would display a greater angle
at peak hip flexion due to the more upright torso position, and a smaller knee flexion angle.
In the present study, small to moderate magnitudes of effect (d ≥ 0.2-0.5) were observed at all
four percentages of 1RM, indicating that the OLY group demonstrated a larger hip angle
displayed at peak flexion by the OLY group at all percentages of 1RM tested. Prior research
by Fry et al., (14) and Wretenberg et al., (41) demonstrated a larger hip angle in the HBBS,
and a greater forward lean in the LBBS. However, the squats were only performed at 50%
and 65% 1RM, respectively, in these aforementioned studies and the results also failed to
reach statistical significance. Therefore, it is possible to surmise that OLY consistently
demonstrate a larger hip angle and therefore, a more upright torso position when performing
the HBBS when compared to the LBBS performed by POW. The knee joint findings of the
present study were similar to those reported in other studies (5, 11, 13, 17, 18, 20, 24, 27, 37,
38) and it appears that the OLY displays a smaller peak knee flexion angle (i.e. greater depth)
than what is seen during the POW. However, the difference was not pronounced, as there
were no significant differences observed but there were small to moderate magnitudes of
change (d ≥ 0.2–0.5).
Interestingly however, significant differences were observed in the hip and knee joints,
between the HBBS performed by the HBCOM group, and the LBBS performed by the
LBCOM. The significant differences between these two groups in joint angles are in line with
ACCEPTED
Copyright ª 2017 National Strength and Conditioning Association

High-bar vs Low-bar squats 19
the prior literature, and this indicates that there may have been an influence of experience on
the significant results in this study and in the findings of previous research. The smaller hip
angle, and greater knee angle shown by the POW group in the present study, indicate a
greater posterior displacement of the hip, a more vertical shank, and therefore a greater ankle
angle. However, the present study showed no significant differences in ankle joint angles
between the OLY and POW groups. Instead, only one significant difference was presented, in
the ankle ROM between OLY and HBCOM at 100% 1RM (p = 0.04; d = 0.7; % Diff = 18.3).
Previous investigations have shown no definitive differences between the ankle joint angles
of the HBBS and LBBS (13, 17, 24, 34, 37). The ankle joint angle results of this study further
support these previous findings between experienced populations (i.e. OLY and POW), but
may indicate differences in an experienced versus less-experienced groups HBBS
practitioners (i.e. OLY and HBCOM) at maximal effort.
The upper body has a larger mass than the lower body, and therefore humans are inherently
unstable, and require effective control mechanisms to constantly resist perturbation (40). This
inherent instability is expressed in three planes of motion when load is added to the upper
body via a barbell, as in the case of the HBBS and/or LBBS (35). The COP is the point on the
ground at which the Fv vector originates, and is a representation of the center of mass (COM)
which accounts for the whole body’s weight (including the external bar load) (1). It can be
argued that the COM/COP will be in the same position with both the HBBS and LBBS,
however the variation in position of the bar forces the segments of the body to adapt
differently in order to maintain the COM within the athlete’s base of support (BOS), and
therefore combat a loss of balance. A change in one body segment, will typically result in a
change in the other segments (12). The distance of the bar from the COP can help indicate the
level of change in these segments, particularly when paired with kinematic joint angle data.
ACCEPTED
Copyright ª 2017 National Strength and Conditioning Association

High-bar vs Low-bar squats 20
The results of this study indicate that the mechanisms the body employs to maintain the
balance of its system are concentrated at the hip and not at the knee or ankle joint. At the
deepest part of each squat, we found the distance of the bar behind the center of pressure
(COP) was larger in the LBBS (55 ± 39 mm) than in the HBBS (21 ± 36 mm) (Table 3).
Anthropometric differences (e.g. lower limb length) between participants here would create
variability if such a measure was to come from a joint center. Instead the distance from the
COP accounts better for the combined mass of the participant and external bar load. These
findings exemplify the effects of the low-bar position being further down the back on the
lower trapezius musculature, and also indicates a more vertical torso in the HBBS. In order to
maintain the position of the barbell on the shoulders and to keep the body’s COM within the
BOS, the lifter must adopt a smaller torso angle when performing the LBBS. In addition, a
wider stance is also often employed when performing the LBBS (10) and anecdotally it is
performed to suit the hip structure of the lifter to allow them to obtain the required depth. An
increased stance width also acts to effectively increase the BOS, and therefore allows for the
bar to be a further distance from the COP, without exiting the BOS. Thus, the smaller hip
angle demonstrated in this study may allow greater loads to be lifted with the LBBS, due to
the decreased moment arm, greater emphasis on the strong hip musculature, as well as the
aforementioned increased stability (34, 37).
The only significant difference observed between the OLY and POW groups, across all
percentage ranges of 1RM was in the eccentric phase RFD (0-50ms) at 74-83%1RM (p =
0.03). However, small (d ≥ 0.2) and moderate (d ≥ 0.5) magnitudes of change were observed
for several variables (Tables 7, 9, 11, 13). The OLY and POW that took part in this study
were all of a high level and consequently, they lifted loads that were similar to each other
when presented relative to body weight, but not in terms of actual load (Table 1 and 2).
ACCEPTED
Copyright ª 2017 National Strength and Conditioning Association

High-bar vs Low-bar squats 21
Although not statistically significant, the POW on average lifted greater loads for each
percentage of 1RM. Prior research has shown that as load is increased, there is a resulting
increase in the Fv produced that is proportionate to the increase in load (6, 7, 13, 23, 42).
With this in mind, it was expected that the results of this study would show that the POW had
the ability to generate greater Fv levels during the LBBS, due to the larger loads typically
lifted. However, this did not occur. Instead, no significant differences were observed between
the POW and OLY groups, and only small effects (d ≥ 0.2) were observed for Fv. These
effects are also in direct contrast to Goodin (15), who showed the HBBS to produce larger
Fv, when compared to the LBBS, with loads of 20-80% 1RM, in HBBS dominant athletes. In
the current investigation the Fv levels were only shown to be significantly greater in the
LBBS than the HBBS between the less experienced HBCOM and LBCOM groups in the
eccentric phase at 94-99% 1RM (p = 0.05; d = 1.3; % Diff = 2.4). This indicates that the
LBBS may in fact be a more efficient technique of squatting large loads in proportion to the
lifter’s bodyweight. Even though greater loads were lifted by the POW, when compared to
the OLY for each set, the Fv produced was relatively the same, thus the mechanical
advantage can be attributed to kinematic joint angle differences. An analysis of the lower
limb and trunk muscle activity throughout the squat for both the HBBS and LBBS is
necessary to supplement these conclusions. Such an analysis will create a greater
understanding as to the level of muscle mass that is deemed to be active throughout each
squat style. These findings may provide an insight into the reasons for differing kinetic
results, through muscle activity results.
The resistance trained males in this study were recruited as a comparison group and they did
not have any specific expertise in either the HBBS or LBBS. As a result, the techniques
displayed by the comparison group had many significant kinetic differences when compared
ACCEPTED
Copyright ª 2017 National Strength and Conditioning Association

High-bar vs Low-bar squats 22
with the well-trained OLY and POW athletes (Tables 6-13). In addition, significant
differences were also observed in several joint angles between the OLY and POW groups
versus the HBCOM and LBCOM groups (Table 4 and 5). Therefore, it can be concluded that
resistance training experience and technical proficiency have a strong influence on the
associated joint angle kinematics and kinetics. Thus, the level of experience of an individual
may be a useful predictor of squatting technical performance. This notion, and the results of
this study are supported the work of Miletello, Beam and Cooper (30) which reported
differences in kinetic and kinematic variables measured at the knee when three different
POW groups, of varying experience, performed the LBBS. In order of highest skill to least
skilled, the POW groups were: competitive collegiate; competitive high school; and novice.
Future studies should look to specifically only include well trained athletes when comparing
the HBBS to LBBS, in order to minimize the dilution of results from less experienced
populations.
The significant differences observed between the experienced (i.e. OLY and POW) groups
and the less experienced (i.e. HBCOM and LBCOM) groups, indicates that the time spent
familiarizing each comparison participant with both squat styles was insufficient to create
expertise in both styles prior to testing. The differences in joint angles between the two bar
positions in the comparison group, can also be attributed to a lack of expertise in both squat
styles. Another limitation to this study was the low number of participants representing each
group, as this reduced the statistical power of the model. Athletes competing at a high level
were targeted to make up the experienced OLY and POW groups (i.e. international and
national level, respectively). Therefore, the pool of potential participants was automatically
reduced. Moreover, athletes were also recruited from different gyms, in different stages of
competition preparation at the time of testing. As a result of the reduced sample size, the
ACCEPTED
Copyright ª 2017 National Strength and Conditioning Association

High-bar vs Low-bar squats 23
effect size data should be carefully considered rather than interpreting the findings based on
statistical significance alone. Future studies should look to compare larger cohorts of
experienced HBBS and LBBS participants up to and including 100% of 1RM, with the
further addition of muscle activity analysis, in order to complete a full profile of each squat
style and improve statistical power.
SUMMARY AND PRACTICAL APPLICATIONS
This study provided evidence to suggest that the LBBS is a more efficient way of squatting
large loads, as demonstrated by comparable kinetic results to the HBBS despite greater
absolute loads being lifted. This study also indicates that resistance trained individuals should
not be compared/combined with well-trained athletes when comparing such a technical
movement as the HBBS or LBBS as there is an apparent influence of expertise on the
performance of these techniques. With regards to training adaptations, practitioners seeking
to place emphasis on the stronger hip musculature should consider the LBBS, as the greater
forward lean of the movement ensures the hip muscles are engaged more so than the HBBS.
It is also recommended that when the goal is to lift the greatest load possible, the LBBS may
be preferable. Conversely, the HBBS is more suited to replicate movements that exhibit a
more upright torso position, such as the snatch and clean or to place more emphasis on the
associated musculature of the knee joint. Future research should look to analyze the muscle
activity differences between the HBBS and LBBS, up to and including 100% 1RM. The
addition of this knowledge to the results presented in this study will provide a complete
profile of the differences between the HBBS and LBBS.
ACCEPTED
Copyright ª 2017 National Strength and Conditioning Association

High-bar vs Low-bar squats 24
REFERENCES
1. Benda BJ, Riley PO, and Krebs DE. Biomechanical relationship between center of gravity and center of pressure during standing. Rehabilitation Engineering 2: 3-10, 1994.
2. Benz RC. A kinematic analysis of the high and low bar squat techniques by experienced low bar weight lifters. Pennsylvania: West Chester University, 1989.
3. Cohen J. Statistical power analysis. Current Directions in Psychological Science 1: 98-101, 1992.
4. Cormie P, McGuigan MR, and Newton RU. Adaptations in athletic performance after ballistic power versus strength training. Medicine and Science in Sports and Exercise 42: 1582-1598, 2010.
5. Donnelly DV, Berg WP, and Fiske DM. The effect of the direction of gaze on the kinematics of the squat exercise. Journal of Strength and Conditioning Research 20: 145-150, 2006.
6. Ebben WE and Jensen RL. Electromyographic and kinetic analysis of traditional, chain, and elastic band squats. Journal of Strength and Conditioning Research 16: 547-550, 2002.
7. Ebben WP, Garceau LR, Wurm BJ, Suchomel TJ, Duran K, and Petushek EJ. The optimal back squat load for potential osteogenesis. Journal of Strength and Conditioning Research 26: 1232-1237, 2012.
8. Ebben WP, Kaufmann CE, Fauth ML, and Petushek EJ. Kinetic analysis of concurrent activation potentiation during back squats and jump squats. Journal of Strength and Conditioning Research 24: 1515-1519, 2010.
9. Escamilla RF. Knee biomechanics of the dynamic squat exercise. Medicine and Science in Sports and Exercise 33: 127-141, 2001.
10. Escamilla RF, Fleisig GS, Lowry TM, Barrentine SW, and Andrews JR. A three-dimensional biomechanical analysis of the squat during varying stance widths. Medicine and Science in Sports and Exercise 33: 984-998, 2001.
11. Escamilla RF, Fleisig GS, Zheng N, Lander JE, Barrentine SW, Andrews JR, Bergemann BW, and Moorman CT. Effects of technique variations on knee biomechanics during the squat and leg press. Medicine and Science in Sports and Exercise 33: 1552-1566, 2001.
12. Evangelista P and Alberti G. The physics of the squat, in: European Weightlifing Federation Scientific Magazine. 2016.
13. Flanagan SP and Salem GJ. Bilateral differences in the net joint torques during the squat exercise. Journal of Strength and Conditioning Research 21: 1220-1226, 2007.
14. Fry A, Aro T, Bauer J, and Kraemer W. A comparison of methods for determining kinematic properties of three barbell squat exercises. Journal of Human Movement Studies 24: 83, 1993.
15. Goodin J. Comparison of external kinetic and kinematic variables between high barbell back squats and low barbell back squats across a range of loads. Tennessee: East Tennessee State University, 2015.
16. Gullett JC, Tillman MD, Gutierrez GM, and Chow JW. A biomechanical comparison of back and front squats in healthy trained individuals. Journal of Strength and Conditioning Research 23: 284-292, 2009.
17. Hales ME, Johnson BF, and Johnson JT. Kinematic analysis of the powerlifting style squat and the conventional deadlift during competition: is there a cross-over effect between lifts? Journal of strength and conditioning research 23: 2574-2580, 2009.
ACCEPTED
Copyright ª 2017 National Strength and Conditioning Association

High-bar vs Low-bar squats 25
18. Han S, Ge S, Liu H, and Liu R. Alterations in three-dimensional knee kinematics and kinetics during neutral, squeeze and outward squat. Journal of Human Kinetics 39: 59-66, 2013.
19. Heijne A, Fleming BC, Renstrom PA, Peura GD, Beynnon BD, and Werner S. Strain on the anterior cruciate ligament during closed kinetic chain exercises. Medicine and Science in Sports and Exercise 36: 935-941, 2004.
20. Hooper DR, Szivak TK, Comstock BA, Dunn-Lewis C, Apicella JM, Kelly NA, Creighton BC, Flanagan SD, Looney DP, and Volek JS. Effects of fatigue from resistance training on barbell back squat biomechanics. Journal of Strength and Conditioning Research 28: 1127-1134, 2014.
21. International Powerlifting Federation. Technical Rules Book 2015. 22. Jidovtseff B, Harris NK, Crielaard JM, and Cronin JB. Using the load-velocity
relationship for 1RM prediction. Journal of Strength & Conditioning Research 25: 267-270, 2011.
23. Kellis E, Arambatzi F, and Papadopoulos C. Effects of load on ground reaction force and lower limb kinematics during concentric squats. Journal of Sports Sciences 23: 1045-1055, 2005.
24. Kobayashi Y, Kubo J, Matsuo A, Matsubayashi T, Kobayashi K, and Ishii N. Bilateral asymmetry in joint torque during squat exercise performed by long jumpers. Journal of Strength and Conditioning Research 24: 2826-2830, 2010.
25. Maddigan ME, Button DC, and Behm DG. Lower-limb and trunk muscle activation with back squats and weighted sled apparatus. Journal of Strength and Conditioning Research 28: 3346-3353, 2014.
26. Matuszak ME, Fry AC, Weiss LW, Ireland TR, and McKnight MM. Effect of rest interval length on repeated 1 repetition maximum back squats. Journal of strength and conditioning research 17: 634-637, 2003.
27. McKean MR, Dunn PK, and Burkett BJ. Quantifying the movement and the influence of load in the back squat exercise. Journal of Strength and Conditioning Research 24: 1671-1679, 2010.
28. McKenzie C, Brughelli M, Whatman C, and Brown S. The influence of optimal handheld load on the technical ability to apply ground reaction forces during horizontal jumping in female netball players. International journal of sports medicine 37: 318-323, 2015.
29. McLaughlin TM, Dillman CJ, and Lardner TJ. Kinematic model of performance in the parallel squat by champion powerlifters. Medicine and Science in Sports 9: 128-133, 1977.
30. Miletello WM, Beam JR, and Cooper ZC. A biomechanical analysis of the squat between competitive collegiate, competitive high school, and novice powerlifters. Journal of Strength and Conditioning Research 23: 1611-1617, 2009.
31. Nisell R and Ekholm J. Joint load during the parallel squat in powerlifting and force analysis of in vivo bilateral quadriceps tendon rupture. Scandinavian Journal of Sports Sciences 8: 63-70, 1986.
32. O̓ Shea P. Sports Performance Series: The parallel squat. National Strength and Conditioning Association Journal 7: 4, 1985.
33. Sands WA, McNeal JR, and Shultz BB. Kinetic and temporal patterns of three types of vertical jump among elite international divers. Research in Sports Medicine: An International Journal 9: 107-127, 1999.
34. Sato K, Fortenbaugh D, and Hydock DS. Kinematic changes using weightlifting shoes on barbell back squat Journal of Strength and Conditioning Research 26: 28-33, 2012.
ACCEPTED
Copyright ª 2017 National Strength and Conditioning Association

High-bar vs Low-bar squats 26
35. Schick EE, Coburn JW, Brown LE, Judelson DA, Khamoui AV, Tran TT, and Uribe BP. A comparison of muscle activation between a smith machine and free weight bench press. Journal of Strength and Conditioning Research 24: 779-784, 2010.
36. Stoppani J. Encyclopedia of muscle & strength. Champaign, IL: Human Kinetics, 2006.
37. Swinton PA, Lloyd R, Keogh JW, Agouris I, and Stewart AD. A biomechanical comparison of the traditional squat, powerlifting squat, and box squat. Journal of Strength and Conditioning Research 26: 1805-1816, 2012.
38. van den Tillaar R, Andersen V, and Saeterbakken AH. The existence of a sticking region in free weight squats. Journal of Human Kinetics 42: 63-71, 2014.
39. West BT, Welch KB, and Galecki AT. Linear mixed models: a practical guide using statistical software. CRC Press, 2014.
40. Winter DA. Human balance and posture control during standing and walking. Gait & posture 3: 193-214, 1995.
41. Wretenberg P, Feng Y, and Arborelius UP. High- and low-bar squatting techniques during weight-training. Medicine and Science in Sports and Exercise 28: 218-224, 1996.
42. Zink AJ, Perry AC, Robertson BL, Roach KE, and Signorile JF. Peak power, ground reaction forces, and velocity during the squat exercise performed at different loads. Journal of Strength and Conditioning Research 20: 658-664, 2006.
43. Zourdos MC, Klemp A, Dolan C, Quiles JM, Schau KA, Jo E, Helms E, Esgro B, Duncan S, Merino SG, and Blanco R. Novel resistance training-specific RPE scale measuring repetitions in reserve. Journal of Strength and Conditioning Research, 2015.
FIGURE LEGEND
Figure 1: Actual and raw joint angles of the hip, knee and ankle. Taken from A) the left end
of the barbell, B) the right end of the barbell, C) acromion process, D) greater trochanter, E)
lateral epicondyle of the femur, F) lateral malleolus, G) the top of the heal lift of the lifting
shoe, and H) the base of the fifth metatarsal.
Figure 2: Representation of the order of familiarization and testing dates for the comparison
group.
ACCEPTED
Copyright ª 2017 National Strength and Conditioning Association

Table 1: Mean loads lifted across all %1RM ranges
% Range Variable OLY POW HBCOM LBCOM OLY vs POW Diff; ±90%CI HBCOM vs LBCOM Diff; ±90%CI
BW (kg) 83.2 ± 13.0 87.1 ± 8.0 87.9 ± 15.3 87.9 ± 15.3
74-83% Load (kg) 136.6 ± 23.5 140.9 ± 20.1 99.9 ± 13.2 103.0 ± 16.2 12.5 ± 23.8 4.0 ± 7.6
*BW 1.6 ± 0.2 1.6 ± 0.3 1.2 ± 0.2 1.2 ± 0.2 0.1 ± 0.3 0.1 ± 0.1
84-93% Load (kg) 152.5 ± 23.1 159.2 ± 21.8 116.4 ± 12.9 121.7 ± 18.8 9.4 ± 26.6 6.0 ± 9.5
*BW 1.8 ± 0.2 1.9 ± 0.4 1.3 ± 0.2 1.4 ± 0.2 0.0 ± 0.3 0.1 ± 0.1
94-99% Load (kg) 164.0 ± 24.7 174.6 ± 20.1 128.7 ± 12.4 136.5 ± 21.6 7.2 ± 24.2 7.9 ± 8.0
*BW 2.0 ± 0.2 2.0 ± 0.4 1.5 ± 0.2 1.6 ± 0.2 0.0 ± 0.3 0.1 ± 0.1
100% Load (kg) 169.5 ± 26.5 181.2 ± 21.8 135.2 ± 11.1 143.4 ± 20.7 11.8 ± 25.4 8.2 ± 11.1
*BW 1.9 ± 0.3 2.1 ± 0.4 1.6 ± 0.2 1.6 ± 0.2 0.1 ± 0.3 0.1 ± 0.1
OLY, Olympic weightlifters; POW, Powerlifters; HBCOM, Comparison high-bar back squat; LBCOM, Comparison low-bar back-squat; BW, Body weight; 1RM, One
repetition maximum; CI, Confidence interval. All data presented as mean ± standard deviation.
ACCEPTED
Copyright ª 2017 National Strength and Conditioning Association

Table 2: Mean loads lifted effect sizes and percentage differences
OLY vs POW HBCOM vs LBCOM
% Range Variable Effect Size % Difference Effect Size % Difference
74-83% Load (kg) 0.3* 3.2 0.3* 3.0
*BW 0.1 0.2 0.3* 2.5
84-93% Load (kg) 0.2* 4.4 0.3* 4.4
*BW 0.0 0.8 0.4* 3.9
94-99% Load (kg) 0.2* 6.5 0.5§ 5.7
*BW 0.0 2.5 0.6§ 5.1
100% Load (kg) 0.2* 6.9 0.4* 5.7
*BW 0.1 3.0 0.5§ 5.2
OLY, Olympic weightlifters; POW, Powerlifters; HBCOM, Comparison high-bar back squat; LBCOM, Comparison low-bar back-squat; BW, Body weight.
* = Small effect d ≥ 0.2; § = Moderate effect d ≥ 0.5.
ACCEPTED
Copyright ª 2017 National Strength and Conditioning Association

Table 3: Distance of center of pressure to bar results
% Range OLY (mm) POW (mm) HBCOM (mm) LBCOM (mm)
74-83% -19 ± 42 -44 ± 31 -60 ± 45 -57 ± 18
84-93% -20 ± 40 -58 ± 39 -51 ± 42 -72 ± 25
94-99% -23 ± 29 -46 ± 31 -58 ± 35 -59 ± 38
100% -24 ± 40 -74 ± 52 -39 ± 49 -51 ± 18
OLY, Olympic weightlifters; POW, Powerlifters; HBCOM, Comparison high-bar back squat; LBCOM, Comparison low-bar back-squat. Negative number represents the bar
a distance behind the center of pressure. All center of pressure data is presented as mean ± standard deviation.
ACCEPTED
Copyright ª 2017 National Strength and Conditioning Association

Table 4: Kinematic results
High-Bar Back-Squat Low-bar Back-Squat
%1RM
Range
Joint Variable OLY
Angle (°)
HBCOM
Angle (°)
OLY vs HBCOM
Diff; ±90%CI
OLY vs POW
Diff; ±90%CI
POW
Angle (°)
LBCOM
Angle (°)
POW vs LBCOM
Diff; ±90%CI
HBCOM vs LBCOM
Diff; ±90%CI
Hip Peak Flexion 69 ± 7 64 ± 5 6 ± 7 8 ± 10 59 ± 9 61 ± 4 3 ± 8 3 ± 3
ROM 100 ± 8 105 ± 9 5 ± 10 6 ± 11 109 ± 11 101 ± 9 9 ± 12 4 ± 4
Knee Peak Flexion 54 ± 7 59 ± 8 3 ± 9 9 ± 11 62 ± 11 63 ± 8 1 ± 11 4 ± 4
ROM 116 ± 7 110 ± 11^ 3 ± 11 5 ± 12 114 ± 12 104 ±
10^
8 ± 13 5 ± 5
Ankle Peak
Dorsiflexion
90 ± 5 88 ± 6 4 ± 6 2 ± 5 90 ± 5 90 ± 8 0 ± 7 2 ± 4
74-83%
ROM 33 ± 4 32 ± 3 0 ± 4 1 ± 6 33 ± 6 30 ± 4 2 ± 6 2 ± 3
Hip Peak Flexion 69 ± 9 64 ± 6^ 6 ± 8 6 ± 11 59 ± 8 61 ± 3^ 3 ± 7 3 ± 3
ROM 100 ± 9 105 ± 10 6 ± 11 8 ± 11 111 ± 11 99 ± 9 13 ± 11 5 ± 5
84-93%
Knee Peak Flexion 56 ± 7 61 ± 8 4 ± 8 7 ± 11 63 ± 12 67 ± 5 4 ± 10 6 ± 6
ACCEPTED
Copyright ª 2017 National Strength and Conditioning Association

ROM 114 ± 7 107 ± 11 5 ± 10 1 ± 12 113 ± 13 101 ± 6 12 ± 12 6 ± 6
Ankle Peak
Dorsiflexion
91 ± 4 90 ± 6 2 ± 5 2 ± 5 90 ± 5 91 ± 7 1 ± 7 1 ± 3
ROM 33 ± 4 30 ± 5 2 ± 4 2 ± 6 34 ± 7 30 ± 4 4 ± 6 0 ± 2
Hip Peak Flexion 71 ± 10 69 ± 6^ 4 ± 9 12 ± 12 59 ± 9 61 ± 5^ 2 ± 9 8 ± 8
ROM 98 ± 10 100 ± 10 4 ± 11 11 ± 13 110 ± 14 100 ± 10 9 ± 14 0 ± 3
Knee Peak Flexion 56 ± 7 65 ± 8 8 ± 9 4 ± 10 62 ± 12 68 ± 5 5 ± 10 3 ± 4
ROM 113 ± 8 103 ± 12 8 ± 12 2 ± 12 114 ± 13 101 ± 7 11 ± 12 6 ± 6
Ankle Peak
Dorsiflexion
90 ± 5 91 ± 6 1 ± 6 0 ± 6 90 ± 5 92 ± 7 2 ± 7 1 ± 2
94-
99%
ROM 33 ± 4 28 ± 4 4 ± 5 1 ± 6 33 ± 7 29 ± 3 4 ± 6 1 ± 2
Hip Peak Flexion 71 ± 9 68 ± 6^ 3 ± 8 12 ± 12 59 ± 10 63 ± 6^ 4 ± 8 5 ± 5
ROM 97 ± 10 101 ± 10 4 ± 10 11 ± 12 109 ± 13 96 ± 11 13 ± 13 5 ± 5
100%
Knee Peak Flexion 56 ± 7* 65 ± 6*^ 9 ± 9 7 ± 11 63 ± 12 73 ± 6^ 10 ± 10 7 ± 7
ACCEPTED
Copyright ª 2017 National Strength and Conditioning Association

ROM 113 ± 9 103 ± 9^ 10 ± 10 0 ± 12 113 ±
14§
95 ± 8§^ 18 ± 18 8 ± 8
Ankle Peak
Dorsiflexion
90 ± 5 92 ± 6 1 ± 6 0 ± 6 91 ± 6 93 ± 6 3 ± 7 2 ± 2
ROM 32 ± 3* 27 ± 4* 5 ± 5 1 ± 6 33 ± 8 27 ± 4 6 ± 6 0 ± 4
OLY, Olympic weightlifters; POW, Powerlifters; HBCOM, Comparison high-bar back-squat; LBCOM, Comparison low-bar back-squat; ROM, Range of motion; CI,
Confidence interval.
All angle data presented at mean ± standard deviation. * p < 0.05 OLY vs HBCOM; § p < 0.05 POW vs LBCOM; ^ p < 0.05 HBCOM vs LBCOM.
ACCEPTED
Copyright ª 2017 National Strength and Conditioning Association
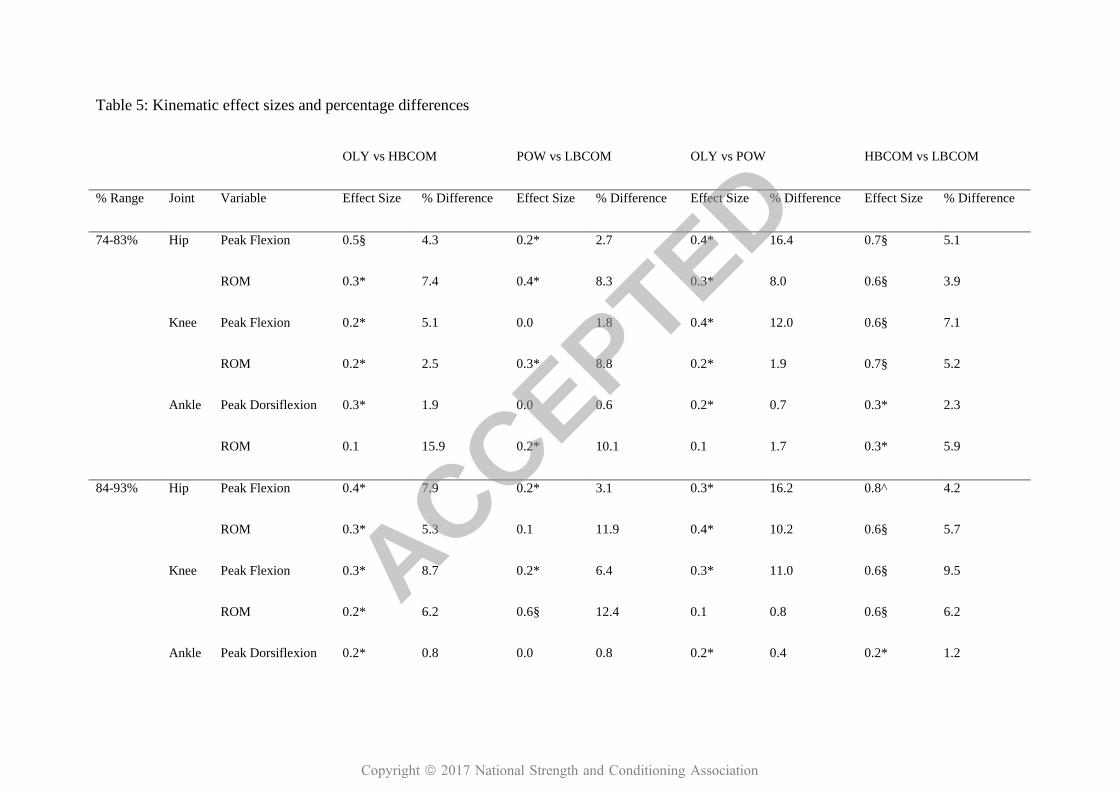
Table 5: Kinematic effect sizes and percentage differences
OLY vs HBCOM POW vs LBCOM OLY vs POW HBCOM vs LBCOM
% Range Joint Variable Effect Size % Difference Effect Size % Difference Effect Size % Difference Effect Size % Difference
74-83% Hip Peak Flexion 0.5§ 4.3 0.2* 2.7 0.4* 16.4 0.7§ 5.1
ROM 0.3* 7.4 0.4* 8.3 0.3* 8.0 0.6§ 3.9
Knee Peak Flexion 0.2* 5.1 0.0 1.8 0.4* 12.0 0.6§ 7.1
ROM 0.2* 2.5 0.3* 8.8 0.2* 1.9 0.7§ 5.2
Ankle Peak Dorsiflexion 0.3* 1.9 0.0 0.6 0.2* 0.7 0.3* 2.3
ROM 0.1 15.9 0.2* 10.1 0.1 1.7 0.3* 5.9
84-93% Hip Peak Flexion 0.4* 7.9 0.2* 3.1 0.3* 16.2 0.8^ 4.2
ROM 0.3* 5.3 0.1 11.9 0.4* 10.2 0.6§ 5.7
Knee Peak Flexion 0.3* 8.7 0.2* 6.4 0.3* 11.0 0.6§ 9.5
ROM 0.2* 6.2 0.6§ 12.4 0.1 0.8 0.6§ 6.2
Ankle Peak Dorsiflexion 0.2* 0.8 0.0 0.8 0.2* 0.4 0.2* 1.2
ACCEPTED
Copyright ª 2017 National Strength and Conditioning Association

ROM 0.2* 10.2 0.3* 14.6 0.2* 2.4 0.0 1.5
94-99% Hip Peak Flexion 0.2* 2.4 0.1 2.9 0.6§ 19.5 2.3^ 11.8
ROM 0.2* 2.3 0.4* 9.4 0.4* 10.9 0.1 0.2
Knee Peak Flexion 0.4* 13.7 0.2* 7.9 0.2* 9.9 0.3* 4.0
ROM 0.4* 10.0 0.5§ 12.4 0.1 0.6 0.6§ 1.6
Ankle Peak Dorsiflexion 0.1 1.0 0.1 1.9 0.0 0.1 0.2* 0.9
ROM 0.4* 15.4 0.3* 13.9 0.1 1.9 0.2* 3.2
100% Hip Peak Flexion 0.2* 3.8 0.3* 6.6 0.7§ 20.7 1.3^ 7.9
ROM 0.2* 3.6 0.5§ 13.2 0.5§ 10.5 0.6§ 4.9
Knee Peak Flexion 0.7§ 14.3 0.5§ 13.7 0.3* 10.4 0.9^ 10.9
ROM 0.6§ 9.9 0.8^ 18.9 0.0 0.1 0.8^ 7.7
Ankle Peak Dorsiflexion 0.1 1.3 0.2* 2.9 0.0 0.2 0.6§ 1.9
ROM 0.7§ 18.3 0.5§ 22.0 0.1 1.9 0.0 1.1
OLY, Olympic weightlifters; POW, Powerlifters; HBCOM, Comparison high-bar back-squat; LBCOM, Comparison low-bar back-squat; ROM, Range of motion.
* = Small effect d ≥ 0.2; § = Moderate effect d ≥ 0.5; ^ = Large effect d ≥ 0.8.
ACCEPTED
Copyright ª 2017 National Strength and Conditioning Association

Table 6: Kinetic results 74–83% 1RM
High-Bar Back-Squat Low-Bar Back-Squat
Phase Variable OLY HBCOM OLY vs HBCOM
Diff; ±90%CI
OLY vs POW
Diff; ±90%CI
POW LBCOM POW vs LBCOM
Diff; ±90%CI
HBCOM vs LBCOM
Diff; ±90%CI
Ecc Mean Bar v
(m.s-1)
0.51 ± 0.13 0.44 ± 0.11 0.09 ± 0.19 0.05 ± 0.10 0.54 ±
0.12§
0.38 ±
0.09§
0.20 ± 0.20 0.06 ± 0.07
Peak Fv
(N.kg-1)
38 ± 3* 26 ± 4* 10 ± 10 1 ± 3 37 ± 2.69§ 26 ± 3§ 9 ± 9 1 ± 2
RFD (0-50ms)
(N.s-1)
2746 ±
1080*
845 ± 318* 2190 ± 2190 862 ± 948 2294 ± 824 1102 ± 339 1213 ± 1213 231 ± 319
RFD (0-100ms)
(N.s-1)
3657 ±
1788¥
1570 ± 539 2396 ± 2396 1319 ± 1553 3058 ±
1376¥
1877 ± 415 1377 ± 1641 337 ± 436
ACCEPTED
Copyright ª 2017 National Strength and Conditioning Association

Con Mean Bar v
(m.s-1)
0.51± 0.05 0.49 ± 0.11 0.07 ± 0.08 0.03 ± 0.06 0.57 ±
0.08§
0.55 ±
0.11§
0.09 ± 0.10 0.04 ± 0.05
Peak Fv
(N.kg-1)
38 ± 3* 31 ± 27* 10 ± 10 1 ± 3 37 ± 3§ 27 ± 4§ 8 ± 8 1 ± 1
RFD (0-50ms)
(N.s-1)
2013 ± 737 816 ± 416 1131 ± 1131 311 ± 1046 2002 ±
1089
707 ± 166 1319 ± 1317 85 ± 283
ACCEPTED
Copyright ª 2017 National Strength and Conditioning Association

OLY, Olympic weightlifters; POW, Powerlifters; HBCOM, Comparison high-bar back-squat; LBCOM, Comparison low-bar back-squat; Ecc, Eccentric; Con, Concentric;
RFD, Rate of force development; Fv, Vertical force; CI, Confidence interval. All kinetic data presented at mean ± standard deviation. * p < 0.05 OLY vs HBCOM; § p < 0.05
POW vs LBCOM; ¥ p < 0.05 OLY vs CON.
ACCEPTED
Copyright ª 2017 National Strength and Conditioning Association

Table 7: Kinetic effect sizes and percentage differences 74–83% 1RM
OLY vs HBCOM POW vs LBCOM OLY vs POW HBCOM vs LBCOM
Phase Variable Effect Size % Difference Effect Size % Difference Effect Size % Difference Effect Size % Difference
Eccentric Mean Bar v (m.s-1) 0.3* 15.9 1.0^ 40.2 0.3* 5.3 0.7§ 12.7
Peak Fv (N.kg-1) 1.5^ 43.7 1.9^ 40.9 0.2* 1.3 0.4* 0.7
RFD (0-50ms) (N.s-1) 1.2^ 224.8 0.9^ 108.1 0.6§ 19.7 0.7§ 23.3
RFD (0-100ms) (N.s-1) 0.8^ 132.9 0.6§ 62.9 0.6§ 19.6 0.7§ 16.4
Concentric Mean Bar v (m.s-1) 0.6§ 2.4 0.6§ 4.0 0.4* 11.9 0.8^ 11.7
Peak Fv (N.kg-1) 1.6^ 42.0 1.6^ 37.6 0.2* 0.7 1.1^ 2.5
ACCEPTED
Copyright ª 2017 National Strength and Conditioning Association

RFD (0-50ms) (N.s-1) 0.8^ 146.7 0.7§ 183.3 0.2* 0.6 0.3* 15.5
RFD (0-100ms) (N.s-1) 0.6§ 123.6 0.8^ 161.2 0.1 5.4 0.2* 10.5
OLY, Olympic weightlifters; POW, Powerlifters; HBCOM, Comparison high-bar back-squat; LBCOM, Comparison low-bar back-squat; ROM, Fv, Vertical force; RFD,
Rate of force development. * = Small effect d ≥ 0.2; § = Moderate effect d ≥ 0.5; ^ = Large effect d ≥ 0.8.
ACCEPTED
Copyright ª 2017 National Strength and Conditioning Association

Table 8: Kinetic results 84–93% 1RM
High-Bar Back-Squat Low-Bar Back-Squat
Phase Variable OLY HBCOM OLY vs HBCOM
Diff; ±90%CI
OLY vs POW
Diff; ±90%CI
POW LBCOM POW vs
LBCOM Diff;
±90%CI
HBCOM vs
LBCOM Diff;
±90%CI
Ecc Mean Bar v
(m.s-1)
0.48 ± 0.09 0.39 ± 0.08 0.09 ± 0.19 0.00 ± 0.10 0.51 ± 0.10§ 0.35 ± 0.10§ 0.16 ± 0.16 0.04 ± 0.04
Peak Fv (N.kg-
1)
40 ± 3* 28 ± 5 * 10 ± 10 2 ± 3 38 ± 3§ 27 ± 3§ 10 ± 10 0 ± 3
RFD (0-50ms)
(N.s-1)
2258 ± 943 857 ± 737 1088 ± 1188 517 ± 957 1857 ± 648§ 493 ± 112§ 1425 ± 1425 362 ± 745
RFD (0-
100ms) (N.s-1)
3413 ± 1587 1552 ± 1233 1727 ± 2147 715 ± 1648 2896 ± 1226§ 950 ± 74§ 1987 ± 1987 602 ± 1247
ACCEPTED
Copyright ª 2017 National Strength and Conditioning Association

Con Mean Bar v
(m.s-1)
0.41 ± 0.06 0.40 ± 0.05 0.06 ± 0.06 0.00 ± 0.07 0.44 ± 0.09§ 0.42 ± 0.09§ 0.06 ± 0.08 0.03 ± 0.05
Peak Fv (N.kg-
1)
39 ± 4* 28 ± 5* 10 ± 10 2 ± 4 38 ± 3§ 29 ± 4§ 8 ± 8 1 ± 3
RFD (0-50ms)
(N.s-1)
2278 ± 921 889 ± 324 1282 ± 1282 865 ± 1023 1617 ± 838 705 ± 243 1036 ± 1036 183 ± 333
RFD (0-
100ms) (N.s-1)
3303 ± 1632 1325 ± 674 1930 ± 1994 1024 ± 1727 2686 ± 1448§ 964 ± 223§ 1871 ± 1871 357 ± 719
ACCEPTED
Copyright ª 2017 National Strength and Conditioning Association

OLY, Olympic weightlifters; POW, Powerlifters; HBCOM, Comparison high-bar back-squat; LBCOM, Comparison low-bar back-squat; Ecc, Eccentric; Con, Concentric;
RFD, Rate of force development; Fv, Vertical force; CI, Confidence interval. All kinetic data presented at mean ± standard deviation. * p < 0.05 OLY vs HBCOM; § p < 0.05
POW vs LBCOM.
ACCEPTED
Copyright ª 2017 National Strength and Conditioning Association

Table 9: Kinetic effect sizes and percentage differences 84-93% 1RM
OLY vs HBCOM POW vs LBCOM OLY vs POW HBCOM vs LBCOM
Phase Variable Effect Size % Difference Effect Size % Difference Effect Size % Difference Effect Size % Difference
Eccentric Mean Bar v (m.s-1) 0.3* 22.7 0.9^ 46.0 0.0 6.1 0.9^ 10.5
Peak Fv (N.kg-1) 1.5^ 42.5 2.1^ 39.6 0.4* 4.3 0.1 2.1
RFD (0-50ms) (N.s-1) 0.7§ 163.5 1.5^ 276.5 0.4* 21.6 0.4* 73.7
RFD (0-100ms) (N.s-1) 0.6§ 119.9 1.1^ 204.8 0.3* 17.8 0.4* 63.3
Concentric Mean Bar v (m.s-1) 0.7§ 5.5 0.5§ 5.1 0.0 6.8 0.4* 7.7
Peak Fv (N.kg-1) 1.3^ 39.7 1.6^ 32.0 0.4* 3.6 0.3* 2.1
ACCEPTED
Copyright ª 2017 National Strength and Conditioning Association

RFD (0-50ms) (N.s-1) 0.8^ 156.3 0.9^ 129.2 0.6§ 40.9 0.5§ 26.0
RFD (0-100ms) (N.s-1) 0.7§ 149.3 0.9^ 178.6 0.4* 23.0 0.4* 37.4
OLY, Olympic weightlifters; POW, Powerlifters; HBCOM, Comparison high-bar back-squat; LBCOM, Comparison low-bar back-squat; ROM, Fv, Vertical force; RFD,
Rate of force development. * = Small effect d ≥ 0.2; § = Moderate effect d ≥ 0.5; ^ = Large effect d ≥ 0.8.
ACCEPTED
Copyright ª 2017 National Strength and Conditioning Association

Table 10: Kinetic results 94–99% 1RM
High-Bar Back-Squat Low-Bar Back-Squat
Phase Variable OLY HBCOM OLY vs HBCOM
Diff; ±90%CI
OLY vs POW
Diff; ±90%CI
POW LBCOM POW vs LBCOM
Diff; ±90%CI
HBCOM vs LBCOM
Diff; ±90%CI
Ecc Mean Bar v
(m.s-1)
0.47 ±
0.09
0.36 ± 0.10 0.12 ± 0.15 0.04 ± 0.13 0.45 ± 0.12 0.34 ± 0.07 0.10 ± 0.14 0.03 ± 0.07
Peak Fv
(N.kg-1)
41 ± 4* 29 ± 4*^ 11 ± 11 2 ± 4 39 ± 3§ 28 ± 3§^ 11 ± 11 1 ± 1
RFD (0-50ms)
(N.s-1)
2018 ±
1110
811 ± 500 1272 ± 1479 383 ± 1275 1618 ±
1107
687 ± 140 893 ± 1207 123 ± 504
RFD (0-
100ms) (N.s-1)
2953 ±
1658
1413 ± 957 1344 ± 2274 477 ± 1665 2371 ±
1266
1071 ± 402 1302 ± 1418 300 ± 848
ACCEPTED
Copyright ª 2017 National Strength and Conditioning Association

Con Mean Bar v
(m.s-1)
0.32 ±
0.03
0.31 ± 0.05 0.06 ± 0.06 0.02 ± 0.05 0.31 ± 0.05 0.31 ± 0.04 0.01 ± 0.06 0.02 ± 0.03
Peak Fv
(N.kg-1)
41 ± 5* 29 ± 4* 11 ± 11 2 ± 4 39 ± 3§ 30 ± 4§ 9 ± 9 1 ± 1
RFD (0-50ms)
(N.s-1)
2083 ±
906*
706 ± 525* 992 ± 1154 327 ± 935 1595 ± 818 575 ± 342 1016 ± 1016 141 ± 294
RFD (0-
100ms) (N.s-1)
3425 ±
1412
1062 ± 815 1880 ± 1880 498 ± 1481 2761 ±
1258§
870 ± 461§ 1866 ± 1866 224 ± 542
OLY, Olympic weightlifters; POW, Powerlifters; HBCOM, Comparison high-bar back-squat; LBCOM, Comparison low-bar back-squat; Ecc, Eccentric; Con, Concentric;
RFD, Rate of force development; Fv, Vertical force; CI, Confidence interval. All kinetic data presented at mean ± standard deviation. * p < 0.05 OLY vs HBCOM; § p < 0.05
POW vs LBCOM; ^ p < 0.05 HBCOM vs LBCOM.
ACCEPTED
Copyright ª 2017 National Strength and Conditioning Association

Table 11: Kinetic effect sizes and percentage differences 94–99% 1RM
OLY vs HBCOM POW vs LBCOM OLY vs POW HBCOM vs LBCOM
Phase Variable Effect Size % Difference Effect Size % Difference Effect Size % Difference Effect Size % Difference
Eccentric Mean Bar v (m.s-1) 0.6§ 27.9 0.5§ 33.5 0.2* 2.4 0.4* 6.4
Peak Fv (N.kg-1) 1.2^ 43.9 2.0^ 41.5 0.3* 4.2 1.3^ 2.4
RFD (0-50ms) (N.s-1) 0.6§ 148.9 0.5§ 135.6 0.2* 24.7 0.2* 18.0
RFD (0-100ms) (N.s-1) 0.4* 109.0 0.7§ 121.4 0.2* 24.5 0.3* 31.9
Concentric Mean Bar v (m.s-1) 1.2^ 5.5 0.1 1.1 0.3* 3.9 0.5§ 2.7
Peak Fv (N.kg-1) 1.2^ 42.4 1.6^ 32.1 0.3* 4.1 0.7§ 3.5
ACCEPTED
Copyright ª 2017 National Strength and Conditioning Association

RFD (0-50ms) (N.s-1) 0.6§ 195.0 0.8^ 177.6 0.6§ 30.6 0.4* 22.9
RFD (0-100ms) (N.s-1) 0.7§ 222.3 0.9^ 217.2 0.2* 24.0 0.4* 22.1
OLY, Olympic weightlifters; POW, Powerlifters; HBCOM, Comparison high-bar back-squat; LBCOM, Comparison low-bar back-squat; ROM, Fv, Vertical force; RFD,
Rate of force development. * = Small effect d ≥ 0.2; § = Moderate effect d ≥ 0.5; ^ = Large effect d ≥ 0.8.
ACCEPTED
Copyright ª 2017 National Strength and Conditioning Association

Table 12: Kinetic results 100% 1RM
High-Bar Back-Squat Low-Bar Back-Squat
Phase Variable OLY HBCOM OLY vs HBCOM
Diff; ±90%CI
OLY vs POW
Diff; ±90%CI
POW LBCOM POW vs LBCOM
Diff; ±90%CI
HBCOM vs LBCOM
Diff; ±90%CI
Ecc Mean Bar v
(m.s-1)
0.48 ±
0.09*
0.34 ±
0.09*
0.14 ± 0.14 0.03 ± 0.11 0.44 ±
0.14§
0.31 ±
0.06§
0.14 ± 0.14 0.04 ± 0.07
Peak Fv
(N.kg-1)
42 ± 4* 29 ± 4* 13 ± 13 2 ± 3 40 ± 2§ 29 ± 3§ 11 ± 11 0 ± 2
RFD (0-50ms)
(N.s-1)
2240 ±
852*
634 ± 372* 1606 ± 1606 490 ± 905 1750 ±
878§
375 ± 337§ 1375 ± 1375 258 ± 413
RFD (0-
100ms) (N.s-1)
3062 ±
1681
1052 ± 650 2010 ± 2010 406 ± 1660 2656 ±
1485§
676 ± 581§ 1980 ± 1980 376 ± 769
ACCEPTED
Copyright ª 2017 National Strength and Conditioning Association

Con Mean Bar v
(m.s-1)
0.22 ±
0.03
0.20 ± 0.03 0.02 ± 0.04 0.01 ± 0.05 0.21 ± 0.06 0.23 ± 0.05 0.03 ± 0.07 0.04 ± 0.06
Peak Fv
(N.kg-1)
41 ± 4* 30 ± 3* 12 ± 12 2 ± 4 40 ± 2§ 31 ± 3§ 9.00 ± 9.00 1 ± 2
RFD (0-50ms)
(N.s-1)
1734 ±
916*
629 ± 248* 1105 ± 1105 86 ± 1197 1820 ±
1332
507 ± 222 1313 ± 1313 122 ± 179
RFD (0-
100ms) (N.s-1)
3218 ±
1572*
1049 ±
480*
2169 ± 2169 202 ± 1972 3016 ±
2153
676 ± 254 2341 ± 2341 374 ± 528
OLY, Olympic weightlifters; POW, Powerlifters; HBCOM, Comparison high-bar back-squat; LBCOM, Comparison low-bar back-squat; Ecc, Eccentric; Con, Concentric;
RFD, Rate of force development; Fv, Vertical force; CI, Confidence interval. All kinetic data presented at mean ± standard deviation. * p < 0.05 OLY vs HBCOM; § p < 0.05
POW vs LBCOM.
ACCEPTED
Copyright ª 2017 National Strength and Conditioning Association

Table 13: Kinetic effect sizes and percentage differences 100% 1RM
OLY vs HBCOM POW vs LBCOM OLY vs POW HBCOM vs LB CON
Phase Variable Effect Size % Difference Effect Size % Difference Effect Size % Difference Effect Size % Difference
Eccentric Mean Bar v (m.s-1) 0.9^ 40.0 0.9^ 46.4 0.2* 7.7 0.5§ 11.2
Peak Fv (N.kg-1) 1.9^ 44.8 2.9^ 39.7 0.3* 3.5 0.2* 0.2
RFD (0-50ms) (N.s-1) 1.3^ 253.5 1.1^ 366.4 0.4* 28.0 0.5§ 68.9
RFD (0-100ms) (N.s-1) 0.8^ 191.1 0.9^ 292.9 0.2* 15.3 0.4* 55.6
Concentric Mean Bar v (m.s-1) 0.4* 9.9 0.3* 10.6 0.1 4.5 0.5§ 17.7
Peak Fv (N.kg-1) 1.7^ 39.3 2.1^ 29.2 0.3* 3.2 0.7§ 4.5
ACCEPTED
Copyright ª 2017 National Strength and Conditioning Association

RFD (0-50ms) (N.s-1) 0.9^ 175.6 0.7§ 259.1 0.0 4.7 0.6§ 24.1
RFD (0-100ms) (N.s-1) 1.0^ 206.7 0.8^ 346.5 0.1 6.7 0.6§ 55.3
OLY, Olympic weightlifters; POW, Powerlifters; HBCOM, Comparison high-bar back-squat; LBCOM, Comparison low-bar back-squat; ROM, Fv, Vertical force; RFD,
Rate of force development. * = Small effect d ≥ 0.2; § = Moderate effect d ≥ 0.5; ^ = Large effect d ≥ 0.8.
ACCEPTED
Copyright ª 2017 National Strength and Conditioning Association

ACCEPTED
Copyright ª 2017 National Strength and Conditioning Association

Friday Saturday Sunday Monday Tuesday Wednesday Thursday Friday
Familiarization session 1
Familiarization session 2
‘Self-directed’familiarization
session 3Testing session
ACCEPTED
Copyright ª 2017 National Strength and Conditioning Association