journal of technical analysis (jota). issue 24 (1986, may)
TRANSCRIPT

Gill
m
0 t
0 c) -I
m
c)
2 c)


-am ASSOCIATIOW J- Issue 24 May 1986
l3litir: Henry 0. Pruden, Ph.D. Adjunct Professor Golden Gate University San Francisco, CA 94105
Manuscript-: Arthur T. Dietz, Ph.D. Professor of Finance Graduate School of Business Administration, mry University Atlanta, Georgia
Frederick Dickson Portfolio Manager Millbum Corporation New York, New York
Richard On-, Ph.D. Vice President for Research John Gutman Investment Corporation New Britian, CcKlnecticut
David Dpshaw, C.F.A. Director of Portfolio Strategy Research Waddell and Reed Investment Management Kansas City, Missouri
Anthony W. Tabell Technical Analyst Delafield, Harvey, Tabell Princeton, New Jersey
Robert T. Wbod, Ph.D. Associate Professor of Finance Pennsylvania State University State College, Pennsylvania
Printer: &lden Gate University 536 Mission Street San Francisco, CA 94105
Mrket Technicians Association 70 Pine Street New York, New York 10005

2
MTA Journal/May 1986
MTA JOURNAL—MAY 1986
TABLE OF CONTENTS
MTA OFFICERS AND COMMITTEE CHAIRPERSONS . . . . . . . . . . 3 MEMBERSHIP AND SUBSCRIBER INFORMATION . . . . . . . . . . . 4 STYLE SHEET FOR SUBMISSION OF ARTICLES . . . . . . . . . . . . 5 VOICE OF A PRO: WHAT IS PROGRAM TRADING? Joseph Gahtan and Andrew Harmstone-Rakowski . . . . . . . . . 6 ’86 PITFALLS IN THE STOCK MARKET Walter R. Deemer . . . . . . . . . . . . . . . . . . . . . . 16 SOME OBSERVATIONS FROM SAFIAN RESEARCH Kenneth Safian . . . . . . . . . . . . . . . . . . . . . . . 28 THE INSTITUTIONAL BUY-SIDER USE OF TECHNICAL ANALYSIS William Di Ianni . . . . . . . . . . . . . . . . . . . . . . 46 STATISTICAL TOOLS FOR THE TECHNICAL ANALYSIS, THE BASICS FROM A SLIGHTLY DIFFERENT PERSPECTIVE Frederic H. Dickson and Dr. Robert A. Wood . . . . . . . . . . . 48 PERSPECTIVES ON TWENTY-FOUR HOUR TRADING William A. Lupien . . . . . . . . . . . . . . . . . . . . . . 62 TIME OF DAILY HIGH AND LOW Arthur A. Merrill . . . . . . . . . . . . . . . . . . . . . . 66 DIVERGENCE ANALYSIS: SEVERAL EMPIRACLE TESTS Joseph F. Kalish . . . . . . . . . . . . . . . . . . . . . . 68 THE LAST HALF HOUR INDICATOR Bruce M. Kamich . . . . . . . . . . . . . . . . . . . . . . 93
PRES- Gail Dudack Pershing/Div. DLJ 212~312-3322
vIu3 PRsKmm Cheryl Stafford Wellington Management 617/227/9500
Officers
-. John Murphy JJM Technical Advisors 2121724-6982
TREzdmx David Krell New York Stock Exchange
VIC33 PRESlDBW (Semimr) Robert Sinpokins Delafield, Harvey, Tabell 609/924-9660
Cozdttee Chairpersons
Robert Colby 212/399-6002
EZTlICS & -/=C REXATXCXS Tony Tabell 609/924-9660
Robert Prechter John Brooks 404/536-0309 404/266-6262
Henry Pruden 415/459-1319
-ll!ATIm Charles Comer & John Brooks 212/825-4367 404/266-6262
Phil Roth 212/742-6535
Ralph Acanlpora 212/510-3750
liaxmrrIrn E&d Dickson 212/398-8489
-smmw John Finley 203/762-0229
E7m3zus~IALI-GKouP William Byers 212/925-6651
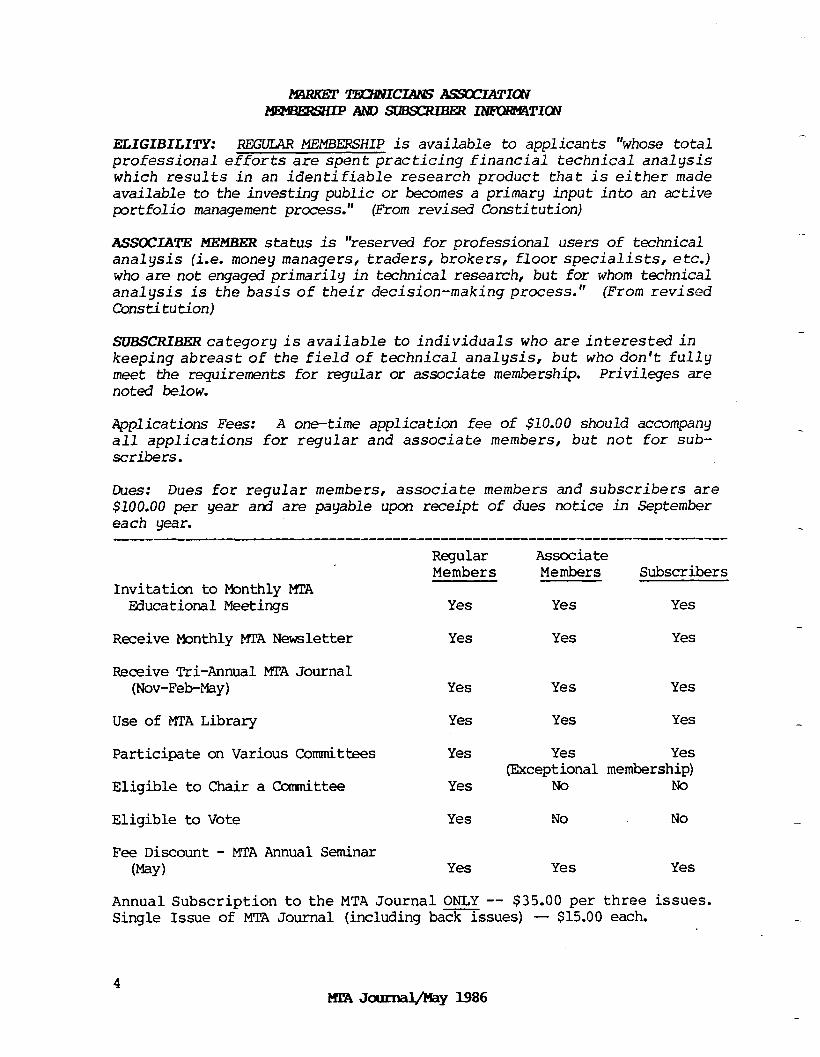
ELIGIBILITY: REGULAR MEMBERSHIP is available to applicants "whose total professional efforts are spent practicing financial technical analysis which results in an identifiable research product that is either made available to the investing public or becomes a primary input into an active portfolio management process." (From revised Constitution)
ASSOCIAT!E MEMRER status is "reserved for professional users of technical analysis (i.e. money managers, traders, brokers, floor specialists,etc.) who are not engaged primarily in technical research, but for whom technical analysis is the basis of their decision-making process." (From revised Constitution)
SUBSCRIBER category is available to individuals who are interested in keeping abreast of the field of technical analysis, but who don't fully meet the requirements for regular or associate membership. Privileges are noted below.
Applications Fees: A one-time application fee of $10.00 should accompany all applications for regular and associate members, but not for sub- scribers.
Dues: Dues for regular members, associate $100.00 per year and are payable upon receipt each year.
members and subscribers are of dues notice in September
-------------------------------------------------------------------------
Regular Associate Members Members Subscribers
Invitation to Monthly MTA Educational Meetings
Receive Monthly MTA Newsletter
Receive Tri-Annual MTA Journal (Nov-Feb-May)
Use of MTA Library
Participate on Various Committees
Eligible to Chair a Corranittee
Eligible to Vote
Fee Discount - MTA Annual Seminar (May)
Yes
Yes
Yes
Yes
Yes
Yes
Yes
Yes
Yes
Yes
Yes Yes
Yes Yes
Yes Yes (Exceptional membership)
No No
No No
Yes
Yes
Yes
Yes
Annual Subscription to the MTA Journal ONLY -- $35.00 per three issues. Single Issue of MTA Journal (including bmssues) - $15.00 each.
4 ma ~aurnayMay 1986

sryLEsHETm!mE slB!asIrn OF AR!rIrn
MTA Editorial Policy
The MAR@T!l'XBWICIANS ASSOCIATIONJOURNAL is published by the Market Technicians Association, 70 Pine Street, New York, New York 10005 to promote the investigation and analysis of price and volume activities of the world's financial markets. The MTA Journal is distributed to individuals (both academic and practitioner) and libraries in the United States, Canada, Europe and several other countries. The Journal is copyrighted by the Market Technicians Association and registered with tie Library of Congress. All rights are registered with the Library of Congress. All rights are reserved. Publication dates are February, May, and November.
Style for #eMTAJcmma.l
All papers submitted to the MTA Journal are requested to have the follow- ing items as prerequisites to consideration for publication:
1. Short (one paragraph) biographical presentation for inclusion at the end of the accepted article upon publication. Name andaffiliation will be shown under the title.
2. All charts should be provided in camera-ready form and be properly labeled for text reference.
3. Paper should be submitted typewritten, double-spaced'in completed form on 8 l/2 by 11 inch paper. If both sides are used, care should be taken to use sufficiently heavy paper to avoid reverse side images. Footnotes and references should be put at the end of the article.
4. Greek characters should be avoided in the text and in all formulae.
5. Two submission copies are necessary.
Manuscripts of any style will be received and examined, but upon acceptance, they should be prepared in accordance with the above policies.
Mail your manuscripts to Henry 0. Pruden, Ph.D., Editor, MTA JOURNAL, P.O. E!ox 1348, Ross, California 94957.
5 M!m Joumd/by 1986

The subject of our interview is a discussion on program trading by two promi- nent experts in the field: Joseph Gahtan, Vice President, Options and Futures Trading, Salomon Brothers and Andrew Harmstone-Rakowski, Stock Index Special- ist at Paine Webber Capital Markets.
Joe's name is well recognized in the options business. He has been actively involved in derivative products for many years, Andrew brings a quantitative and analytical perspective to tiis topic, through his active involvement with stock index futures and options evaluation techniques and models.
Q. What is program trading, in general?
Gahtan: Program trading as it relates to index options or futures is the buying or selling of securities while simultaneously buying or selling index options or futures.
Q. Does this only involve futures and options or are there programs involving other types of instruments?
Gahtan: There are other programs, but the traditional ones done include the futures and index options such as XMI, OEX or NYA and the underlying securities.
Q. Andrew, would you define for our readers what the term basket trade means?
Harmstone: Basically, a basket or program trade is an arbitrage. It is called a basket because you are trading a large number of stocks simultaneously. You don't care that much about any one individual stock. You care about the prices of all the stocks together.
You may buy some stocks at higher prices than anticipated and others at lower, but mainly you are concerned with the net average price of the stocks you trade. The reason for the basket is that the future is mispriced so you want toarbitrage against the future. You are buying or selling the stocks as a hedge against your future contract.
Q. What are the mechanics of executing this type of arbitrage?
Harmstone: One of the most important things is tohave an on-line system of prices showing the spread between the bid or ask and the last sale of the stocks themselves. Typically, a single phone call down to the floor is used to execute a program. The floor traders execute program A, program B or whatever it is. The tickets are already down on the floor so they just take those tickets ard execute them.
You typically take whatever price is available in the market. You want to execute the trade as quickly as possible because the conditions to the other side of the trade can change very quickly. So what you end up doing is making two phone calls , one to the futures pit and one to the floor of the stock
6

exchange. Both sides are executed simultaneously. The tricky part is the futures side since it is-the most volatile.
Q. What side do you normally execute first, the stocks or futures?
Harmstone: You try to execute them as simultaneously as possible. Because the futures are so volatile, the spread may be there for only a few seconds after you actually put the order in.
Gahtan: If you are willing to take the risk, you mightexecutethe one side and then the other. If you thought the market was declining, you could sell stocks first and buy your futures later. But of course, that becomes more risky.
Q. How long does it take to complete one of these program trades?
Gahtan: Well, it really depends on the size. If it is a ten million dollar program, which is a relatively small program, it could take two to three minutes. Aprogram of $25-50 million encompasses a little more time. The real issue is how many stocks are involved. It takes less time to execute 250 stocks than 500 stocks; The faster the stocks are executed the less the variation in price. The number of stocks will impact the speed with which the program is executed.
Q. On the average, how many stocks are normally used?
Gahtan: I don't know if there is an average. We tailor each program to the need of the client and the basis risk he is willing to assume over that period of time. You are going to have some tracking error risk over a period depending on the number of stocks used. .
Certainly this year if you had something like 200 to 250 stocks you had every takeover stock there was. So you certainly beat the index. Had you used fewer stocks your performance might have been somewhat lower.
Harmstone: That is absolutely right. The takeover situations have made a large basket really critical. A lot of people started doing the arbitrage with only 60 stocks to replicate a 500 stock index. Sometimes baskets were used with fewer than 60 stocks. However, if you left out cne takeover stock you were in bad shape. Most people who are doing this in a serious way have gone to 250-300 or even 400 stocks.
Gahtan: We never traded with fewer than 150 stocks and the maximum we used was 480. The right number depends on the particular custaner.
Q. What's the general dollar aunt of these programs?
Gahtan: I don't think there is a general dollar amount. Programs that range between $10-25 million are medium size. We have executed $50-100 million using the futures, but it becomes difficult with the other side.
Harmstone: When the program is less than $10 million, there are restraints on
7 m"A Jound&ay 1986
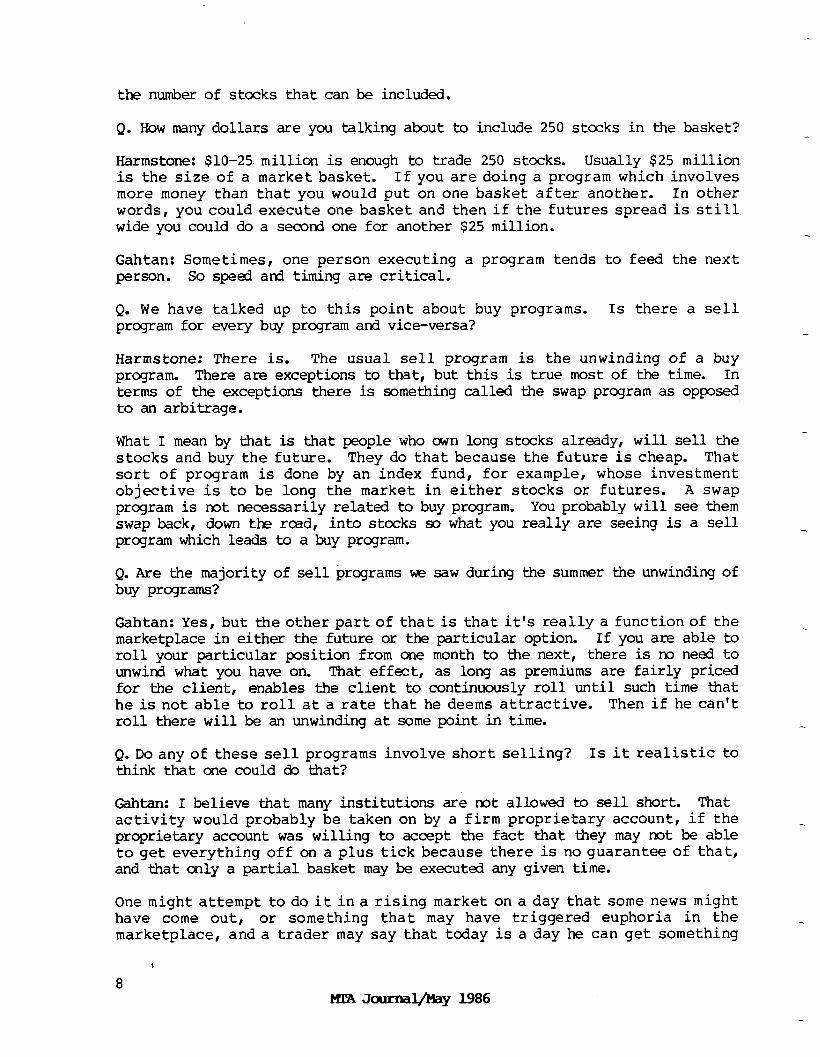
the number of stocks that can be included.
Q. How many dollars are you talking about to include 250 stocks in the basket?
Harmstone: $10-25. million is enough to trade 250 stocks. Usually $25 million is the size of a market basket. If you are doing a program which involves more money than that you would put on one basket after another. In other words, you could execute one basket and then if the futures spread is still wide you could do a second one for another $25 million.
Gahtan: Sometimes, one person executing a program tends to feed the next person. So speed and timing are critical.
Q. We have talked up to this point about buy programs. Is there a sell program for every buy program and vice-versa?
Harmstone: There is. The usual sell program is the unwinding of a buy program. There are exceptions to that, but this is true most of the time. In terms of the exceptions there is something called the swap program as opposed to an arbitrage.
What I mean by that is that people who own long stocks already, will sell the stocks and buy the future. They do that because the future is cheap. That sort of program is done by an index fund, for example, whose investment objective is to be long the market in either stocks or futures. A swap program is not necessarily related to buy program. You probably will see them swap back, down the read, into stocks so what you really are seeing is a sell program which leads to a buy program.
Q. Are the majority of sell programs we saw during the summer the unwinding of buy programs?
Gahtan: Yes, but the other part of that is that it's really a functionof the marketplace in either the future or the particular option. If you are able to roll your particular position from one month to the next, there is no need to unwind what you have on. That effect, as long as premiums are fairly priced for the client, enables the client to continuously roll until such time that he is not able to roll at a rate that he deems attractive. Then if he can't roll there will be an unwinding at some point in time.
Q.Do any of these sell programs involve short selling? Is it realistic to think that one could do that?
Gahtan: I believe that many institutions are mt allowed to sell short. That activity would probably be taken on by a firm proprietary account, if the proprietary account was willing to accept the fact that they may not be able to get everything off on a plus tick because there is no guarantee of that, and that only a partial basket may be executed any given time.
One might attempt to do it ina rising market on a day that some news might have come out, or something that may have triggered euphoria in the marketplace, and a trader may say that today is a day he can get something
-
8 ma Jaxnal&y 1986

off. But he then has to look at the other derivative market to see if that side is in line. So he is never certain that he can get that short sale off while the other condition that he is dependent on is there.
Q.Areyou saying that there isn't a greatdealof short selling as a part of these programs?
Gahtan: In my opinion, it is almost non-existent.
Harmstone: I would agree with that. We have done some experimenting with that, but it is a very unusual sort of trade.
Q. Andrew, hm do you determine when a buy program should be executed?
Harmstone: You look for a mispriced future, actually an overpriced future or an overpriced call relative to a put, depending on what derivative product you are looking at.
Gahtan: Or an underpriced situation. It really has to be looked at both ways.
Harmstone: Yes, that is correct. For a swap, underpriced futures have to be looked at. Mispricing is the key. In order to justify doing a program make sure that the mispricing is large enough to cover the costs when you do the trade. The largest part of the cost, interestingly enough, is the market impact of the stock side of the trade.
For a customer, you have to consider the commissions on the futures and the stocks, as well as the impact on the market. If you are doing the buy program, which means the future is overpriced, what you want to see is the future overpriced in excess'of the market impact plus the commission cost of the trade. Similarly, if you are doing a sell program, what you want to see is that the future is mispriced cheaply enough to cover the costs plus get you out at the rate that you require.
Q. Joe, if we are dealing with a three-month period, what type of premium is needed in the index futures in order to consider doing a buy program?
Gahtan: If you can tell me where interest rates will be and what the customer's particular needs over the T-bill rate or CD-rate may be etc., then I will be able to tell you what level it might be.
Every client has a different rate by which he needs to be either above T- bills, CD's or whatever his interest rate is. So, therefore, to say that there is a particular price by which a buy or sell program will triggered is really to say that this has all become standardized.
It really is not a standardized kind of thing because a client may have different needs whether that be 200 or 300 basis points over a ?Lbill or even more or less. On any one day it is certainly not dictated by the brokerage firms. It is client driven. It is client initiated.
Harmstone: You fir-d that there are two things that decide those levels. One
9 MTA Jcmnd&aY 19%
criterion is the trading range of the spread. People will usually execute buy programs at the top of the trading in terms of the spread. The second cri- terion is definitely, as Joe pointed out, the required return that the cus- tomers have and that is usually stated as basis points over T-bills something like 200 or 300 basis points over T-bills.
************************************************
Our interview with Joseph Gahtan and Andrew Harmstone-Rakowski will con- tinue. We'll talk about: Kinds of customers involved in basket trades; Effects of mergers cn market baskets; Programs and the individual investor; and How a broker can anticipate buy or sell programs.
10
WICE OF A PRJ: ProgramTrading. PartII
Our interview with Joseph Gahtan, Vice President, Options and Futures Trading, Salomon Brothers, and Andrew Harmstone-Rakowski, Stock Index Specialist at PaineWebber Capital Markets is concluded in this issue. This candid discussion of program trading should help many stock and options investors to understand one of the newest developments to occur in the equity marketplace.
Q. What kind of customers are involved in buy and sell programs?
Gahtan: Corporate and pension custczners.
Q. Is it the aim of corporate treasurers to invest excess funds available to them for short periods of time at some rate above a given interest rate, whether it is CD's or short term treasuries?
Gahtan: That's correct. Particularly now that interest rates have been dropping, the futures arbitrage has been a particularly attractive vehicle since its rate stayed up longer than actual rates on.other money market instruments. Recently, of course, we have seen the rates dropping. But for a long time you were able to get very nice rates using the arbitrage.
Q. What both of you are saying is that the stock market is being used as a vehicle for managing short term cash assets. Is that right?
Gahtan: In part, but certainly it is used for investment purposes as well. If a money manager had a portfolio of stocks , some of which he wanted to weed out, he might sell futures'outright against that portfolio in order to hedge the portfolio until such time that he was ready to make his stock selections. This strategy is basically being employed by money managers and not the corporate accounts.
Q. How are money managers using these derivative products for market timing, asset allccaticn and hedging?
Gahtan: If futures are cheap, a money manager may consider buying futures, especially if they're below fair value and then at a later time select the securities that he wants. As the stocks are added to the portofolio, the futures are sold.
The future, from my view, is a sentiment indicator. Someone's sentiment in the futures pit may not be the sentiment of an equity manager. If the equity manager finds the market cheap and feels it should be bought, but the futures' crowd believes the market is going lower and they want to sell a little below fair value, then there is an opportunity for an equity manager to replace his portfolio or buy futures and decide on that portfolio at a later time.
Q. Are there diverse reasons why users may at times want to consider using these instruments?
11 MpAJomml/May I986

Harmstone: Right now you are probably seeing a large number of hedgers participating in the market. As Joe pointed out, a lot of people are bearish on the market now. They are selling the futures against their portfolio to raise cash.
Alternatively, they are doing a portfolio protection strategy. If the market goes down they sell futures against their portfolio ard reduce their overall market exposure. Both of these strategies are at work right now.
Q. Joe, what happens if one of the holdings is involved in a merger?
Gahtan: We would check withour arbitrage area. Based on their opinion, we would suggest to the client that he tenders all or part of those shares in whatever the terms are of that tender offer. So, it would really be a function of the terms and whether you believe the merger is really going to happen.
'Ib just sell the stock out may also be the right answer. The other answer may be to tender it. Each individual deal is different and so each individual analysis would have to be made each time.
Q. If one of the issues is a particularly large holding within the basket and it is taken over, is there an adjustment to the portfolio? Is there a substi- tution? Is the cash being replaced?
Harmstone: Basically, you would try to take advantage of the merger or tender offers so as to track the indexes properly. Typically, you actually drop that stock out of the basket and substitute a similar stock. You have that flexibility. The individual stocks in the basket are less important than the overall basket.
Almost every stock with the exception of IBM or similar stock can be substituted for by other stocks that are also in a popular index. In a lot of cases, you can simply take a stock out of the basket, have aprofiton it and substitute another stock in its place.
Q. Let's get into something that is a concern to many brokers around the country. What effect do you think these programs have had on the general market?
Harmstone: Well, theprograms,since they involvebuying or selling a large groupof stocks canhave an impact on the market. It depends on the overall conditions of the market and how many people are trading.
When a firm is unwinding they will try to find buyers for the other side. They will find their other customers who are interested in buying those stocks. Often, the total market impact is less than you might think because it is possible to find the other side.
I think another important thing to realize is that whenever there is a big move in the market, programs get blamed because that's the easiest explanation. In some cases it is justified. In many cases there are other
12 HL7AJoumal/hy1986

things that are going on, but people frequently blame programs.
Q. Joe, what's your response?
Gahan: I think certainly at the onset of futures there may have been an impact. I think that impact has lessened over the last two years. If you are alluding to the last day phenomenon, which I think you are, that impact has been dissipated with each and every expiration because investors are very smart and have learned very quickly how to take advantage of these programs.
We have asked our customer base tobe prepared on expiration days to either buy or sell above or below the market and that has had a tendency to stabilize the market. We actively solicit clients to be there for any advantage that may be achieved by a buy or sell program on a particular last day. But in general, I think that if you look at the volatility of the market over the last two years, you will find that since the index futures and options have started we have been in a less volatile market than in the past.
I think if you were to look at the numberoftimes 4% moves have happened in the marketplace, you would see that they happen less often today than two years ago and much less than three years prior. If you were to look at 1980 to 1985 you would find that the percentage has decreased enormously. While we may have intra-day swings of some measure, the overallmarketvolatility has a- bated.
Q. If there is an impact on the market, is that impact very short in duration?
Gahtan: In my opinion, the impact is short induration. Now, there may be a level in the marketplace where people will say it has broken its traditional support or resistance zones, .-which may have been triggered by a buy or sell program. But I think the impact has lessened.
I think people have become futures and options wise and have been less likely to react to the buy or the sellprogram. I think the buy side has certainly learned not to react to it and is much more creative in its purchases and sales, apart from whatever these programs are doing.
Harmstone: The futures premiums do tend to indicate the sentiment of the futures traders about the direction of the market. Frequently, futures premiums are low because the market is heading dawn. Its the "chicken-and- the-egg" kind of thing. Is the selling the cause, or the effect, of a weak market?
Q. In your opinion, are individual investors disadvantaged by this activity in any way?
Harmstone: It seems to me that the impact on the individual investor is due largely tothedominance of large institutions trading in the stock market generally. With a large institution, the size of a trade can be so substantial that it affects the market.
Also, an individual may not have the same information that the institutions
13 ma Jamd./MaY 1986
do. Institutions can afford to pay for a lot of fundamental research, technical analysis and advice which an individual investor as a rule can't afford. I think there is a valid point that the individual investor has a more difficult time than in the past. I think this is due primarily to the institutional participation in the market with the fact.that these institutions typically have a lot more information than an individual investor can afford to obtain.
Gahtan: I think you should also look at how much the individual investor has gained by having these programs. I will take the positive side of that by saying that if an investor had something to sell at a specific price and a buy program went into effect he probably received an execution that he may not have received had the market not'risen to his level.
The same could be true with buying; if it were not for a sell program, an investor may not have been able to buy the stock he was considering at an attractive price. So as much as one would like to highlight the disadvantages of the program trading, I think there are advantages for public mstomers that were not present before.
Q. How can an individual investor , or a broker who deals with individuals, anticipate whenbuy programs and sell programs might occur? Are there any telltale signs that cne might look for?
Harmstone: I think that the most important thing that any individual investor or stockbroker can do is to monitor the price of the S&P 500 future. Not only because he can anticipate the programs but also because the future has frequently tended to lead the market , at least in a very short-term period.
It is one more sentiment indicator, something like a put/call ratio or the short position ard so on. It is another indicator that people should be aware of and look at. It could have predictive value and could help their cus- tomers.
If they watch the future they should specifically look at the difference between the price of the future and the underlying index.
If the future's premium starts to increase substantially, the broker should be aware of the possibility that the market may go up. It may go up because of a change in sentiment which is reflected faster in the futures market.
-
Secondly, when the future's premium goes up, it becomes more attractive to do program trading. You could have significant buying occur in many stocks because of the expansion of the future's premium.
I feel very strongly that an individual investor or stockbroker should watch the future's premium on a continuous basis. That's very easy to do. You just have to get a subscription to a quote service that provides futures prices.
You should watch those futures contracts very closely, continuously, through the day. When you see a big positive change in the premium, be aware that it
14 MlR Je 1986

could be foreshadowing a rise in the market. Similarly, a weakening in the futures premium could be foreshadowing weakness in the market.
**********************************************
'Ehank you both for sharing with our readers your insights ~1 program trading and helping us understand hw it arks.
This article was made available through the courtesy of the Members of the New York Stock l&change and is reproduced with their permission.
15

'86PIW INmEt4?Iax~
by Walter R. Deemer
Introduction by Arnold Wood, Batterymarch Financial Management
The Boston Security Analysts Society has about sixty luncheon meetings a y-b and all but one or two of them are devoted to company presentations. This meeting is the one out of the sixty. We're going to look at the market from the inside. We're going to look at that little thing in the capital asset pricing model (for those of you who are familiar with that) called the "mu" out on the end. It is the little thing the academics use when they say "I can't explain why it happened.' It helps to explain how we behave as investors.
We have a very appropriate person here to do so. I didn't realize the following that Walter Deemer has. I was actually quite surprised at the number of people here today - about 50 plus, 49-plus of whom are old friends of Wally Deemer which is just terrific. He started in the business in 1963 with Merrill Lynch. He joined shortly Tsai Management, then went to Putnam for ten years, and now has his own firm, Deemer Technical Research, which he started in July 1980. We are delighted to have him here to tell us about the inside of the market.
Remarks by Walter Deemer
Thank you, Arnie. It's a real pleasure to be back in Boston again. Bostonhas always been a very special city to me; as you just heard, I spent most of my professional career here in Boston. I also happened to meet and marry my wife here in Boston, so there are a lot of fond memories for me here. I am glad to be back in the home of the bean and the cod... and the football teamthatsquished the fish, but had a real rough time with the bears in the Super Bowl yesterday. As you know, the outcome of the game has a great deal of impact on what the stock market is going to do this year, and we will get into that later. First, though, I'd like to express my appreciation to the Boston Society for inviting me here - for letting me be the one out of sixty -- and for giving me the opportunity to see so many of my old friends today.
For those of you who don't know me very well, just my being here today tells you a couple of important things about me. First, I have a terrific sense of timing, since I waited for the Super Bowl to be played yesterday so I would know what the market was going to do for the rest of the year. The Chicago Bears, of course, were from ths old NFL; since if the team from the old NFL wins the Super Bowl the stock market goes up for the year, you now know what the market is going to do this year. Youdon'tneed technicians to tell you, you don't need economists, you don't even need MPT. You just need the football score. The only problem is that I have a bit of trepidation this year, because if the market happens to go down during the year someone is going to get up and say "Well of course the market went down; the Bears won. How can the market go up when the Bears win?" So I think there will be a Super Bowl indicator around next year - but maybe with an asterisk. Besides my astute
16 M!I!A JoumaljBy 1986

sense of timing you also know that I am also quite contrary, since I came from Florida toBoston at the end of January to deliver a talk. Everybody else is headed the other way for any reason they can think of, so there is a big sense of contrariness about me, too.
For those of you who are not all that familiar with what I am doing now, let me take just a minute ard explain. Basically I am doing two things. When I left Putnam in 1980 I started a consulting firm, Deemer Technical Research, in Florida. We provide a consulting service to institutional clients, giving them the same sort of research information as I generated at Putnam during the ten years I was there. The second thing is more recent; when I moved to Florida I had a long-range goal -- or dream -- of starting a market letter, and after a lot of hard work, we got it going last October. It is called Mr. Technician, and we are having a lot of fun with it. So Deemer Technical Research now has two arms: the market letter and the institutional consulting service.
I must tell you that the title of my talk was selected very carefully. After deep consultation with Rich Gula, my successor at Putnam, we came up with the title "'86 Pitfalls In The Market." We thought the word "pitfalls" would bring out the nervous people -- and I hear that there are a lot of nervous people in Boston. We also thought by using "'86 Pitfalls," many people would not know I meant1986 and thought I would stand uphere and rattle all 86 off - so I thought this would bring the hard core bears out. I will get to the 86 pitfalls later on but they are really not all that serious.
Seriously, though, I do think 1986 will be a lot trickier year than last year for investors to deal with. It's funny. If I had come here a year ago and told you that the market was going to go up most of the year, that there would be only one reaction during the year -- but that it wouldn't be even as much as 10 percent, and that by the end of the year the averages would be at all time highs, you would have said "ah-hah...vintageyear...isn't this great" and spent the year on Cape Cod. But we all fretted all year; it was one of the most nerve wracking years I have ever been through. I think the fact we were all nervous all the year through made it happen. Butgettingtwoyears like that back to back is going to be kind of difficult, I think, which is why I suspect that 1986 is going to be a little trickier than 1985 was.
I am going to tell you this afternoon how you can get through the next 11 months with most of your sanity intact. Tb do this I am going to break my talk into 3 different parts. First, a few thoughts on how you might be able to get more use and benefit out of this thing we call technical analysis. You do not need to be a technician or technical analyst to get some use out of technical analysis; you do not need to even admit publicly that you even look at the stuff. Secondly, I will discuss the market's technical position; where we are now, and how we got there. This sets up the third and finalpartof my talk: where we might be going.
I had actually toyed with calling the first part of my talk "The Death of Technical Analysis" -- or at least "The Death of Institutional Technical Analysis." This fits in with what someone said to me earlier today, that technical analysis has fallen into ill repute. I must confess that knowing
17 MTA JarrndypfaY 1986

Dean &Baron for many, many years, as technical analysis swings more and more over into the so-called "ill repute" category I keep waiting for Dean, as a big contrarian, to start a war room over at Batterymarch. Dean, though, once had my predecessor at Putnam, John Bennett,over there working for him,and told John to hide his charts in the drawer with the false bottom in it until after five o'clock. Rich Gula, my successor at Putnam, is over at Batterymarch glow, but he's got John Bennett's old desk, and Rich has still got to use the same drawer, and Dean still doesn't have a war room. I don't know how long the whole process takes but I don't knew whether I can wait that much longer.
Actually, I was reminiscing about all this the other day. Back in the early 1970's there were 13 in-house technical analysts at insti.tutions in Boston, and 6 of us were operating at fairly senior levels. The number is now down from 13 to four; more regrettably, the number of senior analysts has fallen from six to one. I don't know why; I don't thinkour records havebeen that bad, and in some cases they've been quite good. Perhaps it's just economics. Technical analysis may have already gone through what the field of economics is going through now, which is reductions of in-house efforts. I may also be that the severe reductions in soft dollar commission budgets has caused the number of available sources to institutions to diminish, so the need for in-house coordination is down.
Technical analysis, I dare say, is not dead. I suspect everybody in this room reads Bob Farrell or StanBergeor John Mendelson. I think the problem that technical analysis has gotten into is that most people, for various reasons, now rely on just a few analysts for input on any given stock or group. As a result, most people tend to know exactly the same thing about almost everything, including the market, as everybody else does. The answer, of course, is to be contrary, but with everybody knowing the same thing, everybody has sort of a standard contrary. Also, as far as contrary investing goes, there are so many little Batterymarches around now that they are making life miserable for everybody (in that they are all using essentially the same screening process. This means that everybody is either coming up with nothing or, in order to get a jump on the guy down the street, they're fudging their screens a little bit, making the risk factor higher and the performance lower.
I think that being contrary is a big part of technical analysis (or "market analysis"' which I prefer. But I think that basic technical analysis has to be integrated with all the other factors. This is a key thing which John Bennett, who taught me a lot when I worked for him at Putnam, and to whom I owe a great deal, taught me. John did a great job of showing, on a practical basis, how technical analysis should be integrated with the other elements: economic, fundamental, political, monetary - it all blends together. It would be nice to have technical analysis all summed up by a black box with a red light and a greenlightonit ; when the green light is on, you're in, and when the red light is on, you're out. But its not that simple, especially if you realize (and I think this is the basic underlying rationale for technical analysis) that the market is the sum of all of our knowledge -- those of us here in this room and everywhere else. As such, the market "knows" more than any single person in it; by studying the market, you can learn, by inference, a lot of things about things like strength ard weakness in the economy.
18 HINJanodLFfayU86
How can you use technical analysis most effectively? Well, a writer named Dostoevsky once said "Be simple -- and rediscover the world." I think that's as good a place to start as anywhere. Everybody seems to want to fine tune things until they lose value from it rather than adding, so I think as we go through the rest of this presentation - and as you go through the rest of the year -- you should just keep asking yourself a couple of basic questions. These questions are what you should be finding out from technical analysis -- and what technical analysis can tell you. So just keep a couple of simple questions in mind: Is the trend -- intermediate or major -- up or down; is the market going upordown? Is the.market gaining or losing momentum? Is the move broad or narrow; can you buy almost anything and make money, or do you have to be very selective? Is the tone of the market speculative or conserva- tive? There are times, during a speculative binge, when you have to have a high beta -- and there are times when, if you have a high beta, you will have your head handed to you. Also, is the market's tone getting more speculative or more conservative? Finally, the most important question for those who manage money: where's the leadership? What's leading the market up or down? Is there any theme to it? (There is abig theme now called deflation, and it is blending a couple of things together that might not ordinarily have been blended together). Just keep these things in mind as we go through where the market is now and where the market is going, and I think you will be able to find out some insights that market analysis can give you.
There is a basic underlying factor about the market here that you can't forget (even though we all tend to because we are in the heat of battle day after day): we are in a secular bull market. A secular bull market is a bull market that extends over more than one conventional 4-year cycle. This one happened to begin in 1974; it followed the secular bear market that started in 1968 which followed the secular bull market that started in the 1940's. So you are now in the midst of a' secular bull market which started with the once in a generation valuation lows of 1974, and it is not likely to end until you get once in a generation valuation or speculation highs as you did in 1968. And, whatever else this,is, "itain'ta secular top." This is not a once in a generation high yet; as a matter of act, if you envision a pendulum swinging fr0m.a secular low, with its undervaluation, underenthusiasm and disinterest, to the overenthusiasm and overspeculation of a secular high, you are probably about halfway there. So that puts the end of this secular bull market somewhere in the 1990's. It is an important underlying factor, since the major underlying trend is with equity investors now, not against them. And as technicians like to say, "the trend is your friend."
I don't think this secular bull market is going to end until the public is back in the market with both feet. I think they are going to come back in a big way; I suspect our friends at Fidelity will have a hundred billion dollars before this whole thing is through. The public is going to be very excited about stocks again, just as they have been excited about other things in recent years; they will rediscover the stock market. This is one reason Mr. Techni- cian, my market letter, was created; when they come back I want to have some- thing for them to read -- and I think they are going to be back in a big way before we are through.
"Secular Bull Market" - I almost think that we ought to put a little sign
19 MllA Jourd&ay 1986
on our desk that says "This is a Secular Bull Market;" the first thing every morning; you look at it, and the last thing every night, you look at it. It is something you tend to forget, but it is something very basic -- the most basic building block of where the market is now.
We now come to the regular bull and bear market cycle; the four-year cycle. The four-year cycle is working very well: in 1982 we got a conventional 4-year cycle low, which followed the prior lows in 1978, 1974, 1970, 1966 and 1962. The four-year cycle (which happens, if you track it very closely, to be 51 months) means that if you add 51 months to the last low, you come up with October of 1986 as the next one. And, since in order to get a four-year low, you need a decline of some magnitude, you can't go all the way to September of 1986 to get your peak; you need some sort of a significant decline to get a four-year low. From a four-year cycle standpoint, then, 1986 looks like a bad Y-r -- except for one thing. And that's what the Fed did last year; something they weren't supposed to do three years into the four-year cycle -- they cut the discount rate twice at the end of 1984... and once more, in May, for good measure. They aren't supposed to do this. They are supposed to be tightening; they aren't supposed to be loosening. And, as a result, I suspect that the Fed has blown the four-year cycle out of the water this time around. It has certainly put it in limbo. This leaves two possibilities. Number one: the four-year cycle is still there, so you get a low in October 1986 (give or take a coupleof months). Number two is that the Fed has indeed changed the four- year cycle (and if I were going to vote, this is the one I would vote for).
This means that the market is now doing something similar to what it did in 1960-62, when it sort of skipped a step in the four-year cycle: we had a major low in 1960, which was economically related, and we had another major low in 1962 which was all technical. The 1962 decline had nothing to do with a recession; although there were fears of a recession, there was no actual recession. But there was rampant speculation in the market in 1961; May of that year saw the only day in history when the Amex volume was bigger than the NYSE volume, and the new issue market was red hot. Nineteen sixty-two was a correction of 1961's over-speculation and over-valuation (the Dow-Jones Industrials were selling at 25 times trailing 12 months earnings at the end of 1961). It was a purely technical decline. Nevertheless, you had a major low in 1960, another one in 1962, and, since then,one every 4 years. If the Fed did what it usually does early in the four-year cycle back at the end of 1984 and in early 1985, we may have skipped a step again, and the four-year low may now be dating back to 1984, not 1982. There is certainly a strong possibility that the next four-year low is not scheduled for 1986, but 1988.
I am really saying only one thing. I don't think you can be bearish this year just because of the four-year cycle. You aregoing tohavetohave some other reasons too, because there is an offsetting argument this time, which says that the next four-year low will not be in 1986 -- but 1988. And all the sentiment factors that we touch on later suggest that this is not a major top, but only part way up.
Now to the intermediate term. We had a top last summer, but there was no particular technical deterioration. We started the decline last summer with the classic early leaders (the financial stocks, the interest-sensitive stocks,
20 e Jourd&ay I386
the utilities) starting down first. The Dow Jones Utility average, as I remember, had the biggest one day decline in history a day or two off the July top. And so the early leaders led the market down last summer. As the market started down, the longer term indicators quickly turned bullish. (They were never really bearish to begin with). The shorter-term indicators (the sentiment factors, etc.) quickly turned bullish afterwards. We were then sitting there waiting for strength to reappear in the areas (foods, financial, utilities, etc.) that led us down in the first place. It took us until early October, but we finally got it. It showed up first in foods, but that was due to the General Foods buyout. Thenit showed up in utilities; finally, in the first week of October it showed up in the financial stocks, interest sensitive stocks, and quality growth stocks.
In hindsight, getting outlast summer was easy, but getting back in was almost impossible. Now that was the low; the last low of short to intermedi- ate-term significance. What was sentiment like at that low? You are going to have to remember; if you forget, you are going to have to relive history. This is because sentiment was unbelievably bearish at that low -- and it stayed that way almost all the way up. To give you an idea, let me just read this, which was written on September 20 because I was getting so much pressure from people about why we should be bearish. (Editor's Note: this now seems almost unbelievable -- ~10~ that the KJI has broken 1700).
"We set forth our 'not a bear market' case in considerable detail in last week's report. Nothing has changed since then, so we will not repeat our case here. We would like, however, to briefly respond to a few of the most common investor concerns. 1) Important uptrend lines have been broken. True. But this is not necessarily fatal -- especially given the lack of traditional bear market evidence (as we discussed last week); mid-1965 decline.
To see a classic example of this, look at the 2) The four-year cycle is bearish. Maybe -- but
there is also some strong evidence it may not be. 3) Institutional cash levels are very low. Also true, but this is usually the case during intermediate market declines (as opposed to bear markets). We still think, as we have since late last year, that there is more than enough cash available to support a significant advance in the hands of (a) the public (b) corporations and (c) (possibly) foreigners."
The thing to remember is that people were unbelievably bearish at the time of the last low, last September and they should be just as bullish at the next top. They aren't now. And until they get that way, I don't think you have an intermediate top.
So we got a good intermediate low last September. We then started a traditional rally sequence, which came in exactly the right order. It was led by defensive groups (the financial index, utilities, etc.) and quickly spread into quality growth stocks. Leadership then spread to the more cyclical ele- ments, as the Transportation average hit anew high. The next stop when you are going through a rally sequence, is usually the more speculative areas of market; finally, the last area to go up is the energy area (which doesn't seem to be doing that yet). So you are probably somewhere in the middle of the rally sequence now; where you start the sequence again really depends on how
21 KCAJaxnal&ay 1986
severe and how long the decline goes. I don't think the decline is going to be bad, as you'll hear in a minute, but if I'm wrong, and if the decline lasts longer than I think (if the market erodes away for a while, as it did last September), you may start the rally sequence back further towards the beginning of the leadership sequence -- the financial and quality.growth stocks -- rather than picking it up in the middle again.
As we rolled into 1986, the advance sort of got caught up in the turn-of- the-year cross-currents. On Tuesday, January 7th, the Dow broke free and made an all time high. It was a confirmed new high, which in technical lingo means that all the things -- the advance-decline line, financial index, etc. -- that were supposed to make new highs along with the broad averages did so. There were only two exceptions; the same ones that dogged the market during the whole November-December advance: the Transportation average (which, as it usually does, lagged and then caught up) and the one remaining divergence, the number of new highs , which was higher last spring thatitis now. Thus, onJanuary 7th you had a confirmed new high; there were no divergences waving all over the place. The important thing about that is that big declines don't usually begin from confirmed new highs; only short-term corrections begin from confirmed new highs.
Then, the next day -- Wednesday -- the market followed through on the upside, but then we got what we technicians call an "outside day," which means the market high that day was higher than the previous day, but then it turned all the way around and closed below the previous day's low. That's a significant reversal ; it's usually tough to go up above the prior day's high and then turn around and come all the way back down and close below the previous day's low. You did that Wednesday, though -- and you did it in a whole bunch of averages. That usually means it takes a while for the market to settle down afterwards, but the fact the we had a "record 39-point decline" (which the media all picked up) was really not all that significant. It was 2 l/2% declne; I can tell you about many 2 l/2% one-day declines. As a matter of fact, there was a 36-point decline on October 25th of 1982 - but it started at 1030, not 1570, so it was 3 l/2% instead of 2 l/2%. That one ended up being a 6.1% decline, on an hourly basis, that lasted about three days. The market then rallied, and came back to test the low three weeks later and again seven weeks later; then it was off and running again.
The 1982 decline came after a long advance without a correction -- as this last decline did. So short-term declines in bull markets can begin very suddenly, but then they don't usually follow through. So call this a short- term correction rather than something serious. It doesn't appear to be quite over yet. I don't want to get too short-term but the fact that we bounced off 1500 last week only lets me know that a lot of people still know how to divide by 100. The very short-term numbers were not particularly good last Wednesday, Thursday, and Friday, so technically it doesn't look like a terrific bottom. I would rather seethe market go down in continuing response to the decline in early January (in what I would call "aftershocks" to it) and break 1500. If youbreak 1500 you willsetupabetter bottom and have abetter advance than if you go up from here. This bottom is not as solid a bottom yet, by a long shot, as the one last Septe&er and October was.
22 Kl!A J-y 1986
The funny thing in all this was that the right decision in the last year, or more than a year , was to just stay bullish. Maybe you could have gotten out in July and August and gotten back in September and October, but I doubt it. That decline was an 8% decline (I was saying all along that it would be less than a 5% decline, which it was in the Dow-Jones, but that was fudged by General Foods. So call it an 8% decline). Can a major institution get out and get back in again in 8%? I don't know. The problem, too, was that there was a great hue and cry then about leadership shifting, and I suspect if you got out of the Bell operating companies and the regional banks then you never got back into them -- and that was more costly than avoiding an 8% decline. So where the market is now is a short-term correction in an angoing intermediate uptrend in an ongoing bull market in an ongoing secular bull market.
Where are we going? Is the bullmarketending? There don'tseemtobe any signs of a major top. There is IIO overspeculation. I was in Jerry Tsai's war room in 1968; I have seen what speculation looks like -- and "this ain't it." Nineteen sixty-eight was the time when the Amex tape ran more than half an hour late. Think about that; the Amex tape is so slow now they can rent 30- second commercials on it and sell advertising on there ("Merrill Lynch is bullish on America") - then report two more trades. Nineteen sixty-eight was also the time when the analyst who followed a stock called Parvin/Dohrmann' showed me a subpoena he had gotten. There were some shenanigans going on, and somebody wanted to talk to him. A couple of weeks later he got a second subpcena, leading to his sell rule: "When you get the second subpoena, sell!" There's nothing like that going on now; there's 1k0 overspeculation.
There also aren't any major divergences , which is usually the sign of a serious loss of momentum. Breadth is surprisingly good in here. The Transportation average has now.made a new high. The financial index has made a new high. Utilities are hanging. in there. So there are-no major divergences. There may be some short-term ones building up; maybe not. If you goback up from here without first going back under 1500 you may set up some shorter term divergences -- but nothing major.
Is there overconfidence here? No sir! I haven't had to tone anybody's enthusiasm down in the last year and I don't think I will have to start this afternoon. Sentiment is surprisingly shaky yet. Nobody believes the bull market is for real. Institutional brokers don't believe it. Public brokers don't believe it. The public doesn't believe it. Believe me -- the public doesn't believe it. I am in the market letter business now, and sometimes it generates some very good sentiment figures. Some of my cohorts have very heavy advertising budgets, and they know down to a hundredth of a percent what their response should be to a given ad they run in Barron's, or to a given 50,000 piece mailing. These are proven ads; the same ads they run over and over. When the market went up through 1400, their response rates (which had been running about half of normal) remained there until we got to 1500 -- at which point they fell off even further. The public just isn't coming in here -- and the various wirehouse trading figures show it. And institutions don't believe it either. That's why I went into the sentiment of last September in such detail. That was just an intermediate low, but everyone was very gloomy back then. By the time this bull market ends the majority of people will be long-' term bullish -- just the opposite of last fall. We have a long way to go
23 MpAJouad&iy 1986

before to get to that point.
I will mention two uncertainties here. Number one is this four-year cycle thing. Are interest rates going to stay low? They have stayed low for a long time now. I have no idea where interest rates are going; I have always followed interest rates because they tend to lead the stock market, and I like anything that leads the stock market. If the planet Venus led the stock market I would follow the planet Venus. But thequestion is whether interest rates can avoid going up before long, thus putting pressure on stocks? In other words, is there going to be a four-year cycle low this year, as scheduled? The other uncertainty is whether corporations will continue to buy their own stocks and acquire other companies at the same rate as a year ago. It looks like this trend is starting to slow down; if it does slow down, the question then is whether the public will take up the slack. The public has the bucks -- more bucks than anybody else. What they do with those bucks determines what a lot of financial markets - including the stock market - do. The public doesn't have to put the bucks directly in the stock market; they don't have to walk into their Merrill Lynch office and buy 100 shares of Cray Research. They can put the money into mutual funds, which then go into the stock market. But the question of public participation in the stock market is the imponderable.
With that, I think we can come up with some conclusions, and then I can answer some questions. Here are my conclusions. First, the major and intermediate trends are still up. However, 1986 is likely to be a much choppier year than 1985 was. This is partly why 1986 is going to make you long for 1985 before it's over. I know you didn't like 1985, but after this year is over 1985 will look better and better to you. Second, the odds are that there is going to be at least cne correction of more than 10 percent sometime during the year. Before that, though, since all the technical problems here seem to be very short-term in nature, there should be at least one more push to the upside. Third, the market is getting more specxawinnature. I suspect that this trend is going to continue, but I suspect that the big wave of speculation -- the sort of insane wave that is going to be even stronger than 1982-83 was -- is still out there a few years, rather than just around the comer.
Finally, as far as leadership is concerned, regrettably, this is the point in the market cycle when technicians have a hard time, because the leadership is so well established but is also very extended, and the market advance is also broad enough that there are literally hundreds of good looking stocks. During the last couple of days I have had a chance to look at a lotofcharts; I thought I would come up with all sorts of ideas, but ended with very few, since it is of no use to give you a list of 200 over-the-counter stocks that look very good (which I could easily do). How do you narrow the 200 stocks down? Anyway, the old conservative leadership - disinflation or deflation or whatever -- is still there; regional banks are still there, and insurance is still there. But they are very extended. If you don't awn them now you have a rough decision to make, because that's where your leadership is - ax-d it is as extended as can be. As far as new ideas, given the rotational nature of the market and the fact that we are getting a little bit more aggressive in nature - usually this combination of factors (the fact that the rotation has gotten beyond the financial and growth stocks, and has worked its way down towards the
24 MI!4 Jarmal/pfay 19%

more cyclical growth stocks, a nd the fact that you are also starting to pick up secondary stocks) -- the normal thing that is at the confluence of all these forces is technology. So I think if I were a research director I would have my technology analyst working very hard to uncover ideas. There are a lot of them that look interesting tichnically (again, most of them are extended); over-the- counter stocks like National Computer or Reynolds & Reynolds, for example. This is where you need fundamentals to sort them out ; a technician cannot do it for you. But I would be looking for ideas from the technology sector and the cyclical growth sector.
Energy stocks are laggards; they are traditionally the last ones to move during a rally. It is probably too soon to anticipate strength rotating there, but I would suspect that at some point during the year you are going to wish that you owned a bunch of energy stocks. I don't know when -- and I don't think it's tomorrow. But I think I would be looking for ideas in that area now. In other words, your decision now is when to sell a regional bank and go on to an energy stock. I don't think that point has come yet -- but at some point it probably will. And you will need to know then what to buy within the energy area: oils or oil service or gas or whatever; traditionally institutions used to think of the energy area as Schlumberger and Halliburton, but I suspect that there are going to have to be some oils in there this time -- and some of them will have to be overseas oils. And finally, with all this I see, the one thing that comes up as the beneficiaries of it is the stock brokers. If the public's coming back, I suspect brokers are going to make a buck or two. And I think the reason that brokerage stocks have not done well so far is simply because they are a barometer of institutional confidence; institutional confi- dence never got restored, and therefore brokerage stocks never went up. So I think that I would want to own a brokerage stock or two here (or a mutual fund management stock or two).
Before I conclude, I ought to give you the 86 pitfalls I promised the hard core bears at the beginning of my presentation. The 86 pitfalls -- the biggest pitfalls I see this year -- are the 52 money supply reports, the 30 stocks in the DowJones Industrial average , and your four quarterly performance reports.
Now to answer the questions I told you to keep in mind -- and remember there is no reason to be a hard core bear here. Is the trend up or down? Intermediate up, long term up. Is the movegainingor losing momentum? It appears to be losing it. After all, you're up 200 points in the Dow-Jones; you can't gain momentum in here, you're going to lose it - but it is dissipating
slowly. very Is the move broad or narrow? Surprisingly braad. Is it getting broader or more selective? It is remaining surprisingly broad; it has not narrowed all that much yet. When it starts to narrow, probably the first to drop by the wayside will be the conservative leaders such as the financial and utility stocks. Is the move speculative or conservative? At the moment it is not too speculative; it looks like it's getting more speculative; we'll have to see how speculative it gets over the next couple of months. I think it will be more speculative, but I don't think that it will be the big speculative push. I will say this, though: this is a secular bull market; ithasn'ttopped out. No portion of the market has topped out - including the NASDAQ Industrials, which is still well below its 1983 all time high. The NASDAQ Composite index hit a new high this month, but I follow the industrial index because it doesn't
25 MA J-Y 1986

have banks and insurance companies in it, so it is a much better proxy for smaller growth stocks. The NASDAQ industrial average at the moment is about 330 and its all time high is about 420; I don't think that will be its all time high by the time this bull market is over. Percentagewise, that gives you a fair amount on the upside. Finally, where is the leadership here? In the same old places: the same old insurance group, the same old Digital Equipment, or whatever. I see no real change in leadership here -- except I think it will get more aggressive.
With that, I will stop and see if anybody has any questions.
Questions
The question is do I have an updated nifty-fifty growth stock index? The answer is no. It's funny; when I was at Putnam my big boss asked me the exact same question, because we were following a nifty-fifty index at the time. I quickly assured him that our index was not up to date. He was disappointed - until I explained that if I knew when Eadd a stock to the nifty-fifty index, and when to remove stocks that were already in it, he wouldn't need any portfolio managers. What I am trying to do with my growth stock index is to measure what proven growth stocks are doing in the market (as opposed to emerging growth stocks), so I am sticking with my growth stock index -- which is still a good leading indicator of the market. This is because if you decide the market is going up, the first thing you buy is IBM, not some little over- the-counter stock. That happens the next day.
"What are some leading indicators that will tell us when individuals are coming back into the market?" Probably the brokerage house trading statistics - plus the fact that when people talk to you at cocktail parties, instead of walking away when you tell them you're in the investment business, they ask you what you would buy instead. I think they are just now starting to do this, but they are certainly not doing it very frequently. As far as the brokerage house figures are concerned, I tend to follow the Merrill Lynch figures more closely than I do the others simply because I calculated and plotted them back in the 1960's, so I got more familiar with them than anything else. The general public, according to those figures -- and others -- has generally been disinte- rested in the market during the last year. They have shown a flicker of interest during the lastcoupleof weeks, but they are certainly not rampant buyers at this point. I think the public will come back into mutual funds before they come into individual stocks, though.
"DO you have forecasts on overseas' markets and currencies?" No. The reason I don't do work on foreign markets or foreign currencies is that my whole approach to analyzing the stock market is to find things that lead the stock market, and then to use those things that lead the stock market to predict what the stock market is going to do. These "things" are concentrated pretty heavily in sentiment factors. I have difficulty finding leading techni- cal indicators in those other markets, and therefore I let other people worry about them.
"What impact are options' arbitrage programs and the like having on tech- nical analysis?" They are increasing the sales of Maalox considerably. As I
26 KQi Jourd&ay 1986

understand it, you literally have to be sitting on a trading desk to do these programs, and what triggers them can be an almost instantaneous price movement. I think these programs are accelerating moves, particularly from a short-term standpoint, but I'm not sure they have that much of an effect on long-term mves .
','Have you thrown away any traditional technical indicators and replaced them with new ones?" Yes; I have thrown away a lot of indicators, but I haven't been able to replace them with that many new ones that are coming along. It makes life very difficult. For example, the whole short-selling spectrum of indicators may have gotten mucked up by those arbitrage activities, but most of them still seem to be working okay -- and the ones on the American Stock Exchange seem not to be distorted much at all. The problem with the Amex figures is that you can't always get them on a timely basis,and there are a lot more mistakes in them than there should be. I have, unfortunately, had much less success finding new indicators to replace the old ones that are thrown away. I will say that, whatever its problems, the put/call ratio seems to be a pretty good sentiment indicator, even with all this arbitrage activity that is taking place. I spent a couple of days on my computer breaking the put/call ratio down into index and non-index ratios, and I finally decided that it was really a waste of time -- that the plain old put/call ratio worked best of all.
Thank you.
A presentation to the Boston Security Analysts Society, January 27, 1986. Walter R Deemer is a member of the Market Technicians Association and is the President of Deemar Technical Research.
27

by Kenneth Safian
Overview of Safian F&search, Inc.
Safian Investment Research provides the institutional money manager, both here and abrmd, with a research service totally dedicated to analyzing and forecasting stock market and ecoRomic trends.
A uniqueaspect ofourfirm , and an underlying thesis to our analysis, is that the stock market is not homogeneous, but rather is compromised of major sectors each of whose movements reflect the divergent trends present in the economy. This sectoralization -- of the economy and stock market - is the thrust of our research effort. Importantly, a combination of original fundamental and technical considerations is incorporated within our analysis.
Nearly twenty-five years ago, the principal of our firm co-introduced what we believe was the second major attempt to sectoralize the stock market (the first having been accomplished by Charles Dow in the late 1800's). This segmentation divides the stock market into two major sectors - Growth and Cyclical. The approach has been particularly useful in identifying major divergences which have occurred in the market such as the 1964-1973 period when growth-related stocks outperformed cyclical-related securities, 1588 to 88.
This dichotomy between sectors of the market was further confirmed by earnings and prioe earnings multiples data, which cr>ntinue to be maintained on a sector basis. The Earnings Divergence Ratio in particular has proven very valuable in signaling when shifts between sectors are most likely to occur.
In addition, we analyze macroeconomic, technical, political, and demogra- phic trends as they relate to the stock market. After determining which sectors appear to be most attractive, we look to select within those sec- tors those major companies which appear relatively undervalued.
ccxporate Profits -AnEvaluatial- 4th Quarter 1985 Data
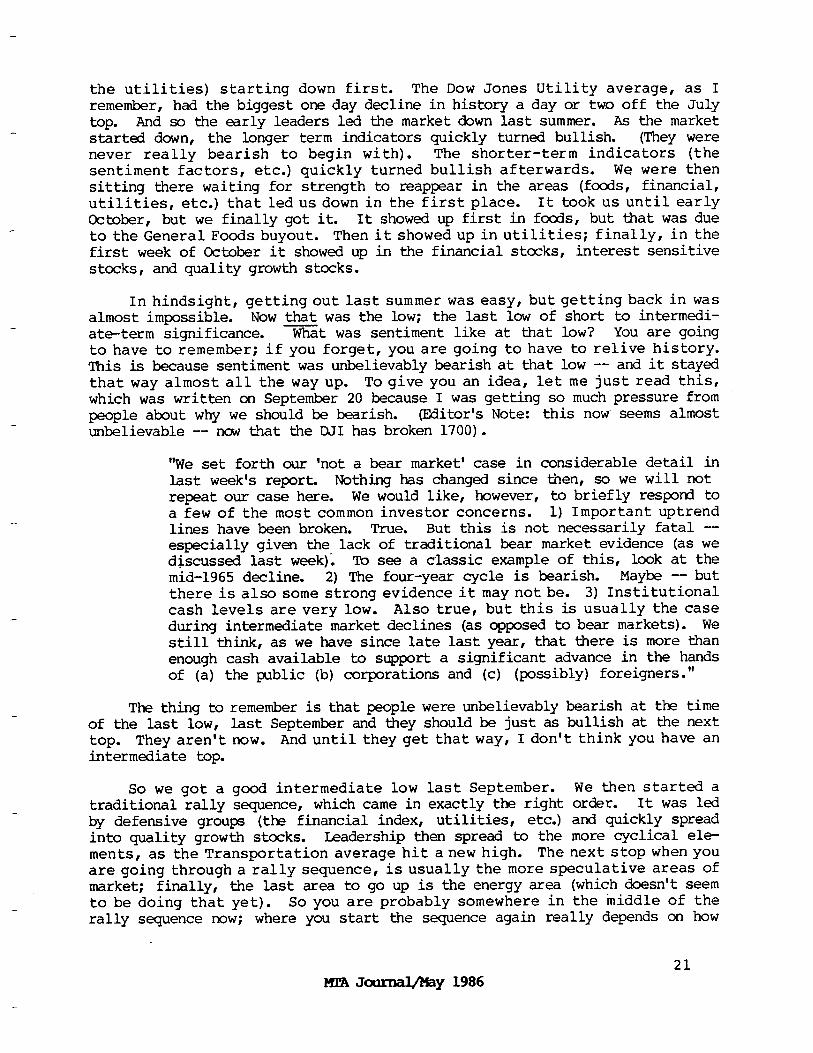
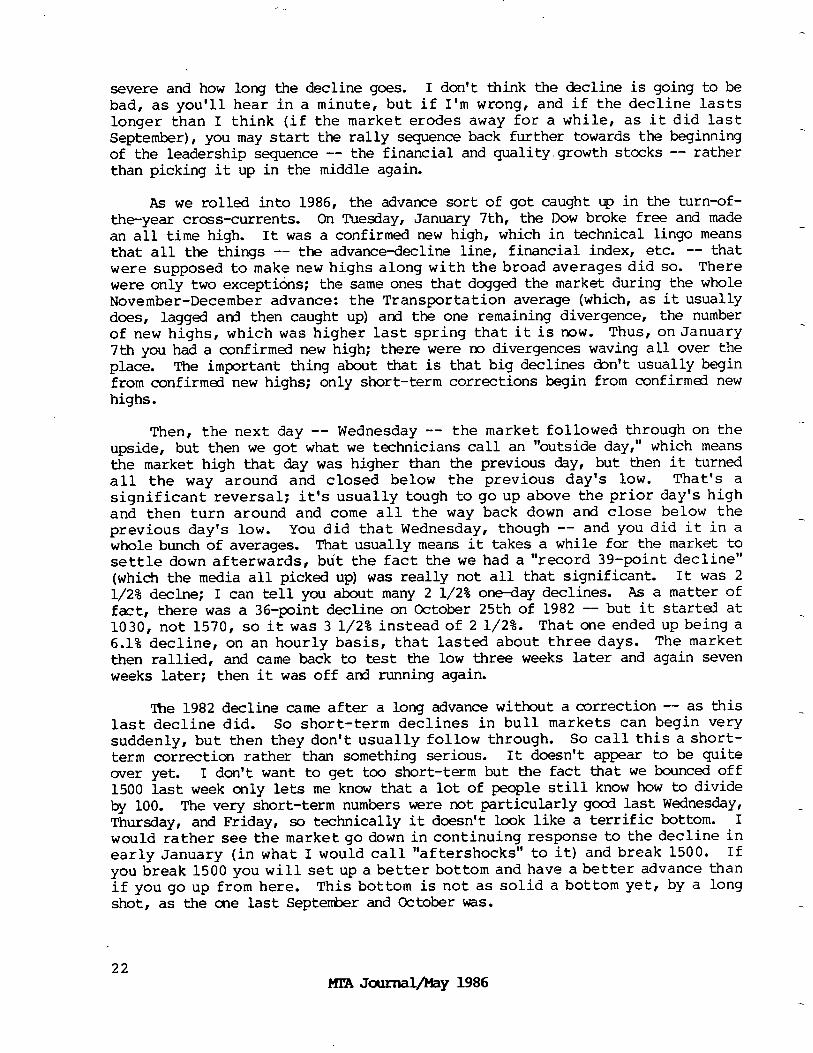
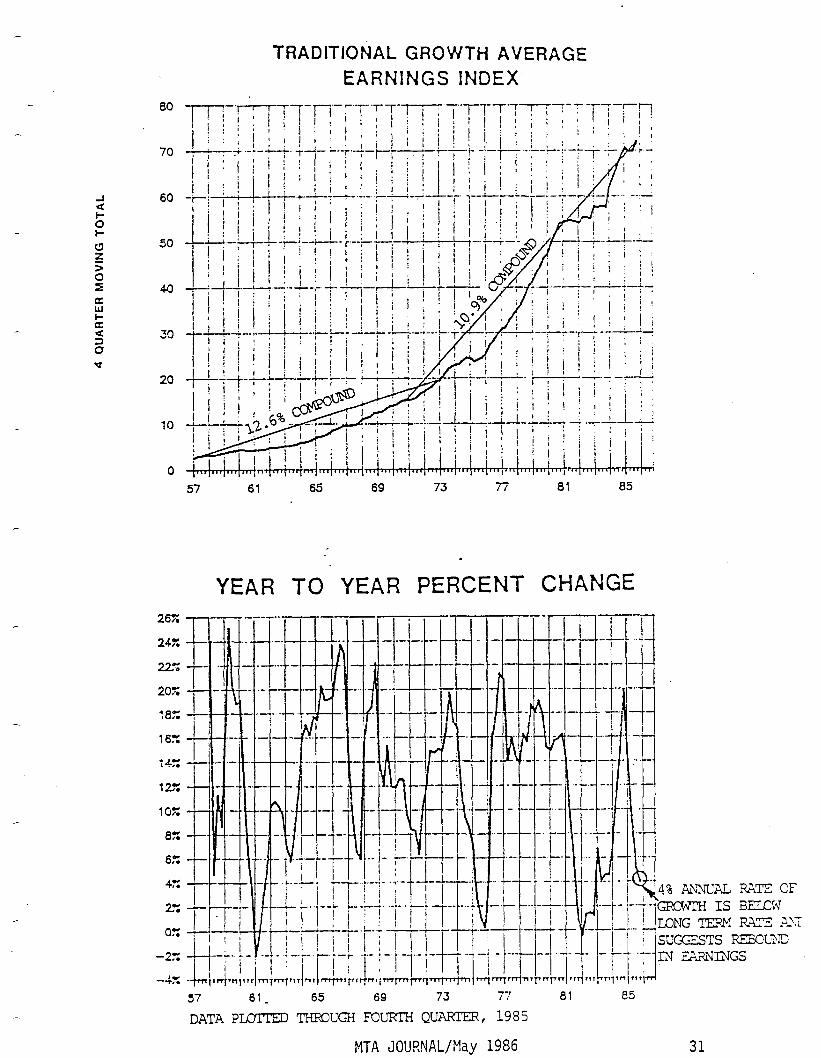
The earnings of our Traditional Growth Average over the past 15 years have grown at a 10.9% compounded rate compared to 12.7% for the lS-year period which ended in 1972. In1972 year end, our Growth Index sold at about 40 times earnings and at the end of last year it sold at 17 times the four quarter trailing profits. The yield cc1 long term U.S. Government bonds was less that 6% in the earlier period compared to 9.75% in December 1985. If interest rates were the same in December 1985 as they were at the end of 1972, we would expect the price/earnings multiple for our growth average to be lower in the more recent period due to the lower rate of growth in earnings.
28 KCA Joumd/HaY 1986

Since the return on government bonds is in the same area today as it was in the 1974-1975 period and since the annual rates of growth in earnings are also at a similar level, then multiples should also be approximately the same, which is the case. (See pages 30 and 31 and circled periods). This reveals to us that both growth stock prices and bond prices are in sync and that it will take higher earnings growth to keep prices rising in the event interest rates do not decline significantly from these levels.
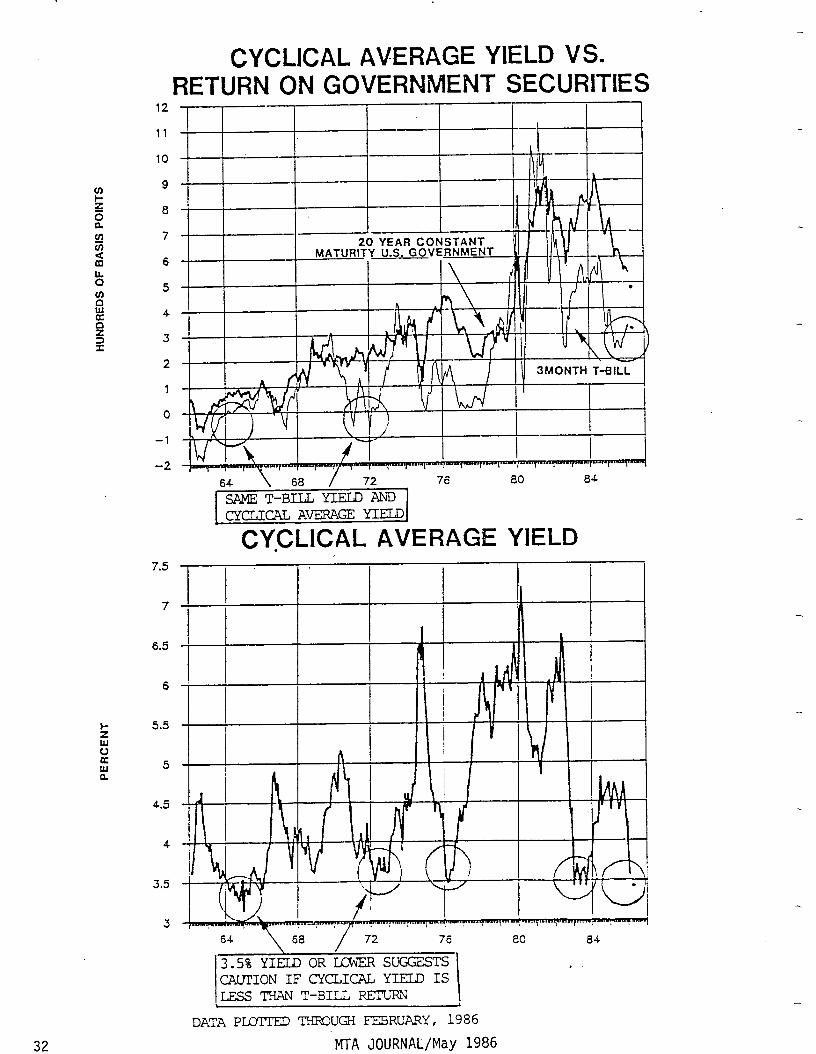
Price to earnings ratios for Cyclical companies, as noted in our past studies, do not seem significant unless normalized earnings are used. Such earnings projections require quite a few assumptions. The yield relation- ship for cyclical companies, however, has been very helpful in determining when stock prices have discounted earnings increases for this group of companies. Typically, a 3 l/2% dividend return has been quite low for our Cyclical Average. This dividend yield must also be viewed in conjunction with the rate of returns on treasury bills and long termbonds. In early 1964 the Cyclical Average dividend yield was below 3 l/2% but the return on treasury bills was the same as cyclical stocks suggesting little downside risk in the event earnings declined and short-term interest rates remained the same. This is not the case currently since treasury bill rates are about 3% higher than the dividend yield for our Cyclical Average Page 32).
Given these data, itseemsthatstock prices are generally vulnerable in the event earnings do not rebound sharply in coming quarters. We do expect corporate profits to rise primarily due to lower interest costs, reduced operating outlays, large write-offs, weakness in the dollar, and greater financial leverage within corporations. Three of our four Averagesdid show higher earnings in the fourth quarter than the third quarter with the exception of our Capital MS Average (Pages 33 to 36). Corporate profits after taxes recorded a similar rising pattern (Page 37). Thus, unless interest rates decline further, we would expect a more selective advance in equity prices,as disappointing earnings statements for individual companies penalize holders of those shares while the reverse is the case for those firms which are able to exceed analysts' earnings projections.
Table I presents compound rates of growth for the earnings of our Averages over varying time periods and clearly shows the relatively low rates of earnings growth for 1985. Growth companies were the only ones to show gains in profits in the year of the four categories we maintain. The divergence in the rate of change for earnings for the different time periods vividly expresses the basis for quity price disparity in recent years.
29
TRADlTfONAL GROWTH AVERAGE
HIGH - LOW MULTIPLE
30 MTA JOURNAL/May 1986
16
15
14
13
12
11
10
9
a
7
6
5
4
3
61 65 69 ai a5
YIELD ON .
U.S. GOVERNMENT 20 YEAR CONSTANT IMATURiTY
- , , , , , , , , , , , .
57 61 65 69 '73 77 ai a5
DATA PL#ITED THROUGH FEBRUARY, 1986
TRADITlOtiAL GROWTH AVERAGE
EARNINGS INDEX
60
26Z
24%
225
20x
1az
16::
14%
12::
10%
a:: 6P;
4::
2.
0.7
-2z
-4::
-i-i-i-1-~/-1-... __,-
57 61 65 69 73 77 ai a5
.
YEAR TO YEAR PERCENT CHANGE
57 61_ 65 69 73 77
DATA PLLXTED THFXXa -KX’RTH QU-, 1985
MTA JOURNAL/May 1986
81 a5
31
12
11
10
9
0
7
6
5
4
3
2
1
0
-1
-2
7.5
7
6.5
6
CYCLlCALAVERAGEYlELD VS. RETURNONGOVERNMENTSECURITIES
I I
3MONTH T-BILL
SAN T-BU;L YIELD AI'D CYCLICALA~GEYIELD
CY.CLiCAL AVERAGE YIELD
64 \ 68 / 72 76 60 84 \
13.5% YIELD OR ihER SUGGESTS 1 CYCLICAL YIELD IS
T-BILL FEt'LL?L?J I
32
DATA PLD-!XED TJXDJGH FEBRUARY, 1986
MTA JOURNAL/May 1986

16
1.5
14
13
12
11
10
9
0
7
6
5
4
3
2
1
CYCLICAL AVERAGE
EARNINGS INDEX
57 ' 61 65 69 i3 n 81 a5
YEAR TO YEAR PERCENT CHANGE -
I
b-TM
- _. - -. ..-
1 i
- -----.- _ .._- -
!
. -. . .-
‘/
‘-I,;;l
;, --i-,!J
j
2-v-e _ -.-- - ._- .-. _..
I 1
1 - _-
;41i’ irili’.l.il
j -’
l-qTqqm.,r ‘. r
97 61 65 69 73 7i
DATA PLDITED THBOUGI FOURTH QU-, 1985
MTA JOURNAL/May 1986
81 8.5
33

160
t 80
60
CONSUMER RELATED STOCK AVERAGE (O~NSUMPTI~N SECTOR)
EARNINGS INDEX .- -j--~;--~~--~-y--~-‘ ;--1--r -r- -y
!n. r I
66 68 70 72 74 76 78 80 82 84
YEAR TO YEAR PERCENT CHANGE - ---
i-n-- --‘---f. .-.i e-e. I -_ - ___- i...
11
___*_- 1 ! . . .- -. .-- - -.- -- - .-, - - .I -
’ I ._ _.- --! .-..- -- .-.. ;;!
_ - _ 1. ..I--. . ..I r ..-. .-
__I 1 r----- --- --. ..I . .._.. +-be. _I -f - -. -. I I -. _ --. w--y i j -. .
1 i ;y.;.- ._ t _ ._.. -c.- -- -- , - - I- - 4 111 _ ._ __ - - . .__-
--_- .
--.-. --- .--I -_- .- .--I-- - .-. -. -- .- - I
j --. - ._. _- 1-
~
_ . . .- -. _- _ J .- .- -.
1 7-l. 7.T 72 74 76 78 80 82 8-:
-_---. -- --. .---.-. I . ..- 1 ‘d . _. -. . .- _. _
1 1 -.
_. . ..I-.- 1 1
- ._ --_.. .-.-.-. .
-a[. . ,_ / . .- __ i. .-.
Pi*.-.~--- g -‘I
.__, . -- - r-- -. -- .!
-- I ! .- cm__ _ .- . .
! l
-- r- - ..-
’ i
_ _. _-..-
ntt-r-v 7-l ,‘”
34 MTA JOURNAL/May 1986
DATA E'IMIrI'ED THROUGH FOURTH QUARER, 1985

CAPiTAL GOODS STOCK AVERAGE
240
230
220
210
200
190
180
170
160
150
l-40
130
120
110
100
90
80
70
60
50
40
30
20
220%
200%
180%
160X
14X
120::
100%
80%
60%
40%
20%
OX
-20::
-40%
-69%
-80::
-100%
(INVESTMENT SECTOR)
EARNINGS INDEX
-LA- .!iL.i--, .____ #!--i-l-r--~
’ ’ ! 1 -:- -i.- ! ; ! i ! i i i I I ! -iv ; L--J:
YEAR TO'YEAR PERCENT CHANGE
. 66 68 70 72 74 76 78 80 82 84
DATA PLMITED THR3CGI-l ?33JRTH QUARTEil, 1985
MTA JOURNAL/May 1986 35
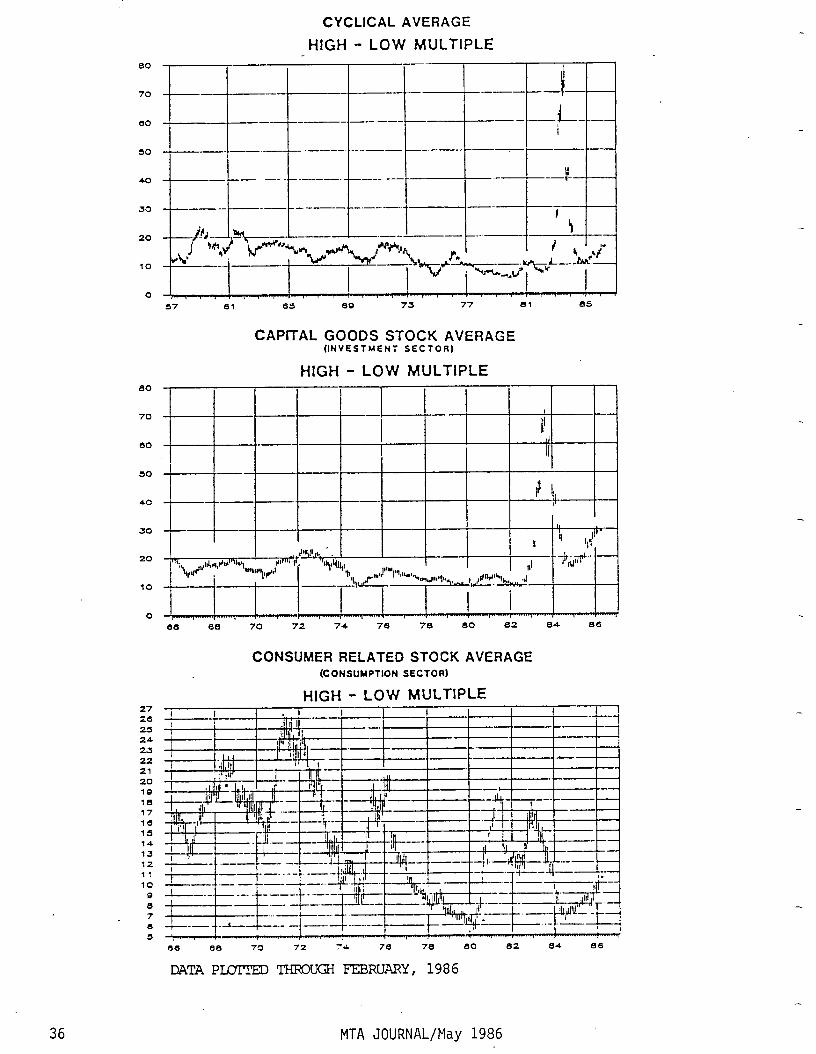
CYCLICAL AVERAGE
HIGH - LOW MULTIPLE
27
26 2s 24 25
22 21
20 19 ra 17 10
15 14 13
12 11
10 8
8 7 8 3
57 57 81 81 655 655 ee ee 73 73 77 77 81 ai a5 a5
CAPfTAL GOODS STOCK AVERAGE (INVESTMENT SECTOR1
HIGH - LOW MULTIPLE
aa 88 70 72 74 76 78 a0 a2 a6
CONSUMER RELATED STOCK AVERAGE
HIGH - LOW MULTIPLE
es da 72 a0 a4
36 MTA JOURNAL/May 1986
DATA PLLYITED l?HEOUGH FEBRUARY, 1986

CORPORATE PROFITS AFTER TAXES SEASONALLY ADJUSTED ANNUAL RATE
180
170
160
150
740
130
120
110
100
90
80
70
60
50
40
30
20
10
__-_-L___ -I - --I - -- t- .- -- _ - - - , E
$ -- -- I -=-T=iT=--
47 53 59 65 71 77 83
YEAR TO' YEAR PERCENT CHANGE 70
60
50
40
30 -_-.-
20
10
0
-10
-20
- W
47 53 59 65 71 77 83
DATA Pm THR0GI-I FWRI'H QUARTES, 1985
MTA JOURNAL/May 1986 37
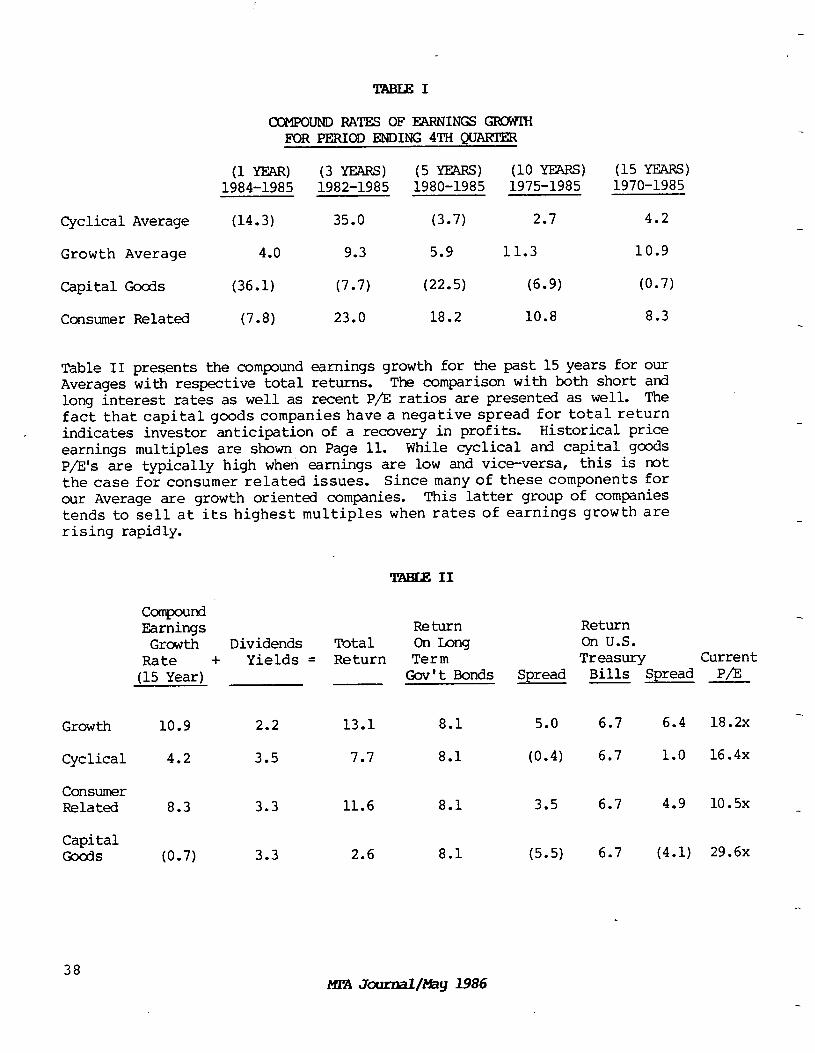
COMPOUNDRATES OFRARNINGS GROWTH FORPERIODRNDING 4THQDARTRR
(1 =I (3 -1 (5 -1 (10 -1 (15 -1 1984-1985 1982-1985 1980-1985 1975-1985 1970-1985
Cyclical Average (14.3) 35.0 (3.7) 2.7 4.2
Growth Average 4.0 9.3 5.9 11.3 10.9
Capital Goods (7.7) (0.7)
Consumer Related (7.8) 23.0 18.2 10.8 8.3
Table II presents the compound earnings growth for the past 15 years for our Averages with respective total returns. The comparison with both short and long interest rates as well as recent P/E ratios are presented as well. The fact that capital goods companies have a negative spread for total return indicates investor anticipation of a recovery in profits. Historical price earnings multiples are shown on Page 11. While cyclical at-d capital goods P/E's are typically high when earnings are low and vice-versa, this is not the case for consumer related issues. Since manyofthese components for our Average are growth oriented companies. This latter group of companies tends to sell at its highest multiples when rates of earnings growth are rising rapidly.
'lnBra3 II
Conrpound Earnings Return
Growth Dividends Total On Long Rate + Yields = Return Term
(15 Year) Gov't Bonds Spread
Growth 10.9 2.2 13.1 8.1
Cyclical 4.2 3.5 7.7 8.1
Consumer Related 8.3 3.3 11.6 8.1
Capital GOQdS (0.7) 3.3 2.6 8.1
5.0
(0.4)
3.5
(5.5)
Return on U.S. Treasury Current
Bills Spread P/E
- 6.7 6.4 18.2x
6.7 1.0 16.4x
6.7 4.9 10.5x _
6.7 (4.1) 29.6x
38
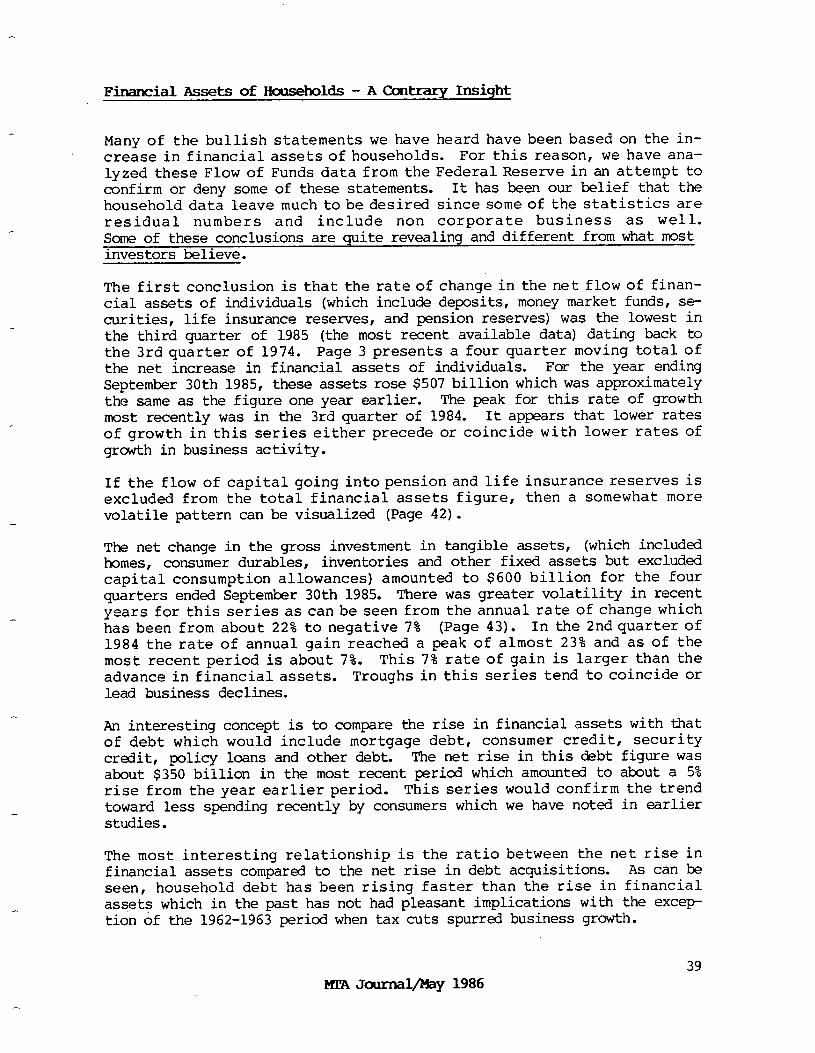
Financial Assets 0fBuseholds - A Contrary Insight
Many of the bullish statements we have heard have been based on the in- crease in financialassetsofhouseholds. For this reason, we have ana- lyzed these Flow of Funds data from the Federal Reserve in an attempt to confirm or deny some of these statements. It has been our belief that the household data leave much to be desired since some of the statistics are residual numbers and include non corporate business as well. Some of these conclusions are quite revealing and different from what most investors believe.
The first conclusion is that the rate of change in the net flow of finan- cial assets of individuals (which include deposits, money market funds, se- curities, life insurance reserves, and pension reserves) was the lowest in the third quarter of 1985 (the most recent available data) dating back to the 3rd quarter of 1974. Page 3 presents a four quarter moving total of the net increase in financial assets of individuals. For the year ending September 30th 1985, these assets rose $507 billion which was approximately the same as the figure one year earlier. The peak for this rate of growth most recently was in the 3rd quarter of 1984. It appears that lower rates of growth in this series either precede or coincide with lower rates of growth in business activity.
If the flow of capital going into pension and life insurance reserves is excluded from the total financial assets figure, then a somewhat more volatile pattern can be visualized (Page 42).
The net change in the gross investment in tangible assets, (which included homes, consumer durables, ihventories and other fixed assets but excluded capital consumption allowances) amounted to $600 billion for the four quarters ended September 30th 1985. There was greater volatility in recent years for this series as canbe seen from the annual rate of change which has been from about 22% to negative 7% (Page 43). In the 2ndquarter of 1984 the rate of annual gain reached a peak of almost 23% and as of the most recent period is about 7%. This 7% rate of gain is larger than the advance in financial assets. Troughs in this series tend to coincide or lead business declines.
An interesting concept is to compare the rise in financial assets with that of debt which would include mortgage debt, consumer credit, security credit, policy loans and other debt. The net rise in this debt figure was about $350 billion in the most recent period which amounted to about a 5% rise from the year earlier period. This series would confirm the trend toward less spending recently by consumers which we have noted in earlier studies.
The most interesting relationship is the ratio between the net rise in financial assets compared to the net rise in debt acquisitions. As can be seen, household debt has been rising faster than the rise in financial assets which in the past has not had pleasant implications with the excep- tion of the 1962-1963 period when tax cuts spurred business growth.
39 IWAJ oumaWy 1986

While we are not concluding that these data are necessarily bearish, they certainly do not seem to confirm statements made by economists and inves- tors that the growth in financial assets has been exceptionally large and therefore, the reason for a bullish attitude toward consumption and prices of securities. It would seem to us that corporate buying of equities and foreign purchases of government securities have played a vital role with respect to the latter.
-1ON
A unique, complex, and volatile investment and economic environment con- tinues to prevail. The sharp drop in oil prices and the dramatic drop in the dollar further illustrates the importance of political factors. The powerful influence of events abroad and economic policies of foreign gov- ernments combined with the uncertain economic policy of our government with respect to the budget deficit, contribute to the potentially more volatile environment created by a heavily leveraged system among other factors. General business series suggest a second wind for the economy which seems in the late stages of an advance and, therefore incapable of sustaining strong economic growth for more than about two quarters. Reduced foreign competition caused by the currency situation, lower inventory position of heavyindustryand contraction in operating costs for most companies in these industries should result in strong earnings gains. The drop in the dollar and price rises in certain commodities should be offset by weakness in other factors keeping inflationary pressures under control. Data continue to suggest the consumer sector as the potentially weak segment but the drop in energy prices has delayed that potential. A more restrictive fiscal policy by year end should havea recessionary force and, weighing the high debt position of all sectors of the economy, will probably not be effectively offset by an easier monetary policy. If such a monetary policy were to evolve, the chances of financial speculation muld be great.
As long as the economy is strong we do not foresee major difficulties for the stock market generally but do perceive major shifts in market leader- ship and groupdivergences. Stock price and breadth trends remain in an uptrend. A continued balanced approach by the Federal Reserve and an alteration in the economic policies of the Administration to re-establish a sound business base should result in higher P/E multiples.
This volatile environment implies little warning prior to sharp setbacks for the prices of securities and requires greater technical emphasis, on measures of investor sentiment. The various non-price related technical series we follow connote more selective stock market conditions for the future.
Mr. Kenneth Safian is head of Safian Research, Inc. of New York City.
40 M!L'AJourndl/phY~86
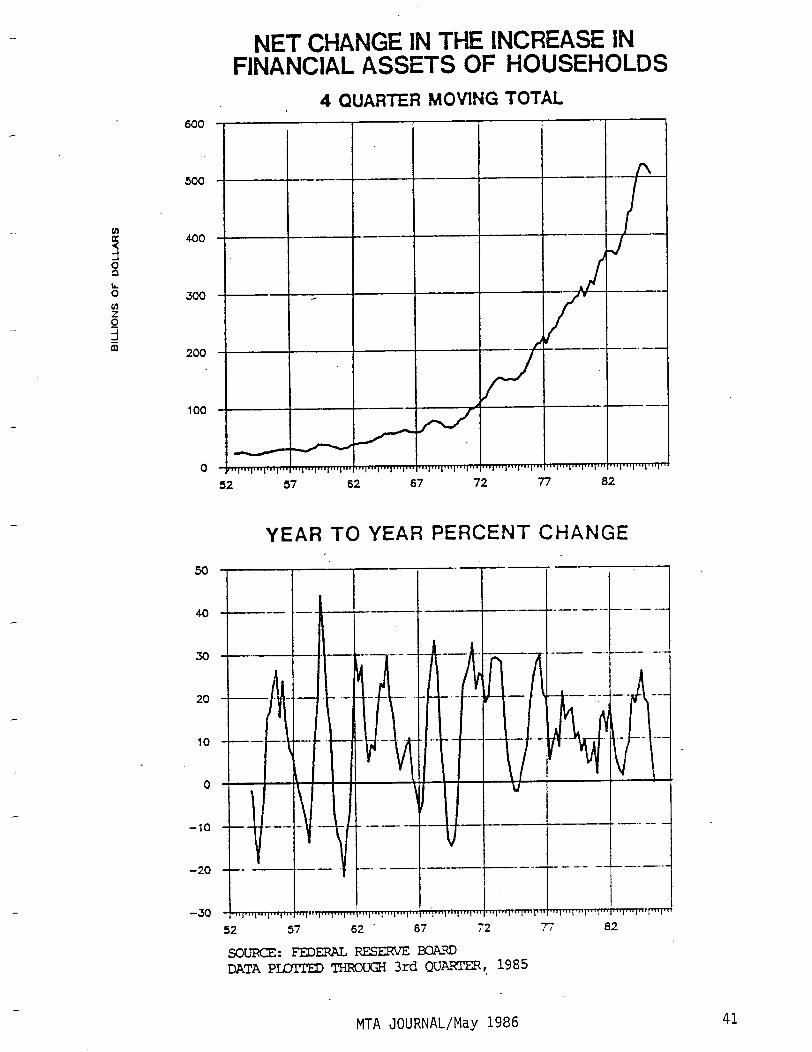
METCHANGElNTHElNCREASEiN FINANCIALASSETSOF HOUSEHOLDS
4 QUARTER MOVING TOTAL 600 ,
500
4.00
300
2.00
100
0
50
40
30
20
10
0
-10
-20
-30
52 57 62 67 72 n 82
YEARTOYEARPERCENTCHANGE
I .Ii 1
’ 52 57 62 67 72 77 62
SJKE:E-EDEXALFESERVEBoARD
DATAPLMlTED- 3rd QUARTER,. 1985
MTA JOURNAL/May 1986 41
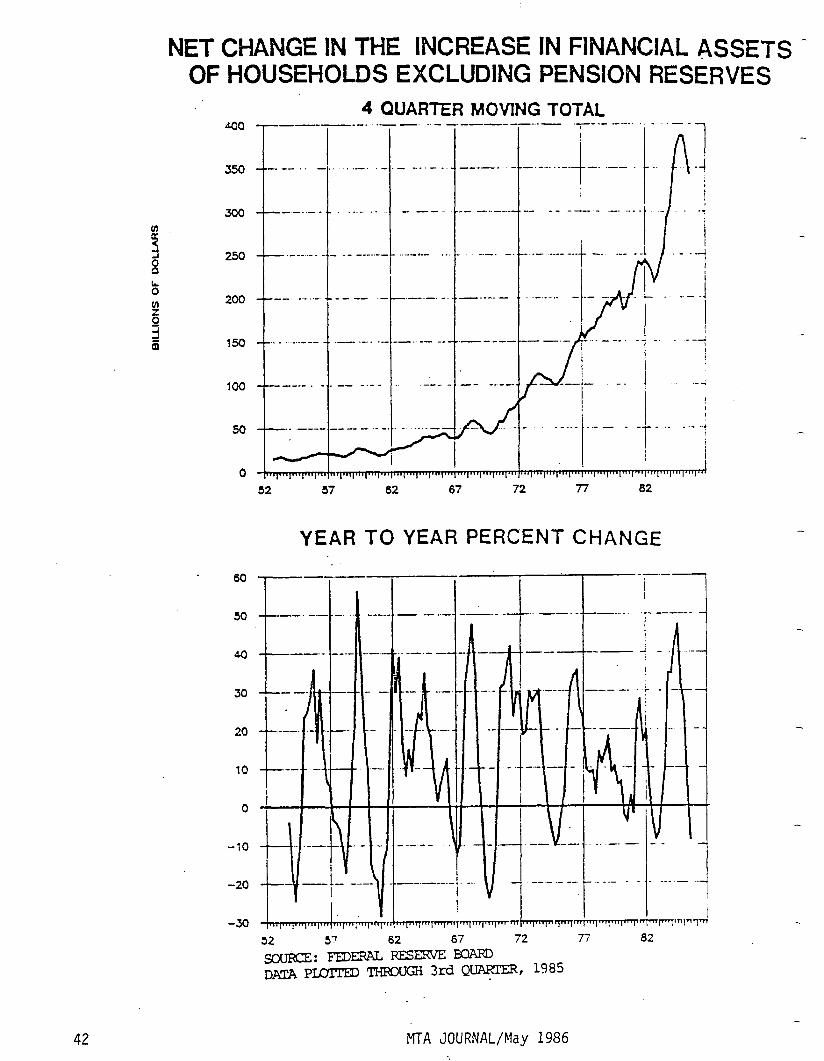
NET CHANGE INTHE INCREASEINFINANCIALASS~TS- OF HOUSEHOLDS EXCLUDING PENSlON RESERVES
4 QUARTER MOVING TOTAL 400 ---
-_--- .
xx) _ - - _ . _
250 - _ _ _ _ ._ _
200 --_- .-..-
,sJJ --.. - .-..---
,(-J-J ------.
50 1,” ._ --- 0 k
.-
-..
-.-
r
- -
I
--
-_-. .-
. ..- ._
_ .- ---..--
-- -- .-
.- .-.. .-
__ -.- -
--- - .- -
.-. ..--
_ --.- .
- --.
_--1-e . . .
-..-...-. -.
-..-- ---
.--- -
P
__-- --v.. - -- .- .-.--- I / -----. 1 - _.- _.._ -.- j -. .-- .- --..--.- -- -- --- I - .-- .._
52 57 62 67 72 77 62
YEAR TO YEAR PERCENT CHANGE
42 MTA JOURNAL/May 1986

NET CHANGE IN THE lMCREASE iN GROSS INVESTMENTS I~TANGIB-LEASSETS OF HOUSEHOLDS ’
4 QUARTER MOVINGTOTAL 600
500
400
300
200
loo
0
24
22
20
18
16
14
12
10
0
6
4
2
0
-2
-4
-6
-
j
- .
-~
72
YEAR-TOYEARPERCENT CHANGE
r-l----L-i-‘--h- i .- -- ilEa
-. .-.. -. -- i - .- . - . --- .‘” ‘.;::, I-B .--- + -.- I I ---I
MTA JOURNAL/May 1986 43
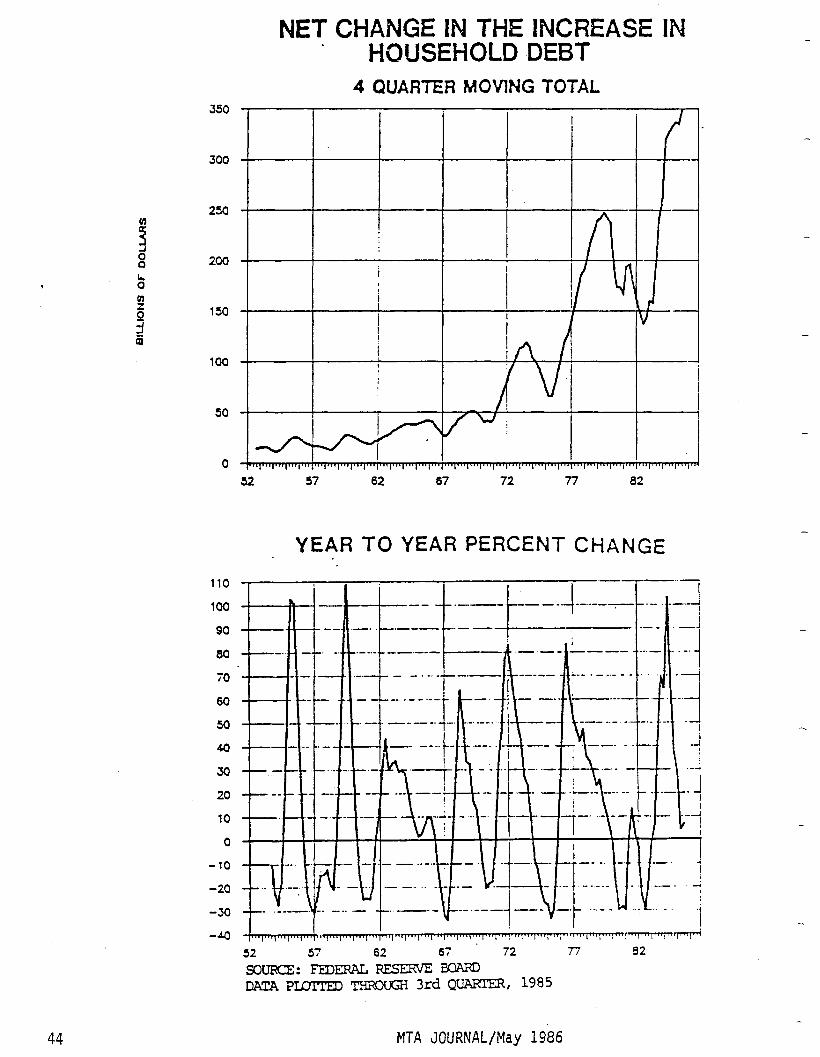
350
300
250
200
150
100
50
0
110
100
90
80
70
60
50
40
30
20
10
0
-10
-20
-30
-a
NETCHANGEINTHEINCREASEIN HOUSEHOLDDEBT
4 QUARTER MOVINGTOTAL
52 52 57 57 62 62 67 67 72 72 77 77 82 82
. YEAR TOYEARPERCENTCHANGE
52 57 62 67 72 77 62
SJFCE:FEDEIRALRESEWEBQARD
DATAPLMTED- 3rd QUAREX, 1985
44 MTA JOURNAL/May 1986 -
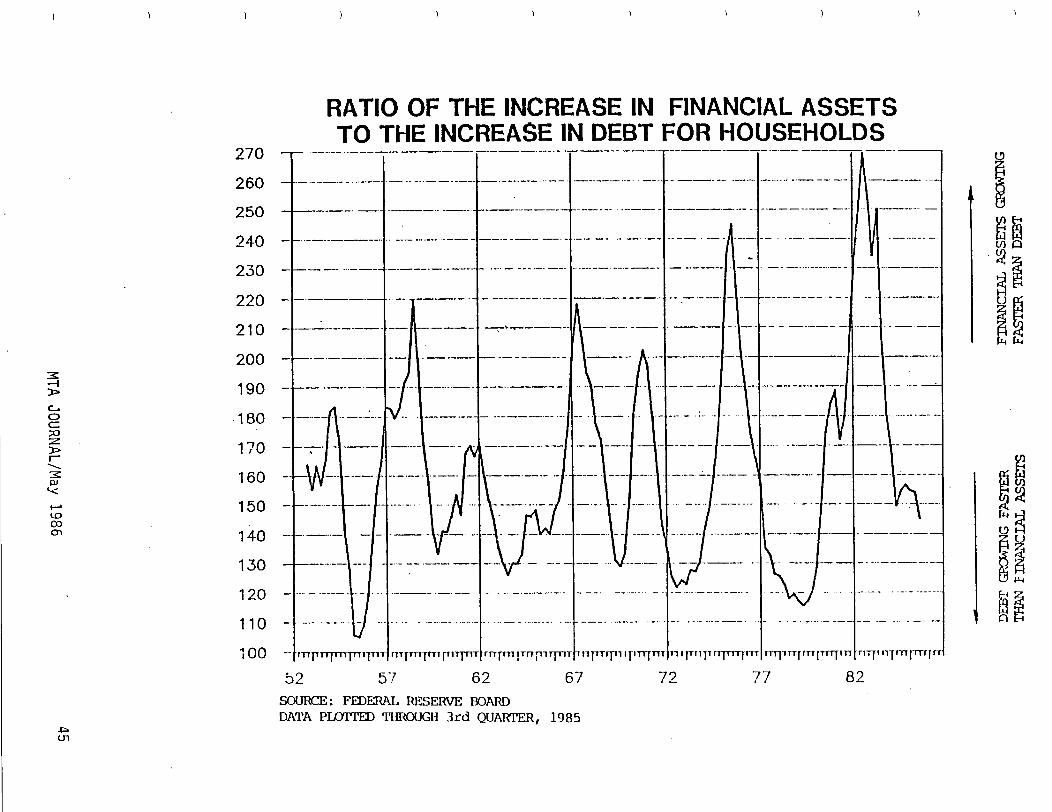
RATIO OF THE INCREASE IN FINANCIAL ASSETS TO THE INCREASE IN DEBT FOR HOUSEHOLDS
270
260
250
240
230
220
210
200
190
'160
170
160
150
110
130
120
110
100
..-.-- ----. ---.-
---- . -
--- .-----
._ .-_- --
.---. . . - --
- ----.
__ . . - . . - -
_..- . . .._. --
----. .L -----.
- .-.- -.- _.--.-
t
----. -
._.-._--.
__- . .._ -
.---.-
_ --.-..------
- -.-.----.-
_--- ._----.._
---_._ - .
-~-- .- -.---. ---
_._.-..- -
__- -.-.- - ---
_ .-- .--- -. -
- ‘TT’TT
-- ---.-----.
-. ---
-..-- -- -
.-.--. .---. -
_ _ .
- .-
--....
-. -_
--. -. -- .--- -
__-- -.-
- --_ -. .-.- _-.... _.- --. -
._.-_-- .---.
._-- --
.- ._.---
. - - .- __.
-.-
-.---.-.-
- ._- ---
__ - .:..
---- --
--
-_
-. -
- .-
--
-
_.
..-
.-._- -- -.---
__.-. --.-.--..I
__ . . .._.... --.
llIp~Trrprl11
h
-
- . . -
- -
:
. -
_.
. - -
- - _ .-- - -
._..-.--_.-. ---.
-.- ---.-.
- --. _-
\
----- . . . . - _-_- -_
.- . .--
.- - ---.-
\
_ _
ti
--- 1 -, -..-- _ _-.. - - . _. . _. - _. ._ _-_-.. - _ __ -- .- __-- . __-.-_
_--. .- ___... -
.__--_ .---_ ..-..
I npq-n I p-p
y&--e.-.
- _---.---.
___-..----- --_ ---.. __I
_---- ..-
----.-.. - -
_ _ _ - _ _
-- .--. -.-
_ _. ~ . . - --
_ .--- -- -..- _ ._.
-._--__ ---- _-._-._ .- - -.-- - . ..- - i/J .- . -_ .-- -. _. _ . .-. -. - -.-.. ------
_ . -.-._----.
_ _ - . _ - -
52 57 62 67
SOUR(3E:FEDERALRESERVEIBOARD DAlYi PUYMED TlIR0UGI-I 3rd QUARTER, 1985
72 77 02
'ME INSTITIITIONAL HJY-SIDER uSEoF9?imiNI~~Is
Moderator William Di Ianni
I am happy and honored to be with you today in Boston as moderator of this panel along with two well-known members of the investment community: Joseph McNayofEssex Investment Management Companyand Jerry Jordanof Hellman, Jordan Management Company.
I thought I might say a few words as to how we handle technical input at Wellington before we hear from Joe and Jerry.
Our department of course uses most of the known chart services, and we have the use of Bridge Data and Datastream. All of these (and more) give us depth of source materials. But the chief function of any technical depart- ment for a large institution rests in the area of proper interpretation of the big picture of any investment sector and proper individual service when called upon.
The scope of these duties may entail:
1. Interfacing with the total organization through oral and written communication.
Example: Participation in the morning meeting and various forms of written work. Many pieces are educational and not only action- oriented.
2. Interfacing with the individual portfolio managers.
Example: Many times a portfolio manager senses a problem in the buying and selling of a stock and wants to discuss the raising or lowering of the entry level significantly.
3. Interfacing with individual fundamental analysts.
Example: Pocket the buy-report, the stock is in poor technical shape; or issue the report now, your timing is perfect.
4. Interfacing with the research director concerning the proper al- location of analysts' time.
Example: Focus on interest sensitive stocks. Or, forget oil service stocks and put analyst on XYZ. Good analysts may be wasted monitoring dead industries.
46 ma Jcxmal&ay 1986

5.
6.
7.
Interfacing with outside technicians.
Example: This boils down to a comparing of opinions on the general market and some focus on group analysis. We prefer opinions wrapped inhumility and are suspect of "hubris" . . . . the pride that goeth before the fall. We all get stale . . . . another view can sharpen one's focus.
Interfacing with the trading department.
Example: Accelerate buy or sell orders because of expectation of a faster moving market.
Interfacing with clients.
Example: Many times we are asked to give technical presentations to groups who are interested in such an overview.
Obviously, the above statements are brief. Life is more complicated than that.
We try to stress the larger view whenever possible, since too much stress on the short-term can be counter-productive for a big institution. We are reminded of what Bob Farrell said in one of his talks at an MTASeminar: "Our correct long-term decision is worth more than a dozen correct short- term decisions."
We know we do not claim to have all the answers and are not afraid to admit that something is too unclear to offer a definitive comment. Markets, un- fortunately, do not always speak clearly.
We do believe that fundamentals are very important, and that as technicians we are in effect "eavesdropping" on the market's fundamental utterances.
We believe one of our most important functions is to alert others of deviations between techno-fundamental factors.
William Di Ianni is a Partner and Senior Vice President of Wellington Management Company, where he heads the technical department with his able assistant Cheryl Stafford. Bill has degrees in Philosophy and Law. He has been with Wellington since April 1969.
47 trr~ J-Y 1986
Statistical~ls for thelkchnicalAnalysts- TheBasics franaSlightlyDifferentE%xsp&tive
Frederic H. Dickson, Chief Investment Officer, ShareInvest
Dr. Robert A. wood, Associate Professor of Finance, Pennsylvania State University
Introduction
Everyday the Technical Analyst faces the dilemma of determining whether a stock, a group or the market is trending or moving in a trading range. One task at hand is to assess the probability that a trend which has been observed will continue intact or assess the possibility that a trend re- versal is imminent. For many years, technical analysts have used basic statistical tools to aid in these determinations. This paper hopes to re- view some of the basic tools used bytechnicalanalysts (as a primer for those entering into the business) and offer some different twists which may provide new insights for those who have used these tools for many years.
The basic tools covered in this paper include: simple moving averages, exponential moving averages , oscillators and momentum measures.
Simple Moving Averages
A basic assumption common to all forms of technical analysis is that prices of stocks, options, futures, or the market indices follow a systematic pattern which is repetitive in nature. Basic pattern moves incorporate properties from one or more of the following types of behavior-horizontal movement (trading range), trend, seasomls and cyclical. A simple moving average is a useful tool to identify price movement relative to its cycli- cal component. Using a simple moving average as a measure of the normal value of a stock at a point in time, the analyst can visually assess the direction of the underlying trend and the strengthof recent price move- ments relative to the direction of the trend.
Basic Definition. To calculate a moving average, one first gathers a set of historical prices (daily, weekly, or monthly) finds the simple average for the period which approximates the duration of one half of a full cycle, then as each new price becomes available calculates a new average (using the same period) and posts to the chart. The analyst typically evaluates the relationship between the stock price and its moving average by first noting whether the moving average is moving up or down (direction of under- lying trend) and whether the stock is above or below its moving average (indicating the probability of trend continuation). By its basic defini- tion, the use of a simple moving average to identify trend.re-versals will produce a signal whichhappens after the actual trend reversal has taken place. Most analysts believe that a stock trading above its moving average will continue to trade above the average until a major reversal occurs. Then it will decisively move below the moving average for an extended
48 IWA Jomml/May 1986

period of time. A crossing of the moving average by its price is the significant determinant of trend reversal.
Perhaps the most difficult aspect of using moving averages to identify trend reversals is the selection of the period to be used in the calculation. Statistical studies have shown the market to move in repeti- tive patterns. As aguide, many analysts use the periods shown below as the basis for calculating moving averages. Many charting services plot lo- and 40-week moving averages on stock and market indices charts. Analysts generally choose a period length equal to either one quarter or one half of the underlying cycle. If they used a period equal to the cycle length, all the cyclical components equal to or shorter than the cycle would be fil- tered out.
5 day-Very short term cycle 20 day-Short term cycle 10 week-Intermediate term cycle 40/50 week-Long term cycle 4 year-Very long term (Political Cycle)
Presented in Chart One is a bar chart of Alaska Airlines for the time period 1981 to 1986. A simple 40 week moving average is indicated on the chart. With a cyclical stock such as Alaska Airlines, price crossings of the 40 week moving average present reasonable buy and sell points. Note, however, periods in 1981and 1983 when several cross-overs occurred in a short period of time. Periods such as these, known as whipsaws, tend to diminish this tool's overall effectiveness, as the analyst really doesn't know whether the crossing signifies a permanent trend reversal or simply a temporary one, a whipsaw.
Exponential Smoothing
Market analysts have noted that there are two basic limitations to using the simple moving average. First, in order to calculate a simple moving average, a significant amount of data needs to be stored for the calculation (equal to the period length used in the calculation). Calculation of moving averages involving periods extending beyond 10 data points becomes tedious. Second, the use of a simple moving average gives equal weight to each observation used in the calculation. The oldest price is given the same weight as the most recent price and prices older than the period used for the calculation are ignored. One can,persuasively argue thatrecentdata should begiven more weightinthe determination of the average. Most recent prices seem to contain more information about future direction than older prices. The statistical tool, exponential smoothing, seems to address the limitations of the simple moving average outlined above.
Basic Definition. The exponential average is the average calculated for the previous data point (price) plus the difference between the average calculated for the previous point and the priceobserved at the previous point weighted by a smoothing constant. The basic formula is:
49 IWA J-y 1986
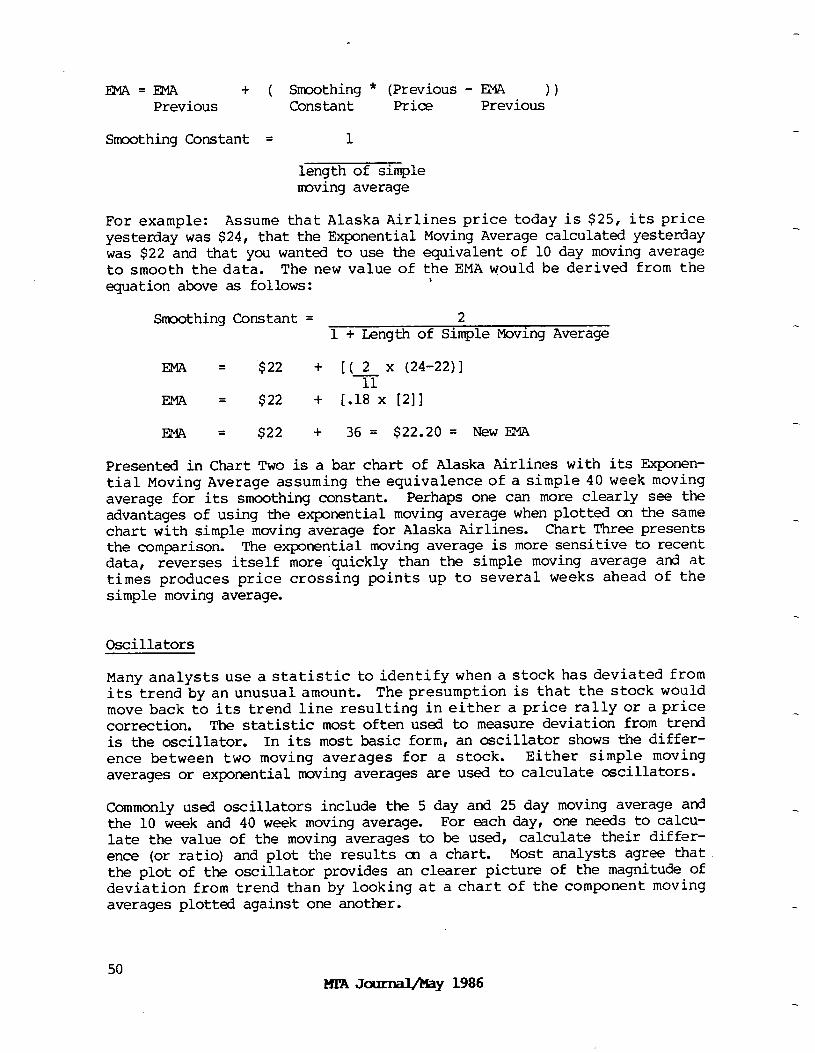
ENA=ENA + ( Smoothing * (Previous - EMA )) Previous Constant- Price Previous
Smoothing Constant = 1
length of simple moving average
For example: Assume that Alaska Airlines price today is $25, its price yesterday was $24, that the Exponential was $22 and that you wanted to use the to smooth the data. The new value of equation above as follows:
Moving Average calculated yesterday equivalent of 10 day moving average the EMA would be derived from the 1
2 Smoothing Constant = 1 + Length of Simple Moving Average
EMA = $22 + [( 2 x (24-22)] -ii
EMA = $22 + [.18 x [211
ENA = $22 + 36 = $22.20 = New IPlA
Presented in Chart Two is a bar chart of Alaska Airlines with its Exponen- tial Moving Average assuming the equivalenceof a simple 40 week moving average for its smoothing constant. Perhaps one can more clearly see the advantages of using the exponential moving average when plotted on the same chart with simple moving average for Alaska Airlines. Chart Three presents the comparison. The exponential moving average is more sensitive to recent data, reverses itself more 'quickly than the simple moving average and at times produces price crossing points up to several weeks ahead of the simple moving average.
Oscillators
Many analysts use a statistic to identify when a stock has deviated from its trend by an unusual amount. The presumption is that the stock would move back to its trend line resulting in either a price rally or a price correction. The statistic most often used to measure deviation from trend is the oscillator. In its most basic form, an oscillator shows the differ- ence between two moving averages for a stock. Either simple moving averages or exponential moving averages are used to calculate oscillators.
Commonly used oscillators include the 5 day and 25 day moving average and the 10 week and 40 week moving average. For each day, one needs to calcu- late the value of the moving averages to be used, calculate their differ- ence (or ratio) and plot the results on a chart. Most analysts agree that the plot of the oscillator provides an clearer picture of the magnitude of deviation from trend than by looking at a chart of the component moving averages plotted against one another.
50 KPA Jaunal&ay 1986
Charts 5, 6 and 7 show examples of oscillators plotted for Alaska Airlines. Buy and sell points are clearly indicated on the charts based on the cross- over of the moving averages (when the difference between the moving average becomes zero). The analyst usually begins to look for price reversal when the oscillator moves above or below a certain level (perhaps +/- 2 in the caseof Alaska Airlines). From these charts, one can clearly see that by lengthening the time periods used to calculate the oscillators, a clear picture of deviation from trend emerges. Note that the oscillators do not necessarily reach extreme values simultaneously with thepeakingofthe stock price. Often, the oscillator will peak ahead of the stock price indicating a slowing down of price change.
If you have a personal computer available, you might want to use a special program written for testing oscillators (and moving averages) to determine optimum cycle lengths and the magnitude for deviation from trend that is most significant. The authors have found that the Technifilter Software package (RTR Software) is particularly helpful in establishing the cycle lengths. From specific researchdone using Technifilter on oscillators (which is beyond the scope of this paper) we found out that using an expon- ential moving average for the fast part of the oscillator a simple moving average for the slow part of the oscillator produced superior results to an oscillator made up of either simple moving averages or exponential moving averages. Chart Eight shows a comparison of an oscillator made from the combination of a exponential moving average and a simple moving average to that made up of simple moving averages.
Momentum
Momentum analysis or rate-of-change analysis is most often used to identify the possibility of stock price trend reversals. In general stock prices move through well-defined phases of price change. Starting at the bottom of a price cycle, prices usually move upward with a rapid increase in velocity (acceleration phase), then slow down in their rate of increase (deceleration phase), while continuing to move higher in price. Finally, they stop moving up and begin to accelerate down in price. On the downward phase of the cycle, stocks either continue to accelerate to the lowest price point and reverse upward or begin to slow down their rate of decline prior to reaching the price bottom. A visual picture of this pattern of acceleration/deceleration is often a very helpful tool when combined with an oscillator to identify the probability of reversal points.
The most common measure of momentum is rate of price change measured over cycle lengths similar to those used to calculate simple moving averages. Many analysts use price changes over the last 26 weeks or 52 weeks for mo- mentum studies. The actual momentum statistic can be calculated using either price differences or price ratios. Often, peak readings of a momen- tum statistic calculated using price ratios will be reached ahead of that calculated using the differences. This is due to the fact that a stock moving up at a steady rate of 5 points a month over a six-month period is actually slowing down in its rate of increase when measured cn a percentage basis (shown by the ratio).
51 MII J-Y 1986
Chart 9 shows price momentum for Alaska Airlines using a 40 week rate-of- change. Eachpriceis comparedtotheprice 40 weeks ago andthediffer- ence is plotted. For comparison, the10 week and 40 week oscillator for Alaska Airlines is shown on the same &art. Notice that the momentum indi- cator turns upahead oftheoscillator; however, the oscillator tends to peak ahead of the momentum indicator.
In conclusion, Technical Analysts use several statistical tools for identifying trend reversals and extreme deviation from trend. This paper was written to provide basic background information about the construction of several simple statistical tools and show how they are commonly used and interpreted. The advent of readily available computerized software for the Technical Analyst allows the possibility to construct ai7d simply test an infinite combination of tools.
Fteferences:
Pring, Martin. Technical Analysis Explained. The McGraw Hill Book Company, 1980
Wheelwright, Steven C. and Makridakis, Spyros. Forecasting Methods for Management John Wiley & Sons, 1973
Biographies
Frederic H. Dickson is a past President of the Market Technicians Associa- tion and has published three previous papers in the MTA Journal on various quantitative aspects of Technical Analysis. He is thechief Investment Officer of ShareInvest, a Connecticut based off-shore equity-oriented hedge fund.
Dr. Robert A. Wood is an Associate Professor of Finance at the Pennsylvania State University and is currently a visiting Professor of Finance at New York University. He is the publisher of numerous articles about the finan- cial markets in various academic journals, and co-authored a paper on non- synchronous trading which appeared in the February 1985 MTA Journal.
52 nA Journalmy 1986
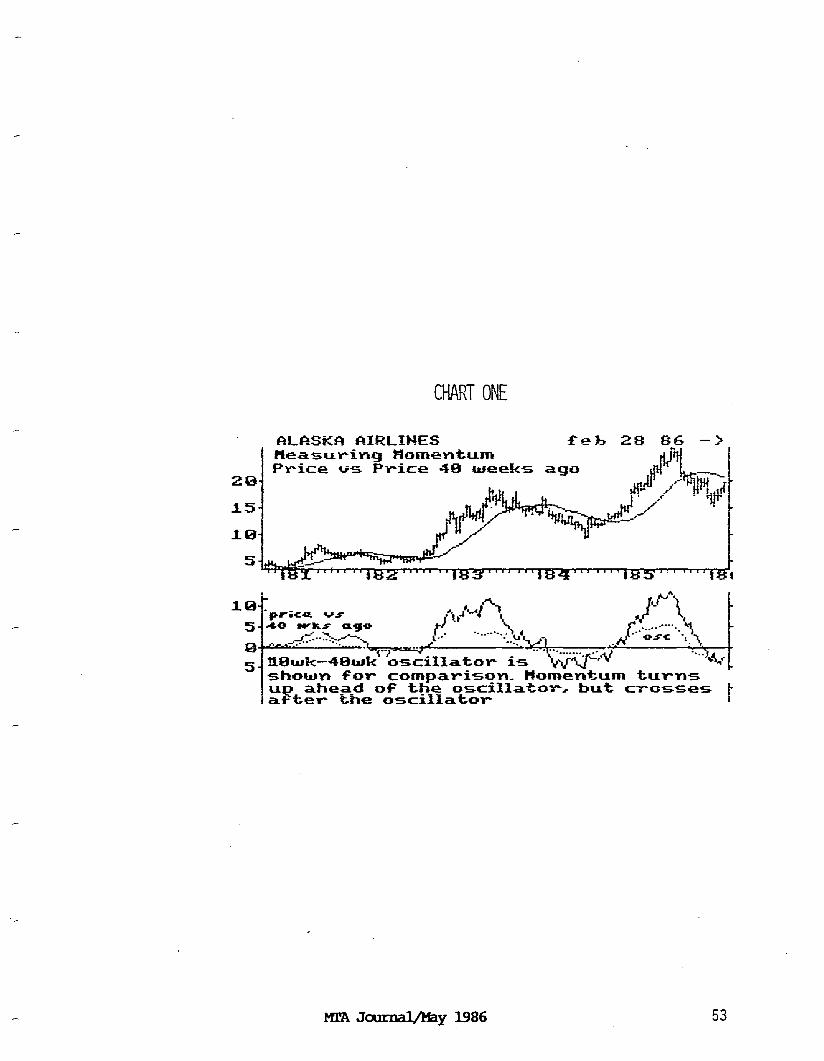
CHART ONE
f2LCtS#A AlRLLb!ES Pkasuring W3mentum Price ~5 P-r-ice 48 weeks
243 ago
15
18
MlJAJourd&ay 1986 53
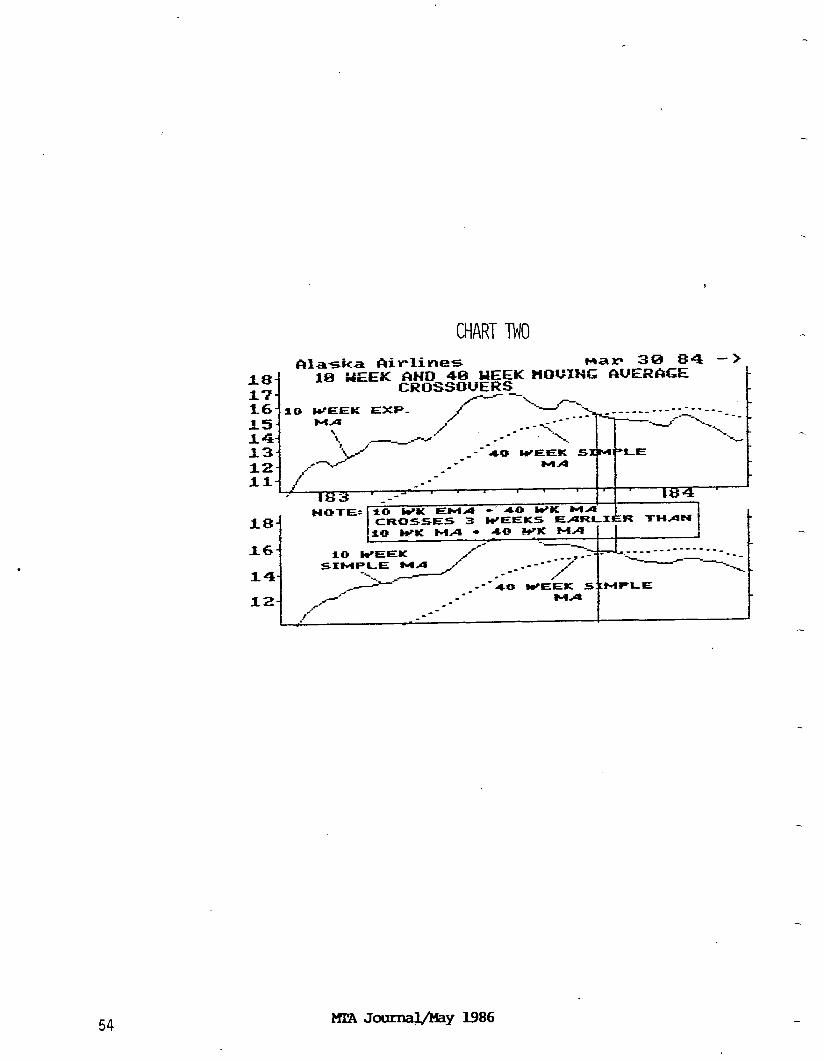
CHART TWO
54 Ml!AJotmal/hy I.986
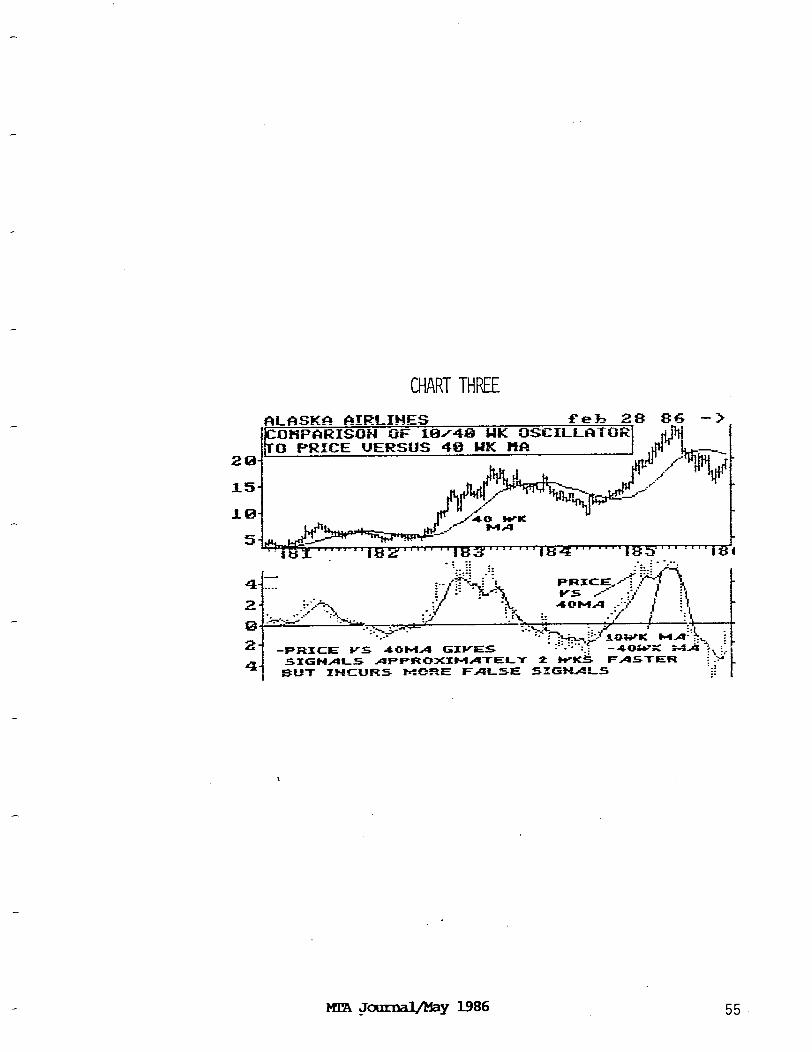
CHARTMFEE
-FRXCE ~5 4#?&4 GIYE5 SIGNALS APPRQXXMATELT P WKh FASTER
I SW-f XNCWRS MQRE FALSE lilCiiNRL5
‘
M!m +mal/hay 1986 55

CHART FOUR
.
YERTZCAL LINES XNDXCATE SIGNAL POXNT
56
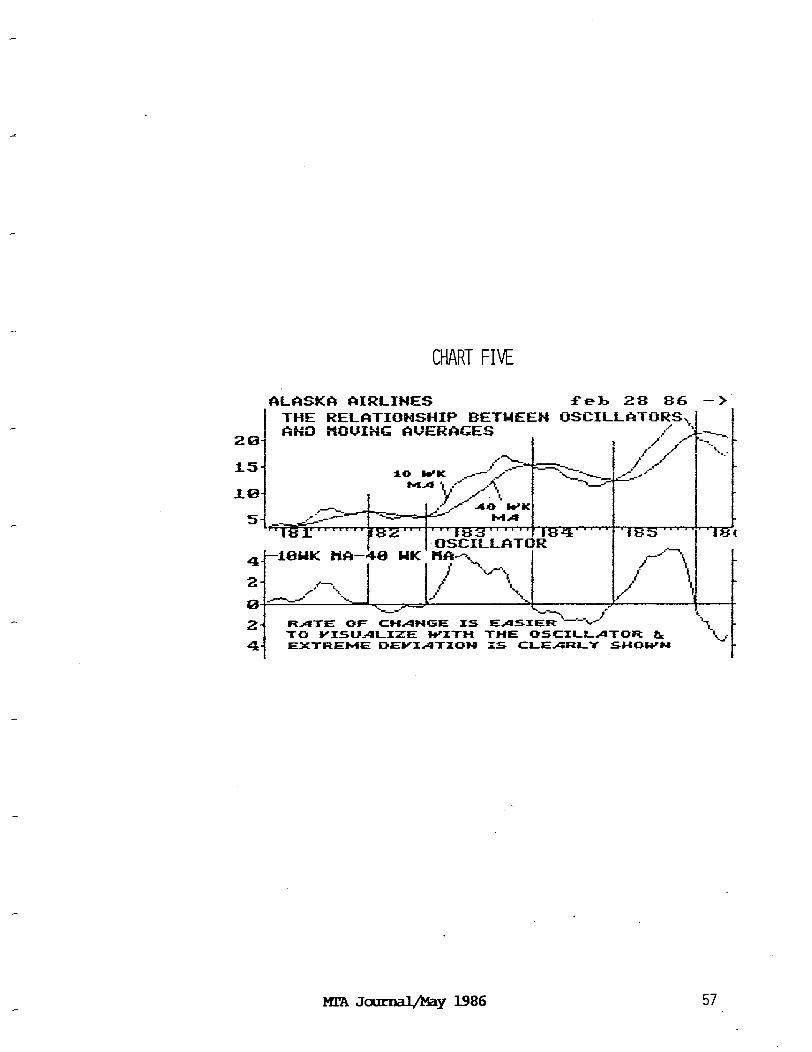
CHART FIVE
57
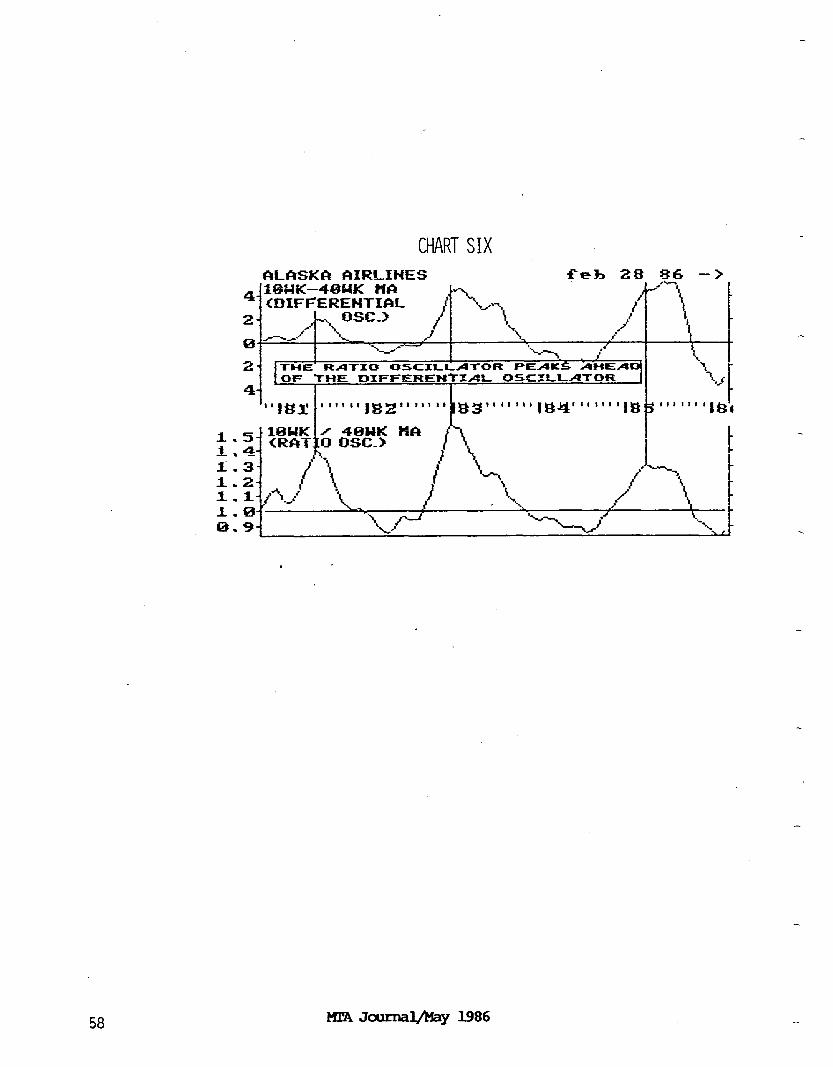
CHART SIX
CDIFFERENTIAL
.
58 MIRJ ournamy 1986
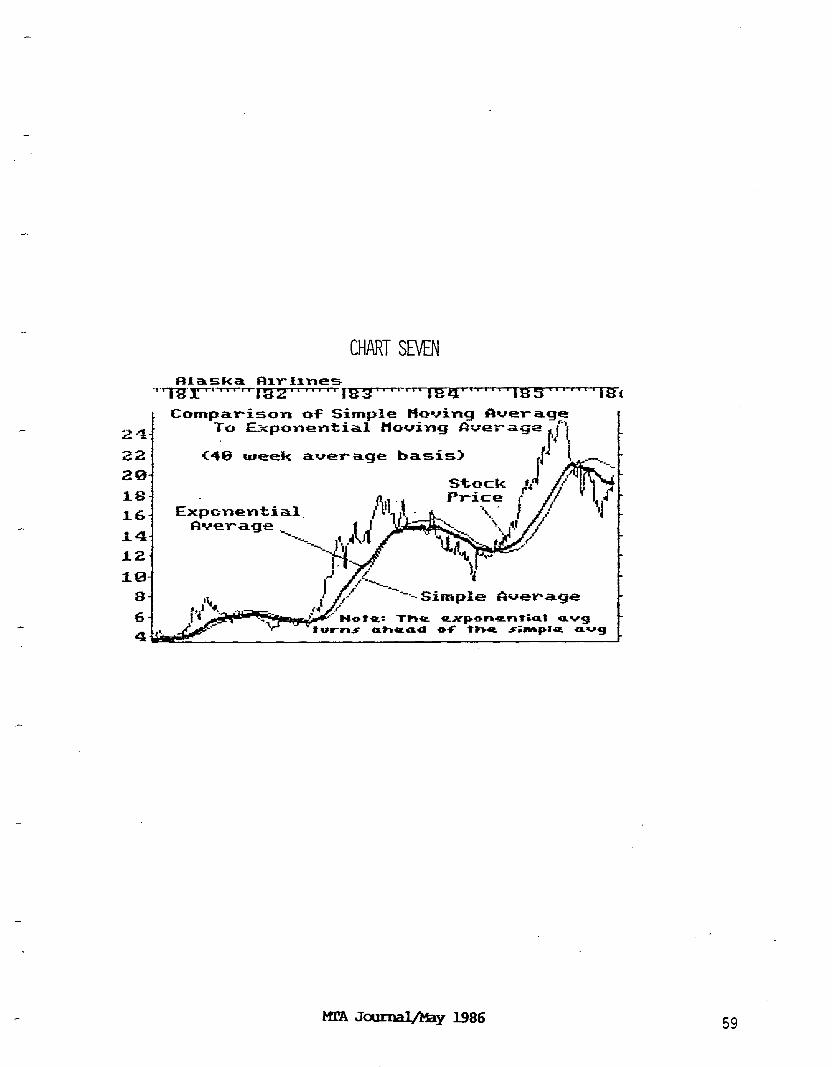
CHART SEVEN
=Jcamd&ayl986 59

60
CHART EIGHT
P EEKLY PRICE RANGE
24 /
28-
X8-
16-
14-
12-
I%-
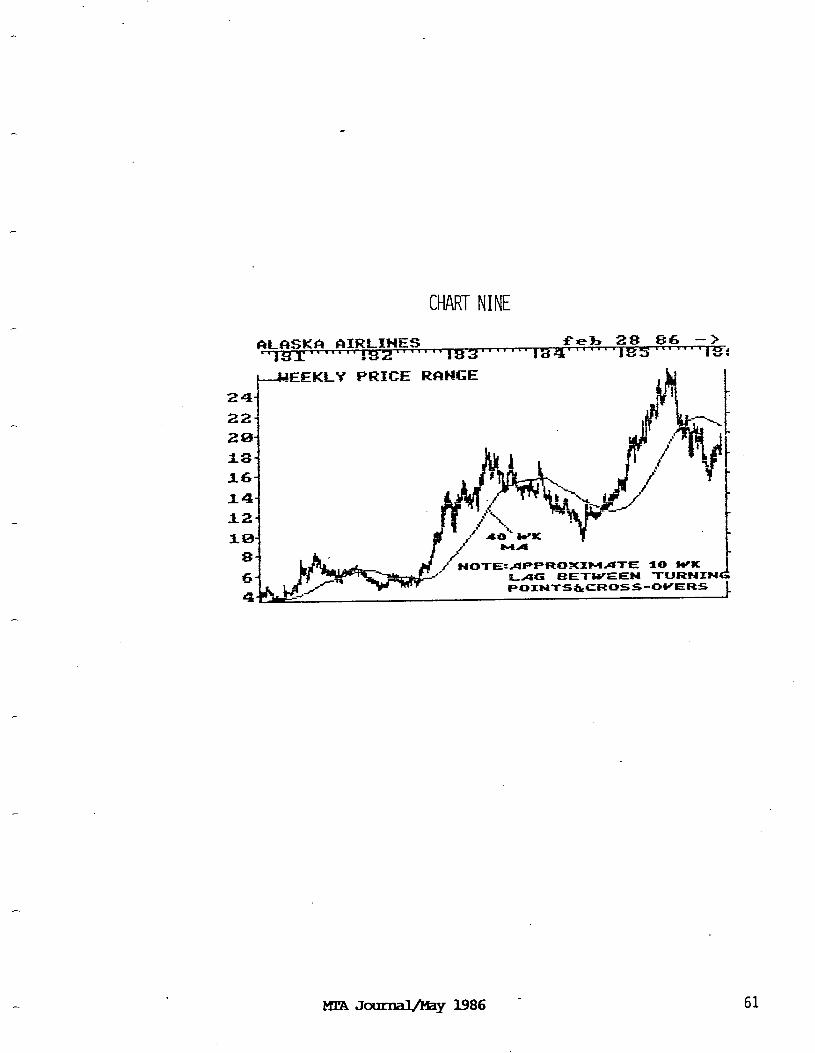
M.CA Jotxd&ay 1986 - 61

by William A. Lupien
Some time in the future we will have a 24-hour, world-wide market. The question is not one of "if," it is one of "when.“ However, the shape and composition of that market is difficult to predict, because there are many variables that will affect it. Despite that, we can identify several questions and issues that must be answered and addressed, and it is the resolution of those questions and issues that will largely determine what the 24-hour market will look like.
The issues in question fall into several broad categories: (1) the types of trading instruments, (2) the structure of the marketplaces themselves, (3) the regulatory environment and (4) the dissemination of information. None of the issues really stands on its own. They will interact with each other and many will be both cause and effect for the resolutionof other pieces of the puzzle.
Let's first consider the types of trading instruments. There is a need for a common dictionary of terms since, in many countries, the same term often has an opposite meaning. For example, the term "stock" in some countries means the debt market, whereas in this country it means equities. "Best efforts" has significantly different meaning in the U.S. and the U.K.
In the U.S., we've already seen the impact of financial futures and various forms of options on the securities markets. However, we really haven't seen this to as great an extent as I think we will, considering the impact of foreign currencies and the various other instruments such as convertible Eurobonds.
Another question is whether or not the various instruments that are traded will be fungible or not. There are some moves to make various instruments fungible from one market to another. The American Stock Exchange and the European Options Exchange have announced a tentative proposal to trade their major market index (ortheXM1 asitis known) both in theEuropean Options Exchange ard on the AMEX and have a fungible contract so that both markets can trade the same contract through many more hours and also have a common settlement facility.
Lastly, methods of settlement and currency exchange issues must be resolved in order to enable the 24-hour market to truly function as a world-wide market.
With respect to the structure of the marketplaces themselves, a significant issue to resolve will be whether markets develop by interlinking the exist- ing markets or by off-board trading. In other words, will stock exchanges link with other stock exchanges, such as we've seen in the linking of the American Exchange and the Toronto Exchange , or will markets developoff board in the countries where there is no linkage or where linkage is only of limited extent? This has great ramifications for each country's
62 J!fI!AJoUrna l/Hay 1986
organized exchanges, since off-board markets tend to have less regulatory back-drop and could propagate a market development away from New York and other international organized exchanges.
A further consideration is whether or not the markets will be continuous as we have in the U.S. or a call market? Will prices be set by auction or negotiation? Will brokers and dealers be one and the same or separated as they have been in the U.K.? Maybe there will be combinations of these, but the resolution of these issues will have a tremendous significance.
What will firms do to move their principal books around the world? Will they try to do this from one or two physical locations, or will they set up offices all around the world? Obivously, for the major firms they can and are setting up offices around the world. But for those firms that lack the financial or personnel resources to set up activities internationally, the question is how will they cope with this, and how will they develop struc- tures so that they can compete with the major firms?
An additional concern (or opportunity) is that more competition will enter the world-wide markets, creating a greater turnover, i.e., greater volume. This greater volume will tend to increase the liquidity of the various markets, but it will also reduce commissions. Consequently, it will im- prove the opportunity for foreigners to trade in a given domestic market around the world, but will also requirethemtobe very good at managing costs as markets become more efficient.
Twenty-four hour markets will create regulatory problems, since trading often gravitates to the least regulated markets. The SEC and various foreign governments are currently trying to figure out solutions to this issue. Unfortunately, each country looks at the problem as a loss of market share and, therefore, instead of maintaining high standards, is tempted to go with a less rigorous regulatory environment in order to attract trading activity. Consequently, it seems that everyone is seeking the lowest common denominator. Along with that will come increased regula- tory problems such as insider trading, lack of quality markets, and people coming and going in various kinds of markets without the long-term commit- ment that we take for granted in the U.S.
The 24-hour market will generate a greatly increased need for information. The speed in dissemination of that information will also be critical. Hopefully, it will be in an on-line transaction reporting type of system, which is commonplace in the U.S. but is mt as prevalent in international markets.
Along with these better communications and information systems will come greater liquidity. As we've seen in the U.S. over the last 15 years, an increase in the quantity and quality of information has caused types of markets to evolve and develop around that information, primarily because many people had an opportunity to prove the information and act upon it in a timely fashion.
The security of financial data will need to be improved because the trans-
63 MIZJ mumd/my 1986
mission across borders tends to increase the risk that somebody will take advantage of it or tamper with it such a way that its format or integrity is changed. This-is a great concern for all of those who are in the trans- mission of data, both informational and actual trade data.
Another major issue,is the quality of the information. This is particu- larly important for technicians, as technicians generally make predictions based upon numbers. In terms of quality, what is the assurance that all trades are being reported and that they are being reported in a timely manner and in a sequence that can then be analyzed by a technical analyst? Some of you may not be aware of this, but a significant volume of trading in U.S. securities is taking plaza offshore, both before and after New York hours, and is not reported to the so-called New York tape. In some cases, these trades have been as large as several million shares. Whereas that would normally trigger off all kinds of signals in each of your technical analysis programs, they are unnoticed or hidden , in effect, by being traded in foreign markets where they have TID reporting mechanism. The quality of the information is going tobecome an ever-increasing concern to market technicians and traders alike.
Consider further-whether we should look for single source or multiple sources of market data. There are in this country several sources of market data. Around the world there are many sources of market data crop- ping up. The advantage of multiple market data sources is that you have a more competitive environment. The disadvantage, on the other hand, is that you have to get multiple market feeds into your system. This increases the cost and the complexity of gathering that market data, not to mention the problem of information overload.
Computer readable data is also an important element in terms of the market data coming from foreign countries. One of the reasons it would become' ever-increasingly important is that the quantity of data is literally exploding in the financial markets. The only reasonable way of analyzing it will be by computer. Having it in computer-readable form will become mandatory. As you probably are aware, many market vendors today only make that data available in a video form output and have, for various reasons, fought the computer-readable format.
What does all of this mean to technical analysts? At the risk of oversim- plification, technical analysis will become more important in helping to identify trading and investment opportunities, because fundamental analysis varies extensively from country to country. Either different accounting standards or different rules an insider information, plus a variety of ways of interpreting fundamental data will cause this. In addition, the requirement in many countries is not as extensive in terms of what funda- mental data has to be displayed or how often.
For instance, in the U.K., they only have to report fundamental data twice a year. That means that you have only two looks during a twelve-month period at what the company is doing from a fundamental standpoint. Obviously, the need for technical analysis in that kind of market is even greater than it is in the U.S., since their alternative fundamental
64 m!A J-l/hay 1986

analysis limits the view of what changes might be taking place over time within a company.
William A. Lupien is affiliated with INSTINET, New York, New York.
65 MA J-y 1986
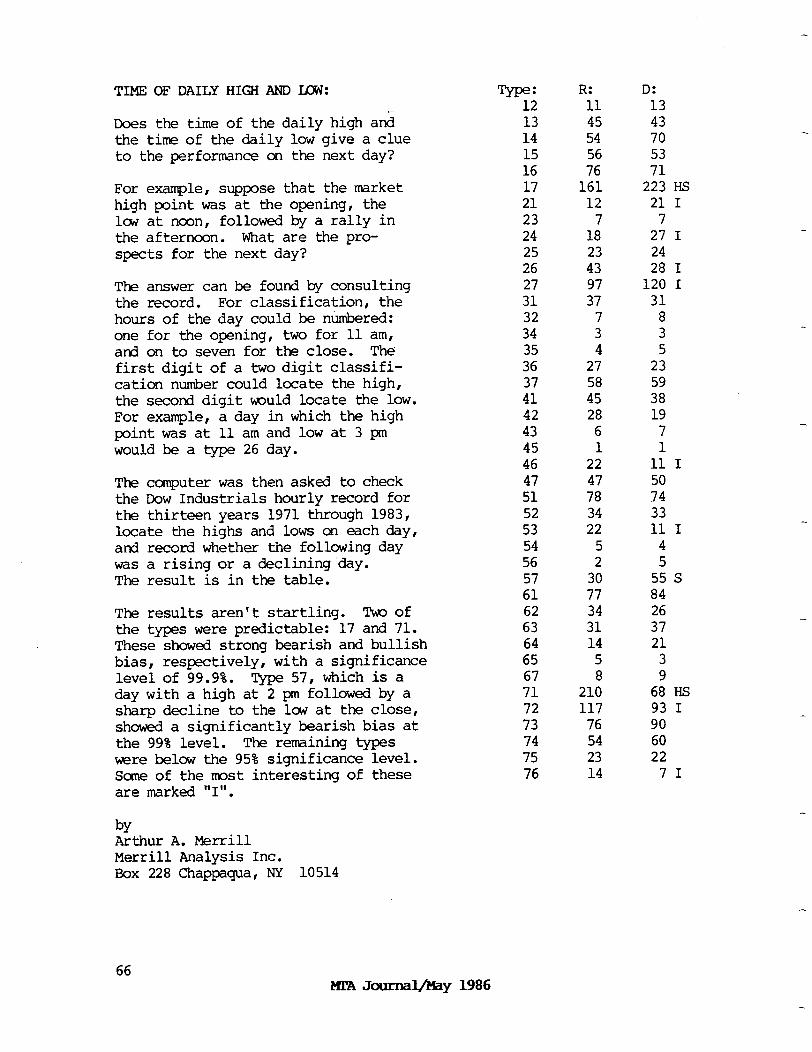
TIME OF DAILY HIGH AND Low:
Does the time of the daily high and the time of the daily low give a clue to the performance on the next day?
For example, suppose that the market high point was at the opening, the 1~ at noon, followed by a rally in the afternoon. What are the pro- spects for the next day?
The answer can be found by consulting the record. For classification, the hours of the day could be ntiered: one for the opening, two for 11 am, and on to seven for the close. The first digit of a two digit classifi- cation number could locate the high, the second digit muld locate the low. For example, a day in which the high point was at 11 am and low at 3 pm would be a type 26 day.
The computer was then asked to check the Dow Industrials hourly record for the thirteen years 1971 through 1983, locate the highs and lows on each day, and record whether the following day was a rising or a declining'day. The result is in the table.
The results aren't startling. T&o of the types were predictable: 17 and 71. These showed strong bearish and bullish bias, respectively, with a significance level of 99.9%. Type 57, which is a day with a high at 2 pm followed by a sharp decline to the lcw at the close, show& a significantly bearish bias at the 99% level. The remaining types were below the 95% significance level. Sane of the most interesting of these are marked “1".
Arthur A. Merrill Merrill Analysis Inc. Box 228 Chappaqua, NY 10514
Type: R: D: 12 11 13 13 45 43 14 54 70 15 56 53 16 76 71 17 161 223 HS 21 12 21 I 23 7 7 24 18 27 I 25 23 24 26 43 28 I 27 97 120 I 31 37 31 32 7 8 34 3 3 35 4 5 36 27 23 37 58 59 41 45 38 42 28 19 43 6 7 45 1 1 46 22 11 I 47 47 50 51 78 74 52 34 33 53 22 11 I 54 5 4 56 2 5 57 30 55 s 61 77 84 62 34 26 63 31 37 64 14 21 65 5 3 67 8 9 71 210 68 Hs 72 117 93 I 73 76 90 74 54 60 75 23 22 76 14 71
66 nrAJ ournawy 1986

Type: First digit: time of high Second digit: time of low.
R:
D:
HS: s: I:
lopen 2 11 am 3ncon 4lpTI 5 2 pm 63~ 7 Close
Number of times the following day was a rising day.
Number of times the following day was'declining day.
Highly significant; 99.9% level Significant; 99% level Below 95%, but interesting.
67 I'fl!AJourd&ay I986

DIVERQWX -IS: sEvERAL~lRIcAT,TEsTs
- by Joseph F. Kalish
ARSmCT: This study first reviews the theory of divergence analysis and provides several examples of classic divergences. Then five technical indicators are examined using the chi-squared test of independence. After showing which indicators are statistically significant for forecasting pr-
poses, these indicators are combined and tested as a composite indicator. The composite indicator shows that the more indicators confirming a trend movement, the more like1 y the trend will continue. Conversely, the more indicators diverging from the trend, the more likely the trend will re- verse. This article is essentially an extension and expansia of the work by David A. Glickstein and Rolf E. Wubbels, "Dow Theory is Alive and Well!, " Journal of Portofolio Management, (Spring, 1983).
Section One: Introduction
Perhaps we should being by explaining and defining the title. What is divergence analysis? Adivergence is most simply when one stock market average goes up and another does rsot. For example, if the Dow Jones Indus- trial Average (DJIA) makes a new high and at the same time the Dow Jones Transportation Average (DJT) does not, a divergence is said to have oc- curred. Therefore, divergence analysis is the study of whether market averages are highly correlated, any time the co-movement between the averages is broken, a change in trend is often the result.
This study uses technical stock market indicators. That is, all data was derived from the market itself. People who examine the prior history of the market and related indicators to forecast future market movements are known as technical analysts, technicians, market analysts or some other similar title.
Technical analysis is the broad term for many different types of market- derived analysis. Many people unfamiliar with technical analysis think technical analysis means "reading" price/volume charts. This is not true. Price/volume analysis is classical technical analysis - identifying pat: terns in charts like head-and-shoulders formations, triangles, flags, etc. Classicalprice/volume analysis is just one type of technical analysis, just as divergence analysis is another, point-and-figure another, relative strength another, etc.
This study follows-up, changes, and expands upon the pioneering work done by David A. Glickstein and Rolf E. Wubbels as described in their Spring 1983 article in the Journal of Portfolio Management, "Dow Theory is Alive and Well!" Briefly, Glickstein and Wubbels (G&W) tested to see if the Dow Theory was statistically valid. They tested the DJIA, DJT, and the
68 MA J-Y 1986

Advance-Decline Line, a cumulative daily sum of the number of stocks advancing minus the number of stocks declining (A-D Line). G&W found Iy3n- random relationships between the DJT and the DJIA, the A-D Line and the DJIA, and both the DJT and the A-D Line and the DJIA.
Section Two explains the theory of divergence analysis in more depth and provides a few examples of some previous divergences. In Section Three we will explain how this study was set up and identify the differences from the G&W study. Section Four describes and analyzes the results of the sta- tistical tests conducted. Finally, in Section Five we summarize the results and draw scnne conclusions.
Section Two: The Theory of Divergence Analysis
It seems appropriate that a paper discussing divergence analysis should first review the theory and examine some examples. That is what we will do in this section.
Let us begin with some definitions that were briefly mentioned in the introduction. Divergence analysis is really the study of non-confirma- tions. A non-confirmation occurs when an average, index, or indicator re- fuses to go up (or down) at approximately the same time as another average, index, or indicator. Conversely, a confirmation is when an average, index, or indicator goes up (or down) atapproximatelythe same time as another average, index, or indicator. Thus, as long as the technician sees confir- mations, the trend in motion is likely to continue. But when the techni- cian spots a non-confirmation, a divergence signal has been rendered and the trend is likely to reverse. Non-confirmations are particularly import- ant since they usually appear early in a market move. They are easiest to identify when new highs or new lows are being made.
The length of time is another important factor in divergence analysis. First, confirmations should occur within a reasonable time frame. The closer in time the confirmation, the more significant it is and the more likely that the trend will continue. Second, short-term divergences (di- vergences that last a few hours or days) signal short-term moves while long-term divergences (divergences that last a few weeks, months, or even years) forecast long-term moves.
Furthermore, the number of indicators is useful in forecasting market moves. The more indicators confirming the action, the more confident we are that the current trend will continue, while the more indicators diverg- ing means we are more likely to see a trerd reversal.
Finally, sometimes one hears the terms "positive divergence" and "negative divergence." In this paper, a positive divergence is a divergence that has bullish implications. A negative divergence is a divergence that has bear- ish implications.
69
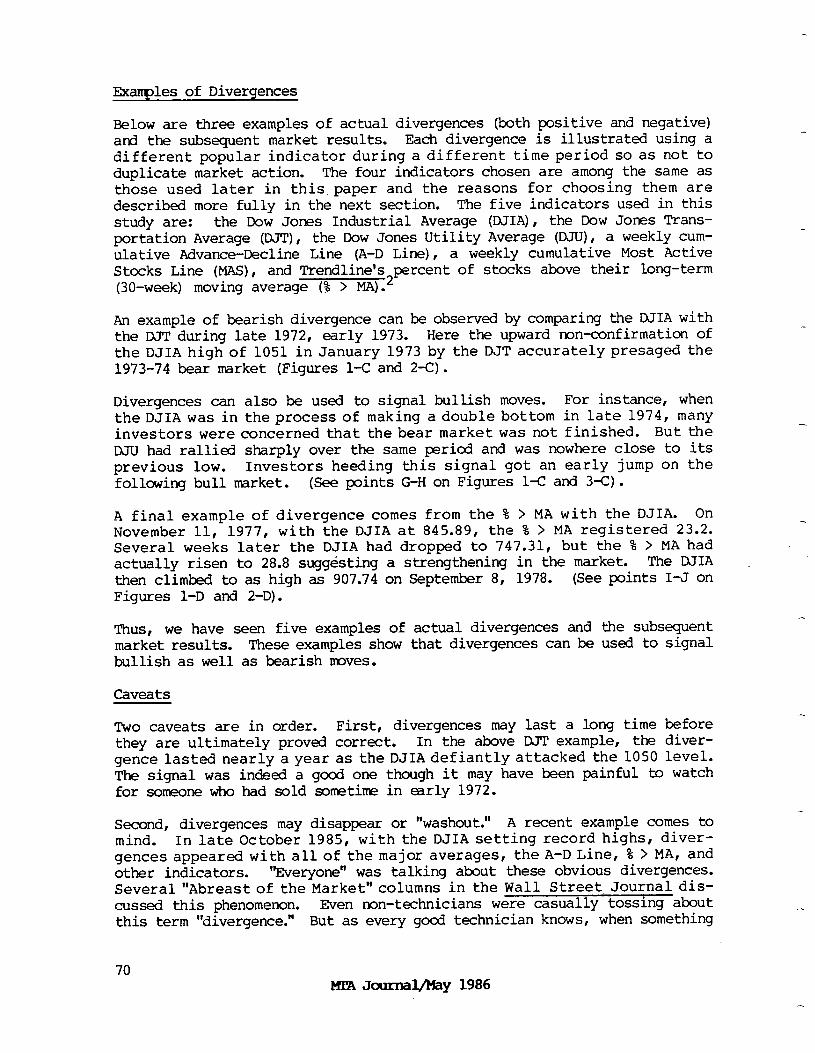
Examples of Divergences
Below are three examples of actual divergences (both positive and negative) and the subsequent market results. Each divergence is illustrated using a different popular indicator during a different time period so as not to duplicate market action. The four indicators chosen are among the same as those used later in this,paper and the reasons for choosing them are described more fully in the next section. The five indicators used in this study are: the Dow Jones Industrial Average (DJIA), the Dow Jones Trans- portation Average (DJT), the Dow Jones Utility Average (DJU), a weekly cum- ulative Advance-Decline Line (A-D Line), a weekly cumulative Most Active Stocks Line (MAS), and Trendline's percent of stocks above their long-term (30-week) moving average (% > MA).*
An example of bearish divergence can be observed by comparing the DJIA with the DJT during late 1972, early 1973. Here the upward non-confirmation of the DJIAhigh of 1051in January 1973 by the DJT accurately presaged the 1973-74 bear market (Figures 1-C and 2-C).
Divergences can also be used to signal bullish moves. For instance, when the DJIA was in the process of making a double bottom in late 1974, many investors wereconcernedthat thebear market was not finished. But the DJU had rallied sharply over the same period and was nowhere close to its previous low. Investors heeding this signal got an early jump on the following bull market. (See points G-H on Figures 1-C and 3-C).
A final example of divergence comes from the % > MA with the DJIA. On November 11, 1977, with the DJIA at 845.89, the % > MA registered 23.2. Several weeks later the DJIA had dropped to 747.31, but the % > MA had actually risen to 28.8 suggesting a strengthening in the market. The DJIA I then climbed to as high as 907.74 on September 8, 1978. (See points I-J on Figures 1-D and 2-D).
Thus, we have seen five examples of actual divergences and the subsequent market results. These examples show that divergences can be used to signal bullish as well as bearish moves.
Caveats
Two caveats are in order. First, divergences may last a long time before they are ultimately proved correct. In the above DJT example, the diver- gence lasted nearly a year as the DJIAdefiantly attacked the 1050 level. The signal was indeed a good one though it may have been painful to watch for someone who had sold sometime in early 1972.
Second, divergences may disappear or "washout." A recent example comes to mind. In late October 1985, with the DJIA setting record highs, diver- gences appeared with all of the major averages, the A-D Line, % > MA, and other indicators. "Everyone" was talking about these obvious divergences. Several"Abreastof the Market"columns in the Wall Street Journaldis- cussed this phenomenon. Even non-technicians were casually tossing about this term "divergence." But as every gocd technician knows, when something
70 m'Ti Jcumal/hy 1986
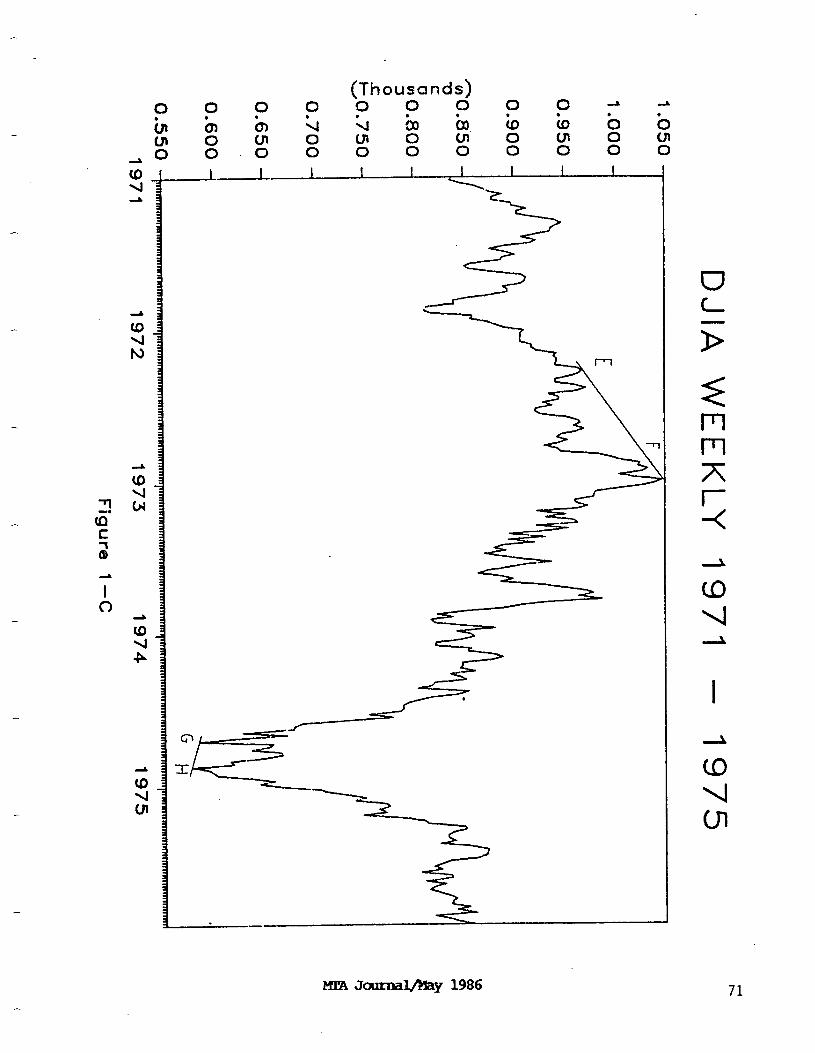
lWA J-y 1986 71

I I i I i I I I ! I I I I
u c- -l
I
72 Kt!A Journal&y 1986
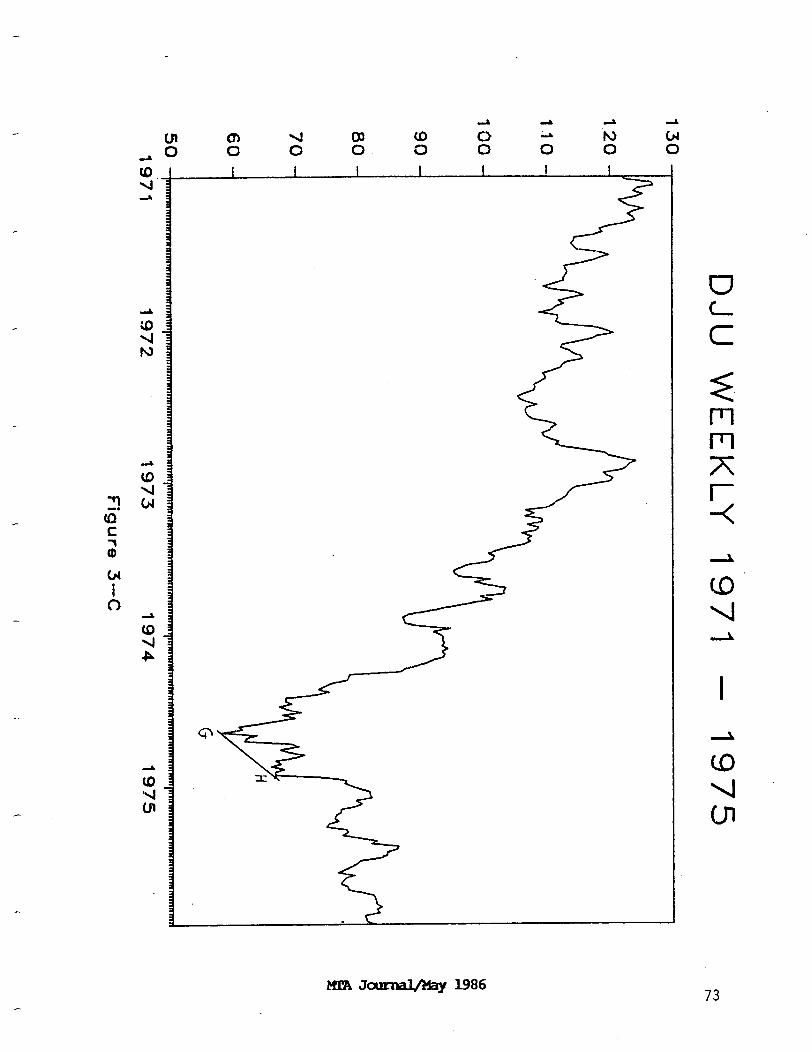
I I I I I I I
73

74 mA Jotrnal&y 1986
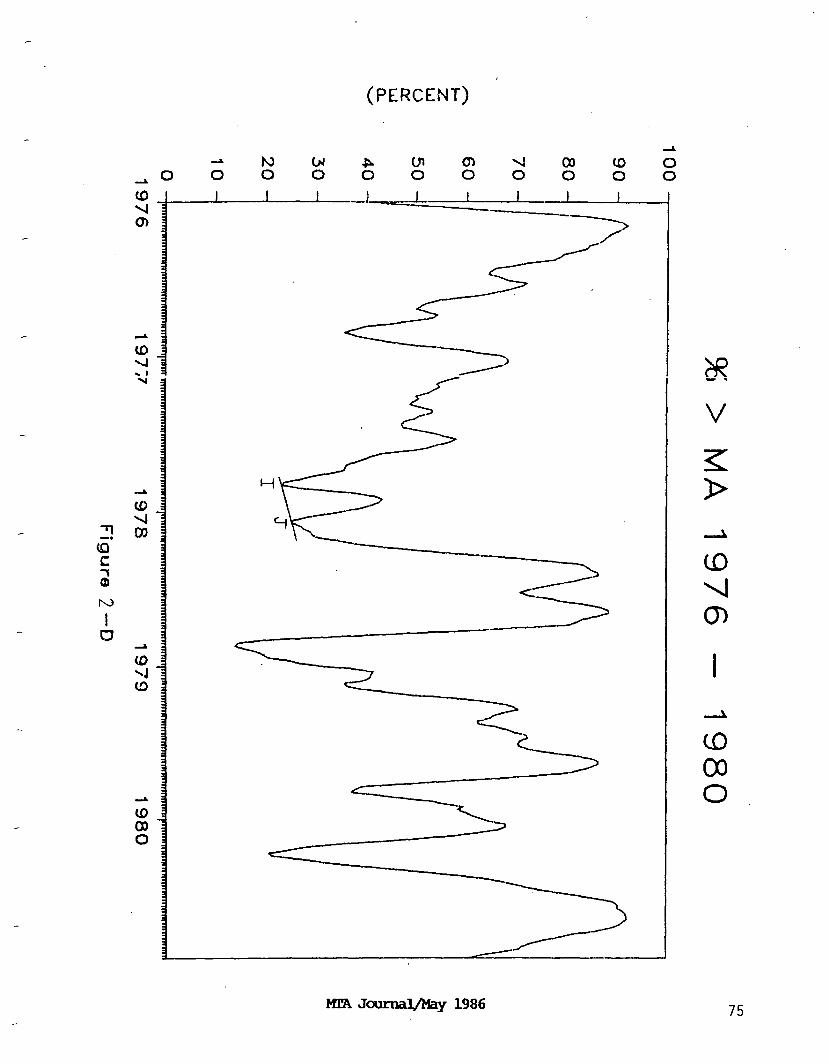
(PERCENT) ’
MI'A J-y 1986 75

is so obvious that the crowd "knows" what is supposed to happen, the crowd is usually wrong. This was the perfect time for a little contrary opinion and a look toward other indicators for bullish clues (of which there were many, especially in the sentiment area). A technician's job is never so easy and obvious , so the divergences disappeared and the crowd was once again left behind. This example also demonstrates how important it is to watch other indicators for confirmation as any single indicator or technique may go astray at critical points.
Section Three: The Study
We wanted to stay as close to the original Glickstein and Wubbels (G&W) study as possible without duplicating the effort. Thus, many of the prin- ciples, definitions, and methodologies are the same. There are, however, several important differences which will be pointed out.
scope 1. Indicators - As described in the introduction, the G&W study tested the
statiscal validity of the Dow Theory. Only two daily indicators (DJT and the A-D Line) were tested. It can be easily seen that this portion of the Dow Theory is merely a subset of the broader category of diver- gence analysis. However, this study uses weekly instead of daily data. Weekly data give a slightly different picture of the market than daily data. This study also examines three new indicators in addition to the DJT and A-D Line: Dow Jones Utility Average (DJU), a cumulative Advance-Decline Line of the week's twenty Most Active Stocks (MAS), and Trendline's percentage of stocks greater than their respective long- term moving averages (% > MA). Why test these particular indicators? All these indicators are and have been widely used in practice in various forms by numerous technicians to detect divergences. Because they are so widely used, it makes sense to test these "classic" diver- gence indicators first.
2. Time Period - In order to test the statistical significance over several bull and bear cycles , a twenty-year period from February 7, 1961 through December 26, 1980 was studied. The G&W study examined the years 1971-1980. Thus, this study provides a direct comparison with the earlier study as well as expanding the period covered by another decade.
Data
Weekly data for each indicator over the twenty-year period were obtained from severaldifferent sources. The weekly values of the DJIA, DJT (Dow Jones Rails prior to 1970), the DJU from 1967-1980 came from the well-known Interactive Data Corporation database. Values prior to 1967 were obtained from the NYSE Daily Stock Record. All of the % > MA data came directly from the worksheets used to produce the calculations at Trendline. Finally, all of the weekly A-D Line statistics and MAS statistics were
76 MT24 Jound/hay 1986

culled from the back issues of Darron's on microfilm for the twenty-year period.
A few people, especially Glickstein, questioned the use of weekly data since the G&W study used intraday highs and lows. G&W state, however, that they did not "believe that the use of closing figures would have altered the results of the test significantly.lV3 There are several reasons for using weekly data:
1.
2.
3.
4.
5.
6.
7.
We can cover many more years (and therefore more bullandbear cycles) with much fewer data points.
Weekly data act as a smoothing factor by better isolating the ' trend.
The "s > MA indicator is a weekly indicator.
The data facilitate the comparison between weekly results and daily results. Hopefully we can determine: 1) whether there is a difference between using weekly data and daily data, 2) if there is, its significance, and 3) which are better to use.
Institutional portfolio managers can be more confident that they are adjusting their portfolios to reflect anticipated major market mves .
Individual investors can easily track these indicators by taking a few minutes out each weekend.
On a more technical point, serial correlation for all practical purposes is eliminated. As mentioned in the G&W study, to elimi- nate statistical dependence, "one would examine progressively more and more distant observations until serial correlation was elimi- nated" (G&W, p. 32). Therefore using weekly data is almost synon- ymous with taking every fifth observation. Even though G&W con- cluded that there was no serial correlation present in their study, the use of weekly data provides added assurance that we are not observing serially dependent observations.
Statistical Methodology
As in the G&W study, chi-squared tests of independence were performed using contingency tables. This procedure provides a method for deciding whether the hypothesis of independence between va4riables in different classifica- tions (null hypothesis) is acceptable. We tested against the null hypothesis that there is an independent relationship between confirmation by an indicator and subsequent weekly movements of the DJIA. Stated another way, if the null hypothesis holds, we can conclude that there is a random or independent relationship between the actions of the indicators and the subsequent future movements an the DJIA.
77
The continguency tables were set up in the same manner as in the G&W study. When the DJIA made a new high above its previous high (or new low below the previous low) the other indicator was examined for confirmation.' We then see if the DJIA continues the trend by making a new high (or new low). Thus the table is the result of the intersection between confirmation and subsequent trend continuation.
Section Four: The Chi-Squared Tests of Independence
In this section, we will examine the results of the chi-squared tests of independence for each of the indicators mentioned in Section Three. Then we will use these results to test a composite indicator.
Before discussing and interpreting the results of the chi-squared tests, it might be helpful to work through a couple of entries to see how the tables were filled. For example, on April 14, 1961, the DJIA stood at a new high of 693.72 and the DJT stood at 142.31. Using the procedure outlined in the previous section, we noted that the DJIA made a new high at that date, eclipsing its previous high. We then checked the DJT for confirmation. In this case, the DJT made a new high at 148.18 three weeks prior on March 24, 1961. Thus, the DJT did not confirm the action of the DJIR Next we noted that the DJIA went an to make a new high on May 19, 1961 of 705.96. In our contingency table, we recorded one instance of non-confirmation ard subse- quent new high (the intersection of "New High" and "Nos").
To continue our example, we-examined the action of May 19, 1961 (since the DJIA made a new high). Again the DJT failed to confirm, but this time the DJIA failed to better its previous high and traded below its previous reac- tion low correctly forecasting the weak June-July period. In this case, one instance of non-confirmation followed by "No New High" was recorded.
An important note about what is not being tested. In principle, the longer the divergence, the more significant it is. The nature of a statistical test, however, is consistency and specificity. Therefore, it is difficult to test long and variable divergences with a statistical test such as this one.
Before we examine the results, let us first see how the contingency table is setup and how the chi-squared test works. Look at Table ion page 79. Over the twenty-year period, we recorded 183 instances where the DJT con- firmed the new high on the DJIA and the DJIA subsequently went to a new high. There were 46 instances where the DJT did not confirm the new high on the DJIA and the DJIA went on to make a subsequent new high. Likewise, there were 48 times when the DJT confirmed the new high on the DJIA and the DJIA failed to make a new high. There also were 25 times when the DJT failed to confirm the action of the DJIA, and the DJIA failed to make a new high. Now we find the row totals and column totals. (These totals are also called the marginal totals since they appear on the edge or margin of
78 MPA J-y 1986
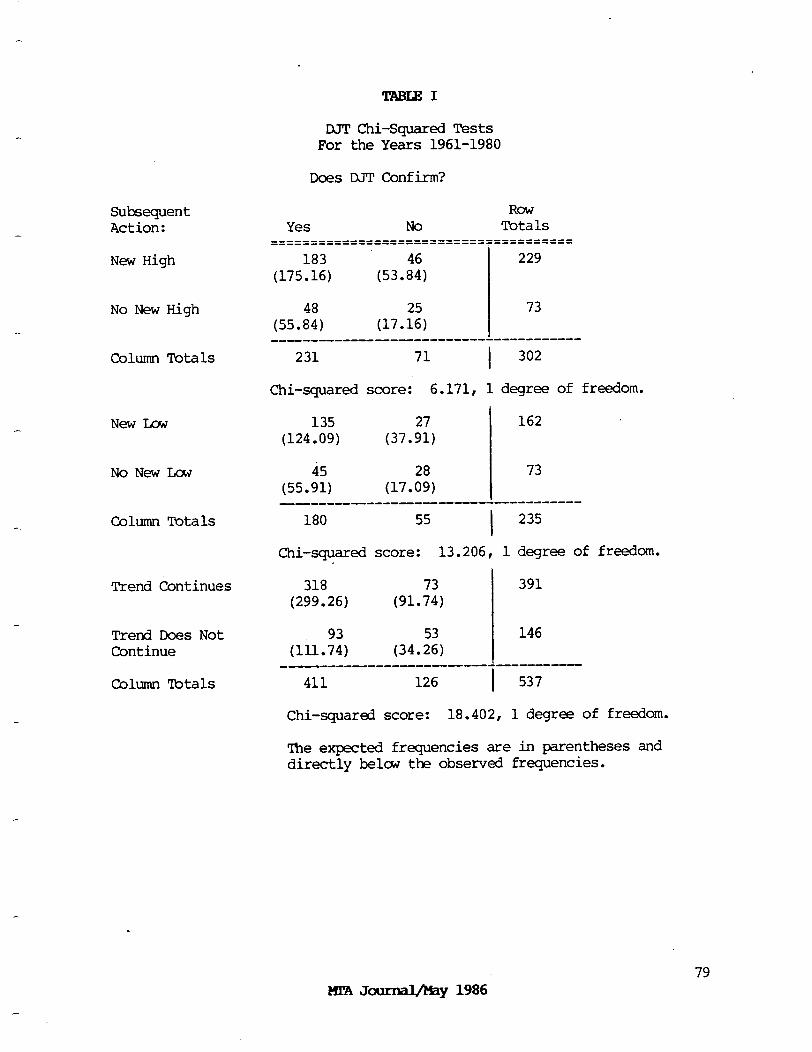
DJT (M-Squared Tests For the Years 1961-1980
Subsequent Action:
New High
No New High
Column Totals
New Law
No New LLXI
Column Totals
Trend Continues
Trend Does Not Continue
Column Totals
Does DJT Confirm?
Yes No Totals ===========================~==========
183 (175.16) (53.::)
229
(55.8448) (17.::) 73
------------------------------------- 231 71 I 302
(X-squared score: 6.171, 1 degree of freedom.
135 162 (124.09) (37.92:)
(55.94:) (17.:;) 73
-------_------------------------- 180 55
I 235
Chi-squared score: 13.206, 1 degree of freedom.
318 (299.26) (9l.E)
391
(lll.7943) (34.;:) 146
------------^------------------- 411 126 I 537
Chi-squared score: 18.402, 1 degree of freedom.
The expected frequencies are in parentheses and directly below the observed frequencies.
79

a contingency table). The row totals are 229 (183 + 46) and 73 (48 + 25). The column totals are 231 (183 + 48) and 71 (46 + 25). Both the row and column totals sum to a total of 302 observations.
Now, we need to calculate the expected number of observations for each cell in the table. This is found by taking the product of the marginals divided by the total number of observations. For example, 229 times 231 divided by 302 equals 175.16. This means that we would expect to see 175.16 observa- tions in this cell, but we actually saw 183.
We are ready to calculate the chi-squared statistic for the contingency table. This is given by the formula:
2 x = f'
(f-e) 2
i-j e
where f is the observed frequency of cell i, e is the expected frequency of cell i, and n is the total number of cells in the contingency table. To avoid arithmetic mistakes, the tables were set up on a Lotus l-2-3 spread- sheet. The first table of Table 1 has a chi-squared of 6.171.
Before we can compare the chi-squared scores with the tabled values, we need to calculate the degrees of freedom. The degrees of freedom tell how many expected frequencies can be determined independently of the marginal totals. The degrees of freedom are found by multiplying (r-l) by (c-l) where r equals the number of rows and c equals the number of columns in the contingency table. In a 2 x 2 contingency table (2-l) (2-l) = (1) (1) = 1 degree of freedom.
We are now ready to compare the calculated chi-squared statistic to the tabled value of the chi-squared probability distribution found in any basic statistics book to see whether there is an independent or dependent rela- tionship between confirmaticn and subsequent weekly DJIA movements (See Table 1). A chi-squared score of 6.171is significant at the 2.5 percent level. What exactly does this mean? It means that this relationship would only have occurred by chance 2.5 percent of the time. Alternatively, we can say with 97.5 percent certainty that this relationship did not occur by chance. Thus, we can reject the null hypothesis at the .025 (alpha = .025) level of significance. The level of significance indicates a point on the horizontal axis under the chi-squared distribution, to the right of which lies alpha equal to some percentage of the area under the curve. The smaller the alpha, the farther to the right we are on the horizontal axis, and the less probable the distribution is independent and the more strongly we can reject the null hypothesis. Thus, we can be fairly certain that there is a dependent or non-random relationship between confirmations by the DJT and whether the DJIA makes a subsequent new high.
As was done in the G&W study, we separated the new highs from the new lows to see if there was any difference in signalling. A chi-squared score of 13.206 was registered on the downside. Therefore, we can reject the null hypothesis even more strongly at the .005 level of significance for the
80 m Journal-/k~Y 1986
number of new lows. This means the DJT was slightly better at signalling changes in trend when the DJIA made a new low and the DJT did not. In other words, it was statistically more meaningful when the DJT diverged on the upside from a new low on the DJIA, than whenitdiverged on the down- side from a new high cn the DJIA (Refer to Table 1).
Then we combined the results of the first two tests to analyze trend con- tinuation. Trend continuation means that a new high on the DJIA is fol- lowed by a subsequent new low. Similarly, a discontinuanoa of trend means that a new high on the DJIA was not followed bya subsequent new low. To obtain the "Trend Continues" row, we simply sum the components of the "New High" row with the components of the "New Low" row. To obtain the "Trend Does Not Continue" row, we sum the "No New High" row with "No New Low" row. For example in Table 1, there were 318 (183 + 135) times when the DJT con- firmed the trend of the DJIA and the DJIA went on to continue the trend. The resulting chi-squared score was 18.402. Thus, we can reject the null hypothesis most strongly for trend continuation.
The second indicator tested was the DJU. The chi-squared scores for new highs, new lows , and trend continuation were 0.792, 2.039, and 2.241 re- spectively. Therefore, we cannot reject the null hypothesis even at the .lO level of significance for any of the DJU tests (see Table 2). Thus, we can can conclude that there is no precise predictive value from confirmation provided by the DJU and subsequent action of the DJIA. In other words, the movement was essentially independent or random. Does this make sense? Yes, since the DJU is interest rate sensitive, it is probably much more closely related to the bond market. Perhaps the box-d market is a good predictor of future movements of the DJU. Frequently, however, the DJU leads the rest of the market. So we tested this by expanding the con- firmation zone to include four weeks prior to the current week. The re- sults, presented in Table 3, show the new high score rising to 3.260, and the new low score dropping to 0.935, and the trend continuation score ris- ing to 3.585. Although some overall improvement resulted, it was still discouraging not to be significant at the .05 level of significance. Does this mean that the DJU has 1y3 predictive value? Not at all. It just means that we have been unable to show a statistically valid relationship between the DJU and future DJIA results using a chi-squared test of independence. Most likely the lead is long and variable, and therefore cannot be adequately tested on a weekly basis.
A-D Line
The A-D Line was the next indicator tested. It received a chi-squared score of 4.997 on the upside, 12.359 on the downside, and 16.183 overall as shown in Table 4. Thus, divergence from new highs cn the DJIA was signifi- cant at the .05 level whereas divergence from new lows on the DJIA and overall trend continuation were significant at the .005 level. As with the DJT, the A-D Line appears to be better at signaling a change in trend when a new low is established on the DJIA than when a new high is established.
81 KI!AJourna WY 1.986

DJU Chi-Squared Tests For the Years 1961-1980
Subsequent Action:
New High
No New High
Column Totals
New Law
No New Low
Column Totals
Trend Continues
Trend Does Not Continue
Column Totals
Does DJU Confirm?
RaW Yes No Total.5
___-_--------------_------------------ ___---------------------w-----e---e--- 142 229
(138.76) (90 2,
(44.::) (28.::) 73
------------------------------------ 183 119
I 302
(X-squared score: 0.792, 1 degree of freedom.
113 162 (108.23) (53.;;)
(48.;;) (24.::) 73
----------------------------------- 157 78
I 235
Chi-squared score: 2.039, 1 degree of freedom.
255 136 391 (247.56) (143.44)
(92.8454, (53.E) 146
,,,,,,,,,,,-,------------------------ 350 197
I 537
(X-squared score: 2.241, 1 degree of freedom.
The expected frequencies are in parentheses and directly below the observed frequencies.
-
82
-.
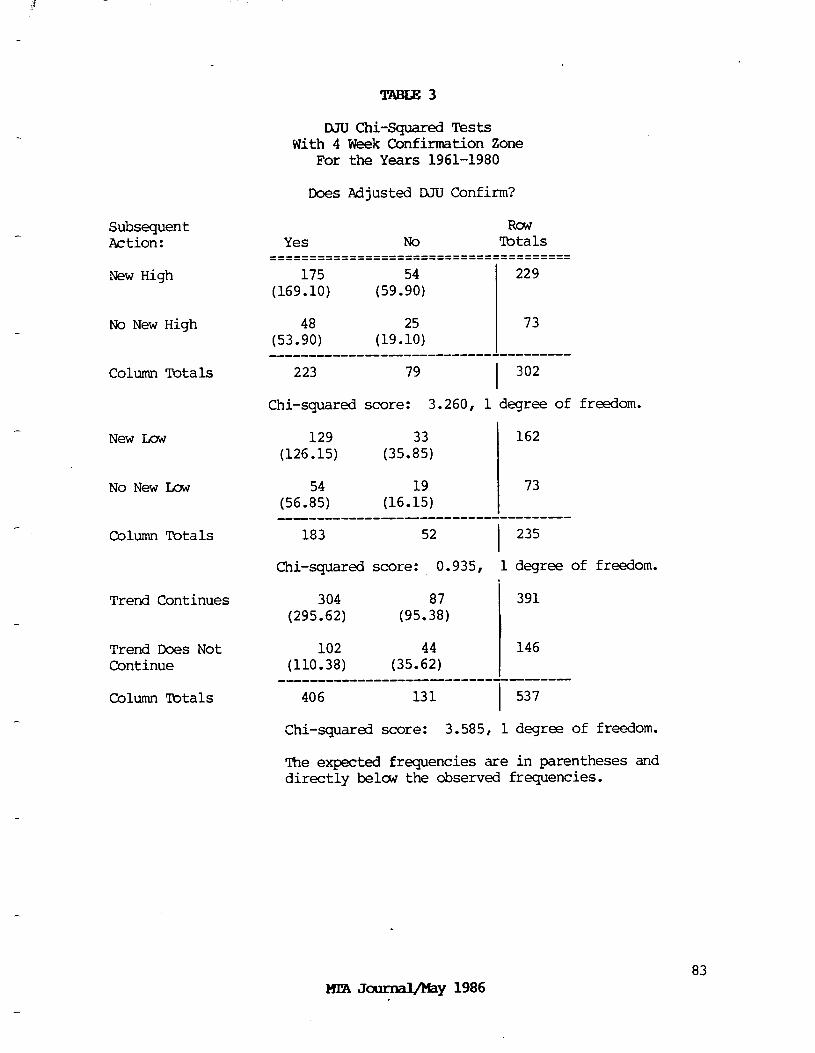
Subsequent Action:
New High
No New High
Column Totals
New Law
No New LQW
Column Totals
Trend Continues
Trend Does Not Continue
Column Totals
DJU Chi-Squared Tests With 4 Week Confirmation Zone
For the Years 1961-1980
Does Adjusted DJU Confirm?
ROW Yes No Totals
---- ==================================---- 175 229
(169.10) (59 2:)
(53.4980) (19.:'0) 73
------------------------------- ----- 223 79
I 302
Chi-squared score: 3.260, 1 degree of freedom.
129 162 (126.15) (35.83:)
(56.85:) (16.:;) 73
_---___---___------------------- 183 52
I 235
C&i-squared score: 0.935, 1 degree of freedom.
304 87 391 (295.62) (95.38)
102 146 (110.38) (35.6424)
--------------------______I___ 406 131
i 537
Chi-squared score: 3.585, 1 degree of freedom.
The expected frequencies are in parentheses and directly belay the observed frequencies.
m!A Jaxnal&ay 1986 83
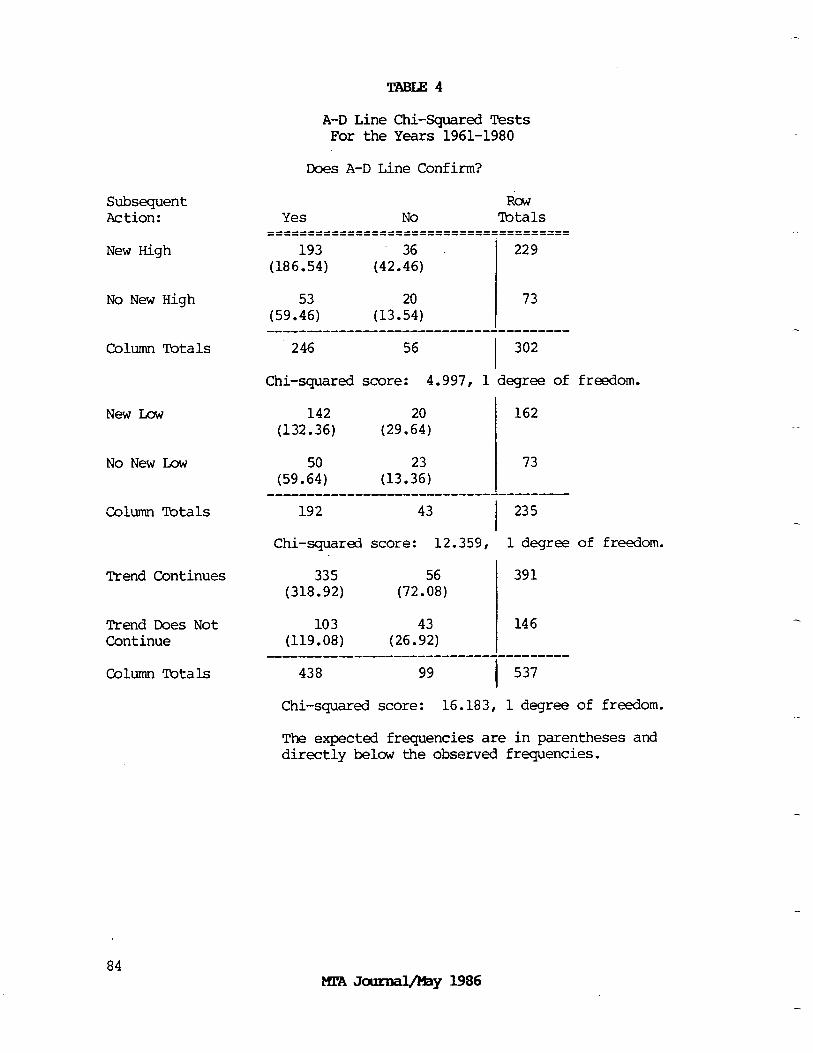
A-D Line Chi-Squared Tests For the Years 1961-1980
Subsequent Action:
New High
No New High
Column Totals
New Low
No New Low
Column Totals
Trend Continues
Trend Does Not Continue
Column Totals
Does A-D Line Confirm?
RoW Yes No Totals
-------------------------------------- ------------------------~~-~~~~~~~~~~~ 193 229
(186.54) (42.::)
(59.2) (13.:",) 73
------------------------------------- 246 56 302
Chi-squared score: 4.997, 1 degree of freedom.
142 162 (132.36) (29.62:)
(59.::) (13.::) 73
__---------------------------------- 192 43
I 235
Chi-squared score: 12.359, 1 degree of freedom.
335 (72.5068)
391 (318.92)
103 146 (119.08) (26.;:)
----------------------------------- 438 99
I 537
Chi-squared score: 16.183, 1 degree of freedom.
The expected frequencies are in parentheses and directly below the observed frequencies.
84
The fourth indicator tested was the cumulative advance-decline line of the week's twenty most active stocks. As shown in Table 5, chi-squared scores of 2.209, 9.110, and 14.316 were calculated for new highs, new lows, and trend continuation respectively. This means that confirmation on the upside was statistically insignificant at the .lO level. However, MAS was statistically significant (alpha = .005) for both new low confirmation and trend continuation.
It might be argued that this indicator is upwardly biased for two reasons. One, high volume is usually associated with higher stock prices, therefore stocks on the MAS list tend to be rising. 'Iwo, takeover candidates "dirty" the list. Let us comment on these two points. While higher volume is usually associated with higher stock prices, the relative volume levels may have changed. In other words, although the MAS are the most heavily traded stocks, if the entire market is trading on lower volume, the MAS will also be trading a relatively fewer number of shares compared to the previous period. For example, according to the New York Stock Exchange, average daily volume was 13.9 million shares in 1974 down from 16.1 million shares in 1973. Thus in 1974, the market and the MAS traded on lower relative volume compared to the previous year. The lower relative volume helps explain the declining stock prices. As far as takeover candidates are concerned, we will just say that merger mania was not as prevalent in the period covered by the study as it has been over the past five years, although it still may have had some effect. A slight upward bias might explain why this indica-tor also seems to be better at signalling reversals when a new low is made on the DJIA.
%>MA
The % > MA from Trendline was the fifth indicator tested. All chi-squared tests showed that the null hypothesis could not be rejected at the .lO level. As shown in Table 6, the chi-squared statistics were 2.123, 0.000, and 0.724 for new highs, new lows, and trend continuation respectively.
The results were not and should not be surprising. This indicator can be used as an overbought/oversold oscillator designed to catch significant in- termediate and long-term moves. Eclipsing a previous high or establishing a lower low did take several months in some cases. The indicator just was not "reacting" fast enough to weekly market changes. Therefore, the test was modified slightly so the indicator would be more sensitive. Following the suggestion of Stan Weinstein, editor and publisher of the Professional Tape Reader, a widely-read market letter, 80/20 parameter levels were established. This means that when the indicator was over 80 percent and then turned down a "sell"or new low was recorded. Conversely, when the indicator went below 20 percent and turned by a "buy" or new high was recorded. Turned up ar-d turned down were defined to be a move of at least five percent in the opposite direction of the preceding trend. Additional- ly, a change of ten percent or more in the opposite direction of the preceding trend between the 80/20 parameter levels. was used to signify a
85 MI24 Joumal&by 1986
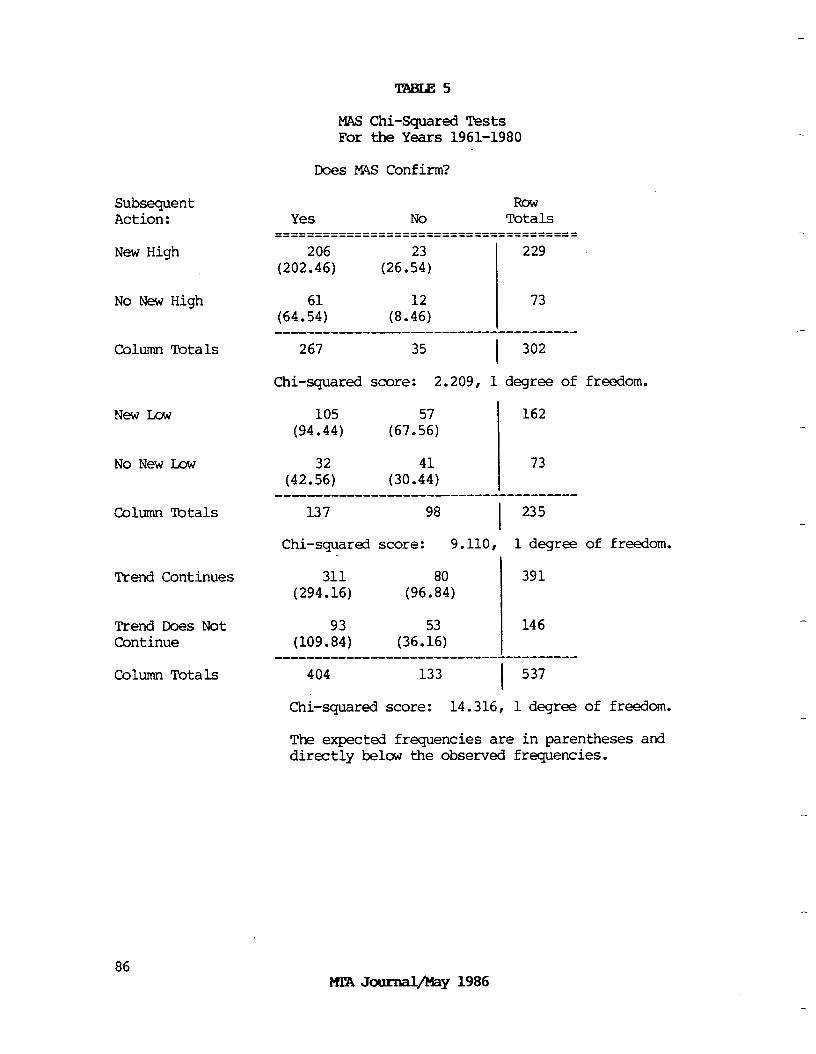
MAS (X-Squared Tests For the Years 1961-1980
Subsequent Action:
New High
No New High
Column Totals
New Low
No New Low
Column Totals
Trend Continues
Trend Does Not Continue
ColumnTotals
Does PI&S Confirm?
Yes No Totals ======================================
206 (202.46) (26.5243,
229
(64.56:) (8.41:) 73
267 35 I
302
Chi-squared score: 2.209, 1 degree of freedom.
105 162 (94.44) (67.5567)
(42.::) (30.4441) 73
---------------------------------- 137 98
I 235
Chi-squared score: 9.110, 1 degree of freedom.
311 391 (294.16) (96.88:)
(109.98:) (36.;;) 146
__---------------------------------- 404 133
1 537
Chi-squared score: 14.316, 1 degree of freedom.
The expected frequencies are in parentheses and directly below the observed frequencies.
86

Subsequent Action:
New High
No New High
Column Totals
New Low
No New Low
Column Totals
Trend Continues
Trend Does Not Continue
Column Totals
% > MA Chi-Squared Tests For the Years 1961-1980
DOS % > MAConfirm?
Row Yes No Totals
----------_-_-_____------------------- --------------------------------------
(88.79:) 136 229
(140.28)
(28.:;) (44.Z) 73
--------------------____I_________- 117 185
I 302
Chi-squared score: 2.123, 1 degree of freedom.
(79.8) (82.80:) 162
(36.3063) (36.393, 73
----------------------------------- 116 119
I 235
Chi-squared score: 0.000, 1 degree of freedom.
174 217 391 (169.65) (221.35)
(63.::) (82.::) 146
-------------------------------- 233 304
I 537
Chi-squared score: 0.724, 1 degree of freedom.
The expected frequencies are in parentheses and directly below the observed frequencies.
87 m'a J-y 1986
new high or new low. If for example, the indicator "bottomed" at 30 percent, then a move above 40 percent would signal a new high.
The chi-squared tests for the adjusted indicator are shown in Table 7. The improvement was dramatic. The new high score of 5.132 is significant at the .025 level. However, new lows were only 90 percent significant with a chi-squared statistic of 3.716. But, there is less than a one percent probability that these events could have occurred by chance when trend continuation is examined since the chi-squared score is 7.353. This adjusted indicator appears to be slightly better at spotting changes in trend when the DJIA makes a new high than when it makes a new low. An ob- vious but important point should be made here. Technical indicators must be used properly if they are to be effective as demonstrated by the adjust- ment of this indicator.
The Composite Indicator
The above analysis showed that only the DJU had no predictive value. The DJT, A-DLine, and MAs appear tobe better at identifying reversals from new lows while the adjusted % > MA appears to be better at spotting rever- sals from new highs. All four indicators are statistically significant for confirmation of and divergence from the trend.
With this in mind, the next logical step would be to take the statistically valid indicators and form a composite indicator. We want to test whether the number of indicators confirming the movement on the DJIA has any rela- tionship to future DJIA movements. The theory as described in Section Two says that the more indicators confirming the movement, the more confident we are of the trend continuing. Conversely, the more indicators diverging from the movement, the more confident we are that a change in trend is at hand.
After checking with Dr. Jeffrey Simonoff, Assistant Professor of Statistics at the Graduate School of Business Administration of New York University, one more contingency table was constructed as shown in Table 8. First we ask how many of the statistically valid indicators confirmed the DJIA move- ment each time the DJIA made a new high or new low. Before presenting the results of the chi-squared test for this contingency table, we should mention a technical point. In cases where some cells have an expected frequency of less than five, it is common practice to combine these cells and subtract one degree of freedom for each cell eliminated before per- forming the chi-squared test. In the top half of Table 8, we notice the second and fourth cells of the first column both have expected frequencies of less than five. Therefore, we combined these two cells and subtracted one degree of freedom in performing the chi-squared test. The resulting score of 32.529 is significant beyond the .005 level of significance. This test confirms the theory. Finally, when trend continuation is tested, an even more impressive chi-squared score of 28.377 with four degrees of free- dom is calculated, significant to beyond the .005 level.
88 MTAJotmdby~86
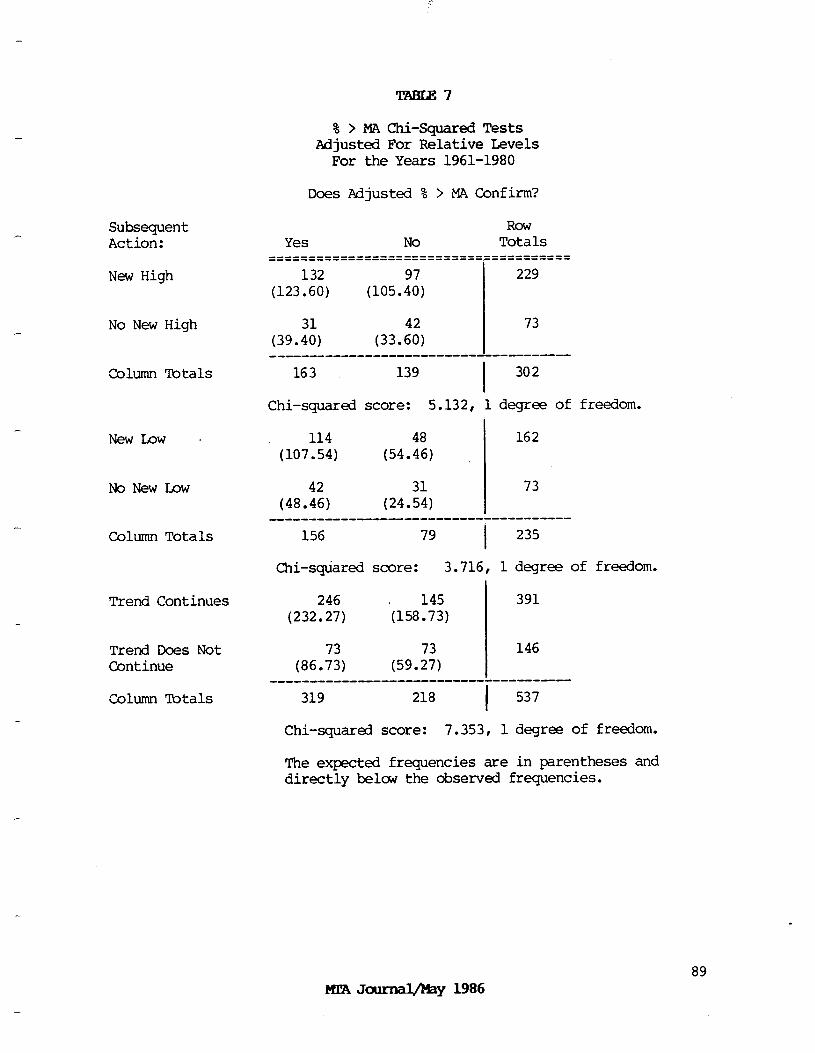
Subsequent Action:
New High
No New High
Column Tbtals
New Low ’
No New Low
Column Totals
Trend Continues
Trend Does Not Continue
Column Totals
% > MA chi-squared Tests Adjusted For Relative Levels
For the Years 1961-1980
Does Adjusted % > MAConfirm?
ROW Yes No Totals
====================================== 132
(123.60) (105.4907) 229
(39.::) (33.6402) 73
--------------------------------- 163 139
I 302
Chi-squared score: 5.132, 1 degree of freedom.
114 162 (107.54) (54.4486)
(48.4426) (24.;:) 73
------------------------------------- 156 79
I 235
Chi-squared score: 3.716, 1 degree of freedom.
246 145 391 (232.27) (159.73)
(86.77:) (59.3:) 146
------------------------------------- 319 218 I 537
Chi-squared score: 7.353, 1 degree of freedom.
The expected frequencies are in parentheses and directly below the observed frequencies.
89
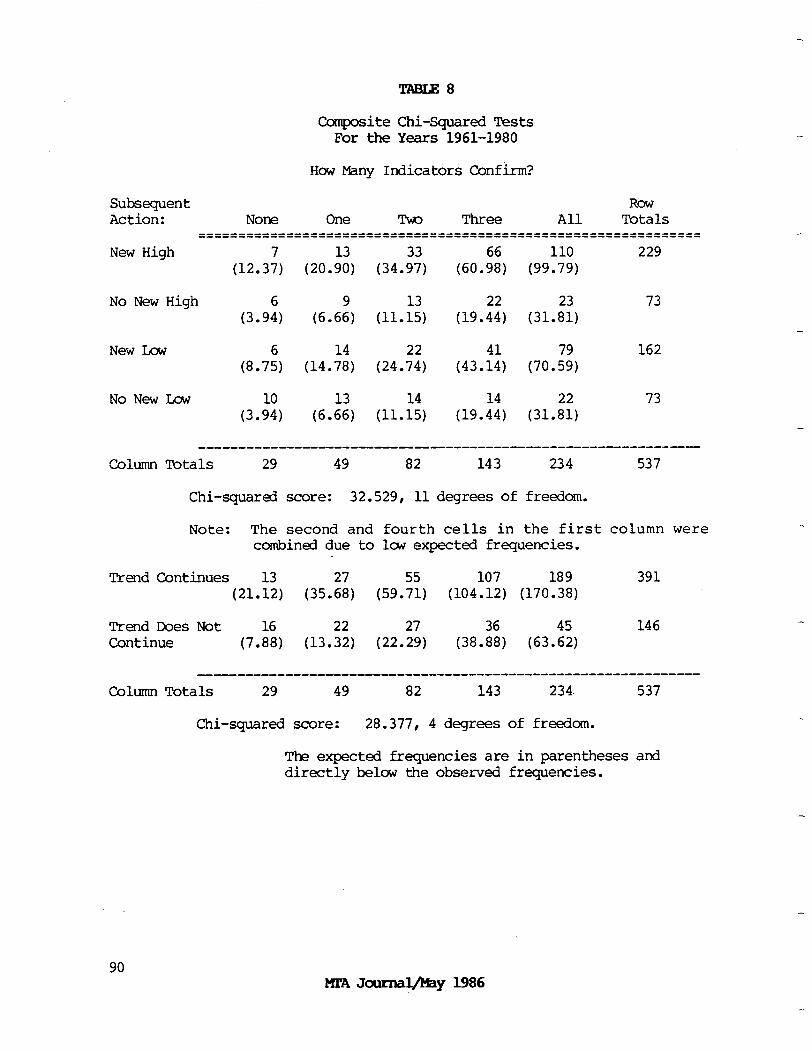
Composite Chi-Squared Tests For the Years 1961-1980
How Many Indicators Confirm?
Subsequent Row Action: None One Three All Totals
-_-_----------------------------------------------------------- ____-_____----------------------------------------------------- New High
(12.3:) (20.;;) (34.93:) (60.::) (99%) 229
No New High
New Low (8.756, (14.;:) (24.7242,
162
No New Law (6.6163, (11.::) (19.41:) (31.8212)
73
----------------------------------------------------------
Column?rotals 29 49 82 143 234 537
Chi-squared score: 32.529, 11 degrees of freedom.
Note: The second and fourth cells in the first column were combined due to law expected frequencies.
Trend Continues (21.:;)
TrendDoes Not Continue
--------------------_---------------------------------------
Column Totals 29 49 82 143 234. 537
Chi-squared score: 28.377, 4 degrees of freedom.
The expected frequencies are in parentheses and directly below the observed frequencies.
90
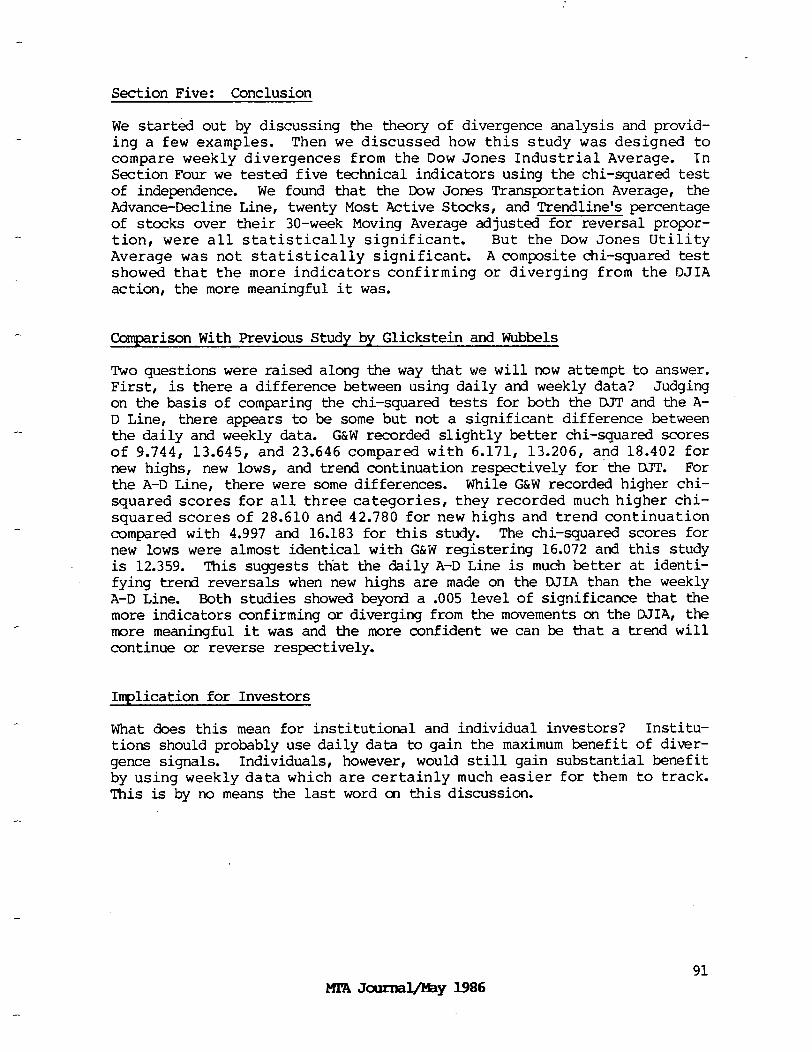
Section Five: Conclusion
We started out by discussing the theory of divergence analysis and provid- ing a few examples. Then we discussed how this study was designed to compare weekly divergences from the Dow Jones Industrial Average. In Section Four we tested five technical indicators using the chi-squared test of independence. We found that the Dow Jones Transportation Average, the Advance-Decline Line, twenty Most Active Stocks , and Trendline's percentage of stocks over their 30-week Moving Average adjusted for reversal propor- tion, were all statistically significant. But the Dow Jones Utility Average was not statistically significant. A composite chi-squared test showed that the more indicators confirming or diverging from the DJIA action, the more meaningful it was.
Comparison With Previous Study by Glickstein and Wubbels
Two questions were raised along the way that we will now attempt to answer. First, is there a difference between using daily ati weekly data? Judging on the basis of comparing the chi-squared tests for both the DJT and the A- D Line, there appears to be some but not a significant difference between the daily and weekly data. G&W recorded slightly better chi-squared scores of 9.744, 13.645, and 23.646 compared with 6.171, 13.206, and 18.402 for new highs, new lows, and trend continuation respectively for the DJT. For the A-D Line, there were some differences. While G&W recorded higher chi- squared scores for all three categories, they recorded much higher chi- squared scores of 28.610 and 42.780 for new highs and trend continuation compared with 4.997 and 16.183 for this study. The chi-squared scores for new lows were almost identical with G&W registering 16.072 and this study is 12.359. This suggests that the daily A-D Line is much better at identi- fying trend reversals when new highs are made on the DJIA than the weekly A-D Line. Both studies showed beyond a .005 level of significance that the more indicators confirming or diverging from the movements on the DJIA, the more meaningful it was and the more confident we can be that a trend will continue or reverse respectively.
Implication for Investors
What does ~this mean for institutional and individual investors? Institu- tions should probably use daily data to gain the maximum benefit of diver- gence signals. Individuals, however, would still gain substantial benefit by using weekly data which are certainly much easier for them to track. This is by no means the last word on this discussion.
91 Ml'AJoumaljhy1986
See Edwards and Magee Technical Analysis of Stock Trends for an excel- lent book on classical technical analysis.
Both cumulative indicators (A-D Line and MAS) had starting values of zero on January 1, 1961.
See Glickstein and Wubbels (G&W) for a complete description of their study.
See Hamburg for a good, non-technical, basic statistics book.
Since G&W used daily data, they looked for confirmation to occur within five trading days. Because we are using weekly data in this study, confirmation was looked to take place within one week.
Edwards,RobertD.and John Magee. Technical Analysis of Stock Trends, Fifth Edition. Boston, Mass.: John Magee Inc., 1966.
Glickstein, David A. and Rolf E. Wubbels. "Dow Theory Is Alive and Well!" Journal of Portfolio Management, Spring, 1983.
Hamburg, Morris. Basic Statistics: A Modern Approach, Third Edition. New York, N.Y.: Harcourt Brace Jovanovich, Inc., 1985.
Trendline's Daily Action Stock Charts (A Division of Standard and Poor's).
Weinstein, Stan. How To Use Long-Term Indicators To Spot Major Changes in Trend. Hollywood, Fl.: Professional Tape Reader, 1977.
Joseph F. Kalish is a student in The New York University Graduate School of Business Administration. This study was funded by a student-research grant provided by the MARKET TECHNICIANS ASSOCIATION.
-
92

bY
BRUCE M. KAMICH
On June 14, 1979, Stan Weinstein introduced a new and simple indicator which he and his service, The Professional Tape Reader, developed and called the Last Hour Indicator. The Last Hour Indicator is constructed by cumulating the net point change in the Dow Jones Industrial Average between 3 pm,EST (when the bond futures market closes) and the 4 pm closing bell of
I the Stock Exchange and plotting this cumulative net change line against the Dow. Stan noted that these two series usually moved together, but that certain divergences occurred that were "quite predictive."
For six years, I though about applying this simple approach to the futures market. (The assumptions on which this indicator is based should not be unique to bonds or stocks so students of technical analysis could try this approach on other markets). Because of my involvement with the financial futures sector these past three years, I elected to apply this idea to the Treasury Bond futures market with a slight change. I.chose to use the last half hour of the day instead of Stan's last hour approach.
What is the logic behind The Last Hour Indicator? Why does it work? Let me quote from Stan's original letter: "In our opinion, the last hour of trading is the most important of the day and truest indication of both the Specialists' and Traders' intentions. The Specialists try to balance them- selves off and get their books set for the next day's business, and the traders usually make their moves at this point since they know that early trading is filled with alotof public orders, and they realize there are too many cross currents at that point to get a true reading of the tape."
Like the Iast Hour Indicator, the basic idea behind my Last Half-Hour Indi- cator is that day trading and activity by locals, professional traders or scalpers can influence the market during the day by running stops or going against small outside paper orders (like the odd lotter in stocks). Inves- tors who keep their positions overnight are more important to lasting trends. An important part of our basic line of thinking is that the settlement or close in the futures market is not just the last trade at the bell, but the summation of all knowledge, fears, and hopes - the best estimate of the worth of that item that day. "Iocals" who might trade very heavily during the day for their own account many times hold only very small positions overnight. The large amount of day trading in futures can be seen particularly in bonds where the day's volume can equal the entire open interest. This would be like a stock's daily volume being equal to its total number of shares outstanding!
In addition, many of the computerized or mechanical trading systems use closing prices as the basis of their signals. The high leverage and same day settlement in futures gives added importance to the close of futures trading. Accounts are rebalanced every day. Futures traders know from ex-
93 MCAJaxr&&ay 1986
perience that an hour in the futures market can seem like an eternity, especially when you have a bad position. Due to the low transactions costs both from tight spreads and low commissions and the high liquidity of the bond futures market, the last half-hour of trading is enough time for the locals to square their positions.
Since the beginning of 1986, I collected and cumulated the net change (in 32nds) for the last half-hour of trading for the nearest bond contract. After collecting and plotting this data in "real-time" for two months, I was encouraged by the results to go back a full twelve months. The charts at the end of this article show TheLast Half-Hour Indicator since March 1985.
You can notice how The Last Half-Hour Indicator trended higher throughout March, April, May, and most of June 1985. The uptrend was broken on June 24, 1985 as bonds declined from a minor double top. Though bonds rallied a third time to retest the May highs, The Last Half-Hour Indicator did not confirm this move. The Last Half-Hour Indicator made a new high on August 26, 1985, long before bonds made a new high in early November 1985. The Last Half-Hour Indicator and futures continued to advance until December 23, 1985 when the August - December uptrend was broken. This preceded the sharp break in bond prices in early January of this year. The LastHalf- Hour Indicator made a small double bottom in the week of January 13, 1986 and advanced to new highs along with the bond market. So far in March of this year, The LastHal+Hour Indicator declined steadily and made a new low below the levels recorded in mid-January.
Conclusion: Unless The Last Half-Hour Indicator bottoms and rallies to new highs, a period of weak bond prices should lie just ahead of us based on my readings of The Last Half-Hour Indicator.
Acknowledgments
I wish to thank the following for their help in preparing this article.
Rita Berg and Stan Weinstein of the Professional Tape Reader, and Larry Laterza of Merrill Lynch Pierce Fenner & Smith, Inc.
Bruce Kamichis a technical analyst for MCM, a Xerox Financial Services Company, which specializes in providing fixed income research and consult- ing services. Bruce contributes his technical views to the .Money Market Critique and is responsible for their new technical video product called Yieldwatch.
94
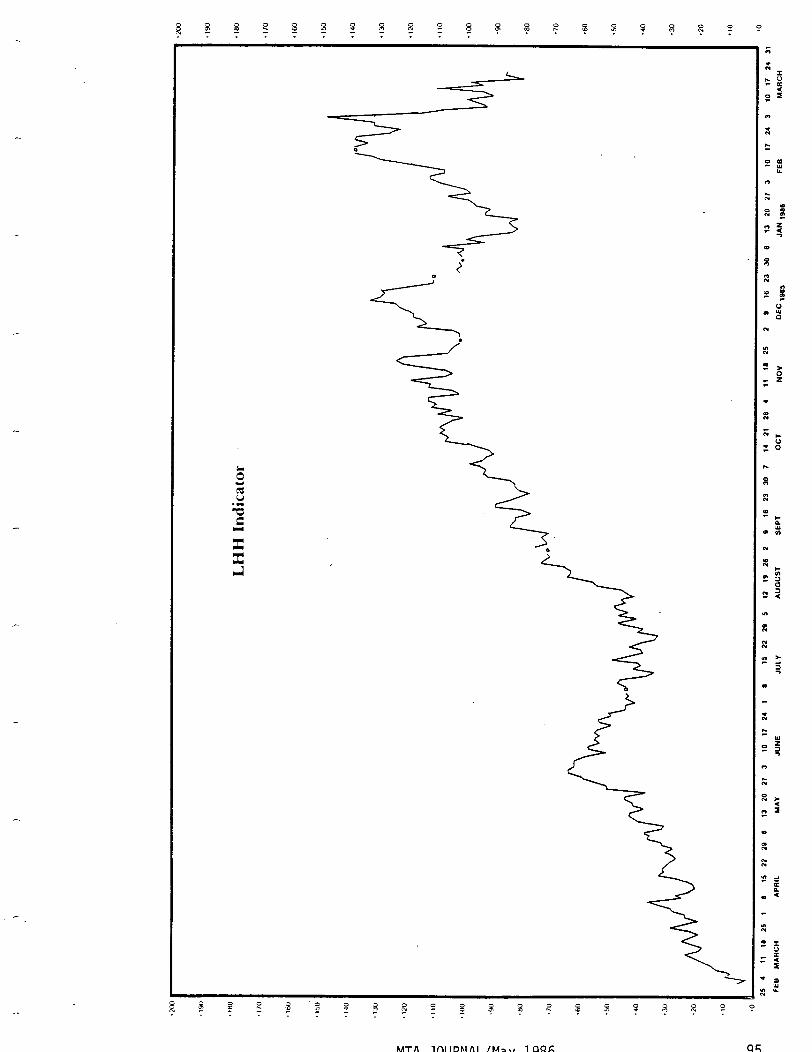
-.
R 0 3 x 3 % R s i:
MTA JOURNAL/May 1986 95