journal physiology with printed in great · pdf file17 ofthe cat's visual cortex. ......
TRANSCRIPT

Journal of Physiology (1988), 399, pp. 657-675 657With 8 text-figures
Printed in Great Britain
LATERAL INTERACTIONS AT DIRECTION-SELECTIVE STRIATENEURONES IN THE CAT DEMONSTRATED BY LOCAL
CORTICAL INACTIVATION
BY ULF TH. EYSEL*, THOMAS MUCHE AND FLORENTIN WORGOTTERFrom the Department of Physiology, University of Essen, Hufelandstrasse 55,
D-4300 Essen 1, F.R.G.
(Received 25 March 1987)
SUMMARY
1. Single neurones were recorded with glass-coated tungsten electrodes from area17 of the cat's visual cortex. The cats were anaesthetized and artificially respiratedwith a mixture of halothane, nitrous oxide and oxygen.
2. For local cortical inactivation a multibarrel pipette was placed 0-5-2-5 mmposterior (or anterior) to the recording site, at a depth of 400-600 ,um. Four separatebarrels of the pipette were filled with y-aminobutyric acid (GABA); the fifth wasfilled with Pontamine Sky Blue for labelling of the centre of the inactivation site.
3. Direction-selective cells, of differing optimal orientations and preferreddirections of motion, were classified as simple or complex and tested with computer-controlled stimuli presented on an oscilloscope.
4. During continuous recording GABA was microionophoretically applied fordifferent durations and with different ejection currents. The effectiveness of GABAmicroionophoresis was evident from the direct GABAergic effects (strong overallinhibition of the recorded cells) observed with high ejection currents and prolongedapplication.
5. Two discrete effects could be observed during local inactivation distant fromthe cortical cell under study: an increase of the response in either the non-preferredor the preferred direction; or a decrease of the response in the preferred direction. AllGABA-induced changes were reversible.
6. The depressant action of GABA was independent of the relative topographybetween recording and inactivation site and affected mainly the response to thepreferred direction of stimulus motion.
7. Disinhibition was only observed when the stimulus-evoked response moved onthe cortical map in a direction from the GABA pipette towards the recordingelectrode. It is concluded that GABA reversibly silences inhibitory interneuronesthat are situated in the vicinity of the micropipette tip and are involved in generationof direction selectivity.
8. No fundamental differences between cells from different cortical layers wereobserved. The disinhibitory effects ofGABA inactivation were more pronounced and
Present address for all authors: Department of Neurophysiology, Ruhr-Universitiat Bochum,MA 4/149, Universitatsstrasse 150, D-4630 Bochum 1, F.R.G.
* To whom reprint requests should be sent.

U. T. EYSEL, T. MUCHE AND F. WORGOTTER
more frequently seen in simple cells (61 %) than in complex cells (38%), while theopposite was true for reduced excitation during lateral GABA inactivation (observedin 62% of the complex vs. 39% of the simple cells). Accordingly, lateral inhibitionstatistically prevails in simple cells and lateral excitation in complex cells.
9. Among the inhibitory and excitatory mechanisms affected by lateral GABAinactivation, inhibition is organized with a higher topographic specificity. It issuggested that the inhibitory elements involved in direction selectivity are spatiallydirected and located in or activated via the upper cortical layers.
INTRODUCTION
Direction specificity is one of the earliest described characteristic properties ofvisual cortical cells (Hubel & Wiesel, 1962). Such cells display a strong preference forthe direction of motion of an optimally oriented stimulus. This property is absent oronly weakly present amongst geniculocortical afferents, but is strongly expressed bycortical cells in layers receiving direct geniculate input (layers IV and VI). Therefore,directionality must be generated at an early stage of intracortical processing.
Postsynaptic inhibition has been suggested as the underlying mechanism fordirection selectivity of visual cortical cells (Benevento, Creutzfeldt & Kuhnt, 1972;Innocenti & Fiore, 1974). This has been supported by the evidence that blockade ofGABAergic inhibition abolished direction specificity in many cells (Sillito, 1977).Several models based on intracortical inhibition have been suggested (Sillito, 1979;Barlow, 1981; Ganz & Felder, 1984; Koch & Poggio, 1985) but excitatoryconvergence has also been proposed as a source of direction selectivity in complexcells (Movshon, Thompson & Tolhurst, 1978).
It has been shown that direction selectivity is not dependent on the spatialarrangement of 'on' and 'off' subregions (Ganz & Felder, 1984; Peterhans, Bishop& Camarda, 1985). Detailed physiological studies (Goodwin, Henry & Bishop, 1975;Emerson & Gerstein, 1977; Ganz & Felder, 1984) have shown inhibitory effects indirection selectivity and imputed the presence of a mechanism within the staticdischarge region with a small lateral spread of between 0-125 and 0-5 deg in receptivefields within 5-10 deg of the visual axis. Incidental observations indicate thepossibility of suppressive regions outside the classical discharge region of a direction-selective cell (Glezer, Tsherbach, Gauselman & Bondarko, 1982).The intracortical mechanisms and pathways involved in direction selectivity are
far from clear. Detailed analyses have provided information about correlationsbetween cell types and cellular morphology (Gilbert & Wiesel, 1979; Martin &Whitteridge, 1984) and vertical and horizontal excitatory connections have beendemonstrated with anatomical and physiological methods (Ferster & Lindstrom,1983; Gilbert, 1983, 1985; Ts'o, Gilbert & Wiesel, 1986). Seven different types ofinhibitory, GABAergic interneurones have meanwhile been distinguished in the cat'svisual cortex (Somogyi, Kisvarday, Martin & Whitteridge, 1983; Somogyi, 1986) andthe functional significance of GABAergic inhibition in the cortex has been clearlydemonstrated (Sillito, 1975, 1977, 1979). However, experimental evidence directlyassessing topography and function of connections between visual cortical neuronesis rare. With local GABA inactivation of layer VI Bolz & Gilbert (1986) have shown
658

DIRECTION SELECTIVITY AND CORTICAL INHIBITION
loss of end-inhibition in layer IV cells, which might be related to inhibitoryconnections demonstrated between layer VI and layer IV cells (McGuire, Hornung,Gilbert & Wiesel, 1984). Direction selectivity and orientation specificity wereapparently not mediated by this pathway. In our first approach to studyingintracortical mechanisms of direction selectivity, we have applied local heat lesionsto the upper cortical layers and abolished direction selectivity in single area 17simple cells by inactivation of lateral inhibition (Eysel & Worg6tter, 1986).The present experiments have applied GABA microionophoresis in the upper
layers of area 17, in order reversibly to induce local cortical inactivation posterioror anterior to the recording sites and thereby to silence the cortical elementssurrounding the injection site. Our aims have been to investigate the contributionsof topographically specified excitatory and inhibitory lateral cortical interactions tothe direction specificity of simple and complex cells, to differentiate andquantitatively relate these interactions to the two cell types, and finally to gain someinsight into the topography of cortical interactions, in an attempt to identify theunderlying, intracortical pathways involved in direction selectivity.
METHODS
Preparation and maintenance of animal8Sixteen adult cats (2-5-5-0 kg) were used. The animals were initially anaesthetized with ketamine
hydrochloride (20-25 mg kg-' I.M.). The head was fixed in a stereotaxic head-holder with xylocainecream applied to all pressure points. The skull was opened to allow access to area 17 of the visualcortex in both hemispheres between Horsley-Clarke co-ordinates PO-P6 and L0O5-L3-5. Thefemoral artery was cannulated for continuous measurement of arterial blood pressure and heartrate. Following the initial dose of ketamine hydrochloride, the anaesthesia was maintained byartificial respiration with N20:02 (70:30) with the addition of 0-2-0-5% Fluothane to ensureadequate anaesthesia. The blood pressure, heart rate and EEG were used to monitor the depth ofanaesthesia, which could be adjusted by the level of added Fluothane. A continuous infusion ofd-tubocurarine (0 3 mg kg-' h-1) and gallamine triethiodide (4 0 mg kg-' h-') in a glucose (1I25 %)and Ringer solution was given throughout the 2-3 day experiments. The mean arterial bloodpressure remained constant at approximately 100 mmHg, no sudden rises in heart rate occurredand the synchronized EEG displayed 8-waves. The end-expired CO2 was held at 3-8 %. Rectaltemperature was kept constant at 38-5 IC. Atropine sulphate (1 %) was applied to the eyes formydriasis, and phenylephrine hydrochloride (5 %) for retraction of the nictitating membranes andeyelids. The corneae were covered with zero-power contact lenses with vertical slit pupils.Refraction was assessed with a refractoscope (Heine) and corrected with lenses for a viewingdistance of 0-25 m.
Recording8 and microionophoresi8SGlass-coated tungsten microelectrodes were used for recording from layers III-VI of the cortex.
The electrodes had a tip diameter of approximately 1 ,um, and the impedance was adjusted to10 MCI by reopening the tip with hydrofluoric acid during measurement with a microelectrodeadmittance meter (Corti, Switzerland). Four barrels of a multibarrel micropipette were used formicroionophoresis of GABA (0 5 M, pH 3 0); the remaining barrel was filled with a solution of 2%Pontamine Sky Blue in 0 5 M-sodium acetate. The tip of each barrel had a diameter of 2-3 um toprevent clogging during long recording sessions. These large tips, however, made single-cellrecordings with the pipette impossible. Retaining and ejection currents were controlled with aNeurophore-2 (Medical Systems Corp., U.S.A.). Ejection currents were increased, as necessary, forperiods of up to 1 h, starting at 20 nA. Total currents were kept below 400 nA to avoid tissuedamage due to electrolytic lesions.
Prior to recordings, in thirteen experiments the microionophoresis pipette was placed in area 17,posterior to the recording site on the apex of the gyrus, at a depth of approximately 400-60 ,um.
659
U. T. EYSEL, T. MUCHE AND F. WORGOTTER
The pipette was kept in place until the end of the recording session. Recordings were made fromarea 17 cells with receptive fields (RFs) within 5 deg of the area centralis. The recording sites werebetween 500 and 2500 ,um anterior to the microionophoresis injection site, as measured across thecortical surface. In two control experiments the arrangement of injection and recording sites wasinverted, placing the pipette similar distances anterior to the recording electrode.The end of individual recording tracks was marked by small electrolytic lesions (2-4 ,uA, 10 s,
electrode negative) and the position of the pipette was labelled with Pontamine Sky Blue (4 ,uA,8 min, electrode negative) after each recording session.
Visual stimulationVisual stimuli were generated by a cathode ray tube image generator ('Picasso', Innisfree,
U.S.A.) and presented on an oscilloscope 0-25 m in front of the cat's eyes. For stimulation of visualcortical cells light and dark bars moving back and forth across the RF with constant velocities wereadjusted in width and length and orientation to evoke optimal responses. Background illuminationand dark bars had a luminance of 0-25 cd m-2; luminances of light bars could be varied between 1P0and 12-5 cd m-2. A pseudo-random sequence was used to change the stimulus orientation bymultiples of 30 deg. Velocity and contrast were individually adjusted to obtain maximumresponses.
Classification of cellsCells were classified as belonging to the S-group (simple) or C-group (complex), respectively,
according to schemes proposed by Kato, Bishop & Orban (1978), and Henry, Harvey & Lund(1979). Intermediate classes A and B (Henry et al. 1979) were not distinguished. S-cells wereclassified by their small RFs (width < 1 5 deg) with non-overlapping 'on' and 'off' regions. Inaddition, the criteria of low spontaneous activity and strong orientational tuning were used.Preliminary classification was performed by hand-held stimuli on a plotting board in front of thecat and confirmed by quantitative analysis of the discharge regions with moving light and darkbars as seen in peristimulus time histograms (PSTH). In cells with end-inhibition, stimulus lengthwas adjusted to obtain maximal responses.
Data analysisThe initialization of the stimulus sweeps, data acquisition and analysis were performed on-line
by a digital computer (LSI-11/23, Digital Equipment Corp., U.S.A.) via laboratory interface(Cambridge Electronic Design, U.K.). Peristimulus time histograms were computed for at least fivesweeps (back and forth movement) for each orientation. Peak response rates derived from each halfof the histograms were used to generate polar plots (Fig. 2B) in which the impulse rate per secondwas plotted as vector length, and the direction of stimulus movement as vector angle, in the polarco-ordinate system.
Histological verificationAll animals were fixed by intra-arterial vascular perfusion with 4% phosphate-buffered
paraformaldehyde (pH 7-4) at the end of the experiment, under deep halothane anaesthesia.Pontamine Sky Blue injections and electrocoagulations were identified in frozen sections of 50 /,m,counter-stained with Cresyl Violet.
RESULTS
Retinotopic relationship between recording and microionophoresis sitesTo simplify the interpretation of the results described in the following sections
Fig. 1 shows an outline of the topographical transformations of a visual stimulusperformed by area 17 of the visual cortex. The visual field (Fig. 1A) is projectedretinotopically in a continuous way onto area 17 (Fig. 1 B; Bilge, Bingle, Seneviratne& Whitteridge, 1967; Tusa, Palmer & Rosenquist, 1978) so that a stimulus movingdownward in the visual field on its trajectory (S, Fig. 1A) elicits a response wavetravelling from posterior to anterior in the cortex (R, Fig. 1C). Assuming that the
660

DIRECTION SELECTIVITY AND CORTICAL INHIBITION
recorded cell (C, Fig. 1 C) responds optimally to horizontal stimulus orientation andvertical movement but shows direction asymmetry, the directional tuning of the cellcould arise either from excitatory or inhibitory intracortical influences involvingneuronal elements along the trajectory of the elicited response wave (R). With anelectrode configuration as schematized in Fig. 1C (recording electrode anterior toGABA pipette) inactivation due to GABA microionophoresis affects cells posterior to
A BLeft visual field 270 Visual cortex
Up Lat.
Up/ 1 ~~~~~Ant. L Post.
Ant._L Recording electrode()/ < } GABA pipette
180 RFc 0 C
Anterior Posterior
S
Down 90
Fig. 1. Topographical transformations of a visual stimulus by area 17 of the visual cortexand juxtaposition of recording and inactivation sites. A, left visual field. St. = stimulusbar, S = stimulus trajectory, RFc = receptive field of a cell C, circle = retinotopicrepresentation of the region inactivated by GABA microionophoresis. B, dorsal view ofthe right hemisphere of cat cortex. S = suprasylvian sulcus, L = lateral sulcus. Theborder between area 17 and area 18 is indicated by the dotted line. The area in the smallrectangle was exposed during the experiments (asterisk = representation of the areacentralis). C, schematic drawing of area 17 with the electrode arrangement formicroionophoresis and recording used in most of the experiments. C = recorded cell,R = response wave in the cortex elicited by stimulus movement along S, circle = regioninactivated during GABA application.
the recorded cell. Retransformed into the visual field the affected region representsreceptive fields situated above the receptive field RFc of cell C (circles).
This arrangement, in principle, allows one to investigate excitatory and inhibitoryintracortical interactions related to directional tuning under the following conditions.If cell C displays a direction preference for downward movement (90 deg), this couldbe based on a predominance of intracortical excitation from regions retinotopicallyabove RFc. GABA-induced inactivation of the corresponding cortical region couldthen reduce lateral excitation and the response to stimulus St. moving along S shoulddecrease leading to diminished direction selectivity. If, on the other hand, cell Cshows a direction preference for 270 deg (upward movement) this could be due toinhibitory influences during downward movement from cortical regions posterior to
661
U. T. EYSEL, T. MUCHE AND F. WORGOTTER
cell C. In this case GABA microionophoresis could inactivate inhibitory elementsacting at cell C, leading to a loss of directional selectivity by an increase of theresponse to stimulus St. Any influences from elements anterior to cell C should notbe affected.
In thirteen experiments the electrode configuration was as shown in Fig. 1. In twoexperiments we inverted the configuration.
A100
60 deg
00 5 0 5 0 5
Time (s)B
O deg
90 deg
Control GABA Recovery
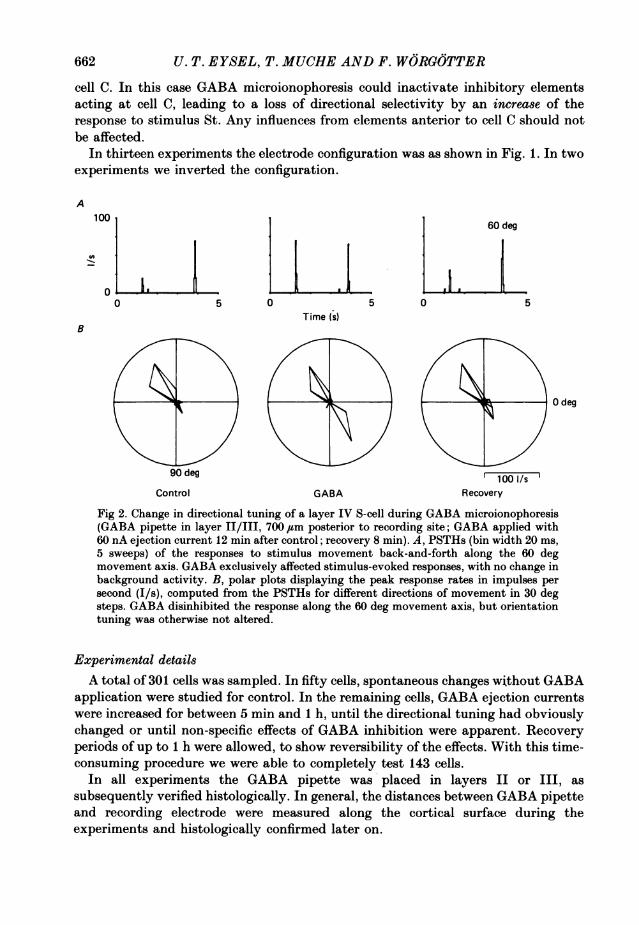
Fig 2. Change in directional tuning of a layer IV S-cell during GABA microionophoresis(GABA pipette in layer II/III, 700 ,um posterior to recording site; GABA applied with60 nA ejection current 12 min after control; recovery 8 min). A, PSTHs (bin width 20 ms,5 sweeps) of the responses to stimulus movement back-and-forth along the 60 degmovement axis. GABA exclusively affected stimulus-evoked responses, with no change inbackground activity. B, polar plots displaying the peak response rates in impulses persecond (I/s), computed from the PSTHs for different directions of movement in 30 degsteps. GABA disinhibited the response along the 60 deg movement axis, but orientationtuning was otherwise not altered.
Experimental detailsA total of 301 cells was sampled. In fifty cells, spontaneous changes without GABA
application were studied for control. In the remaining cells, GABA ejection currentswere increased for between 5 min and 1 h, until the directional tuning had obviouslychanged or until non-specific effects of GABA inhibition were apparent. Recoveryperiods of up to 1 h were allowed, to show reversibility of the effects. With this time-consuming procedure we were able to completely test 143 cells.
In all experiments the GABA pipette was placed in layers II or III, assubsequently verified histologically. In general, the distances between GABA pipetteand recording electrode were measured along the cortical surface during theexperiments and histologically confirmed later on.
662

DIRECTION SELECTIVITY AND CORTICAL INHIBITION
A
1501/sB
300I/s
C
300 I/sControl GABA Recovery
Fig. 3. Change in the directional bias of several layer IV S-cells with different initialdirectionality and using different relative arrangements of recording and GABAelectrodes. A, cell with upward preferred direction developing a response to downwardmovement and thereby losing directionality (GABA pipette in layer II/III, 700 fumposterior; GABA with 160 nA ejection current 4 min after control; recovery 4 min). B,cell with no direction preference developing increased response to upward movementduring GABA microionophoresis (note inverted electrode arrangement: GABA pipette inlayer II/III, anterior, distance 1400,um; GABA injection current 80 nA 16 min aftercontrol; recovery 20 min). C, preferred response to downward movement is increased inthis cell during posterior GABA inactivation. (GABA pipette in layer II/III, 1900 ,umposterior; GABA application with 40 nA ejection current 4 min after control; recovery12 min.)
Disinhibitory effects of local lateral inactivation by GABA microionophoresisLayer IV S-cells. In all cases we compared the resulting polar plots with the PSTHs
used for computation. This enabled us to distinguish between specific changes indirectionality and non-specific effects such as changes of activity not related to thevisual stimulus.
663

U. T. EYSEL, T. MUCHE AND F. WORGOTTER
Figure 2 shows an example of a layer IV S-cell, direction selective for movementobliquely upwards. The GABA pipette was placed posterior to the recording site,thus influencing cells activated before the recorded cell when the stimulus moved inthe non-preferred direction. The cell displayed a clear loss of directionality duringGABA microionophoresis, with an increased response to motion in the non-preferreddirection (Fig. 2 B; 60 deg). This change of the response characteristic was limited tothe stimulus-evoked discharge (Fig. 2A). No increase in spontaneous activity orresponse to other directions of movement was observed (Fig. 2B). The effect was
100 I/sControl GABA Recovery
Fig. 4. GABA effects in layer VI. A direction-insensitive layer VI S-cell developed adirectional preference for 60 deg during GABA microionophoresis (GABA pipette in layerII/III, 2350,m posterior; GABA (60 nA) 40 min after control; recovery 40 min).
obtained with an ejection current of 60 nA 12 min after the control recording. Thetime necessary for complete recovery after GABA application was 8 min.The specific response of this cell seems to rely on two main contributions: an
orientationally tuned excitation with optimal orientation perpendicular to the 60-240 deg axis of movement and an effective inhibitory input from the more posteriorcortex that suppresses the response for downward movement (60 deg direction). Theinhibition is removed by local GABA inactivation posterior to the cell, releasing aresponse for 60 deg equal to that for 240 deg.Another example of a layer IV S-cell (from the same penetration as before) is
shown in Fig. 3A. Again the strong directional preference for 240 deg initiallypresent is reduced, due to an increased response in the non-preferred direction(60 deg) during the application of GABA (Fig. 3A). The cell shown in Fig. 3B wasinvestigated with the inverted electrode configuration (GABA pipette anterior). Thiscell initially displayed almost no directional preference, but developed a markedpreference for approximately 300 deg, as was to be expected if inhibition fromelements anterior to the cell had been abolished. Already existing directionpreferences could even be accentuated by local GABA-induced inactivation. In a cellwith a direction preference for 90 deg (Fig. 3C, GABA pipette posterior), the alreadystrong response to downward motion was enhanced during GABA application.Such disinhibitory effects due to inactivation of inhibitory elements by GABA
microionophoresis could be demonstrated in many cells with a vertical axis ofpreferred movement. Regardless of their initial directionality (90 or 270 deg) andstrength of directional tuning it was always the downward direction of motion that
664

DIRECTION SELECTIVITY AND CORTICAL INHIBITION
was disinhibited if the GABA pipette was posterior to the recorded cell (Figs 2A and3A and C). On the other hand, the upward direction of motion was disinhibited if theinactivation was anterior to the cell (Fig. 3B).
Layer VI S-cells. As all other layers - directly or indirectly - receive inputs fromlayer IV, one might expect that the disinhibitory effects described above would beat least to some extent reflected in the cells of other layers.A layer VI S-cell (GABA pipette 2350 ,um posterior, Fig. 4) was affected in the
same way as the layer IV S-cells in the previous examples. The ejection current was
150 I/s
Control GABA Recovery
Fig. 5. GABA effects in a C-cell. Directionally tuned layer III C-cell with loss ofdirectionality and increased response to 60 deg stimulus movement following GABAapplication. The overall responsiveness of the cell was also increased, leading to reducedorientation tuning. (GABA pipette in layer II/III, 1000 #rm posterior; GABA (40 nA)16 min after control; recovery 8 min.)
increased up to 60 nA over a period of 40 min. The weak direction preference forupward movement was reversed by GABA application and, during recovery, theoriginal response returned. The long time necessary for the GABA effect to developin this case may be due to the large distance between recorded cell and GABApipette. Diffusion of GABA over a certain distance might be necessary to reach therelevant inhibitory elements. Irrespective of this observation, layer VI cells weregenerally less easily influenced and often exhibited only minor effects compared withlayer IV cells.
C-cells. Figure 5 shows a layer III C-cell. This cell responded with a clear preferencefor upward movement. During GABA application (GABA pipette posterior),direction selectivity was abolished, with an increase of response in the originallynon-preferred direction of motion. In addition, this C-cell displayed a significantincrease in overall responsiveness. Both effects proved reversible after cessation ofGABA microionophoresis. In most of the tested C-cells, unspecific effects were mixedwith specific changes in directional tuning. Overall, disinhibition leading to anincrease in spontaneous activity was observed almost as frequently as an overallreduction of responsiveness.
The depressant influence of lateral GABA microionophoresisIn the previous sections we have described the disinhibitory actions of lateral
GABA inactivation on cells with preference for vertical movement, independent of
665
U. T. EYSEL, T. MUCHE AND F. WORGOTTER
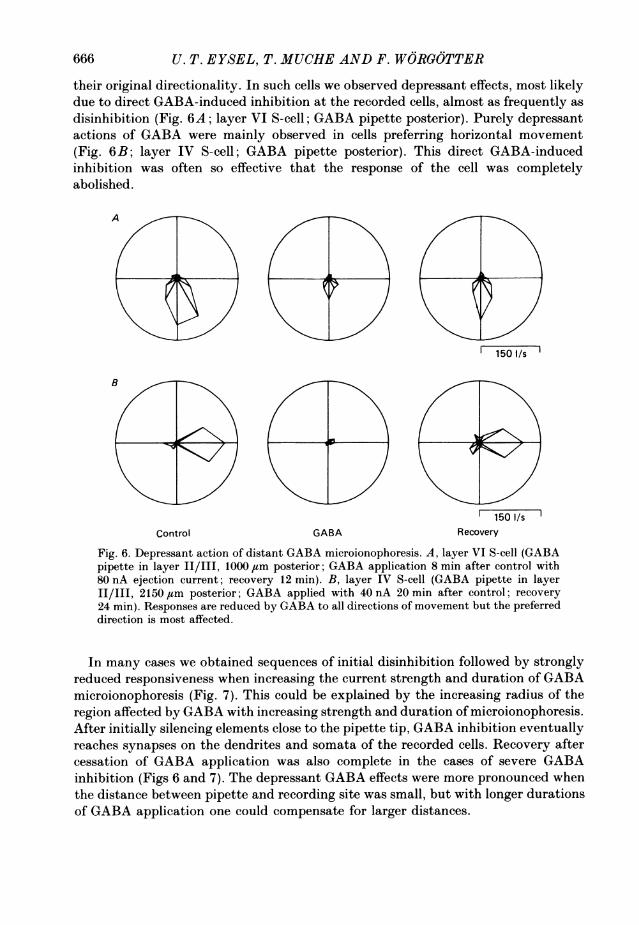
their original directionality. In such cells we observed depressant effects, most likelydue to direct GABA-induced inhibition at the recorded cells, almost as frequently asdisinhibition (Fig. 6A; layer VI S-cell; GABA pipette posterior). Purely depressantactions of GABA were mainly observed in cells preferring horizontal movement(Fig. 6B; layer IV S-cell; GABA pipette posterior). This direct GABA-inducedinhibition was often so effective that the response of the cell was completelyabolished.
A
B
Control GABA150 I/s
Recovery
Fig. 6. Depressant action of distant GABA microionophoresis. A, layer VI S-cell (GABApipette in layer II/III, 1000 Itm posterior; GABA application 8 min after control with80 nA ejection current; recovery 12 min). B, layer IV S-cell (GABA pipette in layerII/III, 2150,m posterior; GABA applied with 40 nA 20 min after control; recovery24 min). Responses are reduced by GABA to all directions of movement but the preferreddirection is most affected.
In many cases we obtained sequences of initial disinhibition followed by stronglyreduced responsiveness when increasing the current strength and duration of GABAmicroionophoresis (Fig. 7). This could be explained by the increasing radius of theregion affected by GABA with increasing strength and duration of microionophoresis.After initially silencing elements close to the pipette tip, GABA inhibition eventuallyreaches synapses on the dendrites and somata of the recorded cells. Recovery aftercessation of GABA application was also complete in the cases of severe GABAinhibition (Figs 6 and 7). The depressant GABA effects were more pronounced whenthe distance between pipette and recording site was small, but with longer durationsof GABA application one could compensate for larger distances.
666

DIRECTION SELECTIVITY AND CORTICAL INHIBITION
100 I/sRecovery
Fig. 7. Effect of long-lasting GABA microionophoresis in a layer IV S-cell. First, after8 min and with 40 nA ejection current the response in the preferred direction (90 deg) wasenhanced. After an additional 20 min and with an increased ejection current (120 nA),direct GABA inhibition was seen. Complete recovery occurred 28 min later. (GABApipette in layer II/III, 1450 ,um posterior to recording electrode.)
Vertical range of GABA effectsTo gain an impression of the radius of diffusion and the vertical range of GABA
effects during long-lasting microionophoresis we performed one control experimentwith recording tracks passing obliquely below the GABA pipette. Histologyestablished the location of the GABA pipette in layer III, and the recording electrodevertically below in layer VI with a distance of 1120 #am from tip to tip. Despite highejection currents (maximum 100 nA) and prolonged GABA application (40 min) onlyminor direct inhibitory effects were seen in some of the recorded layer VI C-cells. Inlayer IV, on the other hand, with a lateral distance of 800-900 ,um between GABApipette and recording electrode tip, we were able to record an S-cell during the samepenetration that clearly changed directionality in the way as described above.
Statistical analysisTwo effects of lateral GABA inactivation in cat area 17 have been shown in this
study: increased responses, probably based on inactivation of inhibitory elements,and depressant actions, either due to direct inhibition of the recorded cell or toinactivation of excitatory interneurones. In many of the tested cells both effects werepresent and for differentiation of cell classes it was necessary to decide from the polar
667

U. T. EYSEL, T. MUCHE AND F. WORGOTTER
plots which effect predominated in a given cell. Cell groups were distinguishedaccording to the preferred direction of motion and change ofmean peak response rate(average of all response rates represented in a polar plot) during GABA application.Four categories of direction preference (PD groups) were defined: PD-00, PD-90,PD-180, PD-270, each including cells with preferred directions in a sector of + 30 degaround the PD group value. The sign of the change of mean peak response rates ineach group was used to further separate the cells into those exhibiting depression(decrease) or disinhibition (increase) of firing rates (Table 1). In addition, a sampleof cells without GABA application was treated in a comparable way and served ascontrol for the range of spontaneous changes.
TABLE 1. Cells grouped according to their preferred direction of motion and increase or decreaseof mean peak response rate (averaged over all directions) during GABA application
Depressant action Disinhibition
No. of Change of No. of Change of TotalPD group cells peak rates cells peak rates number
0 26 (a) -7-12 3 (h) +4-56 2990 20 (b) -10-79 28 (f) +10 10 48180 12 (c) -8109 7 (g) +10-42 19270 24 (d) -7-64 23 (e) +12-96 471 82 61 143Control without 24 -3*34 26 +6-12 50GABA
The letters in parentheses refer to the curves in Fig. 8.
Depressant actions of GABA were observed in 57-3% of the cells distributed overall PD groups (Table 1). Disinhibition was strongly expressed in the PD-270 group(twenty-three cells, change of mean peak response rate + 12-96 spike/s), as might beexpected if direction selectivity involves pronounced inhibition topographicallyarranged along the path of the response wave during stimulus movement in the non-preferred (90 deg) direction. Similarly, in the PD-90 group, inhibition could beremoved by GABA inactivation (twenty-eight cells, change of + 1041 spike/s).Disinhibition only seldom occurred in cells preferentially responding to horizontalmovement (20-8 %), whereas it was seen in 53-6% of the cells preferring verticalstimulus movement.The separation into cell groups (Table 1) gave a useful first impression of the
GABA effects. Now it became possible to further quantify the behaviour of thedifferent cell groups. The disinhibited and the depressed cells of each PD group weretreated separately, and the mean absolute changes of peak rates (peak rates duringGABA application minus control peak rates) in response to all directions of stimulusmovement were computed (Fig. 8, curves a-h).For the eighty-two cells that, in general, were depressed during GABA application,
we found in all PD groups maxima of depression in the response to motion in thepreferred direction (Fig. 8, negative curves with peaks a-d). Among the sixty-onecells with increased mean response rates, cells showing disinhibitory maxima due to
668

DIRECTION SELECTIVITY AND CORTICAL INHIBITION
a+36
+10-
02~~~~
4-S
cva
-36
Fig. 8. Mean absolute changes of peak response rates during GABA application (ordinate)plotted with respect to direction of stimulus movement (abscissa) for the cell groupsdetermined in Table 1. The small insets of schematic polar plots indicate the respectivePD groups and the relative location of the GABA pipette (hatched circles). DepressantGABA effects influencing the preferred responses were present in all PD groups (negativepeaks a-d), whereas disinhibition was exclusively observed for the 90 deg response in thevertical PD groups (PD-90 and PD-270, positive peaks e and f. The disinhibited groupswith horizontal preferred direction (PD-0 and PD-180, curves marked g and h) displayedno significant changes. The dashed lines indicate the maximal spontaneously occurringchanges averaged from control cells without GABA.
GABA application were only found in the PD-270 and PD-90 groups (Fig. 8, peakse and f; fifty-one cells) where, in both cases, maximal disinhibitions occurred in the90 deg direction. The remaining ten cells with horizontal preferred directions (PD-00and PD-180) that showed increased mean peak response rates (Table 1) did not showany significant maximal changes during GABA application (Fig. 8, curves g and h).
669

U. T. EYSEL, T. MUCHE AND F. WORGOTTER
For all the other cases, the maximal GABA-induced depressant as well asdisinhibitory effects (Fig. 8, a-f) were significantly different (t test, P < 0-001) fromthe maximal spontaneously occurring changes without GABA, averaged from thecontrol group of fifty cells (+ 10-2 and -6-0 spikes/s in Fig. 8, dashed lines).
Differences between the S- and C-cell groupsThe question arose whether the disinhibitory and depressant effects were
differentially distributed among S- and C-cells, and whether quantitative differencesof cell properties were present in different cortical layers. Therefore we tested the S-and C-cells of the PD-90 and PD-270 groups with respect to the different GABAeffects, and also compared the frequency of disinhibited and depressed S-cells withinlayers IV and VI.
TABLE 2. Distribution of disinhibitory and depressant effects amongst S- and C-cells (A) andnumbers of S-cells with disinhibition and depression observed in layers IV and VI (B).
A B
Depressant DepressantCell type action Disinhibition S-cells action Disinhibition
S-cells 26 40 Layer IV 11 19C-cells 18 11 Layer VI 11 18
Table 2A shows that most S-cells are disinhibited (n = 40 out of 66), whereas forthe C-cells the reverse is true, with depressant actions in eighteen of twenty-sevencells. This is significant with X2 = 44166; P < 0 05. On the other hand, no differencescould be detected between S-cells in the input layers IV and VI of the visual cortex(Table 2B).
DISCUSSION
GABA microionophoresis has been used in the present study to inactivate visualcortical regions in a way similar to that recently applied by Bolz & Gilbert (1986).GABA acts as an inhibitory transmitter in the cat's visual cortex (Sillito, 1977) andit is assumed that practically all visual cortical cells - whether excitatory orinhibitory - are silenced by GABA, whilst the afferent input to the cortex is notaffected.
Inactivations centred some distance from the recorded cells abolished directionselectivity in certain cells and produced it in others, depending on the relativetopography of recording and inactivation sites and on the properties of theinvestigated cells before local inactivation of nearby regions. These results raisequestions about lateral signal processing in general and its possible contributions todirection selectivity of cells in the cat's visual cortex.Two main effects have been observed during local inactivation of the upper
cortical layers anterior or posterior to the investigated cells: most specifically, anincreased response due to loss of inhibition.. This was obtained when the GABApipette was located in a cortical region activated before the recorded cell duringmovement of the stimulus in the non-preferred direction, suggesting a high
670

DIRECTION SELECTIVITY AND CORTICAL INHIBITION
topographical specificity of involved inhibitory interactions in the cat's visual cortexsimilar to those suggested first for directional cells in the rabbit's retina (Barlow &Levick, 1965). Less specifically, in many cells inhibitory GABA effects were observedirrespective of the electrode arrangement. Such inhibitory effects could be due tosilencing of excitatory cells converging on the investigated cell or might be based ondirect inhibitory actions of GABA on the cell itself. In a number of cases this led toa loss of directionality, indicating an excitatory convergence involved in determiningthe direction sensitivity of these cells. More frequently, however, the inhibitoryeffects led to an overall reduction of responsiveness, not accompanied by any changesof the recorded cell's specificity.
In general, our results are consistent with the view that direction specificityinvolves intracortical inhibition (Benevento et al. 1972; Innocenti & Fiore, 1974;Sillito, 1975, 1977, 1979; Matsubara, Cynader, Swindale & Stryker, 1985). Ourmethod does not allow us to assess the possible contributions of excitatoryconvergence from subcortical inputs as suggested by Ferster (1986).The fact that it proved possible by removal of inhibition from one side of a cell,
to abolish or even invert direction selectivity in cells with a certain preferreddirection (Figs 2, 3A, 4 and 5), to produce direction selectivity in non-directionalcells (Fig. 3B), and to increase the directionality in cells with the opposite preferreddirection (Figs 3C and 7), suggests a model with inhibition acting from both sides ofa visual cortical cell along the common axis of the preferred and non-preferredstimulus motion (Fig. 8, e andf). An imbalance of this inhibition seems to determinethe sign and the strength of direction preference. The direction preference resultsfrom a stronger inhibition from one side, not from the exclusive existence ofinhibition only from that side. The reversal of the direction selectivity of a cell byremoval of lateral inhibition further implies that after local inactivation of theunderlying inhibitory elements the inhibition originally effective during movementin the non-preferred direction must now be weaker than that acting duringmovement in the direction formerly preferred.The results presented further suggest that inhibitory elements possibly involved in
orientational tuning (Sillito, 1975, 1979; Matsubara et al. 1985) are different fromthose involved in direction selectivity (Hammond, 1978). This is supported by ourevidence that direction selectivity could be changed without influencing orientationspecificity. One can speculate that elements involved in orientation tuning must becloser to the recorded cell (and more distant from the GABA pipette) than thoseelements involved in directionality that are closer to the distant GABA pipette andaccordingly inactivated first.
In the present study, GABA inactivation primarily affected the supragranularcortical layers but the localization of the GABA micropipette in layer 11/111 is onlyof significance if GABA does indeed not inactivate deep layers of the cortexsimultaneously. Possibly there is diffusion of GABA over considerable distances,since effects of local inactivation were produced over distances between 05 andnearly 2-5 mm. On the other hand, Bolz & Gilbert (1986) assume that localinactivation by GABA injected into layer VI does not directly affect cells recordedabove them in layer IV, the distance involved in this case being of the order of0 5 mm. In our own control experiments there was, indeed, practically no inhibitory
671

U. T. EYSEL, T. MUCHE AND F. WORGOTTER
effect observed in layer VI during long-lasting microionophoresis with high ejectioncurrents directly above them in layer III. Accordingly, the type of inhibition relatedto direction selectivity that was inactivated in the present study seems to involve theupper cortical layers. This is not contradicted by the findings of Bolz & Gilbert (1986)who simply described changes in end-inhibition but not of direction and orientationspecificity after inactivation of layer VI.
In a recently published study, Schwark, Malpeli, Weyand & Lee (1986) reportedno changes in direction selectivity of cells in the deep layers of the visual cortexduring superficial cortical cooling. There are, however, important methodologicaldifferences between that study and our approach. In the cited investigation, corticalcooling affected the whole cortical surface above the cells under study, i.e.symmetrical rather than asymmetrical inactivation with respect to the recordingsite. Furthermore, the barbiturate anaesthesia used by Schwark et al. (1986) mighthave silenced the kind of cells involved in the present study. Finally, very differenttopographical regions of area 17 were studied: peripheral regions in Schwark'sresearch as opposed to the projection of the central visual field in the present study.Any of these differences might explain the discrepancies between the twoinvestigations.
Several neurophysiological observations show that direction selectivity can beelicited by stimuli within the excitatory discharge region of a cortical cell (Goodwinet al. 1975; Emerson & Gerstein, 1977; Ganz & Felder, 1984). This does notnecessarily imply that regions outside the classical RF are not involved. In ourexperiments GABA inactivation was centred at distances between 0 5 and 2X5 mmfrom the recorded cells, i.e. about 0-3-1X5 deg away from the RF centre, in thevicinity of the area centralis. The observed long-range effects can be interpreted inseveral ways. On the one hand, GABA might diffuse horizontally and reach elementscloser to the recorded cells. On the other hand, more distant lateral effects, notrevealed by tests with single-spot stimuli, might be transmitted in a cascade-likefashion and build in strength during movement towards the cell. In this case,continuity in space and critical time factors would be important. The velocitydependence of directionality (Orban, Kennedy & Maes, 1981) supports thisinterpretation.
In fact, the existence of lateral inhibitory interactions (in part over longerdistances) in striate cortex is predicted by a number of observations (Jones, 1970;Benevento et al. 1972; Bishop, Coombs & Henry, 1973; Innocenti & Fiore, 1974;Glezer et al. 1982; Duysens, 1987; see also Allman, Miezin & McGuiness, 1985) andsupported by local stimulation experiments and the present inactivation study.Lateral cortical excitation with L-glutamate (Hess, Negishi & Creutzfeldt, 1975)evoked inhibition over about 400 jsm in the visual cortex, and electrical micro-stimulation of the motor cortex (Asanuma & Rosen, 1973) yielded lateralinhibition up to 1000,tm. Long-ranging horizontal connections have been dem-onstrated by horseradish peroxidase injections in the visual cortex (Rockland &Lund, 1983; Gilbert, 1985), but experimental evidence suggests that theseinteractions are excitatory in nature (Ts'o et al. 1986).
Unlike the relatively orderly pattern of preferred orientations in the cat's visualcortex (Hubel & Wiesel, 1962, 1963), direction selectivity displays a patchy
672

DIRECTION SELECTIVITY AND CORTICAL INHIBITION
distribution (Payne, Berman & Murphy, 1980) in so far as cells recorded closetogether tend to show comparable direction preferences. Our experience suggeststhat direction selectivity can reverse abruptly during a given penetration while theorientation specificity remains unchanged at the same time. This suggests thatdifferent cells share the same source of direction selectivity independent of theirorientational tuning. This source might be individual inhibitory interneuronesserving a cluster of cells in the visual cortex.Hubel & Wiesel (1962) were the first to suggest that complex-cell receptive fields
might be generated by excitatory convergence of simple cells. In fact, one of the maindifferences between complex and simple cells in our study was the relatively higherpercentage of cells with depressant GABA effects among the C-cell group (62 %) asopposed to 39% in the S-cell group. While 61 % of the S-cells showed effects due toloss of inhibition, this was only seen in 38% of the C-cells. This might be anindication of a more pronounced inhibitory modulation of S-cells as opposed to apreponderance of excitatory convergence in C-cells (Movshon et al. 1978). Theproperty of direction selectivity might be generated in S-cells and then transmittedexcitatorily to C-cells (Goodwin & Henry, 1975). Nevertheless, inhibition wasremoved by GABA inactivation in about one-third of the C-cells, indicating theadditional possibility of influences from inhibitory interneurones in this class ofcells.About 20% of the neurones in the cat's visual cortex are GABAergic inhibitory
interneurones with more than 50% located within lower layer III and layer IV(Gabbott & Somogyi, 1986). Matsubara, Nance & Cynader (1987) have shownnumerous tangentially oriented GABA-immunoreactive fibres in area 18 of the cat.These fibres enable inhibitory connections between functional columns. Seven typesof GABAergic interneurones have so far been individually identified (Somogyi et al.1983; Kisvarday, Martin, Whitteridge & Somogyi, 1985; Somogyi, 1986). Theseinclude two types of large basket cells, one typically situated close to the borderbetween layers III and IV (Somogyi et al. 1983), the other found in layers V and VI(Kisvarday, Martin, Friedlander & Somogyi, 1987). Both have horizontal axons upto 2 mm in length and one could speculate that these large basket cells may beinvolved in the directionality effects observed in our present study.
The authors are indebted to Dr P. Hammond for many critical and helpful comments. We aregrateful to Dr H.-Chr. Pape who helped with the GABA pipettes, and to Ute Neubacher andKirsten G6pelt for the histological work. This study was performed in partial fulfilment of thedoctoral thesis of F. W. The financial support of the Deutsche Forschungsgemeinschaft(SFB 200/A4) is gratefully acknowledged.
REFERENCES
ALLMAN, J., MIEZIN, F. & McGuINEss, E. (1985). Stimulus specific responses from beyond theclassical receptive field: neurophysiological mechanisms for local-global comparisons in visualneurons. Annual Reviews of Neuroscience 8, 407-430.
ASANUMA, H. & ROSEN, I. (1973). Spread of mono- and polysynaptic connections within cat'smotor cortex. Experimental Brain Research 16, 507-520.
BARLOW, H. B. (1981). Critical limiting factors in the design of the eye and visual cortex.Proceedings of the Royal Society B 212, 1-34.22 PHY 399
673

U. T. EYSEL, T. MUCHE AND F. WORGOTTER
BARLOW, H. B. & LEVICK, W. R. (1965). The mechanism of directionally selective units in therabbit's retina. Journal of Physiology 178, 477-504.
BENEVENTO, L. A., CREUTZFELDT, 0. D. & KUHNT, U. (1972). Significance of intracorticalinhibition in the visual cortex. Nature 238, 124-126.
BILGE, M., BINGLE, A., SENEVIRATNE, K. N. & WHITTERIDGE, D. (1967). A map ofthe visual cortexin the cat. Journal of Physiology 191, 116-118P.
BISHOP, P. O., COOMBS, J. S. & HENRY, G. H. (1973). Receptive fields of simple cells in the catstriate cortex. Journal of Physiology 231, 31-60.
BOLZ, J. & GILBERT, C. D. (1986). Generation ofend-inhibition in the visual cortex via interlaminarconnections. Nature 320, 362-365.
DUYSENS, J. (1987). Is direction selectivity of cat area 17 cells always independent of contrast anddependent on short-distance interactions? Experimental Brain Research 67, 663-666.
EMERSON, R. C. & GERSTEIN, G. L. (1977). Simple striate neurons in the cat. II. Mechanismsunderlying directional asymmetry and directional selectivity. Journal of Neurophysiology 40,136-155.
EYSEL, U. TH. & WORGOTTER, F. (1986). Specific cortical lesions abolish direction selectivity ofvisual cortical cells in the cat. Society for Neuroscience Abstracts 12, 583.
FERSTER, D. (1986). Orientation selectivity of postsynaptic potentials in neurons of cat primaryvisual cortex. Journal of Neuroscience 6, 1284-1301.
FERSTER, D. & LINDSTR6M, S. (1983). An intracellular analysis of geniculo-cortical connectivity inarea 17 of the cat. Journal of Physiology 342, 181-215.
GABBOTT, P. L. A. & SOMOGYI, P. (1986). Quantitative distribution of GABA-immuoreactiveneurons in the visual cortex (area 17) of the cat. Experimental Brain Research 61, 323-331.
GANZ, L. & FELDER, R. (1984). Mechanism of directional selectivity in simple neurons of the cat'svisual cortex analyzed with stationary flash sequences. Journal of Neurophysiology 51,294-324.
GILBERT, C. D. (1983). Microcircuitry of the visual cortex. Annual Reviews of Neuroscience 6,217-247.
GILBERT, C. D. (1985). Horizontal integration in the neocortex. Trends in Neurosciences 8,160-165.
GILBERT, C. D. & WIESEL, T. N. (1979). Morphology and intracortical projections of functionallycharacterised neurones in the cat visual cortex. Nature 280, 120-125.
GLEZER, V. D., TSHERBACH, T. A., GAUSELMAN, V. E. & BONDARKO, V. M. (1982). Spatio-temporalorganization of receptive fields of the cat striate cortex. Biological Cybernetics 43, 35-49.
GOODWIN, A. W. & HENRY, G. H. (1975). Direction selectivity of complex cells in a comparisonwith simple cells. Journal of Neurophysiology 38, 1524-1540.
GOODWIN, A. W., HENRY, G. H. & BISHOP, P. 0. (1975). Direction selectivity of simple striate cells:properties and mechanism. Journal of Neurophysiology 38, 1500-1523.
HAMMOND, P. (1978). Directional tuning of complex cells in area 17 of the feline visual cortex.Journal of Physiology 285, 479-491.
HENRY, G. H., HARVEY, A. R. & LUND, J. S. (1979). The afferent connections and laminardistribution of cells in the cat striate cortex. Journal of Comparative Neurology 187, 725-744.
HESS, R., NEGISHI, K. & CREUTZFELDT, 0. (1975). The horizontal spread of intracortical inhibitionin the visual cortex. Experimental Brain Research 22, 415-419.
HUBEL, D. H. & WIESEL, T. N. (1962). Receptive fields, binocular interaction and functionalarchitecture in the cat's visual cortex. Journal of Physiology 160, 106-154.
HUBEL, D. H. & WIESEL, T. N. (1963). Shape and arrangement of columns in cat's striate cortex.Journal of Physiology 165, 559-568.
INNOCENTI, G. M. & FIORE, L. (1974). Post-synaptic inhibitory components of the responses tomoving stimuli in area 17. Brain Research 80, 122-126.
JONES, B. H. (1970). Responses of single neurons in cat visual cortex to a simple and more complexstimulus. American Journal of Physiology 218, 1102-1107.
KATO, H., BISHOP, P. 0. & ORBAN, G. A. (1978). Hypercomplex and simple/complex cellclassification in cat striate cortex. Journal of Neurophysiology 41, 1071-1095.
KISVARDAY, Z. F., MARTIN, K. A. C., FRIEDLANDER, M. J. & SOMOGYI, P. (1987). Evidence forinterlaminar inhibitory circuits in the striate cortex of the cat. Journal of Comparative Neurology260, 1-19.
674

DIRECTION SELECTIVITY AND CORTICAL INHIBITION
KISVARDAY, Z. F., MARTIN, K. A. C., WHITTERIDGE, D. & SOMOGYI, P. (1985). Synapticconnections of intracellularly filled clutch cells: a type of small basket cell in the visual cortexof the cat. Journal of Comparative Neurology 242, 111-137.
KOCH, C. & PoGGIo, T. (1985). The synaptic veto mechanism: does it underlie direction andorientation selectivity in the visual cortex? In Models of the Visual Cortex, ed. ROSE, D. &DoBSON, V. G., pp. 408. Chichester, New York: John Wiley & Sons.
MCGUIRE, B. A., HORNUNG, J.-P., GILBERT, C. D. & WIESEL, T. N. (1984). Patterns of synapticinput to layer 4 of cat striate cortex. Journal of Neuroscience 4, 3021-3033.
MARTIN, K. A. C. & WHITTERIDGE, D. (1984). Form, function and intracortical projections of spinyneurones in the striate visual cortex of the cat. Journal of Physiology 353, 463-504.
MATSUBARA, J., CYNADER, M., SWINDALE, N. V. & STRYKER, M. P. (1985). Intrinsic projectionswithin visual cortex: Evidence for orientation-specific local connections. Proceedings of theNational Academy of Sciences of the U.S.A. 82, 935-939.
MATSUBARA, J., NANCE, D. M. & CYNADER, M. S. (1987). Laminar distribution of GABA-immunoreactive neurons and processes in area 18 of the cat. Brain Research Bulletin 18,121-126.
MOVSHON, J. A., THOMPSON, I. D. & TOLHURST, D. J. (1978). Receptive field organization ofcomplex cells in the cat's striate cortex. Journal of Physiology 283, 79-99.
ORBAN, G. A., KENNEDY, H. & MAES, H. (1981). Response to movement of neurons in area 17 and18 of the cat: velocity sensitivity. Journal of Neurophysiology 45, 1043-1058.
PAYNE, B. R., BERMAN, N. & MURPHY, E. H. (1980). Organization of direction preferences in catvisual cortex. Brain Research 211, 445-450.
PETERHANS, E., BISHOP, P. 0. & CAMARDA, R. M. (1985). Direction selectivity of simple cells in catstriate cortex to moving light bars. Experimental Brain Research 57, 512-522.
ROCKLAND, K. S. & LUND, J. S. (1983). Intrinsic laminar lattice connections in primate visualcortex. Journal of Comparative Neurology 216, 303-318.
SCHWARK, H. D., MALPELI, J. G., WEYAND, T. G. & LEE, C. (1986). Cat Area 17. II. Responseproperties of infragranular layer neurons in the absence of supragranular layer activity. Journalof Neurophysiology 56, 1074-1087.
SILLITO, A. M. (1975). The contribution of inhibitory mechanisms to the receptive field propertiesof neurones in the striate cortex of the cat. Journal of Physiology 250, 305-329.
SILLITO, A. M. (1977). Inhibitory processes underlying the directional specificity of simple, complexand hypercomplex cells in the cat's visual cortex. Journal of Physiology 271, 699-720.
SILLITO, A. M. (1979). Inhibitory mechanisms influencing complex cell orientation selectivity andtheir modification at high resting discharge levels. Journal of Physiology 289, 33-53.
SOMOGYI, P. (1986). Seven distinct types of GABA-immunoreactive neuron in the visual cortex ofcat. Society for Neuroscience Abstracts 12, 583.
SOMOGYI, P., KISVARDAY, Z. F., MARTIN, K. A. C. & WHITTERIDGE, D. (1983). Synapticconnections of morphologically identified and physiologically characterized large basket cells inthe striate cortex of cat. Neuroscience 10, 261-294.
Ts'o, D. Y., GILBERT, C. D. & WIESEL, T. N. (1986). Relationships between horizontal interactionsand functional architecture in cat striate cortex as revealed by cross-correlation analysis. Journalof Neuroscience 6, 1160-1170.
TUSA, R. J., PALMER, L. A. & ROSENQUIST, A. C. (1978). The retinotopic organization of area 17(striate cortex) in the cat. Journal of Comparative Neurology 177, 213-236.
22-2
675