journal videokeratography database ofnormal
TRANSCRIPT
British Journal of Ophthalmology 1996;80:610-616
Videokeratography database of normal humancorneas
Yaron S Rabinowitz, HuiyingYang,Yuri Brickman, Judy Akkina, Carleen Riley, Jerome IRotter, Janet Elashoff
Cornea Genetic EyeMedical Clinic,Cedars-Sinai MedicalCenter, Los Angeles,USAY S RabinowitzY BrickmanJ AkkinaC Riley
Division ofBiostatistics,Department ofMedicine,Cedars-Sinai MedicalCenter, Los Angeles,USAJ Elashoff
Departmnent ofPediatrics, UCLASchool ofMedicine,Los Angeles, USAY S RabinowitzHYangJ I Rotter
Department ofMedicine, UCLASchool ofMedicine,Los Angeles, USAJ I Rotter
Department ofOphthalmology, JulesStein Eye Institute,UCLA School ofMedicine, Los Angeles,USAY S Rabinowitz
Department ofBiomathematics,UCLA School ofMedicine, Los Angeles,USAJ Elashoff
Correspondence to:Yaron S Rabinowitz, MD,Cornea-Genetic Eye MedicalClinic, Suite 102, MarkGoodson Building,Cedars-Sinai MedicalCenter, 444 South SanVicente Blvd, Los Angeles,CA 90048, USA.
Accepted for publication11 March 1996
AbstractAim-To form a database of videokerato-graphy patterns and quantitative indicesdescribing normal human corneas usingthe absolute scale.Methods-Both eyes of 195 normal sub-jects were examined with a TMS-1 video-keratoscope. Videokeratographs were
divided into 10 categories based on a clas-sification scheme devised from the abso-lute scale and analysed with 10quantitative indices devised to describephenotypic features of keratoconusvideokeratographs. Correlations were
sought between videokeratograph pat-terns and quantitative indices. Addition-ally, data were analysed for differences inage, sex, and ethnicity.Results-For symmetric videokeratogra-phy patterns, analysis in the absolute scalewas similar to a previous study done in thenormalised scale. In the asymmetric cat-egories, analyses differed markedly. Usingthe absolute scale and our classificationscheme more variation in normal video-keratography patterns could be appreci-ated. There was good correlation betweenquantitative indices and videokeratogra-phy patterns. Neither videokeratographypatterns nor indices differed significantlybetween sex, ethnic groups, or age usingtwo way analysis ofvariance.Conclusions-Pattern analysis of video-keratographs in the absolute scale using, astandard classification scheme, may bemore useful in trying to determinewhether a cornea is normal or representssubtle early disease than analysis in thenormalised scale. Quantitative indicescould remove the subjectivity from thedecision making process thus facilitatinguniversal reproducibility of videokerato-graphy data interpretation.(BrJ Ophthalmol 1996;80:610-616)
Computer assisted videokeratography is a sen-
sitive method for evaluating the anteriorcorneal surface and allows for detailed qualita-tive and quantitative analysis of corneal shapederived from the corneal power maps gener-ated by current generation videophoto-keratoscopes.'7 In order to determine the ear-
liest changes on the anterior corneal surfacefound in disease states, we first need to analysethe spectrum of topography that exists in nor-
mal human corneas as measured with video-keratography.
Two previous studies have used video-keratography to study normal human corneas;one used the LSU topography system,8 and theother the corneal modelling system, analysingvideokeratographs in the normalised scale.9Neither of these two studies performed adetailed analysis of the correlation betweenqualitative and quantitative data, derived fromvideokeratographs, nor analysed their datawith respect to age, sex, or ethnicity.We used the topographic modelling system
(TMS-1) to study patients from diverse ethnicbackgrounds in order to form a databaseconsisting of qualitative and quantitative de-scriptors of normal human corneas withvideokeratography, using a single colour scalereferred to as the absolute scale.'0 Further-more, our data have been analysed for correla-tion between indices and patterns; differencesbetween eyes, and differences between age, sex,and ethnicity. These data provide the mostextensive analysis of videokeratographs of nor-mal human corneas reported to date.
Subjects and methodsSELECTION OF SUBJECTSWe prospectively analysed 390 corneas of 195normal subjects.The subjects studied were normal volunteers
who were employees of the Cedars-SinaiMedical Center (CSMC), Los Angeles, Cali-fornia. Exclusion criteria for entry into thestudy included contact lens wear; cornealdisease; previous ocular surgery; prior oculartrauma; retroillumination signs for kerato-conus; refractive error of greater than 5.00dioptres (D) of myopia, 5.00 D of hyperopia,or 5.00 D of astigmatism as determined bymeasuring spectacle correction with a lenso-meter; dry eye syndrome; family history ofkeratoconus; and a history of any disease previ-ously reported in association with keratoconus.The mean age of the study sample was 39
(SD 12) years. Eighty males and 115 femaleswere studied (Table 1).
Table 1 Study subjects
Ethnic group White Hispanic Black Asian Total
Number 116 27 31 21 195AgeMean 41 32 37 38 39SD 12 8 12 10 12
SexMale 46 12 10 12 80Female 70 15 21 9 115
M/F ratio 0.66 0.80 0.48 1.33 0.70
610
on October 6, 2021 by guest. P
rotected by copyright.http://bjo.bm
j.com/
Br J O
phthalmol: first published as 10.1136/bjo.80.7.610 on 1 July 1996. D
ownloaded from

Videokeratography database of normal human corneas
METHODS OF CLINICAL EXAMINATIONBefore being entered into the study, all subjectswere asked to review a patient informationsheet approved by the institutional reviewboard for protection of human subjects.Subjects were then asked to complete aquestionnaire regarding their family, medical,and surgical history. The following clinicalexaminations were performed on each patient:Snellen visual acuity, spectacle correction(read with a lensometer), slit-lamp biomicro-scope examination, and examination with adirect ophthalmoscope and a retinoscope torule out such retroillumination signs of kerato-conus, as the oil droplet sign and the scissorreflex. Videokeratography was performed onboth eyes of each study subject with theTMS-1 (Computed Anatomy, Inc, New York,NY, USA), software version 1.61. The follow-ing measures were taken to ensure quality con-trol and reproducibility of video images. Atleast four pictures of each subject were taken;22 of the 25 rings had to be fully digitised; lidshad to be kept wide open and off the corneawithout assistance or eyelid compression; allpictures had to be within 0.25 D of each otheras measured by simulated keratometry (sim K)readings; to ensure proper fixation and align-ment the cross hair had to be in the centre ofthe pupil for each examination. The tenets ofthe Declaration of Helsinki were followed in
F G
C D
H
Figure 1 Videokeratography pattern classification scheme based on the absolute scale:A,round; B, oval; C, superior steepening; D, inferior steepening; E, irregular; F, symmetricbowtie; G, symmetric bowtie with skewed radial axes; H, asymmetric bowtie with inferiorsteepening (AB/IS); I, asymmetric bowtie with superior steepening;J, asymmetric bowtiewith skewed radial axes (ABISRAX).
B
Figure 2 Schematic iUustration ofhow to determine whether a pattern is AB/IS orABISRAX. A line is drawn to bisect the upper and lower lobes of the asymmetric bowtie(see solid lines), if there is no significant deviation from the vertical meridian (that is, noskewing), the pattern is designated asABIIS (as in A); if the lines bisecting the two lobesappear skewed by more than 30 degreesfrom the vertical meridian (that is, 150 degreesfrom one another), it is labelled asABISRAX (as in B).
taking videokeratographs. The best video-keratograph of four was selected on the basis ofthe quality of the keratoscope mires by visualinspection. All videokeratographs were printedin the absolute scale, in which the colours rep-resent 1.5 D intervals between 35 D and 50.5D and 5 D intervals outside this range.
QUALITATIVE TOPOGRAPHY CLASSIFICATIONSYSTEMEach videokeratograph from each eye was putinto one of 10 categories as judged subjectivelyby three observers, who agreed on the samepattern in 90% of videokeratographs studied.The other 10% of videokeratographs wereassigned according to a pattern agreed to by atleast two of the three observers. In no instancewas there disagreement about pattern classifi-cation among all three observers.The categories were as follows: round, oval,
irregular, inferior steepening (IS), superiorsteepening (SS), symmetric bowtie (SB), andasymmetric bowtie (AB) with SS, AB with IS,SB with skewed radial axes (SRAX), and ABwith SRAX (Figs 1 and 2). The steeper of twopredominant colours in the central two thirdsof the cornea was used to determine thepattern type. To be included in the classifica-tion scheme a colour had to occupy at least10% or more of the central two thirds of thecorneal map. In the IS and SS categories thesteepest colour had to occupy at least 10% ofthe inferior or superior part of the central twothirds of the cornea. Any colours foundcompletely outside the central two thirds of thecornea were excluded from this classificationscheme. The colours used for this classificationsystem were blue, green, yellow, orange, andorange-red. Criteria for subclassifying video-keratographs as round, oval, SB, AB, or irregu-lar were those described by Bogan andcolleagues.9 AB was divided into three subcat-egories: SS (if the superior lobe had a greatersurface area than the inferior lobe), IS (if theinferior lobe occupied a greater surface areathan the superior lobe), and SRAX (if the anglebetween the steepest radial axes above andbelow the horizontal meridian appeared lessthan 150 degrees on visual inspection) (Fig 2).Three additional categories were as follows: IS(if there was an area of increased surface powerbelow the horizontal meridian but noneabove), SS (if there was an area of increasedsurface power above the horizontal meridianbut none below), and SB with SRAX (if theangular difference between steepest radial axesabove and below the horizontal meridianappeared to be less than 150 degrees in SBpatterns).
QUANTITATIVE INDICESThe following quantitative indices were re-corded.(1) Indices previously described in detail5:
(a) simulated keratometry readings (sim K),(b) minimum keratometry readings (min K),(c) surface regularity index (SRI), and(d) surface asymmetry index (SAI).
(2) Indices analysed for each eye by a newlydevised computer software program:
A B
.C
A
611
ii
on October 6, 2021 by guest. P
rotected by copyright.http://bjo.bm
j.com/
Br J O
phthalmol: first published as 10.1136/bjo.80.7.610 on 1 July 1996. D
ownloaded from

Rabinowitz,Yang, Brickman,Akkina, Riley, Rotter, Elashoff
(a) Central K, calculated by averaging thedioptric power points on rings 2, 3, and 4 ofthe videokeratographs generated by theTMS-1. A total of 768 data points are aver-aged to give a single dioptric readingdescriptive of the central corneal power.(b) I - S value, calculated by averaging datapoints on rings 14, 15, and 16 of the video-keratographs generated by the TMS-1 in-strument approximately 3 mm inferior to thecentre of the cornea at 30 degree intervals(that is, 210, 240, 270, 300, and 330degrees) (five data points on each of thethree rings). The values of these 15 datapoints are averaged to give a single dioptricvalue, I. A similar calculation is made byaveraging the data points on rings 14, 15,and 16 at 3 mm superior to the centre of thecornea at 30 degree intervals (that is, 30, 60,90, 120, and 150 degrees). These 15 pointsare averaged to give a single dioptric value,S. The superior value is subtracted from theinferior value to give the I - S value. A posi-tive I - S value indicates a relatively steeperinferior cornea, while negative I - S valuesindicates a relatively steeper superior cornea.
(3) The R versus L index, calculated bysubtracting the central K of the left eye fromthe central K of the right eye. (The values cen-tral K, I - S value, and R versus L indexdescribed here, are a more detailed method ofanalysis of similar indices that have previouslybeen described.'1 12(4) New indices that were analysed by acomputer software program and attempts toquantify other features seen in keratoconusvideokeratographs:
(a) CA, the steepest point on the cornea andits location (measured in dioptres, locationin millimetres (distance), and degrees(angle) relative to the centre of the video-keratograph)(b) C - P, the difference between the steep-est central point and the flattest peripheralpoint on each cornea (in dioptres), and(c) AD, the angular difference between themaximum slope above the horizontal merid-ian and the maximum slope below the hori-zontal meridian, calculated from rings 4 to15 by a computer software program, a mea-sure of relative skewing of these radial axes(in degrees) (Fig 2). (To ensure accuracy andreproducibility of all quantitative measures
2.0%
5.9%
6.4%
Asymmetricpattern33.8%
19.5%
SRAX
Irregular
Ss
IS
Figure 3 Schematic presentation of approximate videokeratography pattern distribution inthe normal population. SRAX=skewed radial axes; SS=superior steepening; IS=inferiorsteepening.
above, indices from at least two differentvideokeratographs of the same eye had to bewithin 0.2 D of each other.)
STATISTICAL ANALYSISAll data including demographic information,clinical examination, and both qualitative andquantitative data from each videokeratographwere entered into a database created with theDATA EASE software program. All statistical analy-ses were performed with BMDP, a statisticalsoftware package.'3 Normality was tested for allcontinuous variables by Shapiro and Wilk'sstatistic.'4 Analysis ofvariance was used to test formean difference in quantitative indices betweendifferent qualitative videokeratography patterns.Two way analysis of variance was used to test formean differences in quantitative indices betweenracial and sex groups. Correlations of indicesbetween two eyes were evaluated using the Pear-son correlation coefficient.'5 (For SAI, a logarith-mic transformation was made to obtain a moreready normal distribution before correlationswere computed.)
ResultsDISTRIBUTION OF VIDEOKERATOGRAPHYPATTERNSThe percentage of the total sample group com-prising each pattern is shown in Table 2, andthe distribution of patterns is illustrated inFigure 3. The majority of normal subjects(66%) had symmetric patterns (round, oval,or symmetric bowtie). SRAX patterns wererare, comprising less than 2% of the studysample.
DESCRIPTION OF QUANTITATIVE INDICESTable 3 summarises all indices studied. Themean central K value and average sim K hadthe same dioptric value. There was very littlecentral power difference between two corneasof the same eye as quantified by R versus Lindices, or within an individual cornea asquantified by the I - S value. Corneas flattenedon average 4.3 D from the centre to theperiphery. The median angular differencebetween the steepest radial axis above andbelow the horizontal meridian was within 25degrees of 180 degrees for all corneas andwithin 5 degrees of 180 degrees for corneaswith more than 1.5 D of astigmatism.
Table 2 Videokeratograph distribution in 195 normalindividuals
Right eye Left eyeVKpattern (n) (n) Total (%)
Oval 44 37 20.8Round 46 52 25.1Superior steep 9 7 4.1Inferior steep 22 25 12.1Symmetric bowtie 37 42 20.3Asymmetric
bowtie-superior steep 6 3 2.3Asymmetric bowtie-inferior
steep 14 15 7.4Irregular 14 9 5.9Asymmetric bowtie-SRAX 0 2 0.5Symmetric bowtie-SRAX 3 3 1.5Total 195 195 100.0
VK=videokeratography; SRAX=skewed radial axes.
Symmetricpattern66.2% A
612
on October 6, 2021 by guest. P
rotected by copyright.http://bjo.bm
j.com/
Br J O
phthalmol: first published as 10.1136/bjo.80.7.610 on 1 July 1996. D
ownloaded from

Videokeratography database of normal human corneas
Table 3 Videokeratography indices (mean (SD))
Right eye Left eye
SRI 0.54 (0.17) 0.54 (0.17)SAI 0.33 (0.13) 0.30 (0.11)SimK 43.7 (1.5) 43.8 (1.5)Min K 43.2 (1.5) 43.3 (1.6)Central K 43.7 (1.4) 43.8 (1.4)I - S values 0.20 (0.53) 0.28 (0.54)C - P values 4.29 (1.30) 4.32 (1.33)RvL 0.38 (0.29)CAPower (D) 44.5 (1-5) 44.6 (1.5)Distance (mm) 0.7 (0.25) 0.68 (0.29)Degree 157.8 (98.8) 165 (102.2)
AD 133.8 (50.3) 140.6 (46.0)AD (SB>1.5 D) 174 (5) 173 (5)R v L 0.32 (0-1.47)*CA
Distance 0.7 (0.2-1.30)* 0.6 (0.11-1.6)*Degree 97 (0-351)* 122 (0-356)*
AD 156 (3-80)* 159 (4-180)*AD (SB>1.5) 175 (166-180)* 176 (163-178)*
SRI=surface regularity index; SAI=surface asymmetry index;Sim K=simulated keratography; Min K=iium keratogra-phy; Central K=central cornea power; I - S=inferior minussuperior; C - P=difference between central and peripheralpower; R v L=right versus left; CA=corneal apex location;AD=angular difference between steepest radial axes above andbelow horizontal meridian; SB>1.5 D=symmetric bowtie withmore than 1.5 D of astigmatism.*Median (range).
Table 4 Comparison ofsymmetric and non-symmetricpatterns (SD)
Ovallround,Sym bowtie Others p Value
n 130 65I - S mean 0.12 (0.43) 0.36 (0.67) 0.002SAI mean 0.32 (0.14) 0.34 (0.11) 0.227SRI mean 0.53 (0.18) 0.55 (0.17) 0.535
Sym=symmetric; I - S=inferior minus superior dioptricasymmetry; SAI=surface asymmetry index; SRI=surface regu-larity index.(Only right eyes were used in this comparison.)
Table 5 Videokeratography patterns: comparison withBogan et al's study9
Bogan et al This study
Round 22.6% 20.8%Oval 20.8% 25.1%Irreg 7.1% 5.9%S/bowtie 17.5% 21.5%A/bowtie 32.1% 7.4%Sym group 60.9% 67.4%
Irreg=irregular; S=symmetric; A=asymmetric; Symgroup=symmetric group.
AGE, RACE, AND SEX COMPARISONSExcept for the C - P index, which had signifi-cantly greater values for black males than forAsian males with respect to both eyes (5.7 ver-
sus 3.7 D; p<0.01), none of the quantitativeindices and videokeratography patternsshowed statistically significant differences withregard to race or sex. Age did not correlate withany of the variables measured.
RELATION BETWEEN VIDEOKERATOGRAPHYPATTERNS AND QUANTITATIVE INDICESThe I - S value is distributed around zero, themaximum value being less than 1.8 on bothsides. The absolute I - S value is significantlyless for corneas with symmetric patterns (oval,round, and SB) than for those with asymmetricpatterns (p=0.01) (Table 4). There are no sta-tistically significant differences between sym-
metric and asymmetric patterns for SRI andSAI values. The symmetric bowtie (SB)patterns had significantly more keratometricastigmatism than the oval/round (O/R) pat-terns and the other asymmetric patterns (AP).The AP had more astigmatism than the O/Rpatterns (SB, 1.36 D; AP, 0.79 D; O/R, 0.60 D;(P=<O.O 1).
COLOUR AND PATTERN CORRELATIONThe majority of the maps in this study wereyellow on green; orange in 22.5%, orange-red(47.5-49 D) in 3.6% of the maps, and red(49-50.5 D) in one map (0.25%).
Correlation between two eyesBased on pattern recognition alone, enantio-morphism was observed in 43% of videok-eratographs. All measurements of centralcorneal power (central K, sim K, min K, andCA) showed a highly significant correlationbetween the two eyes (r>0.9), while measure-ments of difference in power points (I - S andC- P values) showed moderate correlation(r=0.5-0.9).
DiscussionOur study provides new and detailed informa-tion about videokeratography patterns andquantitative indices in normal human corneasand confirms previous observations regardingnormal corneal shape. Compiling a database ofpatterns and indices, as we have done in thisstudy, enhances the clinician's diagnostic capa-bilities in several areas: (1) differences inpatterns that appear similar when analysed inthe normalised scale can be discerned bypattern analysis, (2) analysis of quantitativeindices allows for detection of subtle differ-ences in videokeratographs which appear simi-lar even when analysed in the absolute scale;and (3) quantitative indices allow one to deter-mine whether an unusual videokeratographypattern depicts a subtle topographic abnormal-ity in a clinically normal cornea such as seen in'early' keratoconus or merely depicts a varia-tion in normal corneal topography.Two previous studies have described the
variation in videokeratography patterns thatexists in normal human corneas.8 In one,Bogan and colleagues9 used the normalisedscale to develop a qualitative classification sys-tem for normal videokeratographs using fivebasic subgroups (Table 5). We expanded thisclassification scheme to 10 subgroups to allowfor a more detailed pattern analysis and inaddition used the absolute scale. We used theabsolute scale for two reasons: (1) because astudy byWilson et al suggested that a scale with1.5 D intervals is adequate for recognisingpathology,'6 (2) the use of a single consistentscale with a standard set of reference coloursmakes it easier for different observers to deter-mine whether anterior corneal power changeshave occurred over time based on pattern andcolour recognition alone."5
Despite the use of different colour scales, ouranalysis of videokeratography patterns wassimilar in all the major subgroups except forthe AB group. As regards this latter group
613
on October 6, 2021 by guest. P
rotected by copyright.http://bjo.bm
j.com/
Br J O
phthalmol: first published as 10.1136/bjo.80.7.610 on 1 July 1996. D
ownloaded from
Rabinowitz,Yang, Brickman,Akkina, Riley, Rotter, Elashoff
Bogan et al suggested that it might beattributed by technical problems or contactlens wear.9 However, since we controlled care-fully for those factors, we believe this groupforms part of the spectrum of normal cornealtopography. The AB group, larger in Bogan etalrs study (32.1%) correlated well with theasymmetric group (32.6%) in our study.Factors which may account for differences inthe two studies include: different colour scales;different visual acuity entry criteria; andpossible differences in the distribution ofrefractive errors.Marked symmetry between two eyes of the
same individual is a striking feature in normalcorneas, as illustrated by analysis of multiplefactors. Forty three per cent of right and lefteyes were categorised into the same group
90
0 180
based on pattern recognition and the high cor-relation of quantitative indices between the twoeyes suggests a higher degree of mirror imagesymmetry as described by others.8 Mirrorimage symmetry also extended to the locationof the apex for each cornea, as described byEdmund,'7 and to the acute angle between thesteepest radial axis above and below thehorizontal meridian, a feature not previouslyreported. There was also a high degree of sym-metry within an individual eye above andbelow the horizontal meridian, as seen fromthe results of both our pattern and quantitativeanalysis (I - S values).The majority of corneas in our study sample
were steepest centrally flattening towards theperiphery, as previously reported.8 9 18 19 Ourfindings that the central K and sim K values are
90
270 270
90
180' 0)
270
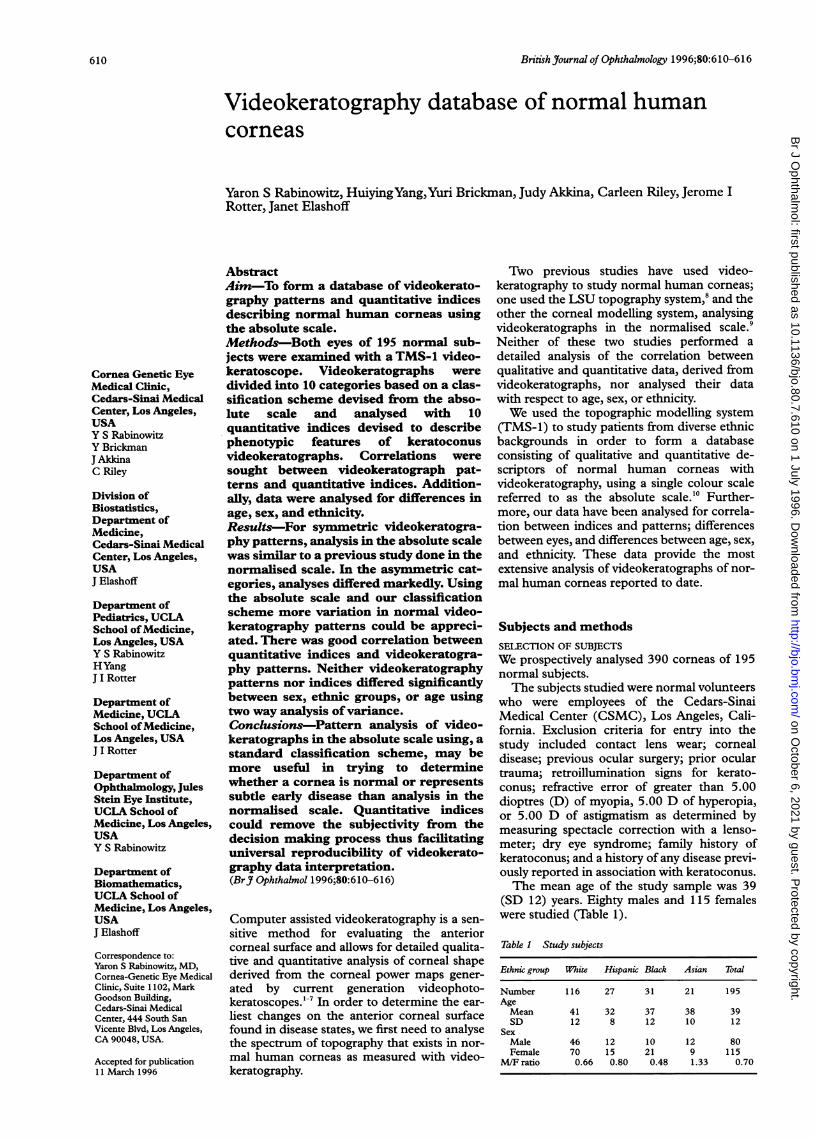
Figure 4 Videokeratographs (normalised scale) of three corneas, normal by slit-lamp examination (top row),accompanying pattern analysis (in absolute scale) (middle row), and quantitative indices illustrating differences amongcorneas (bottom row). (Note: solid arrows indicate steepest radial axis above and below the horizontal meridian.) (Leftcolumn) ABRIS pattern (I - value =1.53 D (within 2-3 D ofnormals),AD=172 degrees (only 8 degree shiftfrom180); (centre column) ABISRAXpattern (I - S value = 1.21 D (within 2-3 SD ofnormals),AD=13 degrees (167degree shiftfrom 180); (right column) ABISRAXpattern (scissoring on retinoscopy with dilated pupil ('early'keratoconus) (I - S value = 2.34 D (>3SD of normals),AD=75 degrees (105 degree shiftfrom 180).
614
on October 6, 2021 by guest. P
rotected by copyright.http://bjo.bm
j.com/
Br J O
phthalmol: first published as 10.1136/bjo.80.7.610 on 1 July 1996. D
ownloaded from

Videokeratography database ofnormal human corneas
of equal power suggests a region between 0.2mm to 1.5 mm from the intersection of the lineof sight and the cornea that may be part of thecorneal cap, as described by Ericksen.20 Wefound the median site ofthe corneal apex (CA)to be superotemporal to the intersection of theline of sight and the cornea, located in anyquadrant around this point and clustering inthe vertical meridian. This is in agreement withthe work of Edmund et al but contrasts withthat of Bonnet et al and Tomlinson et al, whofound no significant trend in the verticalmeridian."lThe database of normal videokeratographs
that we have compiled is not truly representa-tive of the normal population in the strictestsense in that we excluded contact lens wearers,individuals with high degrees of ametropia andthe very young and very old, necessary to cap-ture high quality videokeratographs. Despitethese limitations, defining the normal limits ofvideokeratography by pattern and quantitativeindex analysis as we have done in this studyallows us to discern subtle deviations fromnormal corneal curvature that is not immedi-ately obvious by looking at videokeratographsin the normalised scale. This is illustrated bycomparing the pattern and index analysis ofthe three videokeratographs in Figure 4 (leftand centre columns) (part of this data base)and Figure 4 (right hand column) (whichdoes not form part of this data base). All threepatients have normal slit-lamp evaluations anda cursory glance at videokeratographs analysedin the normalised scale would put all three intothe AB/IS category, with all three being consid-ered as keratoconus 'suspects', as has beendone in recent reports regarding keratoconus'suspects' in the medical literature.'s'6
Pattern analysis in the absolute scale usingour classification scheme demonstrates that wecan show differences between the three pat-terns. Figure 4 (left hand column) depicts an
AB/IS pattern (7.4% overlap with normals),and Figure 4 (centre and right hand columns)have AB/SRAX patterns (0.5% overlap withnormals in this study). For individuals whohave difficulty in recognising that these twopatterns fall into different categories, the ADindex is useful to differentiate the two: forFigure 4 (left) , AD is 172 degrees (a mere 8degree shift from 180) and for Figure 4(centre), AD is 13 degrees (a 167 degree shiftfrom 180) putting it into the AB/SRAXcategory. Using quantitative index analysis,further differences can be discerned betweenpattern 4 (centre) and 4 (right) both of whichfall into the AB/SRAX pattern category.Although the AD index shows a shift of greaterthan 30 degrees from 180 for both patterns(167 degrees for 4 (centre) and 95 degrees for4 (right)), the I - S value for 4 (centre) is 1.2D (within 2-3 SD ofnormals) and is 2.4 D (>3SD for normals) for 4 (right) suggesting an
abnormal cornea. Subsequent retinoscopywith a dilated pupil of all three patientsrevealed 'scissoring of the red reflex' in 4(right) only, confirming the presence of irregu-lar astigmatism and a diagnosis of 'early' kera-toconus. This patient depicted in Figure 4
(centre), an airforce recruit, was diagnosed asbeing clinically and topographically normal byseveral clinicians with extensive experience inmanaging keratoconus, immediately beforebeing referred to our clinic.
Besides the utility of the database of normalvideokeratographs and related quantitativeindices compiled in this study to determinewhich videokeratography patterns should beconsidered as 'suspect' or keratoconus inscreening for refractive surgery, other potentialuses of this database are: its use as a baselineresearch tool for determining subtle deviationsfrom normal corneal curvature in longitudinaltopographic studies of family members ofpatients with familial keratoconus and a basisfor developing a classification scheme forsubclinical keratoconus based on video-keratography, as progression from normaltopography to keratoconus is observed overtime.We hope to demonstrate the utility of thisdatabase for these purposes in future reports oftopographic studies currently in progress.
Supported in part by NIH grant EY09052, the Cedars-SinaiYoung Investigators Research Award, and the Cedars-SinaiBoard of Governors' Chair in Medical Genetics.
Presented in part at the ARVO Annual Meeting, Sarasota,May 1994, and the Cornea Federated Societies Meeting,Toronto, 23 June 1994.
1 Klyce SD. Computer-assisted corneal topography: high-resolution graphic presentation and analysis of kerato-scopy. Invest OphthalmolVis Sci 1984;25:1426-35.
2 Dingeldein SA, Klyce SD. Imaging of the cornea. Cornea1988;7:170-82.
3 Wilson SE, Verity SM, Conger DL. Accuracy and precisionof the corneal analysis system and the topographic model-ing system. Cornea 1992;11:28-35.
4 Hannush SB, Crawford SL, Waring m GO, Gemmill MC.Reproducibility of normal corneal power measurementswith a keratometer, photokeratoscope, and video imagingsystem. Arch Ophthalmol 1990;108:539-44.
5 Wilson SE, Klyce SD. Quantitative descriptors of cornealtopography. A clinical study. Arch Ophthalmol 1991;109:349-53.
6 Roberts C. The accuracy of 'power' maps to display curva-ture data in corneal topography systems. Invest OphthalmolVis Sci 1994;35:3525-32.
7 Klein SA, Mandell RB. Shape and refractive powers in cor-neal topography. Invest Ophthalmol Vis Sci 1995;36:2096-109.
8 Dingeldein SA, Klyce SD. The topography of normalcorneas. Arch Ophthalmol 1989;107:512-8.
9 Bogan SJ, Waring m GO, Ibrahim 0, Drews C, Curtis L.Classification of normal corneal topography based oncomputer-assisted videokeratography. Arch Ophthalmol1990;108:945-9.
10 Gormley DJ, Gersten M, Koplin RS, Lubkin V. Cornealmodeling. Cornea 1988;7:30-5.
11 Rabinowitz YS, Garbus J, McDonnell PJ. Computer-assisted corneal topography in family members of patientswith keratoconus. Arch Ophthalmol 1990;108:365-71.
12 Rabinowitz YS, McDonnell PJ. Computer-assisted cornealtopography in keratoconus. Refractive Corneal Surg 1989;5:400-8.
13 Dixon WJ, ed. BMPD statistical software (Release 7). LosAngeles, CA: University of California Press, 1992.
14 Shapiro SS, Wilk MB. An analysis of test for normality(complete samples). Biometrika 1965;52:591-61 1.
15 Snedecor GW, CochranWG. Statistical methods. Iowa: IowaState University Press, 1980:175-85.
16 Wilson SE, Klyce SD, Husseini ZM. Standardized color-coded maps for corneal topography. Ophthalmology 1900;13:1723-7.
17 Edmund C. Location of the corneal apex and its influenceon the stability of the central corneal curvature: a photo-keratoscopy study. Am Jf Optom Physiol Opt 1987;64:846-52.
18 Bogan SJ, Maloney RK, Waring GO. Computer-assistedtopographic analysis of corneal topography after radialkeratotomy. Invest OphthalmolVis Sci 1990;31:30.
19 Clark BAJ. Mean topography of normal corneas. Aust JOptom 1974;57:107-14.
20 Aubert H or Ericksen, cited by Mandell RB. Contact lenspractice. 3rd ed. Springfield, IL: Charles C Thomas, 1981.
21 Mandell RB, St Helen R. Position and curvature of the cor-neal apex. Am J Optom Physiol Opt 1969;46:25-9.
22 Bonnet R, Cochet P. New method of topographicophthalmometry-its theoretical and clinical applications.Am J Optom Physiol Opt 1962;39:227-51.
615
on October 6, 2021 by guest. P
rotected by copyright.http://bjo.bm
j.com/
Br J O
phthalmol: first published as 10.1136/bjo.80.7.610 on 1 July 1996. D
ownloaded from

Rabinowitz,Yang, Brickman,Akkina, Riley, Rotter, Elashoff
23 Tomlinson A, Schwartz C. The position of the corneal apexin the normal eye. Am Optom Physiol Opt 1979;56:236-40.
24 Waring GO, Rabinowitz YS, Sugar J, Damiano R, WilsonSE, Krachmer J, et al. Nomenclature for keratoconussuspects. Refract Corneal Surg 1993,9:219-21.
25 Grandon SC,Weber RA. Radial keratotomy in patients withatypical inferior steepening. Cataract Refract Surg1994;20:381-6.
26 Bowman CB, Thompson KB, Stulting RD. Refractive kera-totomy in keratoconus 'suspects'. Refract Corneal Surg1995;11:3,202-6.
616
on October 6, 2021 by guest. P
rotected by copyright.http://bjo.bm
j.com/
Br J O
phthalmol: first published as 10.1136/bjo.80.7.610 on 1 July 1996. D
ownloaded from