journey toward excellence investor day -...
TRANSCRIPT

Journey Toward Excellence
INVESTOR DAY | DECEMBER 17, 2013
2
FORWARD-LOOKING STATEMENTS
These slides and accompanying oral presentation contain forward-looking statements, including forward-looking
statements within the meaning of the U.S. Private Securities Litigation Reform Act of 1995. Such forward-looking
statements include, but are not limited to, statements concerning Colfax's plans, objectives, expectations and intentions
and other statements that are not historical or current fact. Forward-looking statements are based on Colfax's current
expectations and involve risks and uncertainties that could cause actual results to differ materially from those expressed
or implied in such forward-looking statements. Factors that could cause Colfax's results to differ materially from current
expectations include, but are not limited to factors detailed in Colfax's reports filed with the U.S. Securities and
Exchange Commission including its 2012 Annual Report on Form 10-K under the caption "Risk Factors." In addition,
these statements are based on a number of assumptions that are subject to change. These slides speak only as of this
date. Colfax disclaims any duty to update the information herein.
The term "Colfax" in reference to the activities described in these slides may mean one or more of Colfax's global
operating subsidiaries and/or their internal business divisions and does not necessarily indicate activities engaged in by
Colfax Corporation.
3
2013 INVESTOR DAY AGENDA
1:00PM Opening Remarks
- Steve Simms, President and CEO
1:15PM Business Segment Presentations
- Clay Kiefaber, EVP and CEO of ESAB
- Carl Pickard, SVP Global Sales and Marketing of Colfax Fluid Handling
- Ian Brander, CEO of Howden
3:00PM Break with Product Tables and Closer Looks
3:30PM Business Development
- Dan Pryor, EVP Strategy and Business Development
3:45PM Colfax Business System and Supply Chain
- Steve Wittig, SVP CBS and Supply Chain
4:15PM Financial Update
- Scott Brannan, SVP and CFO
Summary and Outlook
- Steve Simms, President and CEO
4:45PM Q&A
5:00PM Thank you and Goodbye

OPENING REMARKS
STEVE SIMMS | President and CEO
Journey Toward Excellence

5
SUMMARY
UNIQUE PLATFORM FOR SUSTAINED VALUE CREATION
GROWTH
RUNWAY
ATTRACTIVE
BUSINESS
CBS
CULTURE

6
LEADING BRANDS IN ATTRACTIVE MARKETS
Source: Company filings (for Gas and Fluid Handling) and Management Estimates (for ESAB )
CRITICAL PRODUCTS; STRONG FUNDAMENTALS
FABRICATION TECHNOLOGY
(% of Served Market(1)
)
GAS & FLUID HANDLING
(% of Q3 2013 YTD Revenues)
Power Generation
Oil, Gas & Petro-
chemical
Marine
Mining
General Industrial and Other
Oil & Gas
Power Generation
Marine
Process Industry
Heavy Vehicles
Automotive
General Industrial and Other
Construction &
Infrastructure
1} Excludes PPE

7
0%
25%
50%
75%
100%
2012 Q3 2013 YTD
Emerging Markets Western Europe
North America Other Developed
BROAD GLOBAL FOOTPRINT
Note: Other Developed = Australia, New Zealand, South Korea, Japan, Singapore.
Faster GDP Growth~mid/high single digit over the cycle
Slower GDP Growth~low single digit over the cycle
OVER 50% OF REVENUES IN HIGHER-GROWTH REGIONS
Source: Company filings

8
2006 2007 2008 2009 2010 2011 2012
LONG-CYCLE VS. SHORT-CYCLE
(Prior Year Revenues)
FOREMARKET VS. AFTERMARKET
(% of Q3 2013 YTD Revenues)
BALANCED REVENUES
Foremarket
& Equipment
Aftermarket
& Consumables
Note: Long cycle = Colfax Fluid Handling, Howden, ESAB Cutting & Automation.
MUTED VOLATILITY OVER THE CYCLE
Short Cycle
Long Cycle
Source: Company filings
9
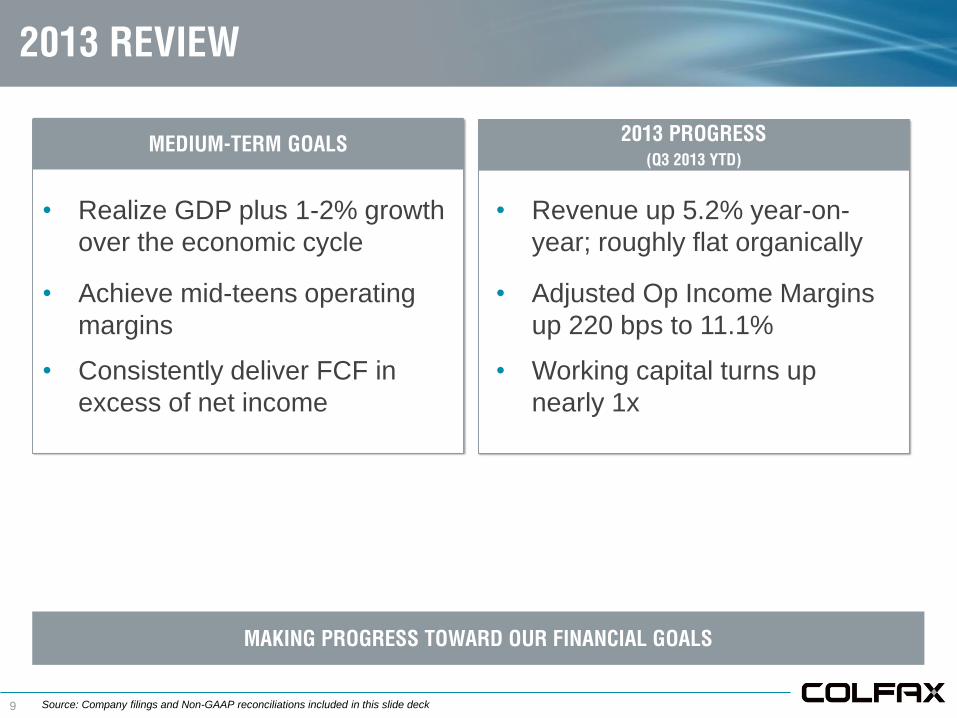
• Realize GDP plus 1-2% growth
over the economic cycle
• Revenue up 5.2% year-on-
year; roughly flat organically
• Achieve mid-teens operating
margins
• Adjusted Op Income Margins
up 220 bps to 11.1%
• Consistently deliver FCF in
excess of net income
• Working capital turns up
nearly 1x
2013 REVIEW
MEDIUM-TERM GOALS
MAKING PROGRESS TOWARD OUR FINANCIAL GOALS
2013 PROGRESS
(Q3 2013 YTD)
Source: Company filings and Non-GAAP reconciliations included in this slide deck

10
2013 REVIEW
Portfolio
STRENGTHENING THE FOUNDATION
• 6 strategic acquisitions
• New product releases gaining steam
People
Process/Culture
• Bench getting deeper/broader
• Talent management/development process in place
• Kaizen activity delivering results
• CBS momentum continues to build

11
2012 2013
E
• Improving ability to fill key
positions internally
DEVELOPING ORGANIZATIONAL CAPABILITY
STRENGTHENING THE TEAM…BUILDING THE BENCH
SENIOR HIRES & INTERNAL MOVES
(2013 YTD = 56 Positions)
Internal Moves
SENIOR TALENT PIPELINE
27%
49%
Based on Internal Reporting 12/2013, Calendar Year data. 2012 reflected rolling 12 months and Charter acquisition
• Increasing key talent within our
funnels
External Hires
12
DEVELOPING ORGANIZATIONAL CAPABILITY
GROWING TOMORROW’S LEADERS

13
REINFORCING THE CULTURE
BUILDING THE FOUNDATION FOR SUSTAINED PERFORMANCE

14
2012 2013
REINFORCING THE CULTURE
CBS CULTURE GAINING TRACTION
CBS TALENT
(As of Period End Q3 2013)
YTD MAJOR KAIZENS
(As of Period End Q3 2013)
Focus on the Vital Few:
• Quality
• Delivery
• Working Capital
• Cost
2012 2013
Source: Internal Management Reporting

15
• Significant operating
improvements
• Focus on growing aftermarket
and service business
• Good progress building CBS
culture
• Accelerating new product
development
• Selling/product development
processes upgraded
• Emphasis on solutions vs.
products
• Leadership teams strengthened • Continued CBS
implementation
2013 PERFORMANCE STRATEGIC THEMES
KEY THEMES: WHAT YOU’LL HEAR FROM THE
BUSINESSES
BALANCED EMPHASIS ON COST AND GROWTH

16
VISION
JOURNEY TOWARD EXCELLENCE
We are dedicated to creating an
enduring premier global enterprise
built on a unique business culture
that…
• Does all things with integrity,
respect and candor
• Has a deep commitment to
excellence to associates and
customers as its foundation
• Is known for consistent delivery
of world-class performance
2014:
Building Foundation
For Long-Term
Growth

ESAB
CLAY KIEFABER | EVP and CEO of ESAB
Journey Toward Excellence

18
PORTFOLIO OVERVIEW
Filler metalsMild steel, alloy and aluminum filler metals
Equipment and accessoriesWelding machines, manual plasma cutting machines, welding
and plasma torches, gas apparatus and PPE
Welding automation and roboticsAutomated welding systems and components
Cutting machinesAutomated cutting tables and systems
19 Video: ESAB Intro
APPLICATION OVERVIEW
VIDEO SHOWN ON LOCATION DURING
EVENT

20
Served Market Size: ~$21B
Long-Term Market Growth: ~3-5%
Market Drivers• Shortage of skilled welders driving need for easier-to-
use equipment and automation
• Increasing application complexity: thinner metals,
tougher environments, etc.
• More sophisticated production in emerging markets
shifting product mix
• Growth of welding-intensive end-markets: energy,
pipelines, infrastructure
Developed
MARKET OVERVIEW
WELDING IS AT THE CORE OF EVERYTHING
GEOGRAPHIC MIX
(% of Q3 2013 YTD Revenues)
Equipment
PRODUCT MIX
(% of Q3 2013 YTD Revenues)
Emerging
Consumables
Source: Market Size and Growth from Internal Management Reporting

21
• Build customer responsiveness • Significant improvements,
particularly in Europe
• Improve operational efficiency • Continued facility and distribution
rationalization
• Strengthen organizational structure
and talent
• All key positions filled
• Drive differentiated product and
application development
• Launched several new VOC-
based products
PERFORMANCE UPDATE
2013 KEY STRATEGIES/FOCUS
SIGNIFICANT PROGRESS AGAINST GOALS, BUT OPPORTUNITY REMAINS
2013 HIGHLIGHTS
22 Source: Internal Management Reporting as of November 30, 2013
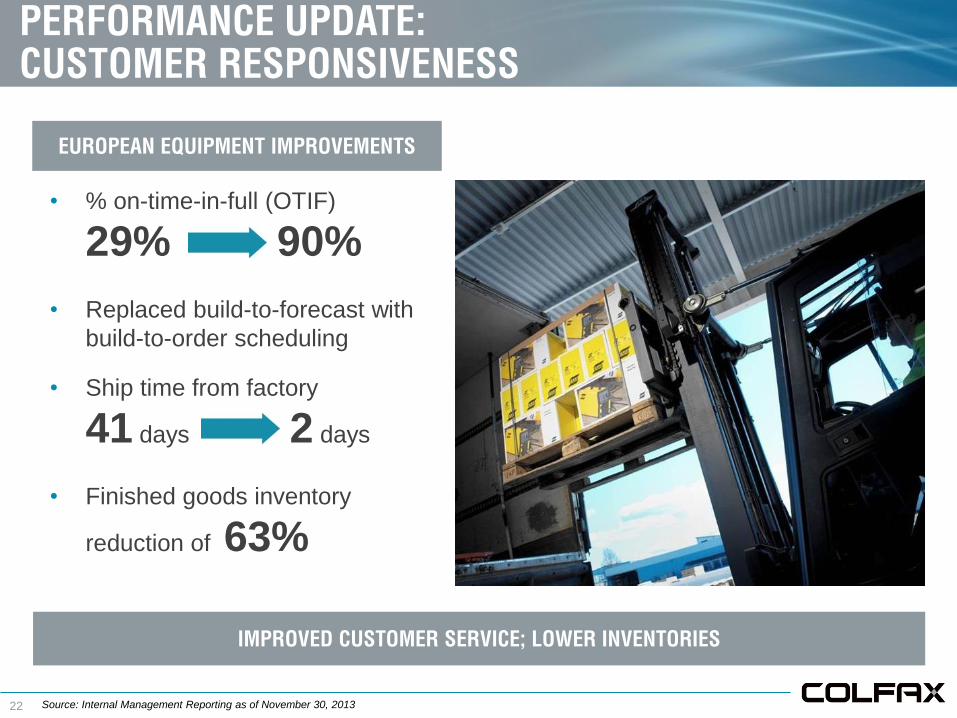
IMPROVED CUSTOMER SERVICE; LOWER INVENTORIES
PERFORMANCE UPDATE:
CUSTOMER RESPONSIVENESS
• % on-time-in-full (OTIF)
29% 90%
• Replaced build-to-forecast with
build-to-order scheduling
• Ship time from factory
41 days 2 days
• Finished goods inventory
reduction of 63%
EUROPEAN EQUIPMENT IMPROVEMENTS
23 Source: Internal Management Reporting
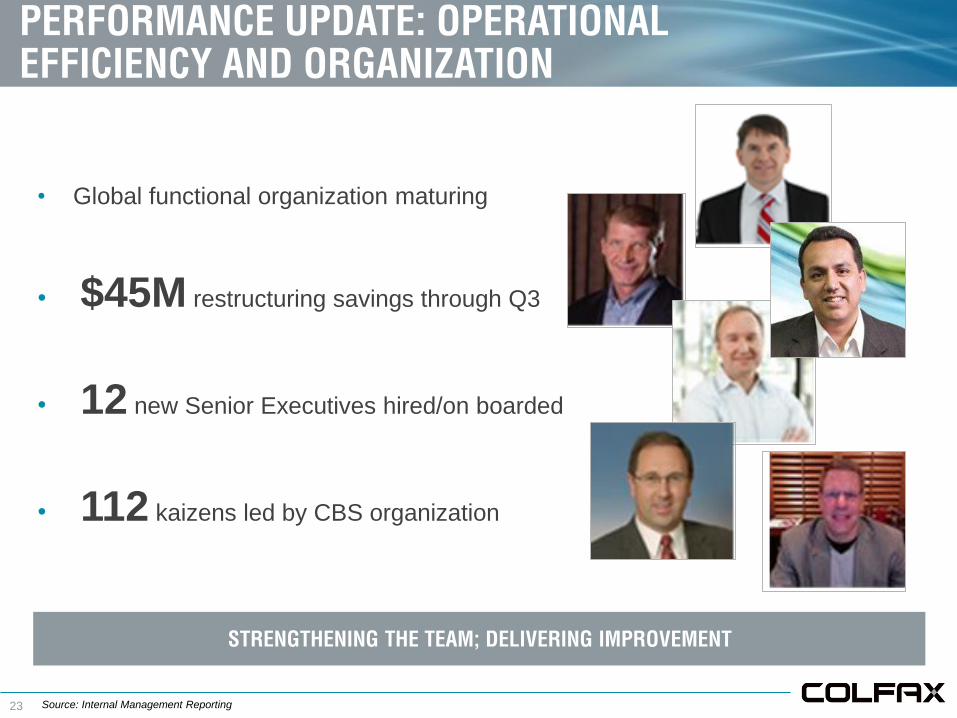
STRENGTHENING THE TEAM; DELIVERING IMPROVEMENT
• Global functional organization maturing
• $45M restructuring savings through Q3
• 12 new Senior Executives hired/on boarded
• 112 kaizens led by CBS organization
PERFORMANCE UPDATE: OPERATIONAL
EFFICIENCY AND ORGANIZATION
24 Source: Internal Management Reporting
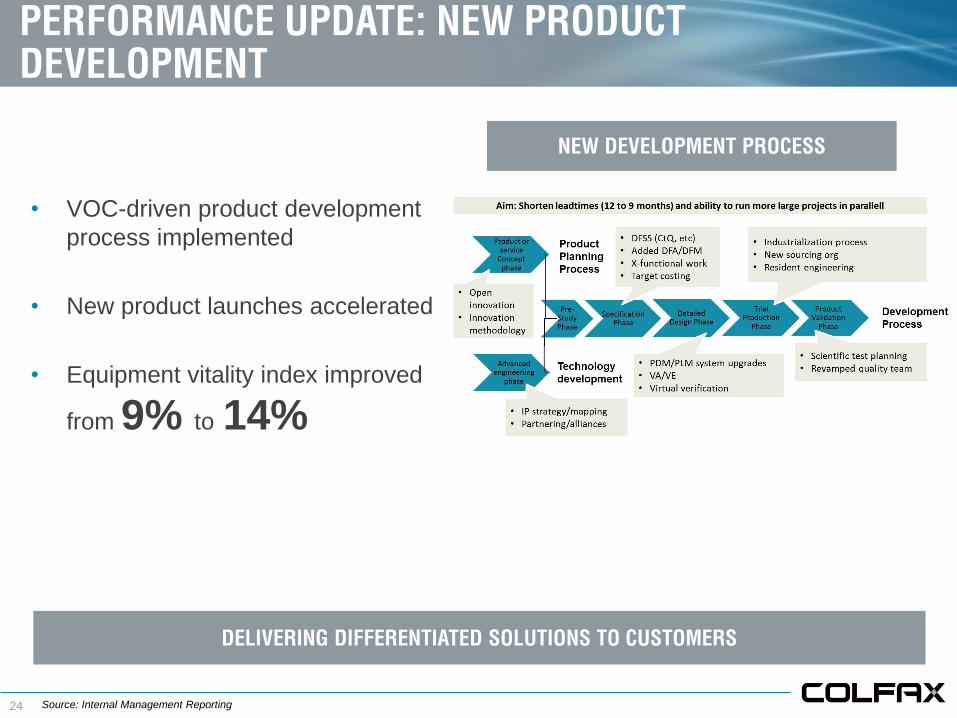
PERFORMANCE UPDATE: NEW PRODUCT
DEVELOPMENT
DELIVERING DIFFERENTIATED SOLUTIONS TO CUSTOMERS
NEW DEVELOPMENT PROCESS
• VOC-driven product development
process implemented
• New product launches accelerated
• Equipment vitality index improved
from 9% to 14%

25
STRATEGIC FOCUS
Drive differentiated product and application development
• Continue compressing new product time to market
• Refresh/expand portfolio with differentiated, VOC-driven new products
Implement CBS tools to achieve operational and financial
excellence
• Expand build-to-order model; continue reducing lead-times and working
capital
• Continue footprint/process improvement and organizational realignment
Strengthen core skills and organizational capability
• Deploy value selling focused on total solutions
• Expand talent development, top-grading and targeted recruiting

26
VOC centered development…
• Over 400 customer interviews
• Over 200 days of development sessions
with end-users
… Delivering quantifiable benefits
• Energy efficiency
• Ease of use
• Flexibility/productivity
• Reliability
CLOSER LOOK: DIFFERENTIATED PRODUCT
DEVELOPMENT
BUILDING THE PROCESSES TO DRIVE GROWTH

27
CLOSER LOOK: APPLICATIONS FOCUS
Video: Rodoverken
VIDEO SHOWN ON LOCATION DURING
EVENT

28
• “Pull” scheduling (driven by
kanban)
• Standardized tugger routes
established with visuals
• $6.6 million inventory (↓14%)
• 221 ft2 materials storage (↓37%)
• “Push” scheduling (controlled
by MRP)
• No visual materials flow; poor
parts route
• $7.7 million inventory
• 595 ft2 materials storage
CBS IMPACT: FLORENCE, SC
REDUCED INVENTORY, IMPROVED PRODUCTIVITY AND BETTER DELIVERY PERFORMANCE
BEFORE
Key actions/tools:
• One-piece flow
• PFEP
AFTER
Source: Internal Management Reporting
29
SUMMARY
Company well positioned in attractive market
Significant progress strengthening business – financial and
operational performance, organizational capabilities
Increasing focus on growth, while continuing to drive cost

Q&A
Journey Toward Excellence
COLFAX FLUID HANDLING
CARL PICKARD | SVP Global Sales and Marketing
Journey Toward Excellence

32
PORTFOLIO OVERVIEW
Positive Displacement PumpsUse two or three intermeshing screws to convey
viscous fluids such as crude oil, lubricants, hydraulic
fluid, coolant, asphalt and polymers
Specialty Centrifugal PumpsCentrifugal pumps capable of handling high volumes of
corrosive and/or hot fluids
Engineered Specialty Pumping SolutionsPumping systems for handling mixed-phase fluids (e.g., water
combined with gas) and delivery of lubricants to high-value rotating
equipment (e.g., compressors, turbines)
Maintenance and Lubrication ServicesFlushing, purification and analysis services for lubrication systems
aimed at improving customer uptime
33
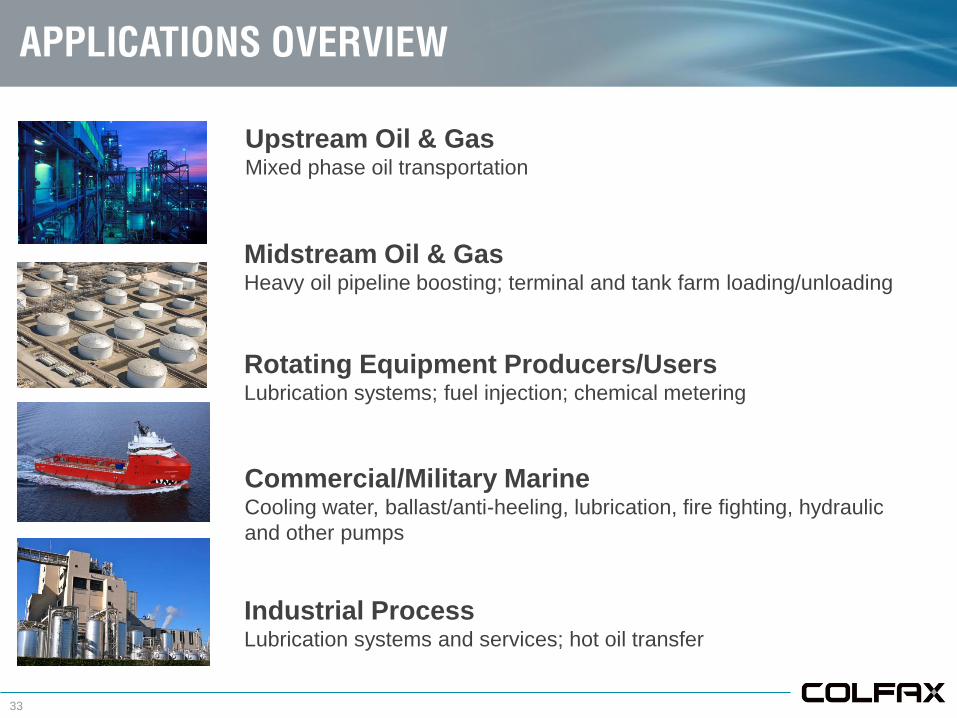
APPLICATIONS OVERVIEW
Upstream Oil & Gas Mixed phase oil transportation
Midstream Oil & GasHeavy oil pipeline boosting; terminal and tank farm loading/unloading
Rotating Equipment Producers/UsersLubrication systems; fuel injection; chemical metering
Commercial/Military MarineCooling water, ballast/anti-heeling, lubrication, fire fighting, hydraulic
and other pumps
Industrial ProcessLubrication systems and services; hot oil transfer
34
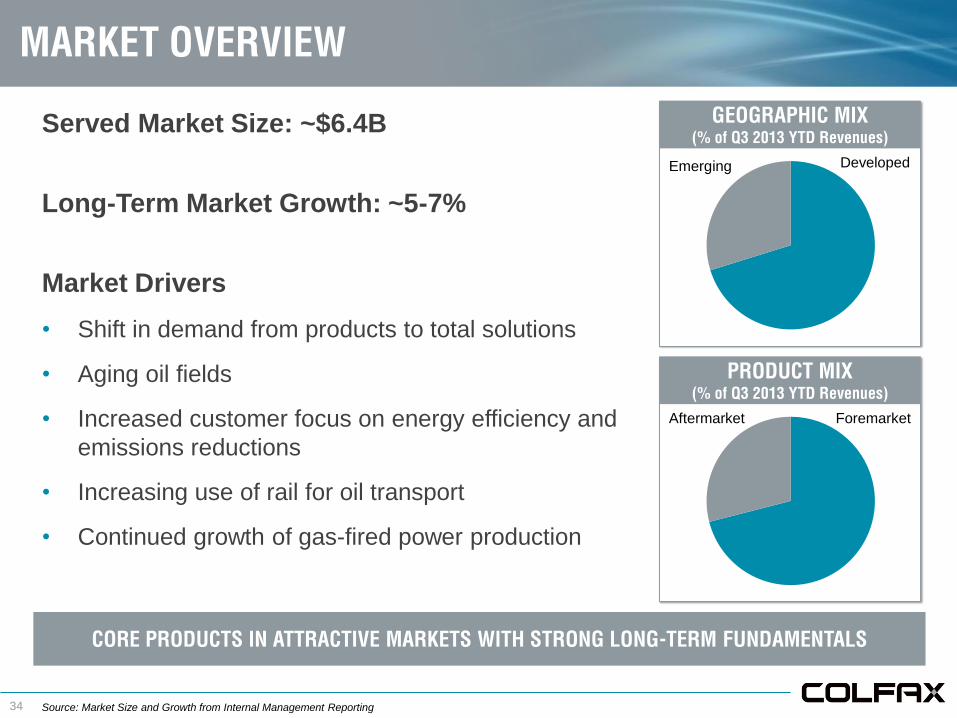
Served Market Size: ~$6.4B
Long-Term Market Growth: ~5-7%
Market Drivers
• Shift in demand from products to total solutions
• Aging oil fields
• Increased customer focus on energy efficiency and
emissions reductions
• Increasing use of rail for oil transport
• Continued growth of gas-fired power production
Developed
MARKET OVERVIEW
CORE PRODUCTS IN ATTRACTIVE MARKETS WITH STRONG LONG-TERM FUNDAMENTALS
GEOGRAPHIC MIX
(% of Q3 2013 YTD Revenues)
Foremarket
PRODUCT MIX
(% of Q3 2013 YTD Revenues)
Emerging
Aftermarket
Source: Market Size and Growth from Internal Management Reporting
35
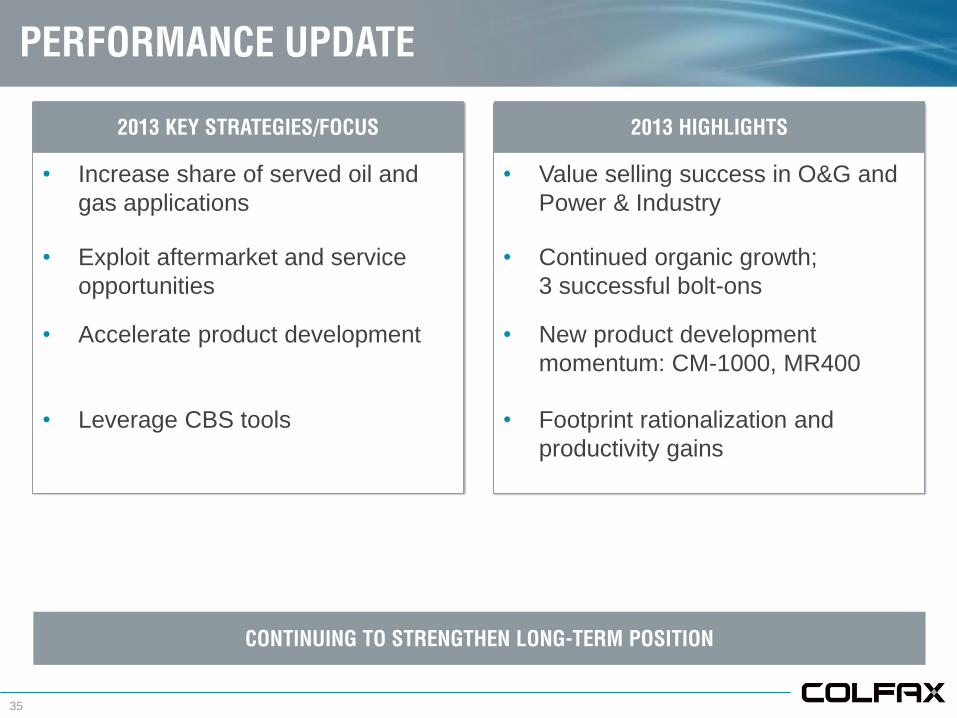
• Increase share of served oil and
gas applications
• Value selling success in O&G and
Power & Industry
• Exploit aftermarket and service
opportunities
• Continued organic growth;
3 successful bolt-ons
• Accelerate product development • New product development
momentum: CM-1000, MR400
• Leverage CBS tools • Footprint rationalization and
productivity gains
2013 KEY STRATEGIES/FOCUS 2013 HIGHLIGHTS
PERFORMANCE UPDATE
CONTINUING TO STRENGTHEN LONG-TERM POSITION

36
STRATEGIC FOCUS
Accelerate profitable foremarket growth by focusing on
product/system innovation• Commercial marine
• Oil & Gas
• Power & Industry
Expand aftermarket sales and service business
• Deepen North America footprint
• Grow internationally leveraging Sicelub acquisition and partnership
with major oil company
Leverage CBS to further optimize manufacturing footprint
and working capital

37
CM-1000 Breakthrough
• Marine operators looking to
increase efficiency and reduce
cost
• CM-1000 developed
incorporating substantial VOC
• Benefits to customer:- Up to 70% energy savings
- 20 kW (750rpm) instead of 64 kW
(1100rpm)
- Significantly reduced carbon footprint
CLOSER LOOK: PRODUCT/SYSTEM INNOVATION
Source: Savings estimated using CM-1000 Simulation Calculator
ACCELERATING PROFITABLE FOREMARKET GROWTH

38
CLOSER LOOK: PRODUCT/SYSTEM INNOVATION
Screen print: CM-1000 Simulation Calculator

39
• “Push” scheduling (controlled
by SAP)
• Material and information flow
inconsistent
• € 88k inventory
CBS IMPACT: RADOLFZELL, GERMANY
SIGNIFICANT IMPROVEMENT OPPORTUNITY EVEN IN LEGACY FACILITIES
BEFORE
Key actions/tools:
• Value stream
map
• One-piece flow
• Setup reduction
• PFEP
AFTER
• “Pull” scheduling (driven by
kanban)
• Clear, visual material and
information flow
• € 26k inventory
Source: Internal Management Reporting

40
ACQUISITION UPDATE
ACQUISITIONS ACCELERATING AFTERMARKET/SERVICE STRATEGY
COMPANY
REGIONSPacific Northwest of United
States
STRATEGIC
RATIONALE
Grow service business;
expand served customer
base
Mexico, Central and South
America
Grow service business;
expand into South America;
broaden service
capabilities/offering
~$10 millionLTM REVENUE ~$45 million
Q3 2013CLOSED Q4 2013

41
SUMMARY
Successfully driving growth in foremarket and highly profitable
service business
Leveraging the tools of CBS to improve productivity and cash
flow
New team gaining traction

Q&A
Journey Toward Excellence
HOWDEN
IAN BRANDER | CEO of Howden
Journey Toward Excellence
44
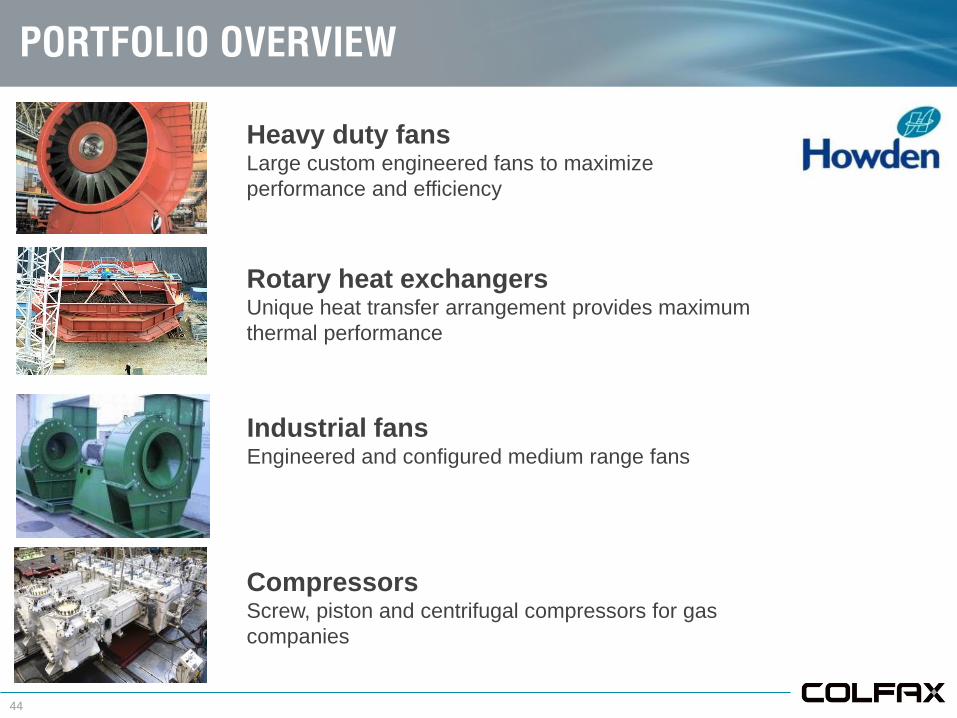
PORTFOLIO OVERVIEW
Heavy duty fansLarge custom engineered fans to maximize
performance and efficiency
Rotary heat exchangersUnique heat transfer arrangement provides maximum
thermal performance
Industrial fans Engineered and configured medium range fans
CompressorsScrew, piston and centrifugal compressors for gas
companies

45
APPLICATION OVERVIEW
Power Main boiler fans, boiler heat recovery, booster fans (environmental)
Mining Surface and underground ventilation, heating and cooling systems
Oil & GasUpstream and downstream oil & gas processing
SteelHot and dusty process exhaust gas handling
CementProcess air supply and exhaust gas handling
TransportationLocomotive motor and brake cooling

46
Served Market Size: ~$7.5B
Long-Term Market Growth: ~4-6%
Market Drivers
• Increasing end-user focus on energy efficiency
• Environmental legislation driving retrofits
• Emerging markets investing in coal-fired power
• Expansion of aftermarket opportunity
Developed
MARKET OVERVIEW
HIGH INTEGRITY PRODUCTS FOR VITAL INDUSTRIES
GEOGRAPHIC MIX
(% of Q3 2013 YTD Revenues)
Foremarket
PRODUCT MIX(1)
(% of Q3 2013 YTD Revenues)
Emerging
Aftermarket
Source: Market Size and Growth from Internal Management Reporting
1) Retrofit included in Foremarket

47
• Exploit environmental opportunities • Continued success in China and
U.S.
• Increase aftermarket capture • Strategic focus continues to
deliver high growth rate
• Grow in mining market • Gained share in soft market
• Improve operational efficiency • Improvements in overhead,
production and sourcing
PERFORMANCE UPDATE
2013 KEY STRATEGIES/FOCUS
FOCUSED EXECUTION DRIVING RESULTS
2013 HIGHLIGHTS

48
PERFORMANCE UPDATE: ENVIRONMENTAL
>10% CAGR FROM REGULATION SINCE EARLY 2000s; SIGNIFICANT OPPORTUNITY REMAINS
• Chinese power plant upgrades winding down
• Environmental opportunities emerging in other
sectors/regions
- Focus shifting to large industrial polluters
- New coal fired plants adding full pollution control measures
- Clean Air Act driving gas cleaning opportunity in South Africa
- Participation in early stage carbon capture development
• Global scale enables Howden to redeploy
resources as demand shifts
Source: Altprofits.com

49
PERFORMANCE UPDATE: MINING
GAINED SHARE IN SOFT MARKET
Mongolian Win
• Mine ventilation and heating solution
• Howden success factors: unique technical
solution, global coverage, excellent support
Copper and gold mine in Mongolia
South American mining operation
South American Win
• Main mine ventilation fans for 1st in new phase
of copper mines
• Howden success factors: energy efficiency,
local support
50
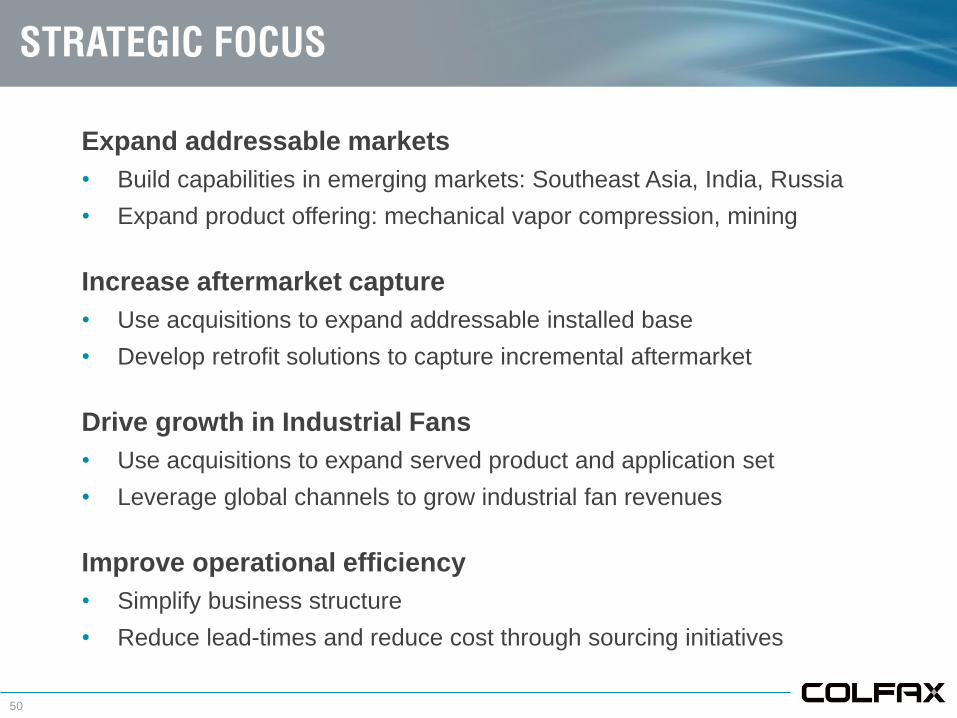
STRATEGIC FOCUS
Expand addressable markets
• Build capabilities in emerging markets: Southeast Asia, India, Russia
• Expand product offering: mechanical vapor compression, mining
Increase aftermarket capture
• Use acquisitions to expand addressable installed base
• Develop retrofit solutions to capture incremental aftermarket
Drive growth in Industrial Fans
• Use acquisitions to expand served product and application set
• Leverage global channels to grow industrial fan revenues
Improve operational efficiency
• Simplify business structure
• Reduce lead-times and reduce cost through sourcing initiatives

51
Two elements:
• Spares and site services – serve our
extensive installed base
• Retrofit - value driven enhancement to
an existing system
CLOSER LOOK: AFTERMARKET STRATEGY
GROWING A STABLE HIGH MARGIN REVENUE STREAM
Differentiators:
• Technology – industry leader with history of success
• Service density – quicker response, better tech
utilization
• Breadth/Scale – 59 facilities in 26 countries
Source: Internal Management Reporting
2006 2007 2008 2009 2010 2011 2012
Howden Aftermarket Development

52
Competitive advantage
• Experienced/broad service network enhances customer
support and creates upgrade opportunities
• Original certified OEM parts ensure equipment integrity and
performance
Geographic success
• North America – Acquisitions provide access to large installed
base (own replacement parts IP for 25+ legacy fan companies)
• China – Significant power plant construction over the past 15
years creates sizeable/growing opportunity
CLOSER LOOK: SPARES & SERVICE
MAXIMIZE PENETRATION OF EXTENSIVE INSTALLED BASE

53
CLOSER LOOK: RETROFIT
USE VALUE SELLING TO CREATE RETROFIT OPPORTUNITIES
Compressor piston ring wear problem solved
Heater seal replacement increases power output
Replacement booster fan on existing foundation
New high pressure blade profile retrofit

54
• 80 day lead-time for wastewater
blower packages
• High WIP for large cooling fans
• Low productivity in
transportation fans area
CBS IMPACT: WEIHAI, CHINA
IMPROVING CUSTOMER SERVICE WHILE REDUCING WORKING CAPITAL
BEFORE
Key actions/tools:
• Cellularization
• Single Piece Flow
• Standard Work
AFTER
• Lead-time compressed to 35
days, reducing inventory $2.6
million
• WIP reduced by 52%
• Productivity improved by 15%
Source: Internal Management Reporting
55
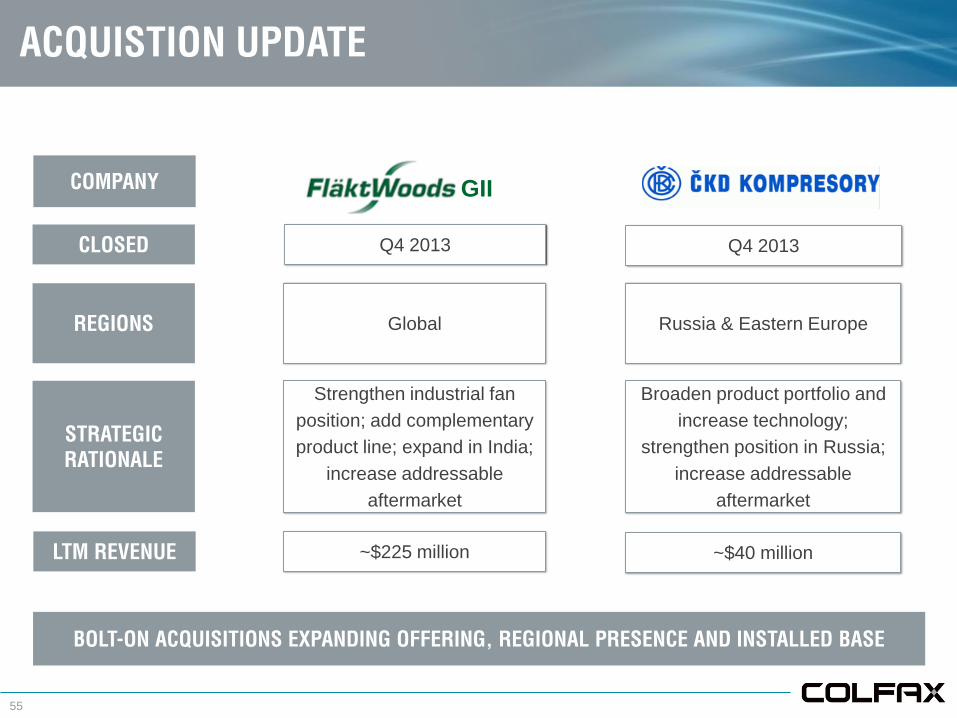
ACQUISTION UPDATE
BOLT-ON ACQUISITIONS EXPANDING OFFERING, REGIONAL PRESENCE AND INSTALLED BASE
COMPANY
REGIONS Global
STRATEGIC
RATIONALE
Strengthen industrial fan
position; add complementary
product line; expand in India;
increase addressable
aftermarket
Russia & Eastern Europe
Broaden product portfolio and
increase technology;
strengthen position in Russia;
increase addressable
aftermarket
GII
~$225 millionLTM REVENUE ~$40 million
Q4 2013CLOSED Q4 2013

56
SUMMARY
Strong performance; room for additional improvement exists
Expanded addressable market provides growth runway
Focus on aftermarket to build stable high margin revenue base

Q&A
Journey Toward Excellence

BAIRD INVESTOR CONFERENCE | NOVEMBER 6, 2013
BREAK
Journey Toward Excellence

BUSINESS DEVELOPMENT
DAN PRYOR | EVP Strategy and Business Development
Journey Toward Excellence

60
GOALS / MODEL
Growth, Margin &
Cash Flow
Improvement
Strategic
Acquisitions
• Strengthen business
– Geographic footprint
– Share/channel
– Products/technologies
– Talent/capabilities
• Accelerate improvement
– Purchasing scale
– Overhead leverage
– Manufacturing consolidation
– Product rationalization
KEY ELEMENT OF COLFAX VALUE CREATION

61
APPROACH / STRATEGY
• Tight linkage with business strategy
– Proactive target identification
– Clear understanding of value creation
• Ensure process rhythm/discipline
– Regular funnel review/prioritization
– Clear view of limits/walk-away points
• Nurture Colfax “acquisition brand”
– Reasonable/trustworthy counterparty
– Nimble/efficient process
ACQUISITION STRATEGY DRIVING RESULTS
• 10 closed transactions
since Charter
• ~$640mm total
consideration
• ~$590mm run-rate
revenues added
• Financial hurdles
achieved

62
CASE STUDY: FANS
Strategic Goals:
• Grow addressable aftermarket
• Enhance industrial fan presence
• Strengthen mining offering
• Expand in India
• Create rationalization opportunities
FAN REVENUES UP APPROXIMATELY 40%
GII
63
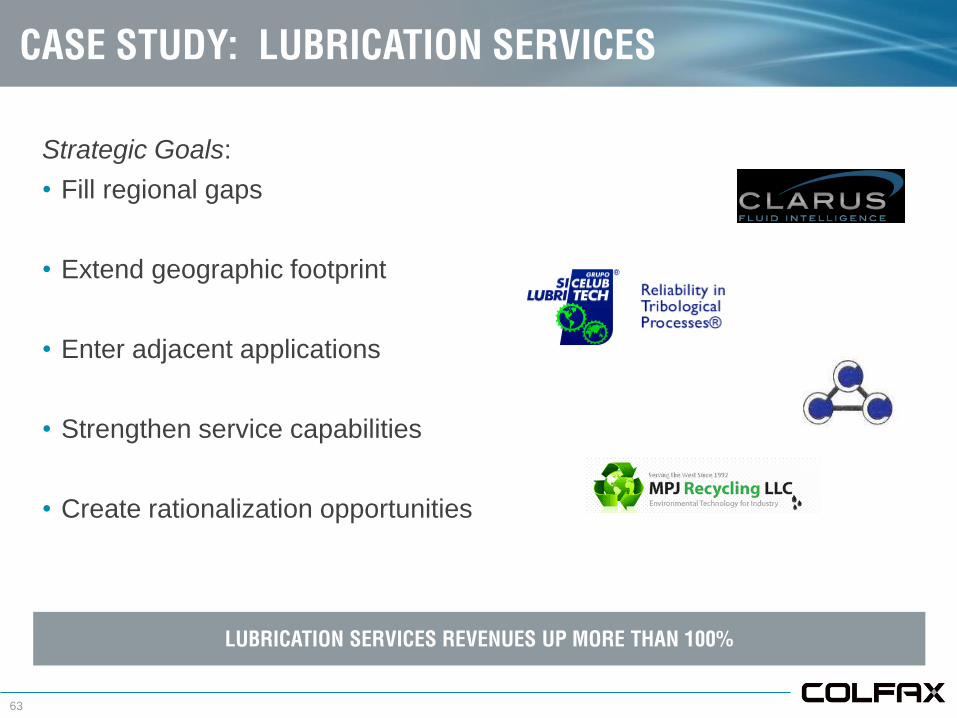
CASE STUDY: LUBRICATION SERVICES
Strategic Goals:
• Fill regional gaps
• Extend geographic footprint
• Enter adjacent applications
• Strengthen service capabilities
• Create rationalization opportunities
LUBRICATION SERVICES REVENUES UP MORE THAN 100%
64
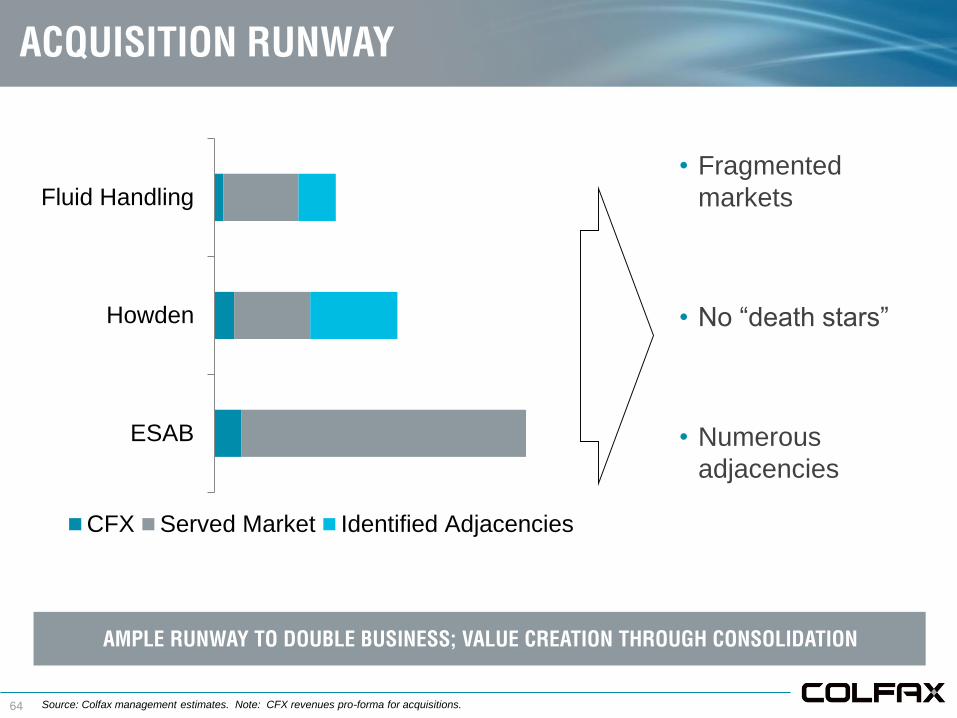
ACQUISITION RUNWAY
ESAB
Howden
Fluid Handling
CFX Served Market Identified Adjacencies
AMPLE RUNWAY TO DOUBLE BUSINESS; VALUE CREATION THROUGH CONSOLIDATION
Source: Colfax management estimates. Note: CFX revenues pro-forma for acquisitions.
• Fragmented
markets
• No “death stars”
• Numerous
adjacencies

65
OUTLOOK
• Broad aperture
– Global reach
– Diverse businesses
• Repeatable process
– Sourcing
– Execution
• Experienced team
– Acquisition
– Integration
PIPELINE REMAINS ROBUST; MAINTAINING VALUE DISCIPLINE
• >$4b of actionable bolt-
on opportunities
• Proactive investment in
execution capability

Q&A
Journey Toward Excellence

COLFAX BUSINESS SYSYEM (CBS)
STEVE WITTIG | SVP, CBS and Supply Chain
Journey Toward Excellence
68
COLFAX BUSINESS SYSTEM (CBS)
MORE THAN A COLLECTION OF TOOLS; A CULTURE/TRADITION OF CONTINUOUS IMPROVEMENT
• Unique business management system
• Repeatable, teachable process
• Focused on creating superior value for customers
• Creating sustainable competitive advantage

69
2012 2013
Developing Competent Expert
STRENGTHENING TEAM; STRONG ENGAGEMENT
EXPERIENCE/SKILL
(# of resources)
CBS RESOURCING
(associates/resource)
EXECUTIVE PARTICIPATION
233
157
2012 2013
40%
60%
80%
100%
PD RCCM Kaizen
CBS BUILD OUT – YEAR 2
Source: Internal Management Reporting

70
CFH28%
ESAB 35%
Howden 37%
Jan Feb Mar Apr May Jun Jul Aug Sep Oct
CBS DEPLOYMENT
Source: Internal Management Reporting
DISTRIBUTION OF KAIZENS PACE OF ACTIVITY
2013
2012
ESAB AND HOWDEN AT RUN RATE AND SUSTAINING

71
• >$200K in delayed customer
payments
• Insufficient/inaccurate change
order documentation
• 139 days to receive customer
approval
CBS IMPACT: NEW ACQUISITION (CLARUS) -
BELLINGHAM, WA
EARLY KAIZENS CRITICAL IN REINFORCING CULTURE AND EXPECTATIONS
BEFORE
Key actions/tools:
• Value stream
mapping
• CEDAC
AFTER
• Reduced time for customer
approval to 30 days
• 100% accuracy in customer
documentation
• Delayed payments reduced
by 56%
Source: Internal Management Reporting
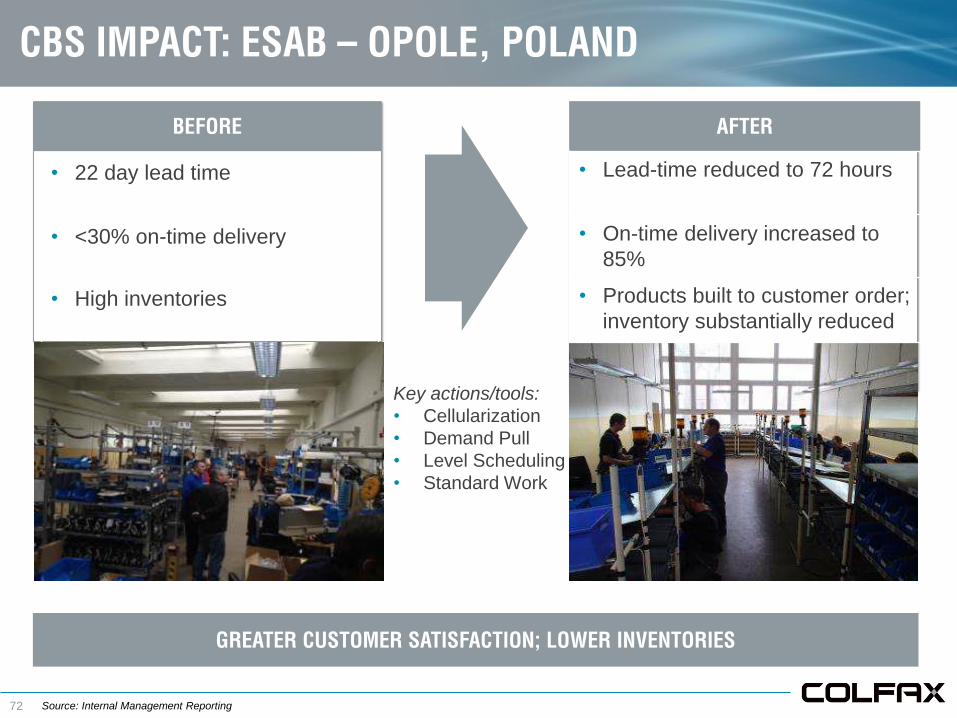
72
• 22 day lead time
• <30% on-time delivery
• High inventories
CBS IMPACT: ESAB – OPOLE, POLAND
GREATER CUSTOMER SATISFACTION; LOWER INVENTORIES
BEFORE
Key actions/tools:
• Cellularization
• Demand Pull
• Level Scheduling
• Standard Work
AFTER
• Lead-time reduced to 72 hours
• On-time delivery increased to
85%
• Products built to customer order;
inventory substantially reduced
Source: Internal Management Reporting

73
• >4 hours setup time
• 11 day lead-time
• 85% OTD
• Product scheduled at multiple
machines, moved numerous
times throughout plant
CBS IMPACT: CFH – MONROE, NC
CONTINUOUS IMPROVEMENT OVER TIME
BEFORE
• Set up time reduced to 2 hours
• 3 day lead-time
• 95% OTD
• Machines relocated to U-
shaped cell with pacemaker
and one-piece flow
Key actions/tools:
• One-piece flow
• Setup reduction
• Standard work
AFTER
Source: Internal Management Reporting

74
CBS TOOLBOX DEVELOPMENT
EXPANDING TOOLKIT IN KEY AREAS OF BUSINESS

SUPPLY CHAIN
Journey Toward Excellence
76
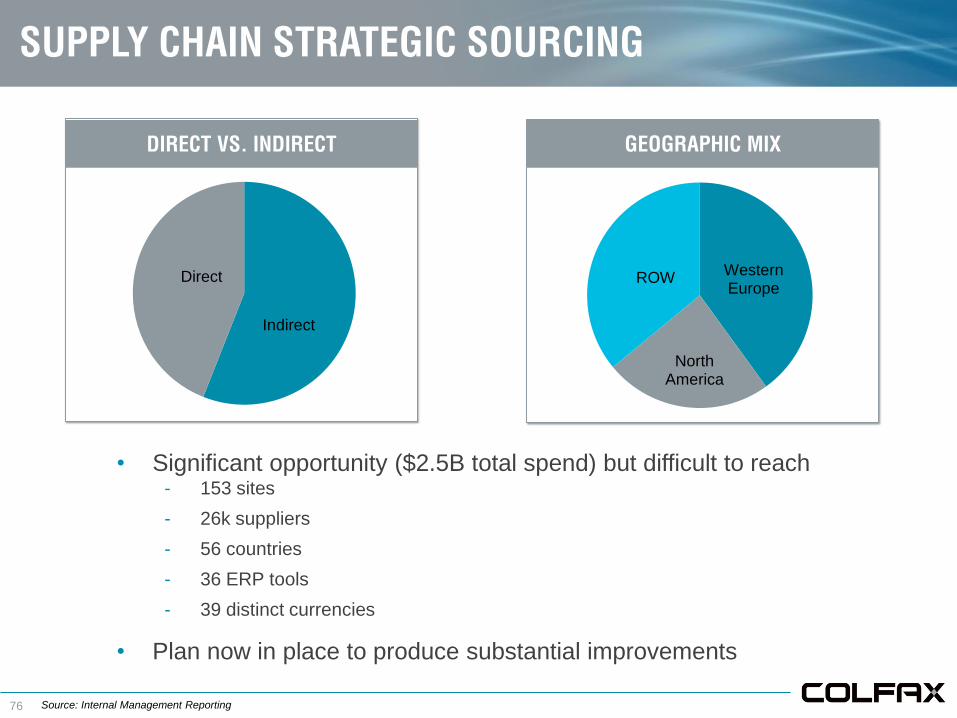
Western Europe
North America
ROW
Indirect
Direct
DIRECT VS. INDIRECT GEOGRAPHIC MIX
• Significant opportunity ($2.5B total spend) but difficult to reach- 153 sites
- 26k suppliers
- 56 countries
- 36 ERP tools
- 39 distinct currencies
• Plan now in place to produce substantial improvements
SUPPLY CHAIN STRATEGIC SOURCING
Source: Internal Management Reporting

77
STRATEGIC FOCUS
SIGNIFICANT OPPORTUNITY IN MATERIAL PRODUCTIVITY AND HEADCOUNT
Improve efficiency of direct/indirect spend
• Leverage size and scale of Colfax
• Supplier consolidation
• LCR opportunity/infrastructure
Leverage CBS to create strategic sourcing capability for
existing and “new” companies
• Utilize Kaizen methodology (CPAS)
• CBS toolbox (e-auction, negotiating)
Top grade/restructure organization
• Leverage centralized team of specialists
• Top grade skills/talent locally
• Develop centers of excellence globally

78
LEVERAGING OUR SPEND…
EUROPEAN FREIGHT
• $24M in annualized spend
• 15 letters sent (as of 8/31/2013)
• $15M of the total spend
Source: Internal Management Reporting

79
• 15 suppliers accepted price (100%)
• 10 suppliers accepted 60 day terms
• 5 suppliers accepted 45 day terms
• $0.75M in annualized savings
• RFQ to be submitted in Q4
…WITH RESULTS
EUROPEAN FREIGHT
Source: Internal Management Reporting
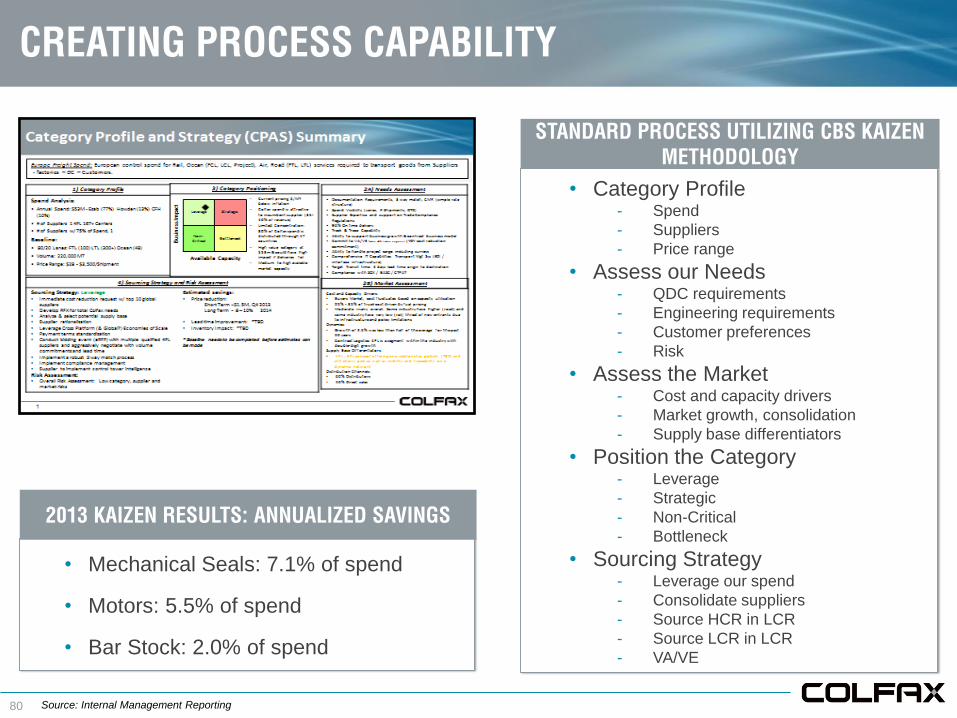
80
• Mechanical Seals: 7.1% of spend
• Motors: 5.5% of spend
• Bar Stock: 2.0% of spend
• Category Profile- Spend
- Suppliers
- Price range
• Assess our Needs- QDC requirements
- Engineering requirements
- Customer preferences
- Risk
• Assess the Market- Cost and capacity drivers
- Market growth, consolidation
- Supply base differentiators
• Position the Category- Leverage
- Strategic
- Non-Critical
- Bottleneck
• Sourcing Strategy- Leverage our spend
- Consolidate suppliers
- Source HCR in LCR
- Source LCR in LCR
- VA/VE
CREATING PROCESS CAPABILITY
STANDARD PROCESS UTILIZING CBS KAIZEN
METHODOLOGY
2013 KAIZEN RESULTS: ANNUALIZED SAVINGS
Source: Internal Management Reporting

81
SUMMARY
Creating culture of continuous improvement
Laying foundation for future value creation
Early stages of building world-class bench

Q&A
Journey Toward Excellence

FINANCIAL UPDATE
SCOTT BRANNAN | SVP and CFO
Journey Toward Excellence
84
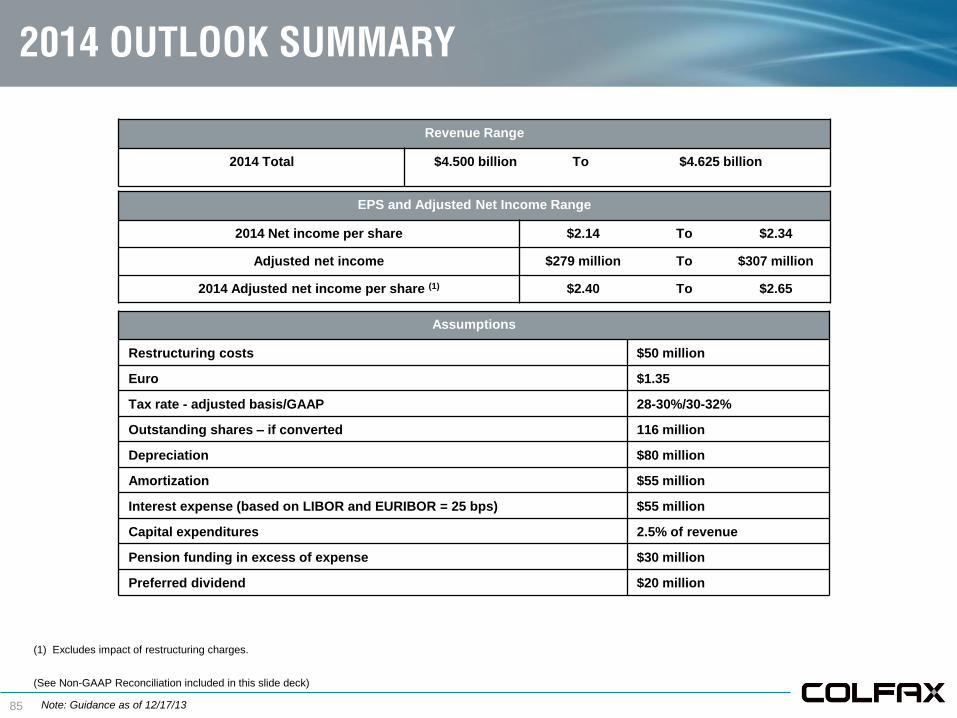
2014 UPDATE
• Organic revenue growth of 1 - 3%
• Excludes any accretion from future acquisitions
• Includes $30 million additional adjusted operating
profit from acquisitions
• Includes $35 million restructuring benefit
85
(1) Excludes impact of restructuring charges.
(See Non-GAAP Reconciliation included in this slide deck)
2014 OUTLOOK SUMMARY
Revenue Range
2014 Total $4.500 billion To $4.625 billion
EPS and Adjusted Net Income Range
2014 Net income per share $2.14 To $2.34
Adjusted net income $279 million To $307 million
2014 Adjusted net income per share (1) $2.40 To $2.65
Assumptions
Restructuring costs $50 million
Euro $1.35
Tax rate - adjusted basis/GAAP 28-30%/30-32%
Outstanding shares – if converted 116 million
Depreciation $80 million
Amortization $55 million
Interest expense (based on LIBOR and EURIBOR = 25 bps) $55 million
Capital expenditures 2.5% of revenue
Pension funding in excess of expense $30 million
Preferred dividend $20 million
Note: Guidance as of 12/17/13

86
2014 ORGANIC GROWTH OUTLOOK
2014 Forecast Organic Growth
Fluid Handling 2-4%
Howden 4-6%
Fabrication Technology (1)-2%
Total Colfax 1-3%
Note: Guidance as of 12/17/13
87
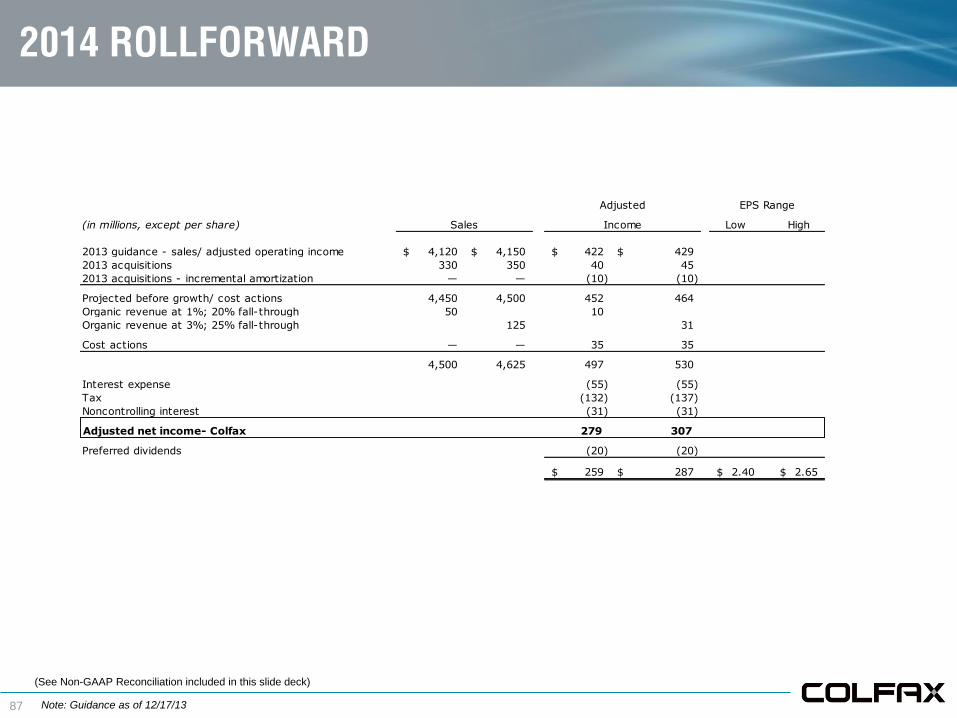
2014 ROLLFORWARD
(in millions, except per share) Low High
2013 guidance - sales/ adjusted operating income 4,120$ 4,150$ 422$ 429$
2013 acquisitions 330 350 40 45
2013 acquisitions - incremental amortization — — (10) (10)
Projected before growth/ cost actions 4,450 4,500 452 464
Organic revenue at 1%; 20% fall-through 50 10
Organic revenue at 3%; 25% fall-through 125 31
Cost actions — — 35 35
4,500 4,625 497 530
Interest expense (55) (55)
Tax (132) (137)
Noncontrolling interest (31) (31)
Adjusted net income- Colfax 279 307
Preferred dividends (20) (20)
259$ 287$ 2.40$ 2.65$
Adjusted EPS Range
Sales Income
(See Non-GAAP Reconciliation included in this slide deck)
Note: Guidance as of 12/17/13

88
SUMMARY
• Continued improvement in low growth environment
• CBS and restructuring keep us on target to met our margin
goals
• Improving financial position and revised credit facility
position us for continued growth
• Deliver 20% plus growth in adjusted EPS

89
NON-GAAP DISCLAIMER
Colfax has provided financial information that has not been prepared in accordance with GAAP. These non-GAAP financial
measures are projected adjusted net income, projected adjusted net income per share, adjusted operating income and
organic sales growth (decline). Projected adjusted net income, projected adjusted net income per share and adjusted
operating income exclude expenses related to major restructuring programs, to the extent they impact the periods
presented. Organic sales growth (decline) and organic order growth (decline) exclude the impact of acquisitions and foreign
exchange rate fluctuations. These non-GAAP financial measures assist Colfax in comparing its operating performance on a
consistent basis because, among other things, they remove the impact of expense related to major restructuring programs.
Sales and order information by end market are estimates. We periodically update our customer groupings order to refine
these estimates.
90
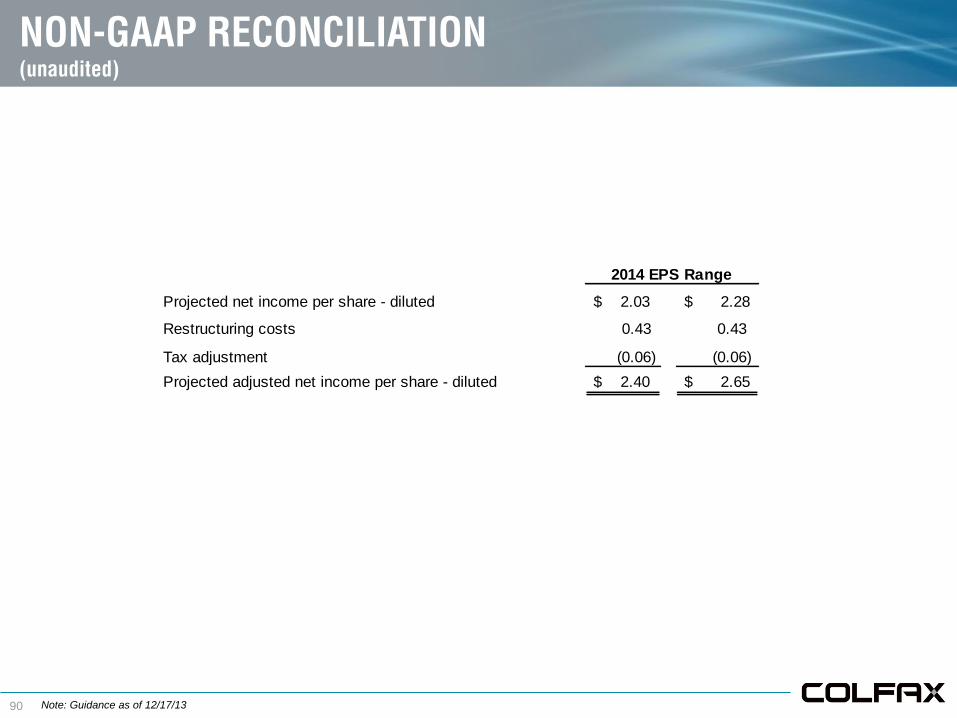
NON-GAAP RECONCILIATION
(unaudited)
Projected net income per share - diluted $ 2.03 $ 2.28
Restructuring costs 0.43 0.43
Tax adjustment (0.06) (0.06)
Projected adjusted net income per share - diluted $ 2.40 $ 2.65
2014 EPS Range
Note: Guidance as of 12/17/13

91
NON-GAAP RECONCILIATION
(unaudited)
Corporate
and Other
Corporate
and Other
Net sales —$ —$
Operating income (loss) 64,135 12.5 % 52,124 10.4 % (13,461) 102,798 10.1 % 32,361 7.0 % 31,357 6.4 % (12,052) 51,666 5.4 %
Charter acquisition-related expense — — — — — — — —
Restructuring and other related charges 3,278 5,459 — 8,737 1,564 12,498 1,803 15,865
Asbestos coverage litigation expense 627 — — 627 3,313 — — 3,313
Fair value adjustments - ESAB/Howden
backlog and inventory amortization expense — — — — 14,455 — — 14,455
Adjusted operating income (loss) 68,040$ 13.3 % 57,583$ 11.4 % (13,461)$ 112,162$ 11.1 % 51,693$ 11.1 % 43,855$ 9.0 % (10,249)$ 85,299$ 8.9 %
954,440$
Q3 2013 - QTD Q3 2012 - QTD
Gas and Fluid
Handling
Fabrication
Technology
Total Colfax
Corporation
Gas and Fluid
Handling
Fabrication
Technology
Total Colfax
Corporation
511,360$ 503,210$ 1,014,570$ 464,873$ 489,567$
Corporate
and Other
Corporate
and Other
Net sales —$ —$
Operating income (loss) 174,597 12.0 % 148,794 9.4 % (36,614) 286,777 9.4 % 93,467 6.7 % 74,642 5.0 % (80,268) 87,841 3.0 %
Charter acquisition-related expense — — — — — 43,617 43,617
Restructuring and other related charges 4,744 12,684 — 17,428 5,379 31,620 6,067 43,066
Asbestos coverage litigation expense 2,801 — — 2,801 8,840 — — 8,840
Fair value adjustments - ESAB/Howden
backlog and inventory amortization expense — — — — 45,597 16,985 — 62,582
Adjusted operating income (loss) 182,142$ 12.5 % 161,478$ 10.2 % (36,614)$ 307,006$ 10.1 % 153,283$ 11.1 % 123,247$ 8.2 % (30,584)$ 245,946$ 8.5 %
2,886,459$
Q3 2013 - YTD Q3 2012 - YTD
Gas and Fluid
Handling
Fabrication
Technology
Total Colfax
Corporation
Gas and Fluid
Handling
Fabrication
Technology
Total Colfax
Corporation
1,453,228$ 1,582,603$ 3,035,831$ 1,386,699$ 1,499,760$
Note: Dollars in thousands

92
SALES & ORDERS GROWTH
(unaudited)
(1) Represents the incremental sales, orders and order backlog as a result of our acquisitions of Charter, Soldex, Co-Vent and Clarus. The impact related to the
Charter Acquisition represents 12 days of activity for ESAB and Howden as the acquisition closed on January 13, 2012.
$ % $ %
For the three months ended September 28, 2012 954.4$ 443.8$
Components of Change:
Existing Businesses 29.1 3.0 % 72.6 16.4 %
Acquisitions(1) 37.6 3.9 % 6.7 1.5 %
Foreign Currency Translation (6.5) (0.6)% 10.2 2.3 %
Total 60.2 6.3 % 89.5 20.2 %
For the three months ended September 27, 2013 1,014.6$ 533.3$
$ % $ % $ %
As of and for the nine months ended September 28,
2012 2,886.5$ 1,475.7$ 1,382.4$
Components of Change:
Existing Businesses 2.4 0.1 % (2.5) (0.2)% 44.7 3.2 %
Acquisitions(1) 180.2 6.2 % 46.2 3.1 % 21.4 1.6 %
Foreign Currency Translation (33.3) (1.1)% (5.8) (0.3)% (1.6) (0.1)%
Total 149.3 5.2 % 37.9 2.6 % 64.5 4.7 %As of and for the nine months ended September 27,
2013 3,035.8$ 1,513.6$ 1,446.9$
Backlog at Period
Net Sales Orders
Net Sales Orders
Note: Dollars in millions

SUMMARY AND OUTLOOK
STEVE SIMMS | President and CEO
Journey Toward Excellence

94
KEY POINTS FROM THE DAY
Strategic logic intact
• Business quality
• Organic growth potential
• Acquisition runway
Making progress toward goals
• Financial/operational metrics
• Organizational strength
• Business expansion
Increasing emphasis on growth while continuing to drive
performance
BUILDING FOUNDATION FOR LONG-TERM GROWTH

95
• Growth: GDP + 1-2%
organic growth, accelerated
by acquisitions
• Margins: mid-teens
operating margins
• Cash flow: FCF
consistently in excess of
net income
LONG-TERM GOALS
DELIVERING CONSISTENT OUT-PERFORMANCE
We are dedicated to creating an
enduring premier global enterprise
built on a unique business culture
that…
• Does all things with integrity,
respect and candor
• Has a deep commitment to
excellence to associates and
customers as its foundation
• Is known for consistent delivery
of world-class performance

96
SUMMARY
UNIQUE PLATFORM FOR SUSTAINED VALUE CREATION
GROWTH
RUNWAY
ATTRACTIVE
BUSINESS
CBS
CULTURE

JOURNEY TOWARD EXCELLENCE