joyce e. berg, forrest d. nelson george r. neumann thomas
TRANSCRIPT

1
Joyce E. Berg,Forrest D. NelsonGeorge R. NeumannThomas A. Rietz
Note: References are in the handout “Research Bibliography”
2
MarketInformation
Design
TradersContracts
Prediction
3
� Accuracy� Polls and Markets� Market Dynamics� Forecast Standard Errors� Trader Characteristics� Trader Interaction� Biases and Small Markets� Other Arenas� Opportunities and Issues

4
� At short horizons, prices are accurate and unbiased predictors
– Berg, Forsythe, Nelson and Rietz, 2001– Berg and Rietz, 2001a
� At long horizons, bid/ask midpoints are efficient forecasts
– Berg, Nelson and Rietz, 2001� Incentives matter
– Gruca, Berg and Cipriano, 2002– Camerer and Hogarth, 1999

5
Berg, Forsythe, Nelson and Rietz (2001)
0
10
20
30
40
50
60
70
80
90
100
0 10 20 30 40 50 60 70 80 90 100Actual Outcome (%)
Pred
icte
d O
utco
me
(%)
US Presidential ElectionsAvg. Abs. Err. = 1.37%(5 Markets, 12 Contracts)Other US ElectionsAvg. Abs. Err. = 3.43%(14 Markets, 50 Contracts)Non-US ElectionsAvg. Abs. Err. = 2.12%(30 Markets, 175 Contracts)

6
0
0.1
0.2
0.3
0.4
0.5
0.6
0.7
0.8
0.9
1
.00-.20 .20-.40 .40-.60 .60-.80 .80-1.00
Price Range
Pred
icte
d an
d Ac
tual
Fre
quen
cy
IEM Price Payoff
Berg and Rietz, 2002a

7
� At short horizons, markets are on par with polls– Berg, Forsythe, Nelson and Rietz, 2001
� At long horizons, markets outperform polls– Berg, Nelson and Rietz, 2001
� Polls do not drive the market, the market leads polls according to Granger tests
– Forsythe, Nelson, Neumann and Wright, 1992

8
Berg, Forsythe, Nelson and Rietz (2001)
0.0%0.5%1.0%1.5%2.0%2.5%3.0%3.5%4.0%4.5%5.0%
88 U
S P
res.
92 U
S P
res.
(2w
ay)
92 U
S P
res.
(3w
ay)
96 U
S P
res.
00 U
S P
res.
95 A
ustr
ia
96 A
ustr
ia (E
P)
90 D
enm
ark
95 F
ranc
e
90 G
erm
any(
B)
90 G
erm
any(
F)
90 G
erm
any(
L)
94 G
erm
any
98 G
erm
any
91 T
urke
y
Ave
rage
Mea
n A
bsol
ute
Err
or
Final PollsMarket-Election eveMarket-Last Week

9
(Berg, Nelson and Rietz, 2001)
Z
Z
ZZ
ZZ
Z
Z
Z
Z
Z
ZZ
T
TTTT
T
TTT
T
T
T
P
P
P
P
P
P
PP
PP
P
N
NN
NN
N
N
N
NN
NL
LLLL
L
L
L
L
LL
H
H
H
H
H
H
H
HH
H
G
G
GG
GG
GG
G
G
G
G
G
G
GG
G
G
G
G
G
GG
G
GGG
G
G
G
GG
G
GGG
GG
GG
G
GG
G
GC
CC
CC
C
CC
C
C
C
C
C
C CA
A
A
AAA
A
AA
AA
A
A
A
A
A
A
AA
AA
AA
AA
A
A
A
-10%-5%0%5%
10%15%20%25%30%35%40%
01-F
eb15
-Feb
01-M
ar15
-Mar
29-M
ar12
-Apr
26-A
pr10
-May
24-M
ay07
-Jun
21-J
un05
-Jul
19-J
ul02
-Aug
16-A
ug30
-Aug
13-S
ep27
-Sep
11-O
ct25
-Oct
Pred
icte
d Cl
into
n W
inni
ng M
argi
n MarketOutcomeRep. Conv.Dem. Conv.DebatesSuper Tuesday
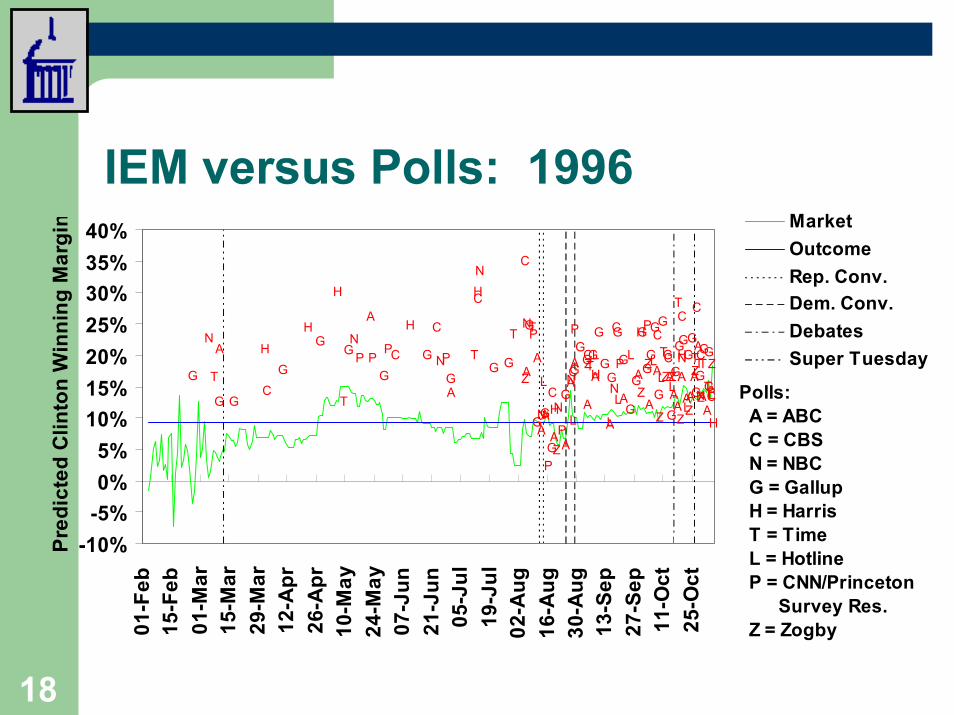
Polls: A = ABC C = CBS N = NBC G = Gallup H = Harris T = Time L = Hotline P = CNN/Princeton Survey Res. Z = Zogby

10
Berg, Nelson and Rietz, 2001
� The market dominates polls at long horizons
Days included in sample Item 1988 1992 1996 2000 all years
All (from the beginning of the market
Number of pollspoll “wins”
market “wins”% market
p-value (1sided)
59 25 34
58% 0.148
151 43 108 72% 0.000
157 21 136 87% 0.000
229 56 173 76% 0.000
596 145 451 76% 0.000
Last 100 Number of pollspoll “wins”
market “wins”% market
p-value (1sided)
45 24 21
47% 0.724
82 23 59
72% 0.000
124 18 106 85% 0.000
180 54 126 70% 0.000
431 119 312 72% 0.000
11
� Large, developed market bid/ask midpoints follow a random walk
– Initially, they may not– Thin markets may not– Berg, Nelson and Rietz, 2001
� Markets react quickly– Powell Nomination Market among others– Berg and Rietz, 2002b
� Markets can help identify meaningful news– Forsythe, Nelson, Neumann and Wright, 1992
� Arbitrage opportunities are capped in large markets, but may be pervasive in small markets
– Forsythe, Ross and Rietz, 1999, Oliven and Rietz, 2002, Rietz, 1998

12
NLLS versus Time Series Estimation Results (Berg, Nelson and Rietz, 2001)
Election Year Item 1988 1992 1996 2000
OLS/Bootstrap Time Series Estimates Constant -0.0011 0.0031 0.0077 0.0001
Robust Std. Err. 0.0007 0.0014 0.0056 0.0009 Lagged Spread 0.9874 0.9282* 0.9312 0.9480
Robust Std. Err. 0.0189 0.0316 0.0547 0.0411 Bootstrap Std. Err. 0.0185 0.0882 0.0948 0.0870
NLLS Estimates Lagged Spread 1.0149 1.0028 1.0093
Robust Std. Err. 0.0068 0.0014 0.0073 Z-Test vs Bootstrap -0.9804 -0.7552 -0.7021
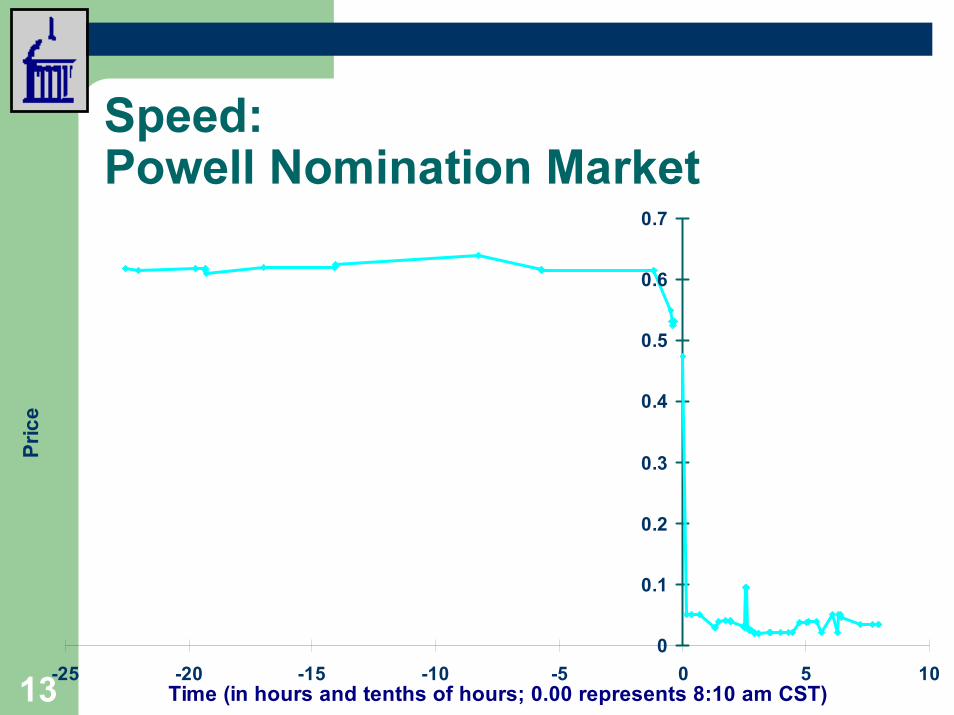
130
0.1
0.2
0.3
0.4
0.5
0.6
0.7
-25 -20 -15 -10 -5 0 5 10Time (in hours and tenths of hours; 0.00 represents 8:10 am CST)
Pric
e

14
Berg, Nelson and Rietz, 2001
0%
10%
20%
30%
40%
50%
60%
70%
80%
90%
100%
1/1
1/8
1/15
1/22
1/29 2/
52/
122/
192/
26 3/4
3/11
3/18
3/25 4/
14/
84/
154/
224/
29 5/6
5/13
5/20
5/27 6/
36/
10
Pred
icte
d Vo
te S
hare
Events D&R Final Perot D&R
Pero
t “D
rops
”
Dem
. C
onv.
Pero
t Ent
ers
Rep
. Con
v.
Deb
ates

15
� Since markets follow a random walk, forecast standard errors increase at approximately root-t
– Berg, Nelson and Rietz, 2001� Inter-market relationships also show this
– Berg, Nelson and Rietz, 2001

16
-80%
-60%
-40%
-20%
0%
20%
40%
60%
80%
7/30
8/13
8/27
9/10
9/24
10/8
10/2
2
11/5
Dem
-Rep
Vot
e Sh
are
Market PredictionActual95% Conf. (Random Walk)95% Conf. (AR(1))95% Conf (Imp. Volatility)95% Conf. (Fitted AR(1))
Random Walk Sigma: 0.85%
Call election for Bush10/29 (-9 days) &
11/6 (-1 day)

17
-80%
-60%
-40%
-20%
0%
20%
40%
60%
80%
7/28
8/11
8/25 9/
8
9/22
10/6
10/2
0
11/3
Dem
-Rep
Vot
e Sh
are
Market PredictionActual95% Conf. (Random Walk)95% Conf. (AR(1))95% Conf (Imp. Volatility)95% Conf. (Fitted AR(1))
Random Walk Sigma: 0.75%
Call election for Clinton9/14 (-52 days)
18
Z
Z
ZZ
ZZ
Z
Z
Z
Z
Z
ZZ
T
TTTT
T
TTT
T
T
T
P
P
P
P
P
P
PP
PP
P
N
NN
NN
N
N
NNN
NL
LL
LL
L
L
L
L
LL
H
H
H
H
H
H
H
HH
H
G
G
GG
GG
GG
G
G
G
G
G
G
GG
G
G
G
G
G
GG
G
GGG
G
G
G
GG
G
GGG
GG
GG
G
GG
G
GC
CC
C
CC
CC
C
C
C
C
C
C CA
A
A
AAA
A
AA
AA
A
A
A
A
A
A
AA
AAA
A
AA
A
A
A
-10%-5%0%5%
10%15%20%25%30%35%40%
01-F
eb15
-Feb
01-M
ar15
-Mar
29-M
ar12
-Apr
26-A
pr10
-May
24-M
ay07
-Jun
21-J
un05
-Jul
19-J
ul02
-Aug
16-A
ug30
-Aug
13-S
ep27
-Sep
11-O
ct25
-Oct
Pred
icte
d C
linto
n W
inni
ng M
argi
n MarketOutcomeRep. Conv.Dem. Conv.DebatesSuper Tuesday
Polls: A = ABC C = CBS N = NBC G = Gallup H = Harris T = Time L = Hotline P = CNN/Princeton Survey Res. Z = Zogby

19
� A representative sample is not necessary – Forsythe, Nelson, Neumann and Wright, 1992, Forsythe,
Ross and Rietz, 1999, Berg, Nelson and Rietz, 2001� Many traders are biased
– Forsythe, Nelson, Neumann and Wright, 1992, Forsythe, Ross and Rietz, 1999
� Large markets overcome this– Forsythe, Nelson, Neumann and Wright, 1992, Forsythe,
Ross and Rietz, 1999� Small market may not
– Forsythe, Ross and Rietz, 1999

20
� Traders self-select into roles– Forsythe, Nelson, Neumann and Wright, 1992, Forsythe,
Ross and Rietz, 1999, Oliven and Rietz, 2002� “Marginal” traders seem less affected by bias
– Forsythe, Nelson, Neumann and Wright, 1992, Forsythe, Ross and Rietz, 1999
� Market makers seem more rational– Forsythe, Ross and Rietz, 1999, Oliven and Rietz, 2002

21
� Small markets may be more affected by irrationality and biases
– Forsythe, Ross and Rietz, 1999, Oliven and Rietz, 2002, and Rietz, 1998
� Market structure matters– Protects traders from their own mistakes and minimizes
impact on prices in large markets– Oliven and Rietz, 2002
� WTA markets may have a slight overconfidence bias at intermediate horizons
– Berg and Rietz, 2001a
22
� Markets have been run successfully in:– Accounting projections
� Berg, Dickhaut, Hughes, McCabe and Rayburn, 1995– Movie box office projections
� Gruca, 2000, and Gruca, Berg and Cipriano, 2002 � Hollywood Stock Exchange
– Corporate sales� Plott, 1999
– Completion dates� Ortner, 1997 & 1998
– Conditional markets� Berg and Rietz, 2002b

23
Berg and Rietz, 2002b
� Could markets tell us about things that may or may not happen?
� Examples: – Would Powell have won if he ran against Clinton in 1996?– Was Dole the right candidate to run against Clinton?– Will this movie idea be a blockbuster?– Will a terrorist attack occur and, if so, under what National
Security Threat Level?� Combinations of regular and conditional markets
can help answer such questions
24
� Republican nomination (event probability) market – Question: Who will win the Republican nomination?– Contracts
� Dole: $1 if Dole is the Republican nominee� Forbes: $1 if Forbes is the Republican nominee� Etc.
� Presidential winner-takes-all (event probability) market
– Question: Who will win the Presidency?– Contracts
� Clin: $1 if Clinton wins the popular vote� OTDem: $1 if another Democrat wins the popular vote� Rep: $1 if a Republican wins the popular vote� Other: $1 if another candidate wins the popular vote

25
0
0.1
0.2
0.3
0.4
0.5
0.6
0.7
0.8
0.9
1
2/4/19
96
2/11/1
996
2/18/1
996
2/25/1
996
3/3/19
96
3/10/1
996
Fore
cast
Pro
babi
litie
s fo
r Dol
e's
Nom
inat
ion/
Perc
ent o
f Del
egat
es
Com
mitt
ed to
Dol
e
0.42
0.44
0.46
0.48
0.5
0.52
0.54
Fore
cast
Pro
babi
litie
s fo
r Clin
ton
Elec
tion
Win
Dole Win Nomination Dole Percent of Delegates Clinton Win Election

26
� Conditional Vote Share Market– Contracts
� V.DOLE: $1 * Doles vote share if Dole is nominated� CL|DOLE: $1 * Clinton’s vote share against Dole if
Dole is nominated� V.FORB: $1 * Forbes vote share if Forbes is nominated� CL|FORB: $1 * Clinton’s vote share against Forbes if
Forbes is nominated� Etc.
� Prices predict conditional vote shares

27
Republicans vs. Clinton
-40%
-30%
-20%
-10%
0%
10%
20%
30%
40%
2/4/
1996
2/6/
1996
2/8/
1996
2/10
/199
6
2/12
/199
6
2/14
/199
6
2/16
/199
6
2/18
/199
6
2/20
/199
6
2/22
/199
6
2/24
/199
6
2/26
/199
6
2/28
/199
6
3/1/
1996
3/3/
1996
3/5/
1996
3/7/
1996
3/9/
1996
3/11
/199
6
3/13
/199
6
Date
Rep
ublic
an V
ote
Mar
gin
Dole Alexander Forbes GrammOther Max Others Avg. Others
LA IA NH DEAZ, ND & SD SC
Multi.2
Multi.1
Primaries and Caucauses
NY

28
� Powell nomination (event probability) market – Question: Will Powell’s name be placed in nomination at
the 1996 Republican Convention?– Contracts
� P.YES: $1 if Powell’s name placed in nomination� P.NO: $1 if Powell’s name not placed in nomination
� Presidential winner-takes-all (event probability) market
– Question: Who will win the Presidency?– Contracts
� Clin: $1 if Clinton wins the popular vote� OTDem: $1 if another Democrat wins the popular vote� Rep: $1 if a Republican wins the popular vote� Other: $1 if another candidate wins the popular vote

29
0.00
0.10
0.20
0.30
0.40
0.50
0.60
0.70
0.80
9/1/
1995
9/8/
1995
9/15
/199
5
9/22
/199
5
9/29
/199
5
10/6
/199
5
10/1
3/19
95
10/2
0/19
95
10/2
7/19
95
11/3
/199
5
11/1
0/19
95
11/1
7/19
95
11/2
4/19
95
Date
Fore
cast
Pro
babi
litie
s fo
r Po
well's
Nom
inat
ion
0.400.420.440.460.480.500.520.540.560.580.60
Fore
cast
Pro
babi
litie
s fo
r Cl
into
n El
ectio
n W
in
Powell Nomination Clinton Win

30
� The good news:– Markets are good information aggregators
� Absolutely� Relative to next best alternative
– Markets seem to be good forecasters– Markets can even tell us about what might have been
� Caveats and Issues– Incentives and market structure important– Subject pool important
� Markets can only aggregate what’s known– Traders make mistakes and display biases
� Do they affect markets and, if so, when and how?– Small markets