jrc- brussels- pf jrc brussels 1 iiasa-accent-vienna 27.01.2004 jrc brussels1 the ipcc ar4...
Post on 19-Dec-2015
221 views
TRANSCRIPT

JRC- Brussels- PF
JRC Brussels JRC Brussels 1IIASA-ACCENT-Vienna 27.01.2004
JRC Brussels 1
The IPCC AR4 Experiment II: Air pollution and climate change in 2030
The team:
Frank Dentener, JRC emissions, deposition, organisation.
David Stevenson, Un. Edinburghozone budgets, climate change, organisation
H. Eskes, KNMI NO2 columns
Kjerstin Ellingsen, Un. Oslo:surface ozone+data handling, web-site
+ ca. 20 participating groups from Europe, US, and Japan.

JRC- Brussels- PF
JRC Brussels JRC Brussels 2IIASA-ACCENT-Vienna 27.01.2004
JRC Brussels 2
Model InstituteContact,e-mail addresses
Domain / resolution Underlying GCM/ Meteorology Advection scheme Convection scheme
IASB IASB/BelgiumJ.-F. Mü[email protected]
5 x 525 levelssfc – 50 hPa
monthly means from ECMWF reanalyses(1993-2001 ERA40)
semi-Lagrangian [Smolarkiewicz and Rasch, 1991]
described in Costen et al. [1998]; cumulo-nimbus distrbution taken from ISCCP
KNMI KNMI / IMAUUtrecht
Twan van NoijePeter van Velthoven
2lat x 3lon25 levelssfc – 0.48 hPa
ECMWF 6-h operational forecasts (2000)
Slopes scheme [Russel and Lerner, 1981]
mass flux scheme of Tiedtke [1989]
TM5 [email protected]@jrc.it
1lat x 1lonzoom over Europe, N. America, and Asia, other wise 6x425 levelssfc – 0.48 hPa
ECMWF 3-6-h operational forecasts (2000)
Slopes scheme [Russel and Lerner, 1981]
mass flux scheme of Tiedtke [1989]
MATCH-MPIC
Max Planck Institute for Chemistry / NCAR
[email protected] x 5.628 levelssfc – 2 hPa
NCEP/NCAR Reanalysis and ECMWF Reanalysis
SPITFIRE [Rasch and Lawrence, 1998]
Zhang and McFarlane [1995] for deep convection; Hack [1994] for shallow convection
UIO2 University of OsloMichael [email protected]
2.8x2.8 40 levelssfc – 10 hPa
ECMWFforecast data
Second Order Moments [Prather, 1986]
mass flux scheme of Tiedke [1989]
LMDz/INCA
LSCE Didier Hauglustaine ([email protected])Sophie Szopa ([email protected])
1.lon x 2.5 lat
19 levels sfc - 3hPa
GCM (or nudged to ECMWF/ERA15-ERA40-OD)
Finite Volume second order (Van Leer, 1977)
mass flux scheme of Tiedke [1989]
STOCHEM-HadGEM
UK Met Office3.75 x 2.520 levelssfc – 40km
GCM(HadGEM)
Lagrangian Described in Collins et al. [2002]
GEOS-CHEM
LMCA-EPFL [email protected] 4°latx5°lon30 levelssfc – 0.01hPa
GEOS windsNASA GMAO
Lin and Rood scheme [Lin and Rood, 1996]
mass fluxes are taken directly from the GISS 2’ meteorology described by Allen et al. [1997]
CHASER FRCGC Kengo [email protected]
2.8x2.8 32 levelssfc – 3 hPa
GCM (CCSR/NIES)
Lin and Rood scheme [Lin and Rood, 1996]
prognostic Arakawa-Schubert scheme in CCSR/NIES GCM
MOCAGE Météo-France, CNRM [email protected], [email protected]°x2°47 levelssfc – 5 hPa
ARPEGE operational analyses (Météo-France), 6 hourlyOptions : forecasts, ECMWF analyses or re-analyses.
Semi-lagrangian [Williamson and Rasch, 1989]
Mass flux scheme [Bechtold et al. , 2001]Option: [Tiedke, 1989]
FRSGC_UCI FRCGC Oliver Wild [email protected] T4237 levels, sfc-2 hPa
ECMWF-IFS pieced-forecast data for 2000
Second order moment [Prather, 1987]
Mass flux scheme of Tiedke [1989]
ULAQ L’Aquila University Veronica [email protected]
Gianni [email protected]
10°X22.5°26 levelssfc-0.04 hPa
GCM Eulerian flux form Pitari et al (2002) following Muller and Brasseur (1995)
GMIDAO NASA-GSFC Jose M. [email protected]
Susan [email protected]
4x546 levelssfc – 0.15 mb
NASA-GMAO(GEOS-STRAT)
Lin and Rood (1996)Utilize archived mass fluxes - Transport scheme from MATCH
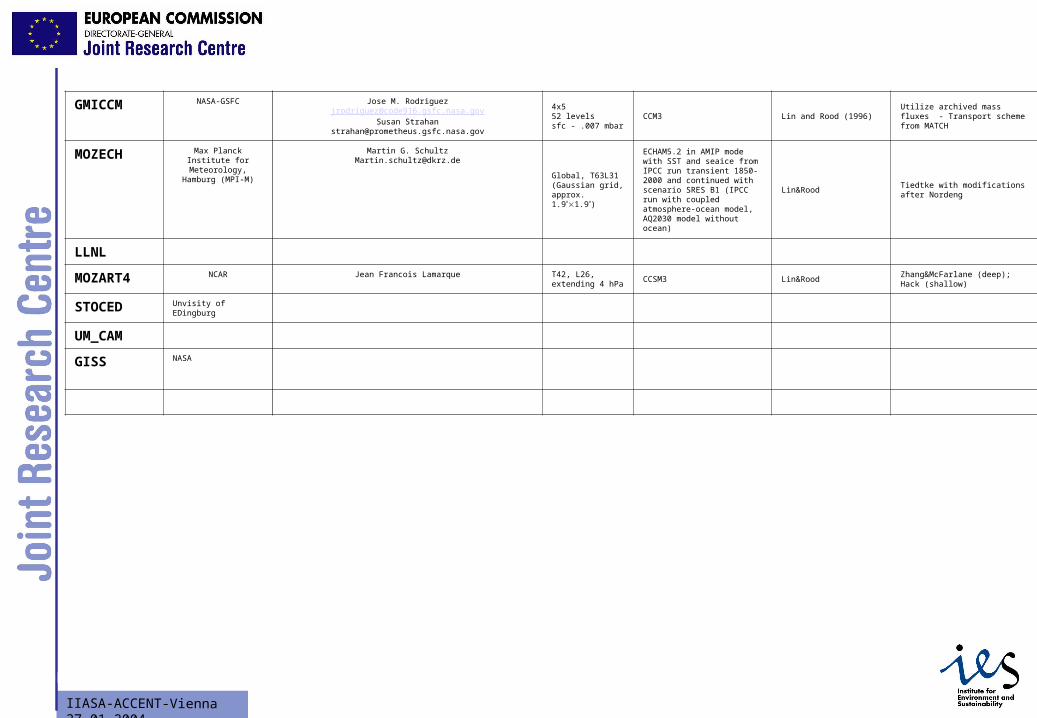
GMICCM NASA-GSFC Jose M. [email protected]
Susan [email protected]
4x552 levelssfc - .007 mbar
CCM3 Lin and Rood (1996)Utilize archived mass fluxes - Transport scheme from MATCH
MOZECH Max Planck Institute for Meteorology, Hamburg
(MPI-M)
Martin G. [email protected]
Global, T63L31 (Gaussian grid, approx. 1.91.9)
ECHAM5.2 in AMIP mode with SST and seaice from IPCC run transient 1850-2000 and continued with scenario SRES B1 (IPCC run with coupled atmosphere-ocean model, AQ2030 model without ocean)
Lin&RoodTiedtke with modifications after Nordeng
LLNL
MOZART4 NCAR Jean Francois Lamarque T42, L26, extending 4 hPa
CCSM3 Lin&RoodZhang&McFarlane (deep); Hack (shallow)
STOCED
UM_CAM
MOZ2-GFDL
JRC- Brussels- PF
JRC Brussels JRC Brussels 3IIASA-ACCENT-Vienna 27.01.2004
JRC Brussels 3
GMICCM NASA-GSFC Jose M. [email protected]
Susan [email protected]
4x552 levelssfc - .007 mbar
CCM3 Lin and Rood (1996)Utilize archived mass fluxes - Transport scheme from MATCH
MOZECH Max Planck Institute for Meteorology, Hamburg
(MPI-M)
Martin G. [email protected]
Global, T63L31 (Gaussian grid, approx. 1.91.9)
ECHAM5.2 in AMIP mode with SST and seaice from IPCC run transient 1850-2000 and continued with scenario SRES B1 (IPCC run with coupled atmosphere-ocean model, AQ2030 model without ocean)
Lin&RoodTiedtke with modifications after Nordeng
LLNL
MOZART4 NCAR Jean Francois Lamarque T42, L26, extending 4 hPa
CCSM3 Lin&RoodZhang&McFarlane (deep); Hack (shallow)
STOCED Unvisity of EDingburg
UM_CAM
GISS NASA
JRC- Brussels- PF
JRC Brussels JRC Brussels 4IIASA-ACCENT-Vienna 27.01.2004
JRC Brussels 4
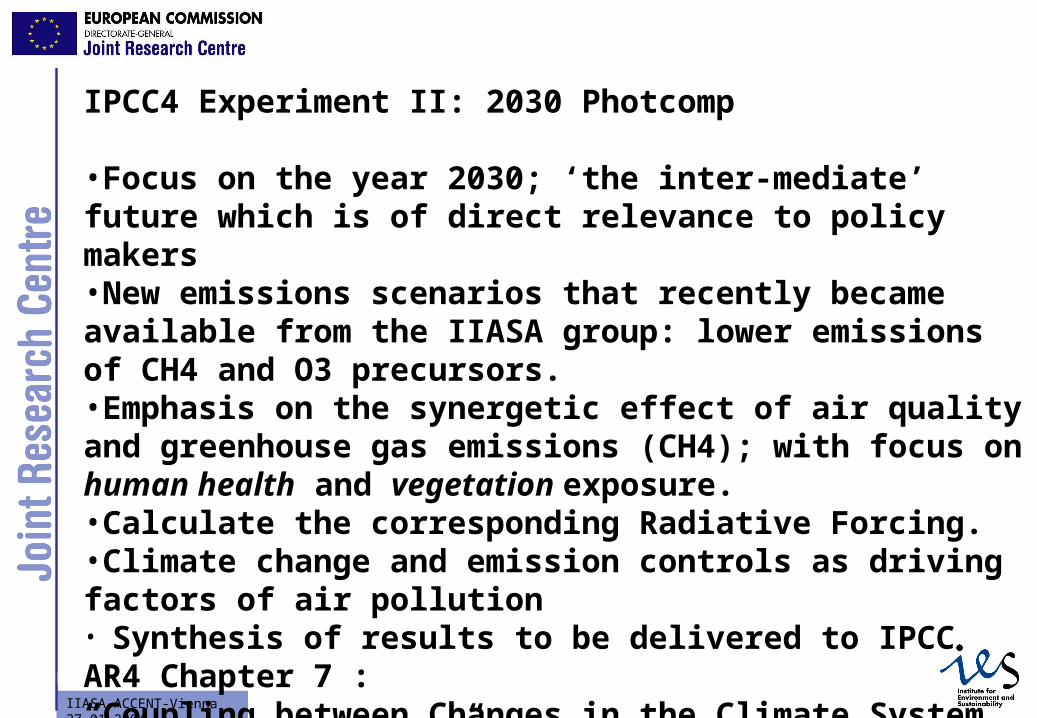
IPCC4 Experiment II: 2030 Photcomp
•Focus on the year 2030; ‘the inter-mediate’ future which is of direct relevance to policy makers•New emissions scenarios that recently became available from the IIASA group: lower emissions of CH4 and O3 precursors.•Emphasis on the synergetic effect of air quality and greenhouse gas emissions (CH4); with focus on human health and vegetation exposure.•Calculate the corresponding Radiative Forcing.•Climate change and emission controls as driving factors of air pollution• Synthesis of results to be delivered to IPCC AR4 Chapter 7 :“Coupling between Changes in the Climate System and Biogeochemistry”
JRC- Brussels- PF
JRC Brussels JRC Brussels 5IIASA-ACCENT-Vienna 27.01.2004
JRC Brussels 5
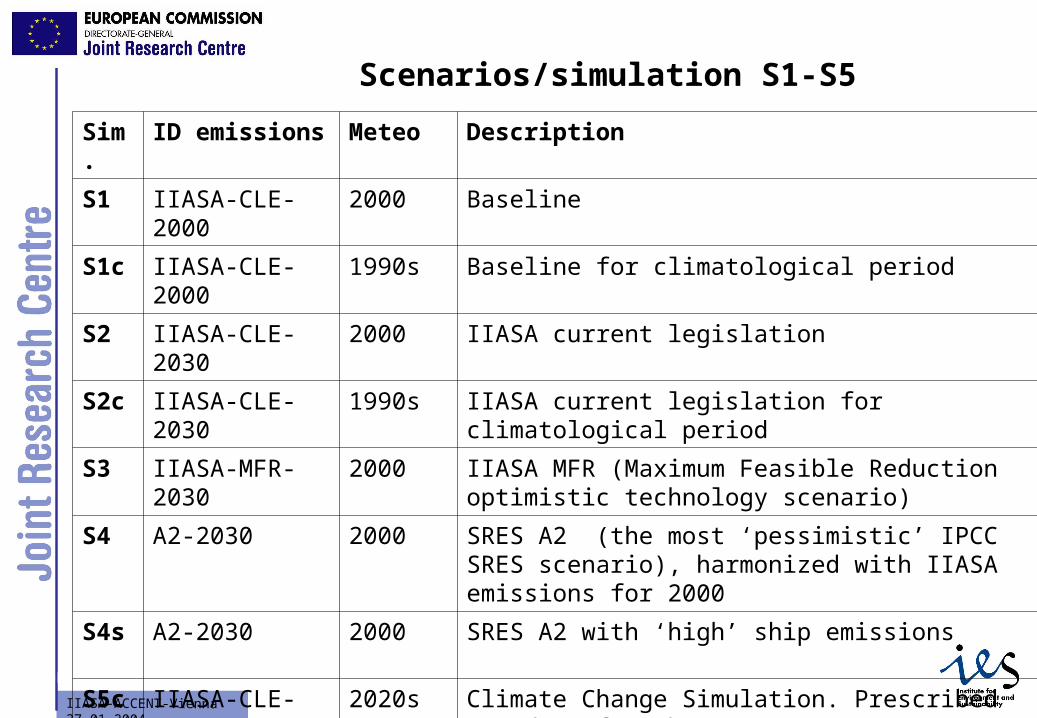
Scenarios/simulation S1-S5
Sim. ID emissions Meteo Description
S1 IIASA-CLE-2000 2000 Baseline
S1c IIASA-CLE-2000 1990s Baseline for climatological period
S2 IIASA-CLE-2030 2000 IIASA current legislation
S2c IIASA-CLE-2030 1990s IIASA current legislation for climatological period
S3 IIASA-MFR-2030
2000 IIASA MFR (Maximum Feasible Reduction optimistic technology scenario)
S4 A2-2030 2000 SRES A2 (the most ‘pessimistic’ IPCC SRES scenario), harmonized with IIASA emissions for 2000
S4s A2-2030 2000 SRES A2 with ‘high’ ship emissions
S5c IIASA-CLE-2030 2020s Climate Change Simulation. Prescribed SST data for the 2020s.
JRC- Brussels- PF
JRC Brussels JRC Brussels 6IIASA-ACCENT-Vienna 27.01.2004
JRC Brussels 6
50
70
90
110
130
150
170
190
2000 2010 2020 2030 2040 2050 2060 2070 2080 2090 2100
TgN
O/y
ear
A1BA2B1B2
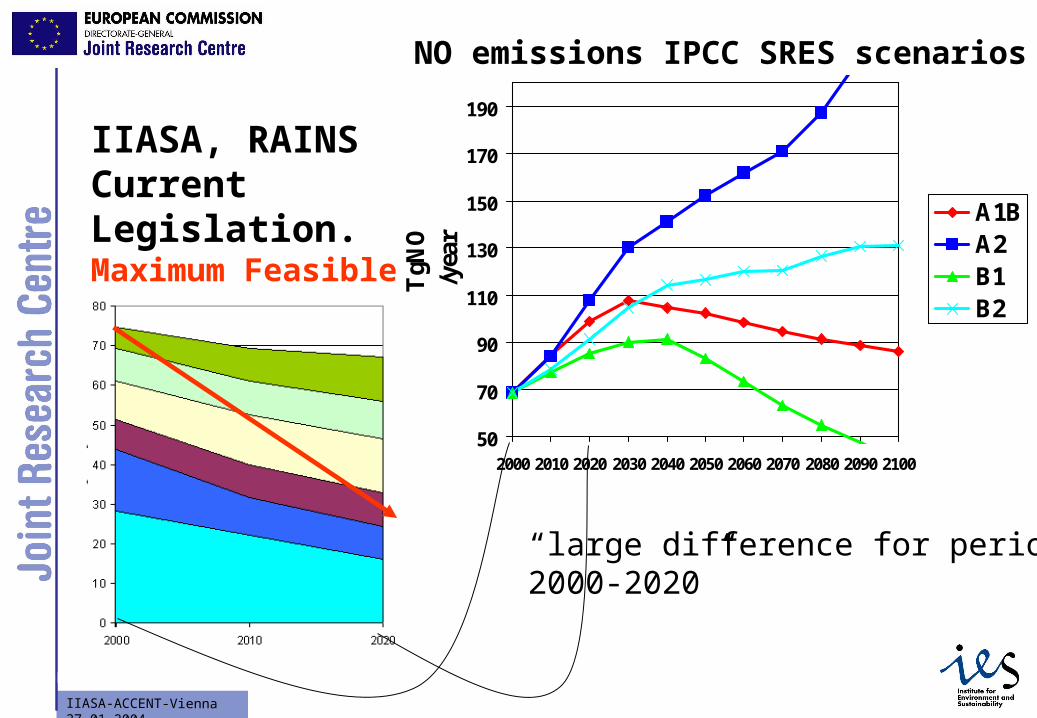
IIASA, RAINSCurrent Legislation. Maximum Feasible Reduction.
NO emissions IPCC SRES scenarios
“large difference for period2000-2020”

JRC- Brussels- PF
JRC Brussels JRC Brussels 7IIASA-ACCENT-Vienna 27.01.2004
JRC Brussels 7
IPCC
JRC- Brussels- PF
JRC Brussels JRC Brussels 8IIASA-ACCENT-Vienna 27.01.2004
JRC Brussels 8
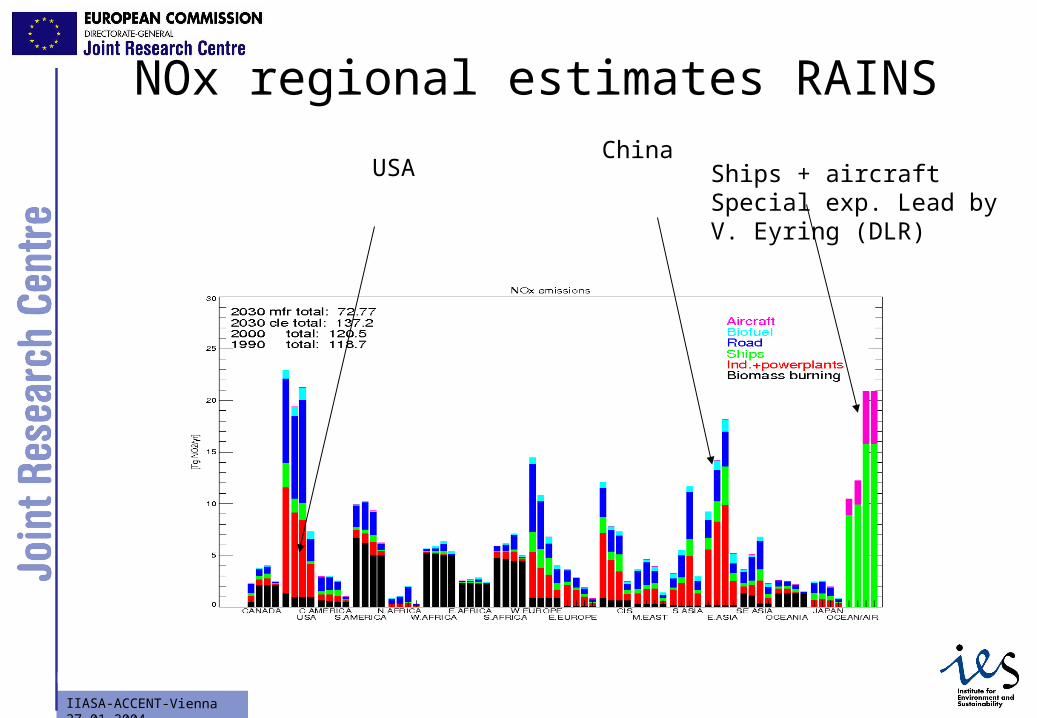
NOx regional estimates RAINS
USAChina
Ships + aircraftSpecial exp. Lead byV. Eyring (DLR)
JRC- Brussels- PF
JRC Brussels JRC Brussels 9IIASA-ACCENT-Vienna 27.01.2004
JRC Brussels 9
JRC- Brussels- PF
JRC Brussels JRC Brussels 10IIASA-ACCENT-Vienna 27.01.2004
JRC Brussels 10
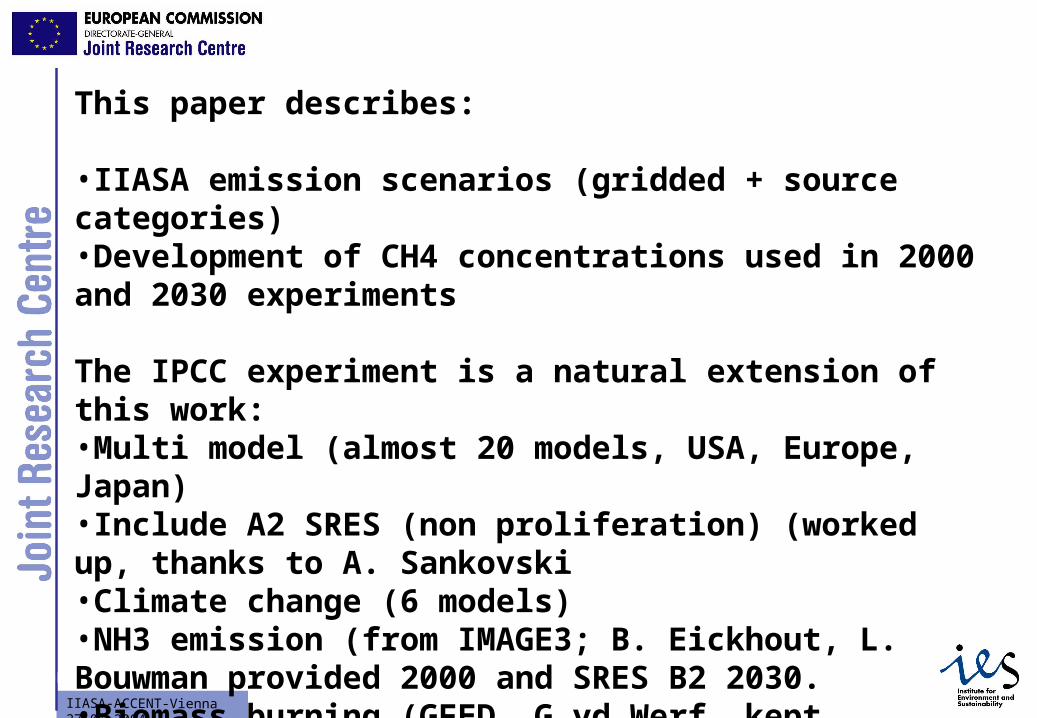
This paper describes:
•IIASA emission scenarios (gridded + source categories)•Development of CH4 concentrations used in 2000 and 2030 experiments
The IPCC experiment is a natural extension of this work:•Multi model (almost 20 models, USA, Europe, Japan)•Include A2 SRES (non proliferation) (worked up, thanks to A. Sankovski•Climate change (6 models)•NH3 emission (from IMAGE3; B. Eickhout, L. Bouwman provided 2000 and SRES B2 2030.•Biomass burning (GFED, G.vd Werf, kept constant among scenarios)

JRC- Brussels- PF
JRC Brussels JRC Brussels 11IIASA-ACCENT-Vienna 27.01.2004
JRC Brussels 11
REQUESTED OUTPUT
•Hourly surface ozone [ppbv] •Daily average tropospheric column ozone •10:30 Local Time NO2 column (molec/cm2). •10:30 Local Time CH2O column (molec/cm2). •2D monthly O3 dry , oxidized and reduced nitrogen, and sulfur deposition fields.•3D monthly mean fields for O3, CO, CH4 NO, NO2, and OH. •3D monthly mean field of the CH4+OH destruction flux. •3D monthly budgets of ozone production and destruction, 2D surface deposition. •2D stratospheric O3 influx
JRC- Brussels- PF
JRC Brussels JRC Brussels 12IIASA-ACCENT-Vienna 27.01.2004
JRC Brussels 12
Deposition of NOy, NHx, and SOx:
Ecosystem inputsBiodiversityEutrophicationAcidification
F. Dentener, J. Drevot, J.F. Lamarque, others

JRC- Brussels- PF
JRC Brussels JRC Brussels 13IIASA-ACCENT-Vienna 27.01.2004
JRC Brussels 13
0
10
20
30
40
50
60
70
80
90C
HA
SE
RC
TM
CH
AS
ER
GC
FR
SG
GE
OS
-CH
EM
GF
DL
GIS
S
IAS
B
LLN
L
MA
TC
H-
MA
TC
H-
NC
AR
ST
OC
ED
TM
4
TM
5
LM
DZ
MO
CA
GE
MO
ZE
CH
Em
issio
ns
NOy Deposition
S1
S2
S3
S4
S5
JRC- Brussels- PF
JRC Brussels JRC Brussels 14IIASA-ACCENT-Vienna 27.01.2004
JRC Brussels 14
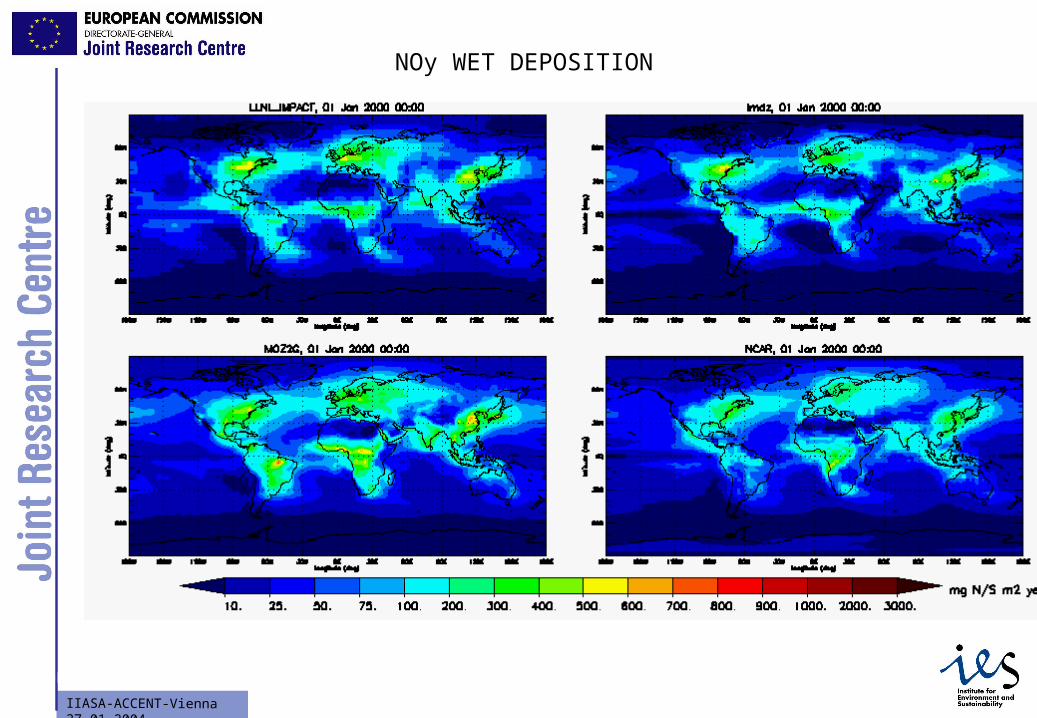
NOy WET DEPOSITION
JRC- Brussels- PF
JRC Brussels JRC Brussels 15IIASA-ACCENT-Vienna 27.01.2004
JRC Brussels 15
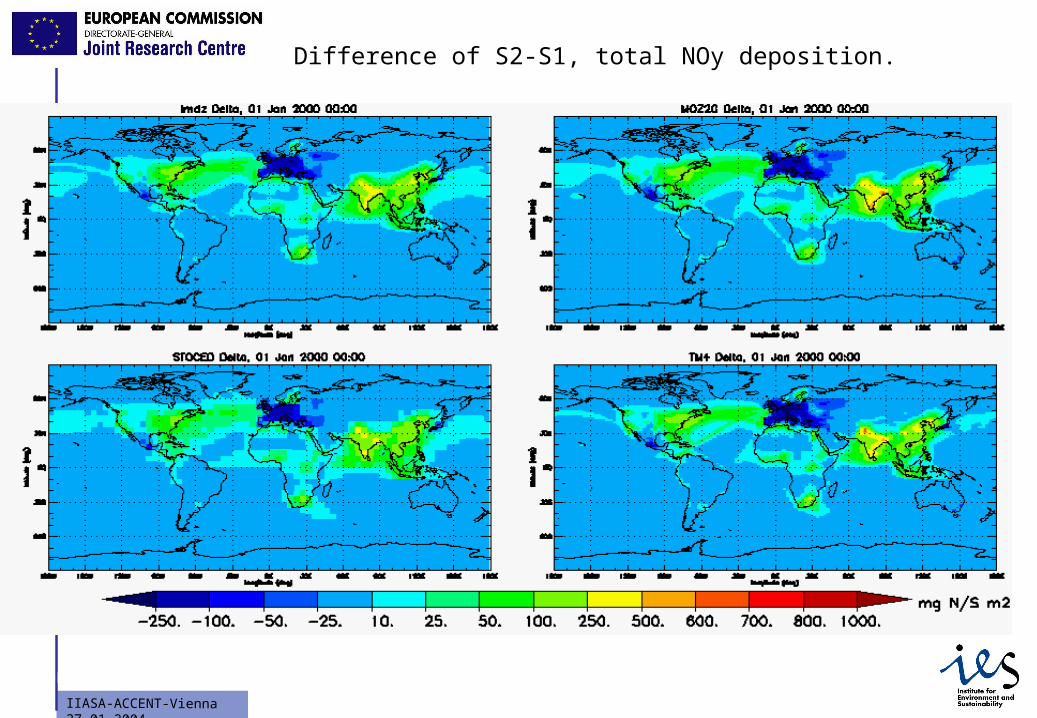
Difference of S2-S1, total NOy deposition.

JRC- Brussels- PF
JRC Brussels JRC Brussels 16IIASA-ACCENT-Vienna 27.01.2004
JRC Brussels 16
NOy wet deposition zoom over Europe
JRC- Brussels- PF
JRC Brussels JRC Brussels 17IIASA-ACCENT-Vienna 27.01.2004
JRC Brussels 17

JRC- Brussels- PF
JRC Brussels JRC Brussels 18IIASA-ACCENT-Vienna 27.01.2004
JRC Brussels 18
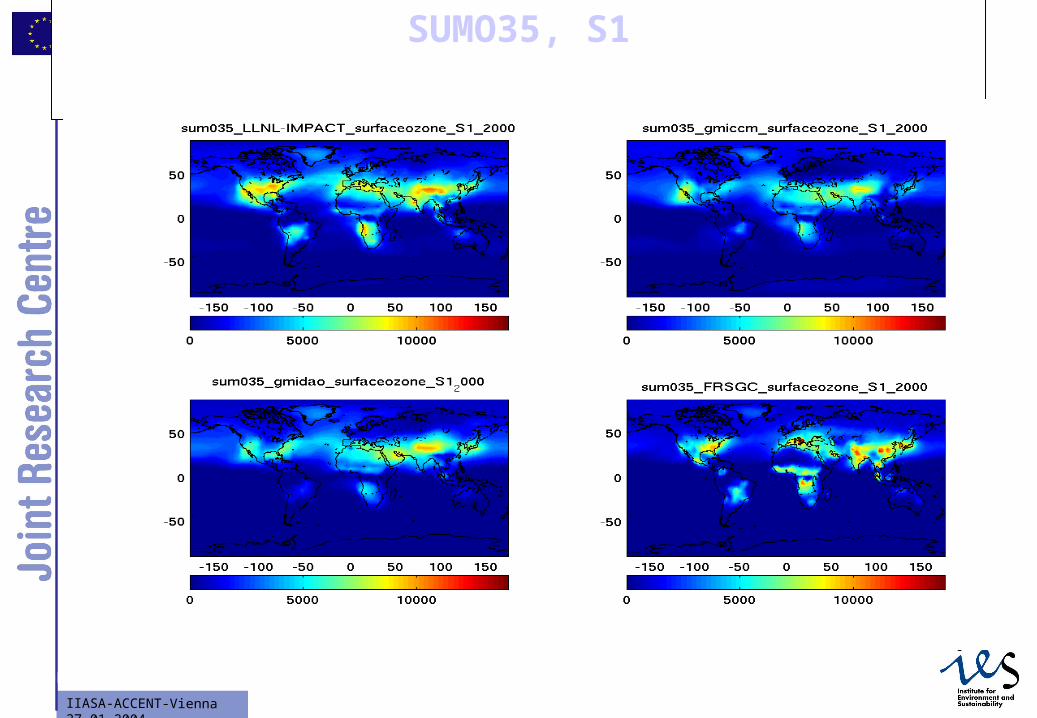
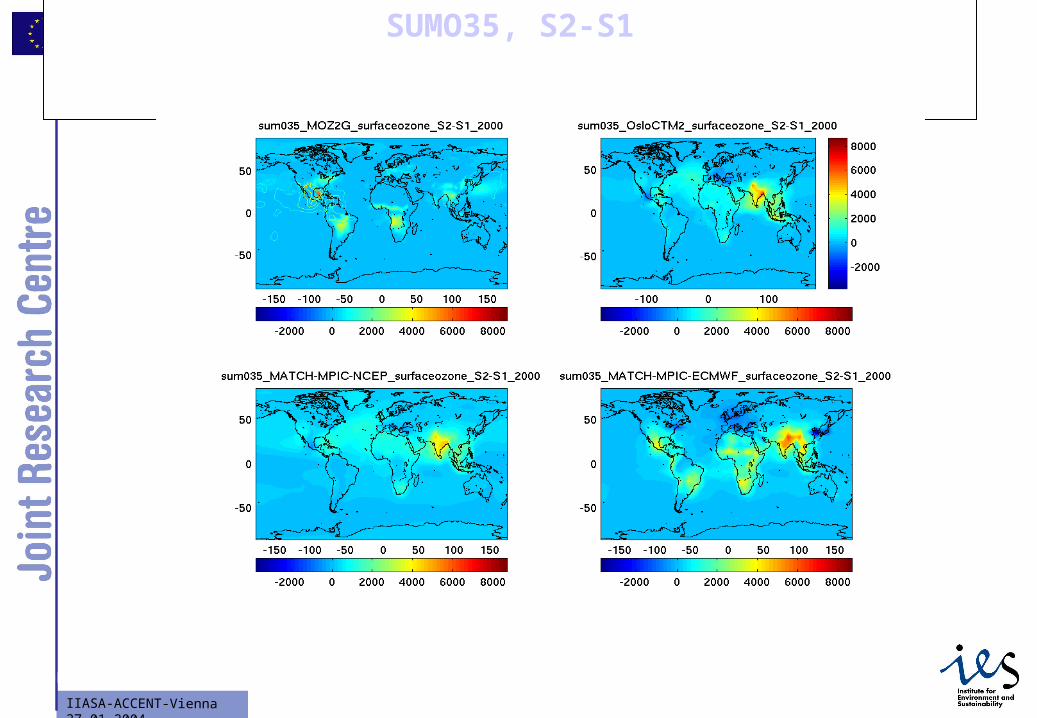
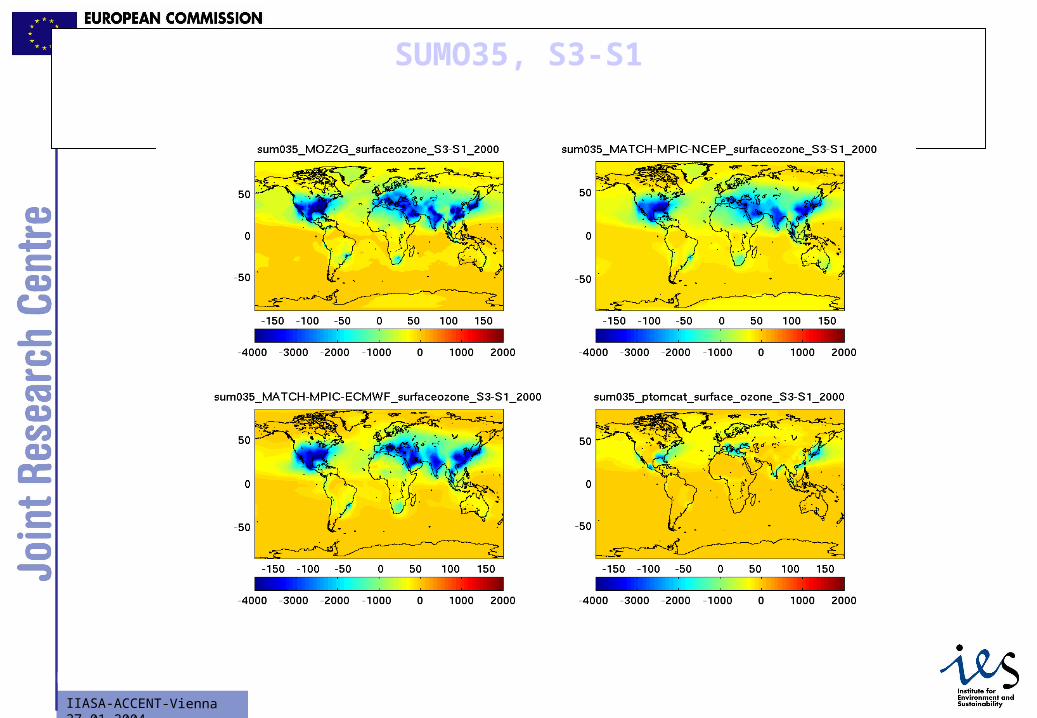
SOMO3535 ppbv WHO recommendation
• Sum of excess of daily maximum 8-h means over a cutoff of 35 ppb calculated for all days of the year.
• Diagnostics: ppb*days
• But also look at other diagnostics/air quality indices, as well as model ozone deposition fluxes. Lisa Emberson, Rita van Dingenen, Martin Schultz, others.
JRC- Brussels- PF
JRC Brussels JRC Brussels 19IIASA-ACCENT-Vienna 27.01.2004
JRC Brussels 19
SUMO35, S1
JRC- Brussels- PF
JRC Brussels JRC Brussels 20IIASA-ACCENT-Vienna 27.01.2004
JRC Brussels 20
SUMO35, S2-S1
JRC- Brussels- PF
JRC Brussels JRC Brussels 21IIASA-ACCENT-Vienna 27.01.2004
JRC Brussels 21
SUMO35, S3-S1
JRC- Brussels- PF
JRC Brussels JRC Brussels 22IIASA-ACCENT-Vienna 27.01.2004
JRC Brussels 22
“Air quality from space”
• NO2 column from GOME 2000; with models• In the light of uncertainties between different retrievals• Exercise lead by H. Eskes, T. van Noije (KNMI); Claire
Granier (POET), N. Savage, Uni Bremen, Harvard/Dalhousie.

JRC- Brussels- PF
JRC Brussels JRC Brussels 23IIASA-ACCENT-Vienna 27.01.2004
JRC Brussels 23
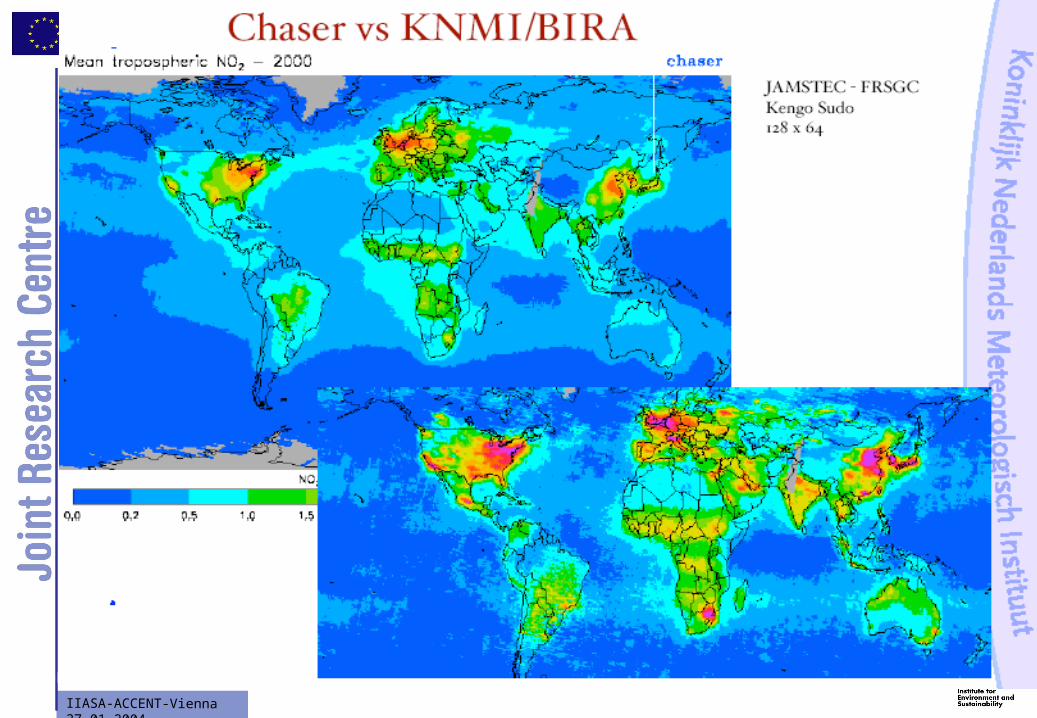
Dalhousie/Harvard vs. BIRA/KNMI
JRC- Brussels- PF
JRC Brussels JRC Brussels 24IIASA-ACCENT-Vienna 27.01.2004
JRC Brussels 24

JRC- Brussels- PF
JRC Brussels JRC Brussels 25IIASA-ACCENT-Vienna 27.01.2004
JRC Brussels 25
Experiment 2: S4 Climate Change and Radiative Forcing
•How will climate change modify atmospheric composition by 2030?•Repeat S2 (CLE emissions) with changed climate•Multiple years needed to see signal above interannual variability •Prescribed SSTs from HadCM3 is92a expt
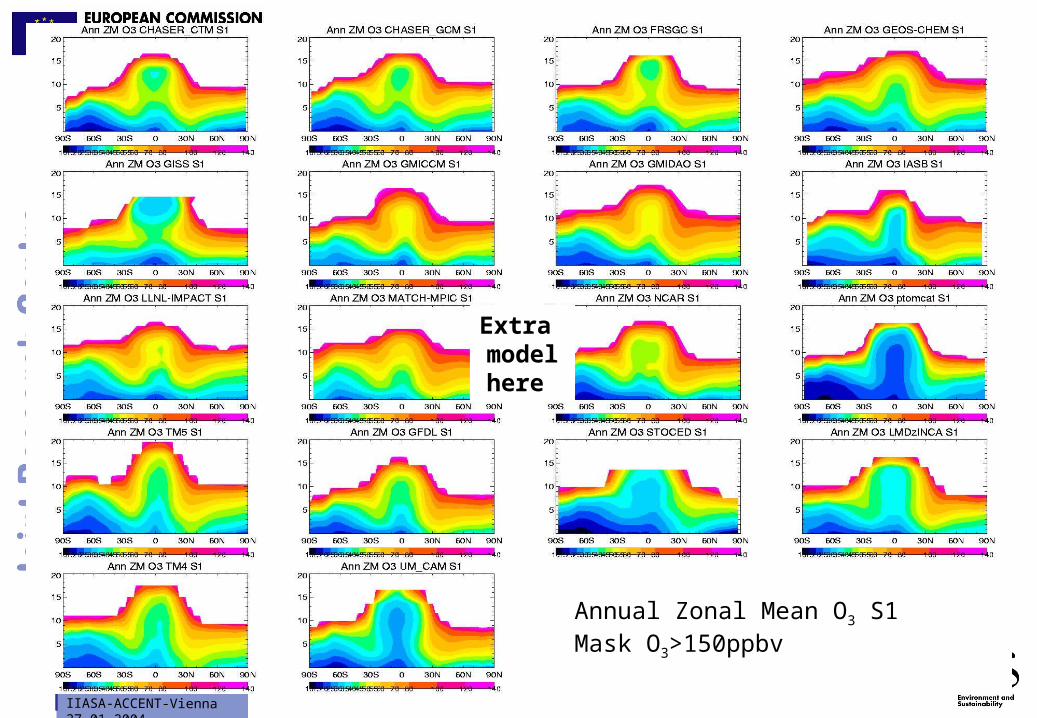
Analysis of:Zonal mean ozone fieldsOzone budgets;Climate change experiments
David Stevenson+ climate change modellers
JRC- Brussels- PF
JRC Brussels JRC Brussels 26IIASA-ACCENT-Vienna 27.01.2004
JRC Brussels 26
Annual Zonal Mean O3 S1Mask O3>150ppbv
Extra modelhere

JRC- Brussels- PF
JRC Brussels JRC Brussels 27IIASA-ACCENT-Vienna 27.01.2004
JRC Brussels 27
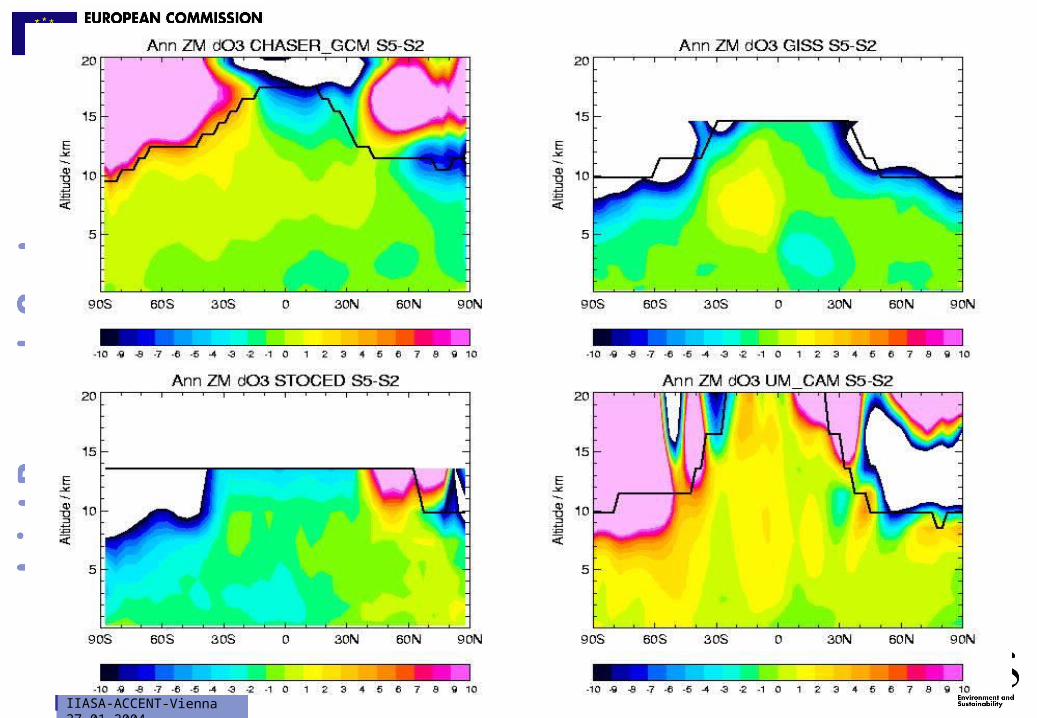
Annual Zonal MeanΔO3 S2 – S1
-10 -5 0 5 10 ppbv

JRC- Brussels- PF
JRC Brussels JRC Brussels 28IIASA-ACCENT-Vienna 27.01.2004
JRC Brussels 28
S1 (y2000) O3 Budgets / Tg(O3)/yr)
0
1000
2000
3000
4000
5000
6000
7000
P
L
D
Sinf
Smod

JRC- Brussels- PF
JRC Brussels JRC Brussels 29IIASA-ACCENT-Vienna 27.01.2004
JRC Brussels 29
-100
0
100
200
300
400
500
600
P
L
D
Sinf
Smod
S2–S1 Δ(O3 Budgets) / Tg(O3)/yr)
JRC- Brussels- PF
JRC Brussels JRC Brussels 30IIASA-ACCENT-Vienna 27.01.2004
JRC Brussels 30

JRC- Brussels- PF
JRC Brussels JRC Brussels 31IIASA-ACCENT-Vienna 27.01.2004
JRC Brussels 31
How is this BIG effort going to be used:
•GRL paper with high lights and synthesis•Some results in IPCC chapter 7•Deposition (F. Dentener et al.)•Surface ozone and health (K. Ellingsen et al.)•Climate change, ozone, ch4 and RF (D. Stevenson et al.)•NO2 (H. Eskes et al.)•Ecosystems and ozone fluxes ( R. v Dingenen, L. Emberson, D. Stevenson tbd)•And hopefully a lot of spin-off publications and users.

JRC- Brussels- PF
JRC Brussels JRC Brussels 32IIASA-ACCENT-Vienna 27.01.2004
JRC Brussels 32