julia chan - lup.lub.lu.se
TRANSCRIPT

Thermal properties of concrete with different
Swedish aggregate materials
Julia Chan
Julia Chan
LUND UNIVERSITY
FACULTY OF ENGINEERING LTH
Division of Building Materials
Report TVBM-5095 Master Thesis
Lund 2013
Lund 2013

Thermal properties of concrete with different Swedish aggregate materials
2
ISRN LUTVDG/TVBM--13/5095--SE
ISSN 0348-7911 TVBM
Julia Chan ©
Division of Building Materials
LTH, Faculty of Engineering
Lund University
Box 118, SE-221 00 Lund
Sweden
www.byggnadsmaterial.lth.se
Thermal properties of concrete with different Swedish aggregate materials
3
Acknowledgment The work presented in this master thesis is from the Faculty of Engineering LTH at Lund University –
Division Building Materials. This thesis is a part of a research study at CBI, The Swedish Cement and
Concrete Research Institute.
First of all I want to thank my supervisor at CBI, Alexander Herlin, for all the help and supporting
during the entire time. His encouragement and helpfulness was very appreciated, especially the work
in the laboratory. I also want to thank my supervisor at LTH, Lars Wadsö, for his expertise and
pedagogical explanations of uncertainties. Both my supervisors have always been there for me and I
am very grateful for that.
Further I would like to thank Bo Johansson, Bengt Nilsson and Stefan Backe for the help in the
laboratory.
Besides, I also want to thank the quarries that gave me aggregate materials so I could do my
experiments.
Finally I would like to thank my family and friends for the support during my thesis period especially
Carl.
Julia Chan
Lund, December 2013

Thermal properties of concrete with different Swedish aggregate materials
4
Title: Thermal properties of concrete with different Swedish aggregate materials.
Author: Julia Chan
Supervisor: Alexander Herlin, Civil engineer
CBI, Cement and Concrete Institute in Sweden
Lars Wadsö, Professor
Division of Building material at LTH
Faculty of Engineering at Lund University
Examiner: Katja Fridh, Associate professor
Division of Building material at LTH
Faculty of Engineering at Lund University

Thermal properties of concrete with different Swedish aggregate materials
5
Abstract
Earlier studies show that different concrete aggregates have different thermal properties, and from
this an idea to optimize thermal properties of concrete was developed. The purpose of this master
thesis is to investigate thermal properties of concrete so additional costs and negative environmental
impacts can be minimized. Measurements of thermal properties of different Swedish aggregates
from existing quarries were investigated. It will also study if the thermal properties affect ther
thermal expansion of concrete. The experimental study in this work was done in laboratory
conditions. Preparation studies that were made before casting concrete were sieving aggregates,
density of aggregates and moisture content. While the concrete was fresh standard tests such as
slump, air-content and density of fresh concrete were made. When the concrete was 28 days old
compressive cube strength and thermal expansion measurement were executed. The thermal
properties (thermal conductivity, volumetric heat capacity and thermal diffusivity) were measured on
aggregates and concrete cubes with the instrument Hot Disk 2500-S.
The results show that the minerals quartz and magnetite have significantly different thermal
properties than the other studied aggregates/concretes. The aggregate/concrete with high amount
quartz mineral has high thermal conductivity and diffusivity. The aggregates/concrete with magnetite
has high thermal conductivity and volumetric heat capacity. The other aggregates and concretes
have similar thermal properties. The thermal expansion coefficients have similar values (12.6-15.5∙
1 /⁰C) for different aggregates, and it was not possible to see if there was a correlation between
them and the thermal properties. Thus was the value of thermal expansion coefficient in a range that
is normal for concrete. The thermal shock resistance is dependent of the thermal conductivity,
thermal expansion coefficient, fracture strength and elastic modulus. The concretes with high
thermal conductivity also had high thermal shock resistance whereas so such concrete should better
resist rapid temperature changes.
The conclusions that can be drawn from this work are that the thermal properties of the aggregates
will be reflected in the properties of the concrete. For both thermal conductivity and heat capacity
the values for the dry concretes (RH 10-30%) were about 40-70% of the values of the aggregates.
Note that this conclusion only applies for thermal conductivity and heat capacity and does not apply
on thermal diffusivity, since diffusivity is the ratio of conductivity and capacity it will be similar in the
concrete. In this study only two aggregates significantly affected the thermal properties: quartz has
high thermal conductivity and diffusivity and magnetite rock has high thermal conductivity and heat
capacity. Another conclusion from this study was high thermal conductivity also give high thermal
shock resistance, where the concrete resist rapid temperature changes better.
Keywords: Concrete, aggregates, thermal properties, thermal conductivity, heat capacity, thermal
diffusivity, high thermal mass buildings, thermal expansion coefficient, thermal shock resistance.

Thermal properties of concrete with different Swedish aggregate materials
6
Sammanfattning Tidigare studier visar att olika ballastmaterial har olika värmeegenskaper och idén att kunna
optimera betongs värmeegenskaper utvecklades. Målet med uppsatsen är att undersöka
värmeegenskaperna hos betong så att merkostnaden och den negativa miljöpåverkan kan minimeras.
Mätningar av värmeegenskaper genomfördes på svensk ballast från befintliga bergtäkter. Uppsatsen
undersöker även om värmeegenskaperna påverkar temperaturberoende rörelser i
betongkonstruktioner. Experimenten utfördes under laboratorieförhållanden. Förberedelser innan
gjutningen av betongen bestod av sikta ballast, densitets- och fukthaltsmätning av ballastmaterial.
Under gjutningen mättes sättmått, lufthalt och den färska betongens densitet. Tryckhållfasthet och
längdutvidgningsmätning utfördes när betongen var 28 dagar gammal. Värmeegenskaperna
(värmeledning, volumetrisk värmekapacitet och värmediffusivitet) mättes med instrumentet Hot Disk
2500-S på ballaststen och betong.
Resultatet visar att ballastmaterial som domineras av mineralen kvarts och magnetit har andra
värmeegenskaper än de andra ballastmaterialen i denna studie. Ballasten/betongen som innehöll
högt kvartsinnehåll hade både hög värmeledning och värmediffusivitet. Ballasten/betongen med
högt magnetitinnehåll hade både hög värmeledning och volumetrisk värmekapacitet. De andra
ballastmaterialen och betongen hade värmeegenskaper som påminde om varandra.
Längdutvidgningskoefficienterna hade värden som var liknade (12,6-15,5 /⁰C) och det gick inte att
dra några direkta slutsatser om värmeegenskaperna påverka deras värden, då ingen tydlig koppling
fanns. Uppmätta längdutvidgningskoefficienter har dock storleksordning som betong bör ha.
Termochockparameter är beroende av värmeledningsförmåga, längdutvidgningskoefficient,
brotthållfasthet och E-modul. Betongen med hög värmeledningsförmåga hade även hög
termochockparameter, vilket dessa betongen är bättre på att motstå påfrestningar som orsakas av
snabba temperaturförändringar.
Slutsatserna som kom fram i denna uppsats var att värmeegenskaperna av ballastmaterialet
avspeglas i betongens värmeegenskaper. För torr betong (RF 10-30%) var både värmeledning och
värmekapaciteten ca 40-70% av värden av ballastmaterialen. Observera att slutsatsen gäller för
värmeledning och värmekapacitet och inte för värmediffusivitet, då diffusivitet är en kvot av de två
värmeegenskaperna, kommer den att behålla sitt värde även i betongen. I denna studie var det
endast två ballastmaterial som skiljde sig markant från de övriga ballaster; kvarts med hög
värmeledning och diffusivitet och magnetit med hög värmeledning och värmekapacitet. En annan
slutsats som kom fram till var att hög värmeledningsförmåga ger hög termochockparameter, vilket
betongen motstår snabba temperaturförändringar bättre.
Nyckelord: Betong, värmeegenskaper, värmeledning, värmekapacitet, värmediffusivitet, värmetröga
byggnader, längdutvidgningskoefficient, termochockparameter.
Thermal properties of concrete with different Swedish aggregate materials
7
Contents
1. Introduction ..................................................................................................................................... 9
1.1. Background .............................................................................................................................. 9
1.2. Objectives .............................................................................................................................. 10
1.3. Limitations ............................................................................................................................. 10
1.4. Research questions................................................................................................................ 10
2. Energy ............................................................................................................................................ 11
2.1. Energy directives ................................................................................................................... 11
2.2. Energy consumption and production in Sweden .................................................................. 11
2.3. Energy prices ......................................................................................................................... 12
3. Thermal properties and heat transport ........................................................................................ 13
3.1. Heat and temperature ........................................................................................................... 13
3.2. Transport process and heat transfer ..................................................................................... 13
3.3. Thermal conductivity ............................................................................................................. 14
3.4. Heat capacity ......................................................................................................................... 14
3.5. Thermal diffusivity ................................................................................................................. 15
3.6. Thermal mass ........................................................................................................................ 15
3.7. Thermal expansion coefficient and thermal shock resistance .............................................. 18
4. Minerals, rocks and aggregates ..................................................................................................... 19
4.1. Minerals ................................................................................................................................. 19
4.2. Rocks ...................................................................................................................................... 19
4.3. Rock forming mineral ............................................................................................................ 21
4.4. Aggregates ............................................................................................................................. 22
5. Materials ........................................................................................................................................ 23
5.1. Cement .................................................................................................................................. 23
5.2. Aggregates used for this experiment .................................................................................... 23
6. Methods ........................................................................................................................................ 26
6.1. Density of aggregates ............................................................................................................ 26
6.2. Sieving of the aggregates ...................................................................................................... 26
6.3. Moisture content ................................................................................................................... 27
6.4. Cast concrete ......................................................................................................................... 27
6.5. Slump-test ............................................................................................................................. 29
6.6. Air-content and density of fresh concrete ............................................................................ 29
6.7. Preparing concrete for measurements ................................................................................. 30
Thermal properties of concrete with different Swedish aggregate materials
8
6.8. Thermal properties with Hot Disk ......................................................................................... 30
6.9. Compressive cube strength ................................................................................................... 31
6.10. Thermal expansion coefficient .......................................................................................... 32
7. Calculations ................................................................................................................................... 34
7.1. Density of aggregates ............................................................................................................ 34
7.2. Compressive cube strength ................................................................................................... 34
7.3. Thermal conductivity ............................................................................................................. 34
7.4. Heat capacity ......................................................................................................................... 35
7.5. Thermal diffusivity ................................................................................................................. 35
7.6. Thermal expansion coefficient .............................................................................................. 35
7.7. Thermal shock resistance ...................................................................................................... 36
8. Results ........................................................................................................................................... 37
8.1. Density of aggregates ............................................................................................................ 37
8.2. Grading curves for mixed aggregates .................................................................................... 37
8.3. Mix proportions ..................................................................................................................... 38
8.4. Thermal properties – Calculated and measured values ........................................................ 40
8.5. Thermal expansion coefficient and thermal shock resistance .............................................. 43
8.6. Temperature in concrete ....................................................................................................... 44
8.7. Remaining results .................................................................................................................. 44
9. Analysis .......................................................................................................................................... 45
10. Discussion and conclusions ....................................................................................................... 47
11. Further researches .................................................................................................................... 49
References ............................................................................................................................................. 50
Appendix A – Slump, Density of concrete and Compressive cube strength ......................................... 52
Appendix B – Sieve analyses of the aggregates .................................................................................... 54
Appendix C– Measured thermal properties from Hot Disk .................................................................. 58
Appendix D – Thermal expansion coefficient and temperature of concrete and dilatometer ............. 69
Appendix E – Calculations of the thermal expansion coefficient .......................................................... 72
Appendix F – Appearance of the concretes .......................................................................................... 75

Thermal properties of concrete with different Swedish aggregate materials
9
1. Introduction
1.1. Background By year 2020 the 20/20/20-targets of the renewable energy directive (2009/28/CE) should be
reached in EU (European Union) (Swedish Energy Agency, SEA, 2011). The three targets are as follows:
20% of the energy use should be from renewable energy resources by year 2020; emission level
should have decreased by 20% compared to the emission level of year 1990 and the use of energy
should be 20% more efficient relative to the value of year 2008 (SEA 2011). The building sector in
Sweden stands for 40% of the total energy use every year and 60% of the energy use from this sector
is generally for heating the buildings and producing hot water (SEA 2011). The costs of maintenance
and management (including heating) through the life cycle of a building are about 90% and
constructing the building about 10% (Bokalders & Block 2009). There are many actions that must be
done to achieve the 20/20/20-target by year 2020. As the building sector consumes a significant part
of the energy, the buildings and the energy supply system must be constructed more energy efficient
so the targets can be achieved. Reduction of the energy use is therefore not only driven by
minimization of cost, but also by reduction of the negative environment impacts.
Fossil fuel is used as a backup production when the normal energy production is not enough (SEA
2011, Gräslund 2010). During a cold winter day in Sweden the demand for heat and electricity is high
and the energy producers are using fossil fuel to meet the demand and this leads to higher energy
prices (SEA 2011). It is known that concrete and other stone materials have the ability to store heat
in a construction and even out temperature variations (Reardon 2010). The heat storage in concrete
is a certain advantage because it takes longer time for the construction to cool down (Reardon 2010).
Therefore, during a cold winter day, when the demand for energy and the price is highest, concrete
constructions can minimize their use of the energy by choosing not to heat the house (Reardon 2010).
In a larger perspective it is possible to design smaller energy networks and minimizing the use of
fossil fuel if more buildings can store heat (have high thermal mass).
Earlier studies show that different concrete aggregates have different thermal properties, and from
this an idea to optimize thermal properties of concrete was developed. The idea is about choosing
aggregates with desirable thermal properties and thereby being able to optimize the thermal
properties of concrete structures. This master thesis is a part of a research project at CBI, The
Swedish Cement and Concrete Research Institute. This thesis presents measurements of thermal
properties of Swedish aggregates and concrete. Another part of this thesis concerns thermal
expansion coefficient and thermal shock resistance. Temperature differences in constructions can
cause cracks. In this thesis results from measurements of the thermal expansion coefficient and
thermal shock resistance are presented. Analysis of thermal expansion coefficient and thermal shock
resistance and thermal properties of concrete are also made, to study if there are any connections
between them. The optimization of thermal properties of concrete is thus not only for gaining
knowledge about heat storage in concrete, it is also about gaining knowledge about if the thermal
properties affect movements in concrete caused by temperature difference in the structures.
Thermal properties of concrete with different Swedish aggregate materials
10
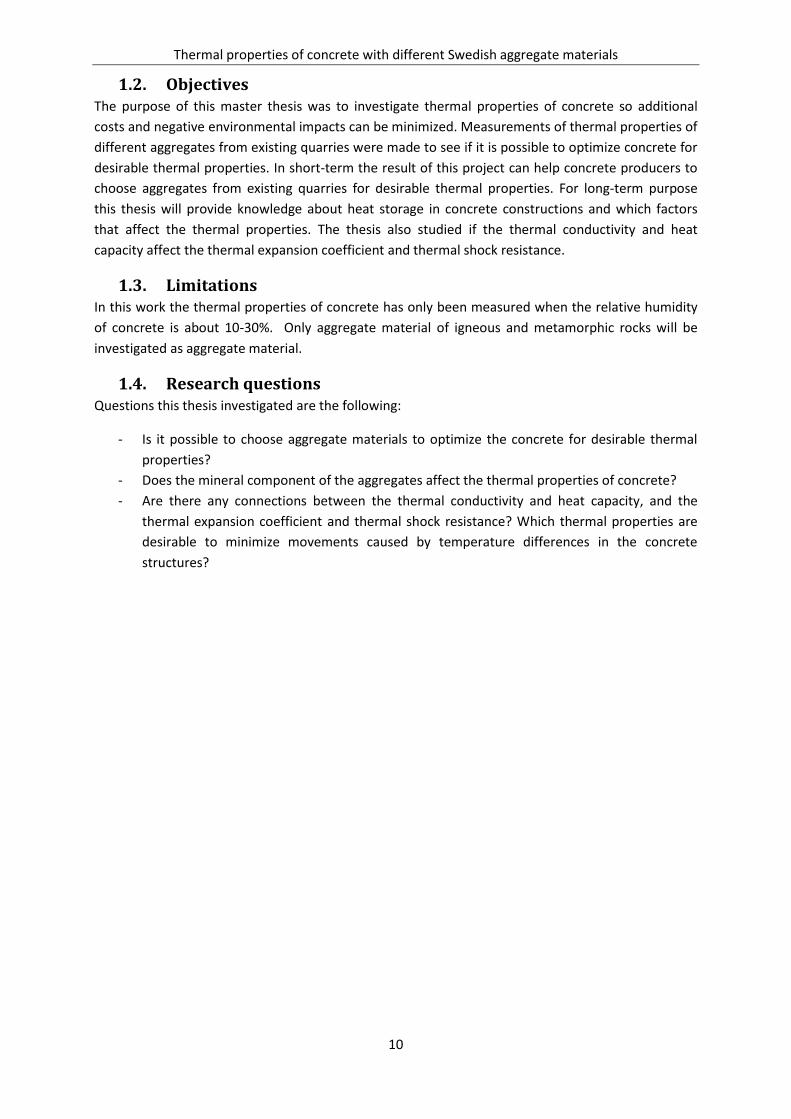
1.2. Objectives The purpose of this master thesis was to investigate thermal properties of concrete so additional
costs and negative environmental impacts can be minimized. Measurements of thermal properties of
different aggregates from existing quarries were made to see if it is possible to optimize concrete for
desirable thermal properties. In short-term the result of this project can help concrete producers to
choose aggregates from existing quarries for desirable thermal properties. For long-term purpose
this thesis will provide knowledge about heat storage in concrete constructions and which factors
that affect the thermal properties. The thesis also studied if the thermal conductivity and heat
capacity affect the thermal expansion coefficient and thermal shock resistance.
1.3. Limitations In this work the thermal properties of concrete has only been measured when the relative humidity
of concrete is about 10-30%. Only aggregate material of igneous and metamorphic rocks will be
investigated as aggregate material.
1.4. Research questions Questions this thesis investigated are the following:
- Is it possible to choose aggregate materials to optimize the concrete for desirable thermal
properties?
- Does the mineral component of the aggregates affect the thermal properties of concrete?
- Are there any connections between the thermal conductivity and heat capacity, and the
thermal expansion coefficient and thermal shock resistance? Which thermal properties are
desirable to minimize movements caused by temperature differences in the concrete
structures?
Thermal properties of concrete with different Swedish aggregate materials
11
2. Energy
2.1. Energy directives According to the Renewable Energy Directive (2009/28/CE) of EU (European Union) should the
20/20/20-targets be achieved by year 2020 in EU (Swedish Energy Agency, SEA, 2011). The three
targets are: 20% of energy use should come from renewable energy resources by year 2020;
emission level should have decreased by 20% compared to the emission level of year 1990 and the
use of energy should be 20% more efficient relative to the value of year 2008 (SEA 2011). Member
states of EU are required to establish minimum requirements for energy performance of buildings to
aim an achievement of optimum cost balance according to the Energy Performance of Building
Directive (2010/13/EU). The requirements apply on new constructions and should also apply on
extensive renovations of existing buildings. It also requires all new buildings from 31th of December
year 2020 should be Near Zero Energy (NZE) type (SEA 2013). In Sweden, nationwide, had the
Swedish government set up more specific goals for Sweden to achieved by year 2020 (Bokalders &
Block 2009). There are 16 environmental quality objectives that should be reached by year 2020. Two
of the 16 objectives are directed to energy efficiency, where the energy use should be reduced by 20%
by year 2020 and 50% by year 2050. One of the 16 objectives also specifies emission level of
greenhouse gases should be 40% lower than the value of 1990 by year 2020. Swedish building codes
for new and existing buildings are an instrument for the building sector to achieve the goals the
government set up (Bokalders & Block 2009).
2.2. Energy consumption and production in Sweden In 2010 the energy use from the residential and service sector was 40% of the total energy use in
Sweden (SEA 2011). Almost 60% of this energy was for heating and production of hot water. In
Sweden is heat primary supplied through district heating networks, but there are also many buildings
with electric heating (often by heat pumps) or biofuel combustion heating. The heat consumption is
depending on the outdoor temperatures, which there are variations from year to year. Most
important is heating need will increase if the winter is cold, but decreases if the winter is mild. For
example in 2010 the energy use in the residential and service sector was highest among all sectors
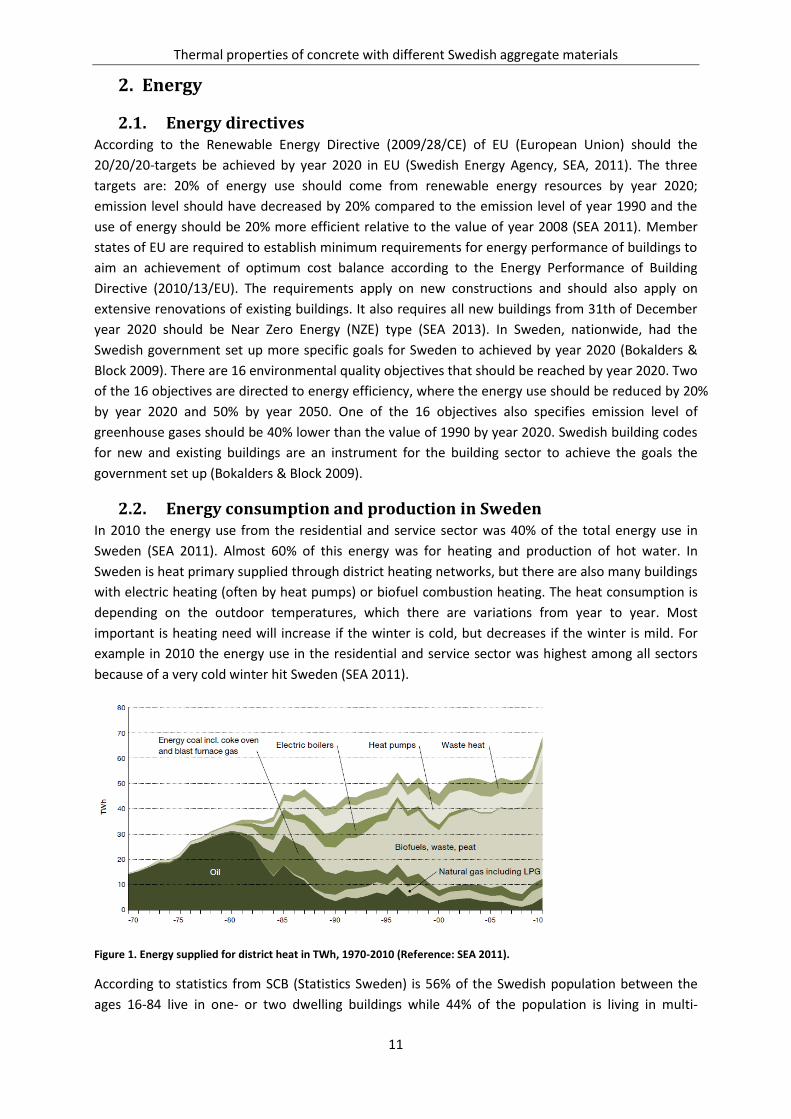
because of a very cold winter hit Sweden (SEA 2011).
Figure 1. Energy supplied for district heat in TWh, 1970-2010 (Reference: SEA 2011).
According to statistics from SCB (Statistics Sweden) is 56% of the Swedish population between the
ages 16-84 live in one- or two dwelling buildings while 44% of the population is living in multi-
Thermal properties of concrete with different Swedish aggregate materials
12
dwelling buildings (data for 2010) (SCB, Statistics Sweden 2012). As was mentioned above district
heating is the most common way to distribute heat in Sweden (SEA2011). For multi-dwelling
buildings and non-residential premises (for example offices) district heating has 92% and 80%,
respectively, of the market share. For one- and two dwelling buildings district heating only has a
share of 15% and electricity is the most common form of energy for heating in these buildings.
District heating has the advantage that it can utilize different fuels. The energy supplied for district
heating in Sweden is shown in Fig. 1. Of the heat produced for district heating in 2010, 49% was from
wood fuel, 17% was from waste, 4% was from peat and 5% was from waste heat. Using waste in
production of district heating has increased over the past decade because the government banned
using combustible waste and organic waste for landfill in 2002 and 2005, respectively (SEA 2011).
Fossil fuels such as oil and coal are used for backup (peak) production of district heat (Gräslund 2010).
The electricity use in Sweden between the years 1970-2010 the residential and service sector was
standing for the main consumption (SEA 2011). Electricity in Sweden is primarily produced by
hydropower and nuclear power. Hydropower stands for 46% of the production and nuclear power 38%
and 2.4% from wind power (value of 2010). The remaining part of the electricity production come
from fossil and biofuels based production. The production based on fossil fuels is mainly a reserve
capacity to provide electricity. The total installed capacity for electricity production is greater than
available. The availability of the power plants varies. The electricity capacity will be critical when
extreme winters occur. The capacity situation was for example very strained the years 2009-2010,
when it was extremely cold and the nuclear power plants had difficulties in operation. Production
and usage of electricity must be balanced. The organization Swedish national grid (Svenska kraftnät),
is responsible for maintenance electricity balance and management and operation of the national
grid of the country. Sweden had in 2010 power transmission links between Norway, Finland,
Denmark, Germany and Poland. The links will be in use when the production and use are imbalanced.
The Nordic countries are mainly importer of electricity. In 2010 between 5 p.m. and 6 p.m. on the
22th of December Sweden used almost all the power transmission links (except Poland) to meet the
electricity demand (SEA 2011).
2.3. Energy prices The trading of electricity is run by Nord Pool Spot on the market Elspot and Elbas market. The
exchanges are organized by NASDAQ OMX (Exchange Company) (2011 SEA). The electricity price
depends on many factors. High demands usually results in high prices, especially when the
production is low. Factors that raise electricity prices are for example cold weather and reduced
production. The total price the consumers pay is charges of distribution from the network operator
and electricity suppliers the customers chosen to have a contract with. Distribution charges depend
on where in the county the electricity is used (SEA 2011).
Prices of district heating are different in different municipalities and the differences can sometimes
be twice the price (2011 SEA). The price differences depend on factors as ownership structures in the
district heating companies, profits and the fuel source that is being used in production. The choices
the customers have in option on heating are largely depending on the geographic area they live. The
variation in production of electricity and cold winter days results in high prices. When the energy
demand is higher than the production, will energy be traded and transported though links between
countries (SEA 2011).
Thermal properties of concrete with different Swedish aggregate materials
13
3. Thermal properties and heat transport
3.1. Heat and temperature Heat is a form of energy (Cengel 2006). Energy cannot disappear; it can only be converted from one
type to another type of energy. Heat is different from other types of energy because it has a quality
and this quality is temperature. The temperature measures heat’s quality. Two important concepts
when it comes to temperature are the absolute temperature and temperature equilibrium. At 0 K
(-273.16°C), which is the lowest possible temperature, all molecular movements will cease. Hence
temperature expressed in kelvin (K) is defined as absolute temperature. The definition of absolute
temperature was originally derived from measurements of gas pressure as a function of temperature.
The temperature at which the extrapolated gas pressure equals zero is 0 K. Materials with different
temperatures strive for temperature equilibrium. Heat will flow from the material with higher
temperature to the one with lower temperature. When the two materials have the same
temperature, heat will not flow between them anymore and the system is at thermal equilibrium
(Cengel 2006).
Heat is disordered energy stored in atomic and molecular movements as velocity, rotation, vibration
etc. (Cengel 2006). If the molecules can move in many different ways they will contain more heat
than molecules that only can move in a few ways. Solid materials do not allow the molecules to
change their position since they are fixed in crystalline or amorphous structure (more about these
structures can be found under the heading Minerals). Instead atoms and molecules in solid materials
vibrate in different ways and in those vibrations heat is stored (Cengel 2006).
3.2. Transport process and heat transfer Heat flow is the total heat transfer per time unit. Heat flow has the symbol and unit W (=J/s)
(Cengel 2006). Heat flux is heat transfer per unit area and has the symbol and unit W/m2. Heat
transfers because of temperature differences. There are three mechanisms that occur when heat
transfers and they are; conduction, convection and radiation (Cengel 2006).
Conduction is heat transfer from a substance with more energetic particles to an adjacent one with
less energetic particles, note there are interactions between the particles (Cengel 2006). Heat
conduction takes place in solids, liquids and gases. For gases and liquids conduction are collision and
diffusion of molecules of random motions. Conduction in solids is a combination of vibrations of the
molecules in a lattice and energy transport by free electrons. The arrangement of the molecules
strongly affects the lattice element of thermal conductivity. For instance diamond has high thermal
conductivity. Thermal conductivity of metals is usually high because of the free flowing electrons
(Cengel 2006).
Energy that transfers between a solid surface and the adjacent gas or liquid that is in motion is called
convection (Cengel 2006). Convection is a combined effect of conduction and fluid motion. Faster
fluid motion results in greater convection of heat transfer. There are forced and natural convection
processes. Forced convection is when an external agent put the fluid in motion to flow over a surface.
An external source can be a fan, pump or wind. Natural convection occurs when there are density
differences because of temperature variation of the fluid. For example will air rises when it gets
warmer and this is because it is lighter (lower density) than the cooler air (Cengel 2006).
Electromagnetic waves occur when atoms and molecules change in the electronic arrangement and
these processes that emit energy are radiation (Cengel 2006). Radiation is different from the other

Thermal properties of concrete with different Swedish aggregate materials
14
two heat transport mechanisms because it does not need presence of any intervening medium to
transfer heat. Radiation can occur in vacuum but not conduction or convection. The radiation
emitted from bodies is thermal radiation. Radiation affect the thermal comfort since there is
radiation heat exchange between our bodies and the surroundings (walls and ceiling) (Cengel 2006).
In a building all three heat transfer processes take place simultaneously. For example a radiator heats
the surrounding air by conduction, making the air lighter so it rises by natural convection; the lighter
air will heat the window and walls that it comes in contact with. The radiator or the sun will also
directly heat walls, floors and ceilings through radiation. Inside solid opaque materials heat
conduction is the only way of heat transfer, but in transparent materials radiation will also take place
and within porous material natural convection can be an important heat transfer mechanism (Cengel
2006).
3.3. Thermal conductivity Thermal conductivity is the ability of a material to transfer heat where all the three heat transfer
mechanisms are taken into account since the calculations are quite similar, and this is described by
Fourier’s law (Cengel 2006):
where is heat flux (W/m2), thermal conductivity (W/m K), temperature difference in K or °C
and the distance or thickness in m. Note that there is not time factor in the Eq. 1 because it is
included in heat flow, W= J/s (note that watt is the unit of heat flow not heat flux). The negative sign
in the equation indicate that heat flows from higher to lower temperature, where the term
is the
temperature gradient. Eq. 1 can be rewritten as
R is the heat transfer resistance (W/m2 K). The heat transfer resistance is commonly used to define
heat transport properties for layer of different material and whole wall structures (Cengel 2006).
In Tab.1 the thermal conductivity for steel, concrete, granite and wood can be found.
Table 1. Thermal conductivity of some building materials (Burström 2007).
Material Thermal conductivity [W/m K]
Dry material Practice value
Steel 60 60
Concrete 0,9 1,7
Granite (Macadam, aggregates) 3,5 3,5
Wood fiber 0,12 0,14
3.4. Heat capacity Heat capacity represents the capability to store energy. Heat capacity is the relation between heat
content and resulting temperature change and can be calculated with Eq. 3:

Thermal properties of concrete with different Swedish aggregate materials
15
where is volumetric heat capacity (J/m3K), is heat transferred to a sample (J), is the volume of
the sample (m3)and is the resulting temperature change in K or °C. Volumetric heat capacity is
related to specific heat capacity and density and can be calculated by:
Here is the specific heat (J/g K) and is the density (kg/m3, g/cm3) (Cengel 2006). Some common
materials’ specific heat capacity, density and volumetric heat capacity can be found in the Tab. 2.
Table 2. Specific heat capacity, volumetric heat capacity and density of some materials (Burström 2007).
Material Specific heat capacity [kJ/kg K]
Density [kg/m3]
Volumetric heat capacity [kJ/m3K]
Steel 0.46 7850 3611
Concrete 1.00 2300 2300
Granite (macadam, aggregates) 1.00 2700 2700
Wood fiber 1.60 500 800
Water 4.19 1000 4190
3.5. Thermal diffusivity Thermal diffusivity measures the rate at which temperature change at the surface of a material
changes the temperature inside the material. It is the ratio between thermal conductivity and
volumetric heat capacity (Cengel 2006).
Here is thermal diffusivity (m2/s), is thermal conductivity (W/mK), and is volumetric heat
capacity (J/m3K) (Cengel 2006).
3.6. Thermal mass A material that has the ability to absorb heat energy is a thermal mass (Reardon 2010). High amount
of energy is needed to change the temperature of high density materials such as concrete, bricks and
tiles. These materials are therefore said to have high thermal mass. On the other hand lightweight
materials like wood have low thermal mass (Reardon 2010). In Fig. 2 a comparison of the air
temperatures of low and high thermal mass buildings can be found. However, in application it is not
only the ability to store heat that is important, but also how rapidly heat can be charged/discharged
in/from a material (wall, thermal storage system etc) is also important (Wu 2010).

Thermal properties of concrete with different Swedish aggregate materials
16
Figure 2. Comparison of air temperatures of low and high thermal mass framed buildings (Reference: Reardon 2010).
The amount of heat that can be stored in a building depends on the properties and volumes of the
used material in the framework, wall, roof and floor slab inside the insulation (Herlin & Johansson
2011). Many other factors affect how a thermal mass is use such as occupant activity, geographic
orientation, window orientation and energy control system (Herlin & Johansson 2011).
Heat can be stored by two main principles; passive and active storage. Passive storage is heat storage
in materials without any special equipment being used, for instance storing solar energy in concrete
walls, while in active systems heat is moved by action for example pumps (Karlsson 2012).
3.6.1. Passive storage systems
Passive energy storage is heat transferred from the ambient to a building structure by thermal
conductivity, natural convection and radiation (Karlsson 2010). The following example explains how
heat transfer mechanisms take place in thermal mass so it is easier to understand how the
mechanisms work: there is a cold stone in indoor climate; the outer surface will be warmed up by
convection and radiation. Heat will gain from convection from the air and radiation from the sun or
other warmer surfaces in the room. The inner part of the stone will gain heat by conduction (Cengel
2006). Heat from the ambient can be for example solar radiation, electric devices or human heat
production (Karlsson 2010). Passive energy storage is for example when there are temperature
differences between indoor air and constructions parts or when solar radiation heats construction
parts. Note that passive energy storage can also be used for cooling. Significant passive energy
storage mainly occurs in concrete and other materials with high volumetric heat capacity (Karlsson
2010). An example of passive heat storage is when in winter a thermal mass like an internal concrete
wall will absorb heat during daytime from sunlight (Reardon 2010). The heat is released by re-
radiation of the heat into the building at night. In summer heat can be absorbed in same way to keep
a building comfortable. At night will cool night breezes and convection flow through the thermal
mass and draw out the stored energy from day time (Reardon 2010)
The effect of thermal mass is mostly beneficial when the temperature difference between day and
night outdoor temperatures is high. Thermal mass should always be used with good passive design
(Reardon 2010). For passive heat storage system is it desirable with a high time-lag so the material
can buffer the heat between the day and night (Cavanaugh 2002). Materials with high heat capacity
can store heat efficiently in passive energy storage systems, but the thermal conductivity (thermal
diffusivity) is also of importance for the rate of charging/discharging of a storage. Generally, heat
storage structures can be optimized with consideration of volumetric heat capacity and thermal
conductivity (thermal diffusivity) (Cavanaugh 2002).

Thermal properties of concrete with different Swedish aggregate materials
17
3.6.2. Active storage systems
Active storage systems also stores heat but the heat is transferred within or between materials and
structures through pipes/duct systems. For example can heat be stored in the concrete of a heavy
structure in one part of a building and later transferred to cold room in another part of the building.
Active systems can be more effective than passive systems (Karlsson 2012).
3.6.3. Advantages of high thermal mass
High thermal mass buildings have three positive potentials; increased indoor comfort, decrease
energy consumption peaks, and minimal size of the energy system (Karlsson 2012). High mass
constructions make it possible to store energy and make it possible to decrease over-temperature
and can increase comfortable climate. Materials with high mass can store the excessive heat and the
indoor temperature will become more even (Karlsson 2012).
High thermal mass buildings can benefit both the building owner and the energy supplier. A building
that is thermally heavy and well insulated does not need constant heat supply as a thermally light
(and well insulated) building as it takes a long time for the stored heat to leak out in high thermal
mass buildings. An approximate quantified time constant τ of a building is the ratio of the total heat
capacity (J/K) inside the insulation to the total thermal conductance (W/K) of the
insulation (Karlsson 2012):
The time constant can be about three times higher with a well insulated heavy building than a well
insulated light building; this means the temperature of a heavy building will decrease slower than the
light building if both buildings turned off the heating on a cold day or when the temperature
decreased with 63% (Ingvarson & Werner 2008). The slower velocity of decreasing in temperature in
heavy buildings is certain advantage in comparison with light buildings (Ingvarsson & Werner 2008).
Thermally heavy buildings are benefitted for the building owner if the owner chooses not to heat the
house during the cold winter day since he/she does not need to pay high energy price, as the energy
price usually are highest during cold days because of high energy demand. If all high thermal mass
buildings choose not to heat during the coldest winter day the size of the heating system could be
reduced, as the size of heating system is normally dimensioned after the highest energy needs, which
is usually the coolest winter day. Benefits for the building owner and energy suppliers are the
reduced size of the heating system, both the system in the building and the pipes. It has the potential
for smaller dimension of the heating system or it would not be necessary to resizing the heating
system even if inhabitants are gaining in the area. Integrated and smart energy system in buildings is
required for maximum advantages. The energy system of a building must be connected to the energy
company’s energy price and weathering forecast so it can turn off the heating system automatically
when the prices is high during cold days (Karlsson 2012).
Thermal properties of concrete with different Swedish aggregate materials
18
3.7. Thermal expansion coefficient and thermal shock resistance Over the years cracks have occurred in concrete structures, especially in bridges, dams and silos
(Larsson 2012). One of the reasons of cracks occurring is temperature variation in the structures,
causing the structure to expand and contract. Temperature differences in a structure cause
movements and if the structure is fixed the movements are limited which will lead to strains and
stresses in the structure causing cracks (Larsson 2012). The stress that is induced by temperature
changes in the body is called thermal stress (Kingery et al. 1976, Ziman 1967). Temperature
variations in structures can be caused by, for example heat development during concrete hydration
or from solar radiation on one side of the structure and shading on the other side (Larsson 2012, Kim
et al. 2002).
Thermal expansion depends on moisture content in concrete (Marshall 1972). The lowest value of
thermal expansion can be found when relative humanity (RH) is 0% and 100% (dried and wet
conditions) and highest when RH is 60-70% (Marshall 1972).
The linear thermal expansion coefficient is calculated as:
is the linear thermal expansion coefficient (/°C ,1/K), is the length difference (m), is the
original length (m), is the temperature difference (°C, K)and is the strain (m/m) (Burström
2007).
As was mentioned above there are thermal stresses induced by temperature changes in a body
(Kingery et al. 1976, Ziman 1967). The possibility of brittle fractures enhances when temperature
gradients stress occur in the concrete. Rapid cooling causes thermal shock in a brittle material
because the induced surface stresses are then tensile (rapid heating causes compression stresses
that are less of a problem). If the stress is larger than the fracture strength when the material are in
tensile, cracks will occur (Burström 2007). When stress is tensile, crack formation and crack
propagation from surface flaws is more probable. The capacity of a material to resist this type of
failure is called thermal shock resistance, TSR, and is approximated by the following equation:
where is the tensile fracture strength (Pa), the thermal conductivity (W/mK), the elastic
modulus (Pa) and is the linear thermal expansion coefficient (/°C ,1/K). has the unit W/m. It
is best for ceramics to have high TSR, where the fracture strength and thermal conductivity are high
and the elastic modulus and thermal expansion coefficient are low (Burström 2007).
Therefore, the thermal expansion coefficient and thermal shock resistance of concrete with different
aggregates was measured to provide knowledge about if the thermal conductivity and heat capacity
affect the thermal expansion. If the concrete has high thermal conductivity it will rapidly transfer
heat from the structure reducing the thermal expansion, and if the structure is capable of storing
more heat the structure would expand less and this will reduce the thermal movements in the
structure.
Thermal properties of concrete with different Swedish aggregate materials
19
4. Minerals, rocks and aggregates
4.1. Minerals A mineral is a solid material that has a given chemical composition and has been formed by natural
inorganic processes (Svensson 2008). In a mineral the atoms are fixed in lattice structure. The atoms
in a lattice arrangement are fixed in set bounded network in three dimensions and in crystalline.
Mineral can be divided into crystalline and amorphous types. Crystalline minerals have high order on
the atomic level, while amorphous minerals show low order. Amorphous minerals are thereby harder
to identify than the well arranged crystalline ones.
Carbonate minerals are found at the top layer of the bedrock (Svensson 2008). Calcites CaCO3 are the
most important carbonate mineral and dominate in limestone. Silicates are the largest mineral group
and one third of all minerals are silicates. There are different structures of SiO4-tetrahedron which
forms six main groups of silicates. Silicate mineral can be single, double, annular, catenate, layers or
in network arranged of SiO4-tetrahedron. Catenated silicate (inosilikat) consists of chained SiO4-
tetrahedron. Examples of catenated silicate are pyroxene and amphibolite. Pyroxene has single
opened chains while amphibolite has closed-circuit. Tectosilicates (lattice silcates) are SiO4-
tetrahedron arranged in a network. Quartz and feldspar are examples of tectosilicates and they are
the most common mineral. The chemical formula for quartz is SiO2; feldspar is aluminumsilicate
(Al-atoms and SIO4-tetrahedron). Feldspar has two subgroups; potassium feldspar and plagioclase.
The difference between the two subgroups of feldspar is the included elements. Potassium feldspar
has potassium- (K) and Al-silicates. Plagioclase contains calcium- (Ca), sodium- (Na) and Al- silicates.
Potassium feldspar, plagioclase and quartz are usually found in the Swedish gneiss and granite.
Quartz is the hardest mineral among the common ones (Svensson 2008).
4.2. Rocks The definition of a rock is an aggregate of mineral (Svensson 2008). One rock type includes one or
many minerals. The rock appearance depends on the rock formation. Different rock formations will
give the rocks different mineralogical composition, grain- shape, size and structure. Rock is classified
in three main groups; igneous, sedimentary and metamorphic rock types (Svensson 2008). Igneous
rocks are molten material (magma) from below the Earth’s surface and were solidified deep down in
the Earth’s crust (plutonic) or near the ground surface (volcanic) (Smith & Collis 2001). Metamorphic
rocks derive from igneous or sedimentary rocks that have been changed by temperature and
pressure in the depth of the Earth’s crust and their characteristics have been changed with respect to
the original rock. Sedimentary rocks are breakdown products of old rocks that have been
consolidated into layers by transportation by water, wind or ice (Smith & Collis 2001). Igneous and
metamorphic rocks are most common and represent 95% of the Earth’s crust (Svensson 2008). In
Sweden, gneiss and granite are the most common rock types, where granite is an igneous rock and
gneiss is a metamorphic rock. The top layer of the bedrock is commonly sedimentary rocks; these
cover 75% of Earth’s surface. Sedimentary rock is not common in Sweden but can be found in
southern Sweden, Scania (Skåne) (Svensson 2008).
The chemical compositions are very different in different igneous rocks and depend on where and
when solidification occurred (Smith & Collis 2001). The velocity of the cooling of magma is influenced
by the environment (Svensson 2008). Good crystallizations conditions are cooling that happened
slowly and deep down in the Earth crust where the thermal conductivity is low. The lava that
solidifies on the Earth’s surface therefore has low crystallization. Plutonic rock that solidifies deep

Thermal properties of concrete with different Swedish aggregate materials
20
down in the Earth’s crust has bigger mineral grains (around 1 mm) than volcanic rock that solidifies
near the Earth’s surface (0.06 mm). The grains lie close to each other and the appearance is called
granular texture. Volcanic rock sometimes has a porous structure because the magma contained gas.
Another structure is porphyritic structure, where crystal size from mm to cm can be found between
the groundmass. An example of porphyric structure is the rock porphyry, see Fig.3 (Svensson 2008).
Figure 3. A microscope structure of the stone porphyry (Reference: Geological survey of Sweden, SGU, 2013).
Metamorphic rock usually has foliated, aligned elongate or banded structures, or sometimes no
specific structure. In foliated structure the individual mineral grains lies in strain lines; this is
sometimes visible for the naked eye, see Fig.5. The foliated structure indicates that the metamorphic
rocks have been affected by high shear stress. Example of foliated structure is the structure of gneiss;
the color reminds of granite but change in temperature and pressure changed the appearance so the
grains are in lines instead of granular structure, see Fig.4 and Fig.5. The strength in metamorphic
rocks will be reduced since the aligned elongate forms in the rock will create an anisotropic rock.
Metamorphism of a higher level will recrystallize the minerals and in extreme conditions it might
melt down the minerals and then the structure of the stone will not be visible. An example is when
sandstone through metamorphism transformed to quartzite, see Fig.6 (Smith & Collis 2001).
Figure 5. Gneiss stone where the foliate (banded) structure is visible (Reference: Geologia 2013).
Figure 4. “Typical” granite stone: the mineral grains are very easy to see and the color of the stone is red, grey and black (Reference: SGU 2013).

Thermal properties of concrete with different Swedish aggregate materials
21
Figure 6. A quartzite stone from the quarry Forserum. The original layer structure is not visible anymore since the metamorphism melt down the minerals and changed the structure.
The characteristics for sedimentary rocks are that they are layered (Svensson 2008). As was
mentioned above, sedimentary rocks are a result of natural breakdown processes of old rocks. The
name sedimentary rock specifies that it is sedimentation of materials. The mineral grains will go
through the process diagenesis where the grains get connect together (Svensson 2008).
Igneous rock has higher strength than sedimentary and metamorphic rocks, especially the plutonic
rocks. For example has granite 200 MPa in uniaxial compressive strength (Svensson 2008). Granite,
diorite and gabbro normally have high strength. Metamorphic rock such as schist has lower strength
than igneous rocks. The structure of metamorphic rocks generally has a foliated structure that is
mechanically weak. Thus are the metamorphic rocks insidious because of its variation of strength and
need to be analyzed before taking in use. Though is quartzite an exception of being insidious, since it
generally has a high strength. In general sedimentary rocks have the lowest strength and because of
this are these rocks usually not suitable for concrete or pavement. Weathering is a process that is
important to consider because it deteriorate the strength of the rock dramatically (Svensson 2008).
4.3. Rock forming mineral The Earth’s crust contains one third of oxygen (O) and silicon (Si) elements (Svensson 2008). Silicate
mineral is the dominating mineral group. Rock forming minerals are feldspar, quartz, pyroxene,
amphibolites, olivine, mica and calcite. Of rock forming minerals 40% are plagioclase and 18%
potassium feldspar (both minerals are feldspars), 11% are quartz, 16% are catenated silicates of
pyroxene and amphibolites and single silicate olivine, 10% are mica and some percent are calcite
(Svensson 2008).
Unsuitable aggregates for concrete making are materials that are porous, schistaceous, mica rich and
weathered (Ljungkratz et al. 1994). Aggregates with these characteristics have lower solidity and
normally requires more water while casting concrete. Porous aggregates can also cause frost damage
in the concrete. Aggregates that contain chemical substances such as sulfides and alkali-silica are also
unsuitable as concrete aggregate materials. Chemical reaction between sulfides and concrete causes
swelling of the concrete and results in serious damages. Reaction of alkali-silica in concrete also

Thermal properties of concrete with different Swedish aggregate materials
22
cause swelling and can also cause serious damages and sometimes it can destroy whole structures
(Ljungkratz et al. 1994). Petrographic analysis is used for determining the mineral content in a
rock/aggregate (Svensson 2008). The method is based on thin cut section of the rock/aggregate that
is analyzed in microscope. Polarized light will go through the thin section and how the light spreads
depends on the atoms and the lattice structure in the minerals (Svensson 2008). Petrographic
analysis is required to find these unsuitable mineral in rock aggregates (Ljungkratz et al. 1994).
4.4. Aggregates Aggregates constitute about 60-80% of the concrete volume. The type and volume of aggregates
influences the properties of the concrete, the mix proportion and economy (Smith & Collis 2001). The
basic requirement of an aggregate is that it stays stable in the concrete and the exposed
environment throughout the designed lifetime of the concrete. Crushed aggregates (angular) needs
more water than uncrushed (rounded) aggregates. The specific area of crushed aggregates is higher
because the surface of the aggregates is more ragged (Smith & Collis 2001).
Thermal properties of thermal conductivity and specific heat capacity are presented in Tab.3 for
some rock types. Each aggregate material has quite large variation in thermal properties and it is one
of the aims of this work to investigate thermal properties of concrete with different crushed
aggregates.
Table 3. Different experimental values on thermal conductivity and specific heat capacity of different rocks. The data is from (Schön 2011). *The properties values for magnetite are summaries from different literatures, while all the other values are experimental data.
Rock Thermal conductivity [W/m K]
Specific heat capacity [J/kg K]
Igneous and Metamorphic Rocks
Granite 1.25-4.45 670-1550
Granodiorite 1.35-3.40 840-1260
Syenite 1.35-5.20 -
Diorite 1.72-4.14 1130-1170
Gabbro 1.62-4.05 880-1130
Diabase 1.55-4.30 750-1000
Basalte 1.40-5.33 880-890
Quarzite 3.10-7.60 710-1340
Amphibolite 1.35-3.90 -
Gneiss (perpendicular schistosity) 1.2-2.6 460-920
Gneiss (parallell schistosity) 1.2-3.1 -
Magnetite * 4.7-5.3 600
Sedimentary Rocks
Dolomite 1.60-5.50 810-940
Limestone (kalksten) 0.62-4.40 820-1720
Sandstone 0.90-6.50 750-3330
Thermal properties of concrete with different Swedish aggregate materials
23
5. Materials
5.1. Cement The cement used in this study was a CEM II/A-LL 42.5 R
(Byggcement Skövde, Cementa AB). This cement is used for
house building concrete. The density for this cement is
3080 kg/m3, but in the calculation of mix proportion the
density 3100 kg/m3 was used instead since the cement density
is usually approximated to this value.
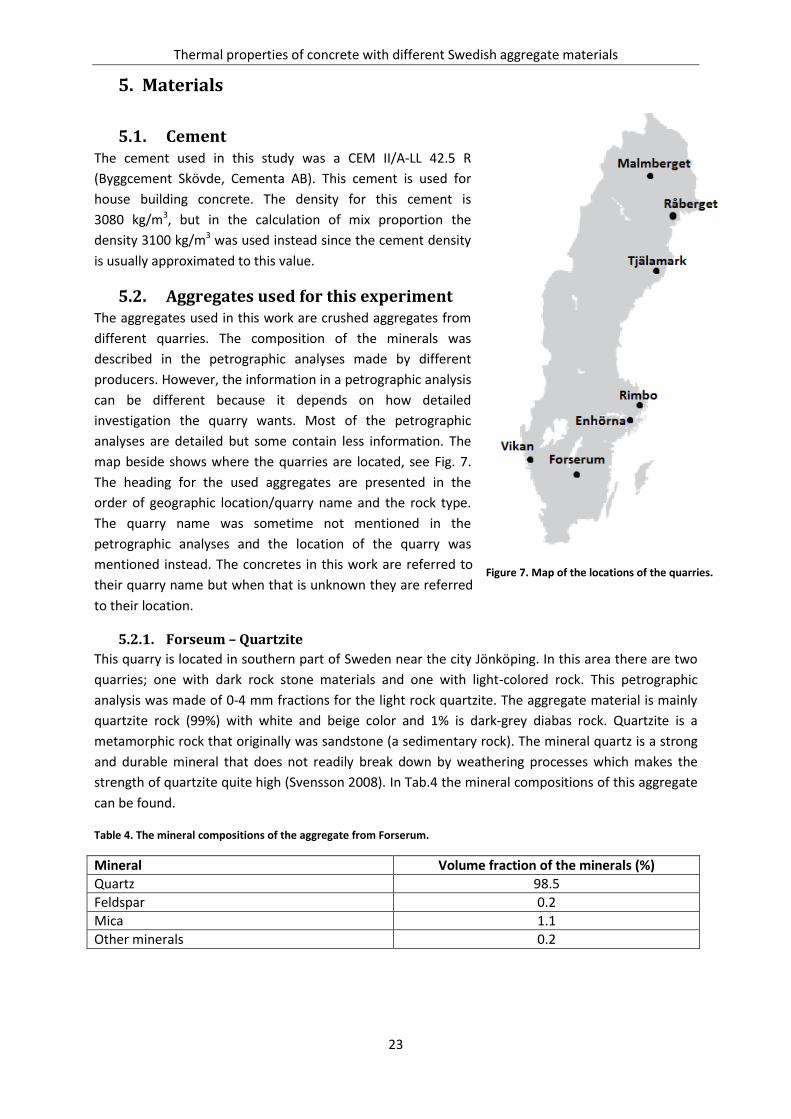
5.2. Aggregates used for this experiment The aggregates used in this work are crushed aggregates from
different quarries. The composition of the minerals was
described in the petrographic analyses made by different
producers. However, the information in a petrographic analysis
can be different because it depends on how detailed
investigation the quarry wants. Most of the petrographic
analyses are detailed but some contain less information. The
map beside shows where the quarries are located, see Fig. 7.
The heading for the used aggregates are presented in the
order of geographic location/quarry name and the rock type.
The quarry name was sometime not mentioned in the
petrographic analyses and the location of the quarry was
mentioned instead. The concretes in this work are referred to
their quarry name but when that is unknown they are referred
to their location.
5.2.1. Forseum – Quartzite
This quarry is located in southern part of Sweden near the city Jönköping. In this area there are two
quarries; one with dark rock stone materials and one with light-colored rock. This petrographic
analysis was made of 0-4 mm fractions for the light rock quartzite. The aggregate material is mainly
quartzite rock (99%) with white and beige color and 1% is dark-grey diabas rock. Quartzite is a
metamorphic rock that originally was sandstone (a sedimentary rock). The mineral quartz is a strong
and durable mineral that does not readily break down by weathering processes which makes the
strength of quartzite quite high (Svensson 2008). In Tab.4 the mineral compositions of this aggregate
can be found.
Table 4. The mineral compositions of the aggregate from Forserum.
Mineral Volume fraction of the minerals (%)
Quartz 98.5
Feldspar 0.2
Mica 1.1
Other minerals 0.2
Figure 7. Map of the locations of the quarries.
Thermal properties of concrete with different Swedish aggregate materials
24
5.2.2. Vikan – Granitoids
The quarry Vikan is located in the south-west part of Sweden near the city Göteborg (Gothenburg).
The analysis was made of 8-16 mm fractions. The rock is granitoids with the characteristics grey,
light-grey, slightly deformed granitoids with mainly angular grains and some elongated grains. The
amount of mica minerals is 19%, which lowers the workability of concrete and the fractions <4 mm
should be minimized in the aggregates. Granitoids is an igneous rock and are similar to granite, but it
is made of different plutonic rocks (Svensson 2008). The mineral compositions of this aggregate can
be found in Tab.5.
Table 5. The mineral compositions of the aggregate from Vikan.
Mineral Volume fraction of the minerals (%)
Quartz 18
Feldspar 39
Amphibole 8
Mica 19
Potential alkali-reactive minerals (ASR) 7
Opaque mineral (sulfides or oxides) 0.2
Other minerals 8
5.2.3. Tjälamark – Gneiss
The quarry Tjälamark is located in northern Sweden near the city Umeå. The rock is mainly
sedimentary gneiss (76.9%) and the rest is granite-pegmatite (15.8%). The sedimentary gneiss is
dark-black and has a large amount of mica mineral biotite. The granite-pegmatite is light, coarse-
grained and contains mica minerals muscovite (light colored) and biotite. The petrographic analysis
was a simplified and it was not specified which minerals the rock contained. The analysis only stated
that the total amount of mica mineral was about 35-40%.The high amount of mica can affect the
workability of concrete and will probably require more water. From the petrographic analysis, the
gneiss is sedimentary gneiss, which this gneiss probably originated from a sedimentary rock.
5.2.4. Enhörna – Granite and gneiss
Enhörna is located in southern-central Sweden, near Stockholm. The petrographic analysis was made
on 32-63 mm fractions. The granite-gneiss aggregate is red and grey, unweathered, heterogeneous,
and has a banded structure. Alkali-silica-reactive (ASR) material was found in the aggregates and the
total amount of ASR is higher than 15%, and expansion tests of the aggregates should be made
before it is used in concrete, as expansion of aggregates can be harmful for the concrete construction.
The petrographic analysis stated the rock type as granite and gneiss. Granite and gneiss can
sometimes be hard to distinguish. This granite seems like it did not go through the metamorphism
completely so some parts still remain as granite. Granite is a plutonic rock that is more acid and the
amount of silicates is higher than 66% (Svensson 2008). In Tab.6 the mineral compositions of this
aggregate are presented.

Thermal properties of concrete with different Swedish aggregate materials
25
Table 6. The mineral compositions of the aggregate from the quarry Enhörna.
Mineral Volume fraction of the minerals (%)
Quartz 16
Feldspar 37
Amphibole 16
Mica 9
Potential alkali-reactive minerals (ASR) 19
Opaque mineral (includes sulfides) 1
Other minerals 3
5.2.5. Råberget– Gneiss
The quarry Råberget is located in northern Sweden near the city Piteå. The aggregate is of the rock
type gneiss. The characteristics for this rock is light-grey, foliated, medium grains 0.5 mm and uneven
grains 3-5 mm. As it was mentioned above gneiss is a metamorphic rock. This gneiss probably has its
origins from granite or other igneous stones. The mineral compositions of this aggregate are
presented in Tab.7.
Table 7. The mineral compositions of the aggregate from Råberget.
Mineral Volume fraction of the minerals (%)
Quartz 31.6
Feldspar 55.3
Mica (biotite) 13.1
5.2.6. Rimbo – Gabbro
Rimbo is a quarry that is located near Stockholm, southern-central Sweden. Petrographic analysis
was made of 8-16 mm fractions. The material is dominated by the rock type gabbro (84%). This
gabbro is dark-grey, angular-, uneven-, granular- and medium grains. The other part of the rock is a
light-grey granitoid with granular texture, even grains and medium sized grains. Gabbro is plutonic
rock that is basic and the amount of silicate is less than 52% (Svensson 2008). In Tab. 8 the mineral
compositions of this aggregate are presented.
Table 8. The mineral compositions of the aggregate from Rimbo.
Mineral Volume fraction of the minerals (%)
Quartz 8
Feldspar 41
Amphibole/Pyroxene 45
Mica 4
Potential alkali-reactive minerals (ASR) 0.9
Opaque mineral (includes sulfides) 0.9
Other minerals 0.3
5.2.7. Malmberget – Magnetite
This rock comes from the iron ore mine Malmberget in Kiruna in the north of Sweden. This is sold as
a concrete aggregate for use in for example shields and counter-weights, where a high density
aggregate is needed. The main mineral of the aggregates are magnetite (90-98%). Other chemical
compounds that are found in this rock are silica, aluminum oxide, calcium oxide, potassium oxide,
sodium oxide and phosphorus. The analysis the quarry provided was more of a chemical analysis
than a petrographic analysis, so minerals content is this rock is unknown apart from the magnetite.

Thermal properties of concrete with different Swedish aggregate materials
26
6. Methods The experimental study in this work was done under laboratory conditions. There were many
parameters that needed to be checked before casting the concrete. Among those studies were
measurements of the density of aggregates, sieving of the aggregates and measurements of the
moisture content. While the concrete was fresh measurements of slump, air-content and density of
the (fresh) concrete were made. Thermal expansion coefficient and compressive cube strength were
measured when the concrete specimens were 28 days old. The thermal properties (thermal
conductivity, diffusivity and heat capacity) were measured with an instrument Hot Disk2500-S on
dried concrete cubes and on aggregates materials with different sizes.
6.1. Density of aggregates The density of the aggregates is important to know, since it is different for different types of
aggregates and to be able to cast a concrete volume that is high enough for all the test specimens,
the density must be known. Measurements of the density of aggregates began with drying the
sample in oven of 105°C over night. A pycnometer (density bottle) with a given volume of 500 ml or
1000 ml was used. The pycnometer was weighed dry. Water was filled to the line on the pycnometer
corresponding to the given volume and was weighed again. The water was poured out of the
pycnometer and it was weighed once more. The next step was to fill the pycnometer with a dry
aggregate sample (about 200 g for the 500 ml pycnometer and 400 g for the 1000 ml pycnometer).
The 500 ml pycnometer was used for smaller fractions (0-4, 0-8 and 8-11 mm) and the 1000 ml
pycnometer for larger fractions (8-16 and 11-16 mm) as the larger fractions were too large to fit in
the 500 ml pycnometer. For the magnetite aggregates the pycnometer was filled with double mass
(400 g instead of 200 g in the 500 ml pycnometer and 800g instead of 400 g in the 1000 ml
pycnometer) since its density is almost twice as high as normal aggregates. After filling the
pycnometer with aggregates, it was weighed again. After that water was filled about 2-3 cm above
the aggregate surface, then the pycnometer was shaken lightly so that the air in the aggregate would
leave. Then was water filled to the line and the pycnometer was weighed once more. Sometimes air
bubbles appeared at the water surface and were removed by a piece of tissue.
6.2. Sieving of the aggregates There are variations in size of the aggregates. For example two aggregates from different quarries
can have the same nominal fractions-sizes-designation differ significantly in actual sizes. Because of
this, the aggregates were sieved before casting. Another reason for this was that the material will
usually get separated during transportation because of vibrations. The larger fractions are usually in
the top layer of the container and the smaller fractions in the bottom. For that reason, it is important
to mix the material and then sieve the material, so the granular curve is representative for the
material. The aggregate materials were more or less moist and needed to be dried. Material samples
of 1-2 kg were either placed in the oven of 105 °C over night or on a plastic foil in the laboratory
over-night. If the moisture content was low will the drying of the material sample on the plastic foil
be enough. The sifters that was used for sieving were 8, 4, 2, 1, 0.5, 0.25, 0.125 and <0.125 mm. The
time was approximately 40-60 minutes for each sieving. When the sieve machine stopped the sifters
were taken out and the material that had stayed in each sifter was weighed. The amounts of the
different fractions were then known and a sieve analyses could be made. From the sieve analyses it is
possible to predict if the mix proportion needs to be adjusted. The fractions 0-8 mm should be
between curves A and B in Fig. 21-27 in Appendix B – Sieve analyses of the quarries. If the fractions
0-8 mm are outside curves A and B, the concrete will be more difficult to cast. Which of the materials

Thermal properties of concrete with different Swedish aggregate materials
27
in the mix proportion that needs to be adjusted is depending on the result of the granular analysis.
For example can an aggregate fraction 0-8 mm contain large amount of fractions that are >8 mm,
which leads to the larger fractions (8-11 and 11-16 or 8-16 mm) need to be reduced. Sometimes the
materials can contain large amount of small fractions (especially fractions <0.25 mm) and in this case
the concrete mix will need more water if these fractions are not reduced.
6.3. Moisture content The aggregates are more or less moist and the moisture content needs to be determined or else will
the amount of mix water and aggregate have the wrong proportion. One or two days before casting
concrete a small aggregate sample was taken, weighed and placed in oven of 105°C over night. On
the day of casting the aggregate sample was taken out from the oven and weighed. The mass
difference between before and after oven drying is the mass of moisture in the aggregates. The mix
proportion was adjusted after the moisture content; the amount of mix water was reduced and the
amount of aggregates was increased as a certain part of the aggregate weight is water.
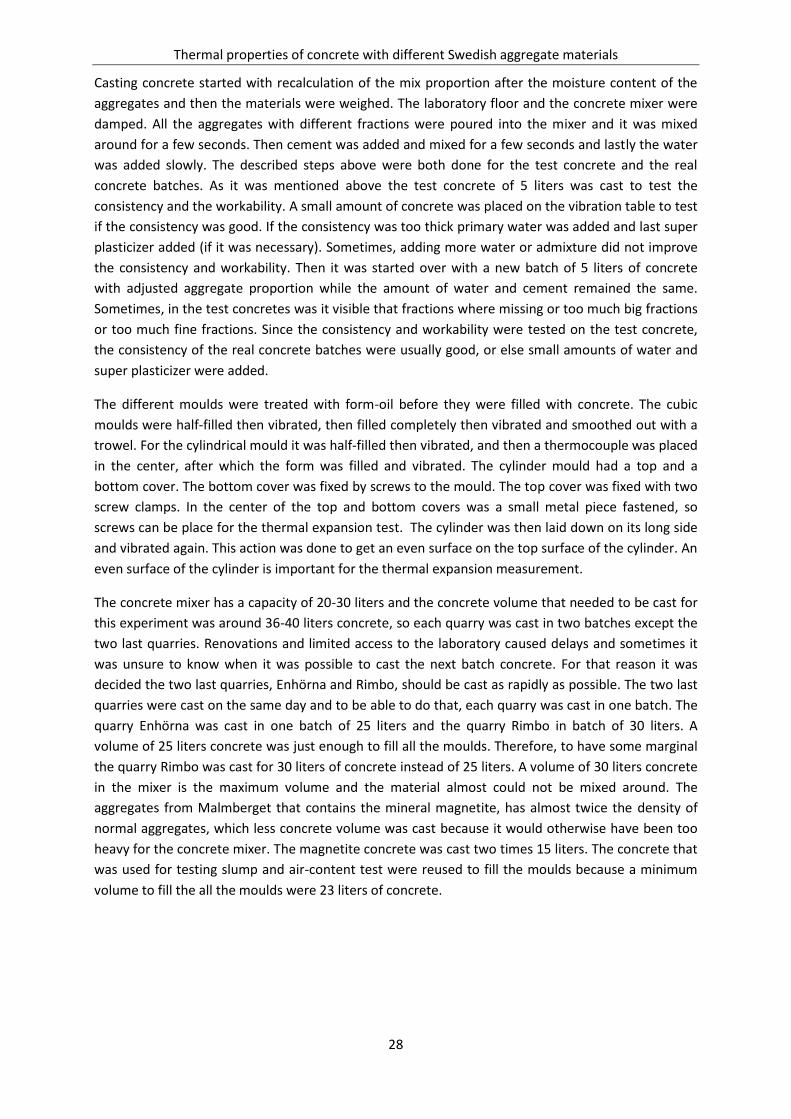
6.4. Cast concrete The concrete specimens that were cast were 5 cubes of the dimension 150 x150 x150 mm and a
cylinder φ150 mm, h=300 mm for each aggregate. Concrete casting needed a concrete mixer, 5 cubic
moulds, a cylindrical mould (moulds dimension are mentioned above), trowel, vibration table, scale,
cement, water and aggregate materials (fractions of 0-16 mm). The concrete mixer that was used for
this experiment was a Sandby tippable counterclockwise mixer model T.U. 75, Fig.8.
Figure 8. The concrete mixer that was used in this experiment.
At first mix proportions were calculated from the granular curves, but when the first batch of
22 liters concrete was cast and there were consistency problems, every mix proportion was modified
individually. The casting started with a test-concrete of 5 liters with a mix proportion of 50% crushed
sand and 50% crushed aggregates, note the proportion of aggregates was sometimes modified
because the amount of different fractions vary. It is known that crusted aggregates need more water
since the specific surfaces of the aggregates are larger (Burström 2007).
Thermal properties of concrete with different Swedish aggregate materials
28
Casting concrete started with recalculation of the mix proportion after the moisture content of the
aggregates and then the materials were weighed. The laboratory floor and the concrete mixer were
damped. All the aggregates with different fractions were poured into the mixer and it was mixed
around for a few seconds. Then cement was added and mixed for a few seconds and lastly the water
was added slowly. The described steps above were both done for the test concrete and the real
concrete batches. As it was mentioned above the test concrete of 5 liters was cast to test the
consistency and the workability. A small amount of concrete was placed on the vibration table to test
if the consistency was good. If the consistency was too thick primary water was added and last super
plasticizer added (if it was necessary). Sometimes, adding more water or admixture did not improve
the consistency and workability. Then it was started over with a new batch of 5 liters of concrete
with adjusted aggregate proportion while the amount of water and cement remained the same.
Sometimes, in the test concretes was it visible that fractions where missing or too much big fractions
or too much fine fractions. Since the consistency and workability were tested on the test concrete,
the consistency of the real concrete batches were usually good, or else small amounts of water and
super plasticizer were added.
The different moulds were treated with form-oil before they were filled with concrete. The cubic
moulds were half-filled then vibrated, then filled completely then vibrated and smoothed out with a
trowel. For the cylindrical mould it was half-filled then vibrated, and then a thermocouple was placed
in the center, after which the form was filled and vibrated. The cylinder mould had a top and a
bottom cover. The bottom cover was fixed by screws to the mould. The top cover was fixed with two
screw clamps. In the center of the top and bottom covers was a small metal piece fastened, so
screws can be place for the thermal expansion test. The cylinder was then laid down on its long side
and vibrated again. This action was done to get an even surface on the top surface of the cylinder. An
even surface of the cylinder is important for the thermal expansion measurement.
The concrete mixer has a capacity of 20-30 liters and the concrete volume that needed to be cast for
this experiment was around 36-40 liters concrete, so each quarry was cast in two batches except the
two last quarries. Renovations and limited access to the laboratory caused delays and sometimes it
was unsure to know when it was possible to cast the next batch concrete. For that reason it was
decided the two last quarries, Enhörna and Rimbo, should be cast as rapidly as possible. The two last
quarries were cast on the same day and to be able to do that, each quarry was cast in one batch. The
quarry Enhörna was cast in one batch of 25 liters and the quarry Rimbo in batch of 30 liters. A
volume of 25 liters concrete was just enough to fill all the moulds. Therefore, to have some marginal
the quarry Rimbo was cast for 30 liters of concrete instead of 25 liters. A volume of 30 liters concrete
in the mixer is the maximum volume and the material almost could not be mixed around. The
aggregates from Malmberget that contains the mineral magnetite, has almost twice the density of
normal aggregates, which less concrete volume was cast because it would otherwise have been too
heavy for the concrete mixer. The magnetite concrete was cast two times 15 liters. The concrete that
was used for testing slump and air-content test were reused to fill the moulds because a minimum
volume to fill the all the moulds were 23 liters of concrete.

Thermal properties of concrete with different Swedish aggregate materials
29
6.5. Slump-test Slump-test is a standard test for consistency of concrete and it is measured on fresh concrete. The
slump-test was performed according to the Swedish standard Institute, SIS, SS-EN 12350-2:2009
Testing fresh concrete –Part 2: Slump-test. In this experiment the consistency only needs to be good
enough to fill out in the moulds. Apparatus for the slump-test are a mould that forms the test
specimen (dimension: 200 mm base diameter, 100 mm top diameter and 300 mm height),
compacting rod (16 mm diameter and 600 mm long), rule and a base plate or even surface. The
mould should have two handles near the top or the foot pieces near the bottom so it can be hold still
see Fig. 9 (SIS 2009a). The slump test required approximately 8-10 liters of concrete.
The mould and the base plate or surface was damped then the mould was placed on the base
plate/surface. While the mould was filled, it was held against the base plate/surface by fixing the
mould with clams or by standing on the two foot pieces. The mould was filled three times and each
time about a third of the height of the mould when the concrete was compacted. Each layer was
compacted 25 times with the compacting rod. The top layer was filled to a heap then compacted. If
the surface was not even after the third time more concrete was filled then evened with the rod
(SIS 2009a). The mould was removed carefully by raising it in the vertical direction and was placed
next to the compacted concrete. The height different between the mould and the highest point of
the concrete is the slump h, see Fig 10.
6.6. Air-content and density of fresh concrete To measure the air-content of the fresh concrete the pressure method used according to Swedish
Standard Institute, SIS, the test SS-EN 12350-7:2009, Testing fresh concrete –Part 7: Air content –
Pressure method was used. This test uses a container with a known volume of 8 liters, cover
assembly, air pump, pressure gauge, trowel and scale (SIS 2009b). The container was damped and
weighted empty. Fresh concrete was filled to half of the container, vibrated then filled and vibrated
again. The concrete surfaced was smoothed out with a trowel (SIS 2009b). By weighing the container
filled with concrete the density of fresh concrete can be determined since the volume of the
container is known.
The air pump and the pressure gauge are fitted on the cover assembly (SIS 2009b). After weighing
the container with concrete was the cover assembly clamped on the container. It is important to
make sure there are no grains on the top of the container because the pressure method will not work
Figure 10. Measure the slump h (Reference: SIS 2009a). Figure 9. The mould from and compacting rod that were used in this experiment.
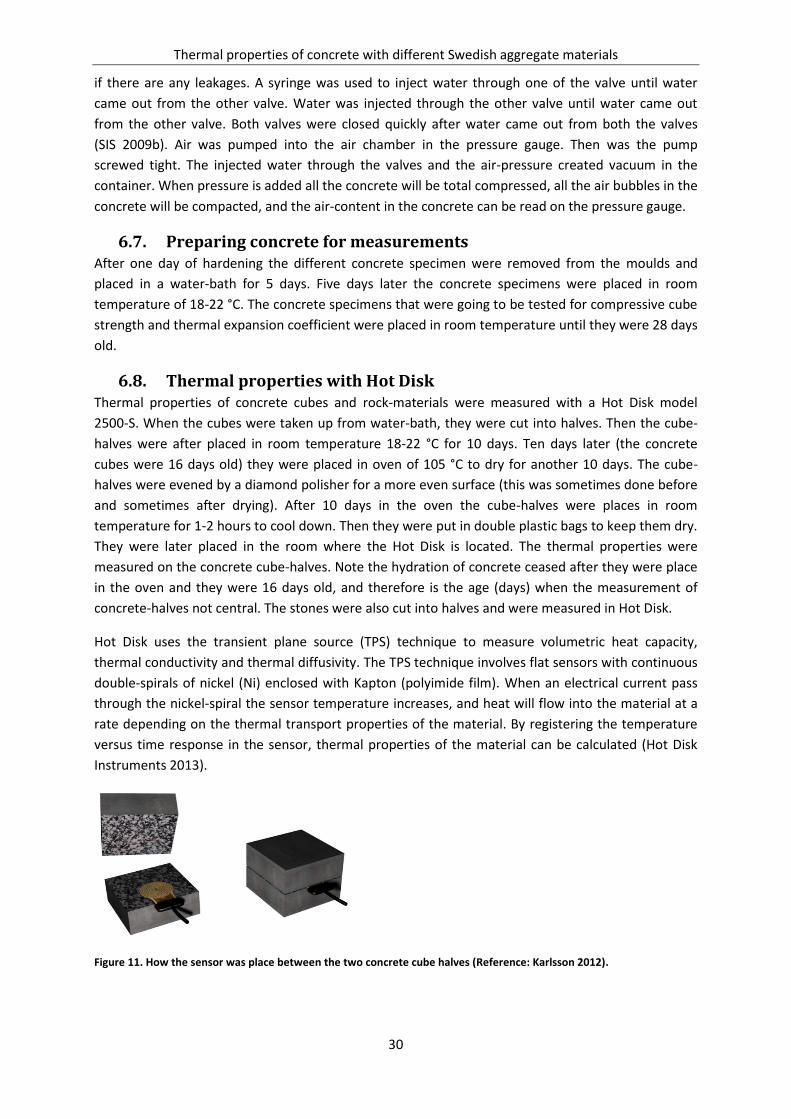
Thermal properties of concrete with different Swedish aggregate materials
30
if there are any leakages. A syringe was used to inject water through one of the valve until water
came out from the other valve. Water was injected through the other valve until water came out
from the other valve. Both valves were closed quickly after water came out from both the valves
(SIS 2009b). Air was pumped into the air chamber in the pressure gauge. Then was the pump
screwed tight. The injected water through the valves and the air-pressure created vacuum in the
container. When pressure is added all the concrete will be total compressed, all the air bubbles in the
concrete will be compacted, and the air-content in the concrete can be read on the pressure gauge.
6.7. Preparing concrete for measurements After one day of hardening the different concrete specimen were removed from the moulds and
placed in a water-bath for 5 days. Five days later the concrete specimens were placed in room
temperature of 18-22 °C. The concrete specimens that were going to be tested for compressive cube
strength and thermal expansion coefficient were placed in room temperature until they were 28 days
old.
6.8. Thermal properties with Hot Disk Thermal properties of concrete cubes and rock-materials were measured with a Hot Disk model
2500-S. When the cubes were taken up from water-bath, they were cut into halves. Then the cube-
halves were after placed in room temperature 18-22 °C for 10 days. Ten days later (the concrete
cubes were 16 days old) they were placed in oven of 105 °C to dry for another 10 days. The cube-
halves were evened by a diamond polisher for a more even surface (this was sometimes done before
and sometimes after drying). After 10 days in the oven the cube-halves were places in room
temperature for 1-2 hours to cool down. Then they were put in double plastic bags to keep them dry.
They were later placed in the room where the Hot Disk is located. The thermal properties were
measured on the concrete cube-halves. Note the hydration of concrete ceased after they were place
in the oven and they were 16 days old, and therefore is the age (days) when the measurement of
concrete-halves not central. The stones were also cut into halves and were measured in Hot Disk.
Hot Disk uses the transient plane source (TPS) technique to measure volumetric heat capacity,
thermal conductivity and thermal diffusivity. The TPS technique involves flat sensors with continuous
double-spirals of nickel (Ni) enclosed with Kapton (polyimide film). When an electrical current pass
through the nickel-spiral the sensor temperature increases, and heat will flow into the material at a
rate depending on the thermal transport properties of the material. By registering the temperature
versus time response in the sensor, thermal properties of the material can be calculated (Hot Disk
Instruments 2013).
Figure 11. How the sensor was place between the two concrete cube halves (Reference: Karlsson 2012).
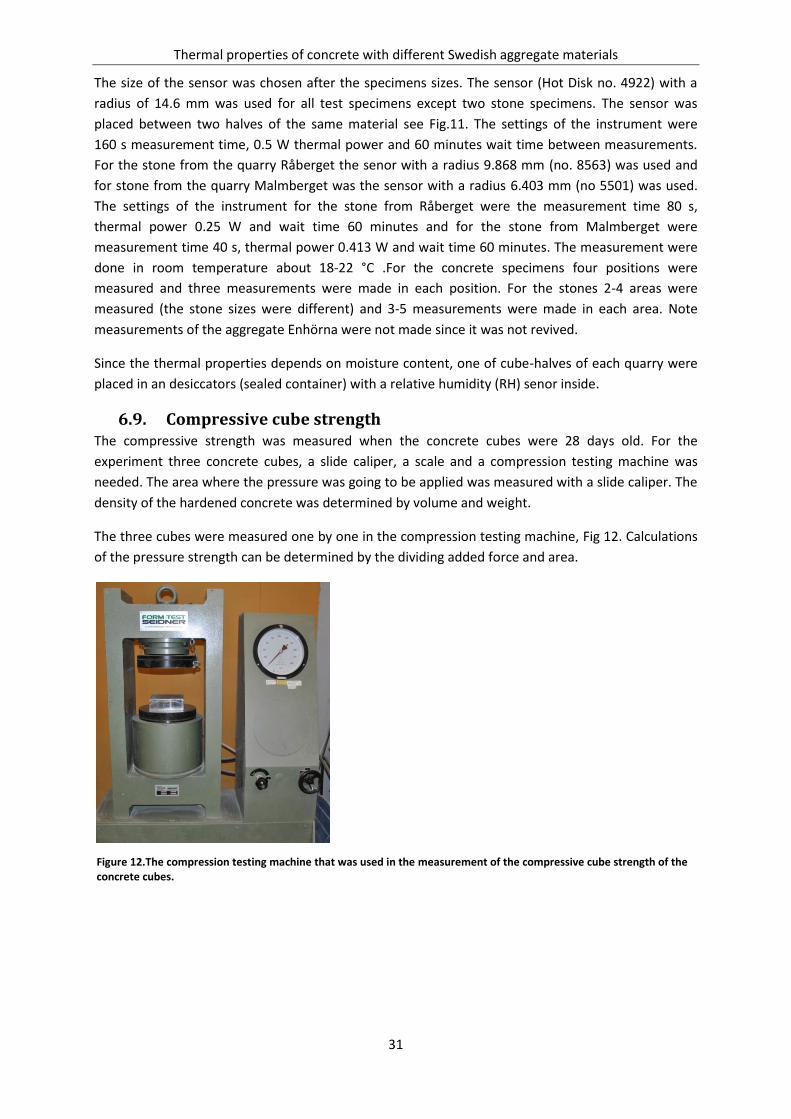
Thermal properties of concrete with different Swedish aggregate materials
31
The size of the sensor was chosen after the specimens sizes. The sensor (Hot Disk no. 4922) with a
radius of 14.6 mm was used for all test specimens except two stone specimens. The sensor was
placed between two halves of the same material see Fig.11. The settings of the instrument were
160 s measurement time, 0.5 W thermal power and 60 minutes wait time between measurements.
For the stone from the quarry Råberget the senor with a radius 9.868 mm (no. 8563) was used and
for stone from the quarry Malmberget was the sensor with a radius 6.403 mm (no 5501) was used.
The settings of the instrument for the stone from Råberget were the measurement time 80 s,
thermal power 0.25 W and wait time 60 minutes and for the stone from Malmberget were
measurement time 40 s, thermal power 0.413 W and wait time 60 minutes. The measurement were
done in room temperature about 18-22 °C .For the concrete specimens four positions were
measured and three measurements were made in each position. For the stones 2-4 areas were
measured (the stone sizes were different) and 3-5 measurements were made in each area. Note
measurements of the aggregate Enhörna were not made since it was not revived.
Since the thermal properties depends on moisture content, one of cube-halves of each quarry were
placed in an desiccators (sealed container) with a relative humidity (RH) senor inside.
6.9. Compressive cube strength The compressive strength was measured when the concrete cubes were 28 days old. For the
experiment three concrete cubes, a slide caliper, a scale and a compression testing machine was
needed. The area where the pressure was going to be applied was measured with a slide caliper. The
density of the hardened concrete was determined by volume and weight.
The three cubes were measured one by one in the compression testing machine, Fig 12. Calculations
of the pressure strength can be determined by the dividing added force and area.
Figure 12.The compression testing machine that was used in the measurement of the compressive cube strength of the concrete cubes.

Thermal properties of concrete with different Swedish aggregate materials
32
6.10. Thermal expansion coefficient The thermal expansion coefficient was performed after the AASHTO TP60-00 standard described in
Yang et al. (2003). Thus in this experiment there were some modifications. According to the method
AASHTO TP60-00 described in Yang et al. (2003) should the concrete be water-saturated, but instead
the concrete were hardened in water for 5 days and tested in normal temperatures, and a relative
humidity of 60-70% instead of 100%. The thermal expansion coefficient will almost be twice as high
as if it was measured in 60-70% RH instead of 100% (Marshall 1972). In use concrete is often exposed
in environments with 60-70% RH and therefore it was decided the concrete should be measure in
room climate where the relative humidity is 60-70%. The temperature range should be 10 to 50°C
according to the standard; however this was not possible, since the temperature in the concrete
specimen would take too long time to change temperature, (5-6 h). The temperature range was
instead 10 to 30°C and the concrete will then only take 2-3 h to change its temperature after each
temperature change.
Before measuring the concrete the extensometer was calibrated because it also expands/shrinks
when temperature increases/decreases. The extensometer was calibrated with an aluminum rod,
whose thermal expansion coefficient was known and the thermal expansion coefficient of the
extensometer can thereby be determined.
Figure 13. A picture of arrangement of the thermal expansion experiment
The thermal expansion coefficients were measured for the concrete specimens at 28 days after
casting. This experiment needed cylindrical concrete specimens, a refrigerator that can go up to 30°C,
LVTD-sensor, dilatometer with screws, 3 thermocouples and a computer for logging the results. The
LVDT-senor logged the length different. 3 thermocouples were logging the temperature; one in the
refrigerator one on the dilatometer and one inside the concrete (cast into the specimen). The
arrangement of the thermal expansion measurement can be seen in Fig.13. The refrigerator was set
for 10°C and 30°C. The refrigerator starts at 20°C and goes up to 30°C in 5 minutes. The cylinder
underwent two cycles (30°C, 10°C, 30°C and 10°C) and the total measurement time was 24 hours,

Thermal properties of concrete with different Swedish aggregate materials
33
which means every cycle was 12 hours. One cycle is 30°C for 6 hours and 10°C for 6 hours. One spike-
shaped screw was screwed on the bottom of the cylinder and a screw with a pane of glass was
screwed on the top. After that was the cylinder assembled to the dilatometer and placed in the
refrigerator. The thermocouples were then connected to the concrete and dilatometer. The LVDT-
sensor was last placed on the top of the dilatometer. The refrigerator was then switched on and the
logging began.
The metal piece that was cast into the cylinder Råberget was not centered, and it was because the
top cover was not fixed properly. A small glass piece was glued on the top of the cylinder instead so
the LVDC-sensor can stand on an even surface.

Thermal properties of concrete with different Swedish aggregate materials
34
7. Calculations All the used equations of calculations of this work are presented here. Calculations of density of
aggregates, compressive cube strength and thermal properties are found below.
7.1. Density of aggregates Density of aggregates was calculated with the equation below
where is the density of aggregates, the sample weight and the volume of the sample.
is the weight of the pycnometer and the sample and is the pycnometer with a little water
inside. The weight of the aggregates sample was derived by subtracting with . is the
volume of the pycnometer and is the volume of the filled water. The volume of the aggregates
sample was calculated by subtracting with .
7.2. Compressive cube strength Compressive strength was calculated with the following equation
where is the compressive strength with the unit , the compression force with the
unit and compressed area with the unit .
7.3. Thermal conductivity The Hashin-Shtrikman model, HS-model, for particles (discontinuous phase) in a matrix (continuous
phase) was used to calculate the expected value of thermal conductivity of concrete. The composite
material will have the thermal conductivity in the given volume , determined from the thermal
conductivities ( and ) and volume fractions ( and ) of spherical particles. The HS-equation is
the following equation (Wadsö 2012).
where and are the thermal conductivities of the continuous and particle phase, respectively,
and and are the volumes of the continuous and particle phase, respectively. Note the equation
above can normally only be used if the particle phase of spherical particles is arranged in a
continuous phase and the particle size and/or their detailed distribution is unknown. In the
calculations the continuous phase was defined as the cement paste and the particle phase was all the
aggregates (the air content was neglected). Thermal conductivities for the aggregates were taken
from the Tab 3. The value 0.58 W/m K was used for cement paste and it is based on an earlier
measurement of the thermal conductivity of the same type of cement paste (Karlsson et.al 2013).
The volume fraction of the continuous and the particle phase is based on the mix proportion. The
thermal conductivity is affected by the moisture content and needs to be adjusted after it. Marshall
(1972) gives such correction factor. To found out the correction factor must the absorbed water in

Thermal properties of concrete with different Swedish aggregate materials
35
cement first be determined. Using a diagram from Wadsö (2012) the absorbed water concrete can be
determined by knowing the water/cement-ratio and relative humidity.
7.4. Heat capacity According to the Swedish concrete manual (1994) the heat capacity of concrete can be calculated by
adding the heat capacities from the used materials (Ljungkrantz et al. 1994, s.651) as it is shown in
Eq. 12:
where is the volumetric heat capacity the material and is the volume of the materials. The
subscript stands for concrete, for cement paste and for aggregates. Specific heats of the
aggregates were taken from the Tab. 3 and by multiplying the specific heat with the measured
density of the aggregates the volumetric heat capacity of the aggregates can be calculated. The value
1.03 MJ/m3 K (volumetric heat capacity) was used for cement (Karlsson et.al 2013). The volume
fraction of the cement paste and aggregates can be found in the mix proportion.
7.5. Thermal diffusivity The calculated values of thermal conductivity and volumetric heat capacity was be used to determine
thermal diffusivity by Eq. 5.
7.6. Thermal expansion coefficient The thermal expansion coefficient is calculated with Eq. 6 and it is shown again:
is the thermal expansion coefficient with unit /°C (1/K), is the length difference with unit m, is
the original length with unit m, is the temperature difference with unit °C (K)and is the strain
with unit m/m (Burström 2007).
Since the registered value of the length difference includes the value of the dilatometer itself
this measured valued must be adjusted. will be lower when the temperature is increasing
(positive ) because the dilatometer itself will also expand, which lowers the registered value.
When the temperature is decreasing (negative ) will be higher because both materials
(concrete and dilatometer) shrink. The calculation of thermal expansion coefficient of concrete is
calculated with the Eq. 13.
where and are the thermal expansion coefficient of concrete respective dilatometer, is
the registered length difference, is original length of concrete and is the strain of concrete. For
more detailed calculation see Appendix E – Calculations of thermal expansion coefficient.
Thermal properties of concrete with different Swedish aggregate materials
36
7.7. Thermal shock resistance The thermal shock resistance, TSR, was calculated by Eq. 8 and it is shown below again.
In the calculations the tensile strength was used for fracture strength (Burström 2007). According
to the handbook from Boverket for concrete constructions BBK 04, the compressive cube strength
gives the concrete different strength class. From the strength classes the tensile strength for non-
fatigue load and the elastic modulus for the concrete can be read from BBK 04 (Boverket 2004). The
tensile strength, elastic modulus and concrete strength class can be found in Appendix A – Slump,
Density of concrete and Compressive cube strength.

Thermal properties of concrete with different Swedish aggregate materials
37
8. Results The results of the density of aggregates, grading curves for the mixed aggregates, mix proportions
and thermal properties are presented here.
8.1. Density of aggregates The measured density of the aggregates is presented in Tab. 9 and they vary from 2620-5070 kg/m3.
Table 9. Density of the aggregates.
Quarry and fraction Density [kg/m3] Quarry and fraction Density [kg/m3]
Forserum 0-8 2630 Råberget 0-4 2690
Forserum 8-11 2620 Råberget 4-8 2670
Råberget 8-16 2660
Vikan 0-8 2760
Vikan 8-11 2820 Rimbo 0-4 2960
Rimbo 4-8 3010
Tjälamark 0-8 2730 Rimbo 8-16 3020
Tjälamark 8-16 2720
MD 0-2 5070
Enhörna 0-8 2710 MD 0-8 4700
Enhörna 8-11 2770 MD 0-20 4800
8.2. Grading curves for mixed aggregates The grading curves for mixed aggregates for casting the different concrete are presented in the
Fig. 14. The curves are composited after the proportion of each the aggregate amount.
Figure 14. Grading curves for mixed aggregates of the different concretes.
0,00%
10,00%
20,00%
30,00%
40,00%
50,00%
60,00%
70,00%
80,00%
90,00%
100,00%
Passed amount (%)
Grain size (mm)
Grading curves for mixed aggregates
Forserum
Vikan
Tjälamark
Enhörna
Råberget
Rimbo
Malmberget
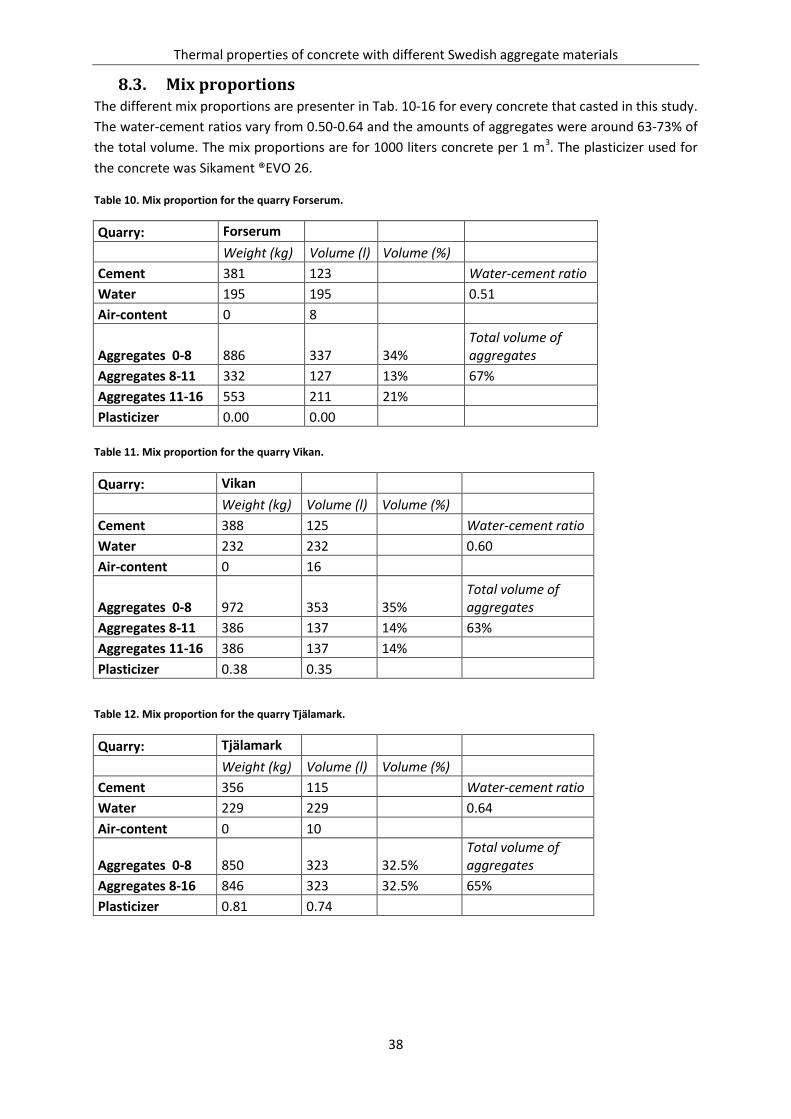
Thermal properties of concrete with different Swedish aggregate materials
38
8.3. Mix proportions The different mix proportions are presenter in Tab. 10-16 for every concrete that casted in this study.
The water-cement ratios vary from 0.50-0.64 and the amounts of aggregates were around 63-73% of
the total volume. The mix proportions are for 1000 liters concrete per 1 m3. The plasticizer used for
the concrete was Sikament ®EVO 26.
Table 10. Mix proportion for the quarry Forserum.
Quarry: Forserum
Weight (kg) Volume (l) Volume (%)
Cement 381 123 Water-cement ratio
Water 195 195 0.51
Air-content 0 8
Aggregates 0-8 886 337 34% Total volume of aggregates
Aggregates 8-11 332 127 13% 67%
Aggregates 11-16 553 211 21%
Plasticizer 0.00 0.00
Table 11. Mix proportion for the quarry Vikan.
Quarry: Vikan
Weight (kg) Volume (l) Volume (%)
Cement 388 125 Water-cement ratio
Water 232 232 0.60
Air-content 0 16
Aggregates 0-8 972 353 35% Total volume of aggregates
Aggregates 8-11 386 137 14% 63%
Aggregates 11-16 386 137 14%
Plasticizer 0.38 0.35
Table 12. Mix proportion for the quarry Tjälamark.
Quarry: Tjälamark
Weight (kg) Volume (l) Volume (%) Cement 356 115 Water-cement ratio
Water 229 229 0.64
Air-content 0 10
Aggregates 0-8 850 323 32.5% Total volume of aggregates
Aggregates 8-16 846 323 32.5% 65%
Plasticizer 0.81 0.74

Thermal properties of concrete with different Swedish aggregate materials
39
Table 13. Mix proportion for the quarry Enhörna.
Quarry: Enhörna
Weight (kg) Volume (l) Volume (%) Cement 384 124 Water-cement ratio
Water 192 192 0.50
Air-content 0 12
Aggregates 0-8 1550 571 57% Total volume of aggregates
Aggregates 8-11 140 50 5% 67%
Aggregates 11-16 140 50 5%
Plasticizer 0.85 0.78
Table 14. Mix proportion for the quarry Råberget.
Quarry Rågberget
Weight (kg) Volume (l) Volume (%) Cement 385 124 Water-cement ratio
Water 192 192 0.50
Air-content 0 9
Aggregates 0-4 363 135 13% Total volume of aggregates
Aggregates 4-8 539 202 20% 67%
Aggregates 8-16 895 337 34%
Plasticizer 0.84 0.77
Table 15. Mix proportion for the quarry Rimbo.
Quarry: Rimbo
Weight (kg) Volume (l) Volume (%) Water-cement ratio
Cement 377 122 0.55
Water 207 207
Air-content 0 11
Aggregates 0-4 879 297 30% Total volume of aggregates
Aggregates 4-8 497 165 16% 66%
Aggregates 8-16 598 198 20%
Plasticizer 0.59 0.54
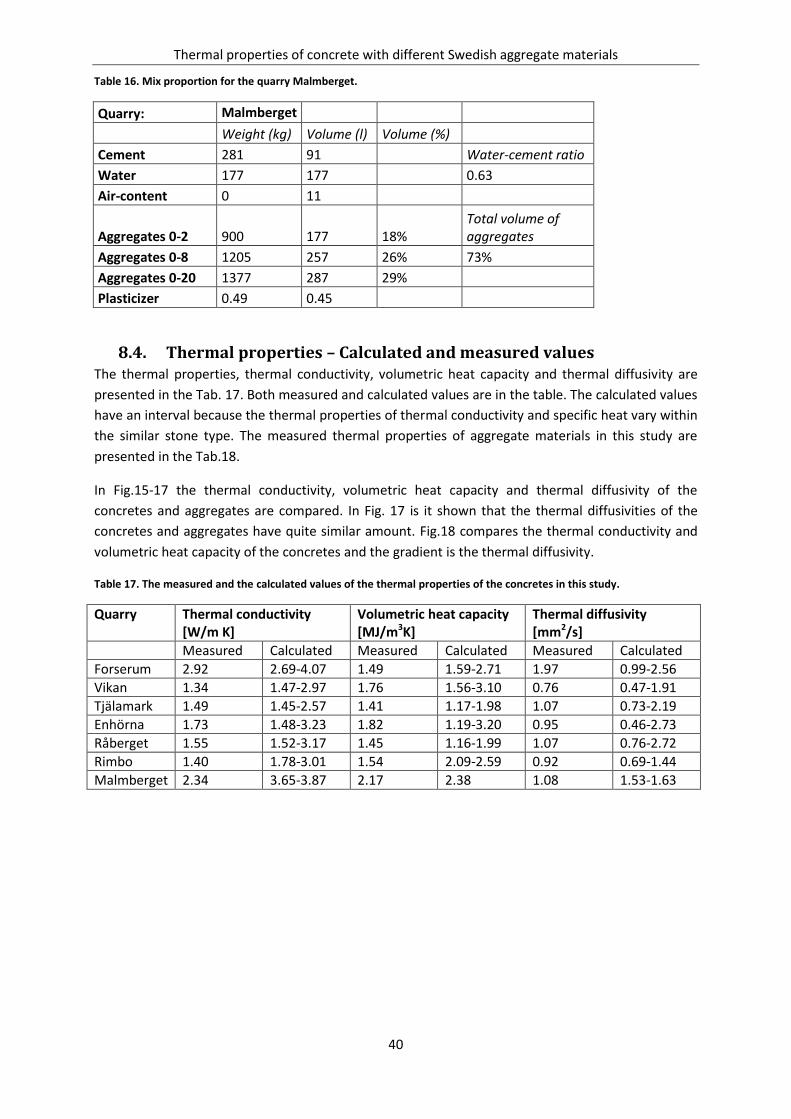
Thermal properties of concrete with different Swedish aggregate materials
40
Table 16. Mix proportion for the quarry Malmberget.
Quarry: Malmberget
Weight (kg) Volume (l) Volume (%) Cement 281 91 Water-cement ratio
Water 177 177 0.63
Air-content 0 11
Aggregates 0-2 900 177 18% Total volume of aggregates
Aggregates 0-8 1205 257 26% 73%
Aggregates 0-20 1377 287 29%
Plasticizer 0.49 0.45
8.4. Thermal properties – Calculated and measured values The thermal properties, thermal conductivity, volumetric heat capacity and thermal diffusivity are
presented in the Tab. 17. Both measured and calculated values are in the table. The calculated values
have an interval because the thermal properties of thermal conductivity and specific heat vary within
the similar stone type. The measured thermal properties of aggregate materials in this study are
presented in the Tab.18.
In Fig.15-17 the thermal conductivity, volumetric heat capacity and thermal diffusivity of the
concretes and aggregates are compared. In Fig. 17 is it shown that the thermal diffusivities of the
concretes and aggregates have quite similar amount. Fig.18 compares the thermal conductivity and
volumetric heat capacity of the concretes and the gradient is the thermal diffusivity.
Table 17. The measured and the calculated values of the thermal properties of the concretes in this study.
Quarry Thermal conductivity [W/m K]
Volumetric heat capacity [MJ/m3K]
Thermal diffusivity [mm2/s]
Measured Calculated Measured Calculated Measured Calculated
Forserum 2.92 2.69-4.07 1.49 1.59-2.71 1.97 0.99-2.56
Vikan 1.34 1.47-2.97 1.76 1.56-3.10 0.76 0.47-1.91
Tjälamark 1.49 1.45-2.57 1.41 1.17-1.98 1.07 0.73-2.19
Enhörna 1.73 1.48-3.23 1.82 1.19-3.20 0.95 0.46-2.73
Råberget 1.55 1.52-3.17 1.45 1.16-1.99 1.07 0.76-2.72
Rimbo 1.40 1.78-3.01 1.54 2.09-2.59 0.92 0.69-1.44
Malmberget 2.34 3.65-3.87 2.17 2.38 1.08 1.53-1.63
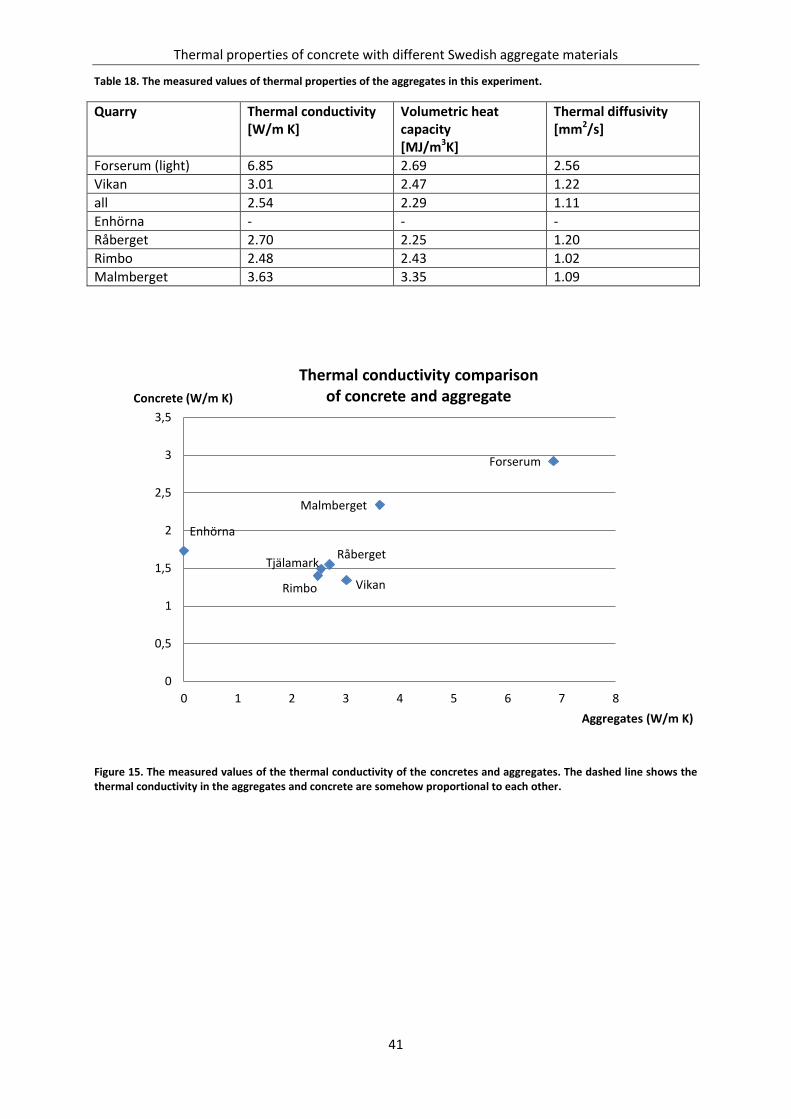
Thermal properties of concrete with different Swedish aggregate materials
41
Table 18. The measured values of thermal properties of the aggregates in this experiment.
Quarry Thermal conductivity [W/m K]
Volumetric heat capacity [MJ/m3K]
Thermal diffusivity [mm2/s]
Forserum (light) 6.85 2.69 2.56
Vikan 3.01 2.47 1.22
all 2.54 2.29 1.11
Enhörna - - -
Råberget 2.70 2.25 1.20
Rimbo 2.48 2.43 1.02
Malmberget 3.63 3.35 1.09
Figure 15. The measured values of the thermal conductivity of the concretes and aggregates. The dashed line shows the thermal conductivity in the aggregates and concrete are somehow proportional to each other.
Forserum
Vikan
Tjälamark
Enhörna
Råberget
Rimbo
Malmberget
0
0,5
1
1,5
2
2,5
3
3,5
0 1 2 3 4 5 6 7 8
Concrete (W/m K)
Aggregates (W/m K)
Thermal conductivity comparison of concrete and aggregate
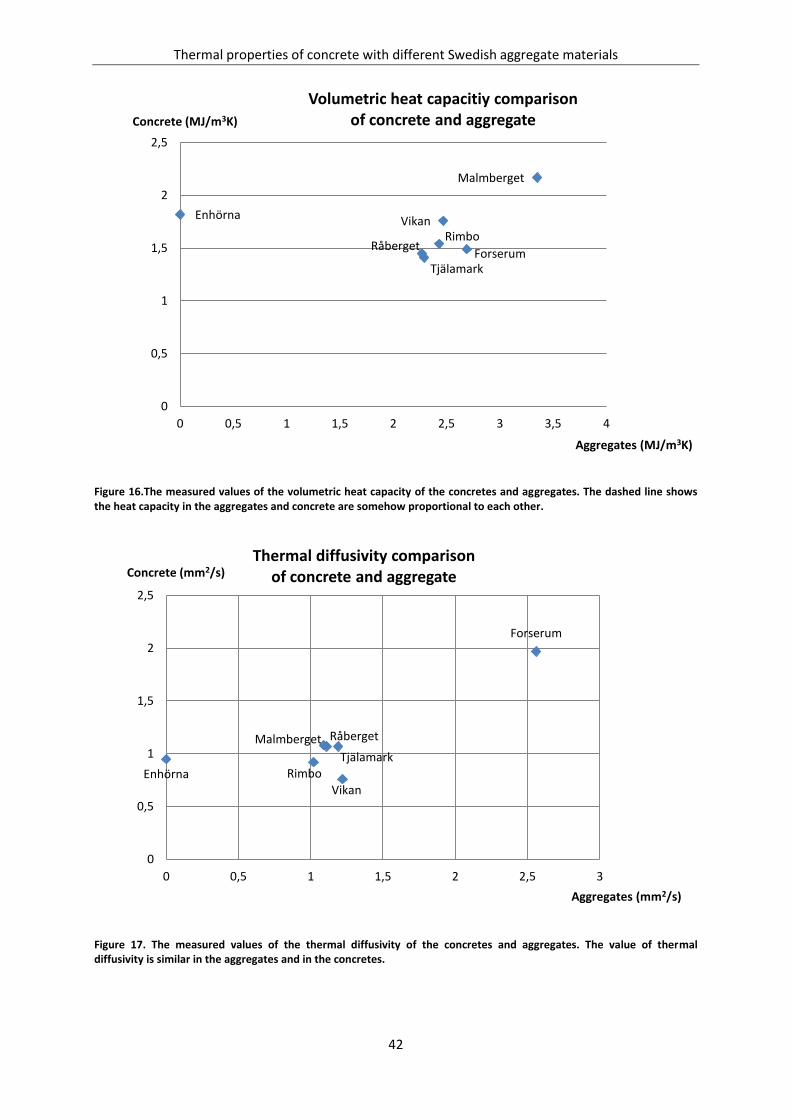
Thermal properties of concrete with different Swedish aggregate materials
42
Figure 16.The measured values of the volumetric heat capacity of the concretes and aggregates. The dashed line shows the heat capacity in the aggregates and concrete are somehow proportional to each other.
Figure 17. The measured values of the thermal diffusivity of the concretes and aggregates. The value of thermal diffusivity is similar in the aggregates and in the concretes.
Forserum
Vikan
Tjälamark
Enhörna
Råberget Rimbo
Malmberget
0
0,5
1
1,5
2
2,5
0 0,5 1 1,5 2 2,5 3 3,5 4
Concrete (MJ/m3K)
Aggregates (MJ/m3K)
Volumetric heat capacitiy comparison of concrete and aggregate
Forserum
Vikan
Tjälamark
Enhörna
Råberget
Rimbo
Malmberget
0
0,5
1
1,5
2
2,5
0 0,5 1 1,5 2 2,5 3
Concrete (mm2/s)
Aggregates (mm2/s)
Thermal diffusivity comparison of concrete and aggregate

Thermal properties of concrete with different Swedish aggregate materials
43
Figure 18.The thermal properties of the concretes. The gradient of the thermal conductivity and volumetric heat capacity is the thermal diffusivity.
8.5. Thermal expansion coefficient and thermal shock resistance The values of the thermal expansion coefficient, TEC, and thermal shock resistance, TSR, are
presented in the Tab. 19. The TECs are in the range from 12.6-15.5∙10-6 /⁰C and the TSRs are in the
range from 5-13 W/m.
Table 19. The measured thermal expansion coefficient of the concrete and the calculated thermal shock resistance.
Quarry
Thermal expansion coefficient [10-6 /⁰C]
Thermal shock resistance [W/m]
Forserum 15.4 13
Vikan 15.5 5
Tjälamark 14.5 6
Enhörna 13.3 9
Råberget 12.6 8
Rimbo 13.7 7
Malmberget 12.8 11
Forserum
Vikan Tjälamark
Enhörna Råberget
Rimbo
Malmberget
0
0,5
1
1,5
2
2,5
3
3,5
0 0,5 1 1,5 2 2,5 Volumetric heat
capacity of concrete (MJ/m3K)
Thermal conductivity of concrete (W/mK)
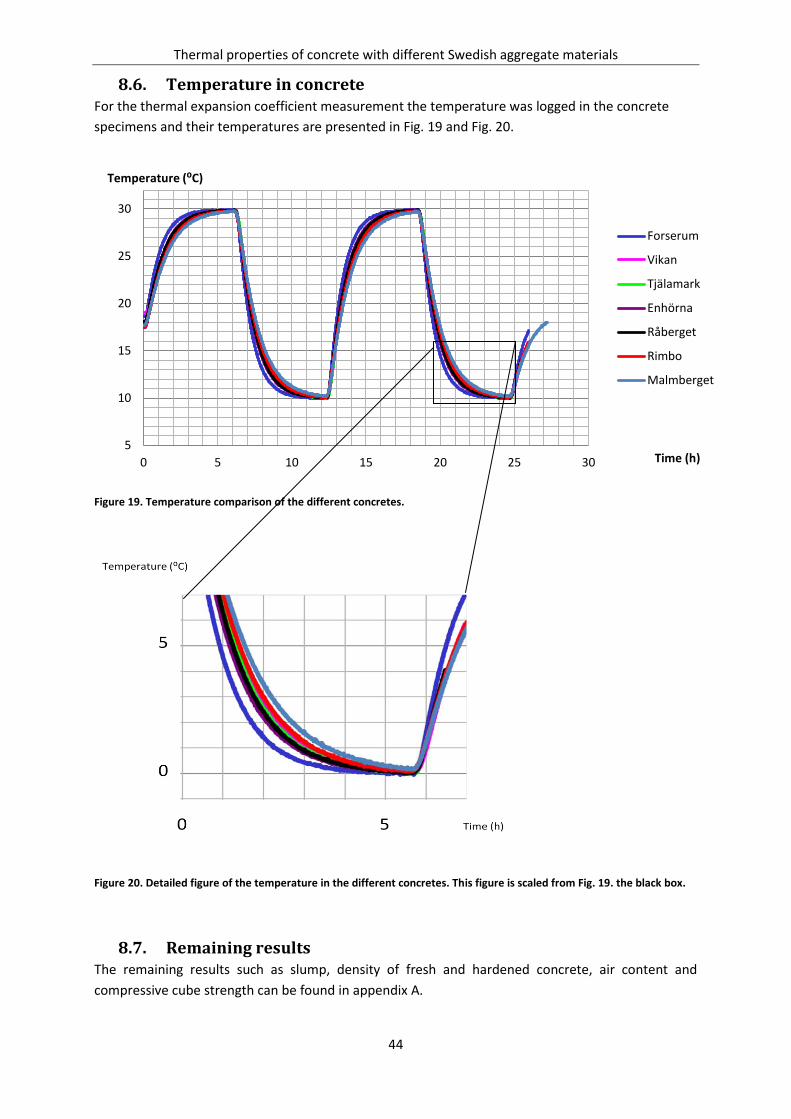
Thermal properties of concrete with different Swedish aggregate materials
44
8.6. Temperature in concrete For the thermal expansion coefficient measurement the temperature was logged in the concrete
specimens and their temperatures are presented in Fig. 19 and Fig. 20.
Figure 19. Temperature comparison of the different concretes.
Figure 20. Detailed figure of the temperature in the different concretes. This figure is scaled from Fig. 19. the black box.
8.7. Remaining results The remaining results such as slump, density of fresh and hardened concrete, air content and
compressive cube strength can be found in appendix A.
5
10
15
20
25
30
0 5 10 15 20 25 30
Temperature (⁰C)
Time (h)
Forserum
Vikan
Tjälamark
Enhörna
Råberget
Rimbo
Malmberget

Thermal properties of concrete with different Swedish aggregate materials
45
9. Analysis Analyses of the measurements are presented with some emphasis on their differences seen between
the different aggregates.
9.1. Forserum The concrete from this quarry contains aggregates with large amount of the mineral quartz.
According to the literature, quartz has high thermal conductivity and this is reflected here in both the
aggregate and the concrete measurements, 6.88 and 2.97 W/m K, respectively. High thermal
conductivity was also seen in the thermal expansion measurements where the aggregates adjusted
themselves to a new temperature within about 3.5 h, instead of 4-5 h for the other concretes, see
Fig. 19 and Fig.20. The thermal expansion coefficient (TEC) was one of the highest among the
measured values.
9.2. Vikan The aggregate used for this concrete is dominated by the mineral feldspar (39%). The thermal
diffusivity of this concrete is 0.76 mm2/ s and this is the lowest value among the measured diffusivity.
It took this concrete more than 4 h to adjust to the ambient temperature. This concrete was second
most rapid one in comparison with the other concretes. As the thermal diffusivity indicates how
quickly temperature changes in a specimen the diffusivity and adjustment time are somewhat
contradictory. The moisture content of the concrete cylinder specimen might have affected the
measurement of the adjustment time and high TEC, this could be caused by high heat capacity of
water and TEC is dependent of the moisture content. This concrete used more water and cement to
cast, water-cement ratio 0.60, which makes the cement paste more porous than a concrete that has
lower water-cement ratio. As it was stated in the petrographic analysis this aggregate contain mica
minerals >19% was more water needed to cast this concrete.
9.3. Tjälamark, Enhörna and Råberget These three concretes are made of aggregates of the rock type gneiss and their thermal properties
are quite similar. The aggregates from these three quarries all have a density around 2.7 g/ cm3. The
thermal properties for the concrete Enhörna in the TEC measurement was slightly quicker, it took
4.5 h instead of 5 h (for Tjälamark and Råberget), thus is the thermal conductivity and volumetric
heat capacity also slightly higher. Once again the moisture content might have affected the TEC of
the concrete cylinder Tjälamark, since this water-cement ratio (0.64) for this concrete is higher than
the other concretes. It was visible that some fractions were missing (4-8 mm) during the cast of
Tjälamark, since there were spaces between the aggregates and the cement paste and the sieve
analysis (see Appendix Fig. 23) also confirm the fractions 4-8 mm were under-represented. This
aggregate also contain mica mineral >19% and more water was needed as this concrete has the
highest water-cement ratio.
For the concrete Enhörna the fractions 0-8 mm were used to 90% of the aggregate volume. This was
because the 0-8 mm fractions contained large amount of large fractions, fractions that are >8 mm,
see Appendix B – Sieve analyses of aggregates.

Thermal properties of concrete with different Swedish aggregate materials
46
9.4. Rimbo This concrete used aggregate materials that contain the darker minerals amphibole and pyroxene
and those two minerals together was around 45% of the mineral composition. The thermal
properties of this concrete were similar to the previous three analyzed concretes with gneiss
aggregates. However, the density of the Rimbo aggregates is around 3.0 g/cm3.
9.5. Malmberget The aggregates for this concrete are dominated by the iron ore mineral magnetite. Magnetite is
known for its high heat capacity and thermal conductivity and this is also shown in the
measurements of the thermal properties of the aggregates and the concrete. Both thermal
conductivity and volumetric heat capacity are higher than for the most other aggregates/concretes.
The amount of aggregates in comparison with the other concretes was somehow higher, instead of
63-67% aggregate material, this concrete used around 72%. It is unsure if the amount of aggregates
affects the thermal properties. The mix proportion of this concrete was provided by the quarry. The
cement and water amount are lower than the other concretes but the water-cement ratio are similar
to the other concretes. Thus, it is difficult to modify mix proportions that have good workability and
knowing this mix proportion provided by the quarry works, was this used to save time.
From the thermal properties measurements of this concrete has it high thermal conductivity, high
heat capacity and thermal diffusivity similar to the other concretes. It took about 5 h for the concrete
to adjust to the ambient temperature during the TEC measurement thus the temperature never
really got to the ambient temperature. This concrete was suppose to have a diffusivity that is similar
to the other concrete but in Fig.19 and Fig. 20 it is shown this concrete is somehow slower in
adjusting to the ambient temperature. The density of the aggregates is almost twice as high as the
other aggregate materials and is approximated to 4.9 g/cm3.

Thermal properties of concrete with different Swedish aggregate materials
47
10. Discussion and conclusions The mix proportion of the concretes could not be the same for all concretes. This is because the
aggregates contain different amounts of fractions and minerals. Even if the proportion of the
different fractions of the aggregates is shown to be different in the mix proportions are the amounts
of the different fractions quite similar in the concretes. The grading curves for mixed aggregates are
shown in Fig. 14. The minerals in the aggregates also affect the amount of mix water, especially the
mineral mica. The aggregates from the quarries Vikan and Tjälamark contain >19% mica mineral and
these two concretes also needed more water to cast.
Most of the aggregate materials contain variable amount of the mineral quartz and feldspar and
three of them were of the rock type gneiss. This is not surprising, since granites and gneiss are the
most common rock types in Sweden and feldspar and quartz the most frequent minerals in rock. If
different mineral compositions give different thermal properties it is hard to draw any conclusions,
since most of the stones are a composition of minerals. However, there were some aggregates that
were dominated with one mineral: more than 90% quartz in one aggregate and another aggregate up
to 95% the iron ore mineral magnetite. The aggregates from Forserum have an amount of quartz
about 90%. The Forserum concrete and aggregates have high thermal conductivity and diffusivity,
thus the volumetric heat capacity is lower than the thermal conductivity (this gives a high diffusivity).
The Malmberget concrete that contains magnetite mineral has thermal conductivity and volumetric
heat capacity that was almost twice of the other aggregates/concretes. However, magnetite
concrete’s thermal diffusivity is similar to the other concrete’s diffusivities, and a general conclusion
is that the most concretes’ thermal conductivity and volumetric heat capacity are proportional to
each other, see Fig. 17 and Fig. 18. The aggregates that have various amounts of feldspar and quartz
minerals do not show any significant differences. It is not possible to give a reason for some of the
minerals that gave slightly higher thermal conductivity and heat capacity. Further analysis of their
inner structure should be made to understand their differences of storing and transferring heat.
Some measured values of the thermal properties with the Hot Disk were excluded because of
deviations of values. It could be one series of measurement or only one value of a series that was
removed. Values of one series of measurement was removed if there were one or more deviated
values, since it was unknown what might have affected the measured series. Thus, if the deviated
value was the first value in one series of measurement only this value was removed, because the
instrument might not have been in thermal equilibrium.
The idea of that if an aggregate has good thermal properties the concrete also will have good
properties (in the aspect that it can for example store high amounts of heat) the measurements on
the aggregates and the concrete confirms that this is correct. The thought that aggregates with high
density also will have good thermal properties was not confirmed in the results; the aggregates from
the quarry Malmberget has a density around 4900 kg/m3 and the aggregates from Forserum has a
density 2600 kg/m3, but the Forserum aggregates have higher thermal conductivity and diffusivity
(but lowest volumetric heat capacity).
The thermal expansion coefficients (TEC) were in the range of 12.6-15.5 ∙106 /⁰C and there were no
correlations between aggregate types and TEC. A possible problem here is that even if the mix
proportions in the beginning were the same it was hard to use the same proportion for every
concrete, because of problem with workability. For that reason some of the concrete has higher
water-cement ratio, which possibly can affect the TEC. Another possible source of uncertainty is the
relative humidity of the room where the experiments were made it was not under controlled

Thermal properties of concrete with different Swedish aggregate materials
48
conditions. The thermal shock resistance (TSR) was calculated by compressive cube strength, thermal
conductivity, elastic modulo and TEC. TSRs with high value was the concretes with high amount of
quartz and magnetite. These concretes have a high TSR because their thermal conductivity is high
(higher than the other concrete). The TEC-values have some uncertainties but the values are still in
the range they should be. High thermal conductivity also gives high TSR and a construction with high
TSR resist sudden temperature changes better.
From the TEC measurements the temperature in the concretes were also logged, see Fig. 19 and Fig.
20. It is shown in Fig.20 the quickest (Forserum) versus the slowest concrete (Malmberget) to adjust
to the ambient temperature, at the same time was 2-3⁰C difference and at the same temperature
was it almost 1.5 h difference. An indoor climate with 2-3⁰C difference can perceive very different.
The diffusivity for the concrete Malmberget has the lowest velocity to adjust to the ambient
temperature, which means the thermal diffusivity should be lowest. From the measurements from
Hot Disk was this concrete’s diffusivity similar to the other concretes’ diffusivity. Comparing the
measured diffusivity from Hot Disk of the concrete Malmberget and Råberget are the values 1.08 and
1.07 mm2/s, respectively. Comparing these two concretes in Fig.19 and Fig.20 it is shown at the same
time is the concrete Malmberget 1-1.5⁰C lower and at the same temperature did the concrete
Råberget reach about an hour earlier. This is contrary and the measured temperature in the concrete
seems more reliable than the values from the Hot Disk since it really shows the thermal behavior of
the concretes.
The conclusions that can be drawn from this work are that the thermal properties of the aggregates
will be reflected in the properties of the concrete. For both thermal conductivity and heat capacity
the values for the dry concretes (RH 10-30%) were about 40-70% of the aggregates’ values. Note this
conclusion does not apply on the thermal diffusivity, it is only the thermal conductivity and heat
capacity that changes in the same way, and since diffusivity is the ratio of those two properties, the
diffusivity will be similar in both the aggregate and the concrete. Granite and gneiss are the most
common rock types in Sweden whereas to find other aggregate materials to optimize the concrete
for desirable thermal properties can be difficult. In this study only two aggregates significantly
affected the thermal properties: quartzite has high thermal conductivity and diffusivity and
magnetite rock has high thermal conductivity and heat capacity. The concrete with magnetite also
has a slower velocity in decreasing of temperature. Another conclusion is concrete with high thermal
conductivity also has high TSR and the concrete will resist rapid temperature changed better. Rapid
temperature change failures can be minimized with high TSR.
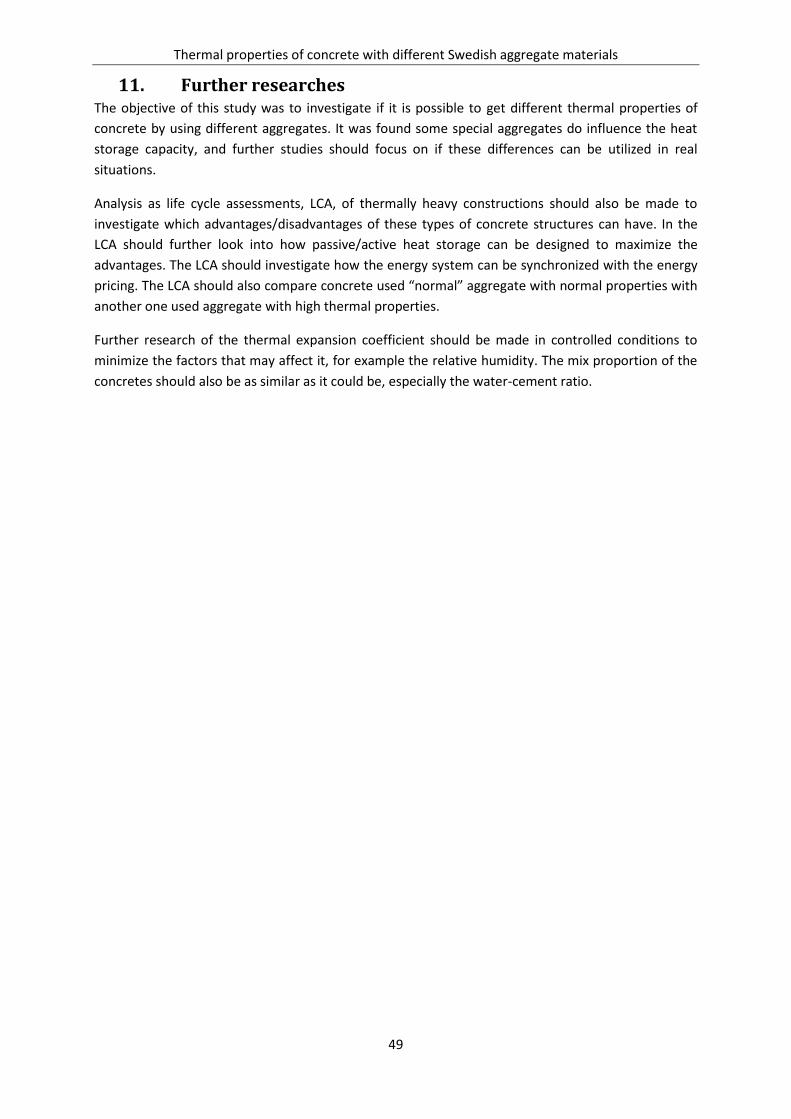
Thermal properties of concrete with different Swedish aggregate materials
49
11. Further researches The objective of this study was to investigate if it is possible to get different thermal properties of
concrete by using different aggregates. It was found some special aggregates do influence the heat
storage capacity, and further studies should focus on if these differences can be utilized in real
situations.
Analysis as life cycle assessments, LCA, of thermally heavy constructions should also be made to
investigate which advantages/disadvantages of these types of concrete structures can have. In the
LCA should further look into how passive/active heat storage can be designed to maximize the
advantages. The LCA should investigate how the energy system can be synchronized with the energy
pricing. The LCA should also compare concrete used “normal” aggregate with normal properties with
another one used aggregate with high thermal properties.
Further research of the thermal expansion coefficient should be made in controlled conditions to
minimize the factors that may affect it, for example the relative humidity. The mix proportion of the
concretes should also be as similar as it could be, especially the water-cement ratio.

Thermal properties of concrete with different Swedish aggregate materials
50
References
Articles Gräslund, J. (2010) Vi behöver både fjärrvärme och värmepumpar men inte på samma ställe. Samhällsbyggaren (5), pp.32-36.
Ingvarson, L.C. Olsson & Wernern, S. (2008) Building mass used as short term heat storage. Conference: The 11th International Symposium on District Heating and Cooling, August 31 to September 2, 2008, Reykjavik, ICELAND.
Karlsson, J (2010) Betydelsen av värmetröga konstruktioner. Bygg och teknik (5), pp. 17-19.
Karlsson, J., Wadsö, L., & Öberg, M. (2013) A conceptual model that simulates the influence of thermal inertia in building structures. Energy and Buildings (60), pp. 146-151.
Khan, M.I. (2001) Factors affecting the thermal properties of concrete and applicability of its prediction models. Building and Environment 37 (2002), pp. 607-614.
Kim, K-H., Jeon S-E., Kim, J-K. & Yang, S. (2002) An experimental study on thermal conductivity of concrete. Cement and Concrete Research 33 (2003), pp. 363-371.
Marshall, A. L. (1972) The thermal properties of concrete. Building Science (7), pp. 167-174.
Svensk Byggtjänst (2004) Metoder att påskynda torkning av betong. AMA-nytt , 1/2004.
Yang, S., Kim, N., Kim, J. & Park, J. (2003) Experimental measurement of concrete thermal expansion. Eastern Asia Society for Transportation Studies (5), pp.1035-1048.
Ziman, J. (1967) Thermal properties of materials. Scientific America, Vol. 217, No. 3, pp.180.188.
Internet Hot Disk Instruments (2013) Hot Disk Technique In-depth, http://www.hotdiskinstruments.com/technology/in-depth.html (Downloaded 2013-11-23).
Geologia (2013) Gnejs (Gneiss) http://www.geologia.fi/index.php/sv/geologi/bergarter/bergartslista/68-svenska/geologi/bergarter/listan/metamorfa/405-gnejs (Downloaded 2013-12-14).
SGU, Geological survey of Sweden (2013) Bergartslära (Learning about rock). http://www.sgu.se/sgu/sv/geologi/berg/bergart_s.htm (Downloaded 2013-12-14).
Literatures Bokalders, V. & Block, M. (2009) Byggekologi: Kunskap för ett hållbart byggande. Stockholm (Sweden): Svensk Byggtjänst.
Boverket (2004) Boverkets handbok om betongkonstruktioner BBK 04. Sweden: Boverket.
Burström, P.G. (2007) Byggnadsmaterial: Uppbyggnad, tillverkning och egenskaper. Second edition. Second printing. Sweden: Studentlitteratur.
Cengel, Y.A. (2006). Heat and mass transfer: A practical Approach. Third edition. The Unites States: McGraw-Hill.
Kingery, W.D., Bowen, H.K. & Uhlmann, D.R. (1976). Introduction to Ceramics. Second edition. New York: John Wiley & Sons.
Ljungkrantz, C., Möller, G. & Petersons, N. (1994). Betonghandboken: Material. Second edition. Stockholm (Sweden): Svensk Byggtjänst and Cementa AB.

Thermal properties of concrete with different Swedish aggregate materials
51
Reardon, C. (2010). Passive design: Thermal mass. In Downton, P. (editor) Your Home Technical Manual. Australia: Australian Government – Department of Climate Change and Energy Efficiency, pp. 114-118.
Schön, J.H. (2011). Physical properties of Rocks: A Workbook. Volume 8. Great Britain: Elsevier.
Smith, M.R. & Collis, L. (2001). Aggregates: Sand, gravel and crushed rock aggregates for construction purposes. Third edition. Bath (UK): The Geological Society.
Svensson, C. (2008). Kompendium i Teknisk Geologi AK. Lund: Faculty of Engineering LTH at Lund University – department of Building and Environmental Technology: Engineering Geology. Lund (Sweden): KFS I Lund AB.
Wadsö, L. (2012). Byggmaterialvetenskap – Kursbok till Byggnadmaterialvetenskap 2012. Faculty of Engineering LTH at Lund University – Division of Building materials. Lund (Sweden): KFS i Lund AB
Wu, S. (2010). Heat energy storage and cooling in buildings. In Hall, M.R.(editor) Materials for energy efficiency and thermal comfort in buildings. Oxford (UK): Woodhead Publishing Limited, pp. 101-126.
Reports Cavanaugh, K (2002). Guide to thermal properties of concrete and masonry systems. American Concrete Institute (ACI Committee 122).
SIS –Swedish Standard Institute (1988), SS 13 71 90. Concrete testing –Fresh concrete –Classification of consistency. Stockholm, Sweden: SIS Förlag AB.
SIS – Swedish Standard Institute (2009a), SS-EN 12350-2:2009. Testing fresh concrete –Part 2: Slump-test. Stockholm, Sweden: SIS Förlag AB
SIS – Swedish Standard Institute (2009b), SS-EN 12350-7:2009. Testing fresh concrete –Part 7: Air content – Pressure method. Stockholm, Sweden: SIS Förlag AB
SCB – Statistics Sweden (2012). Yearbook of Housing and Building Statistics 2012. Stockholm (Sweden): Statistics Sweden, Construction, Rents and Real Estate Statistics Unit.
Theses Herlin, A. & Johansson, G. (2011). En studie av möjligheten att öka den värmelagrande förmågan hos betong. Master thesis. Lund (Sweden): Faculty of Engineering LTH at Lund University – Division of Building Materials.
Karlsson, J. (2012). Possibilities of using thermal mass in buildings to save energy, cut power consumption peaks and increase the thermal comfort. Licentiate thesis. Lund (Sweden): Faculty of Engineering LTH at Lund University – Division of Building Materials.
Larsson, O. (2012). Climate Related Thermal Actions for Reliable Design of Concrete Structures. Doctoral thesis. Lund (Sweden): Faculty of Engineering LTH at Lund University – Division of Structural Engineering.

Thermal properties of concrete with different Swedish aggregate materials
52
Appendix A – Slump, Density of concrete and Compressive cube
strength
Slump and air content The results from the slump test and air content test are presented in Tab.20. The slumps vary from
6-34.5 mm and the air content from 0.75-1.6%. According to the Swedish Standard SS 13 71 90 the
consistency class for all the concretes are S1 and the name of the consistency is plastic; P. During
casting, the concretes had a consistency that was ductile which is what a plastic consistency is. The
air content is normal for concrete, thus is the concretes not suitable for outdoor use, since the air
content are below 5%.
Table 20. Results from the slump test and air content test
Quarry
Slump [mm]
Air content [%]
Forserum 11 0.75
Vikan 34.5 1.6
Tjälamark 18 1.0
Enhörna 6 1.2
Råberget 10 0.9
Rimbo 20 1.1
Malmberget 21 1.1
Density of fresh and hardened concrete The density of fresh and hardened concrete is presented in the Tab. 21. The hardened density of
concrete was measured at 28 days old concrete. The density of fresh concrete is higher than the
hardened concrete since water hydrates in the concrete. The density of the hardened concretes is
normal. The concrete Malmberget has a density that is higher than the other concretes because the
aggregate has higher density.
Table 21. Density of fresh and hardened concrete.
Quarry Density [kg/m3]
Fresh Hardened
Forserum 2399 2354
Vikan 2421 2362
Tjälamark 2394 2325
Enhörna 2451 2426
Råberget 2415 2381
Rimbo 2611 2573
Malmberget 4025 3974

Thermal properties of concrete with different Swedish aggregate materials
53
Compressive cube strength The compressive cube strength of the concrete cubes (150 x 150 x 150 mm3) was measured on three
cubes when the concrete was 28 days old and the mean values of the cubes are presented in the
Tab.22. According to the handbook from Boverket for concrete constructions BBK 04, the
compressive cube strength gives the concrete different strength class. From the strength classes the
tensile strength for non-fatigue load and the elastic modulus for the concretes can be read from
BBK 04. Which strength class a concrete building should have depends on the purpose the
construction part has. Normally a house building concrete has the strength class from C20/25 to
C32/40 and water-cement ratio between 0.5-0.7 (Svensk Byggtjänst 2004).
Table 22. The measured compressive cube strength of the concrete cubes. From the compressive cube strength, strength class, tensile strength and elastic modulus was read from BBK 04.
Quarry
Compressive cube Strength [MPa]
Strength class Tensile strength [MPa]
Elastic modulus [GPa]
Forserum 51 C 40/50 2.40 35.0
Vikan 41 C 32/40 2.00 33.0
Tjälamark 36 C 28/35 1.80 32.0
Enhörna 57 C 45/55 2.55 36.0
Råberget 51 C 40/50 2.40 35.0
Rimbo 54 C 40/50 2.40 35.0
Malmberget 46 C 35/45 2.10 34.0
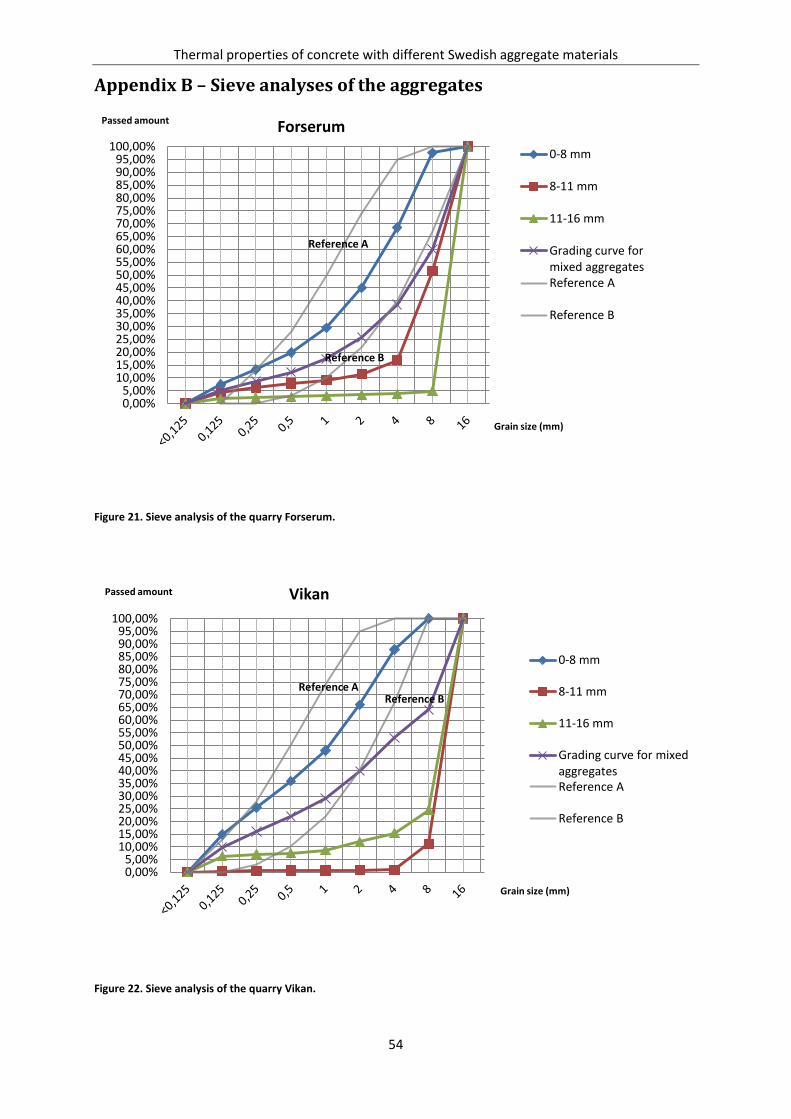
Thermal properties of concrete with different Swedish aggregate materials
54
Appendix B – Sieve analyses of the aggregates
Figure 21. Sieve analysis of the quarry Forserum.
Figure 22. Sieve analysis of the quarry Vikan.
0,00% 5,00%
10,00% 15,00% 20,00% 25,00% 30,00% 35,00% 40,00% 45,00% 50,00% 55,00% 60,00% 65,00% 70,00% 75,00% 80,00% 85,00% 90,00% 95,00%
100,00%
Passed amount
Grain size (mm)
Forserum
0-8 mm
8-11 mm
11-16 mm
Grading curve for mixed aggregates Reference A
Reference B
Reference A
Reference B
0,00% 5,00%
10,00% 15,00% 20,00% 25,00% 30,00% 35,00% 40,00% 45,00% 50,00% 55,00% 60,00% 65,00% 70,00% 75,00% 80,00% 85,00% 90,00% 95,00%
100,00%
Passed amount
Grain size (mm)
Vikan
0-8 mm
8-11 mm
11-16 mm
Grading curve for mixed aggregates Reference A
Reference B
Reference B Reference A
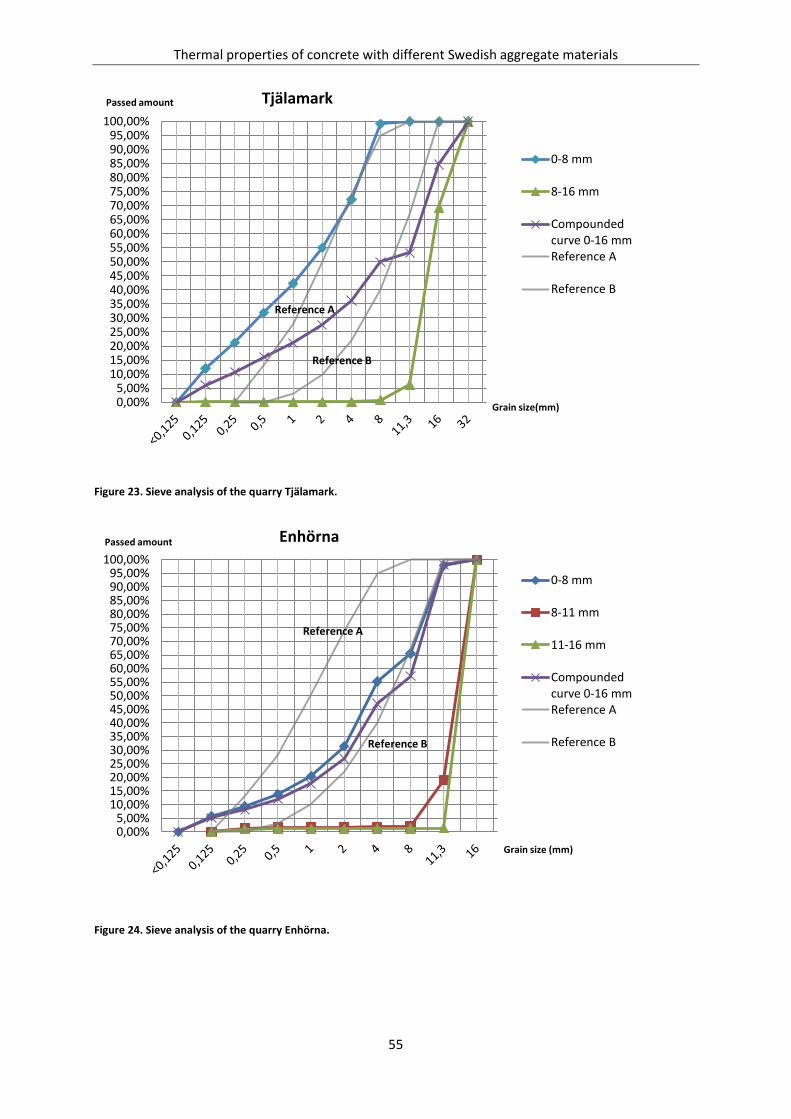
Thermal properties of concrete with different Swedish aggregate materials
55
Figure 23. Sieve analysis of the quarry Tjälamark.
Figure 24. Sieve analysis of the quarry Enhörna.
0,00% 5,00%
10,00% 15,00% 20,00% 25,00% 30,00% 35,00% 40,00% 45,00% 50,00% 55,00% 60,00% 65,00% 70,00% 75,00% 80,00% 85,00% 90,00% 95,00%
100,00%
Passed amount
Grain size(mm)
Tjälamark
0-8 mm
8-16 mm
Compounded curve 0-16 mm Reference A
Reference B
Reference B
Reference A
0,00% 5,00%
10,00% 15,00% 20,00% 25,00% 30,00% 35,00% 40,00% 45,00% 50,00% 55,00% 60,00% 65,00% 70,00% 75,00% 80,00% 85,00% 90,00% 95,00%
100,00%
Passed amount
Grain size (mm)
Enhörna
0-8 mm
8-11 mm
11-16 mm
Compounded curve 0-16 mm Reference A
Reference B Reference B
Reference A
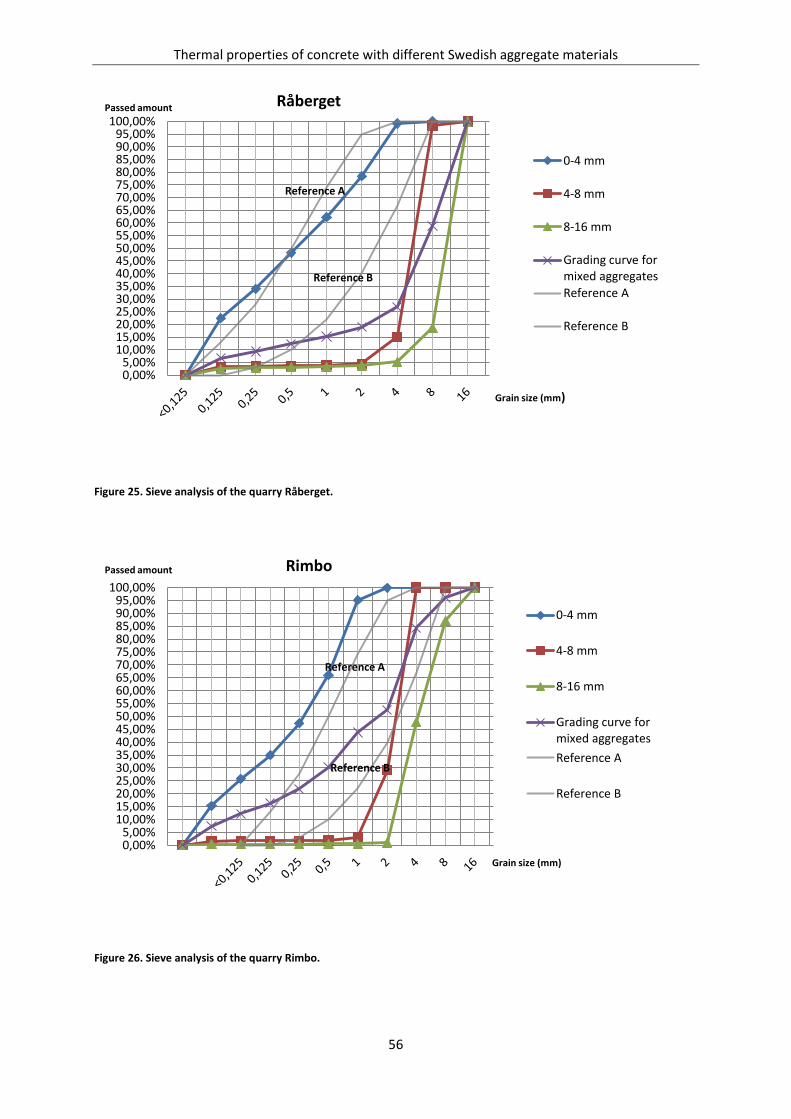
Thermal properties of concrete with different Swedish aggregate materials
56
Figure 25. Sieve analysis of the quarry Råberget.
Figure 26. Sieve analysis of the quarry Rimbo.
0,00% 5,00%
10,00% 15,00% 20,00% 25,00% 30,00% 35,00% 40,00% 45,00% 50,00% 55,00% 60,00% 65,00% 70,00% 75,00% 80,00% 85,00% 90,00% 95,00%
100,00% Passed amount
Grain size (mm)
Råberget
0-4 mm
4-8 mm
8-16 mm
Grading curve for mixed aggregates
Reference A
Reference B
Reference B
Reference A
0,00% 5,00%
10,00% 15,00% 20,00% 25,00% 30,00% 35,00% 40,00% 45,00% 50,00% 55,00% 60,00% 65,00% 70,00% 75,00% 80,00% 85,00% 90,00% 95,00%
100,00%
Passed amount
Grain size (mm)
Rimbo
0-4 mm
4-8 mm
8-16 mm
Grading curve for mixed aggregates
Reference A
Reference B
Reference B
Reference A

Thermal properties of concrete with different Swedish aggregate materials
57
Figure 27. Sieve analysis of the quarry Malmberget.
0,00% 5,00%
10,00% 15,00% 20,00% 25,00% 30,00% 35,00% 40,00% 45,00% 50,00% 55,00% 60,00% 65,00% 70,00% 75,00% 80,00% 85,00% 90,00% 95,00%
100,00%
Passed amount
Grain size (mm)
Malmberget
0-8 mm
8-11 mm
11-16 mm
Grading curve for mixed aggregates
Reference A
Reference B
Reference B
Reference A

Thermal properties of concrete with different Swedish aggregate materials
58
Appendix C – Measured thermal properties from Hot Disk The measured values of the thermal properties are presented in Tab.23-29 for the concretes and
Tab.30-35 for the aggregates. The mean and coefficient of variation are also presented. The
coefficient of variation is the ratio of standard deviation and the mean value. All values are analyzed
with data points 25-150 (in each measurement with Hot Disk there are 200 points). The
measurements were measured in room temperature 18-22⁰C.
Values in one series of measurement that were significantly different to the other values in the series
were removed. The first value in one series that was different to the other values was also removed,
but only this value. This value may not have been thermal equilibrium with the instrument and was
therefore removed. The removed values are marked in grey color.
The measured values of the concrete cubes Table 23. Thermal properties of the concrete from the quarry Forserum.
Area Quarry Th.Conductivity
[W/m K] Th.Diffusivity
[mm2/s]
Vol.heat.cap. [MJ/m
3K]
1 Forserum 2.902368189 1.950327655 1.488143893
1 Forserum 2.913668505 1.984553363 1.468173423
1 Forserum 2.923137384 2.022069648 1.445616568
Mean 2.913058026 1.985650222 1.467311295
Coefficient of variation 0.36% 1.81% 1.45%
2 Forserum 3.013770141 2.121127920 1.420833752
2 Forserum 3.014759838 2.142751118 1.406957538
2 Forserum 3.016887411 2.139568681 1.410044669
Mean 3.015139130 2.134482573 1.412611986
Coefficient of variation 0.05% 0.55% 0.52%
3 Forserum 2.829400591 1.750166331 1.616646681
3 Forserum 2.844099983 1.804018351 1.576536060
3 Forserum 2.847248280 1.827389749 1.558095793
Mean 2.840249618 1.793858144 1.583759511
Coefficient of variation 0.34% 2.21% 1.89%
4 Forserum 3.101801647 3.374002748 0.919323984
4 Forserum 3.093801186 3.366379723 0.919029177
4 Forserum 3.098193163 2.457850845 1.260529364
Mean 3.097931999 3.066077772 1.032960842
Coefficient of variation 0.13% 17.18% 19.08%
All values
Mean 2.97 2.25 1.37
Coefficient of variation 3.46% 24.88% 16.88%
Except the grey values
Mean 2.92 1.97 1.49
Coefficient of variation 2.61% 7.63% 5.24%
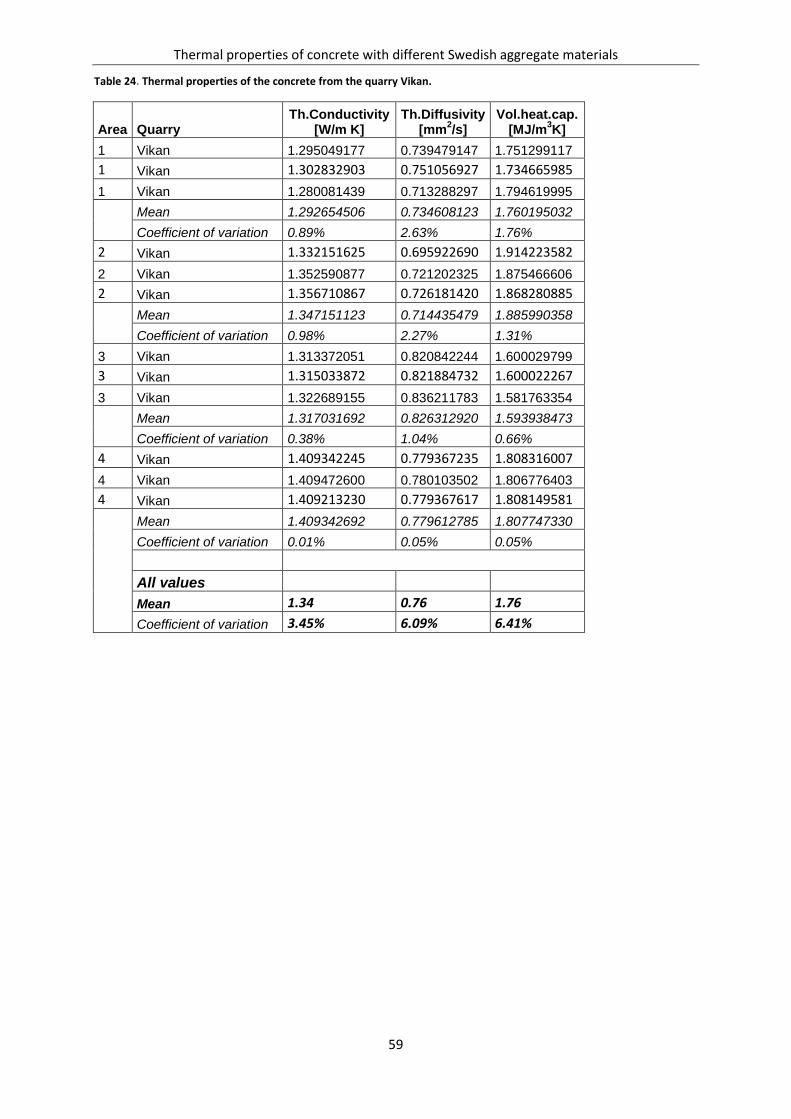
Thermal properties of concrete with different Swedish aggregate materials
59
Table 24. Thermal properties of the concrete from the quarry Vikan.
Area Quarry Th.Conductivity
[W/m K] Th.Diffusivity
[mm2/s]
Vol.heat.cap. [MJ/m
3K]
1 Vikan 1.295049177 0.739479147 1.751299117
1 Vikan 1.302832903 0.751056927 1.734665985
1 Vikan 1.280081439 0.713288297 1.794619995
Mean 1.292654506 0.734608123 1.760195032
Coefficient of variation 0.89% 2.63% 1.76%
2 Vikan 1.332151625 0.695922690 1.914223582
2 Vikan 1.352590877 0.721202325 1.875466606
2 Vikan 1.356710867 0.726181420 1.868280885
Mean 1.347151123 0.714435479 1.885990358
Coefficient of variation 0.98% 2.27% 1.31%
3 Vikan 1.313372051 0.820842244 1.600029799
3 Vikan 1.315033872 0.821884732 1.600022267
3 Vikan 1.322689155 0.836211783 1.581763354
Mean 1.317031692 0.826312920 1.593938473
Coefficient of variation 0.38% 1.04% 0.66%
4 Vikan 1.409342245 0.779367235 1.808316007
4 Vikan 1.409472600 0.780103502 1.806776403
4 Vikan 1.409213230 0.779367617 1.808149581
Mean 1.409342692 0.779612785 1.807747330
Coefficient of variation 0.01% 0.05% 0.05%
All values
Mean 1.34 0.76 1.76
Coefficient of variation 3.45% 6.09% 6.41%
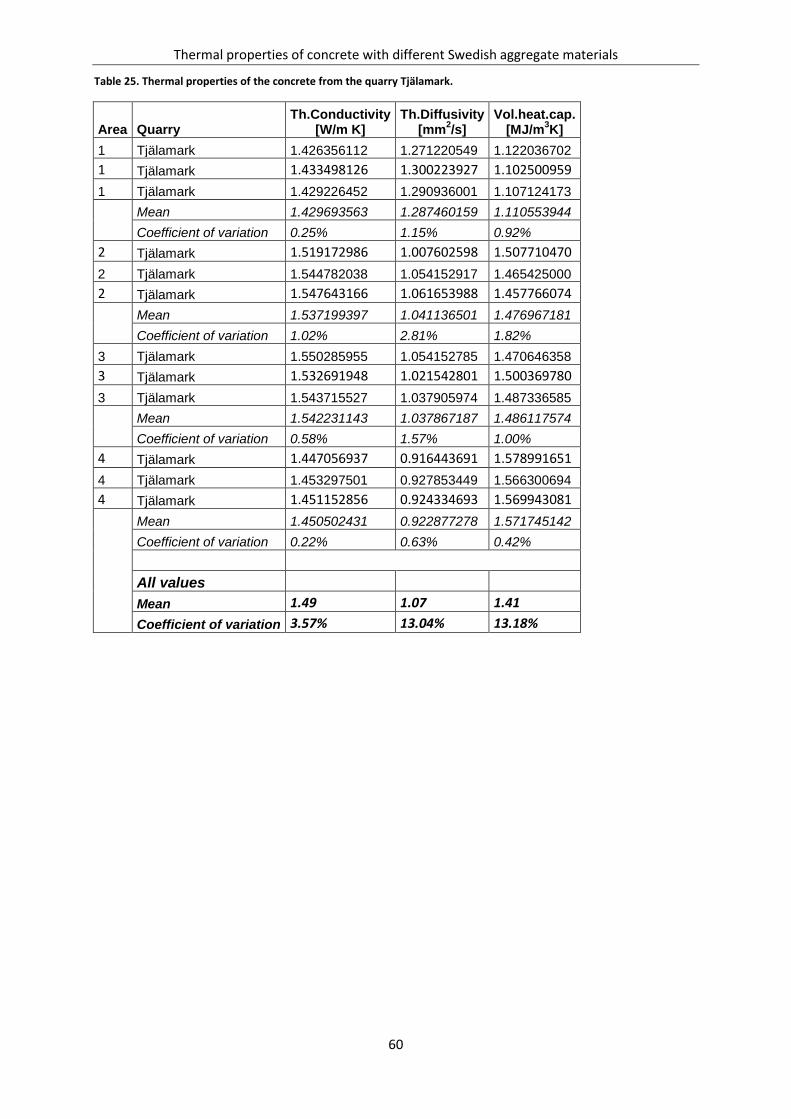
Thermal properties of concrete with different Swedish aggregate materials
60
Table 25. Thermal properties of the concrete from the quarry Tjälamark.
Area Quarry Th.Conductivity
[W/m K] Th.Diffusivity
[mm2/s]
Vol.heat.cap. [MJ/m
3K]
1 Tjälamark 1.426356112 1.271220549 1.122036702
1 Tjälamark 1.433498126 1.300223927 1.102500959
1 Tjälamark 1.429226452 1.290936001 1.107124173
Mean 1.429693563 1.287460159 1.110553944
Coefficient of variation 0.25% 1.15% 0.92%
2 Tjälamark 1.519172986 1.007602598 1.507710470
2 Tjälamark 1.544782038 1.054152917 1.465425000
2 Tjälamark 1.547643166 1.061653988 1.457766074
Mean 1.537199397 1.041136501 1.476967181
Coefficient of variation 1.02% 2.81% 1.82%
3 Tjälamark 1.550285955 1.054152785 1.470646358
3 Tjälamark 1.532691948 1.021542801 1.500369780
3 Tjälamark 1.543715527 1.037905974 1.487336585
Mean 1.542231143 1.037867187 1.486117574
Coefficient of variation 0.58% 1.57% 1.00%
4 Tjälamark 1.447056937 0.916443691 1.578991651
4 Tjälamark 1.453297501 0.927853449 1.566300694
4 Tjälamark 1.451152856 0.924334693 1.569943081
Mean 1.450502431 0.922877278 1.571745142
Coefficient of variation 0.22% 0.63% 0.42%
All values
Mean 1.49 1.07 1.41
Coefficient of variation 3.57% 13.04% 13.18%

Thermal properties of concrete with different Swedish aggregate materials
61
Table 26. Thermal properties of the concrete from the quarry Enhörna.
Area Quarry Th.Conductivity
[W/m K] Th.Diffusivity
[mm2/s]
Vol.heat.cap. [MJ/m
3K]
1 Enhörna 1.688672465 0.918047858 1.839416595
1 Enhörna 1.715691778 0.961499423 1.784391896
1 Enhörna 1.727613393 0.983693138 1.756252358
Mean 1.710659212 0.954413473 1.793353616
Coefficient of variation 1.17% 3.50% 2.36%
2 Enhörna 1.689805528 0.942734398 1.792451333
2 Enhörna 1.693987394 0.950146826 1.782869076
2 Enhörna 1.694558199 0.952017132 1.779966076
Mean 1.692783707 0.948299452 1.785095495
Coefficient of variation 0.15% 0.52% 0.37%
3 Enhörna 1.769346699 1.003013331 1.764031089
3 Enhörna 1.761762022 0.988175295 1.782843621
3 Enhörna 1.767178612 0.999599742 1.767886224
Mean 1.766095777 0.996929456 1.771586978
Coefficient of variation 0.22% 0.78% 0.56%
4 Enhörna 1.764311204 0.918278179 1.921325415
4 Enhörna 1.761676075 0.914447274 1.926492784
4 Enhörna 1.761381005 0.910874371 1.933725508
Mean 1.762456095 0.914533275 1.927181236
Coefficient of variation 0.09% 0.40% 0.32%
All values
Mean 1.73 0.95 1.82
Coefficient of variation 1.99% 3.57% 3.75%
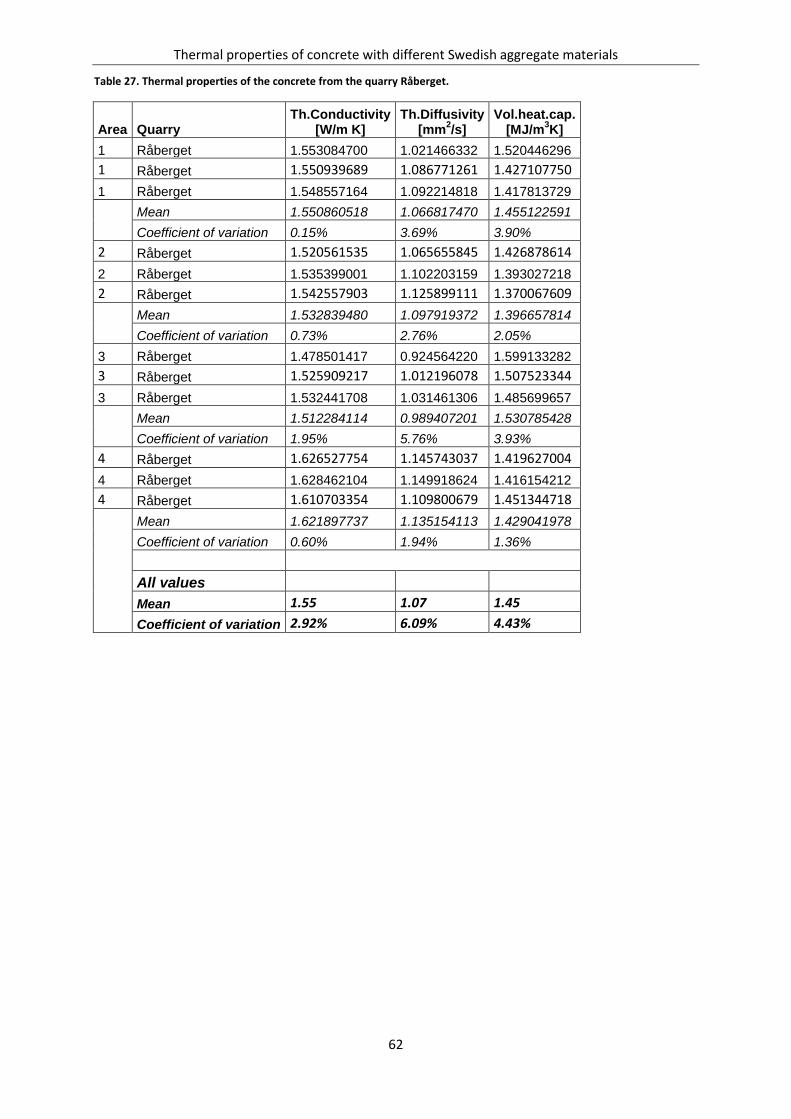
Thermal properties of concrete with different Swedish aggregate materials
62
Table 27. Thermal properties of the concrete from the quarry Råberget.
Area Quarry Th.Conductivity
[W/m K] Th.Diffusivity
[mm2/s]
Vol.heat.cap. [MJ/m
3K]
1 Råberget 1.553084700 1.021466332 1.520446296
1 Råberget 1.550939689 1.086771261 1.427107750
1 Råberget 1.548557164 1.092214818 1.417813729
Mean 1.550860518 1.066817470 1.455122591
Coefficient of variation 0.15% 3.69% 3.90%
2 Råberget 1.520561535 1.065655845 1.426878614
2 Råberget 1.535399001 1.102203159 1.393027218
2 Råberget 1.542557903 1.125899111 1.370067609
Mean 1.532839480 1.097919372 1.396657814
Coefficient of variation 0.73% 2.76% 2.05%
3 Råberget 1.478501417 0.924564220 1.599133282
3 Råberget 1.525909217 1.012196078 1.507523344
3 Råberget 1.532441708 1.031461306 1.485699657
Mean 1.512284114 0.989407201 1.530785428
Coefficient of variation 1.95% 5.76% 3.93%
4 Råberget 1.626527754 1.145743037 1.419627004
4 Råberget 1.628462104 1.149918624 1.416154212
4 Råberget 1.610703354 1.109800679 1.451344718
Mean 1.621897737 1.135154113 1.429041978
Coefficient of variation 0.60% 1.94% 1.36%
All values
Mean 1.55 1.07 1.45
Coefficient of variation 2.92% 6.09% 4.43%
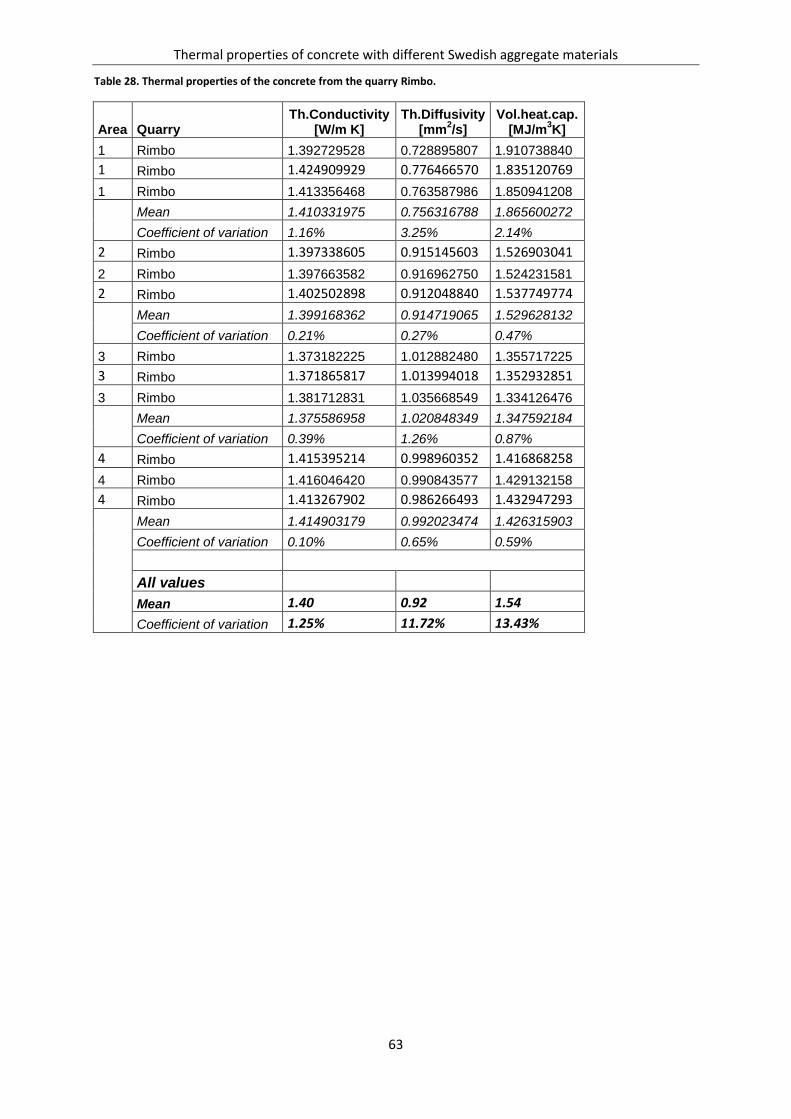
Thermal properties of concrete with different Swedish aggregate materials
63
Table 28. Thermal properties of the concrete from the quarry Rimbo.
Area Quarry Th.Conductivity
[W/m K] Th.Diffusivity
[mm2/s]
Vol.heat.cap. [MJ/m
3K]
1 Rimbo 1.392729528 0.728895807 1.910738840
1 Rimbo 1.424909929 0.776466570 1.835120769
1 Rimbo 1.413356468 0.763587986 1.850941208
Mean 1.410331975 0.756316788 1.865600272
Coefficient of variation 1.16% 3.25% 2.14%
2 Rimbo 1.397338605 0.915145603 1.526903041
2 Rimbo 1.397663582 0.916962750 1.524231581
2 Rimbo 1.402502898 0.912048840 1.537749774
Mean 1.399168362 0.914719065 1.529628132
Coefficient of variation 0.21% 0.27% 0.47%
3 Rimbo 1.373182225 1.012882480 1.355717225
3 Rimbo 1.371865817 1.013994018 1.352932851
3 Rimbo 1.381712831 1.035668549 1.334126476
Mean 1.375586958 1.020848349 1.347592184
Coefficient of variation 0.39% 1.26% 0.87%
4 Rimbo 1.415395214 0.998960352 1.416868258
4 Rimbo 1.416046420 0.990843577 1.429132158
4 Rimbo 1.413267902 0.986266493 1.432947293
Mean 1.414903179 0.992023474 1.426315903
Coefficient of variation 0.10% 0.65% 0.59%
All values
Mean 1.40 0.92 1.54
Coefficient of variation 1.25% 11.72% 13.43%
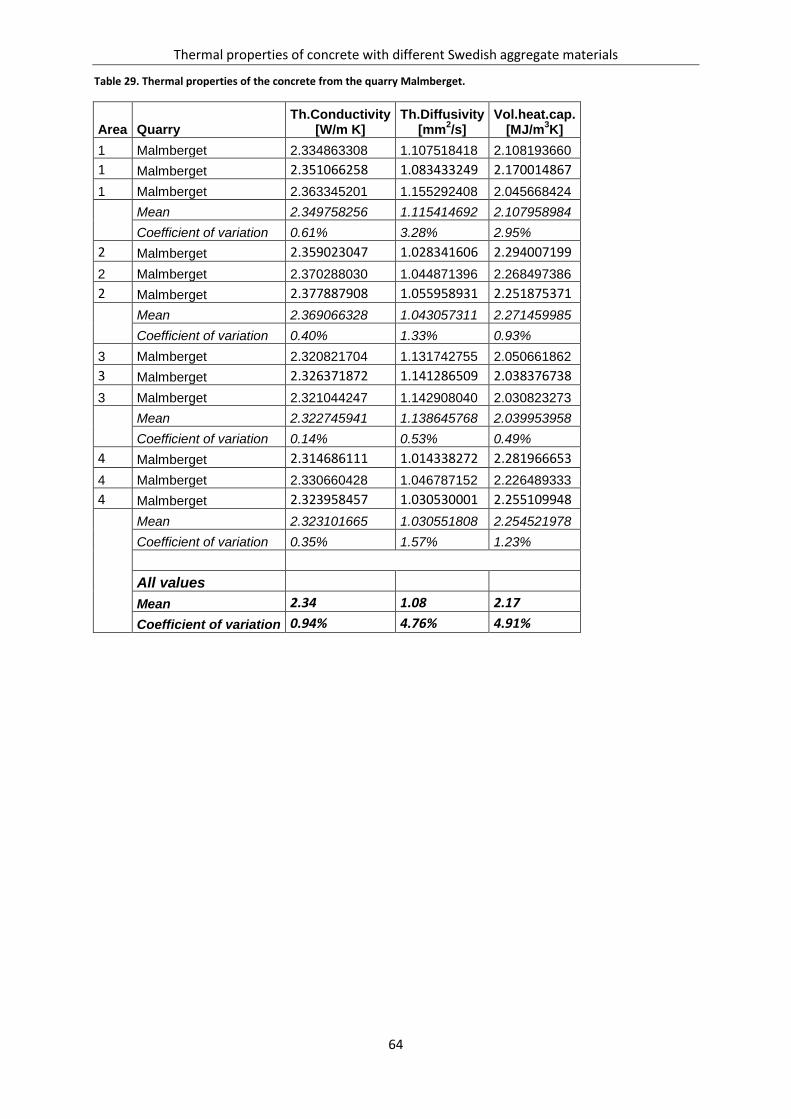
Thermal properties of concrete with different Swedish aggregate materials
64
Table 29. Thermal properties of the concrete from the quarry Malmberget.
Area Quarry Th.Conductivity
[W/m K] Th.Diffusivity
[mm2/s]
Vol.heat.cap. [MJ/m
3K]
1 Malmberget 2.334863308 1.107518418 2.108193660
1 Malmberget 2.351066258 1.083433249 2.170014867
1 Malmberget 2.363345201 1.155292408 2.045668424
Mean 2.349758256 1.115414692 2.107958984
Coefficient of variation 0.61% 3.28% 2.95%
2 Malmberget 2.359023047 1.028341606 2.294007199
2 Malmberget 2.370288030 1.044871396 2.268497386
2 Malmberget 2.377887908 1.055958931 2.251875371
Mean 2.369066328 1.043057311 2.271459985
Coefficient of variation 0.40% 1.33% 0.93%
3 Malmberget 2.320821704 1.131742755 2.050661862
3 Malmberget 2.326371872 1.141286509 2.038376738
3 Malmberget 2.321044247 1.142908040 2.030823273
Mean 2.322745941 1.138645768 2.039953958
Coefficient of variation 0.14% 0.53% 0.49%
4 Malmberget 2.314686111 1.014338272 2.281966653
4 Malmberget 2.330660428 1.046787152 2.226489333
4 Malmberget 2.323958457 1.030530001 2.255109948
Mean 2.323101665 1.030551808 2.254521978
Coefficient of variation 0.35% 1.57% 1.23%
All values
Mean 2.34 1.08 2.17
Coefficient of variation 0.94% 4.76% 4.91%

Thermal properties of concrete with different Swedish aggregate materials
65
The measured values of the aggregate materials Table 30. Thermal properties of the aggregate from the quarry Forserum.
Area Quarry Th.Conductivity
[W/m K] Th.Diffusivity
[mm2/s]
Vol.heat.cap. [MJ/m
3K]
1 Forserum 7.027065605 2.821493376 2.490548326
1 Forserum 6.813425937 3.904578443 1.744983751
1 Forserum 6.968291585 3.012154739 2.313390974
Mean 6.936261042 3.246075519 2.182974350
Coefficient of variation 1.59% 17.81% 17.84%
2 Forserum 6.840200600 2.382073059 2.871532665
2 Forserum 6.837526896 2.427430817 2.816775188
2 Forserum 6.861400484 2.647668195 2.591488048
2 Forserum 6.851404209 2.626178895 2.608887087
2 Forserum 6.858737288 2.696433419 2.543633097
Mean 6.849853895 2.555956877 2.686463217
Coefficient of variation 0.16% 5.53% 5.48%
All values
Mean 6.88 2.81 2.50
Coefficient of variation 1.08% 17.20% 14.08%
Except the grey values
Mean 6.85 2.56 2.69
Coefficient of variation 0.16% 5.53% 5.48%

Thermal properties of concrete with different Swedish aggregate materials
66
Table 31. Thermal properties of the aggregate from the quarry Vikan.
Area Quarry Th.Conductivity
[W/m K] Th.Diffusivity
[mm2/s]
Vol.heat.cap. [MJ/m
3K]
1 Vikan 2.995570623 1.201170574 2.493876131
1 Vikan 3.005212815 1.209780235 2.484098126
1 Vikan 3.031056264 1.246102307 2.432429702
Mean 3.010613234 1.219017705 2.470134653
Coefficient of variation 0.61% 1.96% 1.34%
2 Vikan 3.076887142 1.437664670 2.140198063
2 Vikan 2.982240435 1.252017366 2.381948139
2 Vikan 3.086016873 1.454901302 2.121117679
2 Vikan 3.081160857 1.437747106 2.143047859
2 Vikan 3.080229014 1.439650095 2.139567819
Mean 3.061306864 1.404396108 2.185175912
Coefficient of variation 1.45% 6.09% 5.05%
All values
Mean 3.04 1.33 2.29
Coefficient of variation 1.44% 8.72% 7.43%
Except the grey values
Mean 3.01 1.22 2.47
Coefficient of variation 0.61% 1.96% 1.34%
Table32. Thermal properties of the aggregate from the quarry Tjälamark.
Area Quarry Th.Conductivity
[W/m K] Th.Diffusivity
[mm2/s]
Vol.heat.cap. [MJ/m
3K]
1 Tjälamark 2.538777403 1.094309269 2.319981631
1 Tjälamark 2.558358432 1.117244461 2.289882404
1 Tjälamark 2.551560996 1.107590767 2.303703743
Mean 2.549565610 1.106381499 2.304522593
Coefficient of variation 0.39% 1.04% 0.65%
2 Tjälamark 2.530375836 1.105657584 2.288570958
2 Tjälamark 2.540218633 1.135352328 2.237383561
2 Tjälamark 2.516847271 1.100770365 2.286441705
2 Tjälamark 2.534982471 1.124875011 2.253568126
2 Tjälamark 2.513188069 1.090526681 2.304563577
Mean 2.527122456 1.111436394 2.274105585
Coefficient of variation 0.46% 1.64% 1.22%
All values
Mean 2.54 1.11 2.29
Coefficient of variation 0.61% 1.38% 1.20%

Thermal properties of concrete with different Swedish aggregate materials
67
Table 33. Thermal properties of the aggregate from the quarry Råberget.
Area Quarry Th.Conductivity
[W/m K] Th.Diffusivity
[mm2/s]
Vol.heat.cap. [MJ/m
3K]
2 Råberget 2,709183679 1,209503889 2,239913161
2 Råberget 2,705482484 1,202484621 2,249910257
2 Råberget 2,706177316 1,203182394 2,249182942
2 Råberget 2,689999098 1,178708176 2,282158682
2 Råberget 2,698162230 1,184798702 2,277317004
Mean 2,701800961 1,195735556 2,259696409
Cofficient of variation 0,29% 1,11% 0,83%
3 Råberget 2,696201624 1,213128331 2,222519708
3 Råberget 2,690558599 1,204408119 2,233925989
3 Råberget 2,685650424 1,188264252 2,260145771
Mean 2,690803549 1,201933567 2,238863823
Cofficient of variation 0,20% 1,05% 0,86%
All values
Mean 2,70 1,20 2,25
Cofficient of variation 0,32% 1,04% 0,91%
Table 34. Thermal properties of the aggregate from the quarry Rimbo.
Area Quarry Th.Conductivity
[W/m K] Th.Diffusivity
[mm2/s]
Vol.heat.cap. [MJ/m
3K]
1 Rimbo 2.441076186 0.984565336 2.479344028
1 Rimbo 2.446527496 0.989359234 2.472840411
1 Rimbo 2.459214442 1.006421346 2.443523731
2 Rimbo 2.453771535 1.000475957 2.452604202
2 Rimbo 2.465603616 1.014896059 2.429414908
Mean 2.448939374 0.993448639 2.465236057
Coefficient of variation 0.38% 1.16% 0.77%
2 Rimbo 2.590722472 1.167492522 2.219048450
2 Rimbo 2.527807475 1.071380253 2.359393378
2 Rimbo 2.532047707 1.077687390 2.349519658
Mean 2.550192551 1.105520055 2.309320495
Coefficient of variation 1.38% 4.86% 3.39%
All values
Mean 2.49 1.04 2.40
Coefficient of variation 2.17% 6.04% 3.66%
Except the grey value
Mean 2.48 1.02 2.43
Coefficient of variation 1.55% 3.74% 2.15%

Thermal properties of concrete with different Swedish aggregate materials
68
Table 35. Thermal properties of the aggregate from the quarry Malmberget.
Area Quarry Th.Conductivity
[W/m K] Th.Diffusivity
[mm2/s]
Vol.heat.cap. [MJ/m
3K]
1 Malmberget 3.700385851 1.207106400 3.065500978
1 Malmberget 3.639546020 1.126112784 3.231955157
1 Malmberget 3.640543960 1.130269119 3.220953222
2 Malmberget 3.641730841 1.131164818 3.219452006
2 Malmberget 3.638111361 1.125769509 3.231666278
Mean 3.652063607 1.144084526 3.193905528
Coefficient of variation 0.74% 3.09% 2.25%
2 Malmberget 3.575001736 0.998620588 3.579939948
2 Malmberget 3.522437440 0.929242313 3.790655453
2 Malmberget 3.657418588 1.067287893 3.426834138
Mean 3.584952588 0.998383598 3.599143180
Coefficient of variation 1.90% 6.91% 5.08%
All values
Mean 3.63 1.09 3.35
Coefficient of variation 1.42% 7.75% 6.81%

Thermal properties of concrete with different Swedish aggregate materials
69
Appendix D – Thermal expansion coefficient and temperature of
concrete and dilatometer The thermal expansion measurements were both logged on the length of the LVDT-sensor and
temperature of on the dilatometer and in the concrete. The figures on the left are the calculated
values of the TEC of the concrete and the figures on the right are the logged temperatures of the
dilatometer and concrete.
Figure 31. Temperature measurements of dilatometer and Vikan concrete. Figure 30. Thermal expansion measurements of Vikan concrete.
Figure 29. Temperature measurements of dilatometer and Forserum concrete.
Figure 28. Thermal expansion measurements of Forserum concrete.

Thermal properties of concrete with different Swedish aggregate materials
70
Figure 33. Temperature measurements of dilatometer and Tjälamark concrete.
Figure 32. Thermal expansion measurements of Tjälamark concrete.
Figure 37. Temperature measurements of dilatometer and Råberget concrete.
Figure 36. Thermal expansion measurements of Råberget concrete.
Figure 35. Temperature measurements of dilatometer and Enhörna concrete.
Figure34. Thermal expansion measurements of Enhörna concrete.

Thermal properties of concrete with different Swedish aggregate materials
71
Figure 41. Temperature measurements of dilatometer and Malmberget concrete.
Figure 40. Thermal expansion measurements of Malmberget concrete.
Figure 39. Temperature measurements of dilatometer and Rimbo concrete.
Figure 38. Thermal expansion measurements of Rimbo concrete.
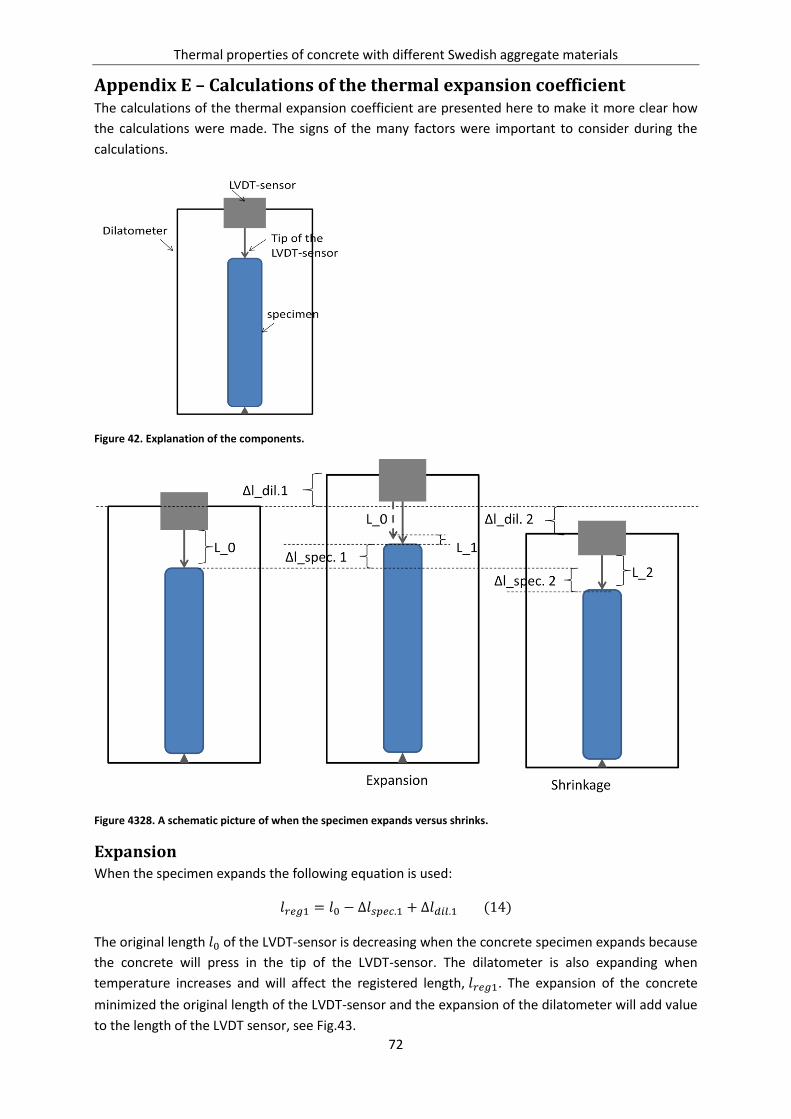
Thermal properties of concrete with different Swedish aggregate materials
72
Appendix E – Calculations of the thermal expansion coefficient The calculations of the thermal expansion coefficient are presented here to make it more clear how
the calculations were made. The signs of the many factors were important to consider during the
calculations.
Figure 42. Explanation of the components.
Figure 4328. A schematic picture of when the specimen expands versus shrinks.
Expansion When the specimen expands the following equation is used:
The original length of the LVDT-sensor is decreasing when the concrete specimen expands because
the concrete will press in the tip of the LVDT-sensor. The dilatometer is also expanding when
temperature increases and will affect the registered length, . The expansion of the concrete
minimized the original length of the LVDT-sensor and the expansion of the dilatometer will add value
to the length of the LVDT sensor, see Fig.43.

Thermal properties of concrete with different Swedish aggregate materials
73
Shrinkage When the concrete shrinks is the following equation used:
The original length of the tip, of the LVDT-sensor is increasing when the concrete specimen shrinks
since the concrete will contract and the tip of the LVDT-sensor extends. The dilatometer is also
shrinking when temperature decreases and will affect the registered length, . The shrinkage will
extend the original length of the LVDT-sensor since the concrete contracts and the shrinkage of the
dilatometer will minimize the length of the LVDT-sensor.
Calibration of the instruments When the concrete specimen expands the value registered length of the LVDT-sensor is prescribed as
and when concrete shrinks the registered length is prescribed as
.
In calibration of the instruments (dilatometer, LVDT-sensor) their movement is unknown. If ,
Eq. 14 and 15 can be rewritten as:
where and , since the tip will be shorter during expansion and longer during
shrinkage.
The instruments were calibrated with an aluminum rod, where the movement of the aluminum is
known and the expected value of the can be calculated. When temperature is increasing the
expected value of the aluminum rod was and when temperature decreases the
expected value of the aluminum rod was . Thus is the values from the logging negative
during expansion and positive during shrinkage, which the expected values and measured values
must be recalculated to be comparable. The measured values were multiplied with -1.
Calculation of the can be summarized in the Eq. 16:
It is the difference of the registered value and the expected values that is interesting, but Excel
cannot do calculations of subtraction during expansion and addition during shrinkage, which
was set as an absolute value.
The movement of the dilatometer and the LVDT-sensor is unknown, where a value was
calculated instead:

Thermal properties of concrete with different Swedish aggregate materials
74
Thermal expansion coefficient of concrete The registered value by the LVDT-sensor was lower than the actual values of the concrete specimen,
because of the instruments also expands/shrinks, where the instruments disguise the length
difference of the concrete specimen with its own change in length. The length difference for
concrete is:
Once again it is important to know which sign the different parameters have. The registered length
is still negative when temperature increases and positive when temperature decreases.

Thermal properties of concrete with different Swedish aggregate materials
75
Appendix F – Appearance of the concretes The concrete cubes were cut into halves for measurement of the thermal properties and below
appearances of them can be found.
Figure 45. Vikan
Figure 44. Forserum.
Figure 47. Enhörna. Figure 46. Tjälamark.
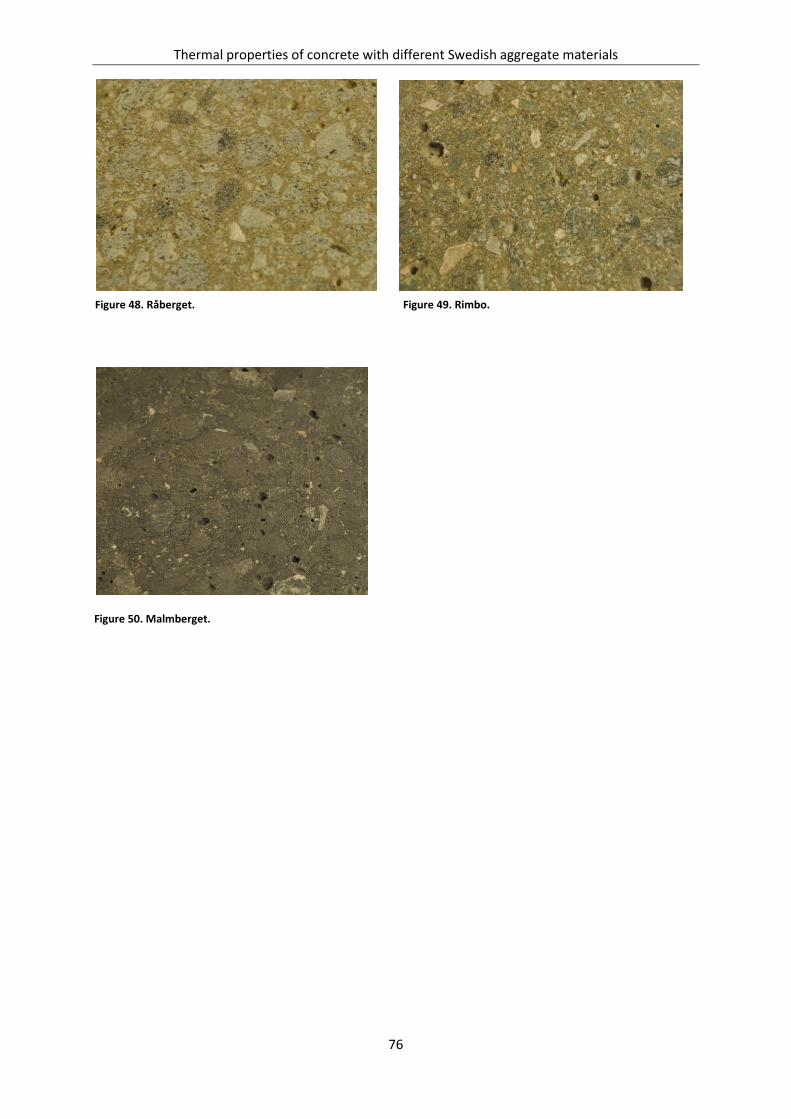
Thermal properties of concrete with different Swedish aggregate materials
76
Figure 50. Malmberget.
Figure 49. Rimbo. Figure 48. Råberget.