july 2009 mechanistic flexible pavement overlay design program
TRANSCRIPT

1. Report No. FHWA/LA.08/454 2. Government Accession No. 3. Recipient's
Catalog No.
4. Title and Subtitle Mechanistic Flexible Pavement Overlay Design Program
5. Report Date
July 2009 6. Performing Organization Code
7. Author(s)
Zhong Wu, Ph.D., P.E., and Kevin Gaspard, P.E.
8. Performing Organization Report No.
454
9. Performing Organization Name and Address Department of Civil and Environmental Engineering Louisiana State University Baton Rouge, LA 70803
10. Work Unit No.
11. Contract or Grant No. LTRC Project Number: 06-2P State Project Number: 736-99-1369
12. Sponsoring Agency Name and Address
Louisiana Department of Transportation and Development P.O. Box 94245 Baton Rouge, LA 70804-9245
13. Type of Report and Period Covered
Final Report March 2006-December 2008 14. Sponsoring Agency Code LTRC
15. Supplementary Notes
Conducted in Cooperation with the U.S. Department of Transportation, Federal Highway Administration
16. Abstract The current Louisiana Department of Transportation and Development (LADOTD) overlay thickness design method follows the “Component Analysis” procedure provided in the 1993 AASHTO pavement design guide. Since neither field nor laboratory tests are required by LADOTD for this method, pavement engineers usually rely on a pre-assigned parish-based typical subgrade resilient modulus value and a set of assumed layer coefficients for determining the effective structural number of an existing pavement in an overlay thickness design. This may lead to significant errors in the designed overlay thickness results because the selected design parameters do not represent actual field conditions. The objective of this research was to develop an overlay design method/procedure that is used for a structural overlay thickness design of flexible pavement in Louisiana based upon (1) in-situ pavement conditions and (2) non destructive test (NDT) methods, specifically the falling weight deflectometer (FWD) and/or Dynaflect. Fifteen overlay rehabilitation projects were selected for this study. These projects were strategically located throughout Louisiana with different traffic levels. At each selected project, NDT deflection tests including the falling weight deflectometer (FWD) and Dynaflect were performed at a 0.1-mile interval. For some of the selected projects, detailed condition survey data including cracking, rut depth, International Roughness Index (IRI), mid-depth temperature, and pavement thickness was also collected. Six NDT-based overlay design methods were selected and used in the overlay thickness design analysis. Results indicated that the 1993 AASHTO NDT procedure generally over estimated the effective structural number for the existing asphalt pavements in Louisiana, which would result in an under-designed overlay thickness. On the other hand, other NDT methods (i.e., ROADHOG, Asphalt Institute MS-17, Louisiana 1980 Deflection method, ELMOD5, and EVERPAVE) were found inapplicable to the Louisiana pavement conditions because all those methods rely on locally calibrated design parameters. Since further calibration of those NDT methods requires additional testing resources and is also considered very time-consuming, a modified FWD deflection based overlay thickness design method was proposed in this study. This method, based upon the Louisiana Pavement Evaluation Chart (a relation between Dynaflect deflections and the structural number of existing pavements) and in-situ subgrade modulus, is deemed able to directly represent Louisiana’s pavement condition. The cost/benefit analysis revealed that, as compared to the current LADOTD component analysis method, the proposed NDT-based overlay design method would potentially save millions of dollars in the flexible pavement rehabilitation in Louisiana. Therefore, before full implementation of the new Mechanistic-Empirical (M-E) pavement design method, the proposed NDT-based overlay design method is recommended for implementation by LADOTD. 17. Key Words Overlay design, non destructive testing, FWD, Dynaflect
18. Distribution Statement Unrestricted. This document is available through the National Technical Information Service, Springfield, VA 21161.
19. Security Classif. (of this report) Unclassified
20. Security Classif. (of this page) Unclassified
21. No. of Pages
92 22. Price
TECHNICAL REPORT STANDARD PAGE

Project Review Committee Each research project will have an advisory committee appointed by the LTRC Director. The
Project Review Committee is responsible for assisting the LTRC Administrator or Manager
in the development of acceptable research problem statements, requests for proposals, review
of research proposals, oversight of approved research projects, and implementation of
findings.
LTRC appreciates the dedication of the following Project Review Committee Members
in guiding this research study to fruition.
LTRC Administrator Zhongjie “Doc” Zhang, Ph.D., P.E.
Pavement and Geotechnical Research Administrator
Members
Phil Arena, FHWA
Jeff Lambert, DOTD
Mark Chenevert, DOTD
Said Ismail, DOTD
Steve Draughon, DOTD
Don Weathers, Asphalt Paving Association
Sam Cooper, LTRC
Directorate Implementation Sponsor William Temple, P.E.
DOTD Chief Engineer

Mechanistic Flexible Pavement Overlay Design Program
by
Zhong Wu, Ph.D., P.E.
Kevin Gaspard, P.E.
Louisiana Transportation Research Center
4101 Gourrier Avenue
Baton Rouge, LA 70808
LTRC Project No. 06-2P
State Project No. 736-99-1369
conducted for
Louisiana Department of Transportation and Development
Louisiana Transportation Research Center
The contents of this report reflect the views of the authors, who are responsible for the facts and
the accuracy of the data presented herein. The contents do not necessarily reflect the official
views or policies of the Louisiana Department of Transportation and Development, or the
Louisiana Transportation Research Center. This report does not constitute a standard,
specification, or regulation.
July 2009


iii
ABSTRACT
The current Louisiana Department of Transportation and Development (LADOTD)
overlay thickness design method follows the “Component Analysis” procedure provided
in the 1993 AASHTO pavement design guide. Since neither field nor laboratory tests are
required by LADOTD for this method, pavement engineers usually rely on a pre-assigned
parish-based typical subgrade resilient modulus value and a set of assumed layer
coefficients for determining the effective structural number of an existing pavement in an
overlay thickness design. This may lead to significant errors in the designed overlay
thickness results because the selected design parameters do not represent actual field
conditions.
The objective of this research was to develop an overlay design method/procedure that is
used for a structural overlay thickness design of flexible pavement in Louisiana based
upon (1) in-situ pavement conditions and (2) non destructive test (NDT) methods,
specifically the falling weight deflectometer (FWD) and/or Dynaflect.
Fifteen overlay rehabilitation projects were selected for this study. These projects were
strategically located throughout Louisiana with different traffic levels. At each selected
project, NDT deflection tests including the falling weight deflectometer (FWD) and
Dynaflect were performed at a 0.1-mile interval. For some of the selected projects,
detailed condition survey data including cracking, rut depth, International Roughness
Index (IRI), mid-depth temperature, and pavement thickness was also collected. Six
NDT-based overlay design methods were selected and used in the overlay thickness
design analysis. Results indicated that the 1993 AASHTO NDT procedure generally over
estimated the effective structural number for the existing asphalt pavements in Louisiana,
which would result in an under-designed overlay thickness. On the other hand, other
NDT methods (i.e., ROADHOG, Asphalt Institute MS-17, Louisiana 1980 Deflection
method, ELMOD5, and EVERPAVE) were found inapplicable to the Louisiana
pavement conditions because all those methods rely on locally calibrated design
parameters. Since further calibration of those NDT methods requires additional testing
resources and is also considered very time-consuming, a modified FWD deflection based
overlay thickness design method was proposed in this study. This method, based upon the
Louisiana Pavement Evaluation Chart (a relation between Dynaflect deflections and the
structural number of existing pavements) and in-situ subgrade modulus, is deemed able to
directly represent Louisiana’s pavement condition. The cost/benefit analysis revealed
that, as compared to the current LADOTD component analysis method, the proposed

iv
NDT-based overlay design method would potentially save millions of dollars in the
flexible pavement rehabilitation in Louisiana. Therefore, before full implementation of
the new Mechanistic-Empirical (M-E) pavement design method, the proposed NDT-
based overlay design method is recommended for implementation by LADOTD.

v
ACKNOWLEDGMENTS
This study was supported by the Louisiana Transportation Research Center (LTRC) and the
Louisiana Department of Transportation and Development (LADOTD). The authors would
like to express thanks to all those who provided valuable help in this study. Specifically, the
authors would like to acknowledge the assistance of Gary Keel, Mitchell Terrell, Shawn
Elisar, and Glen Gore in field data collection; Jeff Lambert in the current overlay design
method; Xingwei Chen in data analysis; and Pallavi Bhandari in helping develop a Visual
Basic computer program.


vii
IMPLEMENTATION STATEMENT
A structural overlay thickness design procedure based on non-destructive surface deflection
testing (i.e., FWD) will be implemented as a result of this research study. One primary
advantage of the developed design procedure over the current LADOTD overlay design
method lies in the elimination of reliance on human judgment in the estimation of an existing
pavement structural number and subgrade modulus, and thus, the overlay thickness design
can be based on in-situ pavement conditions. This procedure will be used routinely for the
thickness design of structural asphalt concrete overlays for flexible pavements in Louisiana.
Since this procedure uses a similar set of design inputs [e.g., design reliability and traffic
loading in term of equivalent single axel loading (ESAL)] as the current LADOTD overlay
design method, implementation is deemed to be simple and straight-forward, only requiring
testing with the FWD device. In addition, the design procedure developed in this study has
been also implemented into a Windows-based computer program for fast processing of FWD
data and the selection of an appropriate overlay thickness.


ix
TABLE OF CONTENTS ABSTRACT ............................................................................................................................. iii
ACKNOWLEDGMENTS .........................................................................................................v
IMPLEMENTATION STATEMENT .................................................................................... vii
TABLE OF CONTENTS ......................................................................................................... ix
LIST OF TABLES ................................................................................................................... xi
LIST OF FIGURES ............................................................................................................... xiii
INTRODUCTION .....................................................................................................................1
Background ................................................................................................................... 2 Effective Thickness Approach ...........................................................................2 Deflection Approach ..........................................................................................4 Mechanistic-Empirical (M-E) Approach ...........................................................8
E-Mail Survey ............................................................................................................. 10 OBJECTIVE ............................................................................................................................13
SCOPE .....................................................................................................................................15
METHODOLOGY ..................................................................................................................17
General Information on Projects ................................................................................. 17 Field Testing ............................................................................................................... 20
Dynaflect ..........................................................................................................20 FWD ..............................................................................................................21 Condition Survey .............................................................................................21
Overlay Thickness Design Methods ........................................................................... 22 Current LADOTD Method ..............................................................................22 The 1993 AASHTO NDT-Based Procedure ....................................................22 Asphalt Institute MS-17 Deflection Method ....................................................23 Louisiana 1980 Method ...................................................................................24 ROADHOG Method ........................................................................................24 ELMOD 5 Method ...........................................................................................24 EVERPAVE Method .......................................................................................25 MEPDG Version 1.0 Method ..........................................................................25
DISCUSSION OF RESULTS..................................................................................................27
Analysis of Phase I Projects ........................................................................................ 27 Condition Survey Results ................................................................................27 NDT Results.....................................................................................................29 Overlay Thickness Design Results ..................................................................33 Summary on Overlay Design Methods ............................................................37
Development of NDT-Based Overlay Design Method for Louisiana Flexible Pavements ....................................................................................................... 38 Evaluation of Existing Pavement Condition ....................................................38 Proposed NDT-Based Overlay Design Method ...............................................44 Overlay Design using the Proposed NDT Method ..........................................46 Overlay Design Using MEPDG Version 1.0 ...................................................48

x
Analysis of Phase II Projects ...................................................................................... 49 Cost/Benefit Analysis ......................................................................................49 Cost of Performing FWD Tests .......................................................................53
CONCLUSIONS......................................................................................................................55
RECOMMENDATIONS .........................................................................................................57
ACRONYMS, ABBREVIATIONS, & SYMBOLS ................................................................59
REFERENCES ........................................................................................................................61
APPENDIX ..............................................................................................................................65
LTRC Overlay Design Program User’s Manual ......................................................... 65

xi
LIST OF TABLES Table 1 Tolerable deflections (× 0.001 inches) [11] ................................................................ 7
Table 2 State DOT overlay design methods using NDTs ....................................................... 11
Table 3 General project information ....................................................................................... 19
Table 4 Existing pavement structure and LADOTD overlay thickness design ...................... 20
Table 5.Summary of condition survey on rutting and surface roughness ............................... 29
Table 6 FWD deflection variations ......................................................................................... 31
Table 7 SN variations ............................................................................................................. 33
Table 8 Overlay design results using the effective thickness methods ................................... 34
Table 9 Overlay design results using AI deflection method ................................................... 35
Table 10 Overlay design results using Louisiana 1980 deflection method ............................ 35
Table 11 Overlay design results using ELMOD 5 method ..................................................... 36
Table 12 Overlay design results using EVERPAVE 5 method .............................................. 36
Table 13 Overlay design results using 1993 AASHTO and proposed methods ..................... 47
Table 14 Results of overlay thickness verification using MEPDG software .......................... 48
Table 15 Comparison of initial construction costs in I-12 ...................................................... 50
Table 16 Analysis of cost saving for over-designed projects ................................................. 51
Table 17 Life cycle cost analysis of cost saving for under-designed projects ........................ 52

xiii
LIST OF FIGURES
Figure 1 EVERPAVE flow chart [20] .................................................................................... 10
Figure 2 Location of pavement projects ................................................................................. 18
Figure 3 Non-destructive testing devices ................................................................................ 21
Figure 4 LTRC multi-functional digital highway data vehicle ............................................... 22
Figure 5 Project cracking information survey ........................................................................ 28
Figure 6 Comparison of Phase-I FWD deflections ................................................................. 30
Figure 7 Dynaflect estimated SN values for Phase-I projects ................................................ 32
Figure 8 Summary of overlay thickness design results .......................................................... 37
Figure 9 Surface maximum deflection under 9,000-lb. FWD load ........................................ 39
Figure 10 Lousiana pavement evaluation chart [1] ................................................................ 40
Figure 11 Effective structural number obtained from FWD and Dynaflect ........................... 41
Figure 12 Evaluation of Dynaflect deflections ....................................................................... 42
Figure 13 Theoretical evidence of Louisiana pavement evaluation chart .............................. 43
Figure 14 Correlation between SNFWD and SNDynaflect ............................................................ 46
Figure 15 Overlay design results of proposed method and current LADOTD method .......... 47
Figure 16 Comparison of overlay thickness ........................................................................... 49
Figure 17 Performance of under-designed overlay thickness on LA74 ................................. 51

INTRODUCTION
Prior to 1960, most agencies relied heavily on engineering judgment and experience in
determining the required overlay thickness for a roadway. Since 1960, the use of
nondestructive deflection testing (NDT) devices such as the Benkelman beam, Dynaflect,
and falling weight deflectometer (FWD) began to gain wide acceptance due to their ease of
operation and the ability to assess the in situ structural integrity. After 1980, more rational
methods based on NDT deflection measurements to evaluate the in-situ pavement conditions
have gradually developed [1-6].
The current LADOTD overlay thickness design follows the “Component Analysis” method
provided in the 1993 AASHTO pavement design guide [7]. Neither field NDT nor
laboratory fundamental property tests are required with this method. LADOTD pavement
engineers often rely on a pre-assigned, parish-based, typical subgrade resilient modulus value
(Mr) and a set of table-assumed layer coefficients in determining, respectively, the subgrade
strength and the effective structural number (SN) of an existing pavement in an overlay
thickness design. Obviously, this procedure will potentially lead to errors in the determined
overlay thickness since none of the design values represent actual field conditions. An over
estimated Mr or SN value will result in an under-designed overlay thickness (i.e., overlay
thickness value smaller than required) that may cause an early failure of a pavement under
loading. On the other hand, an underestimated Mr or SN value will produce a over-designed
overlay thickness, which should also be avoided by a highway agency because it would
allocate more funding into one project that is not necessary.
NDT-deflection based overlay design procedures are generally more accurate than the
current method because they capture the actual field pavement conditions. A newly
developed Mechanistic-Empirical Pavement Design Guide (MEPDG) includes a design
module specifically for the determination of an asphalt overlay thickness, in which in-situ
NDT results can be incorporated [8]. However, implementing the MEPDG in Louisiana will
require a local calibration and verification on those empirical models used in the software.
Both the local calibration and verification processes involve a time consuming data collection
task that may take several years to complete. Due to an urgent need of a NDT-based overlay
design method and a time constraint on implementation of MEPDG, the main propose of this
study was to come up a NDT-based overlay thickness design method/procedure for the
rehabilitation of flexible pavements in Louisiana. An extensive literature search was
conducted to identify NDT-based overlay design procedures currently being utilized by other
agencies. Regarding the new mechanistic-empirical design method, this procedure will
2
require several years to implement in Louisiana and is currently under review by a LADOTD
committee [8].
Background
There are three design methods commonly used in practice to estimate the required overlay
thickness: the effective thickness approach, the deflection approach, and the mechanistic-
empirical approach. In general, NDT deflection testing can be incorporated into any of those
design methods.
Effective Thickness Approach
The basic concept is that the required thickness of asphalt concrete overlay is the difference
between the thickness required for a new full-depth pavement and the effective thickness of
the existing pavement. The procedure assumes that as the pavement deteriorates, it behaves
as if it were an increasingly thinner pavement because its effective thickness accounts less
and less for the expended portion of its total life [14]. Because the effective thickness is
based on the type, condition, and thickness of each component layer, this method is also
called the component analysis procedure [14].
The AASHTO (originally AASHO) pavement design guide was first published as an interim
guide in 1972. Updates to the guide were subsequently published in 1986 and 1993; a new
mechanistic-based design guide is currently being reviewed and implemented by different
state agencies [8]. The AASHTO design procedure is based on the results of the AASHO
Road Test that was conducted in 1959-1960 in Ottawa, Illinois. Approximately 1.2 million
axle load repetitions were applied to specially designed test tracks in the largest road test ever
conducted [22].
The 1993 AASHTO overlay thickness design method utilizes the effective thickness
approach [7]. In the AASHTO method, the required thickness of the asphalt concrete (AC)
overlay is a function of the structural capacity required to meet future traffic demands and the
structural capacity of the existing pavement, as determined by the following basic design
equation:
OL
efff
OL
OLOL a
SNSN
a
SNh
(1)
where, hOL = required thickness of asphalt overlay, SNOL = required structural number of
asphalt overlay, aOL = structural layer coefficient of asphalt overlay, SNf = structural number
3
required to carry future traffic, and SNeff = total effective structural number of the existing
pavement prior to overlay.
The effective design subgrade resilient modulus is required to determine the required
structural number (SNf) through the AASHTO flexible pavement design equation [7].
AASHTO provides three methods from which the design Mr values are obtained: (a)
laboratory testing, (b) backcalculation from NDT measurements, and (c) approximate
estimation using available soil information and relationships developed from a resilient
modulus study. Similarly, AASHTO suggests three methods to determine the effective
structural number (SNeff): (a) NDT method, (b) condition survey method, and (c) remaining
life method. With calculated SNf and SNeff values, the thickness of overlay can be then
determined from equation (1).
The Asphalt Institute MS-17 provided two separate flexible pavement overlay design
methods, the effective thickness method and a deflection-based procedure [9]. The effective
thickness method in MS-17 estimates the overlay thickness as the difference between the
thickness required for a new full-depth asphalt pavement and the effective thickness of the
existing pavement as provided in the following equation:
i
n
iinenOL hChhhh
1
(2)
where, hOL = required asphalt overlay thickness, hn = thickness of new full-depth asphalt
pavement; he = effective thickness of the existing pavement, hi = thickness of the ith layer of
the existing pavement, Ci = conversion factor associated with the ith existing layer, and n =
number of layers in the existing pavement structure.
The conversion factors (Ci) used in equation (2) are empirically estimated based on the
existing pavement distress condition and material classification. Additional detailed
descriptions of conversion factors for different classifications of paving materials can be
found in Table 8-1 of the MS-17 manual [9]. As stated in the MS-17 manual, “These
convention factors, encompassing most paving materials, are in some degree subjective.”
Therefore, although the AI effective thickness method is simple to apply, the estimated
overlay thickness is very sensitive to the used design conversion factors of each component
layer.
Some state DOTs, e.g., Alabama, Virginia, South Carolina, and Maryland, have developed a
spreadsheet based program using the FWD in their flexible pavement overlay design
4
procedures based on either the 1993 AASHTO overlay design or Asphalt Institute MS-17
procedures.
The current overlay design method used by LADOTD follows the 1993 AASHTO overlay
design method, where the design Mr value is derived from an empirically based parish
modulus map, and the SNeff is from the condition survey method. Therefore, no laboratory or
field NDT tests are required by the current LADOTD overlay thickness design procedure.
Deflection Approach
The deflection approach method is based on the empirical relationship between pavement
deflection and overlay thickness. The basic concept of this method is that larger pavement
surface deflections imply a weaker pavement and subgrade, thus, require thicker overlays.
The overlay must be thick enough to reduce the deflection to a tolerable amount. Usually
only the maximum deflection directly under the load is used [5].
The second method in Asphalt Institute MS-17 manual is based on deflection measurements
taken using the Benkelman beam test [9]. With the projected overlay traffic, the temperature
adjustment factor, and the critical period adjustment factor, the design overlay thickness is
obtained from a design chart using overlay traffic and a design deflection indicator called the
representative rebound deflection. The basic issues related to the MS-17 deflection based
overlay thickness design procedure are summarized as follows [9], [14]:
Deflection Data Measurement: At least 10 deflection measurements should be made for
each analysis or a minimum of 20 measurements per mile. Pavement temperatures are
measured at the time of deflection measurements so deflections can be adjusted to a
standard temperature of 70oF.
Representative Rebound Deflection: When deflection tests on the analysis section are
completed, the recorded pavement rebound deflections are used to determine a
representative rebound deflection (RRD):
))()(2( CFsrrd (3)
where, δrrd = the representative rebound deflection, = the mean deflection, s = the
standard deviation, F = the temperature adjustment factor, and C = the critical period
adjustment factor.
Deflection After Overlay (δd): The overlaid pavement is considered a two-layer system
with the HMA overlay as layer 1 and the existing pavement as layer 2. The representative
5
rebound deflection is used to determine the modulus of layer 2 using the following
equation:
rrd
qaE
5.1
2 (4)
where, q = the contact pressure and a is the radius of the wheel load on dual tires.
The design rebound deflection after overlay (δd) is determined as follows:
5.023/1
2
11
1
2
5.02
1
2
8.018.0115.1
E
E
a
h
E
E
a
h
E
qad (5)
where, h1 = the thickness of the overlay, and E1 = the modulus of the overlay.
Overlay Thickness Design: It is assumed that there is a unique relationship between
design rebound deflection and the allowable ESAL as represented by:
2438.0)(0363.1 ESALd (6)
Given the ESAL for the overlay, δd can be determined from equation (6). Given the
representative rebound deflection δrrd, E2 can be obtained from equation (4). With δd and
E2 known and values of q, a and E1 assumed, the thickness of overlay h1 can be computed
from equation (5).
Similarly, the California Department of Transportation (Caltrans) currently also uses the
deflection approach in their overlay designs [12]. An overlay design using dense-graded
asphalt concrete (DGAC) mixtures in the Caltrans Flexible Pavement Rehabilitation
Manual is presented as follows [12]:
Field Deflection Measurement: For all lanes considered for rehabilitation, measure
deflection at 80-m intervals in the outside wheel path to obtain 21 deflection
measurements per 1.6 lane-kilometer (1 mile). Any NDT tests can be used in the
deflection measurement. However, the deflection values measured from devices other
than California Deflectometer must be converted to equivalent California Deflectometer
values used in the overlay design. The California Deflectometer is a Benkelman Beam
based rolling wheel device. Therefore, a relationship between the California
Deflectometer deflections and deflections obtained using other NDT devices (e.g.,
Dynaflect, and FWD) must be constructed before overlay deflection testing.

6
The 80th percentile of the California Deflectometer equivalent deflections in the analysis
unit are then computed based on the following equations:
n
Dx i ,
1
)( 2
n
xDs i
sxD 84.080 (7)
where,
x = mean deflection for a test section,
D80 = 80th percentile of the deflections at the surface for a test section in inches,
S = standard deviation of all deflections for a tee section,
Di = an individual deflection measurements in the test section, and
n = number of measurements in the test section.
Tolerable Deflection at the Surface (TDS): The TDS is determined from the Tolerable
Deflection Table as shown in Table 1 with the design Traffic Index (TI) and either the
thickness of the existing asphalt concrete pavement or the type of base data. The design
TI can be determined using the following equation:
TI=9.0 (ESAL/106)0.119 (8)
Calculate the Percent Reduction in Deflection (PRD) at the surface:
)100(80
80
D
TDSDPRD
(9)
Note that the Caltrans method uses a relative strength indicator known as the gravel
equivalent (GE). The GE has been related to two main design parameters, namely, traffic
loads (NT in ESALs) and materials strength as given by equation (10) [12].
)100(0032.0 RTIGE
119.0
6100.9
TN
TI (10)
Determine the increase in GE required reducing D80 to the TDS, utilizing the calculated PRD
and a design table. It is the amount of gravel that will provide sufficient strength to reduce
the deflections to the tolerable level. To determine the overlay thickness, the following
conditions are considered:
a) For structural adequacy:
Overlay = GE/Gf
where, Gf = the gravel factor. For a dense-graded asphalt concrete overlay over an

7
existing AC pavement, use a Gf of 1.9 regardless of thickness and TI.
b) For reflective cracking:
Overlay = a minimum of half the existing AC thickness
c) For ride quality:
Overlay = a minimum of 0.25 ft. placed in two layers
Table 1
Tolerable deflections (× 0.001 in.) [11]
8
In 1980, LADOTD developed a Dynaflect deflection-based approach for asphalt concrete
overlay thickness selection [1]. The primary failure criteria selected in the Dynaflect
deflection-based approach was the development of fatigue cracking. In the approach,
tolerable deflection-traffic load relationships and deflection attenuation properties of
asphaltic concrete were developed. A suite of overlay thickness design charts was
constructed for overlays of flexible, rigid, and composite pavements, representing the
subgrade support conditions and properties of materials used in Louisiana. The design
maximum deflection input used in the overlay thickness design charts require correction for
the effect of temperature (using the Southgate method) and seasonal subgrade moisture
variation (using a Pavement Evaluation Chart developed in the study) [21]. This approach is
theoretically sound and easy for implementation. However, due to implementing the 1993
AASHTO pavement design method, the developed Louisiana Dynaflect deflection-based
overlay design procedure has never been implemented into a routine use.
Mechanistic-Empirical (M-E) Approach
The M-E approach for the overlay design is similar to the design of new pavements. It
requires that pavement materials be described by their stiffness and strength at different times
of the year. This in turn requires that the stiffness and strength be measured directly in the
field or laboratory or that correlation be used to estimate the stiffness and strength from other
tests. The design procedures are based on the assumption that a pavement can be modeled as
multi-layered elastic or visco-elastic structure on an elastic or visco-elastic foundation. It
requires the determination of critical stress, strain, or deflection in the pavement by some
mechanistic methods and the prediction of resulting damages by some empirical failure
criteria. First, the pavement existing life must be evaluated. Based on pavement condition or
remaining life, the overlay thickness is then determined so damages in either the existing
pavement or new overlay will be within allowable limits. Several state departments of
transportation (DOTs) have developed their own flexible overlay design models using the M-
E approach, including Arizona DOT, Oregon DOT, Washington DOT, and Minnesota DOT
[17], [20], [24], and [25]. These procedures apply the M-E overlay design method using
NDT data and develop models that are calibrated to meet the local conditions of each state
highway system.
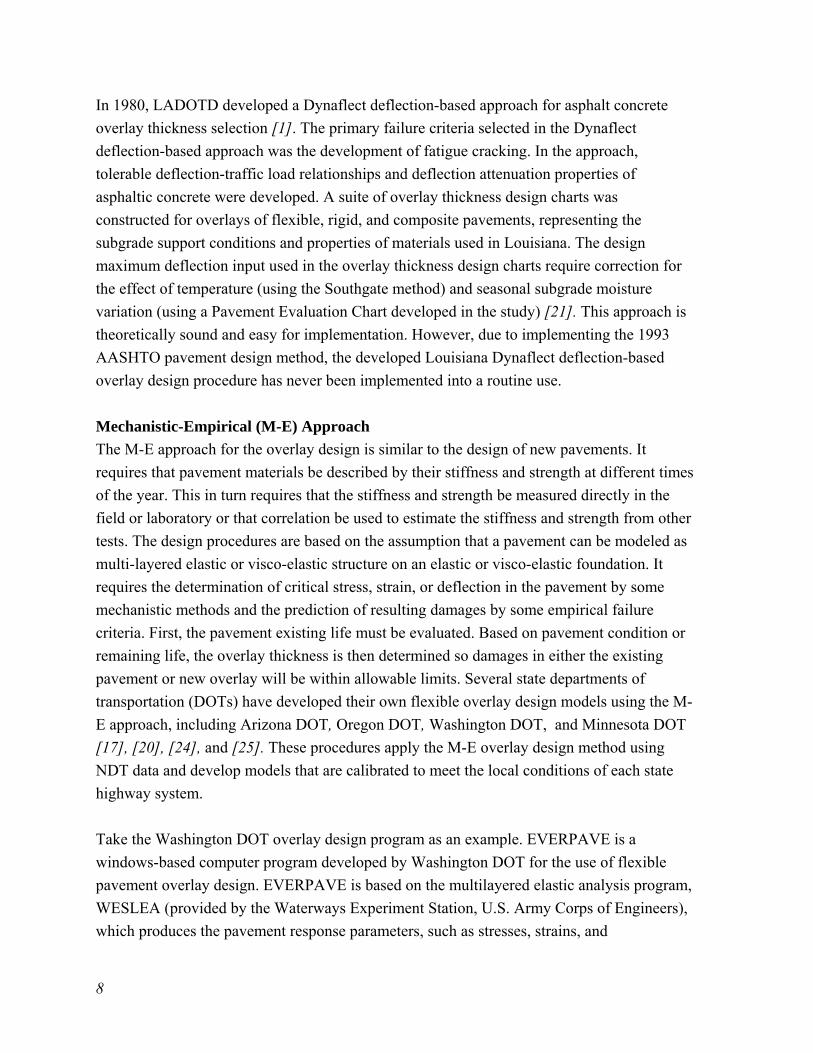
Take the Washington DOT overlay design program as an example. EVERPAVE is a
windows-based computer program developed by Washington DOT for the use of flexible
pavement overlay design. EVERPAVE is based on the multilayered elastic analysis program,
WESLEA (provided by the Waterways Experiment Station, U.S. Army Corps of Engineers),
which produces the pavement response parameters, such as stresses, strains, and
9
deformations in the pavement system. The layer moduli required in EVERPAVE are
backcalculated from FWD deflection basins using EVERCALC, FWD backcalculation
software developed by Washington DOT [20]. The determination of the overlay thickness is
based on the required thickness to bring the damage levels to an acceptable point under a
design traffic condition. Figure 1 shows the design flowchart in the EVERPAVE program.
The damage levels are based on two primary distress types–fatigue cracking and rutting–that
are the most common criteria for mechanistic analysis-based overlay design.
For fatigue cracking, the Monismith-Finn laboratory fatigue model is selected [20]:
)log(854.0)log(291.382.14log actf EN (11)
where, Nf = loads to failure, εt = initial tensile strain, and
Eac = stiffness of AC layer.
For rutting, the Chevron equation is selected:
4843.418 )(10077.1log VfN (12)
where, Nf represents the loads that cause a 0.75-in. rut, and
εV is the vertical compressive stress on the top of subgrade.
The process of the EVERPAVE overlay design procedure is accomplished in the following
sequences, as also shown in Figure 1 [20].
1. Read input data, including initial overlay thickness. The initial overlay thickness is
necessary to prove a starting point from overlay thickness determination. The initial
overlay must be greater than zero.
2. Adjust pavement materials for seasonal moduli variations.
3. Analyze the pavement system and determine the two failure criteria parameters.
4. Compute allowable repetitions to failure, compare the design traffic with the
allowable load repetitions, and calculate the damage ratio for each season.
5. Repeat Steps 2, 3, and 4 for four seasons.
6. Compute the sum of the seasonal damage ratio.
7. If the sum of the damage ratio is less than or equal to one, produce the overlay
thickness. Otherwise, increase the overlay thickness and repeat Steps 1 through 7
until the sum of the damage ratio becomes less than or equal to one.
10
Figure 1
EVERPAVE flow chart [20]
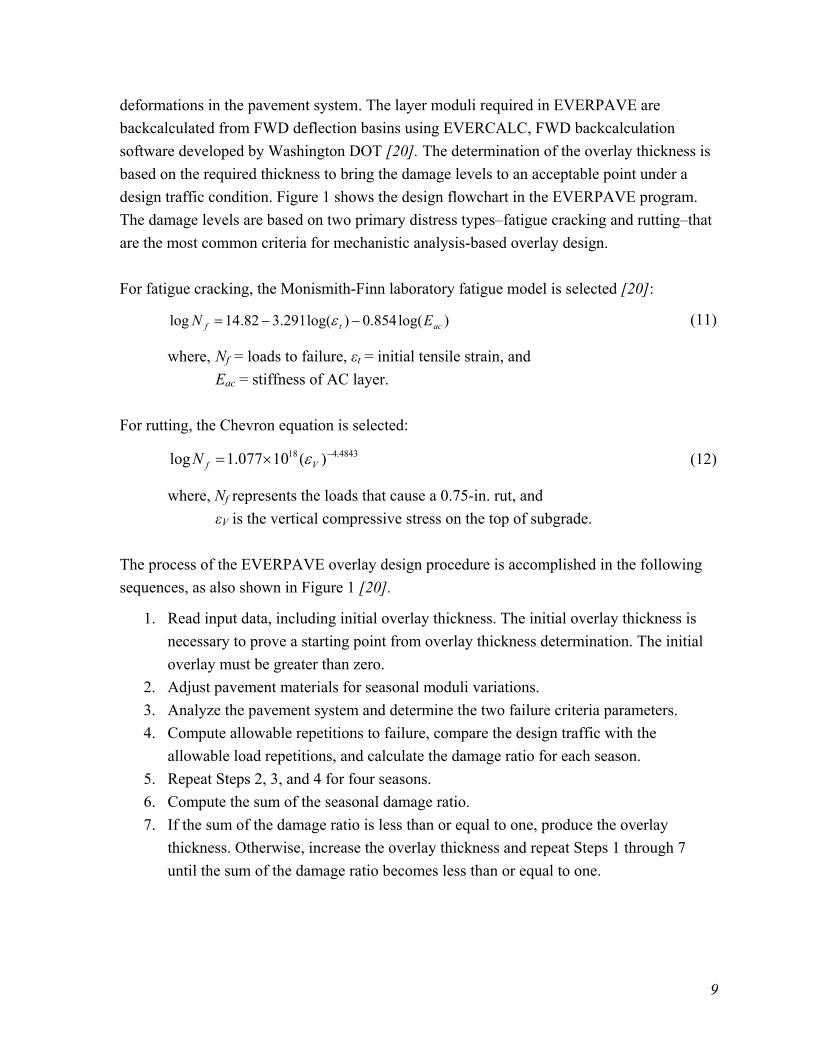
E-Mail Survey
During the literature review, an email-based survey was conducted among the state DOTs to
find out whether NDT methods are being incorporated into flexible pavement overlay
thickness design procedures. The email survey basically asked whether FWD or Dynaflect
testing is being incorporated into their overlay thickness design process, and if the answer
was “yes,” then the second question asked what specific software (or spreadsheet-based
design procedure) they are using for the overlay design. Ten state DOTs who currently use
the NDT in their overlay design programs have responded to this survey. Table 2 presents the
survey results together with several literature search results.
11
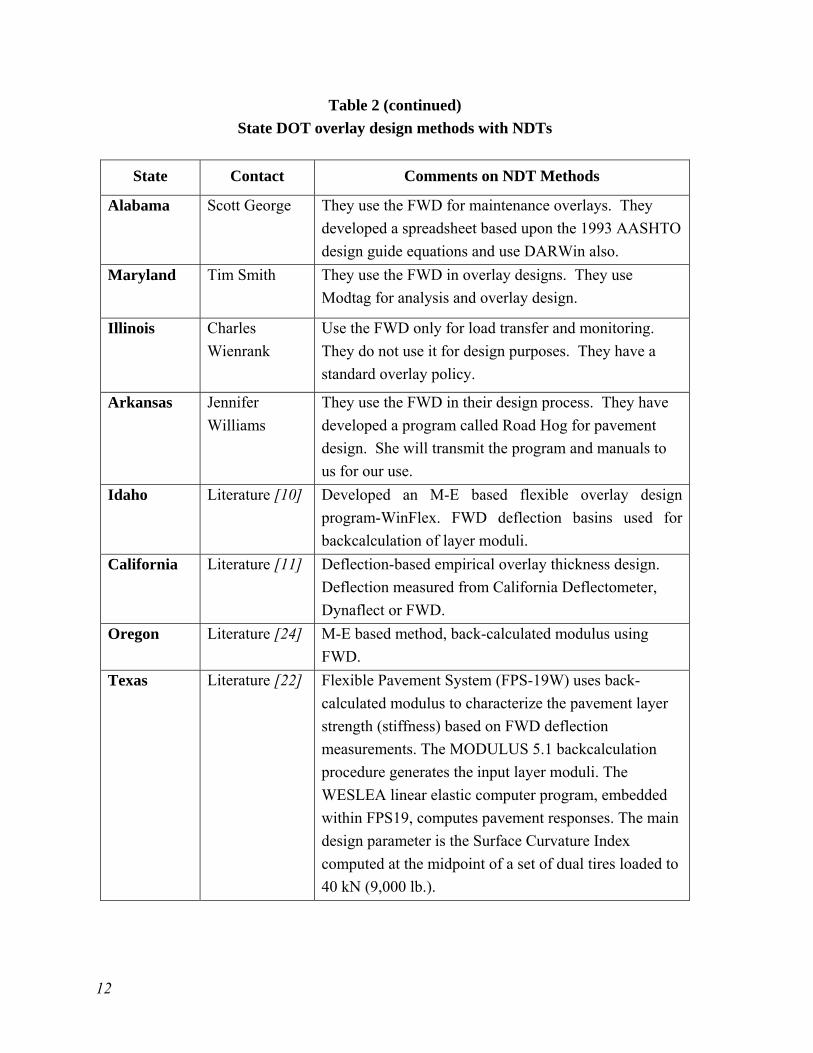
Table 2
State DOT overlay design methods with NDTs
State Contact Comments on NDT Methods
Mississippi James Watkins The FWD is used for overlay designs. The design
module from Dynatest’s ELMOD 5 software is used for
overlay designs.
Washington Linda Pierce They use the FWD in overlay design. They have their
own software package called EVERSERIES. It does
backcalculations, stress analysis, and overlay design.
The package is free as well as the manual.
Minnesota Dave
VanDeusen
They use the FWD in overlay design. They have their
own software package called MNPAVE. The package
and manual are free.
Virginia Trenton Clark They use the FWD in design. They have developed a
software package called ModTAG and use it for
analysis and design. The software is available for free
but technical support must be paid for.
North
Carolina
Judith Corley-
Lay
They use the FWD in design. Their design is based on
deflections and use asphalt institutes deflection criteria
for overlays. They developed a spreadsheet to perform
related computations.
South
Carolina
Andy Johnson They use the FWD in overlay design. They developed
a spreadsheet based on the AASHTO two-layer design
and the asphalt institute.
12
Table 2 (continued)
State DOT overlay design methods with NDTs
State Contact Comments on NDT Methods
Alabama Scott George They use the FWD for maintenance overlays. They
developed a spreadsheet based upon the 1993 AASHTO
design guide equations and use DARWin also.
Maryland Tim Smith They use the FWD in overlay designs. They use
Modtag for analysis and overlay design.
Illinois Charles
Wienrank
Use the FWD only for load transfer and monitoring.
They do not use it for design purposes. They have a
standard overlay policy.
Arkansas Jennifer
Williams
They use the FWD in their design process. They have
developed a program called Road Hog for pavement
design. She will transmit the program and manuals to
us for our use.
Idaho Literature [10] Developed an M-E based flexible overlay design
program-WinFlex. FWD deflection basins used for
backcalculation of layer moduli.
California Literature [11] Deflection-based empirical overlay thickness design.
Deflection measured from California Deflectometer,
Dynaflect or FWD.
Oregon Literature [24] M-E based method, back-calculated modulus using
FWD.
Texas Literature [22] Flexible Pavement System (FPS-19W) uses back-
calculated modulus to characterize the pavement layer
strength (stiffness) based on FWD deflection
measurements. The MODULUS 5.1 backcalculation
procedure generates the input layer moduli. The
WESLEA linear elastic computer program, embedded
within FPS19, computes pavement responses. The main
design parameter is the Surface Curvature Index
computed at the midpoint of a set of dual tires loaded to
40 kN (9,000 lb.).

13
OBJECTIVE
The main objective of this study was to establish a flexible pavement overlay thickness
design method based upon (1) Louisiana in-situ pavement conditions and (2) NDT methods,
specifically the FWD and/or Dynaflect.


15
SCOPE
Fifteen overlay rehabilitation projects were selected for this study. These projects were
strategically located throughout Louisiana with different traffic levels. At each selected
project, NDT deflection tests including the FWD and Dynaflect were performed at a 0.1-mile
interval and on both traffic directions. Six NDT-based overlay design methods–Louisiana
1980 Dynaflect procedure, Asphalt Institute (AI) MS-17, Arkansas ROADHOG, ELMOD 5,
EVERPAVE, and the 1993 AASHTO NDT procedure–were selected and used in the overlay
thickness design analysis. In addition, the newly developed MEPDG software was also
included in the analysis. It should be noted that local calibration of those selected NDT
overlay design methods were not in the scope of this research study. Instead, a modified
NDT overlay design method was developed in this study based upon testing and research
conducted on Louisiana highways. Finally, the economic benefits of using the developed
NDT overlay design method were quantified through the construction and life-cycle cost
analyses.

17
METHODOLOGY
To achieve the objective of this research study, the following general methodology and
analysis procedures were performed:
Selected 15 overlay rehabilitation projects from LADOTD’s overlay letting list based
on different subgrade types and three (low-, medium-, and high-volume) traffic levels.
Performed NDT (FWD and Dynaflect) deflection tests on each of selected projects.
Conducted a comprehensive literature review and an email survey among other state
DOTs to find out whether NDT testing is being incorporated into their overlay
thickness design procedures. Six NDT-based overlay design procedures (or software)
were identified, which include: (1) Kinchen-Temple Dynaflect deflection-based
procedure or Louisiana 1980 Deflection-based procedure, (2) EVERPAVE by
Washington DOT, (3) Arkansas ROADHOG, (4) Asphalt Institute MS-17 deflection
approach, (5) the 1993 AASHTO pavement design guide NDT procedure, and (6)
ELMOD 5 by Dynatest [1], [20], [25], [9], [7], and [26].
Performed overlay thickness design for the four Phase I rehabilitation projects based
upon (1) the NDT deflections and (2) the six selected NDT overlay design procedures.
Analyzed the overlay thickness results and compared to those obtained from the
LADOTD component analysis method as well as those obtained from the newly
developed MEPDG software.
Evaluated the Dynaflect-deflection based Louisiana Pavement Evaluation Chart and
developed a FWD deflection-based overlay thickness design procedure for flexible
pavement overlay thickness design in Louisiana.
Developed a Visual Basic computer program for automating the proposed FWD
based overlay design procedure.
Performed cost-benefit analyses on the Phase II rehabilitation projects.
Prepared a final report that documented and summarized the study results.
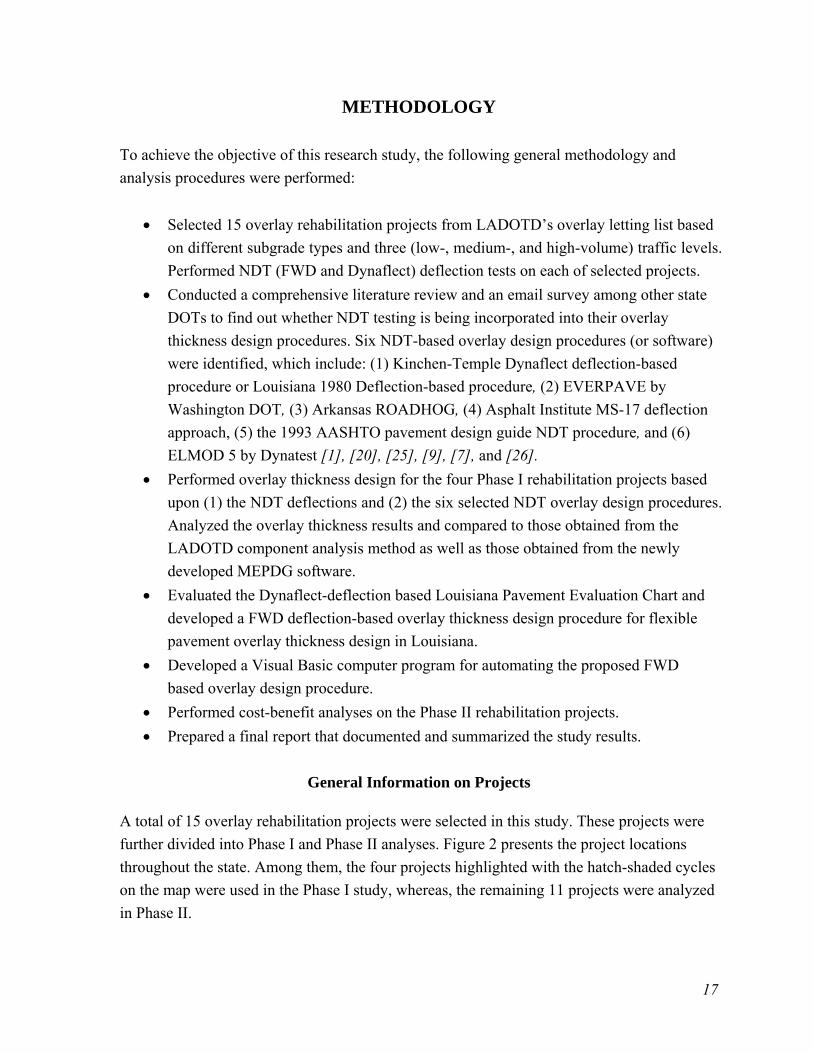
General Information on Projects
A total of 15 overlay rehabilitation projects were selected in this study. These projects were
further divided into Phase I and Phase II analyses. Figure 2 presents the project locations
throughout the state. Among them, the four projects highlighted with the hatch-shaded cycles
on the map were used in the Phase I study, whereas, the remaining 11 projects were analyzed
in Phase II.
18
Figure 2
Location of pavement projects
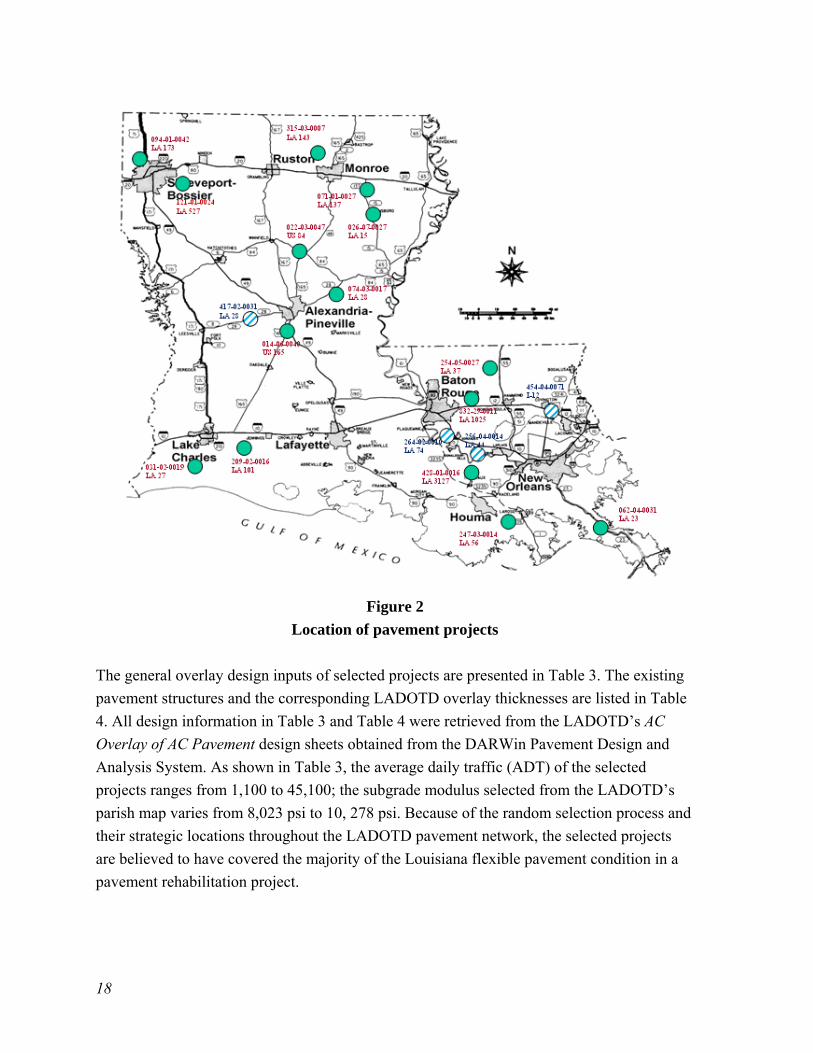
The general overlay design inputs of selected projects are presented in Table 3. The existing
pavement structures and the corresponding LADOTD overlay thicknesses are listed in Table
4. All design information in Table 3 and Table 4 were retrieved from the LADOTD’s AC
Overlay of AC Pavement design sheets obtained from the DARWin Pavement Design and
Analysis System. As shown in Table 3, the average daily traffic (ADT) of the selected
projects ranges from 1,100 to 45,100; the subgrade modulus selected from the LADOTD’s
parish map varies from 8,023 psi to 10, 278 psi. Because of the random selection process and
their strategic locations throughout the LADOTD pavement network, the selected projects
are believed to have covered the majority of the Louisiana flexible pavement condition in a
pavement rehabilitation project.

19
Table 3
General project information
Route Road Length Design Design
Name Classification Parish (miles) ADT EASL Mr (psi)*
Phase I
LA 28 Rural Arterial Rapides 6.7 5,700 1,512,993 9,916
LA 44 Rural Collector St. James 7.54 3,300 353,256 8,023
LA 74 Rural Collector Ascension 3.35 7,700 818,073 8,400
I-12 Urban Interstate St. Tammany 10.541 45,100 2,4399,600 9,200
Phase II
LA 173 Rural Collector Caddo 6.416 2,609 363,342 10,278
LA 527 Rural Collector Bossier 3.788 1,892 192,296 8,797
LA 143 Rural Collector Union 6.85 4,626 681,672 10,278
LA 137 Rural Collector Richland 7.11 3,450 845,472 9,549
LA 27 Rural Collector Cameron 16.96 2,400 239,210 9,176
LA 101 Rural Collector Jeff Davis 3.115 2,600 267,529 8,413
US 84 Rural Arterial Winn 8.004 1,100 232,221 9,200
US 165 Rural Arterial Rapides 7.311 8,400 1,344,639 9,916
LA 15 Rural Collector Franklin 5.46 10,100 1,379,645 9,916
LA 28-2 Rural Arterial Lasalle 7.293 3,300 794,116 9,200
LA
3127 Rural Collector St. James 5.58 1,313 295,705 8,023
LA 37 Rural Collector St. Helena 5.44 2,300 496,816 9,549
LA
1025 Rural Collector Livingston 6.26 4,900 297,029 9,500
Note: * Design Mr values are the subgrade moduli obtained from the Louisiana Parish Mr map.
All roadways have two lanes except that I-12 is a four-lane divided roadway.
20
Table 4
Existing pavement structure and LADOTD overlay thickness design
Route # Length
(miles)
Surface Base Subgrade
Type Type Thickness Type Thickness
LA 28 6.7 AC 5" Soil Cement Varying Types
LA 44 7.54 AC 9" HVY CL 18" Varying Types
LA 74 3.35 AC 6" Soil Cement 4" Varying Types
I-12 10.541 AC 15" Soil Cement 9" Varying Types
LA 173 6.416 AC 3.5" Soil Cement 7" Varying Types
LA 527 3.788 AC 6.5" Soil Cement 6" Varying Types
LA 143 6.85 AC 4.5" Soil Cement 8" Varying Types
LA 137 7.11 AC 7.18" AB 8" Varying Types
LA 27 16.96 AC 8" Shelly SDY LM 9" STY CL
LA 101 3.115 AC 8.5" Shelly SDY LM 4" STY CL
US 84 8.004 AC 4" Soil Cement 8" Varying Types
US 165 7.311 AC 10" Soil Cement 8.5" Varying Types
LA 15 5.46 AC 8.75" Soil Cement 7.5" Varying Types
LA 28-2 7.293 AC 8.5" Soil Cement 8" Varying Types
LA 3127 5.58 AC 6" Soil Cement 8" Sand
LA 37 5.44 AC 4" Soil Cement 9" Varying Types
LA 1025 6.26 AC 4" Soil Cement 8" Varying Types
Field Testing
Field testing of this study included FWD and Dynaflect deflection tests. Both tests were
performed at the same selected locations with FWD tests conducted first. In each project, a 3-
mile long section was chosen for field testing. The deflection tests were conducted bi-
directionally at 0.1-mile intervals on the right wheel path of the selected lane or the outside
lane of a four-lane highway. Pavement mid-depth temperatures were measured during
deflections tests. It is noted that in-situ pavement thicknesses of Phase I projects were also
measured during testing. In addition, existing pavement conditions were surveyed using a
LTRC multi-functional digital highway data vehicle. Each of the testing devices used are
briefly described below.
Dynaflect
Dynaflect is a trailer mounted device (Figure 3a), which induces a dynamic load on the
pavement and measures the resulting deflections by five geophones, spaced under the trailer
at 1-ft. (0.305-m) intervals from the application of the load. The pavement is subjected to
21
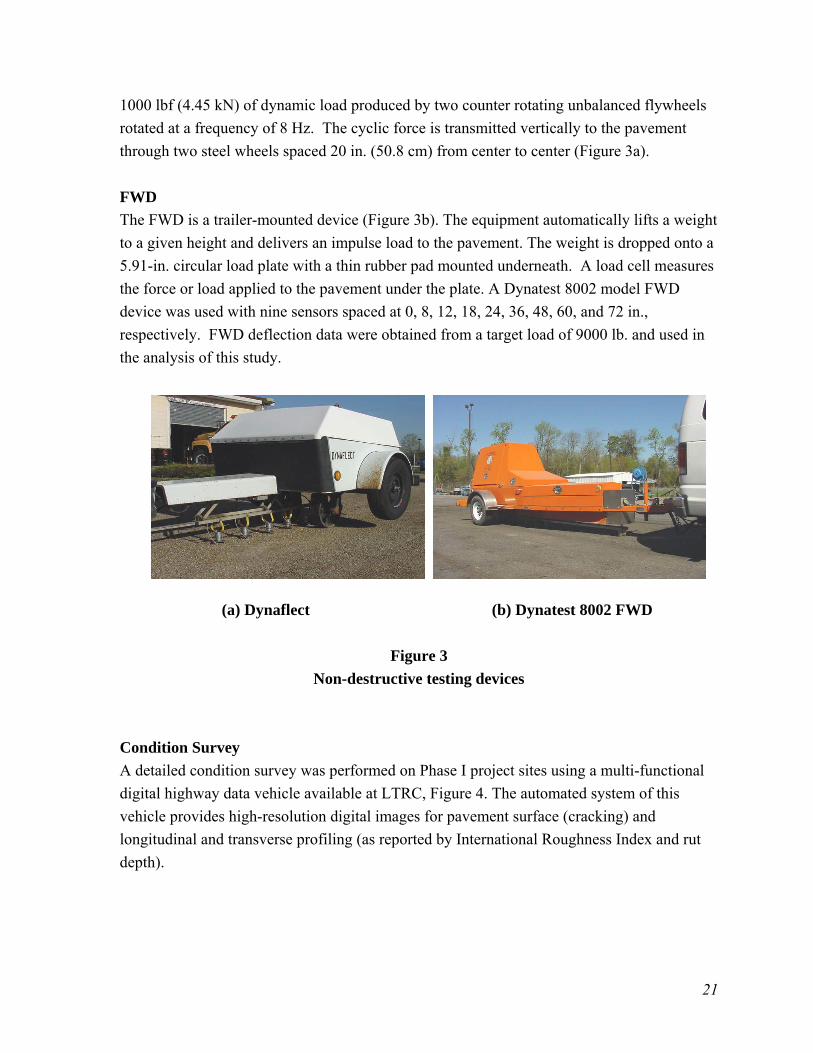
1000 lbf (4.45 kN) of dynamic load produced by two counter rotating unbalanced flywheels
rotated at a frequency of 8 Hz. The cyclic force is transmitted vertically to the pavement
through two steel wheels spaced 20 in. (50.8 cm) from center to center (Figure 3a).
FWD
The FWD is a trailer-mounted device (Figure 3b). The equipment automatically lifts a weight
to a given height and delivers an impulse load to the pavement. The weight is dropped onto a
5.91-in. circular load plate with a thin rubber pad mounted underneath. A load cell measures
the force or load applied to the pavement under the plate. A Dynatest 8002 model FWD
device was used with nine sensors spaced at 0, 8, 12, 18, 24, 36, 48, 60, and 72 in.,
respectively. FWD deflection data were obtained from a target load of 9000 lb. and used in
the analysis of this study.
nnnnk
(a) Dynaflect
(b) Dynatest 8002 FWD
Figure 3
Non-destructive testing devices
Condition Survey
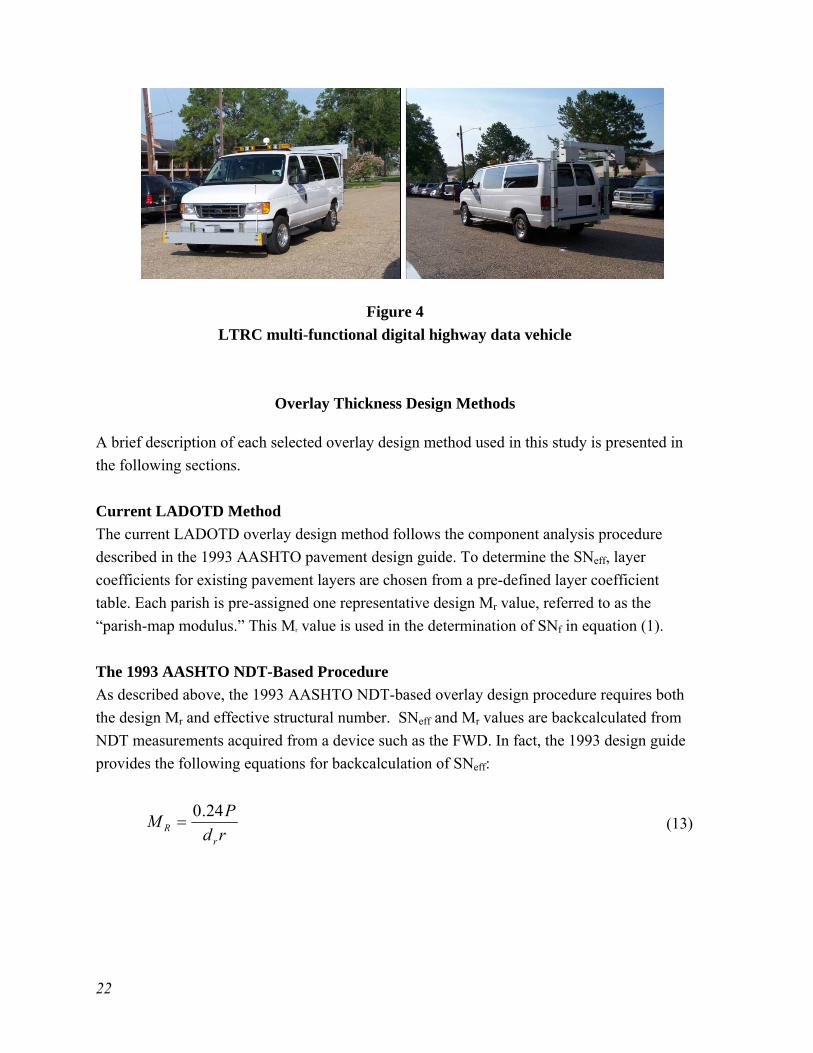
A detailed condition survey was performed on Phase I project sites using a multi-functional
digital highway data vehicle available at LTRC, Figure 4. The automated system of this
vehicle provides high-resolution digital images for pavement surface (cracking) and
longitudinal and transverse profiling (as reported by International Roughness Index and rut
depth).
22
Figure 4
LTRC multi-functional digital highway data vehicle
Overlay Thickness Design Methods
A brief description of each selected overlay design method used in this study is presented in
the following sections.
Current LADOTD Method
The current LADOTD overlay design method follows the component analysis procedure
described in the 1993 AASHTO pavement design guide. To determine the SNeff, layer
coefficients for existing pavement layers are chosen from a pre-defined layer coefficient
table. Each parish is pre-assigned one representative design Mr value, referred to as the
“parish-map modulus.” This Mr value is used in the determination of SNf in equation (1).
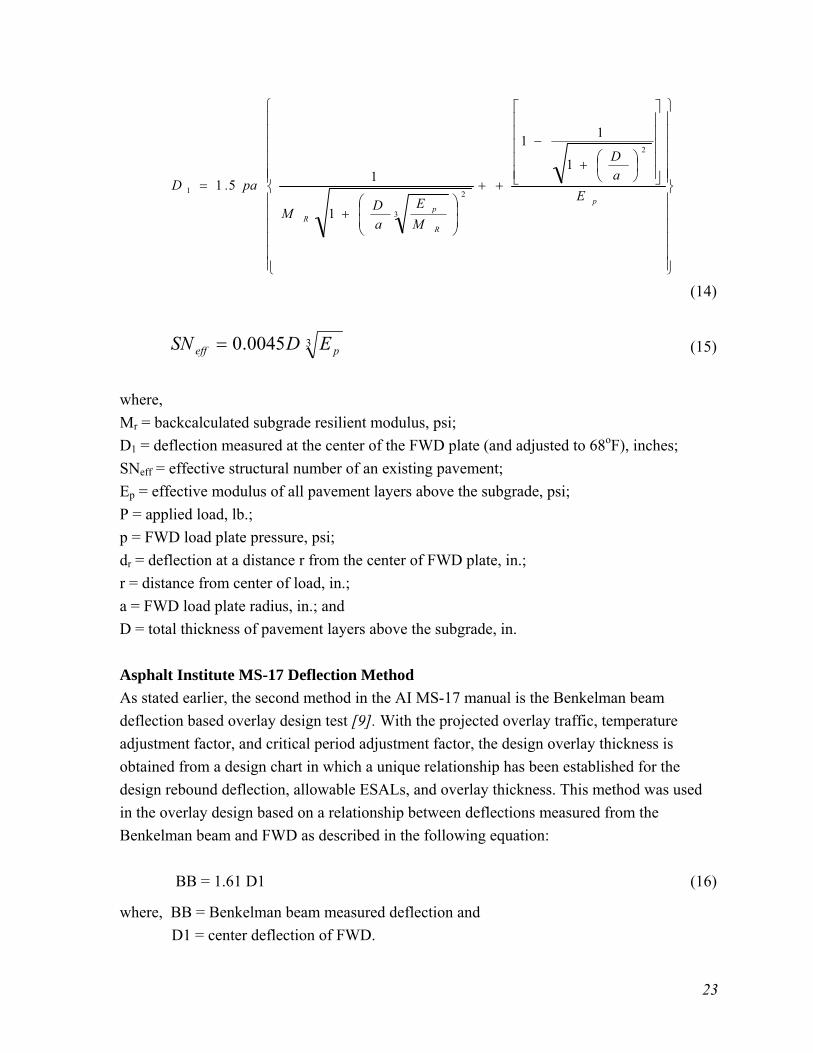
The 1993 AASHTO NDT-Based Procedure
As described above, the 1993 AASHTO NDT-based overlay design procedure requires both
the design Mr and effective structural number. SNeff and Mr values are backcalculated from
NDT measurements acquired from a device such as the FWD. In fact, the 1993 design guide
provides the following equations for backcalculation of SNeff:
rd
PM
rR
24.0 (13)
23
p
R
pR
E
aD
M
E
aD
M
pa.D
2
2
3
1
1
11
1
151
(14)
30045.0 peff EDSN (15)
where,
Mr = backcalculated subgrade resilient modulus, psi;
D1 = deflection measured at the center of the FWD plate (and adjusted to 68oF), inches;
SNeff = effective structural number of an existing pavement;
Ep = effective modulus of all pavement layers above the subgrade, psi;
P = applied load, lb.;
p = FWD load plate pressure, psi;
dr = deflection at a distance r from the center of FWD plate, in.;
r = distance from center of load, in.;
a = FWD load plate radius, in.; and
D = total thickness of pavement layers above the subgrade, in.
Asphalt Institute MS-17 Deflection Method
As stated earlier, the second method in the AI MS-17 manual is the Benkelman beam
deflection based overlay design test [9]. With the projected overlay traffic, temperature
adjustment factor, and critical period adjustment factor, the design overlay thickness is
obtained from a design chart in which a unique relationship has been established for the
design rebound deflection, allowable ESALs, and overlay thickness. This method was used
in the overlay design based on a relationship between deflections measured from the
Benkelman beam and FWD as described in the following equation:
BB = 1.61 D1 (16)
where, BB = Benkelman beam measured deflection and
D1 = center deflection of FWD.

24
Louisiana 1980 Method
In 1980 LADOTD developed a deflection based overlay thickness design guide using
Dynaflect measured deflections [1]. Due to the implementation of the AASHTO pavement
design procedure at that time, it was not implemented for routine use. In the guide, a suite of
overlay thickness design charts was constructed for overlays of flexible, rigid, and composite
pavements, representing the subgrade support conditions and properties of materials used in
Louisiana. The overlay designs are performed by entering charts with the projected traffic
load (ESALs), subgrade strength, and temperature-corrected Dynaflect deflections. Selected
deflection levels are chosen based on the highway classification and deflection percentiles.
For more details refer to Kinchen and Temple’s final report [1].
ROADHOG Method
ROADHOG is an Excel spreadsheet-based overlay design computer program. It was
developed based on research results conducted for the Arkansas State Highway and
Transportation Department (AHTD) [25]. The ROADHOG procedure is generally similar to
the 1993 AASHTO NDT-based procedure except that the SNeff in ROADHOG is determined
based on a relationship between SNeff and Delta-D [equation (17)]. Delta-D represents the
difference between the FWD surface deflection measured directly under the load (the
maximum deflection) and the deflection measured at a distance from the applied load equal
to the thickness of the pavement structure [25].
SNeff = 0.3206 (Delta-D) -0.42 x (pavement thickness) 0.8175 (17)
ELMOD 5 Method
ELMOD is an acronym for Evaluation of Layer Moduli and Overlay Design [26]. The
ELMOD 5 program is a mechanistic-empirical based approach for overlay thickness design.
It includes a FWD backcalculation module based on the Odemark-Boussinesq method. In an
overlay design using ELMOD 5, the required inputs include the predicted future traffic,
backcalculated layer moduli, seasonal variation parameters, and design criteria for both
fatigue cracking and permanent deformation. Due to lack of data, ELMOD default values
were selected for both seasonal variation parameters and the design criteria. Basically, the
default design criteria in ELMOD 5 are the fatigue cracking and rutting equations used in the
Asphalt Institute MS-1 design manual [26]. The overall overlay thickness for each testing
point was determined with the appropriate reliability for the project.

25
EVERPAVE Method
As introduced earlier, EVERPAVE is a flexible pavement overlay design computer program
based on the mechanistic-empirical analysis procedure. EVERSTRS is a multilayered elastic
analysis program. EVERCALC is a FWD modulus backcalculation software. All three
computer programs were developed by the Washington State Department of Transportation
(WSDOT). EVERPAVE uses EVERSTRS (for critical pavement responses under load),
EVERCALC (for layer moduli), and certain pavement failure criteria to estimate AC overlay
thicknesses [20]. The determination of the overlay thickness is based on the required
thickness to bring the damage levels to an acceptable level under a design traffic condition.
The traffic input is in terms of 18,000 lb. ESALs. The damage levels are based on two
primary distress types, fatigue cracking and rutting, which are the most common criteria for
mechanistic analysis based overlay design. The EVERPAVE program is also capable of
considering seasonal variations and stress sensitivity of the pavement materials.
MEPDG Version 1.0 Method
The NCHRP Project 1-37A was sponsored by the AASHTO Joint Task Force on Pavements,
NCHRP, and FHWA to develop an M-E-based pavement design guide. MEPDG was
completed and released to the public for review and evaluation in 2004. A formal review of
MEPDG was conducted by the NCHRP under Project 1-40A. Project 1-40D resulted in
Version 1.0 of the MEPDG software and an updated design guide document. Version 1.0 of
the software was submitted to the NCHRP, FHWA, and AASHTO in April 2007 for further
consideration as an AASHTO provisional standard and efforts are currently underway on
Version 2.0 of the software [29].
The MEPDG software Version 1.0 was used to analyze the overlay design results determined
by the proposed and current LADOTD methods in this study [29]. The MEPDG software
needs sophisticate inputs and most are still not available in Louisiana. In this study, the
default Level 3 input values suggested by the MEPDG software were selected in the analysis,
except traffic, climate, pavement thickness, and modulus values for the base and subgrade
materials (those modulus values were backcalculated from FWD deflections). Additional
details of MEPDG can be referred to elsewhere [29].

27
DISCUSSION OF RESULTS
Analysis of Phase I Projects
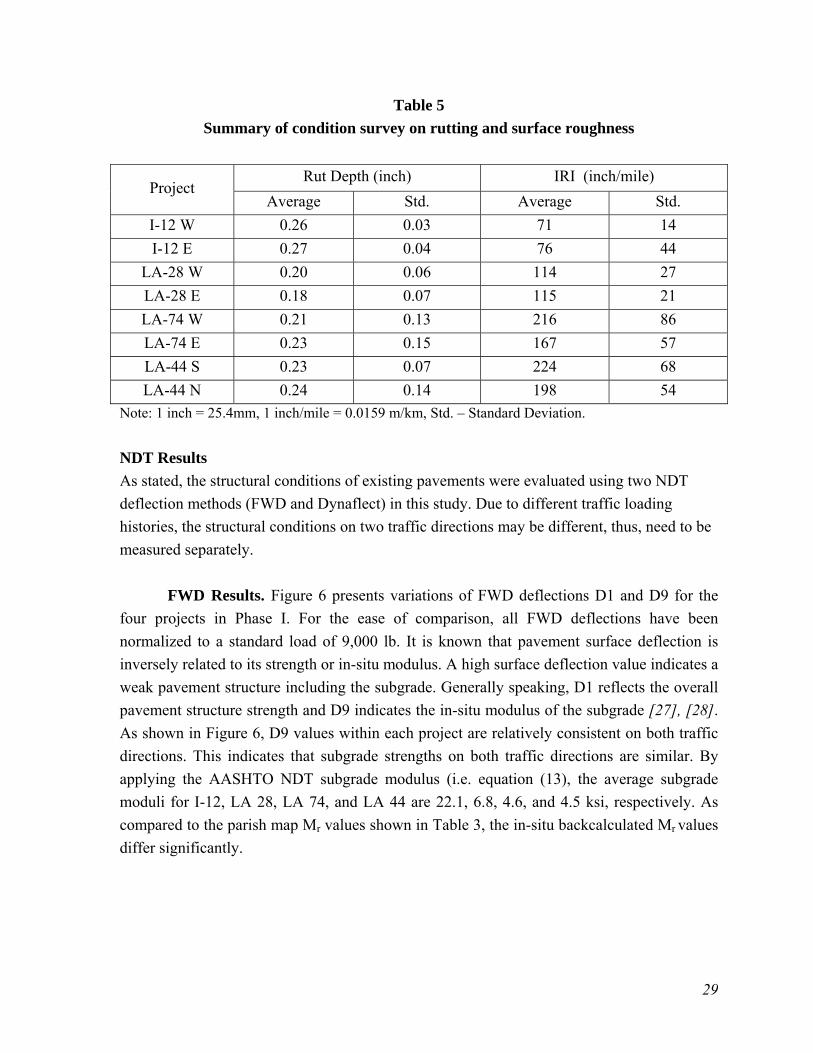
Condition Survey Results
The condition survey data, obtained from the LTRC Multi-functional Digital Highway Data
Vehicle, included digital cracking image, rut depth, and IRI. Note that each project was
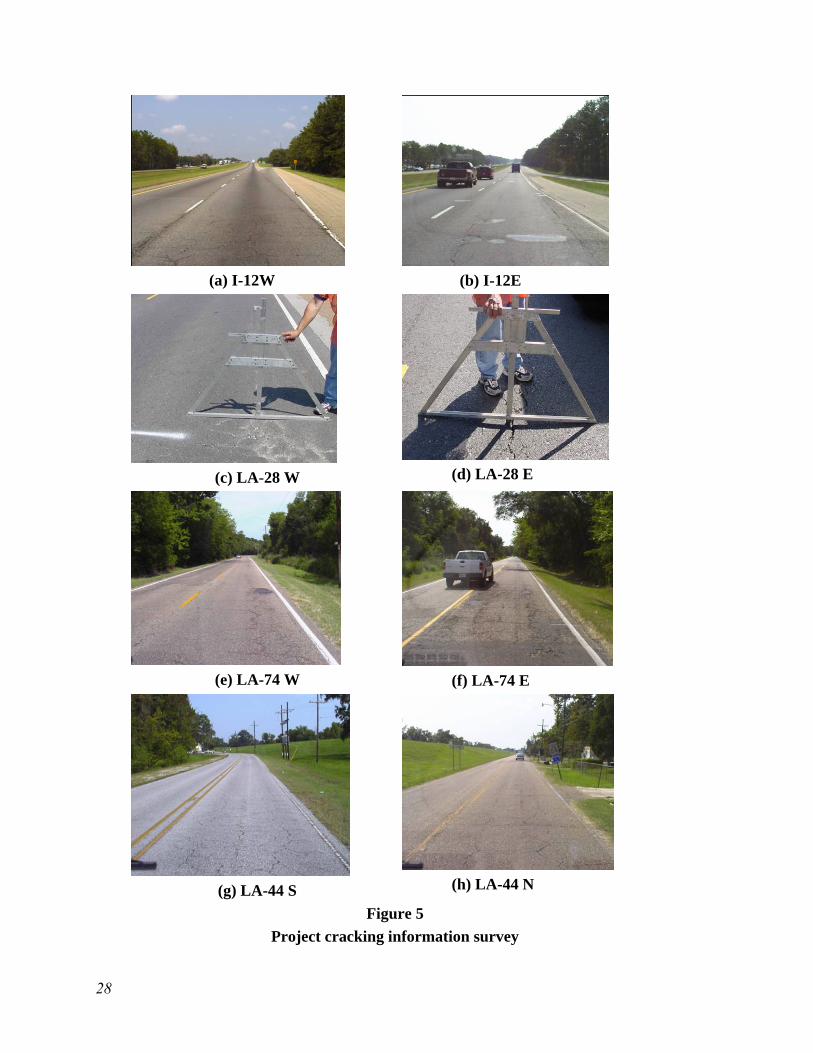
considered as two sub-projects in the analysis for different traffic directions. Figure 5 shows
a typical field cracking photo for each project considered. The measured rut depth and IRI
values are summarized in Table 5.
As shown in Figures 5e-h, cracks observed on existing pavements of LA 74 and LA 44 were
fairly severe and continuously distributed throughout the entire project length. Most of the
cracks were severe fatigue cracks of aged asphalt pavement. On the other hand, Figures 5a-d
indicate that cracks on both I-12 and LA 28 were scattered, isolated, and less severe in most
locations. As shown in Table 5, the average rut depths for all projects were found less
significant, and ranged from 0.18 to 0.27 inch. However, the standard deviations of rut
depths for LA-74W, LA-74E, and LA-44N were found significantly high (ranged from 0.13
to 0.15 inch), much greater than variations for other projects. This suggests that some severe
localized rutting areas exist on those pavements. As expected, the combination of surface
distresses directly reflects the surface riding characteristics of the existing pavements. From
Table 5, the average IRI values of I-12W and I-12E were about 70 inch/mile, followed by
LA28 two sections of about 110 inch/mile. The average IRI values for the other four
pavement sections (in LA74 and LA44) were more than 150 inch/mile, indicating a very
rough riding surface.
Condition survey results mainly provide an indication of functional conditions for the
existing pavements, not the pavement structural characteristics. Based on the existing
pavement functional conditions, functional overlays for existing pavements of LA 74 and LA
44 are apparently most urgently needed, followed by LA 28, and then I-12. However, in a
pavement structural overlay design, the pavement structural characteristics (the strength) of
an existing pavement must be pre-estimated, which in this study will be determined using the
NDT deflection methods as outlined in the following section.
28
(a) I-12W
(b) I-12E
(c) LA-28 W
(d) LA-28 E
(e) LA-74 W
(f) LA-74 E
(g) LA-44 S
(h) LA-44 N
Figure 5
Project cracking information survey
29
Table 5
Summary of condition survey on rutting and surface roughness
Project Rut Depth (inch) IRI (inch/mile)
Average Std. Average Std.
I-12 W 0.26 0.03 71 14
I-12 E 0.27 0.04 76 44
LA-28 W 0.20 0.06 114 27
LA-28 E 0.18 0.07 115 21
LA-74 W 0.21 0.13 216 86
LA-74 E 0.23 0.15 167 57
LA-44 S 0.23 0.07 224 68
LA-44 N 0.24 0.14 198 54
Note: 1 inch = 25.4mm, 1 inch/mile = 0.0159 m/km, Std. – Standard Deviation.
NDT Results
As stated, the structural conditions of existing pavements were evaluated using two NDT
deflection methods (FWD and Dynaflect) in this study. Due to different traffic loading
histories, the structural conditions on two traffic directions may be different, thus, need to be
measured separately.
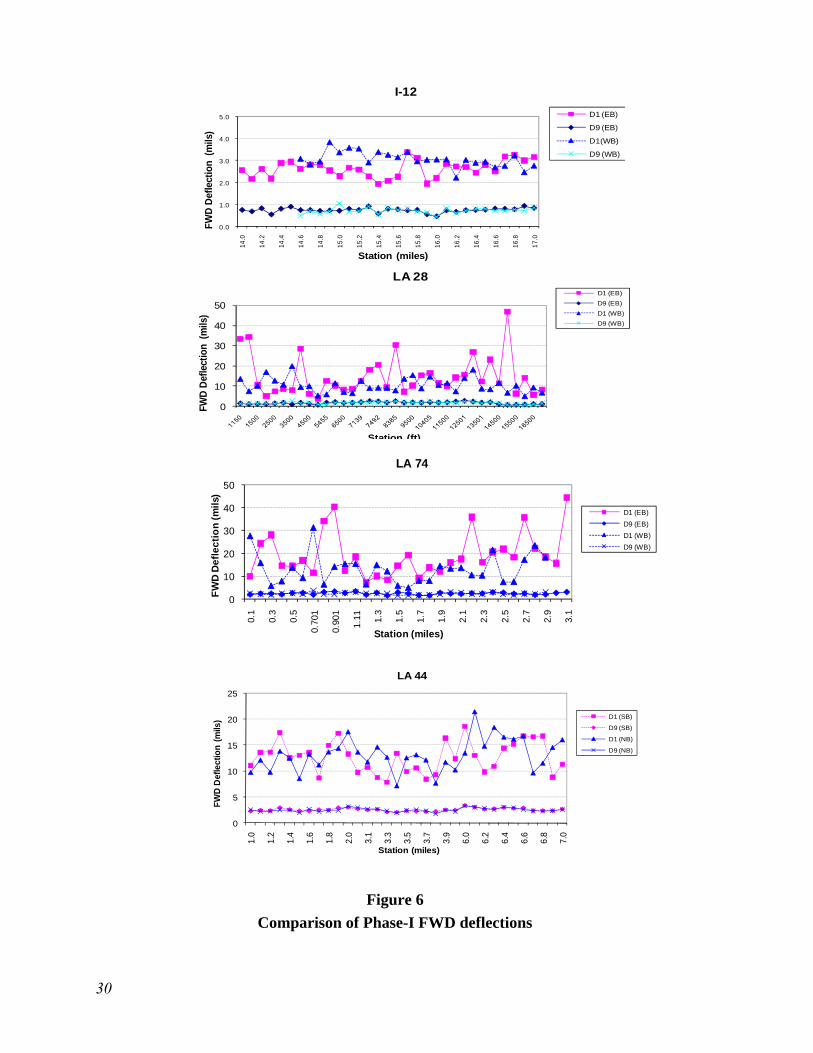
FWD Results. Figure 6 presents variations of FWD deflections D1 and D9 for the
four projects in Phase I. For the ease of comparison, all FWD deflections have been
normalized to a standard load of 9,000 lb. It is known that pavement surface deflection is
inversely related to its strength or in-situ modulus. A high surface deflection value indicates a
weak pavement structure including the subgrade. Generally speaking, D1 reflects the overall
pavement structure strength and D9 indicates the in-situ modulus of the subgrade [27], [28].
As shown in Figure 6, D9 values within each project are relatively consistent on both traffic
directions. This indicates that subgrade strengths on both traffic directions are similar. By
applying the AASHTO NDT subgrade modulus (i.e. equation (13), the average subgrade
moduli for I-12, LA 28, LA 74, and LA 44 are 22.1, 6.8, 4.6, and 4.5 ksi, respectively. As
compared to the parish map Mr values shown in Table 3, the in-situ backcalculated Mr values
differ significantly.
30
Figure 6 FWD deflections
Figure 6
Comparison of Phase-I FWD deflections
0.0
1.0
2.0
3.0
4.0
5.0
14.0
14.2
14.4
14.6
14.8
15.0
15.2
15.4
15.6
15.8
16.0
16.2
16.4
16.6
16.8
17.0
FWD
Def
lect
ion
(mils
)
Station (miles)
I-12
D1 (EB)
D9 (EB)
D1(WB)
D9 (WB)
0
10
20
30
40
50
FWD
Def
lect
ion
(mils
)
Station (ft)
LA 28D1 (EB)
D9 (EB)
D1 (WB)
D9 (WB)
0
5
10
15
20
25
1.0
1.2
1.4
1.6
1.8
2.0
3.1
3.3
3.5
3.7
3.9
6.0
6.2
6.4
6.6
6.8
7.0
FW
D D
efle
ctio
n (
mils
)
Station (miles)
LA 44
D1 (SB)
D9 (SB)
D1 (NB)
D9 (NB)
0
10
20
30
40
50
0.1
0.3
0.5
0.70
1
0.90
1
1.11 1.
3
1.5
1.7
1.9
2.1
2.3
2.5
2.7
2.9
3.1
FW
D D
efl
ec
tio
n (
mil
s)
Station (miles)
LA 74
D1 (EB)
D9 (EB)
D1 (WB)
D9 (WB)
31
The average D1s on I-12, LA 28, LA 74, and LA 44 are 2.85, 12.55, 16.29, and 12.94 mils,
respectively. In terms of overall pavement structure strength, the ranking of existing
pavements from high to low would be I-12, LA 28, LA 44, and LA 74. This is as expected
since the ranking results matched well with the layer thickness configurations of the
pavements as shown in Table 4. However, the D1-values varied considerably within each
project length. For instance, the standard deviation of D1s in LA-74 E is as high as 9.6 mils.
Such deflection variation reflects in-situ pavement strength variation along its project length,
which could have resulted from the construction variation in layer thicknesses, differing
severity in surface distresses, and/or environmental influences such as pavement temperature
differences during FWD testing. The D1-values also varied in different traffic directions. For
instance, the average D1-value for LA-74E is 19.43 mils, which is significantly higher than
that of 13.15 mils in LA-74W. This appears to indicate that, for each traffic direction, the
pavement of LA 74 requires different overlay thicknesses based on the in-situ pavement
conditions. Similarly, large directional variations of D1s are observed in LA 28, whereas,
such variations for I-12 and LA 44 pavements are relatively small. Table 6 presents a statistic
summary of FWD deflections for the four projects evaluated in Phase I.
Table 6
FWD deflection variations
Project D1 (mils) D9 (mils)
Average Std. Average Std.
I-12 W 3.07 0.35 0.73 0.13
I-12 E 2.64 0.38 0.74 0.10
LA-28 W 10.41 9.82 1.65 0.47
LA-28 E 14.69 3.62 1.70 0.50
LA-74 W 13.15 6.58 2.22 0.48
LA-74 E 19.43 9.62 2.48 0.50
LA-44 S 12.72 3.04 2.58 0.32
LA-44 N 13.16 3.11 2.52 0.36
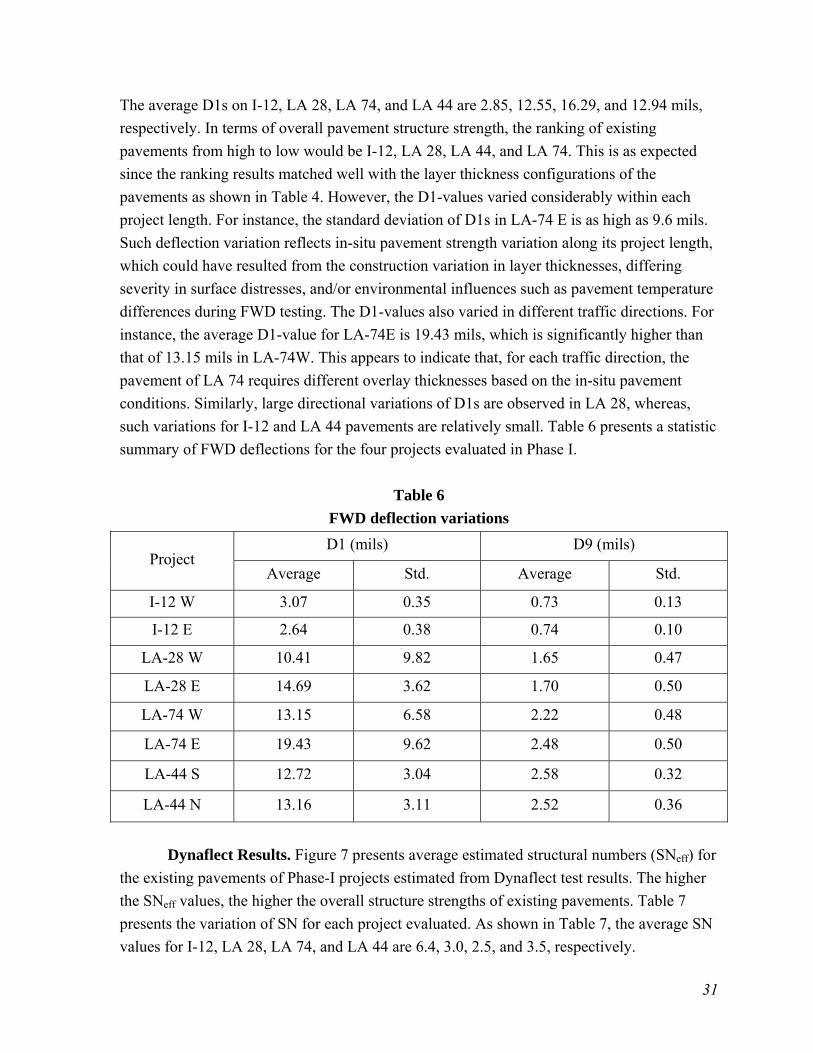
Dynaflect Results. Figure 7 presents average estimated structural numbers (SNeff) for
the existing pavements of Phase-I projects estimated from Dynaflect test results. The higher
the SNeff values, the higher the overall structure strengths of existing pavements. Table 7
presents the variation of SN for each project evaluated. As shown in Table 7, the average SN
values for I-12, LA 28, LA 74, and LA 44 are 6.4, 3.0, 2.5, and 3.5, respectively.

32
Figure 7
Dynaflect estimated SN values of Phase-I projects
0.0
1.0
2.0
3.0
4.0
5.0
6.0
1150
1500
2500
3500
4500
5455
6500
7139
7492
8385
9500
10405
11500
12500
13500
14500
15500
16500
SN
(E
xis
tin
g)
Station (ft)
LA 28
EBWB
SN(WB) = 3.3
SN(EB) =2.7
0.0
2.0
4.0
6.0
0.1
0.3
0.5
0.7
0.9
1.1
1.3
1.5
1.7
1.9
2.1
2.3
2.5
2.7
2.9
SN
(E
xis
tin
g)
Station (miles)
LA 74 E…W… SN(WB)
= 2.8
SN(EB) =2.1
4.0
5.0
6.0
7.0
8.0
14
.01
4.1
14
.21
4.3
14
.41
4.5
14
.61
4.7
14
.81
4.9
15
.01
5.1
15
.21
5.3
15
.41
5.5
15
.61
5.7
15
.81
5.9
16
.01
6.1
16
.21
6.3
16
.41
6.5
16
.61
6.7
16
.81
6.9
17
.0
SN
(Ex
isti
ng
)
Station (miles)
I-12
EB
WB
0.0
1.0
2.0
3.0
4.0
5.0
6.0
1.0
1.2
1.4
1.6
1.8
2.0
3.1
3.3
3.5
3.7
3.9
6.0
6.2
6.4
6.6
6.8
7.0
SN
(Exi
stin
g)
Station (miles)
LA 44NB
SB
33
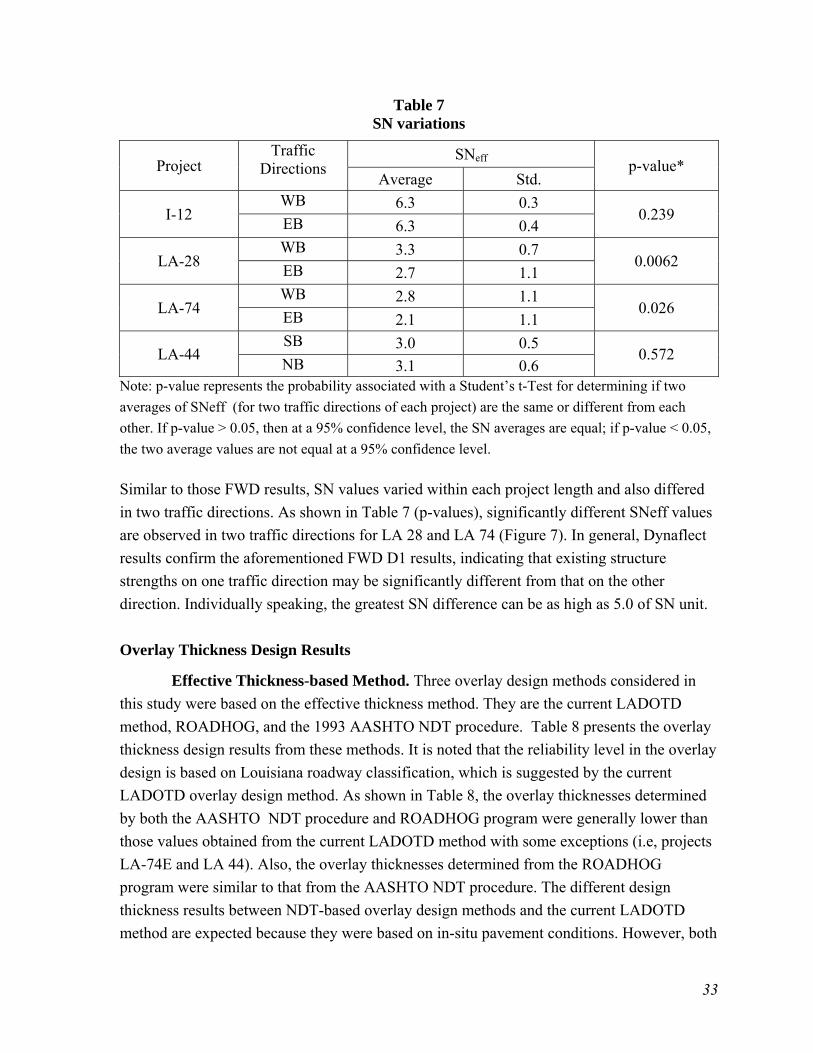
Table 7 SN variations
Project Traffic
Directions SNeff
p-value* Average Std.
I-12 WB 6.3 0.3
0.239 EB 6.3 0.4
LA-28 WB 3.3 0.7
0.0062 EB 2.7 1.1
LA-74 WB 2.8 1.1
0.026 EB 2.1 1.1
LA-44 SB 3.0 0.5
0.572 NB 3.1 0.6
Note: p-value represents the probability associated with a Student’s t-Test for determining if two
averages of SNeff (for two traffic directions of each project) are the same or different from each
other. If p-value > 0.05, then at a 95% confidence level, the SN averages are equal; if p-value < 0.05,
the two average values are not equal at a 95% confidence level.
Similar to those FWD results, SN values varied within each project length and also differed
in two traffic directions. As shown in Table 7 (p-values), significantly different SNeff values
are observed in two traffic directions for LA 28 and LA 74 (Figure 7). In general, Dynaflect
results confirm the aforementioned FWD D1 results, indicating that existing structure
strengths on one traffic direction may be significantly different from that on the other
direction. Individually speaking, the greatest SN difference can be as high as 5.0 of SN unit.
Overlay Thickness Design Results
Effective Thickness-based Method. Three overlay design methods considered in
this study were based on the effective thickness method. They are the current LADOTD
method, ROADHOG, and the 1993 AASHTO NDT procedure. Table 8 presents the overlay
thickness design results from these methods. It is noted that the reliability level in the overlay
design is based on Louisiana roadway classification, which is suggested by the current
LADOTD overlay design method. As shown in Table 8, the overlay thicknesses determined
by both the AASHTO NDT procedure and ROADHOG program were generally lower than
those values obtained from the current LADOTD method with some exceptions (i.e, projects
LA-74E and LA 44). Also, the overlay thicknesses determined from the ROADHOG
program were similar to that from the AASHTO NDT procedure. The different design
thickness results between NDT-based overlay design methods and the current LADOTD
method are expected because they were based on in-situ pavement conditions. However, both

34
the AASHTO NDT procedure and ROADHOG program call for empirical relationships in
determination of the SNeff values, as described in the previous section. Therefore, the more
appropriate method to be used in Louisiana pavement conditions cannot be determined
without local calibration.
Table 8 Overlay design results using the effective thickness methods
Project Classification Reliability
(%) (1) S0
Design ESALs
(2)∆PSIOverlay thickness (in.)
DOTD AASHTO ROADHOG
I-12 W Rural Principal Arterial Interstate
97
0.47
24,399,600 1.5 3.4 0.0 0.0
I-12 E 3.4 0.0 0.0
LA-28 W Rural Principal Arterial Other
95 1,512,993 1.8 3.3 0.5 0.9
LA-28 E 3.3 2.0 2.2
LA-74 W Rural Major Collector
85 819,101 2 2.4 1.3 0.2
LA-74 E 2.4 2.7 0.7
LA-44 S Rural Major Collector
85 353,256 2 0.0 0.0 0.6
LA-44 N 0.0 0.0 0.8
Note: (1) S0 = combined standard error of the traffic prediction and performance prediction;
(2) ∆PSI = different between the initial design serviceability and the design terminal serviceability
index.
Deflection-Based Method. Table 9 presents overlay design results from the AI MS-
17 deflection based method. In general, the overlay thicknesses determined by the MS-17
deflection method were all smaller than those thickness values obtained from the current
LADOTD method. As shown in Table 9, to use the MS-17 method, the FWD measured
deflections have to be first translated into Benkelman beam deflections. Since the correlation
between FWD and Benkelman beam deflections has not been verified based on Louisiana
pavement conditions, a direct use of such a relationship may lead to unpredictable errors.
Interesting to note, although the fundamental methodology using in the MS-17 deflection
method is completely different from the effective thickness method, the required overlay
thicknesses were found quite similar to the values determined from the 1993 AASHTO NDT
procedure as shown in Table 8.

35
Table 9 Overlay design results using AI deflection method
Project Average D1
(mils) Std. D1
(mils) Temperature Correction
RRD (mils)
Overlay Thickness (in.)
I-12 W 3.071 0.349 0.85 5.159 0.0 I-12 E 2.646 0.385 0.9 4.951 0.0
LA-28 W 10.444 3.607 0.85 24.164 0.0 LA-28 E 14.752 9.802 0.82 45.356 2.5 LA-74 W 13.141 6.495 0.9 37.865 1.0 LA-74 E 19.453 9.54 0.82 31.591 2.2 LA-44 S 12.708 2.985 0.83 24.961 0.0 LA-44 N 13.171 3.077 0.8 24.891 0.0
Note: D1= Center deflection of FWD; RRD=Representative rebound deflection converted from FWD
Table 10 presents the overlay design results using the Louisiana 1980 deflection method. In
this method, a temperature-corrected Dynaflect deflection and backcalculated subgrade
modulus were used as the inputs in the overlay thickness design chart developed by Kinchen
and Temple [1]. Again, the design overlay thickness using the Louisiana 1980 method also
differs significantly from the current LADOTD method, but more closely relates to the
results obtained from other NDT methods above.
Table 10 Overlay design results using Louisiana 1980 deflection method
Project Average W1*
(mils) Std. W1
(mils)
Subgrade Modulus, Es
(ksi)
Traffic (ESALs)
Overlay Thickness (in.)
I-12 W 0.207 0.030 24.6 24,399,600
0.0 I-12 E 0.201 0.032 23.7 0.0
LA-28 W 0.788 0.191 9.2 1,512,993
1.4 LA-28 E 0.645 0.275 10.5 1.2 LA-74 W 1.605 0.339 6.7
819,101 2.6
LA-74 E 1.232 0.416 7.0 1.6 LA-44 S 1.115 0.227 5.4
353,256 0.7
LA-44 N 1.005 0.196 6.1 0.6
Note: Temperature-corrected deflection, 1 mil = 0.001 in.
M-E-Based Method. Table 11 presents the overlay design results using the
ELMOD5 computer program.
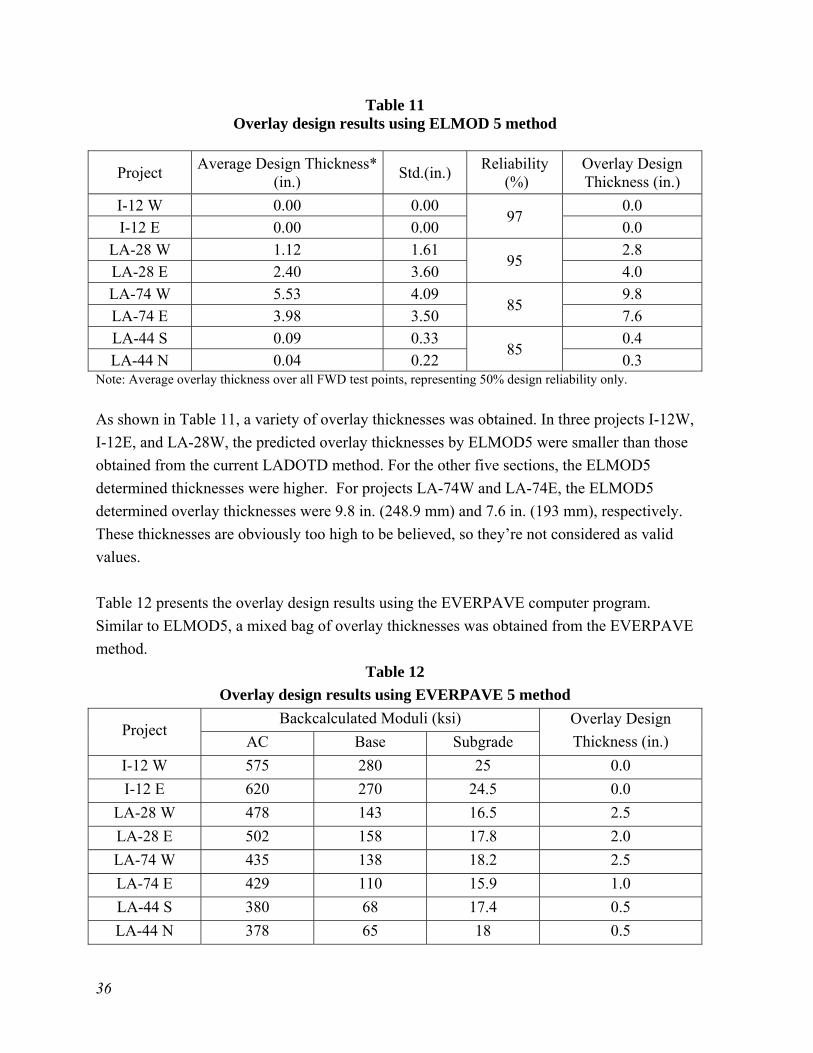
36
Table 11 Overlay design results using ELMOD 5 method
Project Average Design Thickness*
(in.) Std.(in.)
Reliability (%)
Overlay Design Thickness (in.)
I-12 W 0.00 0.00 97
0.0
I-12 E 0.00 0.00 0.0
LA-28 W 1.12 1.61 95
2.8
LA-28 E 2.40 3.60 4.0
LA-74 W 5.53 4.09 85
9.8
LA-74 E 3.98 3.50 7.6
LA-44 S 0.09 0.33 85
0.4
LA-44 N 0.04 0.22 0.3 Note: Average overlay thickness over all FWD test points, representing 50% design reliability only.
As shown in Table 11, a variety of overlay thicknesses was obtained. In three projects I-12W,
I-12E, and LA-28W, the predicted overlay thicknesses by ELMOD5 were smaller than those
obtained from the current LADOTD method. For the other five sections, the ELMOD5
determined thicknesses were higher. For projects LA-74W and LA-74E, the ELMOD5
determined overlay thicknesses were 9.8 in. (248.9 mm) and 7.6 in. (193 mm), respectively.
These thicknesses are obviously too high to be believed, so they’re not considered as valid
values.
Table 12 presents the overlay design results using the EVERPAVE computer program.
Similar to ELMOD5, a mixed bag of overlay thicknesses was obtained from the EVERPAVE
method.
Table 12
Overlay design results using EVERPAVE 5 method
Project Backcalculated Moduli (ksi) Overlay Design
Thickness (in.) AC Base Subgrade
I-12 W 575 280 25 0.0
I-12 E 620 270 24.5 0.0
LA-28 W 478 143 16.5 2.5
LA-28 E 502 158 17.8 2.0
LA-74 W 435 138 18.2 2.5
LA-74 E 429 110 15.9 1.0
LA-44 S 380 68 17.4 0.5
LA-44 N 378 65 18 0.5
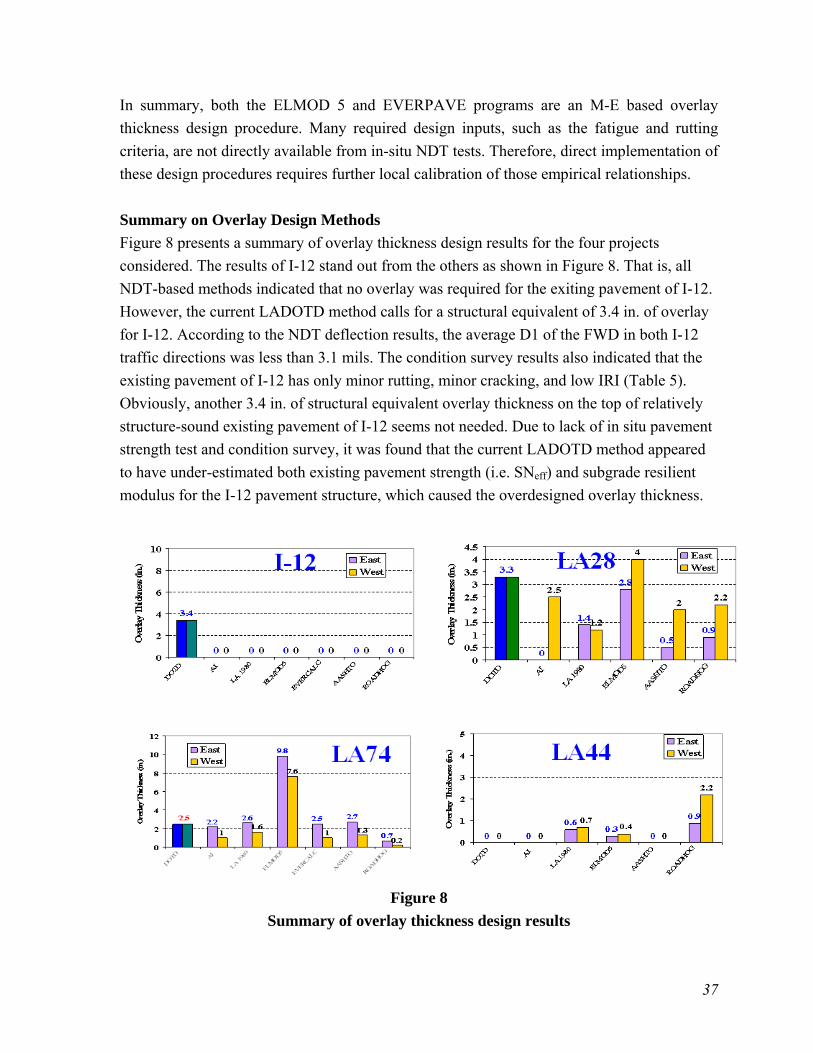
37
In summary, both the ELMOD 5 and EVERPAVE programs are an M-E based overlay
thickness design procedure. Many required design inputs, such as the fatigue and rutting
criteria, are not directly available from in-situ NDT tests. Therefore, direct implementation of
these design procedures requires further local calibration of those empirical relationships.
Summary on Overlay Design Methods
Figure 8 presents a summary of overlay thickness design results for the four projects
considered. The results of I-12 stand out from the others as shown in Figure 8. That is, all
NDT-based methods indicated that no overlay was required for the exiting pavement of I-12.
However, the current LADOTD method calls for a structural equivalent of 3.4 in. of overlay
for I-12. According to the NDT deflection results, the average D1 of the FWD in both I-12
traffic directions was less than 3.1 mils. The condition survey results also indicated that the
existing pavement of I-12 has only minor rutting, minor cracking, and low IRI (Table 5).
Obviously, another 3.4 in. of structural equivalent overlay thickness on the top of relatively
structure-sound existing pavement of I-12 seems not needed. Due to lack of in situ pavement
strength test and condition survey, it was found that the current LADOTD method appeared
to have under-estimated both existing pavement strength (i.e. SNeff) and subgrade resilient
modulus for the I-12 pavement structure, which caused the overdesigned overlay thickness.
Figure 8
Summary of overlay thickness design results
38
Figure 8 also indicates that different NDT methods resulted in different sets of overlay
thicknesses by using same sets of NDT results. Due to the variation in the existing pavement
strengths, all NDT methods called for different overlay thicknesses for different traffic
directions. Nevertheless, the current LADOTD method failed to do so because the in-situ
pavement conditions for different traffic direction were assumed to be the same in the
analysis. On the other hand, without verification and calibrations, none of those NDT
methods can be directly used for the Louisiana pavement condition.
Development of NDT-Based Overlay Design Method for Louisiana Flexible Pavements
LADOTD has begun developing calibration models for implementing the new MEPDG
method in Louisiana. The calibrated MEPDG will include an M-E and NDT based overlay
design module. Clearly, any effort on local calibration of any of those aforementioned NDT
overlay design methods in Louisiana is redundant and beyond the scope of this study.
However, the process of local calibration and full implementation of the MEPDG may take
many years to accomplish. Therefore, a modified effective thickness (ET) overlay design
method was developed in this study based upon testing and research conducted on Louisiana
highways. The proposed method may be used prior to the implementation of MEPDG in
Louisiana.
Evaluation of Existing Pavement Condition
Evaluation of the existing pavement is a key step in an overlay rehabilitation design. When a
pavement’s in-situ strength is expressed in terms of SNeff, one should know that the SNeff
does not always one-to-one relate to the pavement layer modulus (or moduli). In other words,
a layer with a higher modulus does not necessarily possess a greater SNeff than a layer with a
lower modulus. For example, a crushed stone base shares a same design layer coefficient
(i.e., a = 0.14) as a soil cement base. When the two base layers have the same layer thickness,
technically they are expected to have equal in-situ structural numbers, even though the soil
cement often is known to have a higher in-situ elastic modulus than a crushed stone base.
On the other hand, when NDT deflections are involved in evaluation of the existing
pavement, one should aware that the magnitude of pavement surface deflection is largely
dependent on the moduli of underneath pavement layers, not top asphalt layers. The
sensitivity of different modulus on surface deflections is showed in Figure 9. The
computation was based on a two-layer pavement structure under a 9,000-lb. FWD load using
ELSYM5, an elastic multi-layer computer analysis program originally developed at the
University of California at Berkeley [32]. Figure 9a indicates that the surface deflection of an
existing pavement does not change significantly as the surface asphalt concrete modulus

39
increases from 300 ksi to 600 ksi. However, it does decrease drastically when the underneath
base and subgrade modulus increase from 100 ksi to 150 ksi, as shown in Figure 9b.
(a)
(b)
Figure 9
Surface maximum deflection under 9,000-lb. FWD load
Most of the existing pavements in Louisiana use base courses such as soil cement, sand shell,
or clam shell over a relatively weak subgrade. Those materials have different performance
characteristics when compared to a crushed stone base course. A comprehensive pavement
evaluation chart (Figure 10) was then developed by Kinchen and Temple to catalogue in-situ
pavement strength conditions in Louisiana [1]. As shown in Figure 10, an effective structural
number (SNeff) and a design subgrade modulus of existing pavements can be determined
based on a temperature-corrected Dynaflect center deflection and a percent spread value.
The percent spread value is calculated by determining the average of five sensor deflections
and dividing that by the first sensor deflection multiplied by 100. The determination of the
SN value from the Louisiana Pavement Evaluation Chart is hereafter called the “Dynaflect
method.”
0
1
2
3
4
5
6
7
8
0 200 400 600 800
Surface Modulus (ksi)
Su
rfac
e D
efle
ctio
n (
mil
s
0
1
2
3
4
5
6
7
8
0 50 100 150 200
Modulus of Underneath Layer (ksi)
Su
rfac
e D
efle
ctio
n (
mil
s

40
Figure 10
Louisiana pavement evaluation chart [1]
The Louisiana Pavement Evaluation Chart shown in Figure 10 was modified from an
evaluation chart developed by N.K. Vaswani with an inclusion of a Louisiana Dynaflect-
Benkelman beam correlation [30] [1]. The SN values in the chart were calibrated using 28
failed asphalt overlay projects [1]. The individual SN points in the figure represent in situ
estimated SN-values based on field cores. Past research experience indicates that SNeff
determined from the Dynaflect method matches reasonably well to the SN-value determined
by the LADOTD component analysis method when good engineering judgment is applied.
On the other hand, the SN value predicted from the AASHTO NDT method is usually higher
than that from the Dynaflect method. Figure 11a presents the predicted SNeff values obtained
from FWD and Dynaflect for the four projects evaluated in Phase I of this study. The FWD
SNeff values were backcalculated using the 1993 AASHTO NDT procedure; whereas, the
Dynaflect SNeff values were determined from the Louisiana Pavement Evaluation Chart. The
SNeff values were also estimated based on the LADOTD component analysis method. As
shown in Figure 11a, the SNeff values obtained from FWD were significantly higher than
those values obtained from Dynaflect, especially for the I-12 project. On the other hand, as
shown in Figure 11b, the Dynaflect SNeff values were observed to be very close (but mostly
slightly higher) to those determined from the component analysis method. Overall, the above
analysis further confirmed that Dynaflect determined SN values reflect in-situ pavement
conditions in Louisiana.
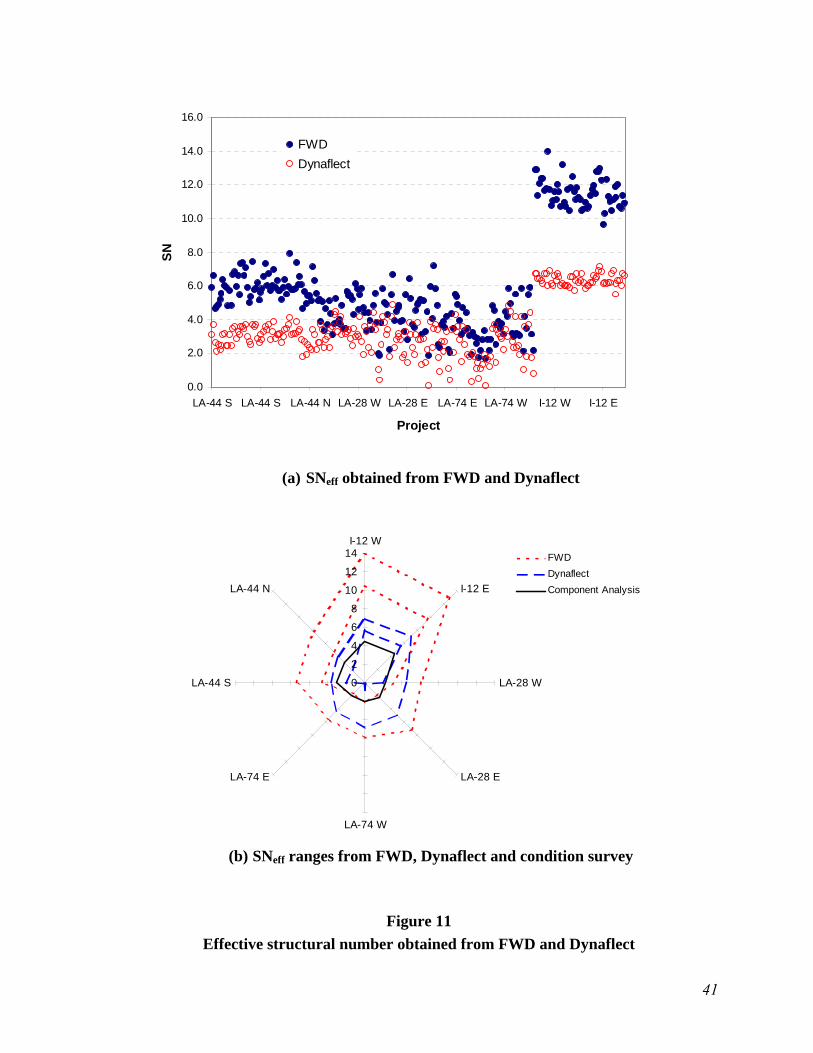
41
(a) SNeff obtained from FWD and Dynaflect
(b) SNeff ranges from FWD, Dynaflect and condition survey
Figure 11
Effective structural number obtained from FWD and Dynaflect
0.0
2.0
4.0
6.0
8.0
10.0
12.0
14.0
16.0
LA-44 S LA-44 S LA-44 N LA-28 W LA-28 E LA-74 E LA-74 W I-12 W I-12 E
Project
SN
FWD
Dynaflect
0
2
4
6
8
10
12
14I-12 W
I-12 E
LA-28 W
LA-28 E
LA-74 W
LA-74 E
LA-44 S
LA-44 N
FWD
Dynaflect
Component Analysis
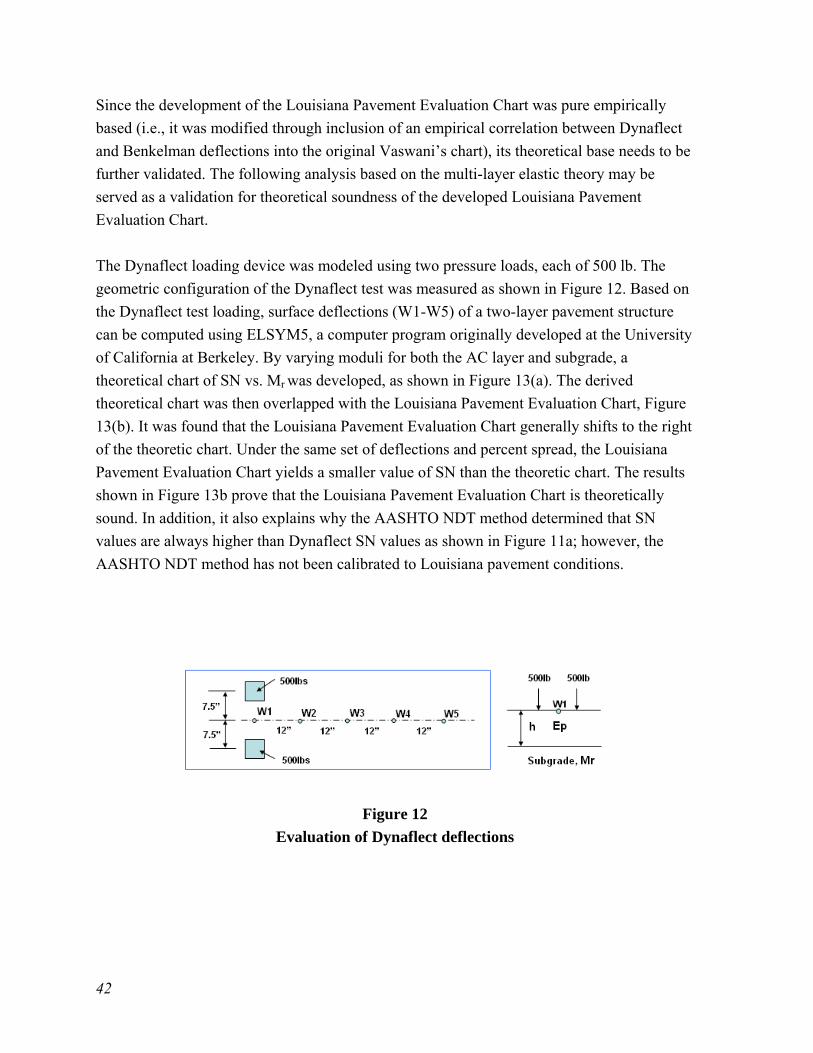
42
Since the development of the Louisiana Pavement Evaluation Chart was pure empirically
based (i.e., it was modified through inclusion of an empirical correlation between Dynaflect
and Benkelman deflections into the original Vaswani’s chart), its theoretical base needs to be
further validated. The following analysis based on the multi-layer elastic theory may be
served as a validation for theoretical soundness of the developed Louisiana Pavement
Evaluation Chart.
The Dynaflect loading device was modeled using two pressure loads, each of 500 lb. The
geometric configuration of the Dynaflect test was measured as shown in Figure 12. Based on
the Dynaflect test loading, surface deflections (W1-W5) of a two-layer pavement structure
can be computed using ELSYM5, a computer program originally developed at the University
of California at Berkeley. By varying moduli for both the AC layer and subgrade, a
theoretical chart of SN vs. Mr was developed, as shown in Figure 13(a). The derived
theoretical chart was then overlapped with the Louisiana Pavement Evaluation Chart, Figure
13(b). It was found that the Louisiana Pavement Evaluation Chart generally shifts to the right
of the theoretic chart. Under the same set of deflections and percent spread, the Louisiana
Pavement Evaluation Chart yields a smaller value of SN than the theoretic chart. The results
shown in Figure 13b prove that the Louisiana Pavement Evaluation Chart is theoretically
sound. In addition, it also explains why the AASHTO NDT method determined that SN
values are always higher than Dynaflect SN values as shown in Figure 11a; however, the
AASHTO NDT method has not been calibrated to Louisiana pavement conditions.
Figure 12
Evaluation of Dynaflect deflections
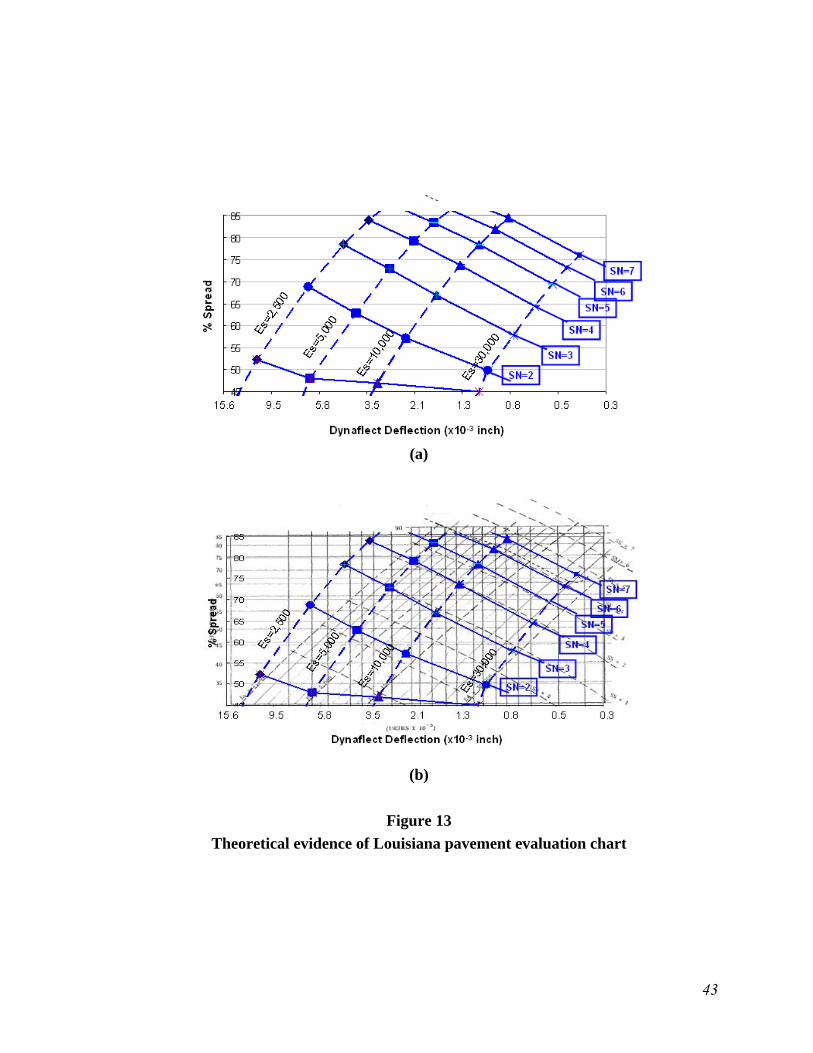
43
(a)
(b)
Figure 13
Theoretical evidence of Louisiana pavement evaluation chart

44
Proposed NDT-Based Overlay Design Method
The proposed overlay thickness design method generally follows similar design steps as
described in the 1993 AASHTO NDT-based overlay design procedure [7]. Specifically, the
following steps are involved:
Step 1: Information on existing pavement design and construction.
Determine thickness and material type of each pavement layer
Collect available subgrade soil information
Step 2: Traffic analysis.
Predict future 18-kip ESALs in the design lane over the design period.
Step 3: Deflection testing.
Perform FWD deflection measurements at 0.1-mile intervals along project’s
mile post on the existing pavement surface.
Step 4: Determination of Design SNeff.
Compute SNeff |(FWD) using the 1993 AASHTO NDT method, as described in
this report with equations (13), (14) and (15)
Determine the design SNeff using the following equation:
Design SNeff = 2.58*Ln(SNeff|(FWD))-0.77 (18)
Step 5: Determination of required structural number for future traffic (SNf).
Determination of design Mr for subgrade
The design Mr value is computed using the following equation:
)
24.0(4.0
rd
PMrDesign
r
(19)
where, P = applied FWD load of approximately 9,000 lb. (40 kN),
dr = deflection at a distance of 36 in. (900 mm) from the center of the
load, and
r = 36 in. (900 mm).
Design PSI loss
PSI immediately after overlay (P1) minus PSI at time of next rehabilitation
(P2). Note that P1 and P2 should be selected based on the current LADOTD
overlay design method.
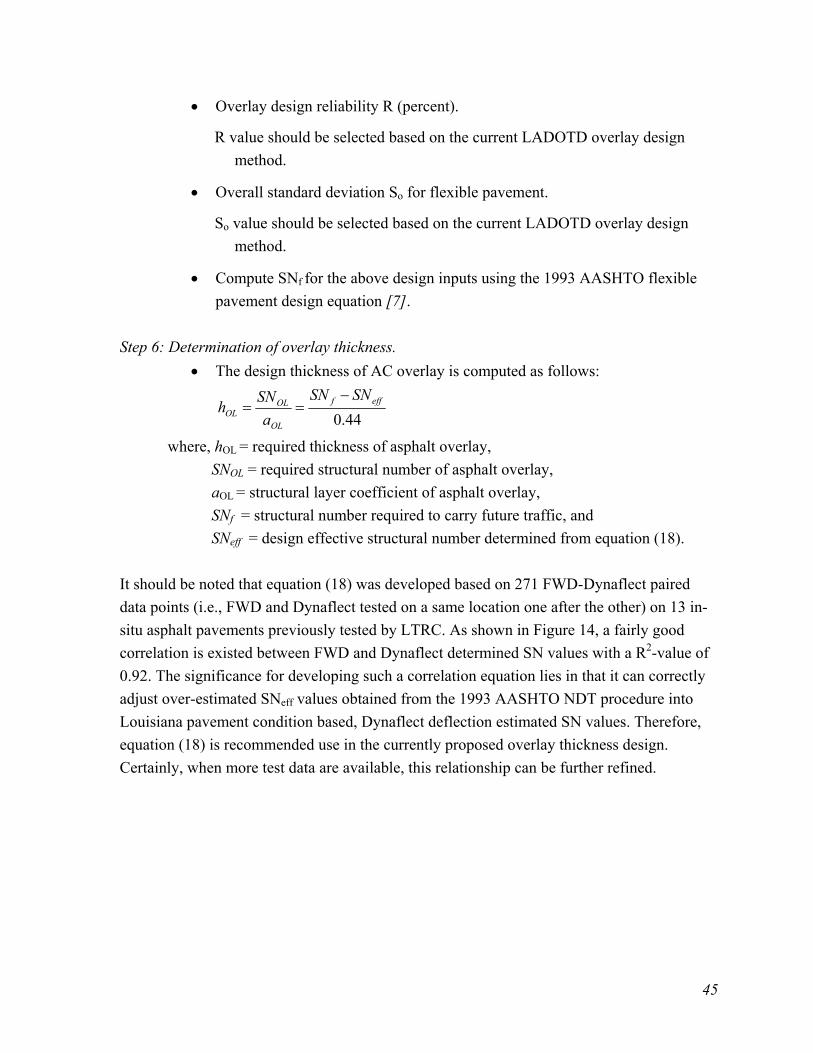
45
Overlay design reliability R (percent).
R value should be selected based on the current LADOTD overlay design
method.
Overall standard deviation So for flexible pavement.
So value should be selected based on the current LADOTD overlay design
method.
Compute SNf for the above design inputs using the 1993 AASHTO flexible
pavement design equation [7].
Step 6: Determination of overlay thickness.
The design thickness of AC overlay is computed as follows:
44.0efff
OL
OLOL
SNSN
a
SNh
where, hOL = required thickness of asphalt overlay,
SNOL = required structural number of asphalt overlay,
aOL = structural layer coefficient of asphalt overlay,
SNf = structural number required to carry future traffic, and
SNeff = design effective structural number determined from equation (18).
It should be noted that equation (18) was developed based on 271 FWD-Dynaflect paired
data points (i.e., FWD and Dynaflect tested on a same location one after the other) on 13 in-
situ asphalt pavements previously tested by LTRC. As shown in Figure 14, a fairly good
correlation is existed between FWD and Dynaflect determined SN values with a R2-value of
0.92. The significance for developing such a correlation equation lies in that it can correctly
adjust over-estimated SNeff values obtained from the 1993 AASHTO NDT procedure into
Louisiana pavement condition based, Dynaflect deflection estimated SN values. Therefore,
equation (18) is recommended use in the currently proposed overlay thickness design.
Certainly, when more test data are available, this relationship can be further refined.
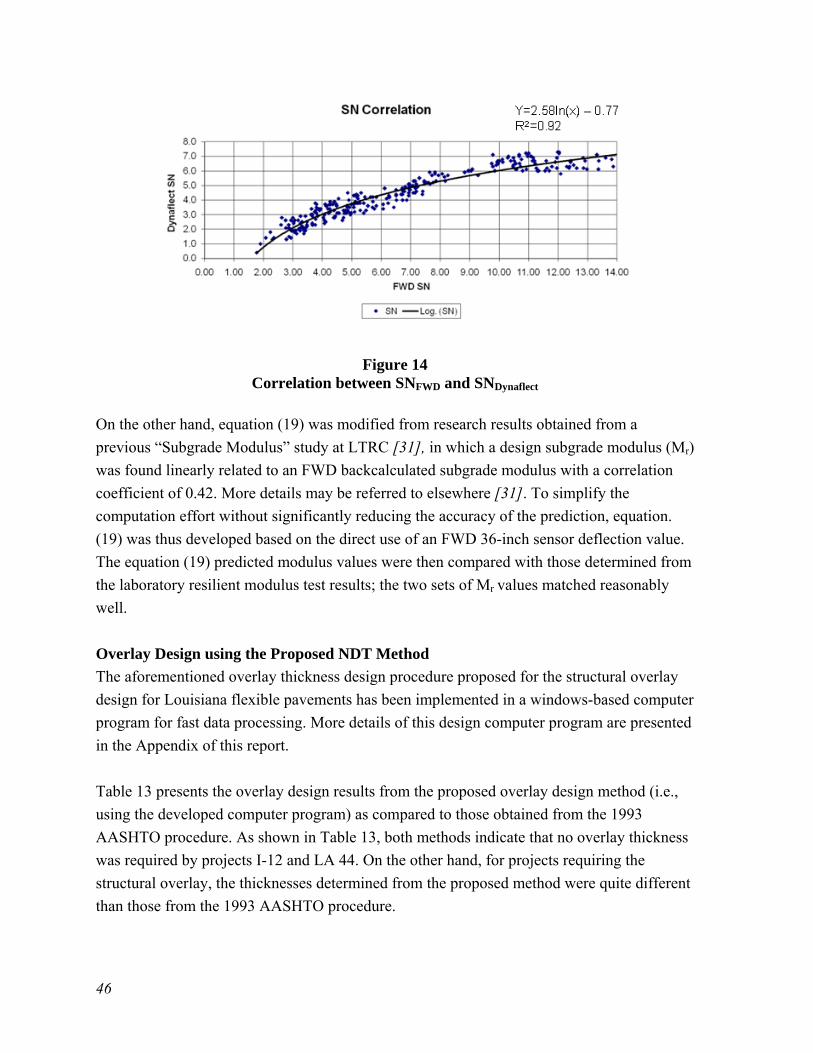
46
Figure 14 Correlation between SNFWD and SNDynaflect
On the other hand, equation (19) was modified from research results obtained from a
previous “Subgrade Modulus” study at LTRC [31], in which a design subgrade modulus (Mr)
was found linearly related to an FWD backcalculated subgrade modulus with a correlation
coefficient of 0.42. More details may be referred to elsewhere [31]. To simplify the
computation effort without significantly reducing the accuracy of the prediction, equation.
(19) was thus developed based on the direct use of an FWD 36-inch sensor deflection value.
The equation (19) predicted modulus values were then compared with those determined from
the laboratory resilient modulus test results; the two sets of Mr values matched reasonably
well.
Overlay Design using the Proposed NDT Method
The aforementioned overlay thickness design procedure proposed for the structural overlay
design for Louisiana flexible pavements has been implemented in a windows-based computer
program for fast data processing. More details of this design computer program are presented
in the Appendix of this report.
Table 13 presents the overlay design results from the proposed overlay design method (i.e.,
using the developed computer program) as compared to those obtained from the 1993
AASHTO procedure. As shown in Table 13, both methods indicate that no overlay thickness
was required by projects I-12 and LA 44. On the other hand, for projects requiring the
structural overlay, the thicknesses determined from the proposed method were quite different
than those from the 1993 AASHTO procedure.
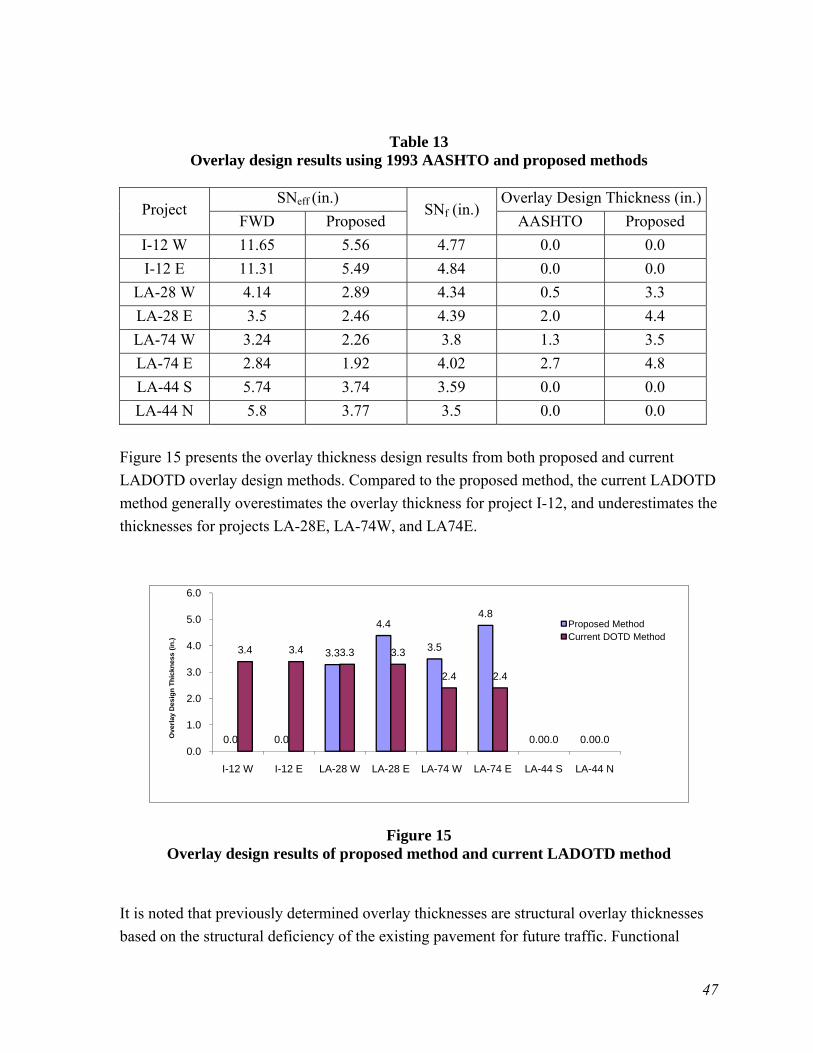
47
Table 13 Overlay design results using 1993 AASHTO and proposed methods
Project SNeff (in.)
SNf (in.) Overlay Design Thickness (in.)
FWD Proposed AASHTO Proposed
I-12 W 11.65 5.56 4.77 0.0 0.0
I-12 E 11.31 5.49 4.84 0.0 0.0
LA-28 W 4.14 2.89 4.34 0.5 3.3
LA-28 E 3.5 2.46 4.39 2.0 4.4
LA-74 W 3.24 2.26 3.8 1.3 3.5
LA-74 E 2.84 1.92 4.02 2.7 4.8
LA-44 S 5.74 3.74 3.59 0.0 0.0
LA-44 N 5.8 3.77 3.5 0.0 0.0
Figure 15 presents the overlay thickness design results from both proposed and current
LADOTD overlay design methods. Compared to the proposed method, the current LADOTD
method generally overestimates the overlay thickness for project I-12, and underestimates the
thicknesses for projects LA-28E, LA-74W, and LA74E.
Figure 15 Overlay design results of proposed method and current LADOTD method
It is noted that previously determined overlay thicknesses are structural overlay thicknesses
based on the structural deficiency of the existing pavement for future traffic. Functional
0.0 0.0
3.3
4.4
3.5
4.8
0.0 0.0
3.4 3.4 3.3 3.3
2.4 2.4
0.0 0.00.0
1.0
2.0
3.0
4.0
5.0
6.0
I-12 W I-12 E LA-28 W LA-28 E LA-74 W LA-74 E LA-44 S LA-44 N
Ove
rlay
Des
ign
Th
ickn
ess
(in
.)
Proposed MethodCurrent DOTD Method
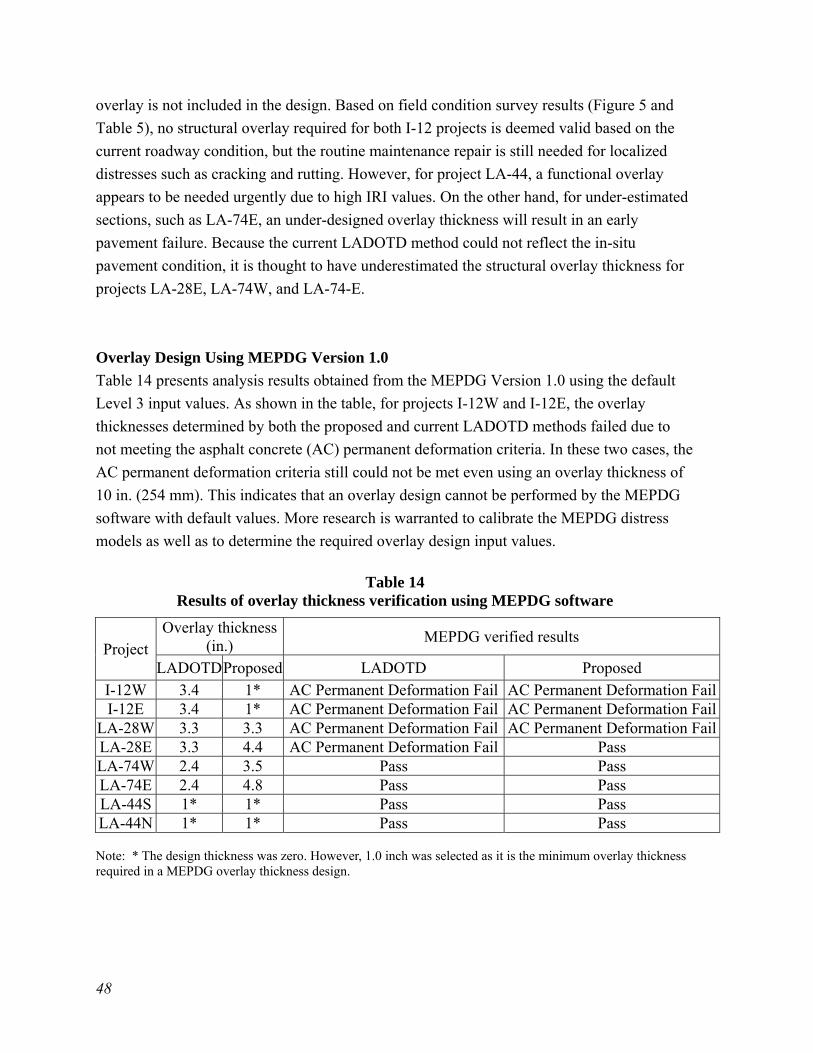
48
overlay is not included in the design. Based on field condition survey results (Figure 5 and
Table 5), no structural overlay required for both I-12 projects is deemed valid based on the
current roadway condition, but the routine maintenance repair is still needed for localized
distresses such as cracking and rutting. However, for project LA-44, a functional overlay
appears to be needed urgently due to high IRI values. On the other hand, for under-estimated
sections, such as LA-74E, an under-designed overlay thickness will result in an early
pavement failure. Because the current LADOTD method could not reflect the in-situ
pavement condition, it is thought to have underestimated the structural overlay thickness for
projects LA-28E, LA-74W, and LA-74-E.
Overlay Design Using MEPDG Version 1.0
Table 14 presents analysis results obtained from the MEPDG Version 1.0 using the default
Level 3 input values. As shown in the table, for projects I-12W and I-12E, the overlay
thicknesses determined by both the proposed and current LADOTD methods failed due to
not meeting the asphalt concrete (AC) permanent deformation criteria. In these two cases, the
AC permanent deformation criteria still could not be met even using an overlay thickness of
10 in. (254 mm). This indicates that an overlay design cannot be performed by the MEPDG
software with default values. More research is warranted to calibrate the MEPDG distress
models as well as to determine the required overlay design input values.
Table 14
Results of overlay thickness verification using MEPDG software
Project Overlay thickness
(in.) MEPDG verified results
LADOTD Proposed LADOTD Proposed
I-12W 3.4 1* AC Permanent Deformation Fail AC Permanent Deformation FailI-12E 3.4 1* AC Permanent Deformation Fail AC Permanent Deformation Fail
LA-28W 3.3 3.3 AC Permanent Deformation Fail AC Permanent Deformation FailLA-28E 3.3 4.4 AC Permanent Deformation Fail Pass LA-74W 2.4 3.5 Pass Pass LA-74E 2.4 4.8 Pass Pass LA-44S 1* 1* Pass Pass LA-44N 1* 1* Pass Pass Note: * The design thickness was zero. However, 1.0 inch was selected as it is the minimum overlay thickness required in a MEPDG overlay thickness design.

49
Analysis of Phase II Projects
The proposed overlay design method was used to design the required overlay thickness for
Phase II projects. The design results were compared to the thickness results obtained from the
current LADOTD method. Figure 16 presents the comparison (thickness difference obtained
between the current LADOTD method and the proposed method) between two sets of
overlay design thicknesses. It is noted that a positive thickness value in Figure 16 indicates
an over-designed asphalt concrete overlay thickness by the current LADOTD method;
whereas, a negative value stands for an under-designed thickness. Among the 11 projects
evaluated, about half were considered under-designed; the under-designed overlay
thicknesses ranged from 0.2 in. to 1.6 in. Another half of considered projects were over-
designed. The corresponding overdesigned asphalt concrete thicknesses varied from 0.3 in. to
1.7 in. (Figure 16).
Figure 16
Comparison of overlay thickness
Cost/Benefit Analysis
The cost/benefit analysis was performed on all projects evaluated in this study, including 4
Phase I projects and 11 Phase II projects. For over-designed projects (i.e., those positive
thickness values in Figure 16), the direct benefit of using the proposed overlay design
method would be construction cost savings. Assuming that the construction cost for asphalt
overlay is $80 per ton, construction cost savings were computed based on cost differences
between overlay plans obtained from the LADOTD overlay method and the proposed overlay
design method in this study. For instance, construction costs of two overlay thickness design
alternatives in I-12 project are listed in Table 15. Since the current LADOTD plan calls for 2
-2
-1.5
-1
-0.5
0
0.5
1
1.5
2
LA 173 LA 527 LA 137 LA 27 LA 101 US 84 US 165 LA 15 LA 28 LA 3127 LA 37
Dif
fere
nce
in O
verl
ay T
hic
knes
s (i
n)
NB/EB
SB/WB
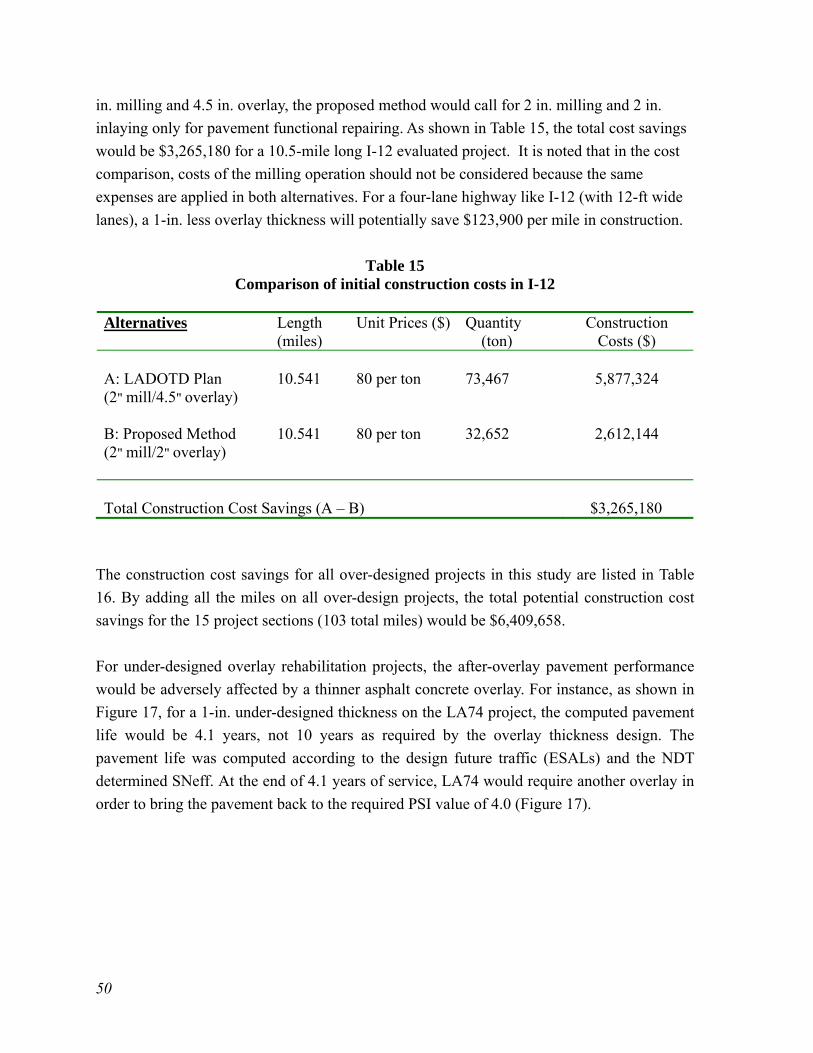
50
in. milling and 4.5 in. overlay, the proposed method would call for 2 in. milling and 2 in.
inlaying only for pavement functional repairing. As shown in Table 15, the total cost savings
would be $3,265,180 for a 10.5-mile long I-12 evaluated project. It is noted that in the cost
comparison, costs of the milling operation should not be considered because the same
expenses are applied in both alternatives. For a four-lane highway like I-12 (with 12-ft wide
lanes), a 1-in. less overlay thickness will potentially save $123,900 per mile in construction.
Table 15 Comparison of initial construction costs in I-12
Alternatives Length
(miles) Unit Prices ($) Quantity
(ton) Construction
Costs ($) A: LADOTD Plan (2" mill/4.5" overlay)
10.541
80 per ton
73,467
5,877,324
B: Proposed Method (2" mill/2" overlay)
10.541
80 per ton
32,652
2,612,144
Total Construction Cost Savings (A – B)
$3,265,180
The construction cost savings for all over-designed projects in this study are listed in Table
16. By adding all the miles on all over-design projects, the total potential construction cost
savings for the 15 project sections (103 total miles) would be $6,409,658.
For under-designed overlay rehabilitation projects, the after-overlay pavement performance
would be adversely affected by a thinner asphalt concrete overlay. For instance, as shown in
Figure 17, for a 1-in. under-designed thickness on the LA74 project, the computed pavement
life would be 4.1 years, not 10 years as required by the overlay thickness design. The
pavement life was computed according to the design future traffic (ESALs) and the NDT
determined SNeff. At the end of 4.1 years of service, LA74 would require another overlay in
order to bring the pavement back to the required PSI value of 4.0 (Figure 17).
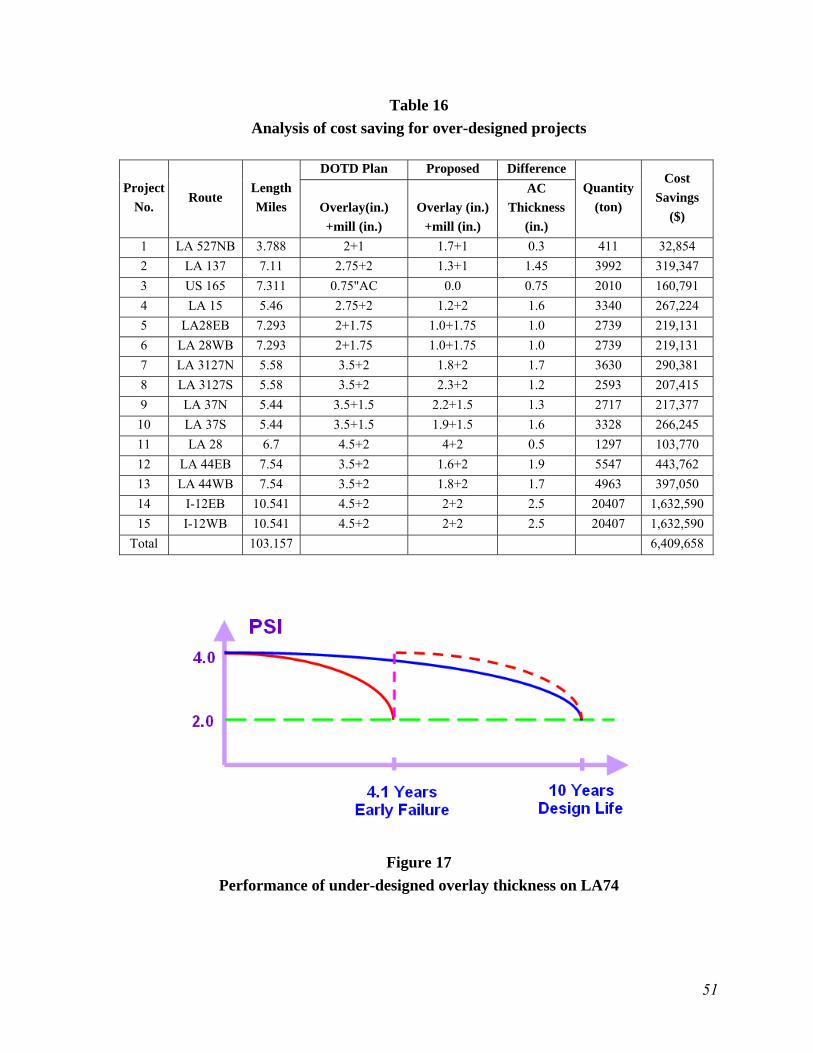
51
Table 16
Analysis of cost saving for over-designed projects
Project
No. Route
Length
Miles
DOTD Plan Proposed Difference
Quantity
(ton)
Cost
Savings
($) Overlay(in.)
+mill (in.)
Overlay (in.)
+mill (in.)
AC
Thickness
(in.)
1 LA 527NB 3.788 2+1 1.7+1 0.3 411 32,854
2 LA 137 7.11 2.75+2 1.3+1 1.45 3992 319,347
3 US 165 7.311 0.75"AC 0.0 0.75 2010 160,791
4 LA 15 5.46 2.75+2 1.2+2 1.6 3340 267,224
5 LA28EB 7.293 2+1.75 1.0+1.75 1.0 2739 219,131
6 LA 28WB 7.293 2+1.75 1.0+1.75 1.0 2739 219,131
7 LA 3127N 5.58 3.5+2 1.8+2 1.7 3630 290,381
8 LA 3127S 5.58 3.5+2 2.3+2 1.2 2593 207,415
9 LA 37N 5.44 3.5+1.5 2.2+1.5 1.3 2717 217,377
10 LA 37S 5.44 3.5+1.5 1.9+1.5 1.6 3328 266,245
11 LA 28 6.7 4.5+2 4+2 0.5 1297 103,770
12 LA 44EB 7.54 3.5+2 1.6+2 1.9 5547 443,762
13 LA 44WB 7.54 3.5+2 1.8+2 1.7 4963 397,050
14 I-12EB 10.541 4.5+2 2+2 2.5 20407 1,632,590
15 I-12WB 10.541 4.5+2 2+2 2.5 20407 1,632,590
Total 103.157 6,409,658
Figure 17
Performance of under-designed overlay thickness on LA74
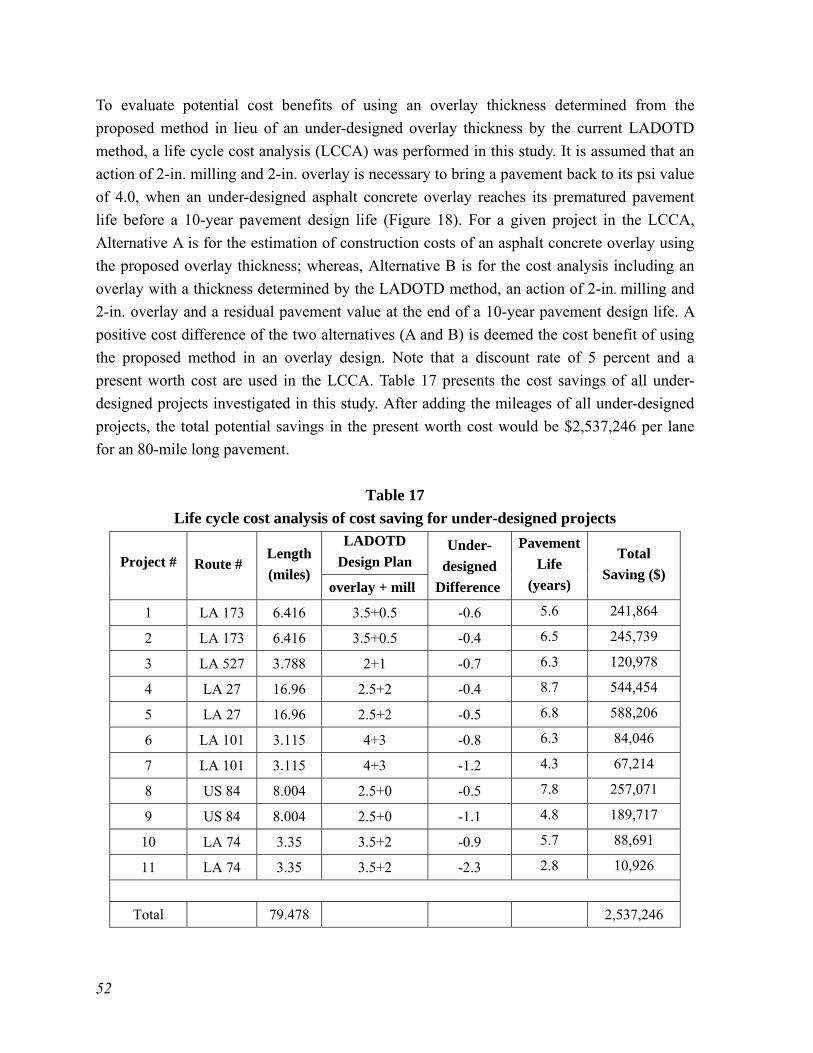
52
To evaluate potential cost benefits of using an overlay thickness determined from the
proposed method in lieu of an under-designed overlay thickness by the current LADOTD
method, a life cycle cost analysis (LCCA) was performed in this study. It is assumed that an
action of 2-in. milling and 2-in. overlay is necessary to bring a pavement back to its psi value
of 4.0, when an under-designed asphalt concrete overlay reaches its prematured pavement
life before a 10-year pavement design life (Figure 18). For a given project in the LCCA,
Alternative A is for the estimation of construction costs of an asphalt concrete overlay using
the proposed overlay thickness; whereas, Alternative B is for the cost analysis including an
overlay with a thickness determined by the LADOTD method, an action of 2-in. milling and
2-in. overlay and a residual pavement value at the end of a 10-year pavement design life. A
positive cost difference of the two alternatives (A and B) is deemed the cost benefit of using
the proposed method in an overlay design. Note that a discount rate of 5 percent and a
present worth cost are used in the LCCA. Table 17 presents the cost savings of all under-
designed projects investigated in this study. After adding the mileages of all under-designed
projects, the total potential savings in the present worth cost would be $2,537,246 per lane
for an 80-mile long pavement.
Table 17
Life cycle cost analysis of cost saving for under-designed projects
Project # Route # Length (miles)
LADOTD
Design Plan Under-
designed Difference
Pavement Life
(years)
Total Saving ($)
overlay + mill
1 LA 173 6.416 3.5+0.5 -0.6 5.6 241,864
2 LA 173 6.416 3.5+0.5 -0.4 6.5 245,739
3 LA 527 3.788 2+1 -0.7 6.3 120,978
4 LA 27 16.96 2.5+2 -0.4 8.7 544,454
5 LA 27 16.96 2.5+2 -0.5 6.8 588,206
6 LA 101 3.115 4+3 -0.8 6.3 84,046
7 LA 101 3.115 4+3 -1.2 4.3 67,214
8 US 84 8.004 2.5+0 -0.5 7.8 257,071
9 US 84 8.004 2.5+0 -1.1 4.8 189,717
10 LA 74 3.35 3.5+2 -0.9 5.7 88,691
11 LA 74 3.35 3.5+2 -2.3 2.8 10,926
Total 79.478 2,537,246

53
Cost of Performing FWD Tests
Tables 16 and 17 presented the cost savings associated with using the proposed procedure but
did not include the cost of performing FWD testing. If the new procedure was adopted by
LADOTD, FWD testing would be conducted by consultant contracts, and a package of
several projects would be the most feasible way to perform the work. Cost estimates were
solicited from industries for performing FWD tests for the following scope and tasks:
10 projects (located throughout the state)
5 miles total length per project
Testing interval (0.1 mile each direction)
Asphaltic concrete roadway
Report, data base, and data analysis
LADOTD provides typical section data such as pavement layer(s) and base course
thicknesses.
The estimated cost would be approximately $79,430 total to perform testing and to provide a
report for 50 miles of roadway. Table 3 shows there were approximately 117.71 miles of
roadway assessed in this project. This means that the FWD testing would cost approximately
$187,006.81 ($79, 430 * (117.31 / 50) = $187, 006.81) for the projects listed in Table 3.
Therefore, the overall cost savings for this project would be $8,759,897 [$6,409,658 (Table
16) + $2,537,246 (Table 17) – $187, 007 (FWD costs)]. This translates into a savings of
$74,419 per mile.


55
CONCLUSIONS
Fifteen overlay rehabilitation projects with different traffic levels and design requirements
were selected for the analysis in this study. Five NDT-based plus 1980 Louisiana Dynaflect-
based overlay design methods were investigated and used in the Phase I analysis of designing
required overlay thicknesses. A modified NDT-based overlay thickness design method has
been developed for selecting the asphalt concrete overlay thickness required to structurally
rehabilitate flexible pavements in Louisiana. This method together with a developed
computer program is recommended to be used by LADOTD before its full implementation of
the new M-E pavement design method. Some specific observations and conclusions may be
drawn from this study:
Results indicated that the 1993 AASHTO NDT procedure generally over-estimated the
effective structural number for the existing flexible pavements in Louisiana, which
would result in an under-designed overlay thickness.
Without local calibration, none of the five selected NDT-based overlay design methods
could be directly implemented in Louisiana since none of them would represent the
actual Louisiana pavement conditions. On the other hand, the 1980 Louisiana overlay
design method is also deemed not implementable due to its out-of-date overlay thickness
design charts based upon Dynaflect-measured deflections.
The Louisiana Pavement Evaluation Chart, originally developed by Kinchen and Temple,
has been proved not only applicable to the Louisiana flexible pavement conditions, but
also based on the elastic-layered pavement theory. Therefore, it is recommended to be
further used in the evaluation of existing pavement strengths of Louisiana flexible
pavements.
A strong correlation between FWD and Dynaflect determined structural numbers was
obtained in this study. Such a correlation is quite useful because it builds a link between
the layered elastic theory applied in a flexible pavement structure and Louisiana in-situ
pavement conditions.
The LCCA analysis indicates that, in lieu of the current LADOTD overlay design
method, a significant amount of cost savings ($74,419 per mile) would be obtained for
both over- and under-designed pavements when applying the proposed NDT-based
overlay design method developed in this study.

57
RECOMMENDATIONS
Evidence exists from this study that a cost savings would be realized by utilizing the
proposed overlay design procedure. In order to further validate the findings in this study, two
things should occur. First, additional projects should be sampled to fortify the findings, and
the proposed overlay design procedure should be used on selected projects and monitored for
performance.
It is envisioned that the modified overlay thickness design method presented in this study
would be a replacement for the current LADOTD component analysis overlay design method
and it would be used only in the structural overlay thickness design of flexible pavements in
Louisiana. For those roads, such as low volume roads that have a higher probability of
requiring functional instead of structural overlays, this proposed overlay design process
would be of little use except to validate that a structural overlay is not required.


59
ACRONYMS, ABBREVIATIONS, & SYMBOLS AASHTO American Association of Highway and Transportation Officials
AC Asphalt Concrete
DGAC Dense-Graded Asphalt Concrete
DOT Department of Transportation
Dynaflect Dynamic Deflection Determination System
D1 Deflection Measured at Center of FWD Plate
D9 Deflection Measured at 72 inches from Center of FWD Plate
D80 80th percentile of the deflections at the surface for a test section in inches
ESAL Equivalent Single Axle Load
ET Effective Thickness
FWD Falling Weight Deflectometer
GE Gravel Equivalent
Gf Gravel Factor
IRI International Roughness Index
LADOTD Louisiana Department of Transportation and Development
LCCA Life Cycle Cost Analysis
LTRC Louisiana Transportation Research Center
MEPDG Mechanistic-Empirical Pavement Design Guide
Mr Resilient Modulus of Soil Subgrade
NDT Non Destructive Testing
PRD Percent Reduction in Deflection
RRD Representative Rebound Deflection
SN Structural Number
SNeff Effective Structural Number of an Existing Pavement
SNf Future Required Structural Number of an Overlaid Pavement
TDS Tolerable Deflection at the Surface
TI Traffic Index


61
REFERENCES
1. Kinchen, R.W. and Temple, W.H. Asphalt Concrete Overlays of Rigid and Flexible
Pavements. Report No. FHWA/LA-80/147, Louisiana Department of Transportation and
Development, 1980.
2. Hoffman, M. S. Direct Method for Evaluating Structural Needs of Flexible Pavements
with Falling-Weight Deflectometer Deflections. In Transportation Research Record:
Journal of the Transportation Research Board, No. 1860, TRB, National Research
Council, Washington, D.C., 2003, pp. 41-47.
3. Romanoschi, S. and Metcalf, J. B. Simple Approach to Estimation of Pavement
Structural Capacity. Transportation Research Record: Journal of the Transportation
Research Board, No. 1652, TRB, Washington, D.C., 1999, pp.198-205.
4. Kim, Y., and Kim, Y. R. Prediction of Layer Moduli from Falling Weight Deflectometer
and Surface Wave Measurements Using Artificial Neural Network. Transportation
Research Record: Journal of the Transportation Research Board, No. 1639, TRB,
Washington, D.C., 1998, pp. 53-61.
5. Abaza, K. A. “Performance-based Models for Flexible Pavement Structural Overlay
Design.” Journal of Transportation Engineering, 131(2), 2005, pp. 149-159.
6. Abaza, K. A. and Abu-Eisheh, S. “An optimum design approach for flexible
pavements.” Int. J. Pavement Engineering, 4(1), 2003, pp. 1–11.
7. American Association of State Highway and Transportation Officials (AASHTO).
(1993). AASHTO guide for design of pavement structures, Washington, D.C.
8. El-Basyouny, M. Witczak, M.W., and El-Badawy, S. “Verification for the Calibrated
Permanent Deformation Models for the 2002 Design Guide.” Journal of the Association
of Asphalt Paving Technologists, Volume 74, 2005.
9. Asphalt Institute (AI). “Asphalt overlays for highway and street rehabilitation.” Manual
Series MS-17, Lexington, KY 1996.
10. Bayomy, F.M.; Al-Kandari, F.A.; and Smith, R.M. 1996. “Mechanistically based
flexible overlay design system for Idaho.” Transportation Research Record 1543,
Transportation Research Board, Washington, D.C., pp. 10-19.
11. California Department of Transportation (Caltrans) 2001. Flexible Pavement
Rehabilitation Manual, Revised Ed., Sacramento, CA.
12. California Department of Transportation (Caltrans) (1979). Asphalt Concrete Overlay
Design Manual, Sacramento, California.
13. Conversation (2005). Project conversation with Gaspard, K., Pavement research
manager, Louisiana Transportation Research Center
62
14. Huang, Y. H. (1993). Pavement analysis and design, 1st Ed., Prentice–Hall, Englewood
Cliffs, N.J.
15. Khattak, M. (2005). Support Study for 02-3B Project- Comparative Study of the Physical
and Mechanistic Properties of HMA Mixture: Field vs Laboratory. LTRC draft final
report, 2005.
16. Maestas, J. M. and Mamlouk, M. S. (1992). “Comparison of pavement deflection
analysis methods using overlay design.” Transportation Research Record 1377,
Transportation Research Board, Washington, D.C., pp. 17–25.
17. Mamlouk, M. S.; Zaniewski, J. P.; Houston, W. N.; and Houston, S. L. (1990). “Overlay
design method for flexible pavements in Arizona.” Transportation Research Record
1286, Transportation Research Board, Washington, D.C., pp. 112–122.
18. Mohammad, L.N.; Titi, H.; and Herath, A. (2002). Effect of Moisture Content and Dry
Unit Weight on the Resilient Modulus of Subgrade Soils Predicted by Cone Penetration
Test. Report No. FHWA/LA-00/355, Louisiana Transportation Research Center.
19. Oglesby, C. H. and Hicks, R. G. (1982). Highway Engineering, 2nd Ed., Wiley, New
York.
20. Pierce, L. M. and Mahoney, J. P. (1996). “Asphalt concrete overlay design case studies.”
Transportation Research Record 1543, Transportation Research Board, Washington,
D.C., pp. 3–9.
21. Southgate, H.F. (1968). An evaluation of temperature distribution within asphalt
pavements and its relationship to pavement deflections. Commonwealth of Kentucky,
Department of Transportation, Bureau of Highways, Division of Research.
22. Scullion, T. and Michalak, C.H. (1998). Flexible pavement design system (FPS) 19:
user's manual. Research Report 1987-2, Texas Transportation Institute.
23. Yoder, E. J. and Witczak, M. W. (1975). Principles of pavement design, 2nd Ed., Wiley,
NY.
24. Zhou, H.; Huddleston, J.; and Lundy, J. (1992). “Implementation of backcalculation in
pavement evaluation and overlay design in Oregon.” Transportation Research Record
1377, Transportation Research Board, Washington, D.C., pp. 150–158.
25. Hall, K. D. and N. H. Tran. Improvements to the ROADHOG Overlay Design Program.
Final Report TRC-0209, University of Arkansas, Fayetteville, AR, 2004.
26. DYNATEST. ELMOD 5 Quick Start Manual. Dynatest, Denmark.
27. Collop, A.C.; Armitage, R.J.; and Thom, N.H. “Assessing Variability of In Situ
Pavement Material Stiffness Moduli.” Journal of Transportation Engineering, Vol. 127,
No.1, January/February, 2001, pp. 74-81.

63
28. Brown, S.F. “Development of an analytical method for the structural evaluation of
pavements,” 2nd Int. Conf. On Bearing Capacity of Roads and airfields, WDM, Bristol,
U.K., 1986.
29. El-Basyouny, M.; Witczak, M.W.; and El-Badawy, S. “Verification for the Calibrated
Permanent Deformation Models for the 2002 Design Guide.” Journal of the Association
of Asphalt Paving Technologists, Volume 74, 2005.
30. Vaswani, N.K. “Method for Separately Evaluating Structural Performance of Subgrade
and Overlaying Flexible Pavements,” Highway Research Record No. 362, Highway
Research Board, Wanshing, D.C., 1971.
31. Mohammad, L.N.; Gaspard, K.; Herath, A.; and Nazzal, M. Comparative Evaluation of
Subgrade Resilient Modulus from Non-destructive, In-situ, and Laboratory Methods.
LTRC Report No. 417, Baton Rouge, LA, 2007.
32. Kopperman, S., Tiller, G, and Tseng, M. (1986). “ELSYM5, Interactive Microcomputer
Version, User’s Manual,” Report No. FHWA-TS-87-206.

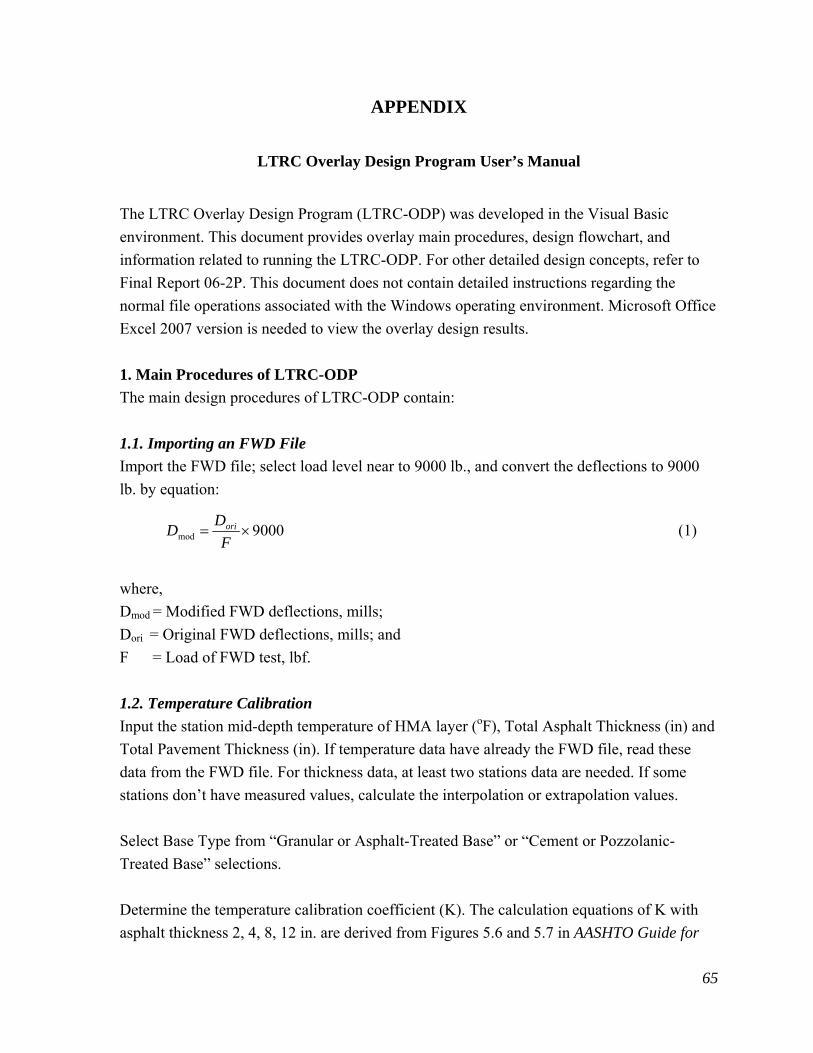
65
APPENDIX
LTRC Overlay Design Program User’s Manual
The LTRC Overlay Design Program (LTRC-ODP) was developed in the Visual Basic
environment. This document provides overlay main procedures, design flowchart, and
information related to running the LTRC-ODP. For other detailed design concepts, refer to
Final Report 06-2P. This document does not contain detailed instructions regarding the
normal file operations associated with the Windows operating environment. Microsoft Office
Excel 2007 version is needed to view the overlay design results.
1. Main Procedures of LTRC-ODP
The main design procedures of LTRC-ODP contain:
1.1. Importing an FWD File
Import the FWD file; select load level near to 9000 lb., and convert the deflections to 9000
lb. by equation:
9000mod
F
DD ori (1)
where,
Dmod = Modified FWD deflections, mills;
Dori = Original FWD deflections, mills; and
F = Load of FWD test, lbf.
1.2. Temperature Calibration
Input the station mid-depth temperature of HMA layer (oF), Total Asphalt Thickness (in) and
Total Pavement Thickness (in). If temperature data have already the FWD file, read these
data from the FWD file. For thickness data, at least two stations data are needed. If some
stations don’t have measured values, calculate the interpolation or extrapolation values.
Select Base Type from “Granular or Asphalt-Treated Base” or “Cement or Pozzolanic-
Treated Base” selections.
Determine the temperature calibration coefficient (K). The calculation equations of K with
asphalt thickness 2, 4, 8, 12 in. are derived from Figures 5.6 and 5.7 in AASHTO Guide for

66
Design of Pavement Structures 1993. For other asphalt thickness, use interpolation or
extrapolation methods to get the K value.
Calculate the temperature calibrated deflection at the center of the load plate (D0_cal), mills:
KDD cal 0_0 (2)
where,
D0 = deflection at the center of the load plate, mills; and
K = temperature calibration coefficient.
1.3. Create SNeff
Calculate the subgrade resilient modulus (MR) by equation:
r
drP
M R
1000
*24.0 (3)
where,
P = 9000 lb.;
dr = Deflection at a distance r = 36 in from the center of the load, mills; and
r = 36 inches.
Calculate the effective modulus of the pavement (Ep) from the following equation:
P
T
R
pTR
cal
E
a
D
M
E
a
DM
apD
2
2
3
_0
1
11
1
15.1
1000
(4)
where,
D0_cal = calibrated deflection at the center of the load plate, mills;
P = NDT load plate pressure, psi, here is 82.3 psi;

67
a = NDT load plate radius, in., here is 5.9 in.;
DT = Total thickness of pavement layers above the subgrade, in.;
MR = Subgrade resilient modulus, psi; and
Ep = Effective modulus of all pavement layers above the subgrade, psi.
Calculate the effective structural number direct from FWD (SNeff_FWD) by the equation:
3_ 0045.0 pTFWDeff EDSN (5)
Calculated modified the effective structural number (SNeff) by equation:
77.0)(58.2 _ FWDeffeff SNLNSN (6)
1.4. Create SNf
Calculate the design subgrade resilient modulus (MR_Des), psi, by:
RDesR MM 4.0_ (7)
Input traffic data ESAL (W18); design psi loss (∆PSI); overlay design reliability (R), %, and
Overlay standard deviation (S0). Calculate the required structural number for future traffic
(SNf) by:
07.8)(log32.2
1
109440.0
5.12.4log
20.0)1(log36.9)(log
_10
19.5
10
1001810
DesR
f
fR
M
SN
PSI
SNSZW
(8)
where,
W18 = number of 18-kip ESAL,
ZR = standard Normal Deviate,
S0 = overlay standard deviation, and
∆PSI = design psi Loss.
1.5. Overlay Design
Input Structural Layer Coefficient of Asphalt Overlay (aOL), Milling Thickness (inches), and
Structural Layer Coefficient of Milled AC (aMil).Calculate the overlay design thickness by
equation:

68
FWD Deflection
Data
Overlay Thickness
Temperature&
Adjustments
Pavement Layer Data
Ep
SNeff_FWD
SNeff
∆PSI, R, S0
SNf
MR
Design MR
Traffic Data (ESAL)
OL
MilMilefff
OL a
DSNSNh
(9)
where,
hOL = required thickness of asphalt overlay, inches;
SNf = required structural number for future traffic;
SNeff = modified effective structural number;
Dmil = milling thickness (in.);
AMil = structural layer coefficient of milled AC; and
aOL = structural layer coefficient of new asphalt overlay.
Output the results of required thickness of asphalt overlay: average and standard deviation
values.
2. LTRC-ODP Flowchart
The flowchart of LTRC-ODP is shown as:
Figure A1
LTRC-ODP flowchart

69
3. Running the LTRC-ODP
3.1. Start LTRC-ODP
Click on the Windows Start
Highlight All Programs→ LTRC→ Overlay Design System, and click once.
The software will verify
Launching Application.
An interface “LTRC Overlay
Design System Application
Version 1.0” will appear.
Then the main interface of
LTRC-ODP opens.
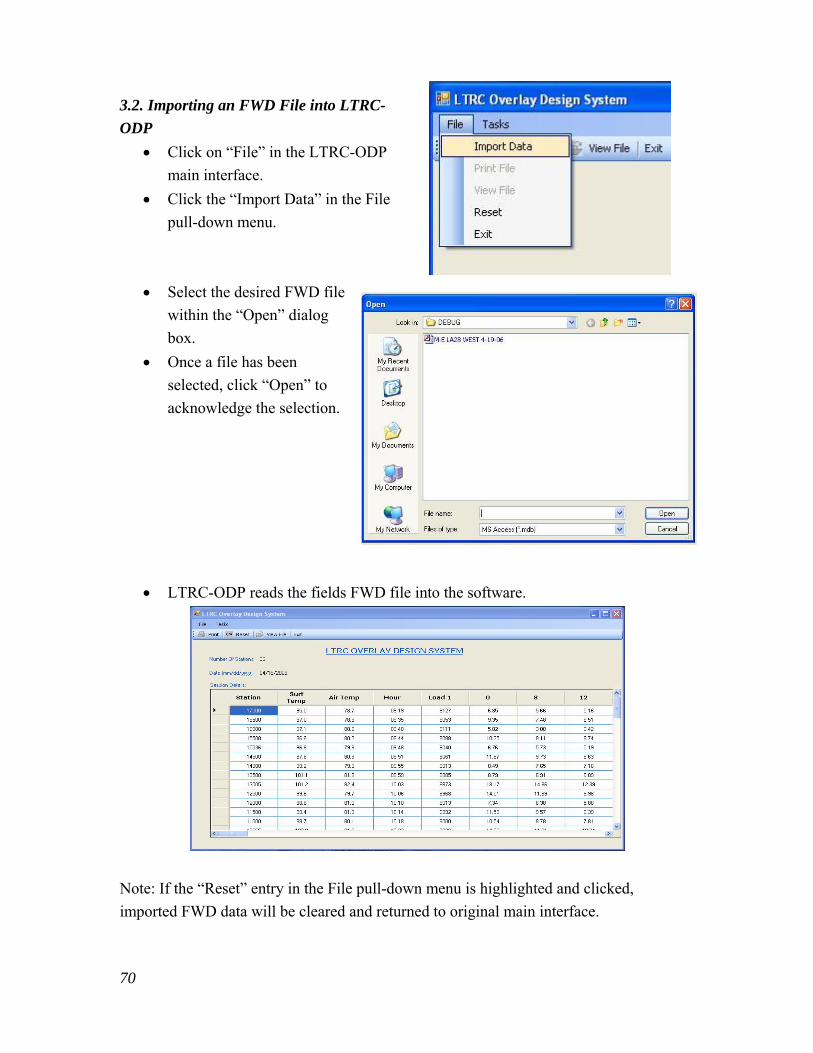
70
3.2. Importing an FWD File into LTRC-
ODP
Click on “File” in the LTRC-ODP
main interface.
Click the “Import Data” in the File
pull-down menu.
Select the desired FWD file
within the “Open” dialog
box.
Once a file has been
selected, click “Open” to
acknowledge the selection.
LTRC-ODP reads the fields FWD file into the software.
Note: If the “Reset” entry in the File pull-down menu is highlighted and clicked,
imported FWD data will be cleared and returned to original main interface.

71
3.3. Input Existing Pavement Structure and Mid-Depth Temperature by Station
Click on “Tasks” in the LTRC-ODP main interface.
Highlight and click “1. Input-Existing Pavement Structure and Mid-Depth
Temperature by Station” in the Tasks pull-down menu.
A Temperature Calibration dialog box will appear.
Input “MID-DEPTH TEMPERATURE (ºF)” for asphalt concrete layers at each
measurement stations.
Note: If the mid-depth temperatures have been incorporated in the FWD
file, then no need to fill in the column of “MID-DEPTH TEMPERATURE (ºF),”
the software will automatically read in the data from the FWD file.
Input “TOTAL ASPHALT THICKNESS (in.)” and “TOTAL PAVEMENT
THICKNESS (in.)” in the dialog box.
Note: At least two stations data are needed. If some stations do not have
measured values, interpolation or extrapolation values will be calculated.
Select the base type from “Granular or Asphalt-Treated Base” or “Cement or
Pozzolanic-Treated Base.”
Once inputs are finished and base type is selected, click “OK.”
If “Reset” is clicked, inputted values and the selection choice will be cleared.

72
3.4. Input Overlay Design Structure Parameters
Click on “Tasks” in the LTRC-ODP main interface.
Highlight and click the “2. Input-Overlay Design Structure Parameters (ESAL’s
Reliability, etc.)” entry in the Tasks pull-down menu.
A “Create NewFlex and Overlay Thickness” dialogue box will appear.
Input the values of Design Traffic, w18 (ESAL); Design PSI Loss (Delta PSI);
Reliability, R (%); Overlay Standard Deviation, So; Structural layer coefficient of
Asphalt overlay; Milling Thickness (Inches); and Structural layer coefficient of
Milled AC.
Once inputs are finished, click “OK.”
If the “Reset” button is clicked, inputted values will be deleted.
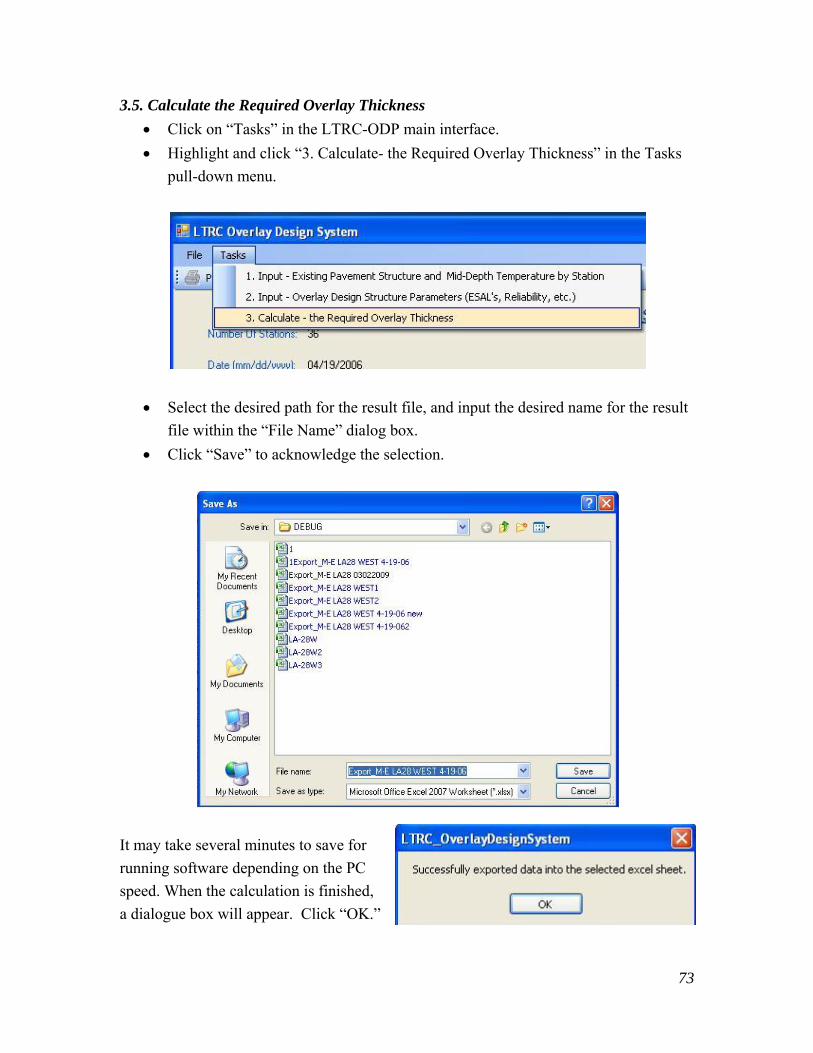
73
3.5. Calculate the Required Overlay Thickness
Click on “Tasks” in the LTRC-ODP main interface.
Highlight and click “3. Calculate- the Required Overlay Thickness” in the Tasks
pull-down menu.
Select the desired path for the result file, and input the desired name for the result
file within the “File Name” dialog box.
Click “Save” to acknowledge the selection.
It may take several minutes to save for
running software depending on the PC
speed. When the calculation is finished,
a dialogue box will appear. Click “OK.”
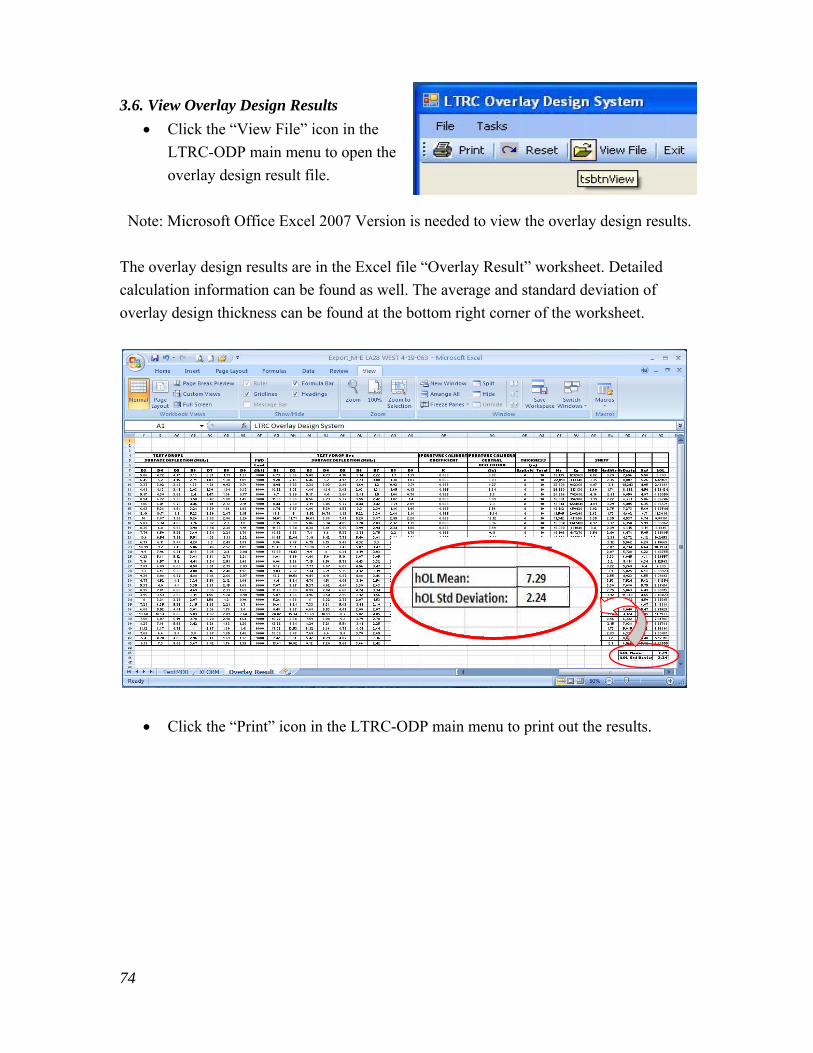
74
3.6. View Overlay Design Results
Click the “View File” icon in the
LTRC-ODP main menu to open the
overlay design result file.
Note: Microsoft Office Excel 2007 Version is needed to view the overlay design results.
The overlay design results are in the Excel file “Overlay Result” worksheet. Detailed
calculation information can be found as well. The average and standard deviation of
overlay design thickness can be found at the bottom right corner of the worksheet.
Click the “Print” icon in the LTRC-ODP main menu to print out the results.