jun matsumoto
TRANSCRIPT
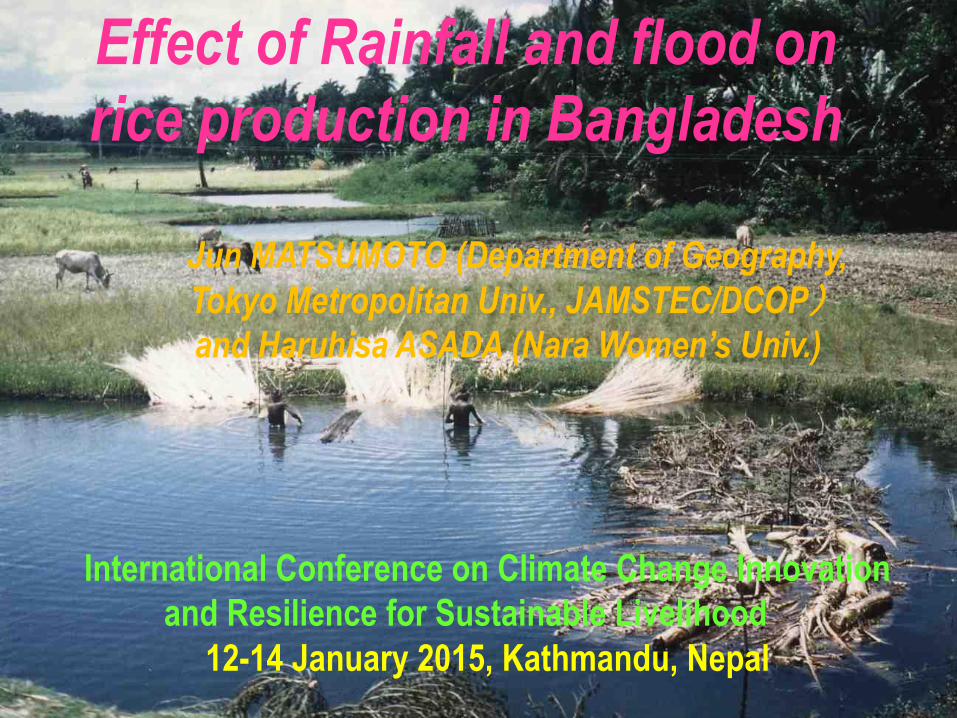
Effect of Rainfall and flood on
rice production in Bangladesh
Jun MATSUMOTO (Department of Geography,
Tokyo Metropolitan Univ., JAMSTEC/DCOP)
and Haruhisa ASADA (Nara Women’s Univ.)
International Conference on Climate Change Innovation
and Resilience for Sustainable Livelihood
12-14 January 2015, Kathmandu, Nepal
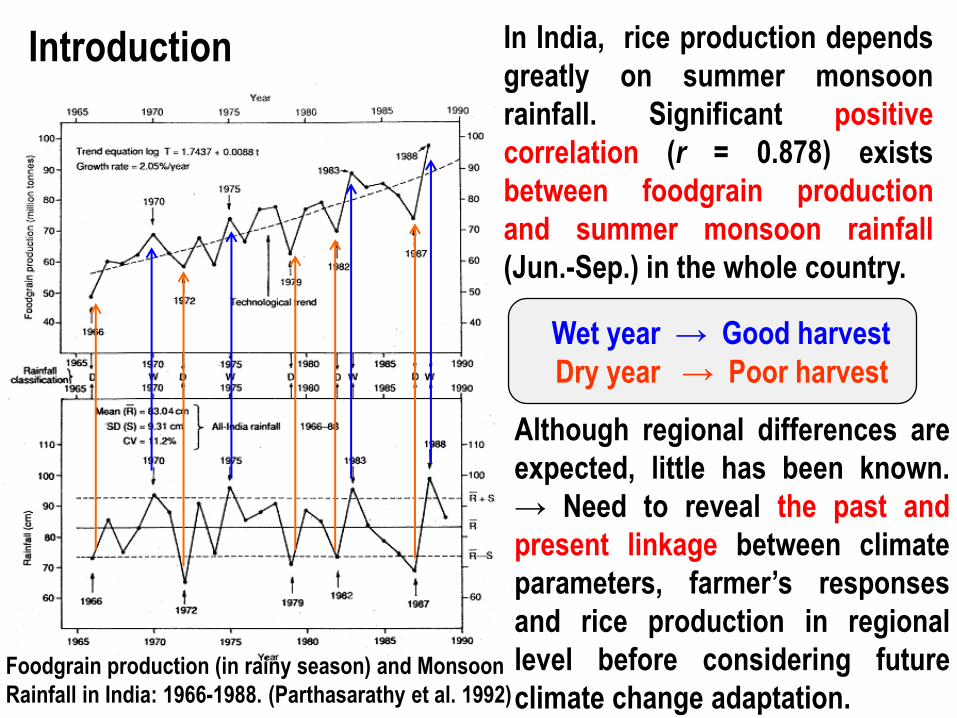
Foodgrain production (in rainy season) and Monsoon
Rainfall in India: 1966-1988. (Parthasarathy et al. 1992)
In India, rice production depends
greatly on summer monsoon
rainfall. Significant positive
correlation (r = 0.878) exists
between foodgrain production
and summer monsoon rainfall
(Jun.-Sep.) in the whole country.
Introduction
Wet year → Good harvest
Dry year → Poor harvest
Although regional differences are
expected, little has been known.
→ Need to reveal the past and
present linkage between climate
parameters, farmer’s responses
and rice production in regional
level before considering future
climate change adaptation.
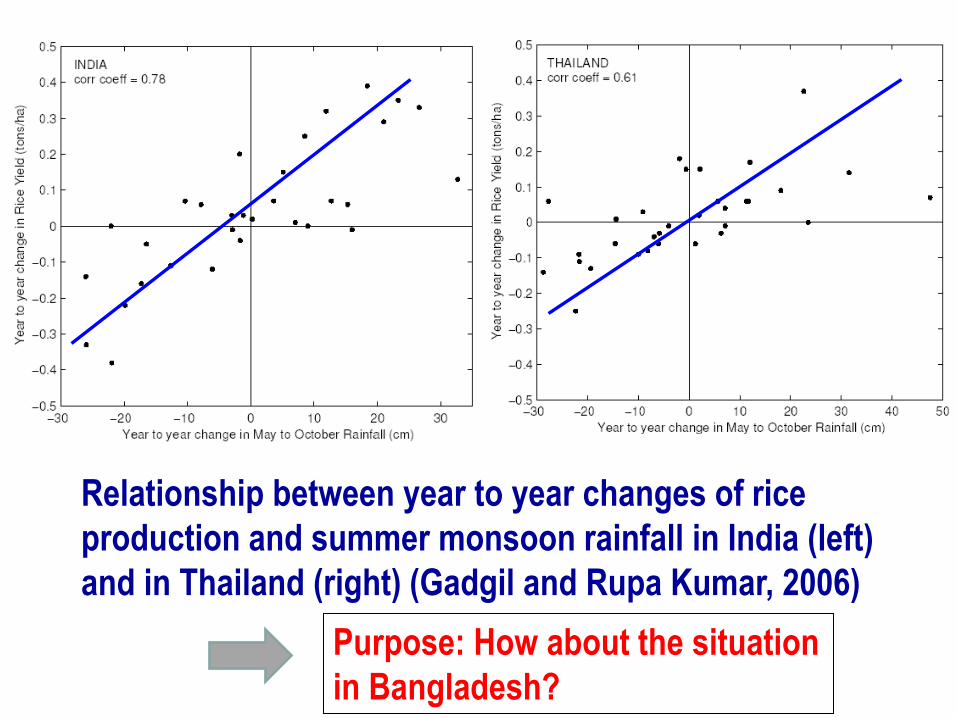
Relationship between year to year changes of rice
production and summer monsoon rainfall in India (left)
and in Thailand (right) (Gadgil and Rupa Kumar, 2006)
Purpose: How about the situation
in Bangladesh?
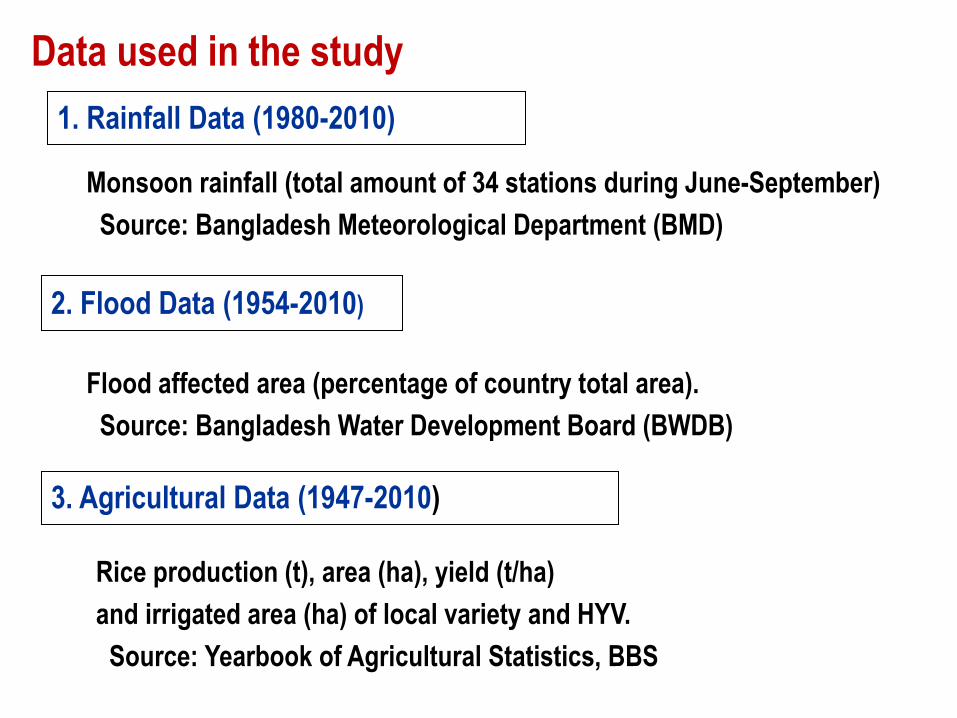
Data used in the study
3. Agricultural Data (1947-2010)
Rice production (t), area (ha), yield (t/ha)
and irrigated area (ha) of local variety and HYV.
Source: Yearbook of Agricultural Statistics, BBS
2. Flood Data (1954-2010)
1. Rainfall Data (1980-2010)
Flood affected area (percentage of country total area).
Source: Bangladesh Water Development Board (BWDB)
Monsoon rainfall (total amount of 34 stations during June-September)
Source: Bangladesh Meteorological Department (BMD)
-20
-15
-10
-5
0
5
10
15
20
25
30000
35000
40000
45000
50000
55000
60000
65000
70000
75000
198
0198
1198
2198
3198
4198
5198
6198
7198
8198
9199
0199
1199
2199
3199
4199
51
99
6199
7199
81
99
9200
0200
12
00
2200
3200
4200
5200
6200
7200
8200
9201
0
Year
to Y
ear
change o
f A
man y
ield
Monsoon r
ain
fall
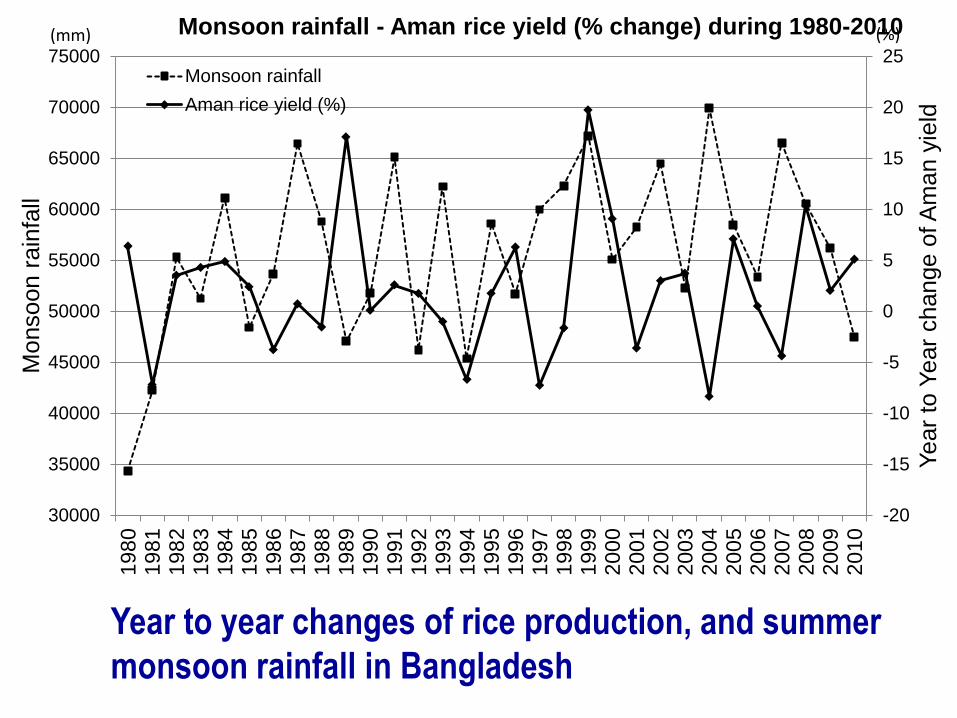
Monsoon rainfall - Aman rice yield (% change) during 1980-2010
Monsoon rainfall
Aman rice yield (%)
(mm) (%)
Year to year changes of rice production, and summer
monsoon rainfall in Bangladesh
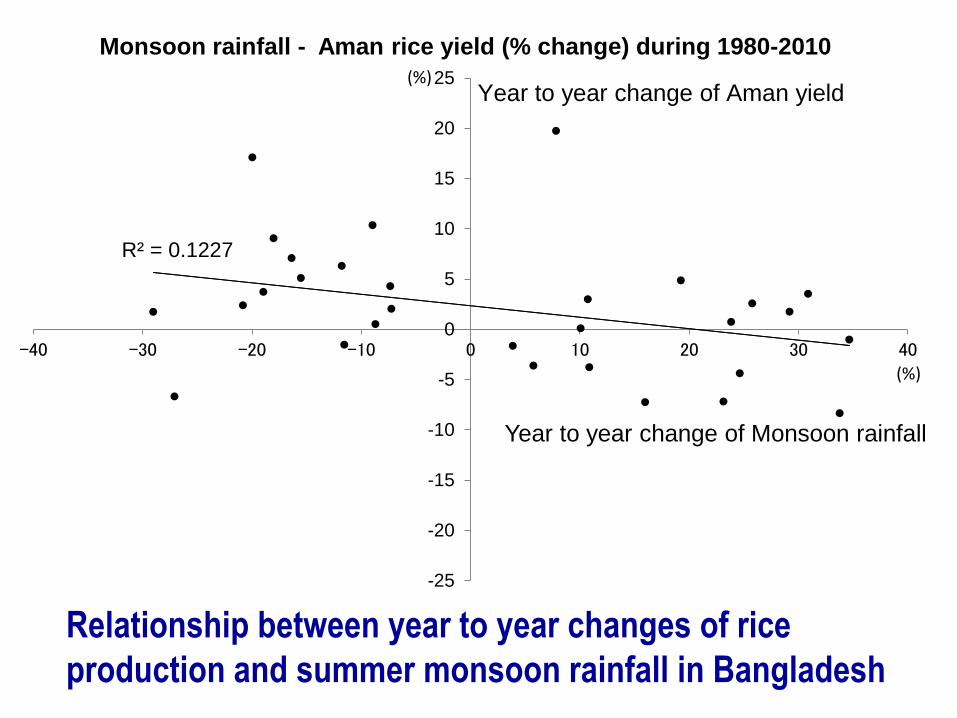
R² = 0.1227
-25
-20
-15
-10
-5
0
5
10
15
20
25
-40 -30 -20 -10 0 10 20 30 40
Year to year change of Monsoon rainfall
Monsoon rainfall - Aman rice yield (% change) during 1980-2010
(%)
(%) Year to year change of Aman yield
Relationship between year to year changes of rice
production and summer monsoon rainfall in Bangladesh
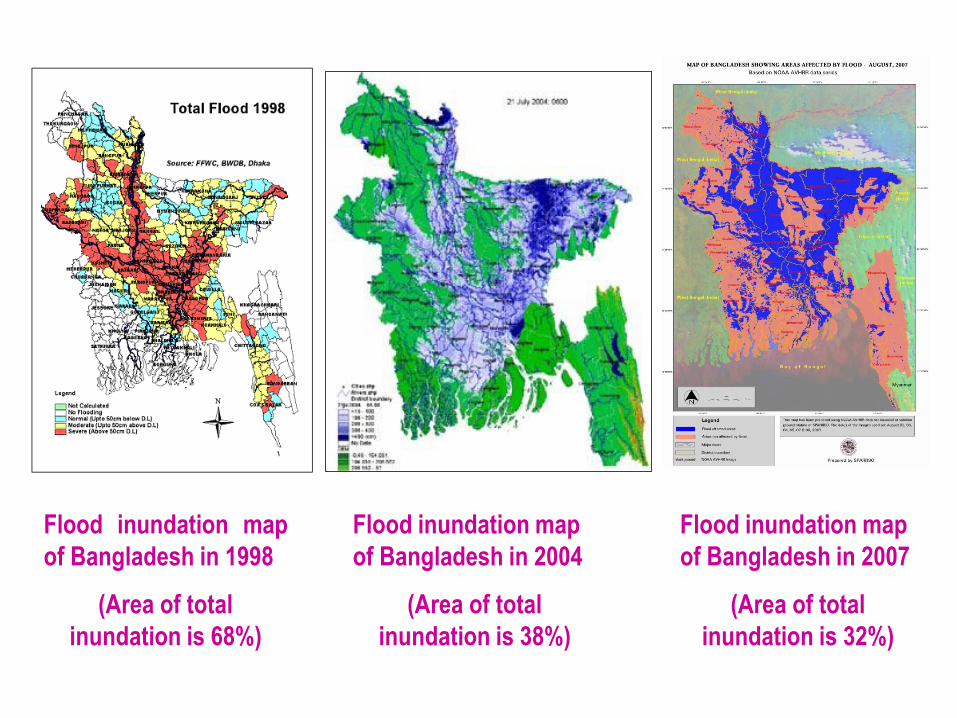
Flood inundation map
of Bangladesh in 1998
(Area of total
inundation is 68%)
Flood inundation map
of Bangladesh in 2004
(Area of total
inundation is 38%)
Flood inundation map
of Bangladesh in 2007
(Area of total
inundation is 32%)
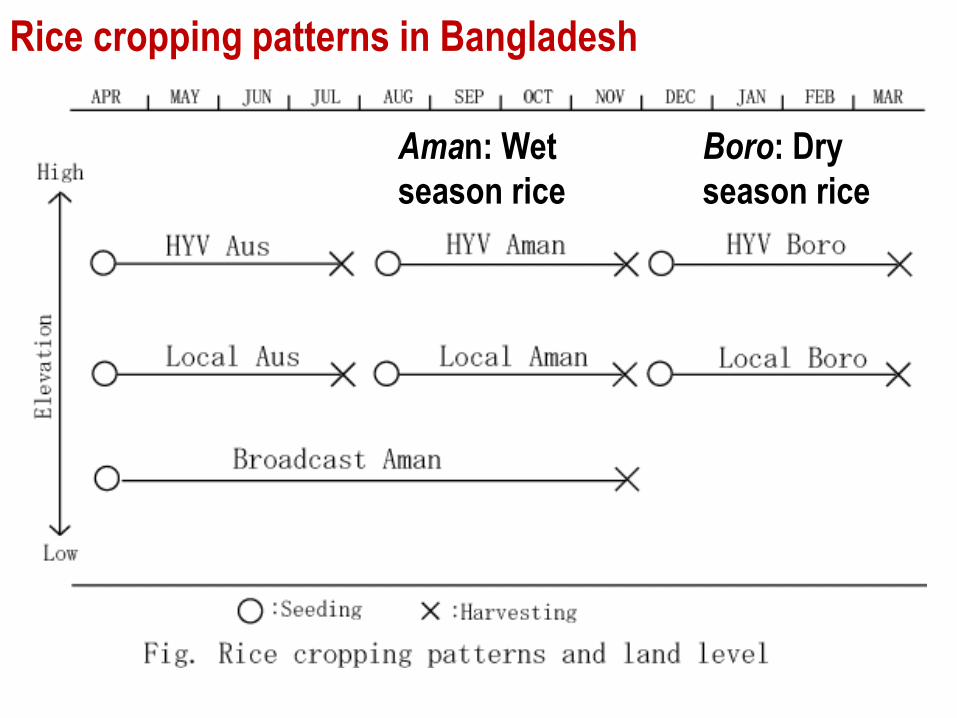
Rice cropping patterns in Bangladesh
Aman: Wet
season rice
Boro: Dry
season rice
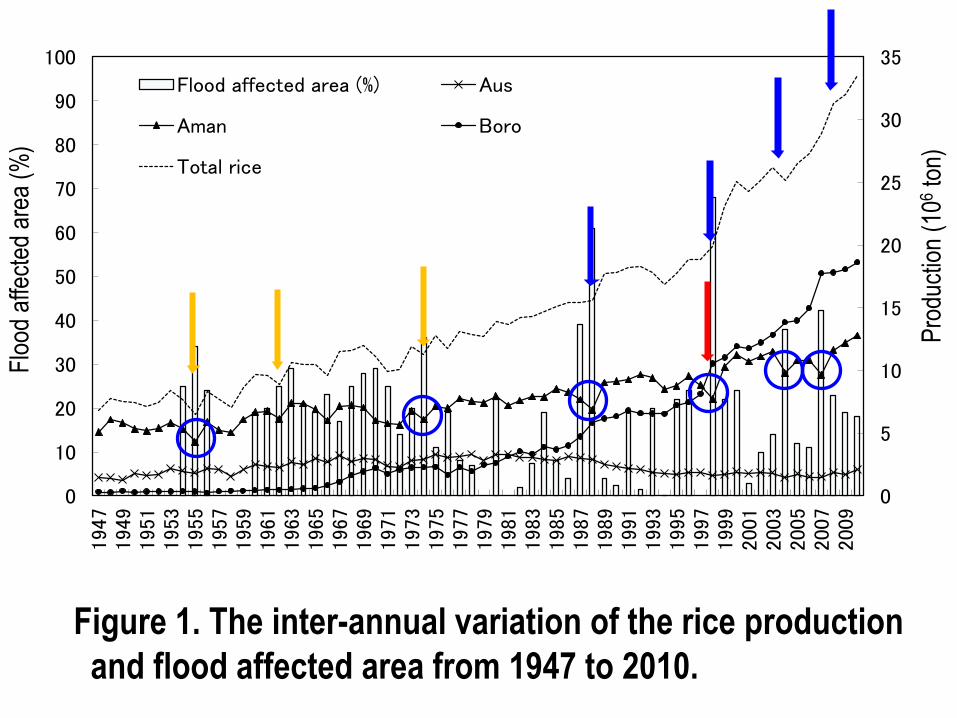
Figure 1. The inter-annual variation of the rice production
and flood affected area from 1947 to 2010.
0
5
10
15
20
25
30
35
0
10
20
30
40
50
60
70
80
90
100
194
7194
9195
1195
3195
5195
7195
9196
1196
3196
5196
7196
9197
1197
3197
5197
7197
9198
1198
3198
5198
7198
9199
1199
3199
5199
7199
9200
1200
3200
5200
7200
9
Pro
duct
ion
(106
ton)
Flo
od a
ffect
ed a
rea
(%)
Flood affected area (%) Aus
Aman Boro
Total rice
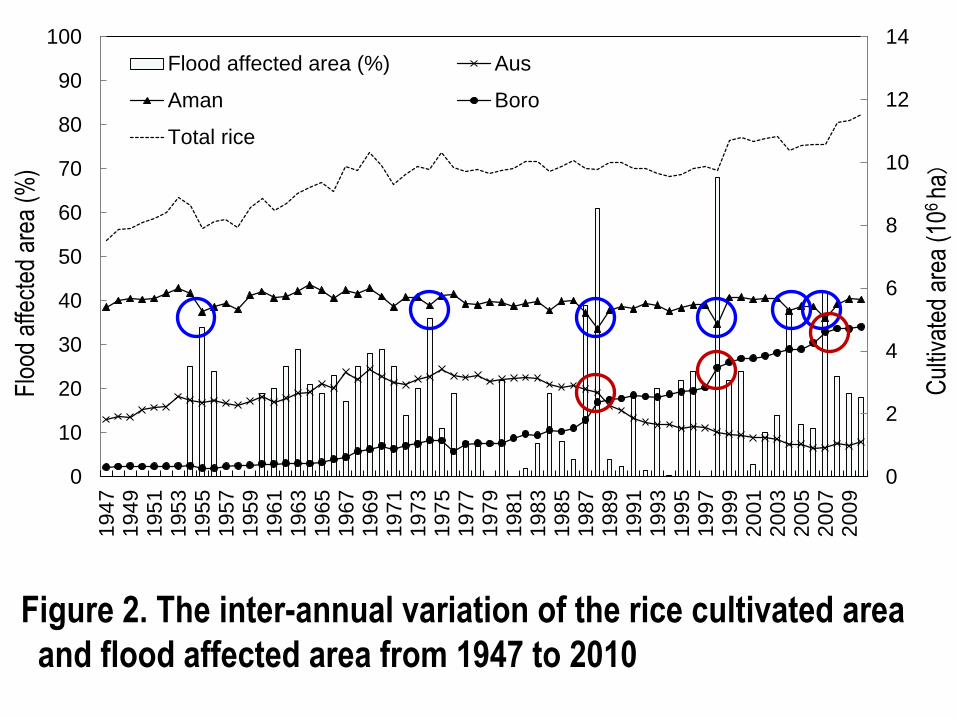
Figure 2. The inter-annual variation of the rice cultivated area
and flood affected area from 1947 to 2010
0
2
4
6
8
10
12
14
0
10
20
30
40
50
60
70
80
90
100
194
7194
9195
1195
3195
5195
7195
9196
1196
3196
5196
7196
9197
1197
3197
5197
7197
9198
1198
3198
5198
7198
9199
11
99
3199
5199
7199
9200
1200
3200
5200
7200
9
Cul
tivat
ed a
rea
(106
ha)
Flo
od a
ffect
ed a
rea
(%)
Flood affected area (%) Aus
Aman Boro
Total rice
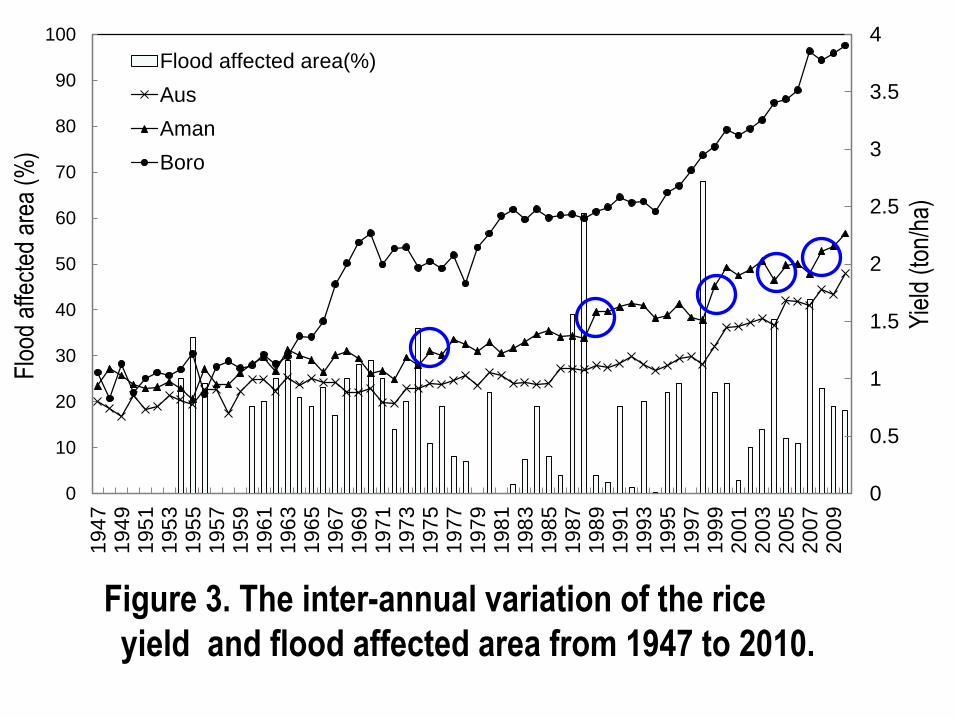
Figure 3. The inter-annual variation of the rice
yield and flood affected area from 1947 to 2010.
0
0.5
1
1.5
2
2.5
3
3.5
4
0
10
20
30
40
50
60
70
80
90
100
194
7194
9195
1195
3195
5195
7195
9196
1196
3196
5196
71
96
9197
1197
3197
5197
7197
9198
1198
3198
5198
7198
9199
1199
31
99
5199
7199
9200
1200
3200
5200
7200
9
Yie
ld (
ton/
ha)
Flo
od a
ffect
ed a
rea
(%)
Flood affected area(%)
Aus
Aman
Boro
0
0.5
1
1.5
2
2.5
3
3.5
4
4.5
5
0
10
20
30
40
50
60
70
80
90
100
196
9
197
1
197
3
197
5
197
7
197
9
198
1
198
3
198
5
19
87
198
9
199
1
199
3
199
5
19
97
199
9
200
1
200
3
200
5
200
7
200
9
Cul
tivat
ed a
nd ir
rigat
ed a
reas
(10
6 ha
)
Flo
od a
ffect
ed a
rea
(%)
Flood affected area(%)
Local Boro
HYV Boro
Irrigated area
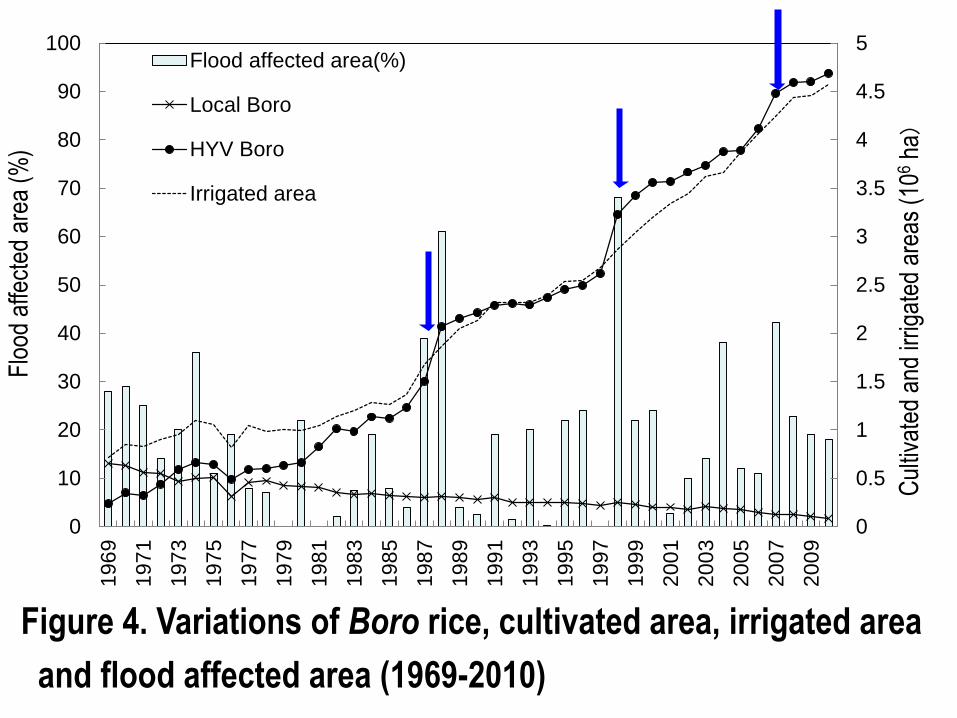
Figure 4. Variations of Boro rice, cultivated area, irrigated area
and flood affected area (1969-2010)

Summary (1)
• Year-to year variations of rice production were poorly
correlated with those of summer monsoon rainfall in
Bangladesh where water from outside is more important
and interesting features associated with severe floods
were found.
• Amon rice production in the severe flood years was
decreased due to the decrease of cultivation area. In the
following dry season, boro rice production was increased
due to the increase of cultivation area. The following wet
season, both aman and boro rice productions were
increased due to the increase of both yield and
cultivation area resulting in the great increase of total rice
productions in the following severe flood years.
Summary (2)
• After severe flood in 1998, rice production in dry
season exceeds that in wet season in Bangladesh,
and it is now becoming the major rice due to the
increase of irrigation. As such Bangladesh rice
cultivation has been developed stepwise to overcome
severe flood damages.
• The results seem to show strong resilience or
effective adaptation strategy of rice production to the
recent frequent flood damages in Bangladesh.
• Floods are not harmful for Bangladesh agriculture in a
long-term perspective?
References
•Asada, H., J. Matsumoto, and R. Rahman. (2005). “Impact
of recent severe floods on rice production in Bangladesh.”
Geographical Review of Japan, 78 (12): 783–793.
•Asada, H. and J. Matsumoto. (2009). “Effects of rainfall
variation on rice production in the Ganges-Brahmaputra
basin.” Climate Research, 38 (3): 249–260.
•Asada, H. (2012). Climate and Rice Cropping Systems in
the Brahmaputra Basin: An Approach to Area Studies on
Bangladesh and Assam. Rubi Enterprise, Dhaka, 115pp.