junbo zhao , life fellow, ieee ieee proof
TRANSCRIPT
IEEE P
roof
IEEE TRANSACTIONS ON POWER SYSTEMS 1
Power System Robust Decentralized Dynamic StateEstimation Based on Multiple Hypothesis Testing
1
2
Junbo Zhao, Student Member, IEEE, and Lamine Mili, Life Fellow, IEEE3
Abstract—This paper proposes a fast and robust unscented4Kalman filter based decentralized dynamic state estimator (DSE)5for power system online monitoring and control. The proposed ro-6bust DSE is able to detect, identify, and suppress three types of7outliers, namely the observation, innovation, and structural out-8liers. Observation outliers refer to the received PMU measure-9ments providing unreliable metered values due to gross errors or10cyber attacks; innovation outliers are typically caused by impul-11sive system process noise, whereas structural outliers are induced12by incorrect parameters of the generators or its associated con-13trollers, such as exciters and speed governors. To enable the fast14estimation of generator states of large-scale power systems in a15decentralized manner, two model decoupling approaches are pre-16sented and compared. It is shown that the generator decoupling17approach presented in this paper achieves higher statistical effi-18ciency than the ones proposed in the literature in the presence of19both small and large measurement noise. To detect and distinguish20three types of outliers, projection statistics based multiple hypoth-21esis testing approach is proposed. Specifically, three hypotheses22corresponding to the occurrence of three types of outliers are as-23sumed by constructing three innovation matrices; these matrices24are made up by time-correlated innovation vectors, and/or pre-25dicted states, and/or measurements; then projection statistics are26applied to each of the innovation matrix and its calculated pro-27jection values are checked by a statistical test to validate the as-28sumed hypothesis. The identified outliers are further suppressed29by a generalized maximum-likelihood-type estimator. Numerical30results carried out on the IEEE 39-bus system demonstrate the31effectiveness and robustness of the proposed method.32
Index Terms—Dynamic state estimation, robust statistics, decen-33tralized estimation, outliers, parameter errors, unscented Kalman34filter, hypothesis testing, projection statistics.35
I. INTRODUCTION36
THE wide-area deployment of phasor measurement units37
(PMUs) on power transmission grids has made possible38
the real-time monitoring and control of power system dynamics.39
However, these functions may not be reliably achieved without40
the development of a fast and robust dynamic state estimator41
(DSE). Indeed, the benefits of using a DSE are an improved42
Manuscript received July 12, 2017; revised November 13, 2017; acceptedDecember 15, 2017. This work was supported by the U.S. National ScienceFoundation under Grant ECCS-1711191. Paper no. TPWRS-01039-2017. (Cor-responding author: Junbo Zhao.)
The authors are with the Bradley Department of Electrical and ComputerEngineering, Virginia Polytechnic Institute and State University, Falls Church,VA 22043 USA (e-mail: [email protected]; [email protected]).
Color versions of one or more of the figures in this paper are available onlineat http://ieeexplore.ieee.org.
Digital Object Identifier 10.1109/TPWRS.2017.2785344
dynamic security assessment scheme and an enhanced local 43
and global system control, to cite a few. 44
To enable the implementation of a power system DSE, several 45
types of Kalman filters are advocated, including the extended 46
Kalman filter (EKF), the unscented Kalman filter (UKF), the 47
ensemble Kalman filter (EnKF) [1]–[8]. In [1]–[3], centralized 48
DSEs using EKF, UKF and EnKF have been proposed. They all 49
require accurate knowledge of the status of each system compo- 50
nent as well as the real-time wide-area PMU measurements. Al- 51
though a global dynamic state estimation may be implemented 52
to achieve global control applications, they may require large 53
computing times that are incompatible for applications in large- 54
scale interconnected power systems. This motivates the devel- 55
opment of decentralized DSE that is implemented at each local 56
synchronous generator, and therefore, is fast to execute [4]– 57
[8]. In [4]–[6], EKF-based DSEs are proposed to estimate the 58
state variables of classical and fourth-order synchronous gen- 59
erators. Since the power system can have strong nonlinearities 60
when operating under stressed conditions or subject to severe 61
disturbances, the first-order Taylor series expansion-based EKF 62
may induce large estimation errors. To circumvent this diffi- 63
culty, UKF-based DSEs are advocated [7], [8]. Note that the 64
model decoupling approach of [4]–[8] to enable the decentral- 65
ized implementation of a DSE is achieved by treating metered 66
generator terminal voltage phasors as inputs and real and re- 67
active power injections or current phasors as outputs. On the 68
other hand, although decentralized DSE is faster to execute 69
compared with the centralized approaches, its global measure- 70
ment redundancy decreases significantly, and as a result, they 71
are more vulnerable to outliers. For a general cyber-physical 72
system that involves dynamic model and measurements, three 73
types of outliers, namely the observation, innovation and struc- 74
tural outliers, are defined in [9]. In power system DSE problem, 75
they are defined specifically as follows: observation outliers 76
refer to the received PMU measurements providing unreliable 77
metered values due to gross errors, cyber attacks, and measure- 78
ment losses; innovation outliers are typically caused by impul- 79
sive system process noise due to unknown disturbances and 80
sudden changes of the model inputs while structural outliers 81
are induced by incorrect parameters of the generators or its as- 82
sociated controllers, such as exciters, speed governors. In the 83
literature [4]–[8], only observation outliers are considered [8], 84
where the normalized innovation vector-based statistical test is 85
advocated to detect them. However, the detection threshold of 86
this approach is system-dependent and sensitive to the change 87
of process and measurement noises, which limits its practical 88
0885-8950 © 2018 IEEE. Personal use is permitted, but republication/redistribution requires IEEE permission.See http://www.ieee.org/publications standards/publications/rights/index.html for more information.
IEEE P
roof
2 IEEE TRANSACTIONS ON POWER SYSTEMS
value. In addition, this approach may fail to work in presence of89
innovation or structural outliers.90
In this paper, a fast and robust unscented Kalman filter-based91
decentralized DSE is proposed. Our robust DSE is able to de-92
tect, identify, and suppress observation, innovation and struc-93
tural outliers. To enable the fast and decentralized estimation94
of generator states of large-scale power systems, two model95
decoupling approaches are presented and compared. The first96
one is achieved by treating the metered generator terminal volt-97
age phasors as inputs and the current phasors and frequency98
as outputs. By contrast, the second one takes measured current99
phasors as inputs while treating voltage phasors and frequency100
as outputs. It is shown that the latter one has higher statistical101
efficiency than the former one in the presence of both small and102
large measurement noise. To detect and distinguish the three103
types of outliers, projection statistics-based multiple hypothe-104
sis testing approach is proposed. Specifically, three hypotheses105
corresponding to the occurrence of three types of outliers are106
tested using three different innovation matrices; these matrices107
are made up of time-correlated innovation vectors and/or pre-108
dicted states and/or measurements; then projection statistics are109
applied to each of the innovation matrix and its calculated pro-110
jection values are checked via a statistical test to validate the111
assumed hypothesis. Then, a generalized maximum-likelihood112
type (GM)-estimator that uses the convex Huber score function113
is advocated to suppress the identified outliers, yielding robust114
state estimates. Finally, the estimation error covariance matrix115
is updated through the total influence function-based approach.116
The remainder of the paper is organized as follows.117
Section II presents the problem formulation. Section III de-118
scribes the proposed robust DSE and Section IV shows and119
analyzes the simulation results. Finally, Section V concludes120
the paper.121
II. PROBLEM FORMULATION122
Decentralized DSE is implemented at each synchronous gen-123
erator using local PMU measurements. Consequently, syn-124
chronous generator model and measurement functions are125
derived first. In this paper, the two-axis model with IEEE-DC1A126
exciter and TGOV1 turbine-governor is considered. It is rep-127
resented by the following differential and algebraic equations128
[10],129
Differential equations of generator:130
T ′do
dE ′q
dt= − E ′
q − (Xd −X ′d) Id + Efd, (1)
T ′qo
dE ′d
dt= − E ′
d −(Xq −X ′
q
)Iq , (2)
dδ
dt= ω − ωs, (3)
2Hωs
dω
dt= TM − Pe −D (ω − ωs) , (4)
Differential equations of IEEE-DC1A exciter:131
TEdEfd
dt= − (KE + SE (Efd))Efd + VR, (5)
132TFdVFdt
= − VF +KF
TEVR − KF
TE(KE + SE (Efd))Efd,
(6)
TAdVRdt
= − VR +KA (Vref − VF − V ) , (7)
Differential equations of TGOV1 turbine-governor: 133
TCHdTMdt
= − TM + PSV , (8)
TSVdPSVdt
= − PSV + PC − 1RD
(ω
ωs− 1
), (9)
Algebraic equations: 134
Vd = V sin (δ − θ) , Vq = V cos (δ − θ) , (10)
Id =E ′q − Vq
X ′d
, Iq =Vd − E ′
d
X ′q
, (11)
Pe = VdId + VqIq ,Qe = −VdIq + VqId, (12)
where T ′do , T ′
qo , TE , TF , TA , TCH and TSV are time constants, 135
in seconds; KE , KF and KA are controller gains; Vref and PC 136
are known control inputs; E ′q , E′
d , Efd , VF , VR , TM and PSV 137
are the q-axis and d-axis transient voltages, field voltage, scaled 138
output of the stabilizing transformer and scaled output of the 139
amplifier, synchronous machine mechanical torque and steam 140
valve position, respectively; Xd , X ′d , Xq and X ′
q are generator 141
parameters; V and θ are the terminal bus voltage magnitude and 142
phase angle, respectively; Pe and Qe are the active and reactive 143
electrical power outputs; Id and Iq are the d and q axis currents, 144
respectively. 145
The above differential and algebraic equations can be put into 146
the following discrete-time state space form: 147
xk = f (xk−1 ,uk ) + wk , (13)
zk = h (xk ) + vk , (14)
where (13) and (14) correspond to (1)–(9) and (10)–(12), re- 148
spectively; xk is the state vector that includes state variables of 149
the synchronous generator, the exciter and the governor; zk is 150
the measurement vector that contains a collection of generator 151
terminal voltage phasors, current phasors and frequency; the 152
noises wk and vk are assumed to be white and with covariance 153
matrices Qk and Rk , respectively; uk represents the input vec- 154
tor; f(·) and h(·) are the vector-valued functions. It is worth 155
pointing out that Vref and PC are the voltage and power ref- 156
erences of the exciter and speed governor, respectively, whose 157
values are adjusted by the local generator operator. Hence, it 158
is reasonable to consider them as the known generator param- 159
eters. Therefore, only local PMU measurements and generator 160
parameters are needed to perform decentralized DSE. 161
Problem statement: the decentralized DSEs proposed in [4]– 162
[8] are vulnerable to outliers and do not achieve high statistical 163
efficiency in presence of thick tailed-probability distribution 164
of the measurement noise. This paper will develop a robust 165
DSE to address these problems while satisfying the follow- 166
ing constraints: given a limited number of PMUs installed at 167
the terminal bus of each generator, i) decouple the generator 168

IEEE P
roof
ZHAO AND MILI: POWER SYSTEM ROBUST DECENTRALIZED DYNAMIC STATE ESTIMATION BASED ON MULTIPLE HYPOTHESIS TESTING 3
from each other to enable the decentralized state estimation169
and thus make the algorithm suitable for large-scale power170
system applications; ii) detect, distinguish and suppress three171
types of outliers; iii) if generator parameter errors occur, lo-172
cate them in order to perform appropriate model calibration and173
validation.174
III. THE PROPOSED ROBUST DECENTRALIZED DSE175
We first present two generator decoupling approaches to en-176
able the decentralized implementation of a DSE. Then, we derive177
the proposed robust decentralized DSE using multiple hypoth-178
esis testing to detect, identify, and suppress the three types of179
outliers.180
A. Generator Model Decoupling Approaches181
Once a disturbance takes place at one point of the power sys-182
tem, synchronous generators will response to it. These responses183
reveal themselves in their terminal voltage or current phasors184
[8]. In other words, a generator is coupled with the power system185
at the point of connection, and its interactions with the rest of the186
system are through the terminal voltage and current phasors. If187
the generator terminal voltage or current phasors are measured188
by PMUs, its responses to the disturbance are captured com-189
pletely and no other system information is required. By doing190
so, a generator model can be decoupled from the rest of the191
system from a DSE prospective and its dynamic states can be192
estimated using only local measurements [8]. Based on the way193
of treating these measurement pairs, two decoupling approaches194
can be achieved: A1) taking the metered terminal voltage pha-195
sors as inputs and the current phasors and frequency as outputs;196
A2) taking the metered terminal current phasors as inputs and197
the voltage phasors and frequency as outputs. It should be noted198
that at the model decoupling stage the generator terminal real199
and reactive powers are not taken as model outputs as advocated200
by several references [4]–[6]. This is due to the fact that gross201
error on single voltage or current phasor will propagate to both202
real and reactive powers, causing a smearing effect. On the other203
hand, as shown by [11], the terminal real and reactive powers,204
when measured, enable a better observability of the generator205
states than either the voltage phasors or the current phasors.206
Therefore, in this paper if both the voltage phasors and current207
phasors are not detected as outliers by the proposed multiple208
hypothesis testing shown in the next section, the terminal real209
and reactive power will be taken as outputs. Otherwise, if any210
voltage phasors and current phasors are flagged as outliers, the211
outputs in the two model decoupling approaches will be pre-212
ferred. We illustrate the two decoupling approaches A1) and213
A2) on an interconnected power system with m synchronous214
generators shown in Fig. 1, and the ith generator is taken as an215
example.216
A1: Taking the current phasor Ii∠φi as known inputs and the217
voltage phasor Vi∠θi and frequency fi as outputs, we have ui =218
[Ii φi ]T , Idi = real[Iiej (φi−δi +π2 ) ], Iqi = Imag[Iiej (φi−δi +
π2 ) ],219
Vdi = E ′di + IqiX
′qi and Vqi = E ′
qi − IdiX′di . Define zi =220
Fig. 1. Interconnected system with m synchronous generators.
[z1 z2 z3 ]T , the measurement function can be expressed as 221
z1 = Vi =√V 2di + V 2
qi + vV i, (15)
z2 = θi = δi − arctan
(VdiVqi
)+ vθi, (16)
z3 = fi = f0(Δωi + 1) + vf i, (17)
where vi = [vV i vθi vf i ]T is the measurement noise vector. 222
A2: Taking the voltage phasor Vi∠θi as known inputs 223
and the current phasor Ii∠φi and frequency fi as outputs, 224
we have ui = [Vi θi ]T , Vdi = Visin(δi − θi), Vqi = Vicos(δi − 225
θi), Idi = (E ′qi − Vqi)/X ′
di and Iqi = (−E′di + Vdi)/X ′
qi . De- 226
fine zi = [z1 z2 z3 ]T , the measurement function can be ex- 227
pressed as 228
z1 = Ii =√I2di + I2
qi + vI i , (18)
z2 = φi = arg(Iqi − jIdi) + δi + vφi, (19)
z3 = fi = f0(Δωi + 1) + vf i, (20)
where vi = [vI i vφi vf i ]T is the measurement noise vector. 229
Note that if our proposed multiple hypothesis testing method 230
does not flag any voltage phasors and current phasors as outliers, 231
we advocate the use of the terminal real and reactive power as 232
outputs. As a result, z1 and z2 of the two decoupling approaches 233
A1) and A2) are rewritten as 234
Pei = VdiIdi + VqiIqi + vP i, (21)
Qei = − VdiIqi + VqiIdi + vQi, (22)
where vi = [vP i vQi vf i ]T is the measurement noise vector. 235
Therefore, the dynamical system model of the ith generator at 236
the time sample k can be expressed as 237
xik = f i
(xik−1 ,u
ik
)+ wi
k , (23)
zik = hi
(xik
)+ vik , (24)
IEEE P
roof
4 IEEE TRANSACTIONS ON POWER SYSTEMS
where wik is the system process noise that includes the noise238
associated with the input vector ui and the model approximation239
error.240
Remark: In a multi-machine power system, a common refer-241
ence is required to define the voltage and rotor angles. Usually,242
the angle of the synchronous machine that has the largest in-243
stalled capacity is used as the reference [10]. Interestingly, North244
American Electric Reliability Corporation (NERC) has a reg-245
ulation rule of installing PMUs to monitor and calibrate the246
machine with the largest generation capacity [12]. Therefore, it247
is not difficult to obtain the reference angle. On the other hand,248
although [7], [13] presented an approach to avoid the defini-249
tion of the reference angle for decentralized DSE by redefining250
the i-th rotor angle with αi = δi − θi , it may suffer from the251
following two drawbacks:252� After the dynamic state estimation, the estimated αi of the253
ith local generator can be used to estimate its internal rotor254
angle through δi = αi + θi . However, θi is always subject255
to noise or even gross errors. As a result, the estimate256
of δi is biased, which may subsequently deteriorate the257
performance of the control actions;258� To damp out inter-area oscillations, the knowledge of just259
a few local generator dynamic state variables may not be260
sufficient. Coordinated controls are usually required and261
in this case, the reference angle can be easily defined at the262
coordination level. Interestingly, this has been implicitly263
shown in [8], [14]. Note that inappropriate local controls264
of inter-area oscillations can produce adverse effects.265
Based on the above discussions, we conclude that the choice266
of a reference angle depends on specific applications.267
B. The Proposed Robust DSE268
The model decoupling approach enables a generator to be269
decoupled from the rest of the system model, which in turn al-270
lows us to rely only on local measurements to estimate the state271
variables of a generator through (23) and (24). To this end, this272
paper presents a robust decentralized UKF-based DSE, termed273
the RDUKFI. Our choice of the UKF as the basic filter is moti-274
vated by the fact that it achieves a more balanced performance275
between computational efficiency and ability to cope with strong276
system nonlinearities than other filters [15]. The RDUKFI con-277
sists of four major steps, namely a batch-mode regression form278
step, an outlier detection and processing step using multiple hy-279
pothesis testing, a robust state estimation step, and a robust error280
covariance matrix updating step. In the following subsections,281
we will discuss them in detail. Note that the index i associated282
with the generator is neglected for simplicity but without loss283
of generality.284
1) Batch-Mode Regression Form: The main idea of the UKF285
is to use a set of chosen deterministic sigma points for statis-286
tical information propagation. For instance, if a state estimate287
with mean xk−1|k−1 ∈ Rn×1 and covariance matrix Σxxk−1|k−1288
is given at time step k-1, its statistics can be captured by 2n289
weighted sigma points defined as [15]290
χjk −1 |k −1
= xk−1|k−1 ±(√
nΣxxk−1|k−1
)
j, (25)
with weights wj = 1/2n, j = 1, ..., 2n. Then, each sigma point 291
is propagated through the nonlinear system process model (23), 292
yielding the following transformed samples 293
χjk |k −1
= f(χj
k −1 |k −1
). (26)
Then, the predicted state xk |k−1 and its covariance matrix 294
Σxxk |k−1 are calculated by the weighted sample mean and sample 295
covariance matrix of the transformed sigma points. Formally, 296
we have 297
xk |k−1 =2n∑
j=1
wjχjk |k −1
,
Σxxk |k−1 =
2n∑
j=1
wj (χjk |k −1
− xk |k−1)(χjk |k −1
− xk |k−1)T + Qk .
To derive the regression model, we will apply statistical 298
linerization [16], [17] to the nonlinear measurement function 299
around xk |k−1 . The main idea of statistical linerization is to 300
approximate the nonlinear function η = g(x) around x sta- 301
tistically with η = Gx + b + ζ, where G = (P xη )T (P xx)−1 ; 302
P xη and P xx are the cross-covariance matrix between x and η, 303
and self-covariance matrix of x, respectively; b = η − Gx and 304
η = g(x); ζ is the statistical linerization error. Following these 305
procedures, the statistical linerization of the nonlinear measure- 306
ment function h(·) around xk |k−1 yields 307
zk = Hk
(xk − xk |k−1
)+ h
(xk |k−1
)+ vk + εk , (27)
where Hk = (Σxzk |k −1
)T (Σxxk |k −1
)−1 ; εk is the statistical lin- 308
earization error term with zero mean and covariance matrix 309
Lk = Σzzk |k −1
− (Σxzk |k −1
)T Σxxk |k−1 Σxz
k |k −1, where 310
Σxxk |k−1 =
2n∑
j=1
wj (χjk |k −1
− xk |k−1)(χjk |k −1
− xk |k−1)T + Qk .
Σzzk |k −1
=2n∑
j=1
wj (zjk |k −1− zk |k−1)(zjk |k −1
− zk |k−1)T + Rk ,
Σxzk |k −1
=2n∑
i=1
wj (χjk |k −1
− xk |k−1)(zjk |k −1− zk |k−1)T ,
and zk |k−1 =∑2n
j=1 wjzjk |k −1
is the predicted measurement vec- 311
tor; zjk |k −1
= h(χjk |k −1
). 312
Define xk |k−1 = xk + Δk , where xk is the true state vector; 313
Δk is the prediction error and E[ΔkΔT
k
]= Σxx
k |k−1 . Then, the 314
equations associated with the state predictions and measurement 315
functions can be reorganized into the following batch-mode 316
regression form: 317
[zk + Hk xk |k−1 − h(xk |k−1)
xk |k−1
]=
[Hk
I
]xk +
[vk + εk
Δk
]
where I is an identity matrix. It can be further rewritten in a 318
compact form as 319
zk = Hkxk + ek , (28)
IEEE P
roof
ZHAO AND MILI: POWER SYSTEM ROBUST DECENTRALIZED DYNAMIC STATE ESTIMATION BASED ON MULTIPLE HYPOTHESIS TESTING 5
and the error covariance matrix of ek is given by320
W k =
[Lk + Rk 0
0 Σxxk |k−1
]
= SkSTk , (29)
where Sk is calculated by the Cholesky decomposition321
technique.322
Note that the state prediction errors of the batch-mode regres-323
sion form should be uncorrelated before the state estimation.324
This can be done by pre-multiplying S−1k on both sides of (28),325
yielding326
S−1k zk = S−1
k Hkxk + S−1k ek , (30)
which is further organized to the compact form given by327
yk = Akxk + ξk , (31)
where E[ξkξk T ] = I .328
2) Outlier Detection and Processing Using Multiple Hy-329
pothesis Testing: As mentioned before, there are three types330
of outliers, i.e., observation, innovation and structural outliers.331
Specifically, observation outliers affect the measurements in332
zk ; innovation outliers are usually caused by unknown sys-333
tem disturbances reflected in the process noise wk or the in-334
correct inputs uk ; structural outliers are induced by param-335
eter errors of the generator, exciter, governor, etc. It should336
be noted that structural outliers will affect all the predicted337
states in this decentralized scheme-based state estimation due338
to the strong dependence among each predicted state. On the339
other hand, if the voltage phasor is taken as input vector and340
has gross errors, it will trigger the following cascading chain:341
V ∠θ → VR → VF → Efd → E ′q → E ′
d , which makes all the342
the predicted states incorrect, yielding innovation outliers. If343
the current phasor is taken as input vector and has gross errors,344
the cascading chain is as follows: I∠φ→ Id → Iq → E ′q →345
E ′d → Efd → VF → VR → Pe → ω → TM , which makes all346
the other predicted states incorrect, yielding innovation outliers.347
Based on the above analysis, it is clear that there are three hy-348
potheses corresponding to each outlier scenario plus one addi-349
tional hypothesis to determine whether there are outliers or not.350
Therefore, we need to validate each hypothesis and determine351
which type of outliers occurs.352
First of all, we need to check the following hypothesis:353
Hypothesis 1 :{H0 : no outliers
H1 : occurrence of outliers. (32)
To this end, we propose to apply the projection statistics (PS)354
at each measurement sample to a 2-dimensional matrix Z1 that355
contains time-correlated samples of the innovations and of the356
predicted state variables. Specifically, we have357
Z1 =[
zk−1 − h(xk−1|k−2) zk − h(xk |k−1)xk−1|k−2 xk |k−1
], (33)
where zk−1 − h(xk−1|k−2) and zk − h(xk |k−1) are the inno-358
vation vectors while xk−1|k−2 and xk |k−1 are the predicted state359
vectors at time instants k-1 and k, respectively. The choice of360
Z1 is motivated by the fact that the innovation vector and the361
predicted state vector are time series samples of power sys- 362
tem responses and have strong temporal correlations. If out- 363
liers occur, this relationship is violated. Thus, by checking this 364
statistical property of the matrix Z1 , we are able to detect 365
outliers. The PS is defined as [9], [17]: 366
PSj = max‖�‖=1
∣∣lTj � −medi
(lTi �
)∣∣
1.4826medκ∣∣lTκ � −medi
(lTi �
)∣∣ , (34)
for i, j, κ = 1, 2, ...,m+ n, where n and m are the number of 367
state variables and measurements taken as outputs, respectively; 368
lTj , lTi and lTκ are the j th, ith and κth row vector of Z1 , respec- 369
tively. The PS values of the predictions and of the innovations 370
are separately calculated. Extensive Monte Carlo simulations 371
revealed that the PS values follow a chi-square distribution 372
with degree of freedom 2. Thus, if we define the set Π1 = 373
{PSi > τ = χ22,0.975 , i = 1, ...,m+ n}, then Hypothesis 1 374
can be rewritten as 375
Hypothesis 1 :{H0 : |Π1 | = 0H1 : 1 ≤ |Π1 | ≤ m+ n
, (35)
where |Π1 | represents the cardinality of the set Π1 ; H1 and H0 376
correspond to occurrence of outliers and no outliers, respec- 377
tively; PSi denotes the ith PS value; τ is determined according 378
to the chi-square distribution at a significance level 97.5%. If 379
H0 is accepted, the robust regression shown in the next sub- 380
section is performed; otherwise, the outlier detection rule is 381
applied and additional procedures are executed to distinguish 382
between them. It is worth pointing out that we can apply the PS 383
to higher dimensional samples, but we found that applying them 384
to 2-dimensional time series data is sufficient to check if the sta- 385
tistical correlations of the innovation vector and the predicted 386
state vector are broken up by outliers. Note that an unnecessary 387
higher dimensional samples will induce more computing burden 388
of the PS algorithm. 389
For any generator with n state variables and m outputs, it 390
is noticed that if the number of bad measurements flagged by 391
the PS is less than m, only observation outliers occur. This is 392
because both innovation and structural outliers will affect all n 393
predicted states, and as a result, all m measurements will be 394
flagged as outliers by the PS. The latter is due to the fact that the 395
predicted states dominate the data of the matrix Z1 ∈ R(m+n)×2 396
and if they are wrong, the PS method breaks down, that is, it 397
identifies all the good measurements that are associated with 398
the innovation vectors as outliers. However in the case where 399
all the mmeasurements are outliers, then all bad measurements 400
will be flagged as outliers as well. Therefore, extra test should 401
be performed to differentiate observation outliers that are in 402
extreme scenario with innovation and structural outliers. To this 403
end, we propose to apply the PS to the matrix Z2 ∈ Rm×3 that 404
includes 3 dimensional consecutive samples, that is, 405
Z2 =[zk−2 zk−1 zk
], (36)
where the received measurements zk−2 and zk−1 must be re- 406
placed by their corresponding estimated values if they have 407
outliers. Our choice of matrix Z2 is motivated by two facts: 408
i) when all m measurements are outliers at time instant k, two- 409
dimensional consecutive samples are not sufficient to detect 410

IEEE P
roof
6 IEEE TRANSACTIONS ON POWER SYSTEMS
outliers due to the lack of redundancy; to address this issue,411
we propose to include one more dimensional sample, which412
increases the global redundancy, and thus, the detectabil-413
ity of the outliers; ii) time-correlated measurements are414
independent from the predicted states and consequently415
innovation/structural outliers do not affect the detection of ob-416
servation outliers. Extensive Monte Carlo simulations showed417
that the PS values calculated from Z2 follow a chi-square dis-418
tribution with degree of freedom 3. Let us now define the set419
Π2 = {PSi > χ23,0.975 , i = 1, ...,m}. The hypothesis 2 used to420
distinguish observation outliers with innovation and structural421
outliers is thus expressed as422
Hypothesis 2 :{H0 : |Π1 | − |Π2 | ≥ 0H1 : |Π2 | = m
, (37)
where hypothesis H1 corresponds to the scenario that all m423
measurements are outliers while H0 corresponds to the occur-424
rence of innovation and/or structural outliers. If the hypothesis425
H1 is confirmed, we propose to replace all m measurements426
with their previous estimated values at time instant k − 1. Then,427
Hypothesis 1 in (35) is tested again and if all newly replaced m428
measurements are flagged as outliers, the occurrence of inno-429
vation and/or structural outliers is double confirmed (note that430
this indicates the possibility of the occurrence of three types431
of outliers simultaneously); otherwise, only the extreme outlier432
scenario associated with the observations presents. To further433
distinguish innovation and structural outliers, we propose to434
replace the system inputs u by its estimated values at the previ-435
ous time instant and obtain new predicted state vector xnewk |k−1 ,436
yielding a new matrix Z3 for outlier detection given by437
Z3 =
[zk−1 − h(xk−1|k−2) zk − h(xnew
k |k−1)xk−1|k−2 xnew
k |k−1
]
, (38)
where zk−1 and zk must be replaced by their estimated values if438
they were detected as outliers in the former steps. Next, define set439
Π3 = {PSi > χ22,0.975 , i = 1, ...,m+ n}, the hypothesis 3 used440
to differentiate innovation and structural outliers is expressed as441
Hypothesis 3 :
{H0 : |Π3 | = 0H1 : |Π3 | = m
. (39)
If the hypothesis H1 is validated, structural outliers exist; oth-442
erwise innovation outliers has occurred.443
After the detection and differentiation of outliers, we propose444
to process them using the following rules:445� Rule 1: if only observation outliers occur, they are down-446
weighted via the weights given by447
�i = min(1, d2/PS2
i
), (40)
where the parameter d is set as 1.5 to yield good statistical448
efficiency at Gaussian distribution and other thick-tailed449
non-Gaussian distributions [2], [17];450� Rule 2: if only innovation outliers occur, the inputs are451
replaced by their estimated values at the last time instant452
and new predicted states are obtained;453� Rule 3: if only structural outliers occur, predicted states are454
replaced by filtered state variables at the last time instant;455
� Rule 4: if both observation and innovation outliers occur, 456
the inputs are replaced by their estimated values at the last 457
time instant and new predicted states are obtained, while 458
observations are processed according to rule 1; if both 459
observation and structural outliers occur, rules 1 and 3 are 460
applied; 461� Rule 5: If three types of outliers occur simultaneously, 462
predicted states are replaced by filtered state variables at 463
the last time instant; bad observations are replaced by their 464
estimated values at the last time instant. 465
Remark 1: By using our multiple hypothesis testing ap- 466
proach, we are able to distinguish between three types of out- 467
liers. If structural outliers occur, additional actions are needed 468
to locate incorrect parameters of the generator, requiring that a 469
model calibration need to be executed. This will be proposed as 470
our future work. 471
Remark 2: The more types of outliers are present, the more 472
time is required for executing the multiple hypothesis testing 473
rules. However, the computing time is not prohibitively large 474
for our robust DSE as the decentralized scheme enables the 475
outlier detection and processing to be quickly executed at each 476
local generator. This will be shown in the simulation results 477
section. 478
3) Robust Regression: After the outlier detection and pro- 479
cessing, corresponding weights �i, i = 1, ...,m+ n are as- 480
signed to the measurements and the predicted states via (40); 481
then the robust regression is performed by using a robust GM- 482
estimator that minimizes the following objective function: 483
J (xk ) =m+n∑
i=1
�2i ρ (rSi ) , (41)
where rSi = ri/s�i is the standardized residual; ri = yi − 484
aTi x is the residual, where aTi is the ith row vector of the 485
matrix Ak ; s = 1.4826 · bm · mediani |ri | is the robust scale es- 486
timate; bm is a correction factor; ρ(·) is the convex Huber-ρ 487
function [2]. 488
To minimize (41), the following necessary condition must be 489
satisfied 490
∂J (xk )∂xk
=l∑
i=1
−�iais
ψ (rSi ) = 0, (42)
where ψ (rSi ) = ∂ρ (rSi )/∂rSi . By dividing and multiplying 491
the standardized residual rSi to both sides of (42) and putting it 492
in a matrix form, we get 493
ATk Λ (yk − Akxk ) = 0, (43)
where Λ = diag(q (rSi )) and q (rSi ) = ψ (rSi )/rSi . By using 494
the IRLS algorithm [9], the state estimates at the j iteration can 495
be calculated 496
Δx(j+1)k |k =
(ATk Λ(j )Ak
)−1ATk Λ(j )yk , (44)
where Δx(j+1)k |k = x
(j+1)k |k − x
(j )k |k . The algorithm converges 497
when∥∥∥Δx
(j+1)k |k
∥∥∥∞
≤ 10−2 . 498
IEEE P
roof
ZHAO AND MILI: POWER SYSTEM ROBUST DECENTRALIZED DYNAMIC STATE ESTIMATION BASED ON MULTIPLE HYPOTHESIS TESTING 7
4) Update the Error Covariance Matrix: Following our pre-499
vious work, the estimation error covariance matrix Σxxk |k is500
updated using the total influence function-based approach [2].501
Formally, we have502
Σxxk |k =
EF [ψ 2 (rS i )]{EF [ψ ′(rS i )]}2
(ATk Ak
)−1(ATk Q�Ak
)(ATk Ak
)−1
(45)
where Q� = diag(�2i
).503
IV. NUMERICAL RESULTS504
Extensive simulation results of several scenarios are carried505
out on the IEEE 39-bus system to test the effectiveness and ro-506
bustness of the proposed robust DSE. In the case studies, Line507
15–16 is tripped at t = 0.5 s to simulate system disturbance.508
The time-domain simulation results are taken as the true values.509
The collections of simulated voltage phasor, current phasor and510
frequency at each generator’s terminal bus are treated as PMU511
measurements. A random Gaussian variable with zero mean and512
covariance matrix equal to 10−6I is assumed for system process513
noise. The generator model assumed for transient simulation is514
the detailed two-axis generator model, whose parameter values515
are taken from [18]. The maximum iteration of the IRLS algo-516
rithm is 20. The break point of the Huber cost function is set to 2.517
The root-mean-squared error (RMSE) of all estimated generator518
state variables is used as the overall performance index while the519
estimated rotor angle, rotor speed, d- and q-axis voltages of Gen-520
erator 5 are taken for illustration due to the limitation of space.521
When the metered generator terminal voltage phasor is used as522
model input while the current phasor and frequency are treated523
as outputs/measurements, the decentralized DSE approach will524
be called the DUKFV. By contrast, when the metered generator525
terminal current phasor is used as model input while the voltage526
phasor and frequency are treated as outputs/measurements, the527
decentralized DSE approach will be called the DUKFI. Its ro-528
bust version, which is our proposed robust DSE, will be termed529
the RDUKFI. The choice of developing a robust version of the530
DUKFI instead of the DUKFV is motivated by the fact that the531
former achieves much higher statistical efficiency than the latter532
in the absence of outliers regardless of the level of measurement533
noise. This is confirmed by the results shown in Figs. 2 and534
3. In other words, if the DUKFI is made robust against out-535
liers, it will outperform the robust DUKFV in presence of both536
measurement noise and outliers.537
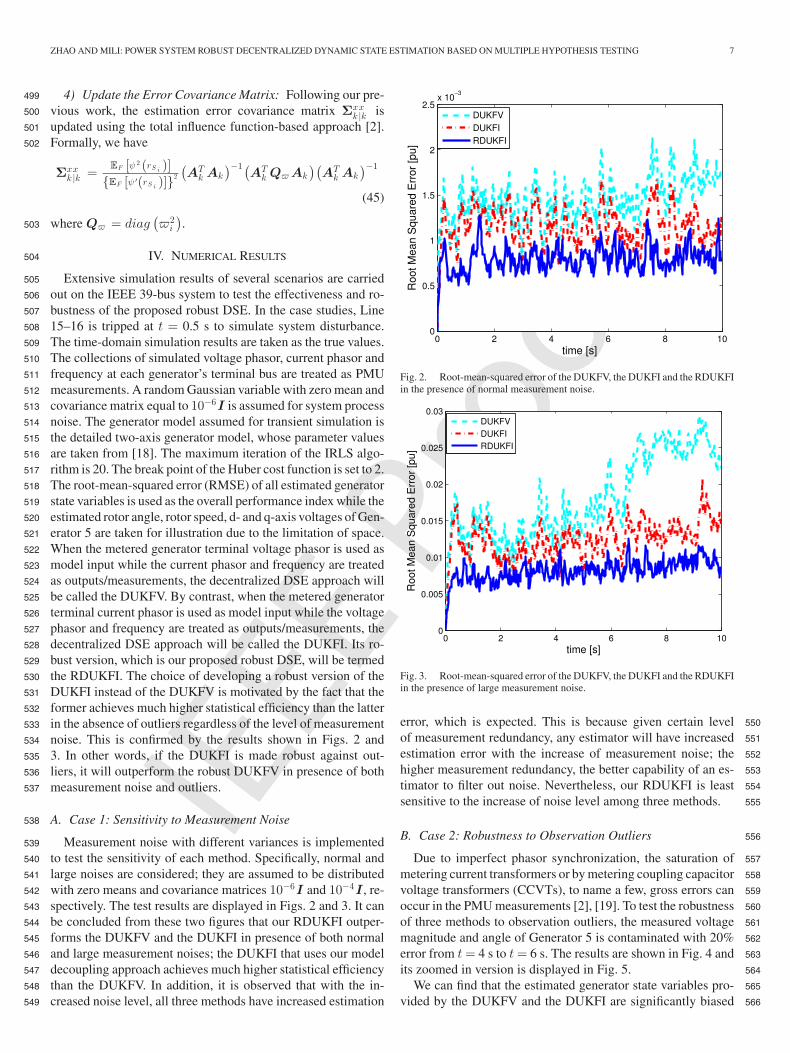
A. Case 1: Sensitivity to Measurement Noise538
Measurement noise with different variances is implemented539
to test the sensitivity of each method. Specifically, normal and540
large noises are considered; they are assumed to be distributed541
with zero means and covariance matrices 10−6I and 10−4I , re-542
spectively. The test results are displayed in Figs. 2 and 3. It can543
be concluded from these two figures that our RDUKFI outper-544
forms the DUKFV and the DUKFI in presence of both normal545
and large measurement noises; the DUKFI that uses our model546
decoupling approach achieves much higher statistical efficiency547
than the DUKFV. In addition, it is observed that with the in-548
creased noise level, all three methods have increased estimation549
Fig. 2. Root-mean-squared error of the DUKFV, the DUKFI and the RDUKFIin the presence of normal measurement noise.
Fig. 3. Root-mean-squared error of the DUKFV, the DUKFI and the RDUKFIin the presence of large measurement noise.
error, which is expected. This is because given certain level 550
of measurement redundancy, any estimator will have increased 551
estimation error with the increase of measurement noise; the 552
higher measurement redundancy, the better capability of an es- 553
timator to filter out noise. Nevertheless, our RDUKFI is least 554
sensitive to the increase of noise level among three methods. 555
B. Case 2: Robustness to Observation Outliers 556
Due to imperfect phasor synchronization, the saturation of 557
metering current transformers or by metering coupling capacitor 558
voltage transformers (CCVTs), to name a few, gross errors can 559
occur in the PMU measurements [2], [19]. To test the robustness 560
of three methods to observation outliers, the measured voltage 561
magnitude and angle of Generator 5 is contaminated with 20% 562
error from t= 4 s to t= 6 s. The results are shown in Fig. 4 and 563
its zoomed in version is displayed in Fig. 5. 564
We can find that the estimated generator state variables pro- 565
vided by the DUKFV and the DUKFI are significantly biased 566
IEEE P
roof
8 IEEE TRANSACTIONS ON POWER SYSTEMS
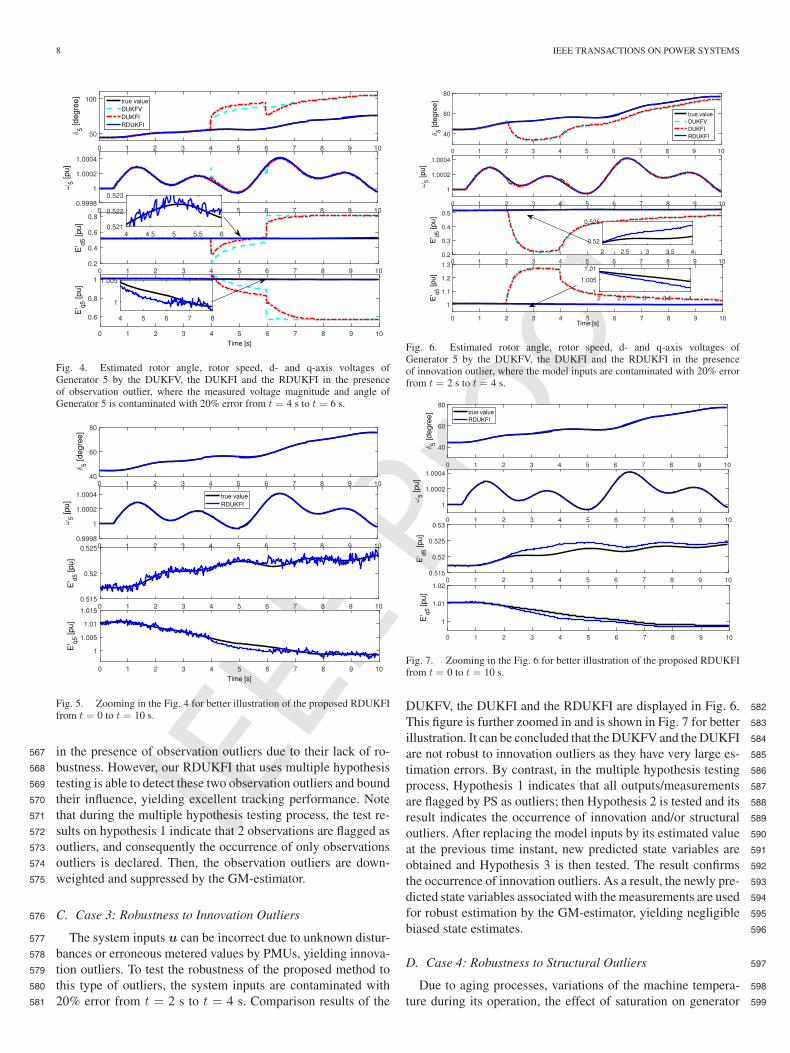
Fig. 4. Estimated rotor angle, rotor speed, d- and q-axis voltages ofGenerator 5 by the DUKFV, the DUKFI and the RDUKFI in the presenceof observation outlier, where the measured voltage magnitude and angle ofGenerator 5 is contaminated with 20% error from t = 4 s to t = 6 s.
Fig. 5. Zooming in the Fig. 4 for better illustration of the proposed RDUKFIfrom t = 0 to t = 10 s.
in the presence of observation outliers due to their lack of ro-567
bustness. However, our RDUKFI that uses multiple hypothesis568
testing is able to detect these two observation outliers and bound569
their influence, yielding excellent tracking performance. Note570
that during the multiple hypothesis testing process, the test re-571
sults on hypothesis 1 indicate that 2 observations are flagged as572
outliers, and consequently the occurrence of only observations573
outliers is declared. Then, the observation outliers are down-574
weighted and suppressed by the GM-estimator.575
C. Case 3: Robustness to Innovation Outliers576
The system inputs u can be incorrect due to unknown distur-577
bances or erroneous metered values by PMUs, yielding innova-578
tion outliers. To test the robustness of the proposed method to579
this type of outliers, the system inputs are contaminated with580
20% error from t = 2 s to t = 4 s. Comparison results of the581
Fig. 6. Estimated rotor angle, rotor speed, d- and q-axis voltages ofGenerator 5 by the DUKFV, the DUKFI and the RDUKFI in the presenceof innovation outlier, where the model inputs are contaminated with 20% errorfrom t = 2 s to t = 4 s.
Fig. 7. Zooming in the Fig. 6 for better illustration of the proposed RDUKFIfrom t = 0 to t = 10 s.
DUKFV, the DUKFI and the RDUKFI are displayed in Fig. 6. 582
This figure is further zoomed in and is shown in Fig. 7 for better 583
illustration. It can be concluded that the DUKFV and the DUKFI 584
are not robust to innovation outliers as they have very large es- 585
timation errors. By contrast, in the multiple hypothesis testing 586
process, Hypothesis 1 indicates that all outputs/measurements 587
are flagged by PS as outliers; then Hypothesis 2 is tested and its 588
result indicates the occurrence of innovation and/or structural 589
outliers. After replacing the model inputs by its estimated value 590
at the previous time instant, new predicted state variables are 591
obtained and Hypothesis 3 is then tested. The result confirms 592
the occurrence of innovation outliers. As a result, the newly pre- 593
dicted state variables associated with the measurements are used 594
for robust estimation by the GM-estimator, yielding negligible 595
biased state estimates. 596
D. Case 4: Robustness to Structural Outliers 597
Due to aging processes, variations of the machine tempera- 598
ture during its operation, the effect of saturation on generator 599
IEEE P
roof
ZHAO AND MILI: POWER SYSTEM ROBUST DECENTRALIZED DYNAMIC STATE ESTIMATION BASED ON MULTIPLE HYPOTHESIS TESTING 9
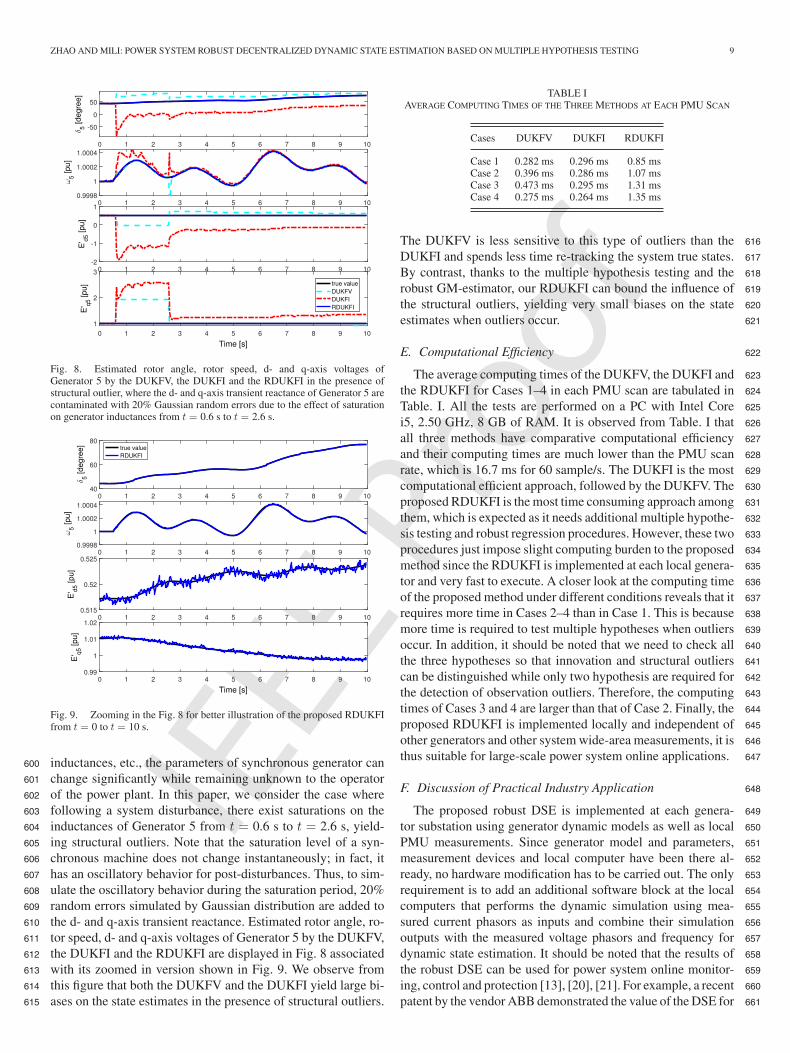
Fig. 8. Estimated rotor angle, rotor speed, d- and q-axis voltages ofGenerator 5 by the DUKFV, the DUKFI and the RDUKFI in the presence ofstructural outlier, where the d- and q-axis transient reactance of Generator 5 arecontaminated with 20% Gaussian random errors due to the effect of saturationon generator inductances from t = 0.6 s to t = 2.6 s.
Fig. 9. Zooming in the Fig. 8 for better illustration of the proposed RDUKFIfrom t = 0 to t = 10 s.
inductances, etc., the parameters of synchronous generator can600
change significantly while remaining unknown to the operator601
of the power plant. In this paper, we consider the case where602
following a system disturbance, there exist saturations on the603
inductances of Generator 5 from t = 0.6 s to t = 2.6 s, yield-604
ing structural outliers. Note that the saturation level of a syn-605
chronous machine does not change instantaneously; in fact, it606
has an oscillatory behavior for post-disturbances. Thus, to sim-607
ulate the oscillatory behavior during the saturation period, 20%608
random errors simulated by Gaussian distribution are added to609
the d- and q-axis transient reactance. Estimated rotor angle, ro-610
tor speed, d- and q-axis voltages of Generator 5 by the DUKFV,611
the DUKFI and the RDUKFI are displayed in Fig. 8 associated612
with its zoomed in version shown in Fig. 9. We observe from613
this figure that both the DUKFV and the DUKFI yield large bi-614
ases on the state estimates in the presence of structural outliers.615
TABLE IAVERAGE COMPUTING TIMES OF THE THREE METHODS AT EACH PMU SCAN
Cases DUKFV DUKFI RDUKFI
Case 1 0.282 ms 0.296 ms 0.85 msCase 2 0.396 ms 0.286 ms 1.07 msCase 3 0.473 ms 0.295 ms 1.31 msCase 4 0.275 ms 0.264 ms 1.35 ms
The DUKFV is less sensitive to this type of outliers than the 616
DUKFI and spends less time re-tracking the system true states. 617
By contrast, thanks to the multiple hypothesis testing and the 618
robust GM-estimator, our RDUKFI can bound the influence of 619
the structural outliers, yielding very small biases on the state 620
estimates when outliers occur. 621
E. Computational Efficiency 622
The average computing times of the DUKFV, the DUKFI and 623
the RDUKFI for Cases 1–4 in each PMU scan are tabulated in 624
Table. I. All the tests are performed on a PC with Intel Core 625
i5, 2.50 GHz, 8 GB of RAM. It is observed from Table. I that 626
all three methods have comparative computational efficiency 627
and their computing times are much lower than the PMU scan 628
rate, which is 16.7 ms for 60 sample/s. The DUKFI is the most 629
computational efficient approach, followed by the DUKFV. The 630
proposed RDUKFI is the most time consuming approach among 631
them, which is expected as it needs additional multiple hypothe- 632
sis testing and robust regression procedures. However, these two 633
procedures just impose slight computing burden to the proposed 634
method since the RDUKFI is implemented at each local genera- 635
tor and very fast to execute. A closer look at the computing time 636
of the proposed method under different conditions reveals that it 637
requires more time in Cases 2–4 than in Case 1. This is because 638
more time is required to test multiple hypotheses when outliers 639
occur. In addition, it should be noted that we need to check all 640
the three hypotheses so that innovation and structural outliers 641
can be distinguished while only two hypothesis are required for 642
the detection of observation outliers. Therefore, the computing 643
times of Cases 3 and 4 are larger than that of Case 2. Finally, the 644
proposed RDUKFI is implemented locally and independent of 645
other generators and other system wide-area measurements, it is 646
thus suitable for large-scale power system online applications. 647
F. Discussion of Practical Industry Application 648
The proposed robust DSE is implemented at each genera- 649
tor substation using generator dynamic models as well as local 650
PMU measurements. Since generator model and parameters, 651
measurement devices and local computer have been there al- 652
ready, no hardware modification has to be carried out. The only 653
requirement is to add an additional software block at the local 654
computers that performs the dynamic simulation using mea- 655
sured current phasors as inputs and combine their simulation 656
outputs with the measured voltage phasors and frequency for 657
dynamic state estimation. It should be noted that the results of 658
the robust DSE can be used for power system online monitor- 659
ing, control and protection [13], [20], [21]. For example, a recent 660
patent by the vendor ABB demonstrated the value of the DSE for 661

IEEE P
roof
10 IEEE TRANSACTIONS ON POWER SYSTEMS
online monitoring [20]. The effectiveness of the DSE assisted662
adaptive protection scheme has been tested in real system [21].663
Thus, although some costs are needed to change the existing664
code for the DSE implementation, its benefits for system online665
monitoring, control, and protection are promising.666
V. CONCLUSION AND FUTURE WORK667
In this paper, a fast RDUKFI-based decentralized DSE is668
proposed. It is implemented at each local generator and inde-669
pendent of the other generators, system parameters, and thus670
suitable for large-scale power system online applications. Fur-671
thermore, our RDUKFI is able to detect, distinguish and sup-672
press the observation, innovation and structural outliers while673
achieving high statistical efficiency in presence of both normal674
and large measurement noise. We propose projection statistics-675
based multiple hypothesis testing approach for outlier detection676
and processing. The identified outliers are suppressed by a gen-677
eralized maximum-likelihood type (GM)-estimator. Numerical678
results carried out on the IEEE 39-bus system demonstrate the679
effectiveness and robustness of the proposed method.680
It should be noted that the proposed robust DSE is general681
in that it can be easily extended to estimate the dynamic states682
of other power system components, such as dynamic loads,683
wind generators and various types of higher order exciters. In684
addition, the 9th-order two-axis model with DC1A exciter is685
one of the recommended models by IEEE for transient stability686
analysis [22]. Thus, we believe that our results have practical687
meanings. The test of the proposed DSE for more detailed gener-688
ator models will be carried out as future work. Furthermore, the689
proposed multiple hypothesis testing approach will be extended690
to locate the specific erroneous parameter values for parameter691
calibration.692
REFERENCES693
[1] Z. Huang, K. Schneider, and J. Nieplocha, “Feasibility studies of applying694Kalman filter techniques to power system dynamic state estimation,” in695Proc. 8th Int. Power Eng. Conf., Singapore, Dec. 2007, pp. 376–382.696
[2] J. B. Zhao, M. Netto, and L. Mili, “A robust iterated extended Kalman697filter for power system dynamic state estimation,” IEEE Trans. Power698Syst., vol. 32, no. 4, pp. 3205–3216, Jul. 2017.699
[3] N. Zhou, D. Meng, Z. Huang, and G. Welch, “Dynamic state estimation700of a synchronous machine using PMU data: A comparative study,” IEEE701Trans. Smart Grid., vol. 6, no. 1, pp. 450–460, Jan. 2015.702
[4] Z. Huang, P. Du, D. Losterev, and B. Yang, “Application of extended703Kalman filter techniques for dynamic model parameter calibration,” Proc.704IEEE Power Energy Gen. Meeting, 2009, pp. 1–6.705
[5] L. Fan and Y. Wehbe, “Extended Kalman filtering based real-time dynamic706state and parameter estimation using PMU data,” Elect. Power Syst. Res.,707vol. 103, pp. 168–177, Oct. 2013.708
[6] E. Ghahremani and I. Kamwa, “Local and wide-area PMU-based decen-709tralized dynamic state estimation in multi-machine power systems,” IEEE710Trans. Power Syst., vol. 31, no. 1, pp. 547–562, Jan. 2016.711
[7] G. Anagnostou and B. C. Pal, “Derivative-free Kalman filtering based712approaches to dynamic state estimation for power systems with unknown713inputs,” IEEE Trans. Power Syst., vol. 33, no, 1, pp. 116–130, Jan. 2018.714
[8] A. K. Singh and B. C. Pal, “Decentralized dynamic state estimation in715power systems using unscented transformation,” IEEE Trans. Power Syst.,716vol. 29, no. 2, pp. 794–804, Mar. 2014.717
[9] M. Gandhi and L. Mili, “Robust Kalman filter based on a general-718ized maximum-likelihood-type estimator,” IEEE Trans. Signal Process.,719vol. 58, no. 5, pp. 2509–2520, May 2010.720
[10] P. Sauer and M. A. Pai. Power System Dynamics and Stability. Englewood721Cliffs, NJ, USA: Prentice-Hall, 1997.Q1 722
[11] A. Rouhani and A. Abur, “Observability analysis for dynamic state esti- 723mation of synchronous machines,” IEEE Trans. Power Syst., vol. 32, no. 4, 724pp. 3168–3175, Jul. 2017. 725
[12] NERC Reliability Guideline, “PMU placement and installation,” NERC, 726Atlanta, GA, USA, 2016. 727
[13] A. K. Singh and B. C. Pal, “Decentralized control of oscillatory dynamics 728in power systems using an extended LQR,” IEEE Trans. Power Syst., 729vol. 31, no. 3, pp. 1715–1728, May 2016. 730
[14] J. B. Zhao, L. Mili, and F. Milano, “Robust frequency divider for power 731system online monitoring and controls,” IEEE Trans. Power Syst., to be 732published. Q2733
[15] S. Julier and J. K. Uhlmann, “Unscented filtering and nonlinear estima- 734tion,” Proc. IEEE, vol. 92, no. 3, pp. 401–422, Mar. 2004. 735
[16] T. Lefebvre, H. Bruyninckx, and J. De Schutter, “Comment on “a new 736method for the nonlinear transformation of means and covariances in 737filters and estimators,” IEEE Trans. Automat. Control, vol. 47, no. 8, 738pp. 1406–1408, Aug. 2002. 739
[17] J. B. Zhao and L. Mili, “Robust unscented Kalman filter for power system 740dynamic state estimation with unknown noise statistics,” IEEE Trans. 741Smart Grid, to be published. 742
[18] IEEE PES TF on Benchmark System for Stability Controls, “Benchmark 743systems for small-signal stability analysis and control,” IEEE Power En- 744ergy Soc., Piscataway, NJ, USA, Tech. Rep. PES-TR18, Aug. 2015. 745
[19] A. Rouhani and A. Abur, “Linear phasor estimator assisted dynamic state 746estimation,” IEEE Trans. Smart Grid, vol. 9, no. 1, pp. 211–219, Jan. 2018. 747
[20] E. Scholtz, V. D. Donde, and J. C. Tournier, “Parallel computation of 748dynamic state estimation for power system,” U.S. Patent Appl. 13 832 670, 749Mar. 15, 2013. 750
[21] “Setting-less protection: Laboratory testing-final report,” Power Syst. Eng. 751Res. Center, Arizona State Univ., Tempe, AZ, USA, 2014. Q3752
[22] IEEE Guide for Synchronous Generator Modeling Practices and Appli- 753cations in Power System Stability Analyses, IEEE Std 1110-2002, 2003. 754
Junbo Zhao (S’13) received the Bachelor’s degree in 755electrical engineering from Southwest Jiaotong Uni- 756versity, Leshan, China, in 2012. He is currently work- 757ing toward the Ph.D. degree at the Bradley Depart- 758ment of Electrical and Computer Engineering, Vir- 759ginia Polytechnic Institute and State University (Vir- 760ginia Tech), Falls Church, VA, USA. 761
He did a summer internship at Pacific Northwest 762National Laboratory from May 2017 to August 2017. 763He has authored two book chapters, and authored or 764coauthored more than 30 peer-reviewed journal and 765
conference papers and nine Chinese patents. His research interests lie in power 766system real-time monitoring, operations and cyber security that include power 767system state estimation, power system dynamics and stability, static and dy- 768namic load modeling, power system cyber attacks and countermeasures, big 769data analytics, and robust statistics with applications in the smart grid. 770
Dr. Zhao is currently the Chair for the IEEE Task Force on Power Sys- 771tem Dynamic State and Parameter Estimation, and the Secretary of the IEEE 772Working Group on State Estimation Algorithms and the IEEE Task Force on 773Synchrophasor Applications in Power System Operation and Control. 774
775Lamine Mili (LF’17) received the Electrical Engi- 776neering Diploma from the Swiss Federal Institute of 777Technology, Lausanne, Switzerland, in 1976, and the 778Ph.D. degree from the University of Liege, Liege, 779Belgium, in 1987. 780
He is a Professor in electrical and computer en- 781gineering, Virginia Tech, Falls Church, VA, USA. Q4782He has five years of industrial experience with the 783Tunisian electric utility, STEG. At STEG, he worked 784in the planning department from 1976 to 1979 and 785then at the Test and Meter Laboratory from 1979 to 786
1981. He was a Visiting Professor with the Swiss Federal Institute of Technol- 787ogy, Lausanne, Switzerland, the Grenoble Institute of Technology, Grenoble, 788France, the Ecole Superieure D’electricit, Gif-sur-Yvette, France, and the Ecole 789Polytechnique de Tunisie, La Marsa, Tunisia, and did consulting work for the 790French Power Transmission company, RTE. His research has focused on power 791system planning for enhanced resiliency and sustainability, risk management of 792complex systems to catastrophic failures, robust estimation and control, non- 793linear dynamics, and bifurcation theory. He is a co-founder and co-editor for 794the International Journal of Critical Infrastructure. He is the chairman for the 795IEEE Working Group on State Estimation Algorithms. He was a recipient of 796several awards including the U.S. National Science Foundation (NSF) Research 797Initiation Award and the NSF Young Investigation Award. 798
799