june 2015 - dcc plc · •enabling further capital deployment •dcc continues to be viewed as an...
TRANSCRIPT

DCC Capital Markets DayJune 2015

Disclaimer
This presentation does not constitute an invitation to underwrite, subscribe for or otherwise acquire or dispose of any shares or other securities of DCC plc (“DCC”).
This presentation is being provided to you on a confidential basis solely for your information. This presentation may not be copied, distributed, reproduced or passed on, directly or indirectly, in whole or in part, or disclosed by any recipient, to any other person (whether within or outside such person's organisation or firm) or published in whole or in part, for any purpose or under any circumstances, without the written consent of DCC. (For the purposes of this notice, "presentation" means this document, any oral presentation, any question and answer session and any written or oral material discussed or distributed during the presentation meeting.)
Without limitation to the foregoing, this presentation is not for release, publication or distribution, in whole or in part, directly or indirectly, in or into the United States (including its territories and dependencies, any state of the United States and the District of Columbia) or any other state or jurisdiction where such distribution is unlawful.
No representation or warranty, express or implied, is made or given by or on behalf of DCC or any of its subsidiary undertakings, or any of its respective directors, officers, employees, agents, affiliates or advisers, as to, and no reliance should be placed on, the accuracy, completeness or fairness of the information or opinions contained in this presentation and no responsibility or liability is assumed by any such persons for any such information or opinions or for any errors or omissions.
This presentation contains some forward-looking statements that represent DCC’s expectations for its business, based on current expectations about future events, which by their nature involve risk and uncertainty. DCC believes that its expectations and assumptions with respect to these forward-looking statements are reasonable; however because they involve risk and uncertainty as to future circumstance, which are in many cases beyond DCC’s control, actual results or performance may differ materially from those expressed or implied by such forward-looking statements. DCC undertakes no duty to and will not necessarily update any such statements in light of new information or future events, except to the extent required by any applicable law or regulation. Recipients of this presentation are therefore cautioned that a number of important factors could cause actual results or outcomes to differ materially from those expressed in or implied by any forward-looking statements.
Any statement in this presentation which infers that transactions may be earnings accretive does not constitute a profit forecast and should not be interpreted to mean that DCC’s earnings or net assets in the first full financial year following the transactions, nor in any subsequent period, would necessarily match or be greater than those for the relevant preceding financial year.
Your attention is drawn to the risk factors referred to in this presentation and also set out in the Principal Risks and Uncertainties section of DCC’s Annual Report. These risks and uncertainties do not necessarily comprise all the risk factors associated with DCC and/or any recently acquired businesses. There may be other risks which may have an adverse effect on the business, financial condition, results or future prospects of DCC. In particular, it should be borne in mind that past performance is no guide to future performance. Persons needing advice should contact an independent financial advisor.
1

77%
8%
15%
UKROIContinental Europe/Other
54%
22%
18%
6%
DCC Energy
DCC Technology
DCC Healthcare
DCC Environmental
DCC
Profit* by division (YE 31 March 15) Profit* by geography (YE 31 March 15)
2
• Listed on the London Stock Exchange since 1994
• FTSE 250 (Support Services) since June 2013
• Market Capitalisation of c. £4.5 billion
• Employs approximately 10,000 people
• Operating in 14 countries
* On a continuing basis – excluding the results of DCC Food & Beverage which has been sold
DCC is an international sales, marketing, distribution and business support services group operating across four divisions
DCC – Financial Highlights*
Revenue £10.6bn ROCE 18.9%
Operating profit £222m Net debt/EBITDA -
Operating cash flow £378m Interest cover (times) 9.9x

0%
20%
40%
60%
80%
100%
120%
140%
160%
18.8 22.1 25.9 29.9 32.3 37.7 41.950.4
58.364.9
73.6 78.484.5
97.5
115.9
139.7
157.9
173.1
142.0
171.2
191.2
209.2
4.8 6.1 7.1 8.1 8.6 10.0 11.3 12.9 15.118.0
22.525.4
29.233.5
39.8
51.5
59.863.2
67.6 69.9
76.9
84.5
17 19 22 24 29 36
43 51 56
62 71 75
82 95
117
149
171
196
161
187
208
228
Track record since flotation
3
Operating profit (£m) EPS (pence)
Dividend growth (pence) Free cash flow conversion (%) 21 year Average
104%21 year CAGR
14.6%
21 year CAGR
12.2%
1994 2015 1994 2015
1994 2015 1994 2015
21 year CAGR
13.2%

Versus the FTSE 100 and FTSE 250
DCC TSR
4
Source: Datastream
1064%
96%
307%
0%
200%
400%
600%
800%
1000%
1200%
DCC FTSE 100 FTSE 250
Over last 14 years
426%
50%
120%
0%
50%
100%
150%
200%
250%
300%
350%
400%
450%
DCC FTSE 100 FTSE 250
Over last 7 years
4844%
366%
815%
0%
1000%
2000%
3000%
4000%
5000%
DCC FTSE 100 FTSE 250
Since flotation (21 years)

Recent activity
• Very pleasing FY15 results across all key metrics
• Record level of development activity• Commitment to acquire Butagaz, DCC’s largest ever acquisition
• Further acquisitions across Energy, Technology and Healthcare
• Disposal of Food & Beverage division – sharpened strategic focus
• Successful equity placing ensures strong balance sheet maintained• Enabling further capital deployment
• DCC continues to be viewed as an attractive and capable acquirer
5

DCC’s Strategy
Our Objective:
To continue to build a growing, sustainable and cash generative business which consistently provides returns on total capital employed significantly ahead of its cost of capital
6
Our strategic priorities:
• Creating and sustaining leading positions in each of the markets in which we operate
• Continuously benchmarking and improving the efficiency of our operating model in each of our businesses
• Carefully extending our geographic footprint to provide new horizons for growth
• Attracting and empowering entrepreneurial leadership teams, capable of delivering outstanding performance, through the deployment of a devolved management structure
• Maintaining financial strength through a disciplined approach to balance sheet management

Agenda
7
Time Topic Speakers
9.00 Introduction Tommy Breen, CEO
9.15 DCC Energy Donal Murphy, MD Henry Cubbon, MD LPGEddie O’Brien, MD Retail & Fuelcard
10.15 DCC Technology Niall Ennis, MDGerry O’Keeffe, MD Exertis UK&IPatrice Arzillier, MD Exertis Continental Europe
10.50 Coffee
11.15 DCC Healthcare Conor Costigan, MDHarry Keenan, MD DCC VitalStephen O’Connor, MD DCC Health & Beauty Solutions
11.50 Financial Strategy Fergal O’Dwyer, CFO
12.20 Wrap up / Q&A Tommy Breen, CEO
1.00 Lunch

DCC EnergyJune 2015

Agenda
Introduction & Oil Donal MurphyManaging Director
LPG Henry CubbonManaging Director, LPG
Retail & Fuelcard Eddie O’BrienManaging Director, Retail & Fuelcard
Market Opportunity & Summary
Donal Murphy
1

2

The European Leader
The leading oil and liquefied petroleum gas (“LPG”) sales, marketing and distribution business in Europe
• Oil distribution for transport, heating andindustrial / agricultural processes
• LPG distribution for heating, cooking, transport and industrial / agricultural processes
• Retail stations and fuel cards for transport, commercial and end users
• Established market leadership positions in7 countries with a platform to grow thebusiness across Europe and beyond
• Over 30 years industry experience
• Consolidator of fragmented markets
• Partner of choice for oil majors in asset divestment
3
DCC Energy
51%
18%
21%
10%
Transport Fuels
Commercial Fuel
Heating (Oil & LPG)
LPG
Volume
10.8bnLitres
Revenue
£7,624.1m
Operating profit
£119.4m
ROCE
19.8%
Recurring revenue, cash generative and high ROCE business
Based on results for the year ended 31 March 2015

Our Business
66%
25%
9%
Britain
Europe
Ireland
4
DCC Energy
Volumes by geography
Customer Volumes
60%18%
11%
4%4%3%
Commercial & Industrial
Retail
Domestic
Agricultural
Marine
Other
72%
13%
15%
Oil
LPG
Retail & Fuelcard
Volumes by sector
Operating profit by sector
41%
35%
24%Oil
LPG
Retail & Fuelcard
Based on results for the year ended 31 March 2015

Track Record
Volumes – Reported (Billion litres) Operating profit (£'m)
5
DCC Energy
2.93.2
4.2
5.3
6.2
7.1
7.9
9.610.2
10.8
2006 2007 2008 2009 2010 2011 2012 2013 2014 2015
37.4 40.4
52.2
83.2
100.4
117.0
72.5
106.2110.5
119.4
2006 2007 2008 2009 2010 2011 2012 2013 2014 2015
Underlying operating profit Estimated weather impact
10 year CAGR
13.2%

A Business of Scale
Pro-Forma Business Statistics FY 2015(inc. acquisitions announced)
6
DCC Energy
Volumes
13.5bnLitres
Customers
1.3m
Trucks
2,150Employees
5,300Facilities
430
Retail petrol sites operated/supplied
Britain
1,600France
400Sweden
400
Austria
300Ireland
100

Key Competitive Advantages
7
Largediversifiedcustomer
base
Sales &operationalexpertise
Extensiveacquisition
and integrationexperienceBroad
portfolioof suppliers
Strength ofthe Group
Balance Sheet
Platform forfurthergrowth
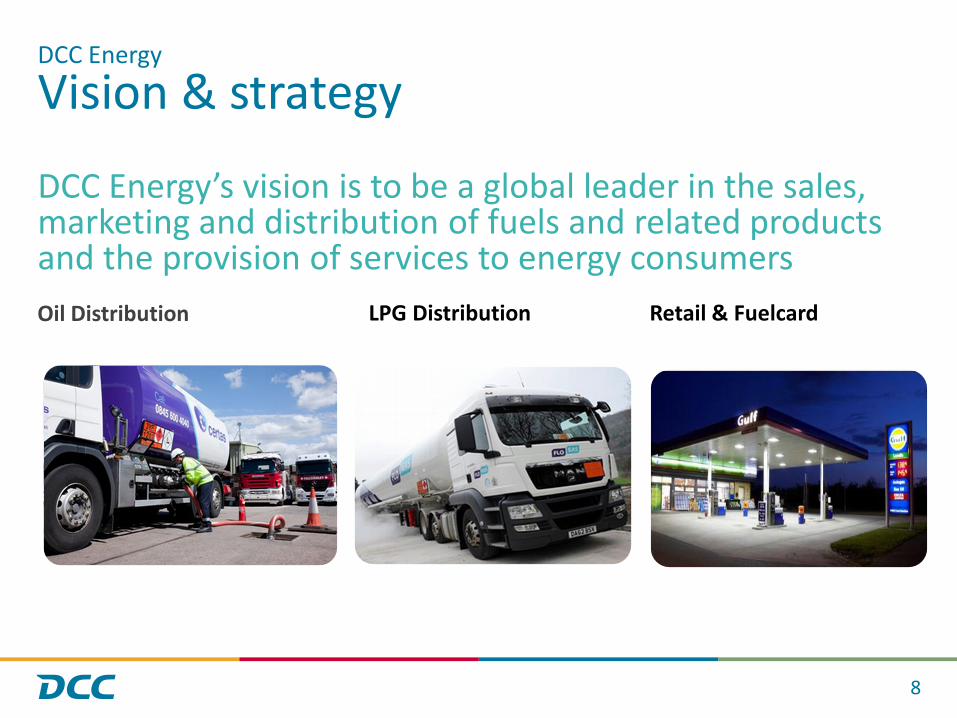
Vision & strategy
DCC Energy’s vision is to be a global leader in the sales, marketing and distribution of fuels and related products and the provision of services to energy consumers
8
DCC Energy
Oil Distribution LPG Distribution Retail & Fuelcard

Oil Distribution
9
“for the road”
“for the air” “for the sea”
“for business & the home”

Oil Distribution – The Consolidation Play
• # 1 oil distributor in Britain
• First entered the market in Sept. 2001
• Acquired and integrated 39 oil distributors including the BP, Shell, Texaco and Total operations
• Significant synergies achieved
• Fragmented market
• Excellent nationwide infrastructure
• Key areas for growth -transport fuels, lubricants, aviation and marine
10
21%
11%
61%
7%
Retail
Domestic
Commerial
Other
Volume Split %
Market Share %
18%
Employees
2,700
Depots / Trucks
159 / 980Volume
5.7bnLitres

Oil Distribution – opportunity for growth
• Further consolidation in existing markets – most markets remain highly fragmented
• Expand into new geographies in Western Europe
• Growth opportunities in differentiated fuels, aviation, marine, lubricants, fuel cards and supplying retail stations
• Leverage relationships with Oil Majors and other asset owners to expand geographic reach initially in Europe
Geography Volume Market ShareMarket
Position
Britain – oil c. 5,700mL c. 18% – oil # 1
Ireland – oil c. 800mL c. 9% – oil # 5
Austria & Germany – oilc. 800mLc. 250mL
c. 13% # 2
Sweden – oil bulk c. 350mL c. 16% # 1
Denmark – oil c. 230mL c. 12% # 2
11
Volumes
8.0bnLitres
Customers
0.7m
Trucks
1,500
Employees
3,150Facilities
350

We are still a small part of a very large market
12
#10AustriaRoad: 8.0MTNon Road: 2.0MT
#07BelgiumRoad: 8.1MTNon Road: 5.9MT
#15DenmarkRoad: 4.4MTNon Road: 1.6MT
#12
FinlandRoad: 4.0MTNon Road: 2.8MT
#02FranceRoad: 41.3MTNon Road: 20.3MT
#4ItalyRoad: 30.3MTNon Road: 11.0MT
#06NetherlandsRoad : 10.2MTNon Road: 5.3MT
#14
NorwayRoad: 3.3MTNon Road: 3.0MT
#11PortugalRoad: 4.9MTNon Road: 3.5MT
#05SpainRoad: 29.2MTNon Road: 12.0MT
#08SwedenRoad: 7.7MTNon Road: 3.7MT
#09SwitzerlandRoad: 5.4MTNon Road: 4.9MT
#03UKRoad: 35.0MTNon Road: 21.6MT
#01GermanyRoad: 52.2MTNon Road: 32.8MT
#13Ireland Road: 3.6MTNon Road: 3.1MT
Potentials (2-5 Years)
Existing Markets
Source: PFC

LPG Distribution
13

LPG – the story so far
14
1977 1984 2001 2002 2012 2014 2015
Greenfield start up of Flogas in Ireland, followed by acquisition of Ergas (Shell)
AcquiredAltagas
AcquiredBritish GasLPG
AcquiredBP LPG
Entered the Benelux market through acquisition of Benegas (BP)
Entered UK market through acquisition of Portagas
AcquiredLP Autogas
Entered the Scandinavian market through the acquisitionof SFR Retail’sLPG Businessesin Norway and Sweden
AcquiredNeste’s cavern facilities
AcquiredDrievorm
Announced commitment to acquire

The Flogas Group today
15
• Operating in six countries with full national coverage
• 1,200 staff managing 60 depots with 400+ trucks and 80 railcars
• c. 75,000 tank and 5m cylinder assets in the market
• Growth through proactive oil to LPG conversions in commercial sectors
• Four independent management teams, with close HSE, financial and compliance oversight
• Flogas Group benefits from best practice exchange and common procurement
Delivering in FY15
• 705,000 tonnes
• 35% of DCC Energy PBIT
• Consistent, strong ROCE and cash flow
CylindersDomestic
bulkCommercial
bulk Autogas AerosolMarket*Share / psn
Flogas Britain 30% #2
Flogas Ireland 40% #2
Benegas 26% #1jt
Flogas Scandinavia 49% #1
* Flogas estimates, Scandinavia = NO +SW
Global LPG Trends
• World LPG supply is increasing vs demand
• Gap is increasing with new natural gas & shale gas developments
• This is resulting in lower prices
• Industrial users moving from oil to LPG
• New sourcing/trading opportunities emerging
• Demand for LPG worldwide to grow by c. 1.7% CAGR to 2020 – Source: Woodmac
• Slow decline in mature markets to flatten
• The roll out of natural gas grids is mostly complete
• Electricity pricing is increasing on a relative basis
• LPG is seen as a cleaner off grid fuel with lower CO2 / Nox
• Greater European supply options with less dependence on inland refineries
• Oil Majors likely to continue to divest out of the specialist “niche” product areas
16

LPG in Europe
17
#2 Market PositionIreland (ROI & NI)Market Share: 40% Market Size: 209kT
#2 Market PositionBritain (ex NI)Market Share: 30% Market Size: 1,013kT
#1 Market PositionNorwayMarket Share: 38% Market Size: 193kT
#1 Market PositionSwedenMarket Share: 55% Market Size: 424kT
#1 Market PositionNetherlandsMarket Share: 26% Market Size: 391kT
2,075kT
241kT
92kT
557kT 1,537kT
3,569kT
1,796kT
48kT
115kT
2,150kT
88kT
35kT
148kT
390kT
480kT
417kT
20kT
85kT
168kT
75kT 140kT
354kT
n/a
n/a
n/a
Modest Market PositionBelgiumMarket Share: c. 1% Market Size: 271kT
Potentials (2-5 Years)
Existing Markets
Source:1) Volumes - WLPGA 2013 statistics2) Market shares - latest DCC estimate of share of addressable market
Acquisition announced

DCC LPG – the growth story: next steps
18
Organic growth
• Switching more commercial users of oil to LPG (cost and carbon savings)
• Promoting LPG as an off grid fuel for domestic customers
• Investment in CRM to optimise sales effort and customer loyalty
• Continuous improvement in logistics efficiencies, investment in telemetry
• Maintaining ROCE focus
Near-term Development
• Infill acquisitions to build scale in existing territories
• Add on natural gas and LNG distribution in selected markets
• Enter new European markets by acquisition
Medium-term Development
• LPG market has similar characteristics across the globe
• Currently evaluating markets in North/South America & Asia
• Real potential to expand outside Europe

27

Transaction Highlights
• Acquisition of the second largest LPG business in France, with market share of 25% and the leading brand in the market
• Market leader in the cylinder and small bulk market segments
• Sells directly or indirectly to over four million customers
• Significantly increases the scale of DCC’s LPG business from approx. 700,000 tonnes to 1.2 million tonnes
• France is the second largest LPG market in Western Europe –approximately twice the size of the British market
• Currently operates as a stand alone business within Shell - led by an experienced and ambitious management team
• Valuation of €464m (£338m) on a debt-free, cash-free basis
• EBITDA multiple of 3.8 times; EBIT multiple of 6.2 times
20

Business Mix
21
Packed / Cylinder Small bulk Large bulk Autogas
Overview • LPG in cylinders mainly used for cooking and forklift trucks by commercial customers
• Customers with low annual usage (<80T), mainly domestic and small IC
• Used mainly for heating
• Customers who purchase 80 tonnes or more of LPG per annum
• Used as a fuel for transportation
• Sold through retail stations and hypermarkets
Share of Butagaz’sbranded volumes
Butagaz’s shareof French market
Segment as a %of French market
32% 54% 12% 2%
31% 25% 17% 8%
25% 52% 17% 6%
No.1No.1
Source: CFBP December 2014

An excellent infrastructure
22
Source:Company information
(1) In addition 4 propane bulk depots owned via the Sobegal entity in which Butagaz has a 28% share. Butagaz also operates one propane bulk dry depot, Vire.
(2) Two Mandataires in France and one Mandataire covering Corsica
LPG supplyPrimary transport
Storage / filling
Secondary and tertiary transport
Points of sale Customers
Autogas end users
Large bulk end users
> 4,000,000
Packed end users
168,000 domestic &
42,000 professional
small bulk end users
26,000 packed points
of sale (principally
supermarkets and
hypermarkets)
3 Mandataires(2)
and Grand Nord
7 filling plants10 propane bulk depots(1)
46 packed depots1 cylinder requalification plant and Geogaz facility
3 major supply points
Geogaz Lavéra
Donges
Norgal
Key:
Supply point
Imported product
Refined product

Butagaz - Potential within DCC
• Leverage the strong Butagaz brand in related energy sectors
• Greater B2B focus e.g. Oil2LPG and LNG
• Integration of Antargaz & Totalgaz may create opportunities to grow market share
• Expand the domestic bulk market
• Continued cost reduction
• Development of a natural gas business
• Purchasing synergies – gas and non-gas
• Share Butagaz B2C, brand management and R&D competencies with other DCC Energy LPG businesses
23

Retail & Fuelcard
24

Retail & Fuelcard
25
Unmanned
• Key pillar for DCC Energy’s retail growth
• Develop a Pan-European network of unmanned stations
• Hub and spoke model with central shared services
• QStar initial backbone• Esso France significant
subsequent step
Retail COCO
• Selective Investments in Company Owned, Company Operated sites
• Target initial return on capital of 15%
• Utilise commission operators/concessionaires/ franchisees to run retail stores
Retail DODO
• Continue to build our Dealer Owned Dealer Operated sites
• Highly complementary to Unmanned/COCO network -excellent returns but lower profitability
• Strong brand portfolio including “Tier 1” brand
• Broad package including branding, supply, card processing, lubes, LPG
FUEL CARDS KEY INGREDIENT

The journey over the last two years
Site network
0
100
200
300
400
500
600
700
800
2013 2014 2015 2016
Ireland UK Sweden France
Network volumes (litres m)
26
0
500
1000
1500
2000
2500
2013 2014 2015 2016
Ireland UK Sweden France*
* Includes Esso Retail France , not yet completed
*

Retail Operating Model
• Central functions basedin Ireland
• Esso France replacement systems and processes
• Professional management team recruited
• Allows a lean organisation approach to country operations
• Local marketing organisations focusedon the customer and growth
27
Pricing
Customer service
Financial Management
Product procurement
Back office functionality
“Hub & Spoke”

The “Hub”
• All fuel pricing execution and strategy centralised
• Product procurement centralised to leverage scale, security and supplier relationships
• Professional team with specific industry experience
• Exception management enabled by integrated technology
• Financial management and reporting at a transaction and site level to enable optimised profitability
• Centralised service contract management
28
Pricing
Customer service
Financial Management
Product procurement
Key contract management
Centralisedoperationssupport

Leveraging technology todrive low cost operations• World class technical systems
• Automated and integrated processes
• Centralised and scalable solutions
• Optimisation engines in supply chainand pricing
29

Significant bolt-on opportunities
• Oil majors continue the trend of divestment
• Unmanned penetration continues to grow faster than traditional formats
• Certas Energy’s execution track record is strong
• Professional management team in place
30

Fuel Cards – Pumping up the Volume
• Largest independent reseller of branded fuel cards in Britain
• Key Partners: BP, Diesel Direct, Shell, Esso, Texaco, UK Fuels
• Value adding products and services a major profit contributor – MileageCount & CO2Count
• Excellent nationwide coverage
• 12% share of a c. 7bn market
• Highly attractive financial characteristics:i.e. negative working capital, no seasonality
• Customers: 50,000Sales offices: 7Employees: 350
• Opportunities to drive “footfall” to our retail sites
31

Retail & Cards – 685 sites & 3.3bn litres
Furtheropportunities?
32
80m litres31 sites
310m litres324 sites
1.0bn litres
1.9bn litres322 sites
13m litres8 sites

Market opportunity& summary
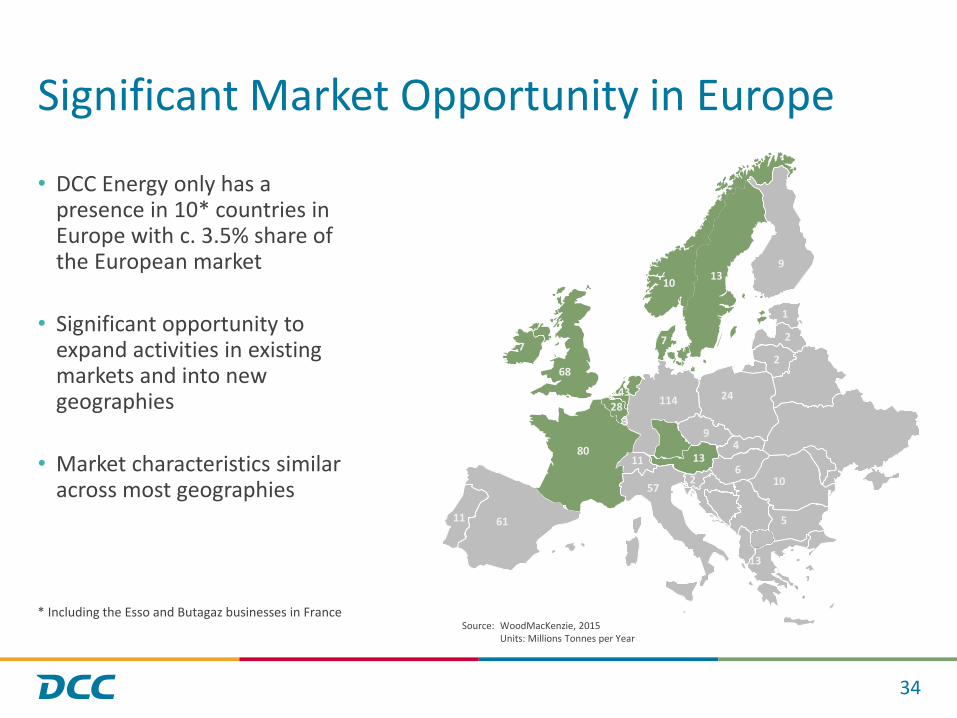
Significant Market Opportunity in Europe
• DCC Energy only has a presence in 10* countries in Europe with c. 3.5% share of the European market
• Significant opportunity to expand activities in existing markets and into new geographies
• Market characteristics similar across most geographies
* Including the Esso and Butagaz businesses in France
34
Source: WoodMacKenzie, 2015Units: Millions Tonnes per Year
13
7
28
9
80
114
13
7
57
3
43
10
11 61
13
11
68
2
4
10
24
2
2
6
1
9
5

An Excellent Fit for DCC
35
Strong competitive
position in the French
LPG market
Potential value creation
opportunities through
brand monetisation
Established and trusted
Butagaz brand
Operational improvement
potential
Broad and dedicated
distribution channels
Experienced and
ambitious management
team with a clear
strategy in place
Strong profitability and
cash generation
delivering high ROCE
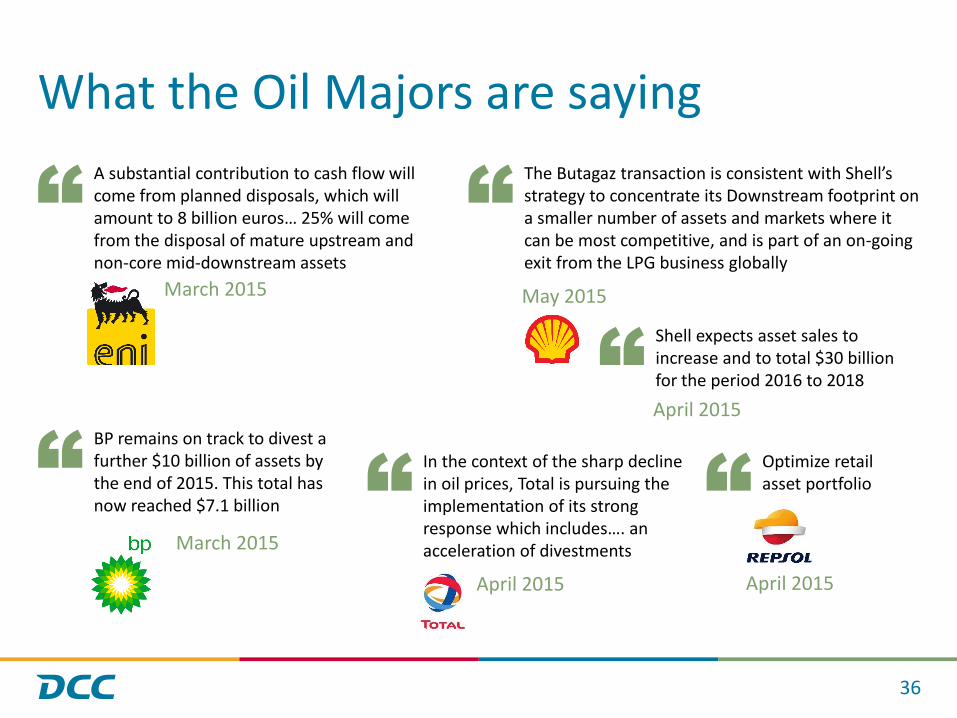
What the Oil Majors are saying
36
A substantial contribution to cash flow will come from planned disposals, which will amount to 8 billion euros… 25% will come from the disposal of mature upstream and non-core mid-downstream assets
March 2015
“The Butagaz transaction is consistent with Shell’s strategy to concentrate its Downstream footprint on a smaller number of assets and markets where it can be most competitive, and is part of an on-going exit from the LPG business globally
May 2015
“
BP remains on track to divest a further $10 billion of assets by the end of 2015. This total has now reached $7.1 billion
March 2015
“
Shell expects asset sales to increase and to total $30 billion for the period 2016 to 2018
April 2015“
“In the context of the sharp decline in oil prices, Total is pursuing the implementation of its strong response which includes…. an acceleration of divestments
April 2015
Optimize retailasset portfolio
April 2015
“

Summary
Scale • DCC Energy is a business of scale• c. 13.5bn litres of sales• c. 1.3m customers across 10 countries
Financial Characteristics • Asset light• Recurring revenues• Strong Cash Conversion and High ROCE
Organic Growth • Platform to drive organic profit growth• Oil• LPG• Retail & Cards
Acquisitions • Significant opportunity to build out business model in existing markets and into new countries, initially across Europe
People • Most importantly we have super people across the businesses
37

DCC TechnologyJune 2015

Agenda
1
Introduction & strategy Niall EnnisManaging Director
Product & servicedevelopment
Gerry O’Keeffe MD Exertis UK & Ireland
Channel development & geographic expansion
Patrice Arzillier MD Exertis Continental Europe
Positioned for growth Niall Ennis

DCC Technology
Leading route-to-market partner for global consumer and SME technology brands
2
FY2015
Revenue £2,350.3m
Operating profit £49.3m
ROCE 25.5%
Employees 1,953
DCC Technology operates under the brand
350industry leading
suppliers
In the homeIn the office On the move
15,000+ customers
Retail, etail, reseller
Consumer & SME

at a glance
Exertis delivers an industry-leading and innovative range of services and value add solutions that enable our partners to access existing and new sales channels in the most effective manner possible.
The obvious partner for a new supplier to access European Retail and SME markets
3
Key Facts Key Partners
£2.35bturnover
>2,000employees across 12 counties
>87,000m2
logistics capacity
>1.4m deliveries last year, shipping over 34m units
350+ technology brands
15,000+reseller & retailer customers
Specialists in SME and Consumer markets
Our Business
Channel SpecialistsBusiness, Retail, Mobile, Supplies
Market Insight and Alignment
Public Sector, Business,
Smart Home, Cloud
Product Focus and BreadthIT, Mobile, Home,Supplies
Value Added Services
Logistics, Supply Chain, Marketing, Retail, Digital

Strong market positions
4
DCC Technology
Geography Market Position
In the homeIn the office On the move
UK No. 1
Ireland No. 1
France No. 7
Sweden No. 3
Others
NetherlandsBelgiumUAESpainNorway
Total Europe No. 4
Current presence
Expansion plans
Global supply chain capability with offices in China, Poland and US
DCC Technology

Track record
• Long history of significant organic volume growth
• Strong organic growth in UK
• Mobile
• Retail
• Reseller (Network, Security, Server)
• Acquisitions in Continental Europe
• France 2008
• Netherlands 2012
• Sweden 2014
• Spain 2015
Operating Profit (£M)
5
20.0
27.1
32.1 32.1 32.7
36.2
41.6 41.5
48.1 49.3
0.0
10.0
20.0
30.0
40.0
50.0
60.0
2006 2007 2008 2009 2010 2011 2012 2013 2014 2015
DCC Technology
10 year CAGR11.6%
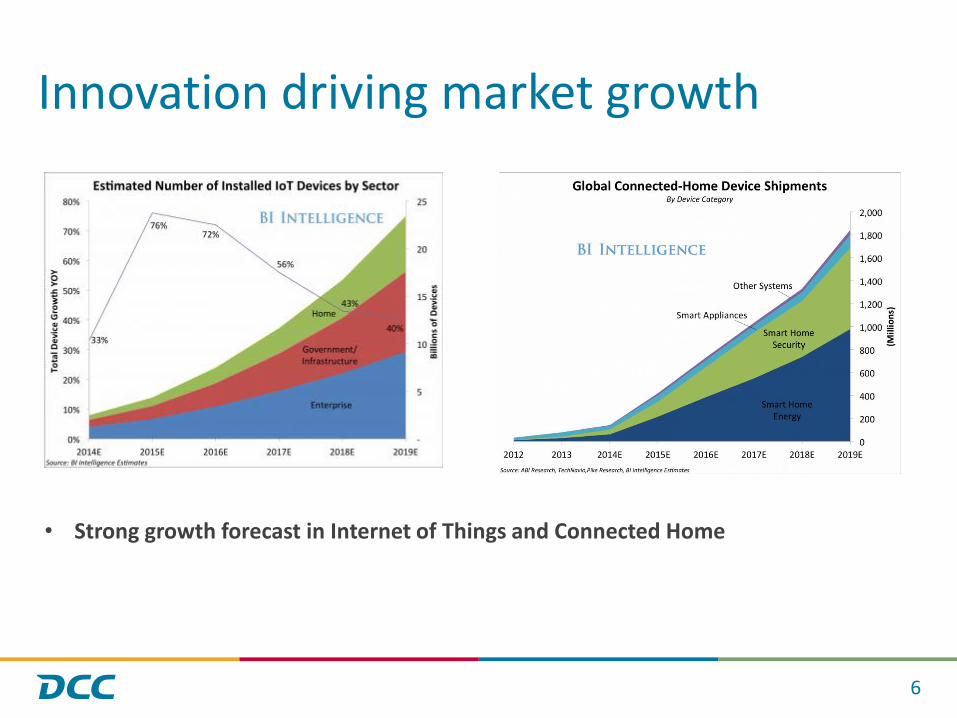
Innovation driving market growth
6
• Strong growth forecast in Internet of Things and Connected Home
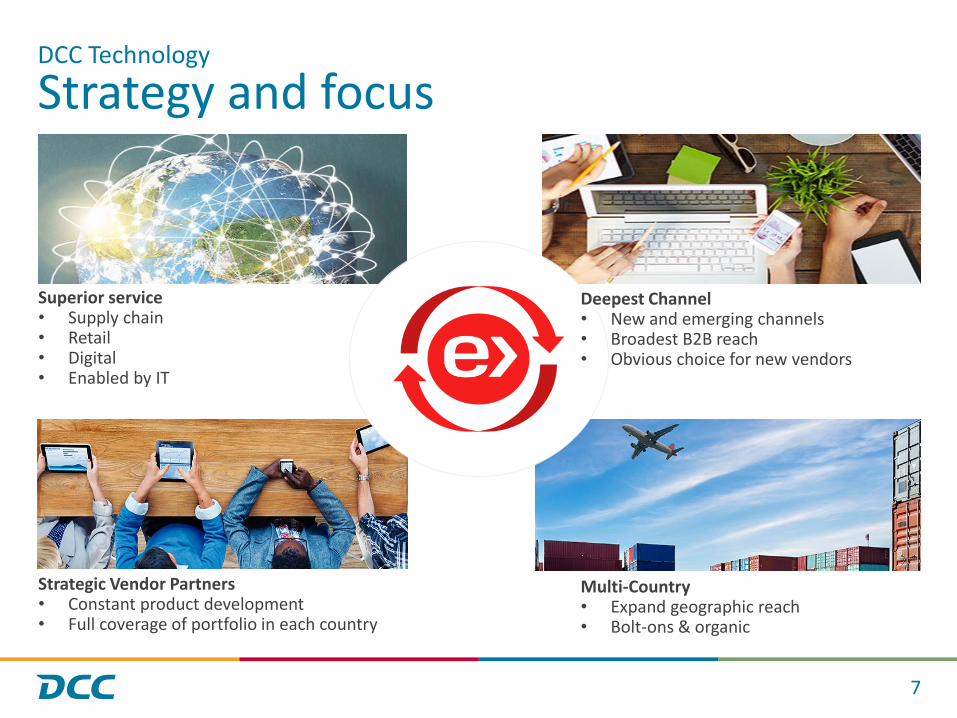
Strategy and focus
7
DCC Technology
Superior service• Supply chain • Retail• Digital• Enabled by IT
Deepest Channel • New and emerging channels• Broadest B2B reach• Obvious choice for new vendors
Strategic Vendor Partners• Constant product development• Full coverage of portfolio in each country
Multi-Country • Expand geographic reach• Bolt-ons & organic

Gerry O’KeeffeMD Exertis UK & Ireland
Product development
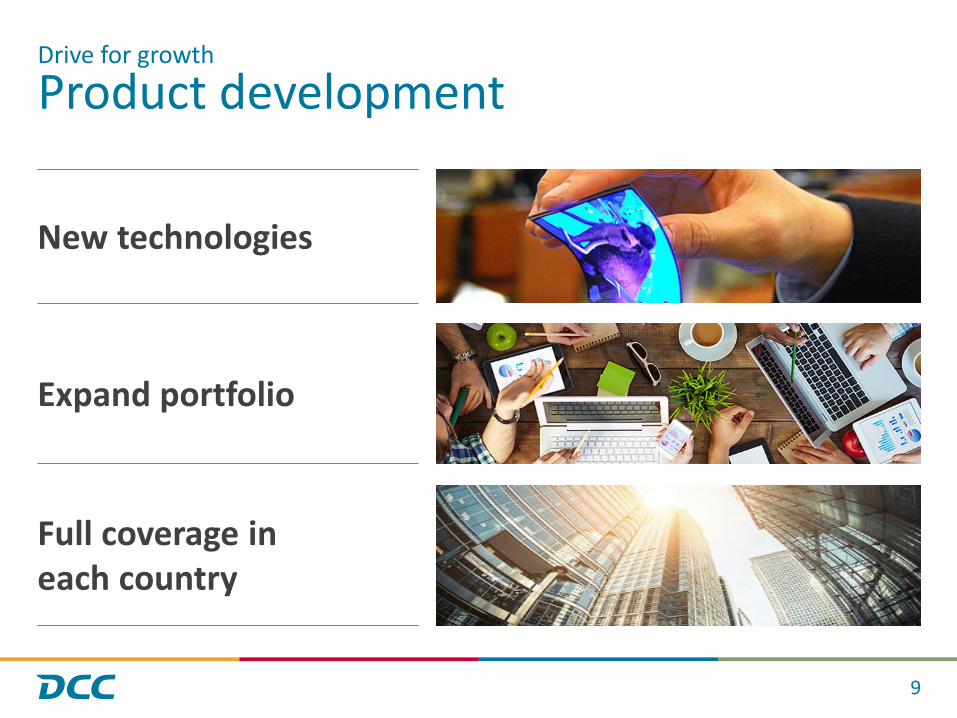
9
Expand portfolio
New technologies
Full coverage ineach country
Drive for growth

New technology stories
Latest focussed product stories:
1. Wearable Tech
10
B2B Channel
Consumer Channel
25 Product Teams
35
0+
Ve
nd
ors
Drive for growth
2. Smart Home

Expand portfolio
11
Align
Prospect
Respond
Drive for growth

Leveraging geographies
12
IT
Home
Mobile
Supplies
Drive for growth

Service development
13
Retail Services
Supply Chain Services
Digital Services
Drive for growth

Supply chain services
Challenge:
• Deliver 200,000 Windows 8 Tablets into Golden Quarter
Issues:
• Intel chipset not available until September
• No route to market established
14
First meeting
Spec selectDesign
Procure components Drive Intel
Create demand
Build QA & Shipment
Execute with Retailers
Ongoing Programme
JUN JUL AUG SEPT OCT NOV-DEC JAN
Considered global role model by Microsoft and Intel
Drive for growth
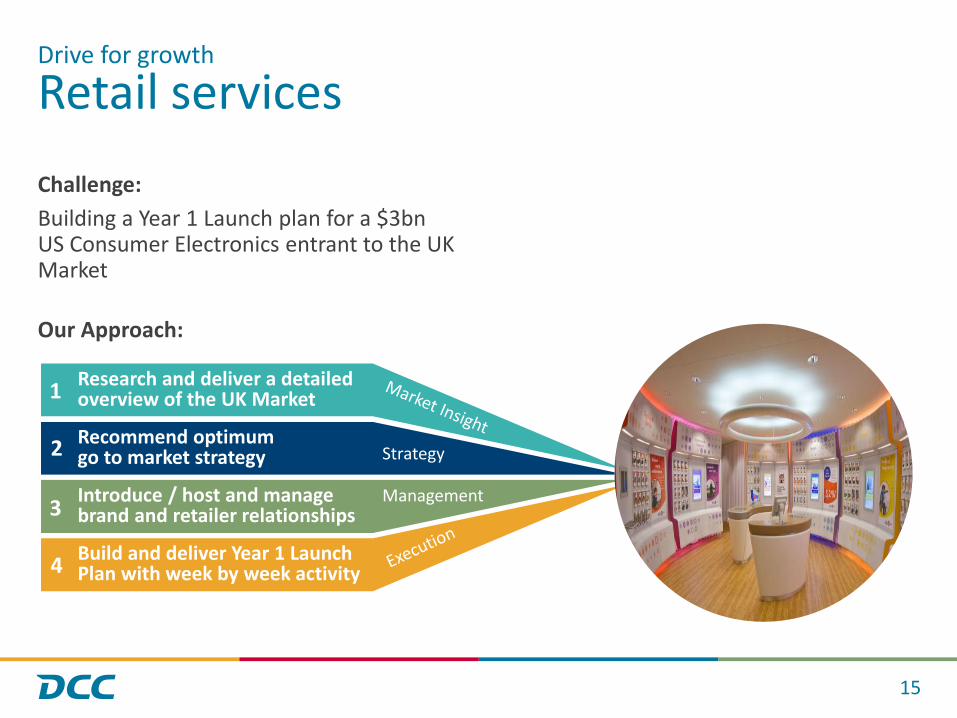
Retail services
Challenge:
Building a Year 1 Launch plan for a $3bn US Consumer Electronics entrant to the UK Market
Our Approach:
15
Drive for growth
Research and deliver a detailed overview of the UK Market
Recommend optimum go to market strategy
Introduce / host and manage brand and retailer relationships
Build and deliver Year 1 Launch Plan with week by week activity
1
2
3
4
Strategy
Management

CustomersVendors
Exertis
Investing in infrastructure
New National Distribution Centre
• 450,000 sq.ft facility due for completion in Q4 2016
• Delivers significant additional capacity, platform to enhance service capability and operational efficiency
New ERP
• Best in class e-commerce capability
• Provides opportunity for ‘front to back’ customer and vendor centric processes
• Seamless Warehouse Management platform (‘EWM’)
16
Legacy Systems6 Warehouses
Drive for growth

Patrice ArzillierMD Exertis Continental Europe

Channel development
18
New Channels
Broaden Existing
Multi Channel
Drive for growth

Broadening existing channels
B2C: Expand our product breadth category with large customers (IT, Mobile, Accessories, Gaming)
B2B: Bring additional value to the reseller channel through a specialist approach
New technologies: to new and existing customers
19
Drive for growth

New channels
Our current channels in France:
20
Telco Office SuppliesOnline ResellersSuperstores
Dixons, Fnac, Leclerc, Darty
Amazon, Ebuyer, Cdiscount, LDLC
Staples, Top Office, InMac
Vodafone, O2, SFR, Orange
Hifi, IT, Design
≈ 4,000 points of sale Our potential channels in France:
Sports Direct, Decathlon, Go Sport
Homebase, Leroy Merlin, Castorama
Total, Esso, Shell, BP Toys’R’Us, PicWic
DIY SportsPetrol Station Health Toys
Boots, Pharmacy and beauty shops
≈ 20,000 additional points of sale
Drive for growth

Multi channel model
21
Vendor End userStoreCustomer Distribution Hub
Vendor Virtual Retailer
End user
Managed by
Drive for growth

Geographic expansion
22
Bolt-on
Acquisition
Organic
Drive for growth

Geographic expansion
23
Modest presence – target for expansion
Existing Markets
Target for expansion
Source: Context plus management estimates
Drive for growth
#12Austria€1.6 bn
#09Belgium€2.5 bn
#11Denmark€1.7 bn
#13
Finland€0.9 bn
#04France€6.4 bn
#06Netherlands€3.8 bn
#14
Norway€0.9 bn
#05Spain €3.3 bn
#08Sweden€2.6bn
#10Switzerland€2.0 bn
#02UK€13.2 bn
#07Poland€3.7 bn
#15Ireland €0.9 bn
#01Germany€15.4 bn

Geographic expansion
Acquisition of CapTech (Sweden) in September 2014
• Focus on vendor development
• Asus
• Acer
• D-Link
• New division launch
• Mobile
• Supplies
• Become a pan-Nordics distributor
• Branch office in Norway
• Target potential acquisitions
24
Drive for growth

Channel expansion
Acquisition of Computers Unlimited in May 2015
• Complementary customer set and product portfolio
• Connected home
• Design professional
• UK, France and a growing presence in Spain
• Development focus:
• New product incubator
• Retail
• Further synergies to be realised
25
80%
18%2%
UK
France
Spain
CU sales per country
Drive for growth

Positioned for growth

Evolving technology supply chains
27
HUB, UK, FR, SWEither 3PL or Brand
Reseller / RetailerCentral Distribution
Store3PL for Web
Brand ownersProduct design and innovation
ODMFar East
3PL EuropeNetherlands Finalisation
3PL, Far EastHub and Freight
End UserStore or Fulfilled
End UserReturns
Repair PartnerInsurance Scrap

Brand ownersProduct design and innovation
ODMFar East
4PLHub, finalise and distribution
Evolving technology supply chains
28
Store / End User rreverse & repairInsurance Scrap
Accelerate stock through the supply chain
Reduce cost to serve and obsolescence
End to end data from manufacturer to consumer

DCC Technology - positioned for growth
29
Deepest and broadest
channel coverage
Industry leading service offering
Expanding addressable
market
Multi-country
capability
Strategic vendor
relationships

DCC HealthcareJune 2015

Agenda
1
Introduction Conor CostiganManaging Director
DCC Vital Harry KeenanManaging DirectorDCC Vital
DCC Health &Beauty Solutions
Stephen O’ConnorManaging DirectorDCC Health & Beauty Solutions
Acquisition focusand conclusion
Conor Costigan

A growth business
Sales, marketingand distribution of pharmaceuticals and medical devices and provision of servicesto health & beautybrand owners
2
FY2015
Revenue £488.1m
Operating profit £39.7m
ROCE 16.6%
Employees 1,992
Share of Group Operating Profit
18%Energy
Technology
Healthcare
Environmental
DCC Healthcare

Strong market positions
DCC Vital
• Most comprehensive sales channelcoverage in Britain and Ireland, including
• #1 in hospital supplies in Ireland
• #1 in GP supplies in Britain
• A leading generics player in Britain
DCC H&BS
• A leading outsourced service providerto the European Health & Beauty sector, including:
• #1 contract manufacturing service provider in Britain
3
71%
29%
DCC Vital
DCC H&BS
FY15 sales by business
FY15 sales by geography
76%
14%
10%
UK
Ireland
ROW
DCC Healthcare

11.1
13.1 13.2 11.6
15.9 17.4
18.4
21.0
28.3
39.7
2006 2007 2008 2009 2010 2011 2012 2013 2014 2015
Track record
• Period of significantgrowth across the business
• Excellent organic profit growthin DCC H&BS
• Ramp up in acquisition activity especially in DCC Vital
• Strong development momentum
• 8 acquisitions in last four years
• £154m spend
4
Operating Profit* (£M)
10 year CAGR
16.1%
DCC Healthcare
* Excludes Virtus Inc. and Mobility & Rehab – disposed during the 10 year period

Strategically well placed for continued growth
5
DemographicsLifestyle factors
Changing government
policies
Trend to outsourcing
Increasing regulation
InnovationFragmented
markets
Growth opportunities
DCC VitalPatient care products
(predominantly government funded)
DCC Health & Beauty SolutionsConsumer products
DCC Healthcare
Market dynamics
OTC pharma
Healthcare creams & liquids
PharmaMedicalDevices
NutritionVMS
Creams& liquids
Beauty products

Vision
6
Build a substantial European healthcare products and services business focused on:
• Sales, marketing and distribution of pharmaceuticals and medical devices;
and
• Provision of services to health & beauty brand owners
DCC Healthcare

DCC Vital
Overview
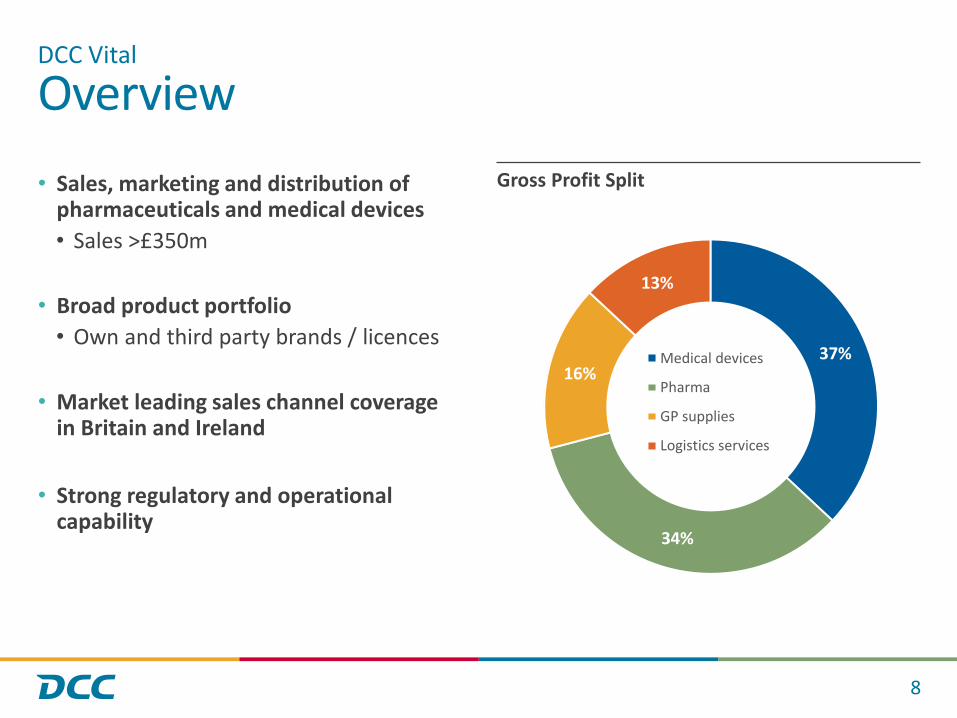
• Sales, marketing and distribution of pharmaceuticals and medical devices
• Sales >£350m
• Broad product portfolio
• Own and third party brands / licences
• Market leading sales channel coverage in Britain and Ireland
• Strong regulatory and operational capability
8
Gross Profit Split
DCC Vital
37%
34%
16%
13%
Medical devices
Pharma
GP supplies
Logistics services

What we do
9
Hospitals Pharma retailersand wholesalers
Primary Care
Sales, marketing & distribution
Portfolio development and product
licensing
Procurement Vendor management
Supply chain management & logistics services
3rd partybrand owners
Own brand/licence products
DCC Vital
38%
62%Own Brand
Third Party
FY15 GP by product:
FY15 GP by channel:
49%
28%
23% Hospitals
Pharma retail/ wholesale
Primary care

Product focus
Medical devices –single use products
Pharma –niche generics
37%34%
16%13%
10
GP Supplies• Diagnostics • Sexual health products• Gloves, paper products• Pharmaceuticals
Pharma• Antibiotics• Pain management• Respiratory• Hospital injectables• IVIG
Medical devices• Woundcare• Diagnostics• Electrodes• Diathermy consumables• Critical care products• Gloves
DCC Vital
Logistics Services
Gross Profit Split

Own brands and exclusive partners
• Pharma companies
• Medical device companies
• Clinical diagnostics / life sciences companies
11
DCC Vital
Own brand
Exclusive Partners

Market dynamics
12
Population increasing, aging and less healthy
• Driving market growth
• Increasing demands on healthcare services
Need for greater efficiencies in the system
• Combined with more treatments in primary care
DCC Vital well positioned to provide comprehensive healthcare solutions to the NHS
• Cost effective generics portfolio
• Innovative devices - minimally invasive surgery, cardiac monitoring
• Comprehensive channel coverage
DCC Vital
Estimated market values
Medical products
UK & Ireland
£5.5bn
Pharmaceuticals
UK & Ireland
£15.0bn

Organic development strategy
13
• Expand product portfolio
• Own brand/licence
• Product categories which can deliver sustainable returns
• Quality IP ideally with international sales potential
• Exploit expanded market coverage in Britain
• Leverage increased business scale in Britain
• Operational efficiency opportunities
• Acquisition integration capability
DCC Vital

DCC Health& Beauty Solutions

Overview
• Provision of outsourced services tothe health & beauty sector in Europe
• Focused on nutrition and beauty products
• High quality, licensed facilities (GMP)
• Excellent technical, regulatory andNPD capability
• Broad British & international customer base
• Circa 50% of output consumed in international markets
15
Sales c.£150m
DCC Health & Beauty Solutions
43%
51%
6%
Nutritional
Beauty
HealthcareCreams & Liquids
What we do
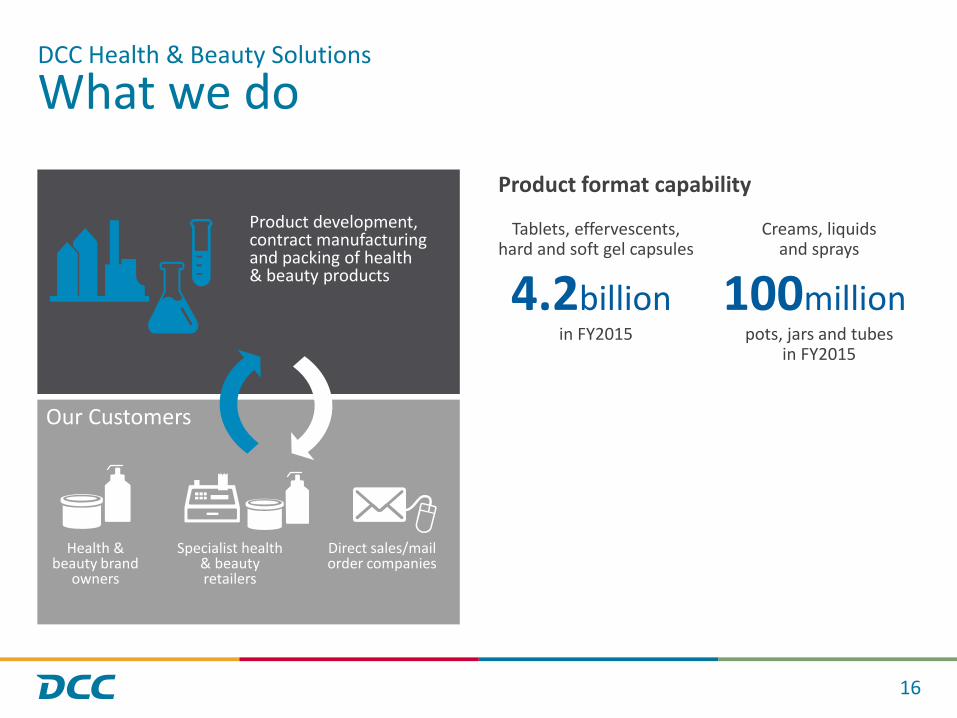
Product format capability
16
Product development, contract manufacturingand packing of health & beauty products
Health & beauty brand
owners
Specialist health & beauty retailers
Direct sales/mail order companies
Our Customers
DCC Health & Beauty Solutions
Tablets, effervescents,hard and soft gel capsules
Creams, liquidsand sprays
4.2billion 100millionin FY2015 pots, jars and tubes
in FY2015

Leading brands we support
• Nutrition and Beauty brands
• Specialist retailers
• Direct sales companies
• Consumer healthcare companies
17
DCC Health & Beauty Solutions

Product categories
18
DCC Health & Beauty Solutions
Nutritional
Beauty
Healthcare cream & liquids
Facial and Bodycare
Sport, Diet and Active lifestyles
Stay well / enhance health
Women’s Health
Baby and Children’s health
Suncare and Self tanning
Haircare
Men’s health& grooming
OTC andMedical Devices

Market background
Estimated market values (at RSP) Dynamics
• Long term growth markets• Pre-emptive healthcare • Active lifestyles
• Fast moving, innovative brands
• Trend to outsourcing• Innovation• Increasing regulation
19
Vitamins & Health Supplements
UK
£0.5bn
Europe
€3.0bn
Beauty products
UK
£6.0bn(excl. fragrances and colour cosmetics)
DCC Health & Beauty Solutions

Organic development strategy
20
• Drive continued growth with existing customers
• Leverage strength and depth of new product development (NPD) and technical resources
• Cross-selling of service capability across all facilities
• Attract new customers in European markets
• High quality facilities
• Experienced, technical sales force
• Relationships founded on NPD
DCC Health & Beauty Solutions

Acquisition focus & summary

Acquisition focus
22
• Expand DCC Vital product portfolio
• Product and business acquisitions
• Integration synergies
• Enhance DCC Health & Beauty Solutions service capability, in particular
• Sports nutrition products
• Healthcare creams and liquids
• Geographic expansion
• Primary focus on Northern Europe
• Routes to market
• Contract manufacturing footprint
DCC Healthcare

Substantial growth opportunity for DCC
23
DCC Healthcare
Favourable market
dynamics
Leadingmarketposition
Excellent operational
infrastructure
Track recordof organic and
acquisitive growth
Flow of acquisition
opportunities

11.1 13.1 13.2 11.6
15.9 17.4 18.4 21.0
28.3
39.7
2006 2007 2008 2009 2010 2011 2012 2013 2014 2015
Positioned for continued growth
24
DCC Healthcare
Operating Profit* (£m)
10 year CAGR
16.1%
* Excludes Virtus Inc. and Mobility & Rehab – disposed during the 10 year period
Financial StrategyJune 2015

Agenda
1
Cash flow since flotation in 1994
Cash inflow drivers
Cash outflow drivers
Balance sheet strength
ROCE vs. cost of capital
Acquisition preferences

Cash flow since flotation in 1994
• Revenue increased from £0.2bn to £10.6bn
• Operating profit increased from £17m to £228m. CAGR of 13.2%
• £214m working capital inflow
• Capex exceeded depreciation by £86m
• Free cash flow of £2.3bn
• Free cash flow conversion of 104% and CAGR of 13.9%
• Cash flow after interest and tax of £1.8bn
• Acquisition spend of £1.4bn
• Further development commitments of £465m
• Dividend / share buybacks of £0.7bn
• Pro forma net debt / EBITDA of c. 0.6 times (c.1.4 times at peak)
2
1 April 1994 – 31 March 2015 £m21 Year CAGR
Operating profit 2,195 13.2%
Decrease in working capital 214
Depreciation 614
Other (50)
Operating cash flow 2,973 13.5%
Capex (700)
Free cash flow 2,273 13.9%
Interest and tax (474)
Free cash flow after interest and tax 1,799 14.3%
Acquisitions (1,382)
Disposals / exceptionals 239
Dividends / share buybacks (680)
Share issues 66
Translation and other (10)
Net cash outflow 32
Opening net debt (2)
Closing net debt at 31 March 2015 30
Development commitments (465)
Placing proceeds 193
Pro – forma net debt (242)

Cash conversion since flotation
3
Free Cash Flow conversion (%)
• 21 year free cash flow conversion of 104% since flotation
• Conversion step up since 2008
• Strong cash flow generation supports development opportunities
104%21 year FCFconversion
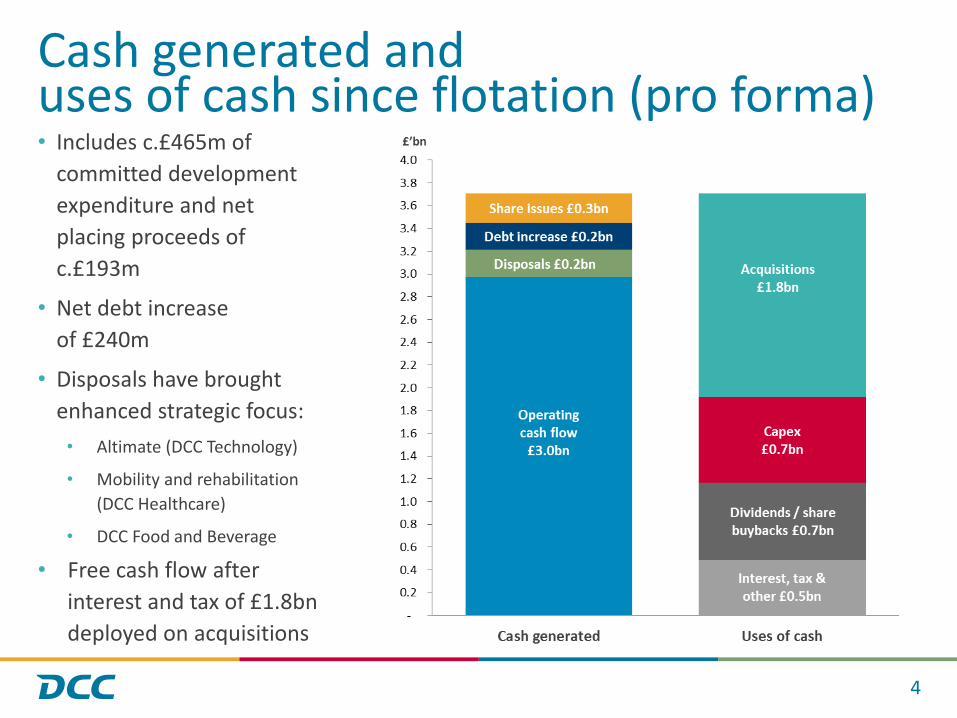
Cash generated and uses of cash since flotation (pro forma)• Includes c.£465m of
committed development
expenditure and net
placing proceeds of
c.£193m
• Net debt increase
of £240m
• Disposals have brought
enhanced strategic focus:
• Altimate (DCC Technology)
• Mobility and rehabilitation
(DCC Healthcare)
• DCC Food and Beverage
• Free cash flow after
interest and tax of £1.8bn
deployed on acquisitions
4

Cash inflow drivers (1) Operating profit
Operating Profit (£m) EPS (pence)
5
21 year CAGR
13.2%21 year CAGR
12.2%

Cash inflow drivers (2) Net Working Capital (NWC) Days
6
• Since 1994 working capital has decreased by £214m, notwithstanding revenue growth of over £10 billion
• From 2011 to 2015:
• Group NWC days reduced from 4.9 days to (4.9) days
• Non-Energy NWC days reduced from 19.2 days to 5.7 days
• Group debtor days reduced from 35.3 days to 31.0 days

Cash outflow drivers (1)Depreciation vs. capex
Depreciation vs. capex* By Division – Since 2000*
7
15 Year Total:
£0.6bn
• Since 1994 capex has exceeded depreciation by £86m
• Driven by organic growth and catch up for acquired businesses in DCC Energy
• Expected step up in capex spend in FY2016
• Ongoing spend to fund the organic growth of the Group
* Excluding DCC Food & Beverage

Cash outflow drivers (2)Dividends
Dividend Growth (pence sterling)
8
* Since flotation in 1994
21 year CAGR
14.6%

Cash outflow drivers (3)
9
£ millions7 years to
31 March 20017 years to
31 March 20087 years to
31 March 2015Total
21 years
Operating Profit 260 669 1,266 2,195
EBITDA 348 861 1,600 2,809
Free cash flow 228 493 1,552 2,273
Free cash flow conversion 88% 74% 123% 104%
Dividends / share buy backs (77) (240) (363) (680)
Acquisitions – spent (174) (473) (735) (1,382)
Acquisitions – committed (410) (410)
Acquisitions – total (174) (473) (1,145) (1,792)

• Excluding the Irish subsidiaries of DCC Food & Beverage which were disposed of in Q4 FY15
Cash outflow drivers (4) Acquisitions
Acquisitions* By Division – Since 2000*
10
15 Year Total
£1.6bn
• £1.8bn spent / committed on acquisitions since flotation in 1994
• Disposals net of exceptionals yielded £0.2bn
*Includes committed in 2014/2015 but not yet paid of c.£410m

Balance SheetStrong, Well Funded and Highly Liquid
Net Debt / EBITDA
• Strong balance sheet allows for acquisition flexibility and facilitates the leveraging of good commercial and credit terms with suppliers
• An enabler for acquisitions
• Total capital employed (i.e. net tangible assets and gross intangibles/goodwill) amounted to £1.16bn at 31 March 2015
• Average maturity of debt at 31 March 2015 was 7 years
• Average credit margin over euribor / libor of 1.65%
• Cash resources of £1.1bn (pro forma £0.85bn)
11
Translated at balance sheet date fx rate
* Adjusting for placing and committed acquisition spend
2015 Position Actual Lender Covenants
Net Debt / EBITDA n/a 3.5
EBITDA – Net Interest 9.9 3.0
Total Equity (£'m) 987 423
2015 £’m
2014 £’m
Fixed assets 465 469
Working capital (144) (32)
Other net operating liabilities (86) (95)
Net tangible assets 235 342
Goodwill / intangible assets 759 744
Capital employed 994 1,086
Net cash / debt 30 (86)
Deferred consideration/other (37) (53)
Total equity 987 946

Return on Total Capital EmployedThe Key Metric
ROCE (%) 31 March 2015*
Total Capital Employed by Division
12
Total Capital Employed at
31 March 2015
£1.2bn
* Continuing operations
• Creation of shareholder value through a combination of operational efficiency, organic and acquisitive growth
• Core strategic aim to deliver returns well in excess of DCC’s cost of capital (DCC WACC of c. 6.5% - 7.0%)
• Hurdle rates significantly higher than cost of capital

Acquisition Preferences
13

Why sell to DCC?
14
• We say what we will do, then we do what we say
• £1.2 billion spent / committed in the last seven years
• Provides assurance to both the owners (sellers) of the business and the suppliers to the business
• At 31 March 2015, DCC had cash and cash equivalents of £0.85 billion having adjusted for committed development spend and the share placing
• Carried interest for entrepreneurs
• Acquired businesses are not burdened with debt
• DCC Group management, financial and operational resources focused on supporting further business growth
• Devolved management structure with opportunities for increased management responsibility
Track record of buying businesses
Balance sheet strength, funding and liquidity position
Flexibility in deal structure
Supportive of further business growth

Key Messages
• Focus on ROCE and cash generation
• Prudent management of balance sheet
• Significant capacity for further bolt on acquisitions
• Long term value creation and delivery of returns well above cost of capital
•High cash conversion used to finance further acquisitions and pay dividends
15

Wrap Up / Q&A

How we create value
• Relentless focus on detail and KPI’s
• Driven to be the best, ambition to be better
• Alignment of Group and business strategies
• Capital allocation
• Expertise in creating and executing on acquisition opportunities
• Decentralised management structure
• Management continuity
• Management of risk to maintain corporate poise
1

Versus the FTSE 100 and FTSE 250
DCC TSR
2
Source: Datastream
1064%
96%
307%
0%
200%
400%
600%
800%
1000%
1200%
DCC FTSE 100 FTSE 250
Over last 14 years
426%
50%
120%
0%
50%
100%
150%
200%
250%
300%
350%
400%
450%
DCC FTSE 100 FTSE 250
Over last 7 years
4844%
366%
815%
0%
1000%
2000%
3000%
4000%
5000%
DCC FTSE 100 FTSE 250
Since flotation (21 years)