june2015 atlanta actuarial club presentation - individual annuity overview
TRANSCRIPT

INDIVIDUAL ANNUITY OVERVIEW
Winter Liu FSA, CFA, FRM
Atlanta Actuarial Club 2015 Spring Luncheon June 10, 2015

Agenda
18/04/2023 2
Sales trend
Product overview
Post 2008 product development
Change in market landscape
Glossary
18/04/2023 3
BB – benefit base
BV – book value (FDA)
DIA – deferred income annuity
FDA – fixed deferred annuity
FIA – fixed indexed annuity
GMxB – guaranteed minimum xxx benefit
GLWB – guaranteed lifetime withdrawal benefit
IA – indexed annuity, same as FIA
IVA – immediate variable annuity
MVA – market value adjustment (on FDA)
SPIA – single premium deferred annuity
VA – variable annuity
VIA – variable indexed annuity

U.S. Individual Annuity Sales Trend
18/04/2023 4
2008 Variable 2014 VariableCompany Share Company ShareTIAA 9% Jackson National 16%MetLife 9% Lincoln 9%ING 9% AIG 9%AXA 9% TIAA 9%Lincoln 7% Transamerica 7%Prudential 6% Prudential 7%John Hancock 6% AXA 7%AIG 5% MetLife 4%Hartford 5% Nationwide 4%Pacific Life 5% Riversource 4%Riversource 5% Pacific Life 3%Jackson National 4% New York Life 3%Other 20% Other 16%
Overall annuity sales held relatively steady since the Great Recession
VA recovered somewhat but still far below the 2007 record; some major players quit
Fixed annuity sales ballooned during the 2008 crash, partly due to liquidity driven incentives
Fixed annuity saw steady growth lately due to popularity of indexed annuity
2007 2008 2009 2010 2011 2012 2013 2014 -
50
100
150
200
250
300
184 156
128 141 159 147 145 140
67 103
105 76 76
67 79 90
U.S. Annuity Sales ($billions)
VA Fixed
Source: LIMRA
U.S. Fixed Annuity Sales Trend
18/04/2023 5
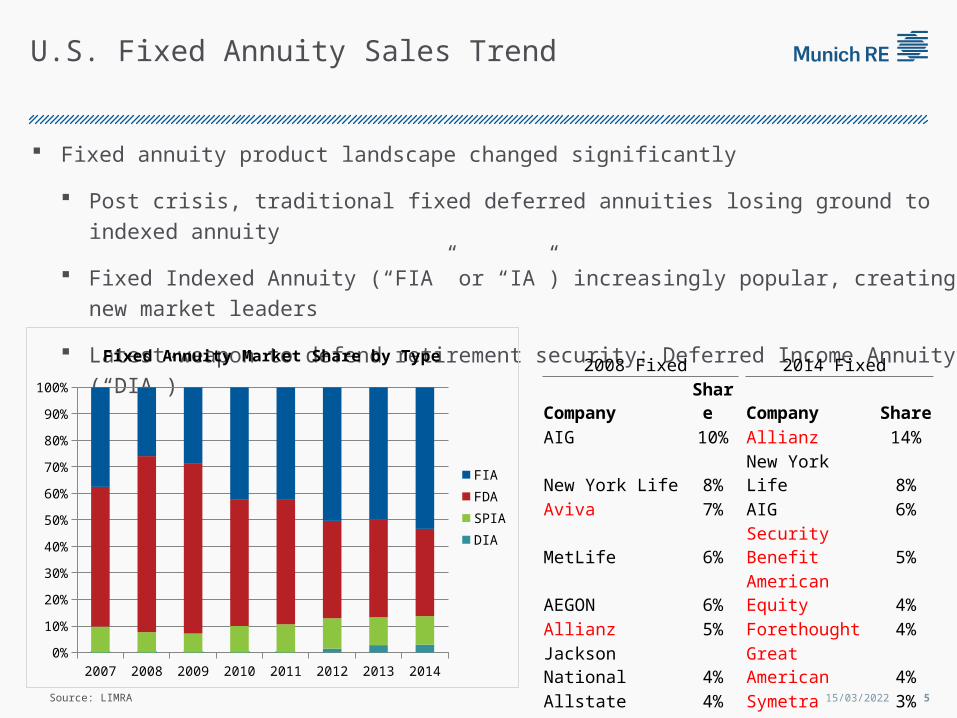
Fixed annuity product landscape changed significantly
Post crisis, traditional fixed deferred annuities losing ground to indexed annuity
Fixed Indexed Annuity (“FIA” or “IA”) increasingly popular, creating new market leaders
Latest weapon to defend retirement security: Deferred Income Annuity (“DIA”)
2008 Fixed 2014 Fixed
Company Share Company Share
AIG 10% Allianz 14%
New York Life 8% New York Life 8%
Aviva 7% AIG 6%
MetLife 6% Security Benefit 5%
AEGON 6% American Equity 4%
Allianz 5% Forethought 4%
Jackson National 4% Great American 4%
Allstate 4% Symetra 3%
Principal 4% MetLife 3%
Hartford 3% Pacific Life 3%
Other 45% Other 46%
Source: LIMRA
2007 2008 2009 2010 2011 2012 2013 20140%
10%
20%
30%
40%
50%
60%
70%
80%
90%
100%
Fixed Annuity Market Share by Type
FIA
FDA
SPIA
DIA
Annuity Product Design
18/04/2023 6
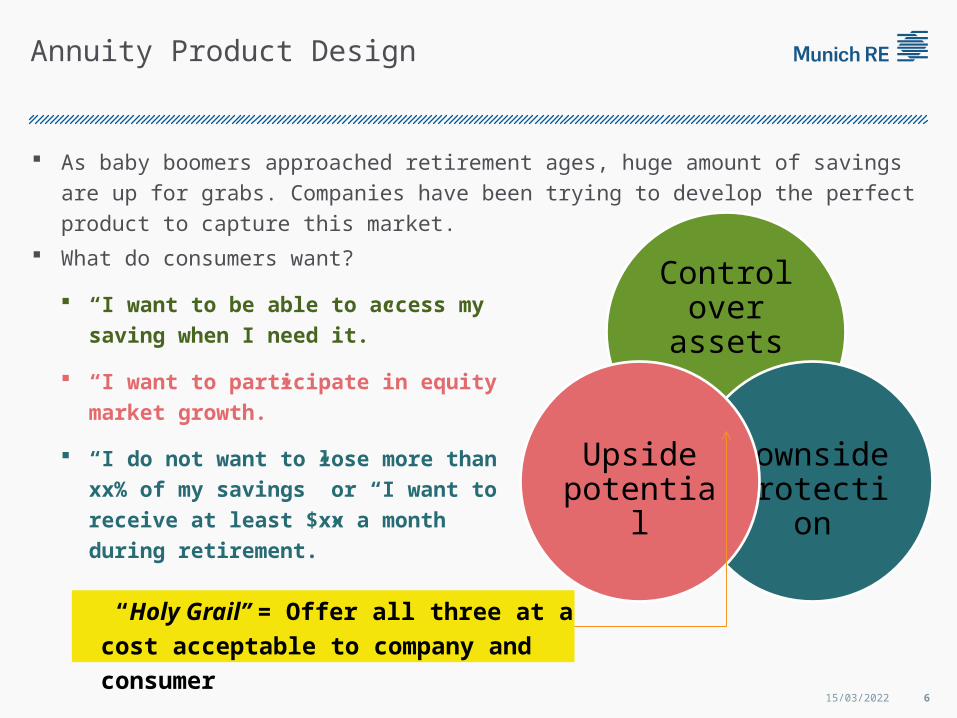
As baby boomers approached retirement ages, huge amount of savings are up for grabs.
Companies have been trying to develop the perfect product to capture this market.
Control over assets
Downside protection
Upside potential
What do consumers want?
“I want to be able to access my saving
when I need it.”
“I want to participate in equity market
growth.”
“I do not want to lose more than xx% of
my savings” or “I want to receive at
least $xx a month during retirement.”
“Holy Grail” = Offer all three at a cost
acceptable to company and consumer
Single Premium Immediate Annuity (“SPIA”)
18/04/2023 7
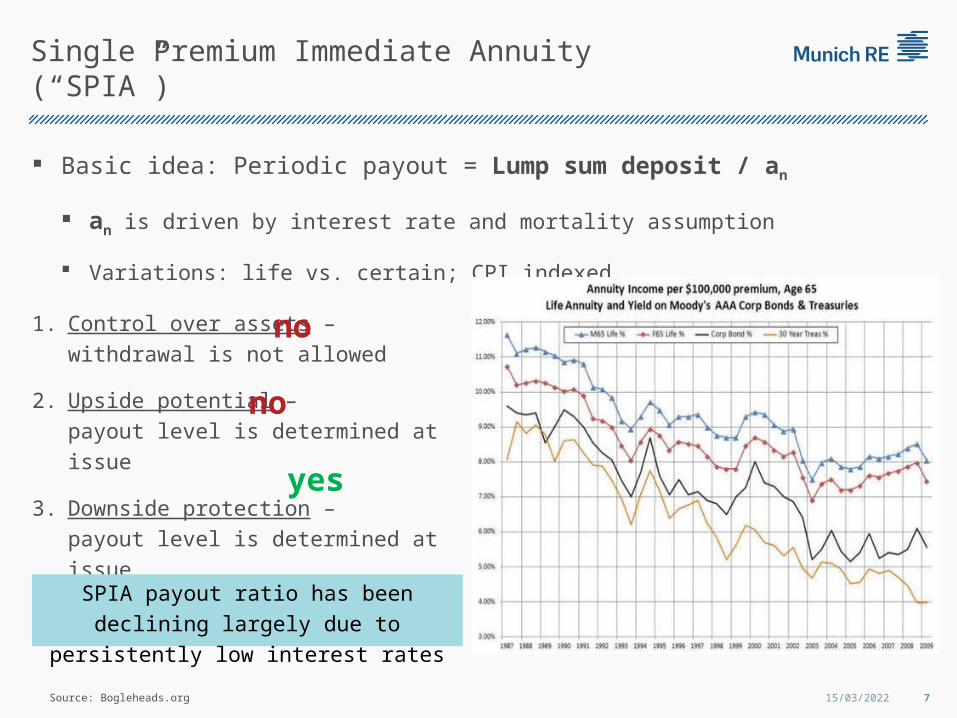
Basic idea: Periodic payout = Lump sum deposit / an
an is driven by interest rate and mortality assumption
Variations: life vs. certain; CPI indexed
1. Control over assets – withdrawal
is not allowed
2. Upside potential – payout level is
determined at issue
3. Downside protection – payout
level is determined at issue
no
no
yes
Source: Bogleheads.org
SPIA payout ratio has been declining largely
due to persistently low interest rates

Fixed Deferred Annuity (“FDA”)
18/04/2023 8
Basic idea: medium term savings account that pays a credited rate. The credited
rate is reset periodically but no less than a guaranteed rate.
Surrender charge applies, typically 3 to 7 years; free withdrawal allowed, typically 10%
Positioned between multi-year CD and bond fund; “book value” withdrawal
Credited rate typically follows a N+1 structure: initially guaranteed for N years, then
reset annually; determined based on portfolio yield less a spread
Guarantee rates prescribed, now between 1.0% ~ 1.5%
Significant variation: Market Value Adjustment (“MVA”), shifting some interest risk to
policyholders. Otherwise, contracts referred to as Book Value FDA.
1. Control over assets – withdrawal is allowed
2. Upside potential – declared rates follow a stable bond portfolio yield
3. Downside protection – principal is not at risk; credited rate has guarantee
no
yes
yes
Fixed Indexed Annuity (“FIA”)
18/04/2023 9
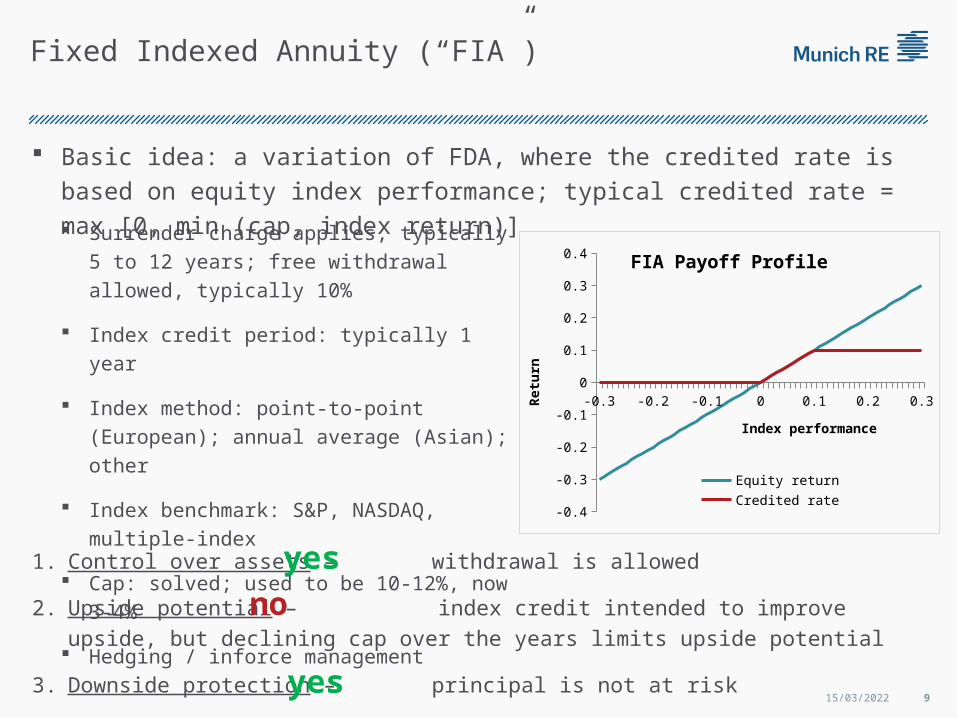
Basic idea: a variation of FDA, where the credited rate is based on equity index
performance; typical credited rate = max [0, min (cap, index return)]
1. Control over assets – withdrawal is allowed
2. Upside potential – index credit intended to improve upside, but declining cap
over the years limits upside potential
3. Downside protection – principal is not at risk
no
yes
yes
-0.3 -0.2 -0.1 0 0.1 0.2 0.3
-0.4
-0.3
-0.2
-0.1
0
0.1
0.2
0.3
0.4 FIA Payoff Profile
Equity return
Credited rate
Index performance
Ret
urn
Surrender charge applies, typically 5 to 12 years;
free withdrawal allowed, typically 10%
Index credit period: typically 1 year
Index method: point-to-point (European); annual
average (Asian); other
Index benchmark: S&P, NASDAQ, multiple-index
Cap: solved; used to be 10-12%, now 3-4%
Hedging / inforce management

Variable Annuity – Base product
18/04/2023 10
Basic idea: a mutual fund type account with tax deferral advantage
Surrender charge applies, typically 4 to 6 years; free withdrawal allowed, typically 10%
Multiple investment options, with management fees from 10bps to 200bps
Fixed rate account sometimes available, similar to FDA
Loads or fees deducted from account value
Often sold with riders (GMxB)
1. Control over assets – withdrawal is allowed
2. Upside potential – return similar to mutual funds
3. Downside protection – similar to mutual funds, principal is at riskno
yes
yes
Pursuit of the Holy Grail
18/04/2023 11
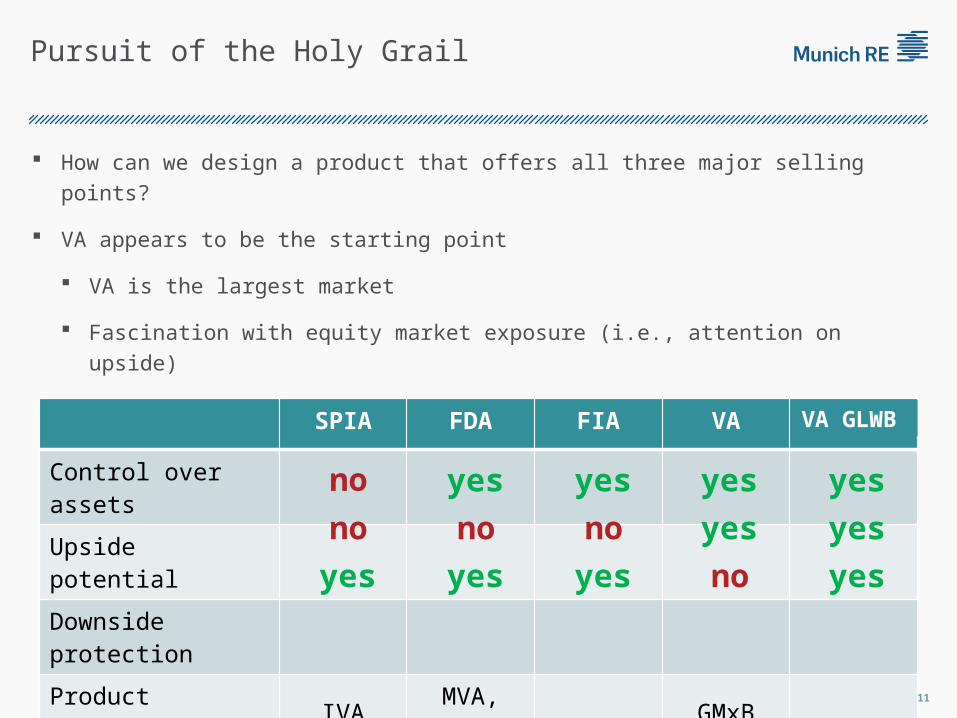
How can we design a product that offers all three major selling points?
VA appears to be the starting point
VA is the largest market
Fascination with equity market exposure (i.e., attention on upside)
Biggest risk is not taking any risk at all: principal protection ≠ downside protection
SPIA FDA FIA VA ??
Control over assets
Upside potential
Downside protection
Product variation IVA MVA, FIA GMxB
yes
yes
no
yes
yes
no yes
yes
noyes
yesno
no
yes
yes
VA GLWB

Guaranteed Lifetime Withdrawal Benefit (“GLWB”) RiderThe pursuit of Holy Grail is over – VA with GLWB rider
18/04/2023 12
Basic idea: GLWB allows policyholder to withdraw x% of Benefit Base (“BB”)
every year for life, regardless of account value performance, even if fund runs
out completely
1 2 3 4 5 6 7 8 9 10 -
500
1,000
1,500
2,000
2,500
GLWB Benefit Base Growth Pattern
AV
BB - Ratchet
BB - Rollup
Policy year
Benefit Base is a side calculation
Ratchet BBt = max (AV, BBt-1 )
Rollup BBt = BBt-1 x (1 + rollup rate)
Withdrawal %age increases by age when
GLWB is exercised (e.g., 4% at age 60)
Once GLWB is triggered, BB does not
decline unless excess withdrawal
GLWB type riders soon dominated VA sales
Companies designed complex dynamic hedging process to manage
cost and risk of GLWB … … Everything worked until it didn’t
Consumer Taste Change after 2008 Crash
18/04/2023 13
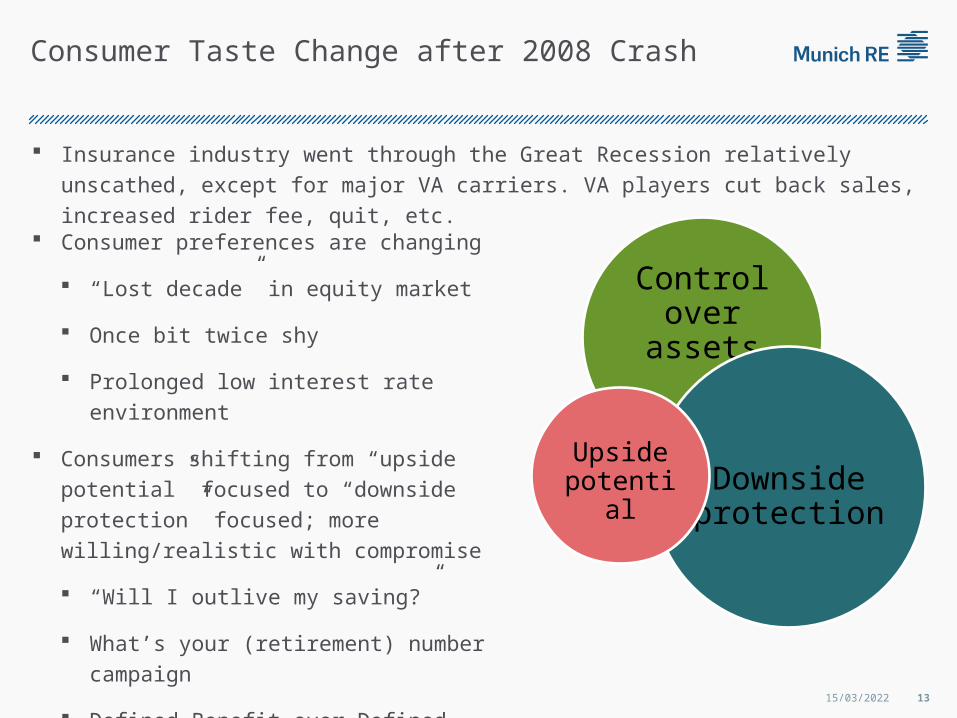
Insurance industry went through the Great Recession relatively unscathed, except for
major VA carriers. VA players cut back sales, increased rider fee, quit, etc.
Control over assets
Downside protection
Upside potential
Consumer preferences are changing
“Lost decade” in equity market
Once bit twice shy
Prolonged low interest rate environment
Consumers shifting from “upside potential”
focused to “downside protection” focused; more
willing/realistic with compromise
“Will I outlive my saving?”
What’s your (retirement) number campaign
Defined Benefit over Defined Contribution

Post 2008 Product Trend
18/04/2023 14
The GLWB Holy Grail failed, or did it?
VA development
Back to basics (i.e., no significant living benefit rider) - but sales still driven heavily by
GLWB due to consumer desire for downside protection
Volatility control funds – shift some hedging to consumer side; consumers appear to be
willing to shoulder the (implied) cost
Introduce a deferred income annuity (“DIA”) element
FIA development
Innovation in indexing strategy, e.g., Variable Indexed Annuity (“VIA”)
FIA a better chassis for GLWB? Lower AV volatility, more predictable Benefit Base pattern
GLWB popularity powered FIA sales; more than 85% FIA sold carries GLWB
Downside protection sells
Deferred Income Annuity (a.k.a. Longevity Annuity)
18/04/2023 15
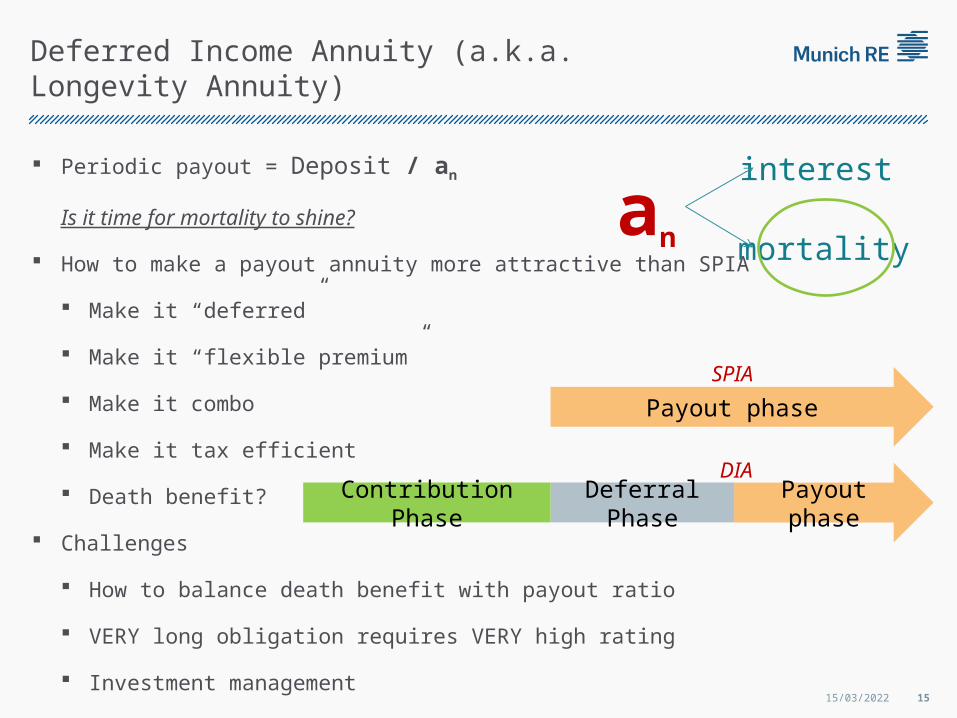
Periodic payout = Deposit / an
Is it time for mortality to shine?
How to make a payout annuity more attractive than SPIA
Make it “deferred”
Make it “flexible premium”
Make it combo
Make it tax efficient
Death benefit?
Challenges
How to balance death benefit with payout ratio
VERY long obligation requires VERY high rating
Investment management
an mortality
interest
Payout phase
Payout phaseDeferral PhaseContribution Phase
SPIA
DIA

Change in Market Landscape
18/04/2023 16
Private equity and alternative buyers enter market via acquisition
Inforce blocks viewed as a cheaper way to acquire assets under management
FDA / FIA particularly popular
Asset intensive
Relatively simple liabilities
Unattractive under market consistent valuation framework
Wave of M&A activities in the past 4 years
Apollo / Athene - RBC USA 2010, Aviva USA (annuity) 2012
Guggenheim - Security Benefit 2010, Equitrust 2011, SunLife USA (Annuity) 2012
Harbinger - Old Mutual 2010
Goldman / Global Atlantic - Forethought 2013, Aviva USA (life) 2013
Resolution - Lincoln Benefit 2013

New Valuation / Appraisal Framework
18/04/2023 17
New players with significant banking and asset expertise brought in a new
valuation/appraisal approach
Liability cost of fund (“COF”)
Asset transfer upon sales = NPV(COF, Product cash flow)
ROE = (Asset return – COF) x Leverage + Asset return
where Leverage = Liability / Required Surplus
Assuming 10x leverage
Asset return (over Swap)COF (over
Swap) 1% 2% 3%
0% 11.0% 22.0% 33.0%
1% 1.0% 12.0% 23.0%
2% -9.0% 2.0% 13.0%
