jupiter asset management series plc (previously merian
TRANSCRIPT

.
Jupiter Asset Management Series Plc (previously Merian Global Investors Series Plc)
Annual Report and Audited Financial Statements
For the financial year ended 31 December 2020

Jupiter Asset Management Series Plc Annual Report and Audited Financial Statements for the financial year ended 31 December 2020
2
Jupiter Asset Management Series Plc
An investment company with variable capital incorporated with limited liability in Ireland, established as an umbrella fund
with segregated liability between Sub-Funds and authorised pursuant to the European Communities (Undertakings for
Collective Investment in Transferable Securities) Regulations, 2011, as amended, and the Central Bank (Supervision and
Enforcement) Act 2013 (Section 48(1)) (Undertakings for Collective Investment in Transferable Securities) Regulations 2019
(Registered Number 271517)
This annual report may be translated into other languages. Any such translation shall be a direct translation of the English
text. In the event of any inconsistency or ambiguity in relation to the meaning of any word or phrase in the translation, the
English text will prevail. Any disputes as to the terms thereof shall be governed by, and construed in accordance with, the law
of Ireland.

Jupiter Asset Management Series Plc Annual Report and Audited Financial Statements for the financial year ended 31 December 2020
3
Contents
Jupiter Asset Management Series Plc……………………………………………………………….……………………..2 Directory…………………………………………………………………………………………………………………………....6 General Information……………………………………………………………………………………………………….……11 Directors’ Report………………………………………………………………………………………..……………………….16 Report of the Depositary to the Shareholders ………………………………………………………………………….20 Investment Advisors’/ Managers’ Reports…………………………………………………………….……..………….21
Jupiter China Equity Fund……………………………………………………………………………………………………………21 Jupiter Merian World Equity Fund…………………………………………………………………………………………………22 Jupiter Pacific Equity Fund……………………………………………………………………………………..……………………23 Merian European Equity Fund………………………………………………………………………………………………………24 Jupiter Merian US Equity Income Fund…………………………………………………………………………………………..25
Jupiter Merian North American Equity Fund (IRL)……………………………………………………………………………27 Merian Global Dynamic Bond Fund……………………………………………………………………………………………….28 Jupiter Emerging Market Debt Fund……………………………………………………………………………………………..30 Jupiter Global Emerging Markets Focus Fund…………………………………………………………………………………31 Merian Asian Equity Income Fund…………………………………………………………………………………………………33 Jupiter Local Currency Emerging Market Debt Fund………………………………………………………………………..35 Jupiter UK Alpha Fund (IRL) ………………………………………………………………………………………………………..37 Jupiter UK Smaller Companies Focus Fund……………………………………………………………………………………..39 Jupiter UK Dynamic Equity Fund…………………………………………………………………………………………………..40 Jupiter Merian Global Equity Absolute Return Fund………………………………………………………………………...41 Jupiter Strategic Absolute Return Bond Fund………………………………………………………………………………….43 Jupiter Europe (ex UK) Smaller Companies Fund……………………………………………………………………………..45 Jupiter Merian Global Equity Income Fund (IRL)……………………………………………………………………………...47 Jupiter Gold & Silver Fund………………………………………………………………...................................................48 Jupiter UK Specialist Equity Fund………………………………………………………………........................................49 Jupiter Financials Contingent Capital Fund………………………………………………………………..........................50
Portfolio of Investments……………………………………………………………………………………………………...52
Jupiter China Equity Fund…………………………………………………...................................................……………52 Jupiter Merian World Equity Fund……………………………………………………………….......................................54 Jupiter Pacific Equity Fund………………………………………………………………………………………........……………66 Merian European Equity Fund…………………………………………………………………………………………...…………72 Jupiter Merian US Equity Income Fund………………………………………………………………………………..........…77 Jupiter Merian North American Equity Fund (IRL)……………………………………………………………………………83 Merian Global Dynamic Bond Fund……………………………………………………………………………………………….89 Jupiter Emerging Market Debt Fund……………………………………………………………………………………………..95 Jupiter Global Emerging Markets Focus Fund…………………………………………………………………….….………100 Merian Asian Equity Income Fund…………………………………………………………………………………………….…102 Jupiter Local Currency Emerging Market Debt Fund………………………………………………………………..…….108 Jupiter UK Alpha Fund (IRL) ……………………………………………………………………………………………………....112 Jupiter UK Smaller Companies Focus Fund…………………………………………………………………………………...115

Jupiter Asset Management Series Plc Annual Report and Audited Financial Statements for the financial year ended 31 December 2020
4
Contents (continued)
Portfolio of Investments (continued) Jupiter UK Dynamic Equity Fund………………………………………………………………………………………………...118 Jupiter Merian Global Equity Absolute Return Fund………………………………………………………………………..121 Jupiter Strategic Absolute Return Bond Fund………………………………………………………………………............142 Jupiter Europe (ex UK) Smaller Companies Fund………………………………..……………………………………...…….147 Jupiter Merian Global Equity Income Fund (IRL) …………………………………...……………………………………….150 Jupiter Gold & Silver Fund……………………………………………………………………………………………................160 Jupiter UK Specialist Equity Fund………………………………………………………………………………………………..163 Jupiter Financials Contingent Capital Fund………………………………………………………………........................168
Independent Auditor’s Report to the Members of Jupiter Asset Management Series Plc……………....171 Financial Statements……………………………........………………........………………........……………….........174
Statement of Operations……………………………........……………………………........…………………………….......174 Statement of Financial Position……………………………........……………………………........………………………...182 Statement of Changes in Net Assets Attributable to Redeemable Participating Shareholders……………...191 Notes to the Financial Statements……………………………........……………………………........…………………….195
Significant Purchases and Sales (unaudited).……………………………........………………........……………...351
Jupiter China Equity Fund.………………………............………………........…........………………........……………...351 Jupiter Merian World Equity Fund……………............………………........…........………………........…….............354 Jupiter Pacific Equity Fund……………............………………........…........………………........…….........................356 Merian European Equity Fund……………............………………........…........………………........……...................358 Jupiter Merian US Equity Income Fund……………............………………........…........………………........……......360 Jupiter Merian North American Equity Fund (IRL)……………............………………........…........………………...362 Merian Global Dynamic Bond Fund……………............………………........…........………………........……...........364 Jupiter Emerging Market Debt Fund……………............………………........…........………………........…….........366 Jupiter Global Emerging Markets Focus Fund……………............………………........…........……………….........368 Merian Asian Equity Income Fund……………............………………........…........………………........…….............370 Jupiter Local Currency Emerging Market Debt Fund……………............………………........…........……...........372 Jupiter UK Alpha Fund (IRL)……………............………………........…........………………........……......................374 Jupiter UK Smaller Companies Focus Fund……………............………………........…........……………….............376 Jupiter UK Dynamic Equity Fund……………............………………........…........………………........……...............378 Jupiter Merian Global Equity Absolute Return Fund……………............………………........…........……………...380 Jupiter Strategic Absolute Return Bond Fund……………............………………........…........……………….........382 Jupiter Europe (ex UK) Smaller Companies Fund……………............………………........…........………………....384 Jupiter Merian Global Equity Income Fund (IRL)......………………........…........………………........…….............386 Jupiter Gold & Silver Fund……………............………………........…........………………........……..........................388 Jupiter UK Specialist Equity Fund……………............………………........…........………………........……..............390 Jupiter Financials Contingent Capital Fund……………............………………........…........………………..............392
Price Record (unaudited)……………............………………........…........………………...........………………....394 Total Expense Ratios (unaudited)……………............………………........…........…................……………....399 Fund Performance (unaudited)……………............………………........…........……....................…………....405

Jupiter Asset Management Series Plc Annual Report and Audited Financial Statements for the financial year ended 31 December 2020
5
Contents (continued)
Events During the Financial Year (unaudited) ……………............………………........…........………………..406 Supplementary Information (unaudited)……………............………………........…........….....……………....409
The below footnotes are used and applied consistently throughout the document for reference purposes. *Merian Global Strategic Bond Fund (IRL) closed on 25 April 2019. **Merian Style Premia Absolute Return Fund closed on 18 June 2019. ***Merian Investment Grade Corporate Bond Fund closed on 31 July 2019. ^The assets of Old Mutual Compass Portfolio 2, Old Mutual Compass Portfolio 3, Old Mutual Compass Portfolio 4 and Old Mutual Compass Portfolio 5 were transferred into Quilter Investors ICAV on 7 June 2019. On 23 August 2019, Old Mutual Compass Portfolio 2 was re-named Merian Compass Portfolio 2, Old Mutual Compass Portfolio 3 was re-named Merian Compass Portfolio 3, Old Mutual Compass Portfolio 4 was re-named Merian Compass Portfolio 4 and Old Mutual Compass Portfolio 5 was re-named Merian Compass Portfolio 5. ^^The assets of Old Mutual European Best Ideas Fund were transferred into Merian European Equity Fund on 30 August 2019. Old Mutual European Best Ideas Fund was re-named Merian European Best Ideas Fund on 16 September 2019. (a) Old Mutual Monthly Income High Yield Bond Fund closed on 14 September 2018. Old Mutual Monthly Income High Yield Bond Fund was re-named Merian Monthly Income High Yield Bond Fund on 16 September 2019. (b) Old Mutual Japanese Equity Fund closed on 26 January 2018. Old Mutual Japanese Equity Fund was re-named Merian Japanese Equity Fund on 16 September 2019. (c) Old Mutual Pan African Fund closed on 28 February 2018. Old Mutual Pan African Fund was re-named Merian Pan African Fund on 16 September 2019. These Sub-Funds were revoked by the Central Bank of Ireland post year end and they are therefore included in this Annual Report and Audited Financial Statements for the financial year ended 31 December 2020. See subsequent events note for further details. However, no Investment Advisers’ reports are included for these funds as they were dormant and not active for the full financial year ended 31 December 2020.

Jupiter Asset Management Series Plc Annual Report and Audited Financial Statements for the financial year ended 31 December 2020
Directory
6
Board of Directors Bronwyn Wright (Irish)† Tom Murray (Irish)† Adrian Waters (Irish)† Nicola Stronach (British) (resigned 26 November 2020) Jasveer Singh (British) (appointed 2 November 2020)
†Independent, Non-Executive Directors Investment Manager Jupiter Investment Management Limited (formerly Merian Global Investors (UK) Limited) Until 7 September 2020 Millennium Bridge House 2 Lambeth Hill London EC4P 4WR From 7 September 2020 The Zig Zag Building 70 Victoria Street London SW1E 6SQ Manager and Distributor Jupiter Asset Management (Europe) Limited (formerly Merian
Global Investors (Europe) Limited) The Wilde-Suite G01 The Wilde 53 Merrion Square South Dublin 2 D02 PR63 Ireland
Investment Adviser to the Investment Manager Ping An of China Asset Management (Hong Kong) for the Jupiter China Equity Fund Company Limited, Suite 2301
Two International Finance Centre 8 Finance St. Central Hong Kong
Investment Sub-Advisers to the Investment Manager Liontrust Investment Partners LLP for the Merian European Best Ideas Fund^^ 2 Savoy Court
London WC2R 0EZ United Kingdom Odey Asset Management LLP 18 Upper Brook Street London W1K 7PU United Kingdom Quilter Investors Limited Senator House 85 Queen Victoria Street London EC4V 4AB United Kingdom Wellington Management International Ltd Cardinal Place 80 Victoria Street London SW1E 5JL United Kingdom

Jupiter Asset Management Series Plc Annual Report and Audited Financial Statements for the financial year ended 31 December 2020
Directory (continued)
7
Investment Sub-Advisers to the Investment Manager Jupiter Investment Management Limited (formerly Merian for the Merian European Best Ideas Fund^^ (continued) Global Investors (UK) Limited) The Zig Zag Building 70 Victoria Street London SW1E 6SQ Investment Adviser to the Investment Manager Quilter Investors Limited for the Merian Compass Portfolio 2^ Senator House for the Merian Compass Portfolio 3^ 85 Queen Victoria Street for the Merian Compass Portfolio 4^ London for the Merian Compass Portfolio 5^ EC4V 4AB United Kingdom Depositary Citi Depositary Services Ireland Designated Activity Company
1 North Wall Quay Dublin 1 D01 T8Y1 Ireland
Administrator, Registrar and Transfer Agent Citibank Europe plc 1 North Wall Quay Dublin 1 D01 T8Y1 Ireland Company Secretary Tudor Trust Limited 33 Sir John Rogerson’s Quay Dublin 2 D02 XK09 Ireland Registered Office 33 Sir John Rogerson’s Quay Dublin 2 D02 XK09 Ireland Auditor KPMG 1 Harbourmaster Place International Financial Services Centre Dublin 1 D01 F6F5 Ireland Legal Advisers Dillon Eustace 33 Sir John Rogerson’s Quay Dublin 2 D02 XK09 Ireland Hong Kong Representative Jupiter Asset Management (Asia Pacific) Limited (formerly Merian Global Investors (Asia Pacific) Limited) Unit 2, 5/F Two Chinachem Central 26 Des Voeux Road Central Hong Kong Paying Agent in Luxembourg BNP Paribas Securities Services Luxembourg Branch 60 Avenue John F. Kennedy 1855 Luxembourg Grand Duchy of Luxembourg

Jupiter Asset Management Series Plc Annual Report and Audited Financial Statements for the financial year ended 31 December 2020
Directory (continued)
8
Paying Agent in Switzerland BNP Paribas Securities Services, Paris Succursale de Zurich, Selnaustrasse 16 8001 Zurich Switzerland Representative in Switzerland First Independent Fund Services Limited Klausstrasse 33 8008 Zurich Switzerland Facilities Agent in the United Kingdom Jupiter Investment Management Limited (formerly Merian Global Investors (UK) Limited)
The Zig Zag Building 70 Victoria Street
London SW1E 6SQ French Centralising and Financial Agent BNP Paribas Securities Services 3 Rue d’Antin 75002 Paris France Paying Agent in Austria Erste Bank der Oesterreichischen Sparkassen AG, France Graben 21 1010 Wien Austria Paying Agents in Italy Allfunds Bank, S.A.U. Via Santa Margherita 720121 Milan Italy BNP Paribas Securities Services Ansperto 5 20123 Milano Italy SGSS. S.p.A, Milan Via Benigno Crespi n19A MAC2 Italy Paying Agent in Sweden Skandinaviska Enskilda Banken AB (publ) Kungsträdgårdsgatan 8
SE-106 40 Stockholm Sweden
Private placement and Master Agent in Taiwan Capital Gateway Securities Investment Consulting
Enterprise No. 171 Sung-De Road Taipei 110 Taiwan
German Information Agent GerFIS – German Fund Information Service UG Zum Eichhagen 4 21382 Brietlingen Deutschland Belgian Financial Agent Caceis Belgium SA B – 1000 Brussels, Avenue du Port 86 C b320 Belgium

Jupiter Asset Management Series Plc Annual Report and Audited Financial Statements for the financial year ended 31 December 2020
Directory (continued)
9
South Africa Representative Old Mutual Unit Trust Managers (RF) (PTY) Ltd Mutual Park Jan Smuts Drive Pinelands 7405 South Africa

Jupiter Asset Management Series Plc Annual Report and Audited Financial Statements for the financial year ended 31 December 2020
Directory (continued)
10
Copies of the Memorandum and Articles of Association, the Prospectus, the Key Investor Information documents, the annual and semi-annual reports of the Company are available free of charge at the office of the representative or agent of each jurisdiction.
Additionally, a list of the purchases and sales of each Sub-Fund made during the financial year 1 January 2020 to 31 December 2020 may be obtained free of charge from the Representative in Switzerland.
The following Sub-Funds are not authorised in Hong Kong and not available to Hong Kong residents:
Jupiter China Equity Fund Merian Japanese Equity Fund(b) Jupiter Merian US Equity Income Fund Merian European Best Ideas Fund^^ Merian Investment Grade Corporate Bond Fund*** Jupiter Global Emerging Markets Focus Fund Jupiter Local Currency Emerging Market Debt Fund Jupiter UK Smaller Companies Focus Fund Jupiter UK Dynamic Equity Fund Jupiter Merian Global Equity Absolute Return Fund Jupiter Strategic Absolute Return Bond Fund Merian Pan African Fund(c) Merian Monthly Income High Yield Bond Fund(a) Merian Compass Portfolio 2^ Merian Compass Portfolio 3^ Merian Compass Portfolio 4^ Merian Compass Portfolio 5^ Jupiter UK Specialist Equity Fund Merian Style Premia Absolute Return Fund** Jupiter Financials Contingent Capital Fund Merian Global Strategic Bond Fund (IRL)*
The following Sub-Funds are not authorised in Sweden and not available to Swedish residents:
Jupiter Europe (ex UK) Smaller Companies Fund Merian Compass Portfolio 2^ Merian Compass Portfolio 3^ Merian Compass Portfolio 4^ Merian Compass Portfolio 5^

Jupiter Asset Management Series Plc Annual Report and Audited Financial Statements for the financial year ended 31 December 2020
General Information
11
Structure Jupiter Asset Management Series Plc (previously Merian Global Investors Series Plc) (the “Company”) is an umbrella fund with segregated liability between Sub-Funds established as an open-ended investment company with variable capital, incorporated on 2 September 1997, organised under the laws of Ireland as a public limited company pursuant to the Companies Act 2014, the Central Bank (Supervision and Enforcement) Act 2013 (Section 48(1)) (Undertakings for Collective Investment in Transferable Securities) Regulations 2019 and the European Communities (Undertakings for Collective Investment in Transferable Securities) Regulations, 2011, as amended (the “Regulations”) and has been authorised by the Central Bank of Ireland (“Central Bank”) as a UCITS within the meaning of the Regulations. The share capital of the Company shall at all times equal the Net Asset Value (“NAV”). The authorised share capital of the Company is EUR 38,082 represented by 30,000 Subscriber Shares of no par value and 500,000,000,000 redeemable participating shares of no par value. The Company has repurchased all but one of the Subscriber Shares.
Additional information On 1 July 2020, Jupiter Asset Management completed the acquisition of the Merian Global Investors Group. The entire issued share capital of Merian Global Investors Limited was acquired by Jupiter Fund Management plc. As a result, the Merian Group is now a wholly-owned subsidiary of Jupiter. On 15 February 2021, the following sub-funds changed their names as set out below:
New Sub-Fund Name Old Sub-Fund Name
Jupiter China Equity Fund Merian China Equity Fund
Jupiter Merian World Equity Fund Merian World Equity Fund
Jupiter Pacific Equity Fund Merian Pacific Equity Fund
Jupiter Merian US Equity Income Fund Merian US Equity Income Fund
Jupiter Merian North American Equity Fund (IRL) Merian North American Equity Fund
Jupiter Emerging Market Debt Fund Merian Emerging Market Debt Fund
Jupiter Global Emerging Markets Focus Fund Merian Global Emerging Markets Fund
Jupiter Local Currency Emerging Market Debt Fund Merian Local Currency Emerging Market Debt Fund
Jupiter UK Alpha Fund (IRL) Merian UK Alpha Fund (IRL)
Jupiter UK Smaller Companies Focus Fund Merian UK Smaller Companies Focus Fund
Jupiter UK Dynamic Equity Fund Merian UK Dynamic Equity Fund
Jupiter Merian Global Equity Absolute Return Fund Merian Global Equity Absolute Return Fund
Jupiter Strategic Absolute Return Bond Fund Merian Strategic Absolute Return Bond Fund
Jupiter Europe (ex UK) Smaller Companies Fund Merian Europe (ex UK) Smaller Companies Fund
Jupiter Merian Global Equity Income Fund (IRL) Merian Global Equity Income Fund (IRL)
Jupiter Gold & Silver Fund Merian Gold & Silver Fund
Jupiter UK Specialist Equity Fund Merian UK Specialist Equity Fund
Jupiter Financials Contingent Capital Fund Merian Financials Contingent Capital Fund

Jupiter Asset Management Series Plc Annual Report and Audited Financial Statements for the financial year ended 31 December 2020
General Information (continued)
12
Investment Objectives of the Sub-Funds Jupiter China Equity Fund The investment objective of the Jupiter China Equity Fund is to seek to achieve long-term capital appreciation by investing in a well-diversified portfolio of equity securities issued by companies with either the predominant part of their assets in, or the predominant part of their revenues derived from, the People’s Republic of China, Hong Kong and/or Taiwan that are listed, traded or dealt in on Regulated Markets in the People’s Republic of China, Hong Kong, Taiwan, the United States of America (“US”), Singapore, Korea, Thailand and Malaysia or in a member state of the Organisation for Economic Co-Operation and Development (“OECD”). Jupiter Merian World Equity Fund The investment objective of the Jupiter Merian World Equity Fund is to seek to achieve asset growth through investment in a well-diversified portfolio of securities of issuers worldwide. It is not proposed to concentrate investments in any one geographical region, industry or sector. Jupiter Pacific Equity Fund The investment objective of the Jupiter Pacific Equity Fund is to seek to achieve asset growth through investment in a well-diversified portfolio of securities of Pacific region issuers or of issuers established outside the Pacific region which have a predominant proportion of their assets or business operations in the Pacific region. It is not proposed to concentrate investments in any one industry or sector. Merian European Equity Fund The investment objective of the Merian European Equity Fund is to seek to achieve asset growth through investment in a well-diversified portfolio of securities of European issuers, of issuers established outside Europe which have a predominant proportion of their assets or business operations in Europe, or of securities listed or having a listing on a European exchange. It is not proposed to concentrate investments in any one industry or sector. Jupiter Merian US Equity Income Fund The investment objective of the Jupiter Merian US Equity Income Fund is to seek to achieve asset growth through investment in a diversified portfolio of equity and equity-related securities. Jupiter Merian North American Equity Fund (IRL) The investment objective of the Jupiter Merian North American Equity Fund (IRL) is to seek to achieve long term capital growth through the active management of a diversified portfolio invested primarily in North American stock markets. It is not proposed to concentrate investments in any one industry or sector. Merian Global Dynamic Bond Fund The investment objective of the Merian Global Dynamic Bond Fund is to seek to maximise total return consistent with preservation of capital and prudent investment management. Jupiter Emerging Market Debt Fund The investment objective of the Jupiter Emerging Market Debt Fund is to seek to achieve asset growth through investment in a well-diversified portfolio of fixed and variable rate debt securities issued in Emerging Markets. Jupiter Global Emerging Markets Focus Fund The investment objective of the Jupiter Global Emerging Markets Focus Fund is to seek to achieve asset growth through investment in a well-diversified portfolio of equity securities of issuers in the Emerging Markets or of issuers established outside of the Emerging Markets, which have a predominant proportion of their assets or business operations in the Emerging Markets and which are listed, traded or dealt in on a Regulated Market worldwide. It is not proposed to concentrate investments in any one industry or sector. Merian Asian Equity Income Fund The investment objective of the Merian Asian Equity Income Fund is to seek to achieve a total return through a combination of income and capital growth.

Jupiter Asset Management Series Plc Annual Report and Audited Financial Statements for the financial year ended 31 December 2020
General Information (continued)
13
Investment Objectives of the Sub-Funds (continued) Jupiter Local Currency Emerging Market Debt Fund The investment objective of the Jupiter Local Currency Emerging Market Debt Fund is to seek to achieve total return through investment in a well-diversified portfolio of fixed and variable rate debt securities issued in the Emerging Markets worldwide and which are primarily denominated in the local currency of the issuer. Jupiter UK Alpha Fund (IRL) The investment objective of the Jupiter UK Alpha Fund (IRL) is to seek to achieve capital appreciation. Jupiter UK Smaller Companies Focus Fund The investment objective of the Jupiter UK Smaller Companies Focus Fund aims to provide capital growth from investing primarily in an equity portfolio of UK smaller companies. Smaller companies are defined for this purpose as those companies which are quoted on a Regulated Market and which have a market capitalisation no greater than the largest company in the Numis Smaller Companies Index at the time of initial investment. The Numis Smaller Companies Index is designed to monitor the performance of the smaller companies sector. Jupiter UK Dynamic Equity Fund The investment objective of the Jupiter UK Dynamic Equity Fund is to achieve capital appreciation by taking long and short positions principally in UK equities outside of the FTSE 100 Index. Jupiter Merian Global Equity Absolute Return Fund The investment objective of the Jupiter Merian Global Equity Absolute Return Fund is capital appreciation while closely controlling risk. In addition, the Sub-Fund intends to deliver absolute returns that have a low correlation with equity and bond markets. Jupiter Strategic Absolute Return Bond Fund The investment objective of the Jupiter Strategic Absolute Return Bond Fund is to seek to deliver positive total returns on a rolling twelve month basis with stable levels of volatility uncorrelated to bond and equity market conditions. Jupiter Europe (ex UK) Smaller Companies Fund The investment objective of the Jupiter Europe (ex UK) Smaller Companies Fund is to achieve long term capital growth through investing primarily in an equity portfolio of smaller companies incorporated in Europe (excluding the United Kingdom) or of companies incorporated outside of Europe (excluding the United Kingdom) which have a predominant proportion of their assets and/or business operations in Europe (excluding the United Kingdom). Jupiter Merian Global Equity Income Fund (IRL) The investment objective of the Jupiter Merian Global Equity Income Fund (IRL) is to seek to achieve a total return through a combination of income and capital growth. Jupiter Gold & Silver Fund The investment objective of the Jupiter Gold & Silver Fund is to seek to achieve a total return by investing predominantly in listed equities. Jupiter UK Specialist Equity Fund The investment objective of the Jupiter UK Specialist Equity Fund is to seek to achieve capital appreciation by taking long and short positions mainly in UK equities outside the FTSE 100 Index, whilst seeking to deliver absolute returns in all market conditions. Jupiter Financials Contingent Capital Fund The investment objective of the Jupiter Financials Contingent Capital Fund is to seek to achieve a total return through a combination of income and capital growth from a portfolio of primarily fixed and variable rate debt securities issued by financial institutions with minimum capital requirements, such as insurers and banks.

Jupiter Asset Management Series Plc Annual Report and Audited Financial Statements for the financial year ended 31 December 2020
General Information (continued)
14
Distribution Policy Distributions to holders of Redeemable Participating Shares are recorded in the Statement of Operations as finance costs. Distributions paid and proposed during the financial years ended 31 December 2020 and 31 December 2019 with respect to certain Share Classes are outlined in Note 10. All of the other Sub-Funds’ income and capital gains were reinvested in accordance with the investment objective and policy of the Sub-Funds.
The Company will declare a dividend in respect of the Classes of Shares of the Sub-Funds as set out in the Prospectus of the Company. For all Classes of Shares that are not distributing, the Sub-Fund’s income and capital gains will be reinvested in accordance with the investment objectives and investment policies of the Sub-Fund. Fixed Distribution Share Classes The Directors at their absolute discretion, have the power to issue Classes of Shares that offer a fixed distribution (“Fixed Distribution Share Classes”). Where the Directors have determined that a Share Class in any Fund is to constitute a Fixed Distribution Share Class it will have the “(F)” designation after its name. Where such Share Classes are offered in the Supplement for the relevant Fund, the Directors intend topay a fixed distribution of income or gains. The Directors will periodically review the Fixed Distribution Share Classes and reserve the right to make changes, for example if the investment income after expenses is higher than the target fixed distribution the Directors may declare the higher amount to be distributed. Equally the Directors may deem it is appropriate to declare a dividend lower than the target fixed distribution. Where in the interest of the Shareholders, especially where the generation of income has a higher priority than capital growth or the generation of income and capital growth have equal priority, a portion or all of the fees and expenses attributable to the Fixed Distribution Share Classes may be charged against the capital of such Shares instead of against income where necessary in order to ensure there is sufficient income to meet the fixed distribution payments.
Dilution Adjustment On any Dealing Day the Directors may determine when there are net inflows into a Sub-Fund or net outflows from a Sub-Fund to apply a dilution adjustment to the dealing Net Asset Value per Share so that the price of a Share in the Sub-Fund is above or below that which would have resulted from a latest available market valuation. This adjustment is intended to pass the estimated costs of underlying investment activity of the Sub-Fund to the active Shareholders by adjusting the Net Asset Value of the relevant classes of Shares and thus to protect the Sub-Fund’s long-term Shareholders from costs associated with ongoing subscription and redemption activity. These costs may include dealing charges, commissions and the effects of dealing at prices other than the middle market price. The price of each Class of Share in a Sub-Fund will be calculated separately but any dilution adjustment will affect the price of Shares of each Class in a Sub-Fund in an identical manner.
Investment Risks An investment in any Sub-Fund involves investment risks, including possible loss of the amount invested. Moreover, there can be no assurance that a Sub-Fund will achieve its investment objective.
Taxation As an investment undertaking within the meaning of Section 739(B) of the Taxes Consolidation Act 1997, as amended, the Company is generally exempt from Irish tax on its income and gains and the Company will not be required to account for any tax in respect of Shareholders who are not Irish residents or exempt Irish residents provided that the signed necessary declarations are in place. The Company may be required to account for tax in respect of Shareholders who are Irish residents. Shareholders who are not Irish residents and have made the required declaration of non-residence will not be liable to Irish tax on income from their Shares or gains made on the disposal of their Shares, provided the Shares are not attributable to an Irish branch or agency of such shareholder. No stamp duty or other tax is generally payable in Ireland on the subscription, issue, holding, redemption, conversion or transfer of Shares.
Selling Restrictions The Shares may not be purchased or held by US persons unless pursuant to an exemption under applicable US law and may not be offered or sold in any jurisdiction in which such offer or sale is not lawful or in which the person making such offer or sale is not qualified to do so or to anyone to whom it is unlawful to make such an offer or sale.

Jupiter Asset Management Series Plc Annual Report and Audited Financial Statements for the financial year ended 31 December 2020
General Information (continued)
15
Dealing Days A Dealing Day in respect of all of the Sub-Funds means every Business Day (as defined for each Sub-Fund in the Prospectus) or such other days as the Directors may determine provided that there shall be at least one Dealing Day each fortnight.
Subscriptions and Repurchases Certain Share Classes have minimum initial investment, minimum subsequent investment and minimum holding requirements which are disclosed in the Prospectus. An initial charge may be payable to the Company on subscriptions for certain Share Classes. A contingent deferred sales charge may be payable to the Company on the subscription price for certain Shares, with the amount of the contingent deferred sales charge payable dependent on the length of time between the date the Shares were purchased and their repurchase. The following table outlines these charges:
Class of Shares: Initial Charge: Contingent deferred sales charge as a percentage of the
subscription price paid
Years since purchase
0 – 1
Years
1 – 2
Years
2 – 3
Years
3 – 4
Years
4+
Years
Class A Shares Up to 5.00% of the Net Asset Value per Share Nil Nil Nil Nil Nil
Class B Shares Nil 4.00% 3.00% 2.00% 1.00% Nil
Class C Shares Up to 1.00% of the Net Asset Value per Share 1.00% Nil Nil Nil Nil
Class C2 Shares Up to 0.50% of the Net Asset Value per Share 2.00% 1.00% Nil Nil Nil
Class L Shares Up to 5.00% of the Net Asset Value per Share for certain Funds
Nil Nil Nil Nil Nil
Class N Shares Up to 3.00% of the Net Asset Value per Share Nil Nil Nil Nil Nil
The other Share Classes are not in scope for these charges.

Jupiter Asset Management Series Plc Annual Report and Audited Financial Statements for the financial year ended 31 December 2020
Directors’ Report
16
The Directors submit their annual report together with the audited financial statements of Jupiter Asset Management Series Plc (the “Company”) for the financial year ended 31 December 2020.
Principal Activities The principal activity of the Company is the collective investment in transferable securities and/or other liquid financial assets. As at 31 December 2020, the Company consisted of 32 Sub-Funds (the “Sub-Funds”) of which 21 are in operation at financial year end (2019: 21).
Business Review, Results and Future Development A more comprehensive overview of the Company’s investment activities and the analysis of the Company’s key performance indicator (‘KPIs’), such as the performance of the relevant Sub-Funds is detailed in the Investment Advisers’ and Investment Managers’ Reports.
The results for the financial year are set out in the Statement of Operations and the assets and liabilities are set out in the Statement of Financial Position. Details of the Company’s share capital and changes during the financial year under review are disclosed in the Statement of Changes in Net Assets Attributable to Redeemable Participating Shareholders. Significant shareholders are disclosed in Note 5.
The Company intends to continue promoting and generating interest in its business in the future.
Jupiter Asset Management (Europe) Limited (“JAMEL”) (“the Manager”) is authorised by the Central Bank to act as a UCITS management company pursuant to the Regulations and an Alternative Investment Fund Manager (“AIFM”) pursuant to the European Communities (Alternative Investment Fund Managers) Regulations, 2013, as amended. As a result, the Company became an externally managed investment company and ceased to operate as a self-managed investment company. The appointment of the Manager ensured that the Company has an EU domiciled fund management company, thereby avoiding issues around the Company continuing to market within the EEA on a cross-border basis by the Manager once the United Kingdom left the EU. The impact of Brexit has resulted in some uncertainty for the financial industry. The United Kingdom leaving the EU still carries an element of uncertainty and with that comes an element of risk. While it is still too soon to judge the full impact of the UK leaving the EU, as Directors of the Company, we maintain that Europe is a core market for distribution of the Sub-Funds and will remain so. There is a risk that Brexit, other political developments or developments otherwise affecting market confidence may result in outflows of assets from investment portfolios with exposure to the UK, which could include asset portfolios held by the Sub-Funds of the Company. Due to the size and importance of the UK economy in the global economy, particularly with respect to the UK financial services market, as well as the uncertainty and unpredictability concerning the UK’s legal, political, financial and economic relationship with the EU after Brexit, there may continue to be instability in the national and international financial markets, significant currency fluctuations and otherwise adverse effects on consumer confidence for the foreseeable future, including beyond the date of the UK’s withdrawal from the EU.
Dividends Distributions paid and proposed during the financial years ended 31 December 2020 and 31 December 2019 are detailed in Note 10.
Principal Risks, Risk Management Objectives and Policies The main risks arising from the Company’s financial instruments are market risk (including market price risk, interest rate risk and currency risk), liquidity risk and credit risk. In order to manage such risks the Company shall comply with the investment restrictions and diversification limits provided for in the Prospectus and the UCITS Regulations. Details of the principal risks, risk management objectives and policies associated with investment in the Company are listed in Note 11.

Jupiter Asset Management Series Plc Annual Report and Audited Financial Statements for the financial year ended 31 December 2020
Directors’ Report (continued)
17
Securities Financing Transactions Regulation Securities Financing Transactions Regulation (Regulation (EU) 2015/2365) (“SFTR”) disclosures have been included in the Supplemental Information (unaudited) to the annual financial statements.
Events During the Financial Year The significant events during the financial year are detailed on pages 406 to 408.
Subsequent Events The subsequent events are listed below: Share Class Launch The following Share Class launched on
Date Sub-Fund name Share Class name
7 January 2021 Jupiter Strategic Absolute Return Bond Fund Class C (USD)
Employees There were no employees of the Company during the financial year under review or during the prior financial year.
Segregated Liability of Sub-Funds The Company is an umbrella fund with segregated liability between Sub-Funds.
Directors The Directors of the Company during the year ended 31 December 2020 were:
Nationality
Bronwyn Wright Irish
Tom Murray Irish
Adrian Waters Irish
Nicola Stronach (resigned 26 November 2020) British
Jasveer Singh (appointed 2 November 2020) British
The Articles of Association do not stipulate a retirement age for Directors and do not provide for retirement of Directors by rotation.
All of the Directors have served for the entire financial year except Nicola Stronach who resigned on 26 November 2020 and Jasveer Singh appointed 2 November 2020. Directors’ remuneration paid and payable during the financial years ended 31 December 2020 and 31 December 2019 are detailed in Note 5. All expenses paid to Directors were non-taxable in line with Section 305 of the Companies Act 2014. Nicola Stronach, as employee of the Investment Manager, was not entitled to receive a Director’s fee or other compensation in connection with her role as a Director of the Company. Jasveer Singh, as employee of Jupiter Asset Management, was not entitled to receive a Director’s fee or other compensation in connection with his role as a Director of the Company.
Directors' and Company Secretary's Interests in Shares and Contracts All Directors and the Company Secretary who held office at 31 December 2020 and at 31 December 2019 had no interest in the share capital of the Company or group undertakings of the Company at any time during the year however Jasveer Singh through his employment and its compensation structures holds shares in Jupiter Fund Management plc.
Transactions Involving Directors The Board of Directors are not aware of any contracts or arrangements of any significance in relation to the business of the Company in which the Directors had any interest as defined in Section 329 of the Companies Act 2014 at any time during the financial year ended 31 December 2020 (2019: Nil). As at 31 December 2020, Jasveer Singh is an employee of Jupiter Asset Management. Nicola Stronach was an employee of the Investment Manager until 26 November 2020 (2019: Nicola Stronach and Jessica Brescia).

Jupiter Asset Management Series Plc Annual Report and Audited Financial Statements for the financial year ended 31 December 2020
Directors’ Report (continued)
18
Corporate Governance Code The Company has adopted in full the voluntary Code of Corporate Governance ("the Corporate Governance Code") for Collective Investment Schemes and Management Companies issued by the Irish Funds (“IF”), the text of which is available from the IF website, www.irishfunds.ie. The Company has been in compliance with the Corporate Governance Code during the financial year ended 31 December 2020.
Connected Person Transactions In accordance with the requirements of the Central Bank UCITS Regulations, any transaction carried out with the Company by its Manager, Depositary, Investment Adviser, Investment Manager and/or associated or group companies of these entities (“connected person”) must be carried out as if negotiated at arm’s length. Such transactions must be in the best interests of the shareholders. In addition to those transactions, there are also transactions carried out by connected persons on behalf of the Company to which the Directors have no direct access and in respect of which the Directors must rely upon assurances from its delegates that the connected persons carrying out these transactions do carry them out on a similar basis. The Board of Directors are satisfied that: (i) there are arrangements in place to ensure that the obligations set out in Central Bank of Ireland’s UCITS Regulations are applied to all transactions with connected parties; and (ii) transactions with connected parties entered into during the financial year complied with the obligations set out in the UCITS Regulations.
Although not deemed to be related parties under FRS 102 as they do not exercise significant influence over the activities of the Company, UCITS Regulations also deems a “Depositary” and its “associated or group companies” to be related parties to the Company. As such, Citi Depositary Services Ireland Designated Activity Company, the Depositary, and Citibank Europe plc (the “Administrator”), are related parties to the Company. During the financial year, Citi Depositary Services Ireland Designated Activity Company and Citibank Europe plc earned fees for provision of depositary and administration services to the Company as disclosed in Note 9. Citi Depositary Services Ireland Designated Activity Company were selected by the Company to execute certain transactions on behalf of the Sub-Funds, the terms of such transactions were negotiated by the Company and were at normal commercial terms.
Statement of Directors' Responsibilities The Directors are responsible for preparing the Directors’ Report and financial statements, in accordance with applicable law and regulations. Company law requires the Directors to prepare financial statements for each financial year. Under that law they have elected to prepare the financial statements in accordance with Irish law and FRS 102 The Financial Reporting Standard applicable in the UK and Republic of Ireland. Under company law the Directors must not approve the financial statements unless they are satisfied that they give a true and fair view of the assets, liabilities and financial position of the Company and of its decrease in net assets attributable to redeemable participating shareholders for that year. In preparing the financial statements, the Directors are required to: • select suitable accounting policies and then apply them consistently; • make judgements and estimates that are reasonable and prudent; • state whether applicable Accounting Standards have been followed, subject to any material departures disclosed and
explained in the financial statements; • assess the Company’s ability to continue as a going concern, disclosing, as applicable, matters related to going concern; and • use the going concern basis of accounting unless they either intend to liquidate the Company or to cease operations, or have
no realistic alternative but to do so. The Directors are responsible for keeping adequate accounting records which disclose with reasonable accuracy at any time the assets, liabilities, financial position and profit or loss of the Company and enable them to ensure that the financial statements comply with the Companies Act 2014, the European Communities (Undertakings for Collective Investment in Transferable Securities) Regulations 2011 and the Central Bank (Supervision and Enforcement) Act 2013 (Section 48(1)) (Undertakings for Collective Investment in Transferable Securities) Regulations 2019. They have general responsibility for taking such steps as are reasonably open to them to safeguard the assets of the Company. In this regard they have entrusted the assets of the Company to a trustee for safe-keeping.


Citi Depositary Services Ireland Designated Activity Company
Directors: Shane Baily, Hilary Griffey, David Morrison (U.K.), Michael Whelan Registered in Ireland: Registration Number 193453. Registered Office: 1 North Wall Quay, Dublin 1.
Citi Depositary Services Ireland Designated Activity Company is regulated by the Central Bank of Ireland under the Investment Intermediaries Act, 1995
20
Jupiter Asset Management Series Plc
REPORT OF THE DEPOSITARY TO THE SHAREHOLDERS
We have enquired into the conduct of Jupiter Asset Management Series Plc (the “Company”), for the financial year ended 31
December 2020, in our capacity as Depositary of the Company.
This report including the opinion has been prepared for, and solely for, the shareholders in the Company in accordance with
the UCITS Regulations, as amended, and for no other purpose. We do not, in giving this opinion, accept or assume
responsibility for any other purpose or to any other person to whom this report is shown.
Responsibilities of the Depositary
Our duties and responsibilities are outlined in the UCITS Regulations, as amended. One of those duties is to enquire into the
conduct of the Company in each annual accounting period and report thereon to the shareholders.
Our report shall state whether, in our opinion, the Company has been managed in that period in accordance with the
provisions of the Company’s memorandum and articles of association (the “Memorandum and Articles of Association”) and
the UCITS Regulations , as amended, (the “Regulations”). It is the overall responsibility of the Company to comply with
these provisions. If the Company has not so complied, we as Depositary must state why this is the case and outline the steps
that we have taken to rectify the situation.
Basis of Depositary Opinion
The Depositary conducts such reviews as it, in its reasonable opinion, considers necessary in order to comply with its duties
as outlined in the UCITS Regulations, as amended, and to ensure that, in all material respects, the Company has been
managed: (i) in accordance with the limitations imposed on its investment and borrowing powers by the provisions of its
constitutional documentation and the appropriate regulations, and (ii) otherwise in accordance with the Company’s
constitutional documentation and the appropriate regulations.
Opinion
In our opinion, the Company has been managed during the period, in all material respects:
(i) in accordance with the limitations imposed on the investment and borrowing powers of the Company by the
Memorandum and Articles of Association and by the Regulations; and
(ii) otherwise in accordance with the provisions of the Memorandum and Articles of Association and the Regulations.
Citi Depositary Services Ireland Designated Activity Company
1 North Wall Quay
Dublin
Ireland
Date: 26 April 2021
1 North Wall Quay Dublin 1 Ireland
T +353 1 622 2000 F +353 1 622 2222

Jupiter Asset Management Series Plc Annual Report and Audited Financial Statements for the financial year ended 31 December 2020
Investment Advisers’ Reports For the financial year ended 31 December 2020
Investment Adviser – Ping An of China Asset Management (Hong Kong) Company Limited
Jupiter China Equity Fund
21
In the first quarter of 2020, COVID-19 affected China severely, both socially and financially. The market subsequently priced in a very negative scenario for stocks and by mid-March valuations fell to extreme levels. Uncertainty about the pandemic’s duration and economic impact persisted, however with policymakers around the globe introducing unprecedented fiscal and monetary stimulus to prevent systemic risks, a bottom gradually formed in the equity markets.
China was the first country to be impacted by the virus, however it was also the first country to recover. Companies began resuming production quickly and the government launched a series of rate cutting measures that supported consumption. While other countries struggled to contain the pandemic, China’s economy delivered resilient growth with GDP up 3.2% in Q2 and year-on-year retail sales growth turning positive in August.
This strong recovery and normalisation of economic activities drove the equity market skywards, on improved investor sentiment and multiple expansion. Chinese equities ultimately rebounded 70% from those March lows, to finish the year up 25%. However, there was a significant divergence between ‘new economy’ and ‘old economy’ stocks, with ecommerce and technology related growth stocks leading the charge.
The fund had a strong 2020, outperforming its benchmark by over 5%. Some of the main positive contributors to performance over the year were the fund’s holdings in ecommerce platforms Meituan and JD.com, supermarket operator Jiajiayue, sportwear manufacturer Li Ning, semiconductor manufacturer SMIC and HK Exchanges and Clearing, which benefited from a number of ‘homecoming’ listings. Among the main detractors from performance over the year were the fund’s holdings in Guangzhou R&F Properties, ICBC and China Overseas Land. Not owning NIO, the electric vehicle manufacturer, also detracted relative to the index, given its share price went up an incredible 1150% over the year!
We believe that the global economic recovery will speed up in 2021, especially in developed countries, as we start to see effective Covid-19 vaccines being deployed worldwide. Given China’s trend back towards full employment, we will likely see monetary and fiscal policies start to normalise and hence credit growth is likely to slow. We think consumption will remain robust, though do expect to see momentum shift towards services and the private manufacturing sector. Overall, the outlook for the Chinese stock market is attractive heading into next year and we think that investors are likely to change their focus towards companies with potential for an earnings recovery.
While we are broadly optimistic, we of course remain mindful of the risks too. One of the main ongoing headwinds for China is the Sino-US relationship. Both nations will continue to compete directly on multiple fronts, especially in areas such as technology, security and capital markets. Under a Biden administration, we do not think there will be an escalation of the trade war, though at the same time we do not expect unwinding of the sanctions imposed on companies during Trump’s administration either.
Our key investment themes are i) ‘consumption upgrade’, where there is growing demand for high-quality, higher-price goods and services, ii) innovation, which will help to boost productivity in what is an aging population (for example, areas such as 5G and automation), and iii) healthcare, where reforms should continue to provide great long-term investment opportunities. In the nearer term, we have a favourable view on the services sector, particularly leisure and travel stocks, as the impact of Covid-19 starts to fade.
Jupiter China Equity Fund absolute and relative returns of share classes and benchmarks from 1 January 2020 to 31 December 2020. Share Class Benchmark Share Class
returns (%) Benchmark returns (%)
Relative returns (%)
A (USD) Accumulation Shares China Equity Composite BM 31.40 25.90 4.37
B (USD) Accumulation Shares China Equity Composite BM 29.97 25.90 3.24
C (USD) Accumulation Shares China Equity Composite BM 29.44 25.90 2.82
C2 (USD) Accumulation Shares China Equity Composite BM 29.71 25.90 3.03
I (USD) Accumulation Shares China Equity Composite BM 32.45 25.90 5.21
S (GBP) Accumulation Shares China Equity Composite BM 27.83 22.01 4.77
U1 (GBP) Accumulation Shares China Equity Composite BM 28.17 22.01 5.05
Please note that the returns of different share classes and benchmarks may vary, depending on a number of factors, including the currency denomination of the share class and/or benchmark and fees charged. The fund does not track a benchmark, all returns are net of fees and the returns for the income share classes are gross of distributions.

Jupiter Asset Management Series Plc Annual Report and Audited Financial Statements for the financial year ended 31 December 2020
Investment Managers’ Reports For the financial year ended 31 December 2020
Investment Manager – Jupiter Investment Management Limited
Jupiter Merian World Equity Fund
22
Performance of the fund The sub-fund marginally outperformed both its index and peer group during the calendar year 2020. The fund was strongly tilted away from cheaper names for most of the year and this avoided significant losses to cheaper stocks as growth names once again dominated market performance. The tilt towards high quality names, those with lower debt, consistent profitability and an efficient balance sheet again performed well over the year. One weaker area of performance was due to the fund avoiding some of the glamour names within the growth area of the market. Although there was some participation, the fund has been placed to benefit as and when these names reverse course. This positioning detracted from performance as the glamour names continued to be bought by the market into the fourth quarter of the year, though this positioning shielded the fund from the momentum breakdown seen in November and December.
Market and Outlook 2020 was a year of shocks both to the global economy and equity markets. The year began with expectations high for a second Trump term in the November US presidential election. Earnings and employment growth signalled a strong global economy. The arrival of Covid, whilst quickly becoming a tragedy for individual citizens, has led to a severe earnings recession in a number of sectors and the global economy suffering negative earnings growth. With that backdrop the behaviour of equity markets seems a little perverse, with only European markets falling. The outperformance of growth, and underperformance of value, also accelerated in 2020 and market leadership narrowed as the winners and losers from the new “stay at home” reality became apparent. 2021 earnings revisions, which have been on a downward path throughout 2020, have begun to inflect higher towards the end of the year. Throughout 2020, 1 trillion USD has gone into US money market funds looking for safety in a highly unstable macro and political environment. Rates at or around zero could mean some of this money looking for better yield in equity markets as the recovery continues. In a period of very low interest rates, long duration assets have been very attractive, hence the outperformance of growth stocks. Growth has also been quite concentrated, leading to a smaller number of growth companies being overly rewarded. This has led to the concentration of markets becoming the highest in 20 years, with for instance 5 companies making up 22% of US equity capitalisation. The Fed and other global central banks are likely to be on hold for the foreseeable future and the economy will expand in 2021 if only due to a bounceback from 2020. Growth will be more widespread, and high operationally leveraged companies which were crushed in 2020 should enjoy strong earnings growth.
Jupiter Merian World Equity Fund absolute and relative returns of share classes and benchmarks from 1 January 2020 to 31 December 2020. Share Class Benchmark Share Class
returns (%) Benchmark returns (%)
Relative returns (%)
A (EUR) Accumulation Shares MSCI World Index - Net Return 5.40 6.33 (0.88)
A (EUR) Hedged Accumulation Shares 12.74
A (USD) Accumulation Shares MSCI World Index - Net Return 15.19 15.90 (0.61)
B (USD) Accumulation Shares MSCI World Index - Net Return 13.91 15.90 (1.72)
C (USD) Accumulation Shares MSCI World Index - Net Return 13.45 15.90 (2.11)
C2 (USD) Accumulation Shares MSCI World Index - Net Return 13.92 15.90 (1.71)
I (EUR) Accumulation Shares MSCI World Index - Net Return 6.19 6.33 (0.13)
I (USD) Accumulation Shares MSCI World Index - Net Return 16.07 15.90 0.15
S (GBP) Accumulation Shares MSCI World Index - Net Return 12.04 12.32 (0.25)
U1 (GBP) Accumulation Shares MSCI World Index - Net Return 12.38 12.32 0.05
Please note that the returns of different share classes and benchmarks may vary, depending on a number of factors, including the currency denomination of the share class and/or benchmark and fees charged. Hedged share classes do not show a benchmark. The fund does not track a benchmark, all returns are net of fees and the returns for the income share classes are gross of distributions.

Jupiter Asset Management Series Plc Annual Report and Audited Financial Statements for the financial year ended 31 December 2020
Investment Managers’ Reports (continued) For the financial year ended 31 December 2020
Investment Manager – Jupiter Investment Management Limited
Jupiter Pacific Equity Fund
23
Performance of the fund The sub-fund strongly outperformed both its index and peer group during the calendar year 2020. The fund was tilted away from cheaper names for most of the year and this avoided significant losses to cheaper stocks as growth names once again dominated market performance. The tilt towards high quality names, those with lower debt, consistent profitability and an efficient balance sheet again performed well over the year. Industries that have shown historic strength continued to outperform this year and added to the performance of the fund. Performance was also helped by avoiding some of the glamour names within the growth area of the market. Although there was some participation, the fund has been placed to benefit as and when these names reverse course. This positioning shielded the fund from the momentum breakdown seen in November and December.
Market and Outlook 2020 was a year of shocks both to the Asian economies and equity markets. The year began with expectations high for a second Trump term in the November US presidential election. Earnings and employment growth signalled a strong global economy. The arrival of Covid, whilst quickly becoming a tragedy for individual citizens, has led to a severe earnings recession in a number of sectors and the global economy suffering negative earnings growth. With that backdrop the behaviour of equity markets seems a little perverse, with positive returns seen across the region. The outperformance of growth, and underperformance of value, also accelerated in 2020 and market leadership narrowed as the winners and losers from the new “stay at home” reality became apparent. 2021 earnings revisions, which have been on a downward path throughout 2020, have begun to inflect higher towards the end of the year. Throughout 2020, investors had accessed low yielding but safe investments in a highly unstable macro and political environment. The return of stability and a snapback in growth could well mean this money looking for better yield in equity markets as the recovery continues. In a period of very low interest rates, long duration assets have been very attractive, hence the outperformance of growth stock. Growth has also been quite concentrated, leading to a smaller number of growth companies being overly rewarded. This has led to the concentration of markets becoming the highest in 20 years, with for instance 5 companies making up 22% of US equity capitalisation. The Fed and other global central banks are likely to be on hold for the foreseeable future, the economy will recover strongly if only due to a bounceback from 2020. Growth will be more widespread, and high operationally leveraged companies which were crushed in 2020 should enjoy strong earnings growth.
Jupiter Pacific Equity Fund absolute and relative returns of share classes and benchmarks from 1 January 2020 to 31 December 2020. Share Class Benchmark Share Class
returns (%) Benchmark returns (%)
Relative returns (%)
A (EUR) Accumulation Shares Pacific Equity Benchmark 15.64 12.33 2.95
A (USD) Accumulation Shares Pacific Equity Benchmark 26.41 22.44 3.24
B (USD) Accumulation Shares Pacific Equity Benchmark 24.95 22.44 2.04
C (USD) Accumulation Shares Pacific Equity Benchmark 24.44 22.44 1.63
C2 (USD) Accumulation Shares Pacific Equity Benchmark 23.99 22.44 1.26
I (USD) Accumulation Shares Pacific Equity Benchmark 27.36 22.44 4.01
R (GBP) Accumulation Shares Pacific Equity Benchmark 23.27 18.66 3.88
S (GBP) Accumulation Shares Pacific Equity Benchmark 22.96 18.66 3.62
U1 (GBP) Accumulation Shares Pacific Equity Benchmark 23.36 18.66 3.96
Please note that the returns of different share classes and benchmarks may vary, depending on a number of factors, including the currency denomination of the share class and/or benchmark and fees charged. The fund does not track a benchmark, all returns are net of fees and the returns for the income share classes are gross of distributions.
Jupiter Asset Management Series Plc Annual Report and Audited Financial Statements for the financial year ended 31 December 2020
Investment Managers’ Reports (continued) For the financial year ended 31 December 2020
Investment Manager – Jupiter Investment Management Limited
Merian European Equity Fund
24
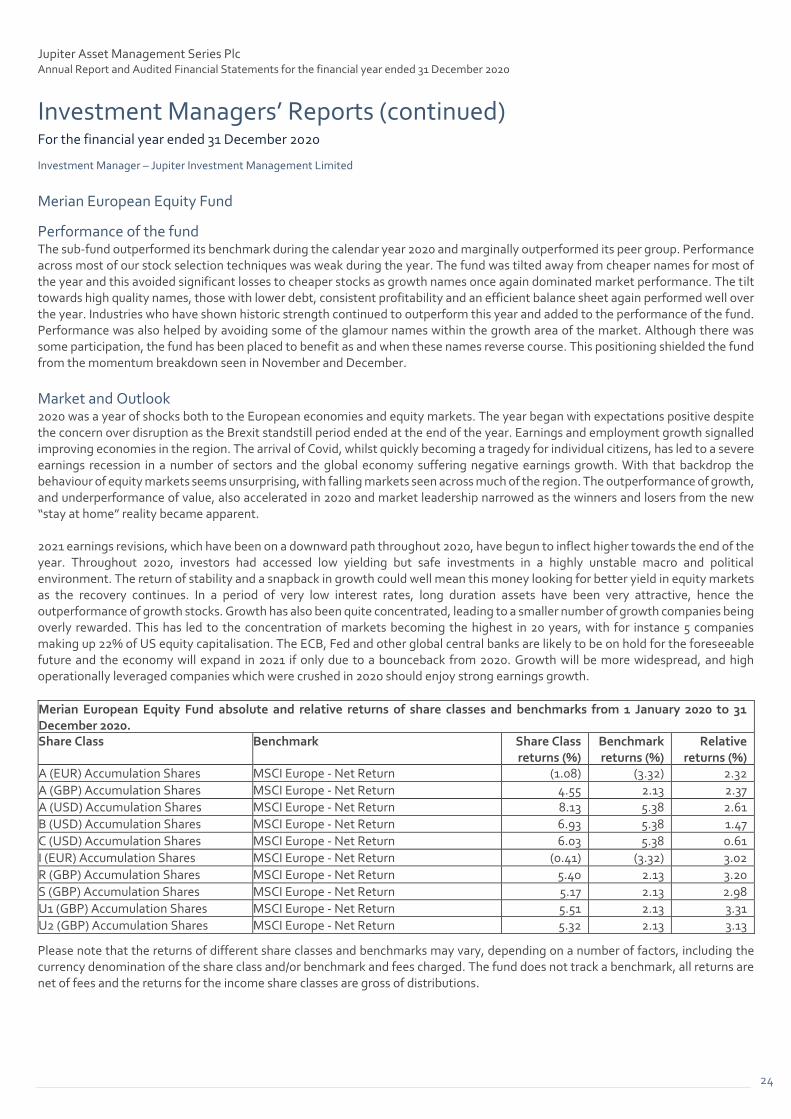
Performance of the fund The sub-fund outperformed its benchmark during the calendar year 2020 and marginally outperformed its peer group. Performance across most of our stock selection techniques was weak during the year. The fund was tilted away from cheaper names for most of the year and this avoided significant losses to cheaper stocks as growth names once again dominated market performance. The tilt towards high quality names, those with lower debt, consistent profitability and an efficient balance sheet again performed well over the year. Industries who have shown historic strength continued to outperform this year and added to the performance of the fund. Performance was also helped by avoiding some of the glamour names within the growth area of the market. Although there was some participation, the fund has been placed to benefit as and when these names reverse course. This positioning shielded the fund from the momentum breakdown seen in November and December.
Market and Outlook 2020 was a year of shocks both to the European economies and equity markets. The year began with expectations positive despite the concern over disruption as the Brexit standstill period ended at the end of the year. Earnings and employment growth signalled improving economies in the region. The arrival of Covid, whilst quickly becoming a tragedy for individual citizens, has led to a severe earnings recession in a number of sectors and the global economy suffering negative earnings growth. With that backdrop the behaviour of equity markets seems unsurprising, with falling markets seen across much of the region. The outperformance of growth, and underperformance of value, also accelerated in 2020 and market leadership narrowed as the winners and losers from the new “stay at home” reality became apparent. 2021 earnings revisions, which have been on a downward path throughout 2020, have begun to inflect higher towards the end of the year. Throughout 2020, investors had accessed low yielding but safe investments in a highly unstable macro and political environment. The return of stability and a snapback in growth could well mean this money looking for better yield in equity markets as the recovery continues. In a period of very low interest rates, long duration assets have been very attractive, hence the outperformance of growth stocks. Growth has also been quite concentrated, leading to a smaller number of growth companies being overly rewarded. This has led to the concentration of markets becoming the highest in 20 years, with for instance 5 companies making up 22% of US equity capitalisation. The ECB, Fed and other global central banks are likely to be on hold for the foreseeable future and the economy will expand in 2021 if only due to a bounceback from 2020. Growth will be more widespread, and high operationally leveraged companies which were crushed in 2020 should enjoy strong earnings growth.
Merian European Equity Fund absolute and relative returns of share classes and benchmarks from 1 January 2020 to 31 December 2020. Share Class Benchmark Share Class
returns (%) Benchmark returns (%)
Relative returns (%)
A (EUR) Accumulation Shares MSCI Europe - Net Return (1.08) (3.32) 2.32
A (GBP) Accumulation Shares MSCI Europe - Net Return 4.55 2.13 2.37
A (USD) Accumulation Shares MSCI Europe - Net Return 8.13 5.38 2.61
B (USD) Accumulation Shares MSCI Europe - Net Return 6.93 5.38 1.47
C (USD) Accumulation Shares MSCI Europe - Net Return 6.03 5.38 0.61
I (EUR) Accumulation Shares MSCI Europe - Net Return (0.41) (3.32) 3.02
R (GBP) Accumulation Shares MSCI Europe - Net Return 5.40 2.13 3.20
S (GBP) Accumulation Shares MSCI Europe - Net Return 5.17 2.13 2.98
U1 (GBP) Accumulation Shares MSCI Europe - Net Return 5.51 2.13 3.31
U2 (GBP) Accumulation Shares MSCI Europe - Net Return 5.32 2.13 3.13
Please note that the returns of different share classes and benchmarks may vary, depending on a number of factors, including the currency denomination of the share class and/or benchmark and fees charged. The fund does not track a benchmark, all returns are net of fees and the returns for the income share classes are gross of distributions.

Jupiter Asset Management Series Plc Annual Report and Audited Financial Statements for the financial year ended 31 December 2020
Investment Managers’ Reports (continued) For the financial year ended 31 December 2020
Investment Manager – Jupiter Investment Management Limited
Jupiter Merian US Equity Income Fund
25
Performance of the fund The sub-fund underperformed its benchmark during the calendar year 2020 but was one of the strongest performing income biased funds in the peer group. The ability to generate income whilst controlling exposure to cheaper stocks has helped to deal with a difficult environment for value. Given the strong underperformance to value stocks, the fund was held back by some of the cheaper names held. However, this was more than offset by the tilt towards quality stocks which performed well over the year. The fund is also tilted away from the glamour names that have driven markets higher, with positioning that would perform well as these momentum stocks reverse course. This positioning detracted from performance as the glamour names continued to be bought by the market into the fourth quarter of the year, though this positioning shielded the fund from the momentum breakdown seen in November and December.
Market and Outlook 2020 was a year of shocks both to the US economy and equity markets. The year began with expectations high for a second Trump term in the November presidential election. Earnings and employment growth signalled a strong economy, helped by deregulation and tax cuts. The arrival of Covid in the US, whilst quickly becoming a tragedy for individual citizens, has led to a severe earnings recession in a number of US sectors with aggregate profits ending 17% down on the year. With that backdrop, the behaviour of US equity markets seems a little perverse, with the S+P ending the year up over 16%. The outperformance of growth, and underperformance of value, also accelerated in 2020 and market leadership narrowed as the winners and losers from the new “stay
at home” reality became apparent. 2021 earnings revisions, which have been on a downward path throughout 2020, have begun to inflect higher towards the end of the year. Throughout 2020, 1 trillion USD has gone into US money market funds looking for safety in a highly unstable macro and political environment. Rates at or around zero could mean some of this money looking for better yield in equity markets as the recovery continues. In a period of very low interest rates, long duration assets have been very attractive, hence the outperformance of growth stocks. Growth has also been quite concentrated, leading to a smaller number of growth companies being overly rewarded. This has led to the concentration of markets becoming the highest in 20 years, with 5 companies making up 22% of US equity capitalisation. The Fed is likely to be on hold for the foreseeable future and the economy will expand in 2021 if only due to a bounceback from 2020. Growth will be more widespread, and high operationally leveraged companies which were crushed in 2020 should enjoy strong earnings growth.

Jupiter Asset Management Series Plc Annual Report and Audited Financial Statements for the financial year ended 31 December 2020
Investment Managers’ Reports (continued) For the financial year ended 31 December 2020
Investment Manager – Jupiter Investment Management Limited
Jupiter Merian US Equity Income Fund (continued)
26
Jupiter Merian US Equity Income Fund absolute and relative returns of share classes and benchmarks from 1 January 2020 to 31 December 2020. Share Class Benchmark Share Class
returns (%) Benchmark returns (%)
Relative returns (%)
A (EUR) Accumulation Shares US Equity Income Benchmark 3.46 10.75 (6.59)
A (EUR) Hedged Accumulation Shares 10.38
A (GBP) Accumulation Shares US Equity Income Benchmark 9.30 17.00 (6.58)
A (USD) Accumulation Shares US Equity Income Benchmark 13.20 20.73 (6.23)
A (USD) Income (F) Shares US Equity Income Benchmark 13.19 20.73 (6.25)
A (USD) Income Shares US Equity Income Benchmark 13.18 20.73 (6.25)
B (USD) Accumulation Shares US Equity Income Benchmark 11.60 20.73 (7.56)
B (USD) Income Shares US Equity Income Benchmark 11.85 20.73 (7.35)
C (USD) Accumulation Shares US Equity Income Benchmark 11.47 20.73 (7.67)
C (USD) Income Shares US Equity Income Benchmark 11.34 20.73 (7.78)
C2 (USD) Income (F) Shares US Equity Income Benchmark 12.06 20.73 (7.18)
C2 (USD) Income Shares US Equity Income Benchmark 11.83 20.73 (7.37)
I (USD) Accumulation Shares US Equity Income Benchmark 14.06 20.73 (5.52)
I (USD) Income Shares US Equity Income Benchmark 14.08 20.73 (5.51)
N (USD) Accumulation Shares US Equity Income Benchmark 11.87 20.73 (7.33)
R (GBP) Accumulation Shares US Equity Income Benchmark 10.27 17.00 (5.75)
R (GBP) Income Shares US Equity Income Benchmark 10.37 17.00 (5.66)
S (GBP) Accumulation Shares US Equity Income Benchmark 10.11 17.00 (5.89)
U1 (GBP) Accumulation Shares US Equity Income Benchmark 10.36 17.00 (5.67)
U1 (GBP) Income Shares US Equity Income Benchmark 10.49 17.00 (5.56)
U2 (GBP) Accumulation Shares US Equity Income Benchmark 10.44 17.00 (5.61)
U2 (GBP) Income Shares US Equity Income Benchmark 10.58 17.00 (5.48)
Please note that the returns of different share classes and benchmarks may vary, depending on a number of factors, including the currency denomination of the share class and/or benchmark and fees charged. Hedged share classes do not show a benchmark. The fund does not track a benchmark, all returns are net of fees and the returns for the income share classes are gross of distributions.

Jupiter Asset Management Series Plc Annual Report and Audited Financial Statements for the financial year ended 31 December 2020
Investment Managers’ Reports (continued) For the financial year ended 31 December 2020
Investment Manager – Jupiter Investment Management Limited
Jupiter Merian North American Equity Fund (IRL)
27
Performance of the fund The sub-fund marginally underperformed its benchmark and was in line with its peer group over the calendar year 2020. The fund was strongly tilted away from cheaper names for most of the year and this avoided significant losses to cheaper stocks as growth names once again dominated market performance. The tilt towards high quality names, those with lower debt, consistent profitability and an efficient balance sheet again performed well over the year. One weaker area of performance was due to the fund avoiding some of the glamour names within the growth area of the market. Although there was some participation, the fund has been placed to benefit as and when these names reverse course. This positioning detracted from performance as the glamour names continued to be bought by the market into the fourth quarter of the year, though this positioning shielded the fund from the momentum breakdown seen in November and December.
Market and Outlook 2020 was a year of shocks both to the US economy and equity markets. The year began with expectations high for a second Trump term in the November presidential election. Earnings and employment growth signalled a strong economy, helped by deregulation and tax cuts. The arrival of Covid in the US, whilst quickly becoming a tragedy for individual citizens, has led to a severe earnings recession in a number of US sectors with aggregate profits ending 17% down on the year. With that backdrop the behaviour of US equity markets seems a little perverse, with the S+P ending the year up over 16%. The outperformance of growth, and underperformance of value, also accelerated in 2020 and market leadership narrowed as the winners and losers from the new “stay at home” reality became apparent.
2021 earnings revisions, which have been on a downward path throughout 2020, have begun to inflect higher towards the end of the year. Throughout 2020, 1 trillion USD has gone into US money market funds looking for safety in a highly unstable macro and political environment. Rates at or around zero could mean some of this money looking for better yield in equity markets as the recovery continues. In a period of very low interest rates, long duration assets have been very attractive, hence the outperformance of growth stocks. Growth has also been quite concentrated, leading to a smaller number of growth companies being overly rewarded. This has led to the concentration of markets becoming the highest in 20 years, with 5 companies making up 22% of US equity capitalisation. The Fed is likely to be on hold for the foreseeable future and the economy will expand in 2021 if only due to a bounceback from 2020. Growth will be more widespread, and high operationally leveraged companies which were crushed in 2020 should enjoy strong earnings growth.
Jupiter Merian North American Equity Fund (IRL) absolute and relative returns of share classes and benchmarks from 1 January 2020 to 31 December 2020. Share Class Benchmark Share Class
returns (%) Benchmark returns (%)
Relative returns (%)
A (EUR) Accumulation Shares North America (IRL) Benchmark 6.86 10.04 (2.89)
A (USD) Accumulation Shares North America (IRL) Benchmark 16.82 19.94 (2.61)
B (USD) Accumulation Shares North America (IRL) Benchmark 15.43 19.94 (3.76)
C (USD) Accumulation Shares North America (IRL) Benchmark 15.05 19.94 (4.08)
C2 (USD) Accumulation Shares North America (IRL) Benchmark 15.31 19.94 (3.86)
I (EUR) Accumulation Shares North America (IRL) Benchmark 7.66 10.04 (2.16)
I (EUR) Hedged Accumulation Shares
I (USD) Accumulation Shares North America (IRL) Benchmark 17.72 19.94 (1.85)
N (USD) Accumulation Shares North America (IRL) Benchmark 15.51 19.94 (3.69)
P2 (GBP) Income Shares North America (IRL) Benchmark 14.63 16.24 (1.39)
P2 (USD) Accumulation Shares North America (IRL) Benchmark 18.43 19.94 (1.26)
R (GBP) Accumulation Shares North America (IRL) Benchmark 13.83 16.24 (2.07)
R (GBP) Hedged Accumulation Shares 14.55
S (GBP) Accumulation Shares North America (IRL) Benchmark 13.56 16.24 (2.30)
U1 (GBP) Accumulation Shares North America (IRL) Benchmark 13.97 16.24 (1.95)
U1 (GBP) Hedged Accumulation Shares 14.74
U2 (GBP) Accumulation Shares North America (IRL) Benchmark 14.07 16.24 (1.86)
Please note that the returns of different share classes and benchmarks may vary, depending on a number of factors, including the currency denomination of the share class and/or benchmark and fees charged. Hedged share classes do not show a benchmark. The fund does not track a benchmark, all returns are net of fees and the returns for the income share classes are gross of distributions.

Jupiter Asset Management Series Plc Annual Report and Audited Financial Statements for the financial year ended 31 December 2020
Investment Managers’ Reports (continued) For the financial year ended 31 December 2020
Investment Manager – Jupiter Investment Management Limited
Merian Global Dynamic Bond Fund
28
The Bloomberg Barclays Global-Aggregate Index (Hedged USD) returned 5.58% over the period. Cross-asset price action at the start of the year was mixed, especially FX, where the USD defied the analyst consensus and appreciated throughout January. With global growth remaining lacklustre, a return to the strong USD regime made us wary and we expected heightened market volatility, which ultimately unfolded under the most unfortunate of circumstances. Thankfully, policymakers responded much faster to this recession than in 2008. Central banks, governments and supranational bodies all intervened promptly, resulting in the shortest equity bear market in history and set the stage for a sharp rebound in risk assets over the summer. Momentum stalled in the third quarter though, as real yields based, Covid-19 case counts rose in Europe, and the US election approached. It was not until after the US election that cyclical assets resumed their upward trend, with robust economic data and Pfizer’s vaccine announcement proving to be a powerful combination. Policy followed too, the ECB, Fed, and US policymakers all delivered additional stimulus to help support the recovery through a tough winter, and even the slimmest of Brexit deals was agreed at the 11th hour. This ensured that the year culminated in a melt-up of risk assets, especially those linked to growth. The fund comfortably outperformed its benchmark and peer group during the period. In many ways, it was as much about what we were not invested in, as what we were invested in. Once it became clear that growth would stay weak, we lowered our tracking error, leaving the fund well placed for the pandemic. Our highly-liquid, defensive portfolio enabled us to avoid the worst of the drawdown, unlike many of our peers who were overweight corporate credit. Our US rates duration was particularly effective, with the yield on the US 10y falling 100bps in a matter of weeks. When policymakers took action in March, we saw an opportunity to add risk to the fund. The levels on IG credit, peripheral Eurozone debt and inflation breakevens looked particularly attractive, and we sought to enhance our exposure, whilst others rushed to cash. By being positioned for the unprecedented stimulus, the fund performed well over the summer and more than kept pace with peers in the rally. After this strong performance, we decided to lower our tracking error once more, having grown concerned by rising Covid-19 cases and the lack of forthcoming stimulus. This left us well placed for the market gyrations between then and the US election, after which our core reflation positioning such as EM rates flourished. That said, core rates were highly volatile around the US election and the vaccine news, and we had to trade tactically to ensure that the fund successfully navigated this. We used the relative calm towards the end of the year to position for the next phase of the cycle – higher US rates; for example, adding US-German spread wideners and reducing our credit exposure further. Consensus believed 2021 would be reflationary and we largely agreed. Many of the issues that had plagued markets such as the US election, were ultimately resolved in the final months of the year. Oddly, risk assets continued to exhibit sizeable risk premiums and so we felt comfortable with our cyclical exposures, and if anything contemplated enhancing positioning in these areas. Nevertheless, the unanimity of the 2021 consensus was troubling and we spent much of December debating how this could come undone. Our main concerns were around Chinese growth, Fed policy and the potential for market volatility, believing that any of one of these themes could derail the reflationary narrative and herald a return to US exceptionalism. Indeed, many asset classes ended the year back at pre-Covid levels, meaning that further gains would require a structural change to occur, in effect a year of genuine reflation. We therefore ended the year cautiously optimistic, but with a healthy degree of scepticism about the consensus.
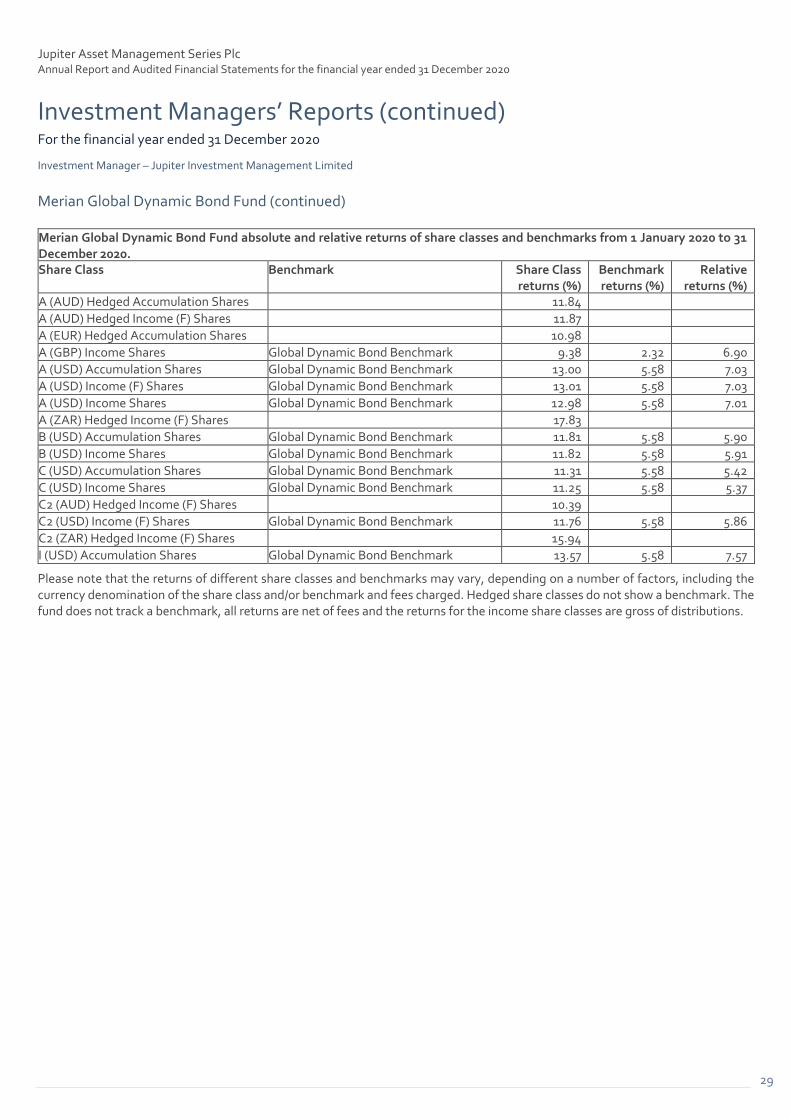
Jupiter Asset Management Series Plc Annual Report and Audited Financial Statements for the financial year ended 31 December 2020
Investment Managers’ Reports (continued) For the financial year ended 31 December 2020
Investment Manager – Jupiter Investment Management Limited
Merian Global Dynamic Bond Fund (continued)
29
Merian Global Dynamic Bond Fund absolute and relative returns of share classes and benchmarks from 1 January 2020 to 31 December 2020. Share Class Benchmark Share Class
returns (%) Benchmark returns (%)
Relative returns (%)
A (AUD) Hedged Accumulation Shares 11.84
A (AUD) Hedged Income (F) Shares 11.87
A (EUR) Hedged Accumulation Shares 10.98
A (GBP) Income Shares Global Dynamic Bond Benchmark 9.38 2.32 6.90
A (USD) Accumulation Shares Global Dynamic Bond Benchmark 13.00 5.58 7.03
A (USD) Income (F) Shares Global Dynamic Bond Benchmark 13.01 5.58 7.03
A (USD) Income Shares Global Dynamic Bond Benchmark 12.98 5.58 7.01
A (ZAR) Hedged Income (F) Shares 17.83
B (USD) Accumulation Shares Global Dynamic Bond Benchmark 11.81 5.58 5.90
B (USD) Income Shares Global Dynamic Bond Benchmark 11.82 5.58 5.91
C (USD) Accumulation Shares Global Dynamic Bond Benchmark 11.31 5.58 5.42
C (USD) Income Shares Global Dynamic Bond Benchmark 11.25 5.58 5.37
C2 (AUD) Hedged Income (F) Shares 10.39
C2 (USD) Income (F) Shares Global Dynamic Bond Benchmark 11.76 5.58 5.86
C2 (ZAR) Hedged Income (F) Shares 15.94
I (USD) Accumulation Shares Global Dynamic Bond Benchmark 13.57 5.58 7.57
Please note that the returns of different share classes and benchmarks may vary, depending on a number of factors, including the currency denomination of the share class and/or benchmark and fees charged. Hedged share classes do not show a benchmark. The fund does not track a benchmark, all returns are net of fees and the returns for the income share classes are gross of distributions.

Jupiter Asset Management Series Plc Annual Report and Audited Financial Statements for the financial year ended 31 December 2020
Investment Managers’ Reports (continued) For the financial year ended 31 December 2020
Investment Manager – Jupiter Investment Management Limited
Jupiter Emerging Market Debt Fund
30
In common with nearly all asset classes, emerging market debt (EMD) experienced significant volatility early in the year as the coronavirus pandemic wrought havoc on the world economy. By the middle of March, the JP Morgan global EM benchmark had fallen sharply on the year with the Merian fund underperforming the index. However, as developed market and EM governments and central banks engaged in unprecedented stimulus measures by the beginning of April, outflows ended and the turnaround in EM asset prices began. This recovery continued for the remainder of the first half.
In the second half, EMD markets benefited from continued optimism as the recovery in major economies gathered momentum and the development of COVID-19 vaccines progressed. In November, the US election result and positive vaccine news drove EM returns higher and attracted inflows. This broad trend continued through December across EMD: improving global economic data, vaccine optimism and the US election resolution remained the drivers for strong inflows and performance.
Over the 12 months, the fund outperformed the benchmark. Performance recovered sharply after the fund was taken over by Alejandro Arevalo and the Jupiter Emerging Market Debt team, ending the year 0.60% ahead of the benchmark, having started over 200 basis points behind it at the start of July. Outperformance in December was driven by credit selection and asset allocation decisions, particularly in Latin America followed by Africa and Europe.
The fund managers continue to believe a focus on fundamentals, along with differentiation by security and country, is key. They are generally constructive on countries that have room to take on higher fiscal deficits and high reserve balances and more defensively positioned towards, or look to completely avoid, countries that are running high debt-to-GDP ratios and are particularly vulnerable to currency shocks.
The fund managers are positive about the outlook for the EMD asset class this year. EMD offers a significant yield premium relative to developed markets. The recent breakthrough with Covid-19 vaccines and subsequent rollout can be viewed as even more important for those EM countries that do not have the reserve currencies, deep pockets and access to credit markets that developed markets enjoy. Ongoing monetary and fiscal policy is likely to drive US dollar weakness, which will benefit EMD. Finally, investors are currently under-allocated to EMD, though according to several market surveys, many investors have expressed their desire to increase their exposure.
Jupiter Emerging Market Debt Fund absolute and relative returns of share classes and benchmarks from 1 January 2020 to 31 December 2020. Share Class Benchmark Share Class
returns (%) Benchmark returns (%)
Relative returns (%)
A (EUR) Accumulation Shares Emerging Market Debt Benchmark (3.60) (3.43) (0.17)
A (EUR) Hedged Accumulation Shares 3.40
A (SEK) Hedged Accumulation Shares 3.39
A (SGD) Hedged Income Shares 4.71
A (USD) Accumulation Shares Emerging Market Debt Benchmark 5.45 5.26 0.18
A (USD) Income (F) Shares Emerging Market Debt Benchmark 5.44 5.26 0.18
A (USD) Income Shares Emerging Market Debt Benchmark 5.46 5.26 0.19
A (ZAR) Hedged Income (F) Shares 8.30
B (USD) Accumulation Shares Emerging Market Debt Benchmark 4.23 5.26 (0.98)
B (USD) Income Shares Emerging Market Debt Benchmark 4.35 5.26 (0.86)
C (USD) Accumulation Shares Emerging Market Debt Benchmark 3.86 5.26 (1.33)
C (USD) Income Shares Emerging Market Debt Benchmark 3.74 5.26 (1.44)
C2 (USD) Income (F) Shares Emerging Market Debt Benchmark 3.90 5.26 (1.29)
C2 (ZAR) Hedged Income (F) Shares 8.02
I (USD) Accumulation Shares Emerging Market Debt Benchmark 6.27 5.26 0.96
S (GBP) Income Shares Emerging Market Debt Benchmark 2.47 2.01 0.45
U1 (GBP) Income Shares Emerging Market Debt Benchmark 2.88 2.01 0.86
Please note that the returns of different share classes and benchmarks may vary, depending on a number of factors, including the currency denomination of the share class and/or benchmark and fees charged. Hedged share classes do not show a benchmark. The fund does not track a benchmark, all returns are net of fees and the returns for the income share classes are gross of distributions.

Jupiter Asset Management Series Plc Annual Report and Audited Financial Statements for the financial year ended 31 December 2020
Investment Managers’ Reports (continued) For the financial year ended 31 December 2020
Investment Manager – Jupiter Investment Management Limited
Jupiter Global Emerging Markets Focus Fund
31
In 2020 markets were dominated by the COVID-19 pandemic. It was when the virus reached Italy that global markets began to aggressively sell off as it became apparent that lockdown and social distancing measures would be required around the world bringing economies to a shuddering standstill. March bore witness to the fastest ever bear market in the USA with the S&P 500 falling 34% from its all-time high in just 23 trading days. Emerging markets were not spared in the global market rout as markets were hit by a tsunami of selling as investors rushed to exit risk. Since those March lows emerging market equities have staged a dramatic recovery helped by extremely supportive fiscal and monetary stimulus from governments and central banks around the world. The Chinese authorities have dealt with virus well and their economy has rebounded strongly, now back to almost pre-Covid levels of activity. The news of the Pfizer-Biontech vaccine breakthrough in the fourth quarter gave investor’s confidence to believe the worst is now behind us and emerging markets finished the year at new all-time highs after a 13 year hiatus, up 70% from the March lows. The positive vaccine news also instigated a rotation away from the “winning” sectors of the pandemic, such as ecommerce, towards more cyclical sectors likely to benefit from the reopening of economies, such as materials and financials. Emerging markets also responded favourably to the election victory of President-elect Joe Biden, the market feeling that a Democratic government is likely to be looser fiscally. The fund had a strong 2020, outperforming its benchmark. The main positive contributors to performance over the year were the fund’s holdings in Mercado Libre, Anta Sports, Kweichow Moutai, Taiwan Semiconductor Manufacturing and Sinbon Electronics. Many of the holdings in the fund have benefitted from the social and economic effects of the pandemic, with expedited growth in nascent trends such as online shopping and cloud-based solutions. The main detractors from performance over the year were the fund’s holdings in YDUQS, Petrobras and Network International, and also several stocks in the benchmark that the fund does not hold such as NIO and Pinduoduo, which both saw stratospheric share price gains even though these companies have never made a profit! Whilst we are unable travel to meet our portfolio companies in 2020, we have been having regular telephone and video calls with them just as we always do. Our research and portfolio implementation processes continued to function as normal in what has been an abnormal year. With the prospect of mass vaccination programmes being rolled out globally, and continued monetary and fiscal support, the market is already looking through to the end of the worst of the pandemic. Some consolidation may be due in the near term, however emerging market equities could hit a sweet spot in 2021, with a recovering global economy, low interest rates for the foreseeable future and the potential for the US Dollar to reverse recent multiyear strength. The fund continues to be exposed to both secular growth themes, such as technology “plumbing” and consumption upgrade, and also more traditional sectors like financials, where we believe there is considerable recovery upside in some of last year’s laggards as the world returns to some semblance of normality. Emerging Markets should continue to provide plenty of opportunity for growth and we continue to seek out those rare companies best placed to capture it profitably.

Jupiter Asset Management Series Plc Annual Report and Audited Financial Statements for the financial year ended 31 December 2020
Investment Managers’ Reports (continued) For the financial year ended 31 December 2020
Investment Manager – Jupiter Investment Management Limited
Jupiter Global Emerging Markets Focus Fund (continued)
32
Jupiter Global Emerging Markets Focus Fund absolute and relative returns of share classes and benchmarks from 1 January 2020 to 31 December 2020. Share Class Benchmark Share Class
returns (%) Benchmark returns (%)
Relative returns (%)
A (EUR) Accumulation Shares MSCI EM (Emerging Markets) - Net Return 11.93 8.54 3.13
A (GBP) Accumulation Shares MSCI EM (Emerging Markets) - Net Return 18.42 14.65 3.28
A (USD) Accumulation Shares MSCI EM (Emerging Markets) - Net Return 22.17 18.31 3.26
B (USD) Accumulation Shares MSCI EM (Emerging Markets) - Net Return 20.91 18.31 2.20
C (USD) Accumulation Shares MSCI EM (Emerging Markets) - Net Return 19.78 18.31 1.25
C2 (USD) Accumulation Shares MSCI EM (Emerging Markets) - Net Return 20.90 18.31 2.19
I (USD) Accumulation Shares MSCI EM (Emerging Markets) - Net Return 23.27 18.31 4.20
R (GBP) Accumulation Shares MSCI EM (Emerging Markets) - Net Return 19.24 14.65 4.00
S (GBP) Accumulation Shares MSCI EM (Emerging Markets) - Net Return 18.97 14.65 3.77
U1 (GBP) Accumulation Shares MSCI EM (Emerging Markets) - Net Return 19.26 14.65 4.02
U2 (GBP) Accumulation Shares MSCI EM (Emerging Markets) - Net Return 19.49 14.65 4.22
Please note that the returns of different share classes and benchmarks may vary, depending on a number of factors, including the currency denomination of the share class and/or benchmark and fees charged. The fund does not track a benchmark, all returns are net of fees and the returns for the income share classes are gross of distributions.

Jupiter Asset Management Series Plc Annual Report and Audited Financial Statements for the financial year ended 31 December 2020
Investment Managers’ Reports (continued) For the financial year ended 31 December 2020
Investment Manager – Jupiter Investment Management Limited
Merian Asian Equity Income Fund
33
Performance of the fund The sub-fund underperformed its benchmark during the calendar year 2020 but was one of the strongest performing income biased funds in the peer group. The ability to generate income whilst controlling exposure to cheaper stocks has helped to deal with a difficult environment for value. Given the strong underperformance to value stocks, the fund was held back by some of the cheaper names held. However, this was somewhat offset by the tilt towards quality stocks which performed well over the year. Industries who have shown historic strength continued to outperform this year and added to the performance of the fund. Performance was also helped by avoiding some of the glamour names within the growth area of the market. Although there was some participation, the fund has been placed to benefit as and when these names reverse course. This positioning shielded the fund from the momentum breakdown seen in November and December.
Market and Outlook 2020 was a year of shocks both to the Asian economies and equity markets. The year began with expectations high for a second Trump term in the November US presidential election. Earnings and employment growth signalled a strong global economy. The arrival of Covid, whilst quickly becoming a tragedy for individual citizens, has led to a severe earnings recession in a number of sectors and the global economy suffering negative earnings growth. With that backdrop the behaviour of equity markets seems a little perverse, with positive returns seen across the region. The outperformance of growth, and underperformance of value, also accelerated in 2020 and market leadership narrowed as the winners and losers from the new “stay at home” reality became apparent. 2021 earnings revisions, which have been on a downward path throughout 2020, have begun to inflect higher towards the end of the year. Throughout 2020, investors had accessed low yielding but safe investments in a highly unstable macro and political environment. The return of stability and a snapback in growth could well mean this money looking for better yield in equity markets as the recovery continues. In a period of very low interest rates, long duration assets have been very attractive, hence the outperformance of growth stocks. Growth has also been quite concentrated, leading to a smaller number of growth companies being overly rewarded. This has led to the concentration of markets becoming the highest in 20 years, with for instance 5 companies making up 22% of US equity capitalisation. The Fed and other global central banks are likely to be on hold for the foreseeable future and the economy will expand in 2021 if only due to a bounceback from 2020. Growth will be more widespread, and high operationally leveraged companies which were crushed in 2020 should enjoy strong earnings growth.

Jupiter Asset Management Series Plc Annual Report and Audited Financial Statements for the financial year ended 31 December 2020
Investment Managers’ Reports (continued) For the financial year ended 31 December 2020
Investment Manager – Jupiter Investment Management Limited
Merian Asian Equity Income Fund (continued)
34
Merian Asian Equity Income Fund absolute and relative returns of share classes and benchmarks from 1 January 2020 to 31 December 2020. Share Class Benchmark Share Class
returns (%) Benchmark returns (%)
Relative returns (%)
A (EUR) Accumulation Shares MSCI AC Asia Pacific ex Japan (GDP weighted prior to 15Oct14) 5.50 12.33 (6.09)
A (GBP) Accumulation Shares MSCI AC Asia Pacific ex Japan (GDP weighted prior to 15Oct14) 10.96 18.66 (6.49)
A (USD) Accumulation Shares MSCI AC Asia Pacific ex Japan (GDP weighted prior to 15Oct14) 15.61 22.44 (5.58)
A (USD) Income (F) Shares MSCI AC Asia Pacific ex Japan (GDP weighted prior to 15Oct14) 15.17 22.44 (5.94)
A (USD) Income Shares MSCI AC Asia Pacific ex Japan (GDP weighted prior to 15Oct14) 14.50 22.44 (6.49)
B (USD) Accumulation Shares MSCI AC Asia Pacific ex Japan (GDP weighted prior to 15Oct14) 13.90 22.44 (6.98)
C (USD) Accumulation Shares MSCI AC Asia Pacific ex Japan (GDP weighted prior to 15Oct14) 13.01 22.44 (7.70)
C2 (USD) Income (F) Shares MSCI AC Asia Pacific ex Japan (GDP weighted prior to 15Oct14) 14.04 22.44 (6.87)
I (EUR) Accumulation Shares MSCI AC Asia Pacific ex Japan (GDP weighted prior to 15Oct14) 6.58 12.33 (5.12)
I (USD) Accumulation Shares MSCI AC Asia Pacific ex Japan (GDP weighted prior to 15Oct14) 16.49 22.44 (4.86)
R (GBP) Accumulation Shares MSCI AC Asia Pacific ex Japan (GDP weighted prior to 15Oct14) 12.73 18.66 (5.00)
U1 (GBP) Accumulation Shares MSCI AC Asia Pacific ex Japan (GDP weighted prior to 15Oct14) 12.82 18.66 (4.93)
U1 (GBP) Income Shares MSCI AC Asia Pacific ex Japan (GDP weighted prior to 15Oct14) 12.83 18.66 (4.92)
U2 (GBP) Income Shares MSCI AC Asia Pacific ex Japan (GDP weighted prior to 15Oct14) 12.74 18.66 (4.99)
Please note that the returns of different share classes and benchmarks may vary, depending on a number of factors, including the currency denomination of the share class and/or benchmark and fees charged. The fund does not track a benchmark, all returns are net of fees and the returns for the income share classes are gross of distributions.

Jupiter Asset Management Series Plc Annual Report and Audited Financial Statements for the financial year ended 31 December 2020
Investment Managers’ Reports (continued) For the financial year ended 31 December 2020
Investment Manager – Jupiter Investment Management Limited
Jupiter Local Currency Emerging Market Debt Fund
35
In common with nearly all asset classes, emerging market debt (EMD) experienced significant volatility early in the year as the coronavirus pandemic wrought havoc on the world economy. With both developed market and emerging market governments and central banks engaging in unprecedented stimulus measures by the beginning of April, outflows ended and the turnaround in EMD asset prices began. This recovery continued for the remainder of the first half. In the second half, EMD markets benefited from continued optimism as the recovery in major economies gathered momentum and the development of COVID-19 vaccines progressed. In November, the US election result and positive vaccine news drove emerging markets returns higher and attracted inflows. This broad trend continued through December across EMD: improving global economic data, vaccine optimism and the US election resolution remained the drivers for strong inflows and performance. Q4 2020 was the strongest quarter for EMD inflows since 2013, but only just retraced Q1-Q2 outflows. Over the 12 months, the fund slightly underperformed the benchmark. In the first half, the fund held onto what the managers considered to be oversold names during the market falls but reduced exposure to frontier markets. It remained overweight in interest-rate risk (duration) in those countries the managers saw as having room to further ease monetary policy such as Russia, Indonesia and Colombia. Near the end of the year, the fund added FX risks after the US election. The fund turned overweight in the Turkish lira, anticipating tightening from the central bank after the reshuffle of the economic team. The fund also added to the Mexican peso and Colombian peso to take advantage of attractive valuations and a recovery of commodity prices. The fund took profit in the rouble after the Russian hacking reports and extended duration in Mexico. The fund managers continue to believe a focus on fundamentals, along with differentiation by security and country, is key. They are generally constructive on countries that have room to take on higher fiscal deficits and high reserve balances and more defensively positioned towards countries that are running high debt-to-GDP ratios and are particularly vulnerable to currency shocks. The fund managers are positive about the outlook for the EMD asset class this year. EMD offers a significant yield premium relative to developed markets. The recent breakthrough with Covid-19 vaccines and subsequent rollout can be viewed as even more important for those EM countries that do not have the reserve currencies, deep pockets and access to credit markets that developed markets enjoy. Ongoing monetary and fiscal policy is likely to drive US dollar weakness, which will benefit EMD. Finally, investors are currently under-allocated to EMD, though according to several market surveys, many investors have expressed their desire to increase their exposure.

Jupiter Asset Management Series Plc Annual Report and Audited Financial Statements for the financial year ended 31 December 2020
Investment Managers’ Reports (continued) For the financial year ended 31 December 2020
Investment Manager – Jupiter Investment Management Limited
Jupiter Local Currency Emerging Market Debt Fund (continued)
36
Jupiter Local Currency Emerging Market Debt Fund absolute and relative returns of share classes and benchmarks from 1 January 2020 to 31 December 2020. Share Class Benchmark Share Class
returns (%) Benchmark returns (%)
Relative returns (%)
A (AUD) Hedged Income (F) Shares (0.87)
A (EUR) Accumulation Shares JP Morgan GBI-EM Global Diversified Composite (7.53) (5.79) (1.85)
A (GBP) Income Shares JP Morgan GBI-EM Global Diversified Composite (2.15) (0.48) (1.68)
A (USD) Accumulation Shares JP Morgan GBI-EM Global Diversified Composite 1.05 2.69 (1.60)
A (USD) Income (F) Shares JP Morgan GBI-EM Global Diversified Composite 1.09 2.69 (1.56)
A (USD) Income Shares JP Morgan GBI-EM Global Diversified Composite 1.09 2.69 (1.56)
A (ZAR) Hedged Income (F) Shares 3.90
B (AUD) Hedged Income (F) Shares (1.88)
B (USD) Income Shares JP Morgan GBI-EM Global Diversified Composite 0.02 2.69 (2.60)
B (ZAR) Hedged Income (F) Shares 2.80
C (USD) Accumulation Shares JP Morgan GBI-EM Global Diversified Composite (0.39) 2.69 (3.00)
C (USD) Income Shares JP Morgan GBI-EM Global Diversified Composite (0.46) 2.69 (3.07)
C2 (AUD) Hedged Income (F) Shares (2.80)
C2 (USD) Income (F) Shares JP Morgan GBI-EM Global Diversified Composite (0.10) 2.69 (2.72)
C2 (ZAR) Hedged Income (F) Shares 1.99
I (USD) Accumulation Shares JP Morgan GBI-EM Global Diversified Composite 2.06 2.69 (0.61)
U1 (GBP) Income Shares JP Morgan GBI-EM Global Diversified Composite (1.23) (0.48) (0.76)
U2 (GBP) Accumulation Shares JP Morgan GBI-EM Global Diversified Composite (1.12) (0.48) (0.65)
Please note that the returns of different share classes and benchmarks may vary, depending on a number of factors, including the currency denomination of the share class and/or benchmark and fees charged. Hedged share classes do not show a benchmark. The fund does not track a benchmark, all returns are net of fees and the returns for the income share classes are gross of distributions.

Jupiter Asset Management Series Plc Annual Report and Audited Financial Statements for the financial year ended 31 December 2020
Investment Managers’ Reports (continued) For the financial year ended 31 December 2020
Investment Manager – Jupiter Investment Management Limited
Jupiter UK Alpha Fund (IRL)
37
Global equity markets plunged in February as the COVID-19 virus spread globally. The restrictions on movement and social interaction imposed by governments led to a sharp decline in economic activity, which in turn saw profit forecast slashed, most notably for cyclical companies and those operating in the travel and leisure sectors which were most impacted by the restrictions. In response governments increased fiscal deficits and central banks significantly increased bond purchases to support their economies. These actions put a floor under equity markets which began to recover in the Spring. The discovery of effective vaccines to combat the virus in November lead to a sharp rise in equity market on the hope that they would lead to a return to a more normal economy. Joe Biden’s victory in the US Presidential election and the late agreement of a trade deal between the UK and EU added to the positive tone. The fund outperformed the index. Positive contributions to performance came from Pets at Home, gaming group Entain (formerly GVC), electricity generator Drax, Rio Tinto, Fidelity National Services and Experian, which all delivered resilient business performances over the year. Engineer Weir Group made progress following the sales of its problematic oil and gas division, which had held back the rating of the entire group. Travel catering group SSP and International Consolidated Airlines led the list of underperformers. Both companies raised equity to over the year to strengthen their balance sheets given the collapse in profits and cash flow caused by the pandemic. Software group Micro Focus issued poor trading statements earlier in the year while engineer Melrose moved lower due to the pandemic’s impact on its Aerospace and Automotive business. All the underperformers mention rose strongly in the final quarter on better trading statement and the optimism surrounding vaccines. Over the year we bought new positions in electricity generator SSE that will bill benefit from the government’s Green Agenda through its though its renewable energy and electricity distribution businesses. We also participated in the IPO of online retailer THG Group which is driving growth by selling its online expertise to third party brands, and also reintroduced housebuilder Taylor Wimpey into the portfolio on the belief that government support buyers would support the housing market. We sold out of our positions in HSBC and Aviva in favour of domestic banks Lloyds and Barclays that traded on substantial discounts to book value and added to positions in Whitbread, SSP and Drax at favourable prices. The market is currently looking through the short-term impact of extended lockdowns in many countries in the hope that vaccines will allow a return to a more normal economic environment. This remains our base case, but the new variants of the virus represent a threat to the efficacy of the vaccines and there are logistical challenges to the vaccine rollout. In the US, the Biden administration is likely to lead to significant fiscal stimulus that should support economic recovery. US bond yields have started to rise in response to the expected increase in spending and if this continues it could challenge the performance of growth stocks that have performed strongly in the low interest rate environment since the GFC while economic recovery will be supportive of the cyclical and value areas of the market. While retaining favoured growth stocks the fund bias is toward economic recovery and value.

Jupiter Asset Management Series Plc Annual Report and Audited Financial Statements for the financial year ended 31 December 2020
Investment Managers’ Reports (continued) For the financial year ended 31 December 2020
Investment Manager – Jupiter Investment Management Limited
Jupiter UK Alpha Fund (IRL) (continued)
38
Jupiter UK Alpha Fund (IRL) absolute and relative returns of share classes and benchmarks from 1 January 2020 to 31 December 2020. Share Class Benchmark Share Class
returns (%) Benchmark returns (%)
Relative returns (%)
A (EUR) Accumulation Shares FTSE ALL-SHARE (TR) (14.11) (14.63) 0.61
A (GBP) Accumulation Shares FTSE ALL-SHARE (TR) (9.12) (9.82) 0.77
A (GBP) Income Shares FTSE ALL-SHARE (TR) (9.10) (9.82) 0.79
A (USD) Accumulation Shares FTSE ALL-SHARE (TR) (6.11) (6.94) 0.89
A (USD) Hedged Accumulation Shares (7.40)
I (EUR) Accumulation Shares FTSE ALL-SHARE (TR) (13.44) (14.63) 1.39
I (USD) Accumulation Shares FTSE ALL-SHARE (TR) (5.38) (6.94) 1.68
I (USD) Hedged Accumulation Shares (6.78)
R (GBP) Accumulation Shares FTSE ALL-SHARE (TR) (8.43) (9.82) 1.54
R (GBP) Income Shares FTSE ALL-SHARE (TR) (8.41) (9.82) 1.56
U1 (GBP) Accumulation Shares FTSE ALL-SHARE (TR) (8.36) (9.82) 1.62
U1 (GBP) Income Shares FTSE ALL-SHARE (TR) (8.34) (9.82) 1.63
U1 (USD) Accumulation Shares FTSE ALL-SHARE (TR) (5.30) (6.94) 1.77
U2 (GBP) Accumulation Shares FTSE ALL-SHARE (TR) (8.28) (9.82) 1.70
U2 (GBP) Income Shares FTSE ALL-SHARE (TR) (8.28) (9.82) 1.70
U2 (USD) Accumulation Shares FTSE ALL-SHARE (TR) (5.24) (6.94) 1.83
Please note that the returns of different share classes and benchmarks may vary, depending on a number of factors, including the currency denomination of the share class and/or benchmark and fees charged. Hedged share classes do not show a benchmark. The fund does not track a benchmark, all returns are net of fees and the returns for the income share classes are gross of distributions.

Jupiter Asset Management Series Plc Annual Report and Audited Financial Statements for the financial year ended 31 December 2020
Investment Managers’ Reports (continued) For the financial year ended 31 December 2020
Investment Manager – Jupiter Investment Management Limited
Jupiter UK Smaller Companies Focus Fund
39
The sub fund performed strongly over the year, significantly outperforming the benchmark by year-end. The year was dominated by the COVID-19 pandemic and the associated government responses, ranging from substantial fiscal and monetary stimulus to nationwide lockdowns. The initial onset of the pandemic saw a sharp decline in equity markets in February and March, before the start of a recovery in the summer, further accelerated by the positive vaccine news in Q4. The economic fallout varied hugely between sectors, countries, and individuals. Online businesses, for instance, saw rapid acceleration in adoption, while businesses dependent on the physical interaction of people unsurprisingly suffered. The fund went into the year more balanced thematically, but still overweight structural growth, which saw a significant outperformance over most of the year. During the troughs of the market, we selectively took the opportunity to increase this overweight, adding to our tech focused businesses that stood to benefit from the shift online. This position was mediated towards the second half of the year, adding more travel sensitivity and cyclicality to the portfolio, to provide protection against the value/cyclical rotation. Pleasingly the fund outperformed the benchmark across both halves. As we look forward, the fund thematic tilt remains slightly to structural growth, offset with a good degree of cyclicality. Whilst the full ramifications of the pandemic are yet to emerge, in our view, the length of lockdown restrictions is habit forming in many instances, creating enduring trends that the portfolio stands to benefit from, such as the shift online. Conclusions in the US election and a Brexit deal of sorts further reduce macro pressures, hopefully allowing for a more stock specific driven year. There are also early signs of the IPO market resuming in the new year. Valuations remain attractive relative to other asset classes and jurisdictions and opportunities remain for long term investors.
Jupiter UK Smaller Companies Focus Fund absolute and relative returns of share classes and benchmarks from 1 January 2020 to 31 December 2020. Share Class Benchmark Share Class
returns (%) Benchmark returns (%)
Relative returns (%)
A (GBP) Income Shares Numis Smaller Companies Index ex Investment Companies - Total Return 10.97 (4.29) 15.94
R (GBP) Income Shares Numis Smaller Companies Index ex Investment Companies - Total Return 11.55 (4.29) 16.55
U1 (GBP) Income Shares Numis Smaller Companies Index ex Investment Companies - Total Return 11.54 (4.29) 16.54
Please note that the returns of different share classes and benchmarks may vary, depending on a number of factors, including the currency denomination of the share class and/or benchmark and fees charged. The fund does not track a benchmark, all returns are net of fees and the returns for the income share classes are gross of distributions.

Jupiter Asset Management Series Plc Annual Report and Audited Financial Statements for the financial year ended 31 December 2020
Investment Managers’ Reports (continued) For the financial year ended 31 December 2020
Investment Manager – Jupiter Investment Management Limited
Jupiter UK Dynamic Equity Fund
40
The COVID-19 pandemic was the overwhelming driver of financial markets over 2020. The pandemic, and the measures taken by governments to control it, had a severe impact on global economic output. Governments intervened with very substantial fiscal stimulus, while central banks lowered interest rates and materially increased their purchases of government bonds. The economic fallout varied hugely between sectors, countries, and individuals. Online businesses, for instance, saw rapid acceleration in adoption, while businesses dependent on the physical interaction of people unsurprisingly suffered. Equity markets fell sharply in February and March, as the economic impact of the pandemic was digested. The equally dramatic recovery over the summer was largely led by stocks seen to benefit from the near-term and long-term impact of the pandemic. This meant a significant outperformance of “growth” and “quality” stocks over “cyclical” and “value”. Finally, in late autumn, a number of highly efficacious Phase III vaccine trial results were announced, leading to a sharp reversal in these thematic trends, and further gains in overall equity markets. Against this turbulent backdrop, the fund had a strong year, outperforming its benchmark and placing in the top decile of the UK All Companies peer group. The fund has long been positioned overweight in those businesses best positioned to benefit from the structural shift towards a more digital way of life. Covid has materially accelerated this structural shift to the benefit of key holdings such as boohoo.com, The Hut Group, S4 Capital, and Asos. Weaker performances came from directly Covid-affected businesses such as Melrose and Workspace. The short book benefitted from small gains in AG Barr, Biffa and Victrex. There was considerable portfolio activity as we shifted the fund in response to the dramatically changing outlook. Initially we sold positions in businesses most directly impacted by Covid, however we were able to add back selective exposure at attractive valuations during the summer months and into the year end as more positive than expected vaccine efficacy became apparent. Thematically, the fund is currently reasonably balanced with respect to Covid winners/losers via a mix of longer-term structural winners and more cyclical businesses with the potential to enjoy a strong recovery as the world returns to normality. While the Brexit trade negotiations have ultimately resulted in a ‘skinny’ deal, their conclusion does at least allow businesses to plan and invest with some degree of certainty. Meanwhile the roll-out of vaccines in the UK and wider world should mark the beginning of the end of the Covid-19 pandemic, notwithstanding several more months of tough containment measures to come. The resultant economic recovery, coupled with governments and central banks that are unlikely to remove stimulus measures any time soon, should create a supportive backdrop for equity markets and UK small and mid caps in particular. Valuations remain attractive relative to other asset classes and jurisdictions and opportunities remain for long term investors.
Jupiter UK Dynamic Equity Fund absolute and relative returns of share classes and benchmarks from 1 January 2020 to 31 December 2020. Share Class Benchmark Share Class
returns (%) Benchmark returns (%)
Relative returns (%)
A (GBP) Income Shares FTSE 250 x Investment Trusts - Total Return 6.95 (8.48) 16.86
I (EUR) Hedged Accumulation Shares 8.29
R (GBP) Income Shares FTSE 250 x Investment Trusts - Total Return 6.99 (8.48) 16.90
Please note that the returns of different share classes and benchmarks may vary, depending on a number of factors, including the currency denomination of the share class and/or benchmark and fees charged. Hedged share classes do not show a benchmark. The fund does not track a benchmark, all returns are net of fees and the returns for the income share classes are gross of distributions.

Jupiter Asset Management Series Plc Annual Report and Audited Financial Statements for the financial year ended 31 December 2020
Investment Managers’ Reports (continued) For the financial year ended 31 December 2020
Investment Manager – Jupiter Investment Management Limited
Jupiter Merian Global Equity Absolute Return Fund
41
Performance of the Fund The sub-fund had a small negative return in the calendar year 2020 and underperformed its benchmark. The disappointing returns overall masked the continued improvement in performance over the second half of the year. The fund was strongly tilted away from cheaper names for most of the year and this avoided some of the significant losses to cheaper stocks as growth names once again dominated market performance. The tilt towards high quality names, those with lower debt, consistent profitability and an efficient balance sheet also mitigated some of the negative performance that would have been present with larger amounts of cheaper names in the portfolio. Another weaker area of performance was due to the fund avoiding some of the glamour names within the growth area of the market. Although there was some participation, the fund has been placed to benefit as and when these names reverse course. This positioning detracted from performance as the glamour names continued to be bought by the market into the fourth quarter of the year, though this positioning shielded the fund from the momentum breakdown seen in November and December.
Market and Outlook
2020 was a year of shocks both to the global economy and equity markets. The year began with expectations high for a second Trump term in the November US presidential election. Earnings and employment growth signalled a strong global economy. The arrival of Covid, whilst quickly becoming a tragedy for individual citizens, has led to a severe earnings recession in a number of sectors and the global economy suffering negative earnings growth. With that backdrop the behaviour of equity markets seems a little perverse, with only European markets falling. The outperformance of growth, and underperformance of value, also accelerated in 2020 and market leadership narrowed as the winners and losers from the new “stay at home” reality became apparent. 2021 earnings revisions, which have been on a downward path throughout 2020, have begun to inflect higher towards the end of the year. Throughout 2020, 1 trillion USD has gone into US money market funds looking for safety in a highly unstable macro and political environment. Rates at or around zero could mean some of this money looking for better yield in equity markets as the recovery continues. In a period of very low interest rates, long duration assets have been very attractive, hence the outperformance of growth stocks. Growth has also been quite concentrated, leading to a smaller number of growth companies being overly rewarded. This has led to the concentration of markets becoming the highest in 20 years, with for instance 5 companies making up 22% of US equity capitalisation. The Fed and other global central banks are likely to be on hold for the foreseeable future and the economy will expand in 2021 if only due to a bounceback from 2020. Growth will be more widespread, and high operationally leveraged companies which were crushed in 2020 should enjoy strong earnings growth.
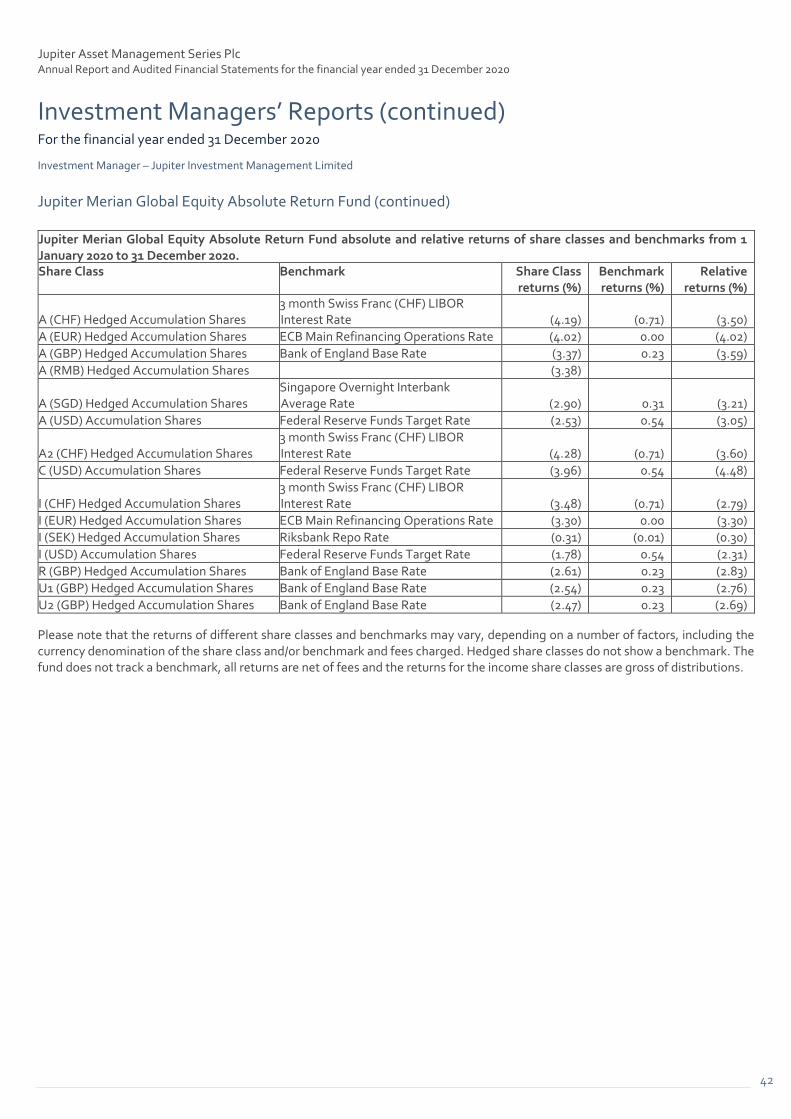
Jupiter Asset Management Series Plc Annual Report and Audited Financial Statements for the financial year ended 31 December 2020
Investment Managers’ Reports (continued) For the financial year ended 31 December 2020
Investment Manager – Jupiter Investment Management Limited
Jupiter Merian Global Equity Absolute Return Fund (continued)
42
Jupiter Merian Global Equity Absolute Return Fund absolute and relative returns of share classes and benchmarks from 1 January 2020 to 31 December 2020. Share Class Benchmark Share Class
returns (%) Benchmark returns (%)
Relative returns (%)
A (CHF) Hedged Accumulation Shares 3 month Swiss Franc (CHF) LIBOR Interest Rate (4.19) (0.71) (3.50)
A (EUR) Hedged Accumulation Shares ECB Main Refinancing Operations Rate (4.02) 0.00 (4.02)
A (GBP) Hedged Accumulation Shares Bank of England Base Rate (3.37) 0.23 (3.59)
A (RMB) Hedged Accumulation Shares (3.38)
A (SGD) Hedged Accumulation Shares Singapore Overnight Interbank Average Rate (2.90) 0.31 (3.21)
A (USD) Accumulation Shares Federal Reserve Funds Target Rate (2.53) 0.54 (3.05)
A2 (CHF) Hedged Accumulation Shares 3 month Swiss Franc (CHF) LIBOR Interest Rate (4.28) (0.71) (3.60)
C (USD) Accumulation Shares Federal Reserve Funds Target Rate (3.96) 0.54 (4.48)
I (CHF) Hedged Accumulation Shares 3 month Swiss Franc (CHF) LIBOR Interest Rate (3.48) (0.71) (2.79)
I (EUR) Hedged Accumulation Shares ECB Main Refinancing Operations Rate (3.30) 0.00 (3.30)
I (SEK) Hedged Accumulation Shares Riksbank Repo Rate (0.31) (0.01) (0.30)
I (USD) Accumulation Shares Federal Reserve Funds Target Rate (1.78) 0.54 (2.31)
R (GBP) Hedged Accumulation Shares Bank of England Base Rate (2.61) 0.23 (2.83)
U1 (GBP) Hedged Accumulation Shares Bank of England Base Rate (2.54) 0.23 (2.76)
U2 (GBP) Hedged Accumulation Shares Bank of England Base Rate (2.47) 0.23 (2.69)
Please note that the returns of different share classes and benchmarks may vary, depending on a number of factors, including the currency denomination of the share class and/or benchmark and fees charged. Hedged share classes do not show a benchmark. The fund does not track a benchmark, all returns are net of fees and the returns for the income share classes are gross of distributions.

Jupiter Asset Management Series Plc Annual Report and Audited Financial Statements for the financial year ended 31 December 2020
Investment Managers’ Reports (continued) For the financial year ended 31 December 2020
Investment Manager – Jupiter Investment Management Limited
Jupiter Strategic Absolute Return Bond Fund
43
The Deutsche Bank Fed Funds Effective Rate Total Return Index returned 0.38% over the period. Cross-asset price action at the start of the year was mixed, especially FX, where the USD defied the analyst consensus and appreciated throughout January. With global growth remaining lacklustre, a return to the strong USD regime made us wary and we expected heightened market volatility, which ultimately unfolded under the most unfortunate of circumstances. Thankfully, policymakers responded much faster to this recession than in 2008. Central banks, governments and supranational bodies all intervened promptly, resulting in the shortest equity bear market in history and set the stage for a sharp rebound in risk assets over the summer. Momentum stalled in the third quarter though, as real yields based, Covid-19 case counts rose in Europe, and the US election approached. It was not until after the US election that cyclical assets resumed their upward trend, with robust economic data and Pfizer’s vaccine announcement proving to be a powerful combination. Policy followed too, the ECB, Fed, and US policymakers all delivered additional stimulus to help support the recovery through a tough winter, and even the slimmest of Brexit deals was agreed at the 11th hour. This ensured that the year culminated in a melt-up of risk assets, especially those linked to growth. The fund comfortably outperformed its benchmark and peer group during the period. In many ways, it was as much about what we were not invested in, as what we were invested in. Once it became clear that growth would stay weak, we lowered our tracking error, leaving the fund well placed for the pandemic. Our highly-liquid, defensive portfolio enabled us to avoid the worst of the drawdown, unlike many of our peers who were overweight corporate credit. Our US rates duration was particularly effective, with the yield on the US 10y falling 100bps in a matter of weeks. When policymakers took action in March, we saw an opportunity to add risk to the fund. The levels on IG credit, peripheral Eurozone debt and inflation breakevens looked particularly attractive, and we sought to enhance our exposure, whilst others rushed to cash. By being positioned for the unprecedented stimulus, the fund performed well over the summer and more than kept pace with peers in the rally. After this strong performance, we decided to lower our tracking error once more, having grown concerned by rising Covid-19 cases and the lack of forthcoming stimulus. This left us well placed for the market gyrations between then and the US election, after which our core reflation positioning such as EM rates flourished. That said, core rates were highly volatile around the US election and the vaccine news, and we had to trade tactically to ensure that the fund successfully navigated this. We used the relative calm towards the end of the year to position for the next phase of the cycle – higher US rates. For example, adding US-German spread wideners and reducing our credit exposure further. Consensus believed 2021 would be reflationary and we largely agreed. Many of the issues that had plagued markets such as the US election, were ultimately resolved in the final months of the year. Oddly, risk assets continued to exhibit sizeable risk premiums and so we felt comfortable with our cyclical exposures, and if anything contemplated enhancing positioning in these areas. Nevertheless, the unanimity of the 2021 consensus was troubling and we spent much of December debating how this could come undone. Our main concerns were around Chinese growth, Fed policy and the potential for market volatility, believing that any of one of these themes could derail the reflationary narrative and herald a return to US exceptionalism. Indeed, many asset classes ended the year back at pre-Covid levels, meaning that further gains would require a structural change to occur, in effect a year of genuine reflation. We therefore ended the year cautiously optimistic, but with a healthy degree of scepticism about the consensus.
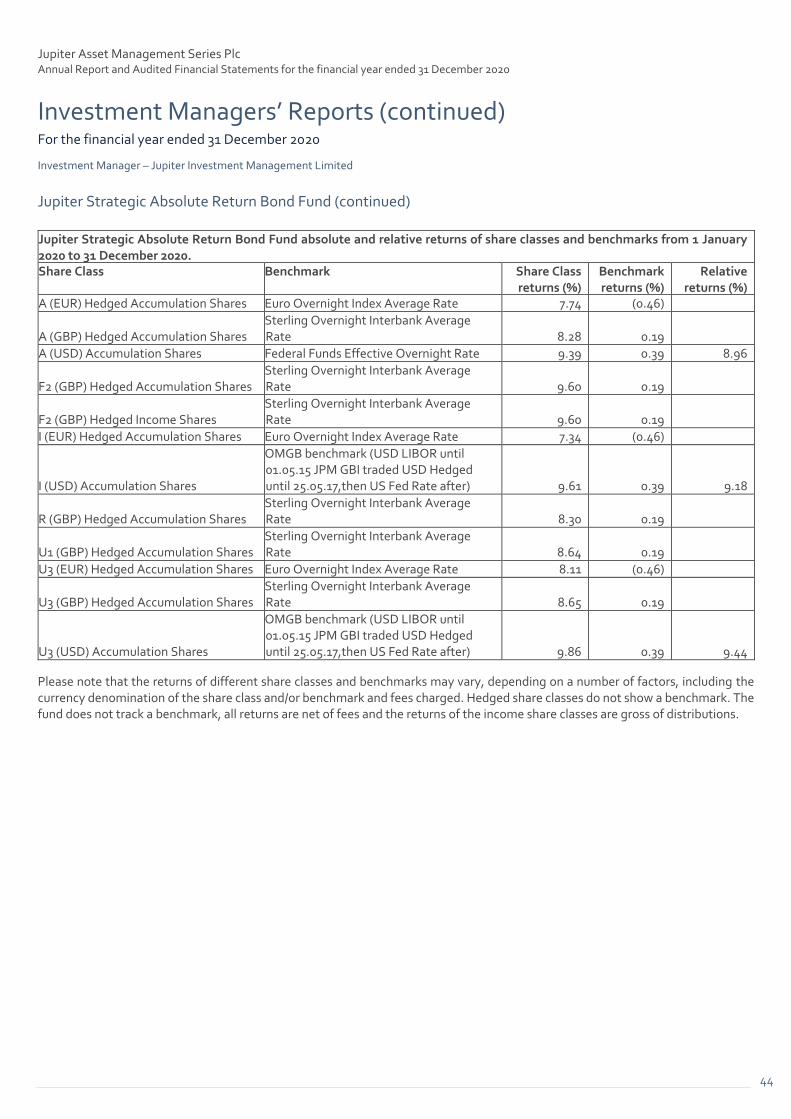
Jupiter Asset Management Series Plc Annual Report and Audited Financial Statements for the financial year ended 31 December 2020
Investment Managers’ Reports (continued) For the financial year ended 31 December 2020
Investment Manager – Jupiter Investment Management Limited
Jupiter Strategic Absolute Return Bond Fund (continued)
44
Jupiter Strategic Absolute Return Bond Fund absolute and relative returns of share classes and benchmarks from 1 January 2020 to 31 December 2020. Share Class Benchmark Share Class
returns (%) Benchmark returns (%)
Relative returns (%)
A (EUR) Hedged Accumulation Shares Euro Overnight Index Average Rate 7.74 (0.46)
A (GBP) Hedged Accumulation Shares Sterling Overnight Interbank Average Rate 8.28 0.19
A (USD) Accumulation Shares Federal Funds Effective Overnight Rate 9.39 0.39 8.96
F2 (GBP) Hedged Accumulation Shares Sterling Overnight Interbank Average Rate 9.60 0.19
F2 (GBP) Hedged Income Shares Sterling Overnight Interbank Average Rate 9.60 0.19
I (EUR) Hedged Accumulation Shares Euro Overnight Index Average Rate 7.34 (0.46)
I (USD) Accumulation Shares
OMGB benchmark (USD LIBOR until 01.05.15 JPM GBI traded USD Hedged until 25.05.17,then US Fed Rate after) 9.61 0.39 9.18
R (GBP) Hedged Accumulation Shares Sterling Overnight Interbank Average Rate 8.30 0.19
U1 (GBP) Hedged Accumulation Shares Sterling Overnight Interbank Average Rate 8.64 0.19
U3 (EUR) Hedged Accumulation Shares Euro Overnight Index Average Rate 8.11 (0.46)
U3 (GBP) Hedged Accumulation Shares Sterling Overnight Interbank Average Rate 8.65 0.19
U3 (USD) Accumulation Shares
OMGB benchmark (USD LIBOR until 01.05.15 JPM GBI traded USD Hedged until 25.05.17,then US Fed Rate after) 9.86 0.39 9.44
Please note that the returns of different share classes and benchmarks may vary, depending on a number of factors, including the currency denomination of the share class and/or benchmark and fees charged. Hedged share classes do not show a benchmark. The fund does not track a benchmark, all returns are net of fees and the returns of the income share classes are gross of distributions.

Jupiter Asset Management Series Plc Annual Report and Audited Financial Statements for the financial year ended 31 December 2020
Investment Managers’ Reports (continued) For the financial year ended 31 December 2020
Investment Manager – Jupiter Investment Management Limited
Jupiter Europe (ex UK) Smaller Companies Fund
45
Market review Risk assets started the period on a tear, continuing the trend of the previous 12 months. But by the middle of February, financial markets had started to become concerned about the spread of the coronavirus from China. What had initially been seen as a local issue for the Chinese economy, or at least a more limited pandemic along the line of the 2002-03 SARS outbreak, swiftly developed into something much more significant. As economies around the world started to impose lockdowns in an attempt to stem the spread of the virus, the severe economic impact of the coronavirus became apparent. Having set records in terms of declines in economic activity levels, the end of the period brought much better economic data globally, starting with the US non-farm payrolls and continuing through PMIs and confidence surveys across Europe. November was an exceptional month for equity markets. At the beginning, it was uncertain who would be the next US president after the tightest election in 20 years. But when it became clear that this was highly likely to be Joe Biden, Pfizer released news that its Covid-19 vaccine had proven far more effective than anyone had dared to hope. The announcement triggered a remarkable rotation from highly rated long-duration growth stocks into beaten-down ‘value’ stocks and this so-called ‘reflation trade’ continued on the back of additional vaccine news from Moderna and AstraZeneca. In December, global equities reached further post-pandemic highs as optimism about a US fiscal stimulus deal, Covid-19 vaccinations and Brexit negotiations proved strongly supportive of equities. Set against this, a new and significantly more infectious variant of the coronavirus was identified. Germany entered a hard lockdown from mid-December onwards, other European states enacted stricter measures too.
Performance review The fund underperformed the benchmark during the year. In the first half, the fund initially struggled as bond yields collapsed, which supercharged returns for shares in growth companies. Positive contributions for the fund during the year came from industrials, health care and consumer staples. Negative contributions came from consumer discretionary and financials. The new managers who took over in July have aligned the fund with their existing highly successful long-term strategy. This involves investing in exceptional European-based companies by focusing on business models and operational performance. The new team firmly believes that long-term value is not affected by short-term noise, and that a buy and hold strategy benefits from compounding value. The team is seeking quality businesses that consistently produce cash and create shareholder value, and which are led by proven management teams aligned with shareholders’ interests. There is a clear focus by the new managers on seeking companies with a sustainable competitive advantage that operate in areas of long-term growth. The ability of companies to generate high return is important. But so is their ability to sustainably reinvest at attractive internal rates of return and generate further high-quality growth. In the new managers’ view, this is the key to outsized returns. Exceptional growth companies have the potential to become even more valuable, benefiting their shareholders. The new team is keenly focused on identifying companies with the potential to consistently create significant value.

Jupiter Asset Management Series Plc Annual Report and Audited Financial Statements for the financial year ended 31 December 2020
Investment Managers’ Reports (continued) For the financial year ended 31 December 2020
Investment Manager – Jupiter Investment Management Limited
Jupiter Europe (ex UK) Smaller Companies Fund (continued)
46
Jupiter Europe (ex-UK) Smaller Companies Fund absolute and relative returns of share classes and benchmarks from 1 January 2020 to 31 December 2020. Share Class Benchmark Share Class
returns (%) Benchmark returns (%)
Relative returns (%)
A (EUR) Accumulation Shares EMIX Smaller Europe x UK 0.86 12.55 (10.38)
A (GBP) Accumulation Shares EMIX Smaller Europe x UK 6.72 18.89 (10.24)
A (USD) Accumulation Shares EMIX Smaller Europe x UK 10.28 22.68 (10.11)
A (USD) Hedged Accumulation Shares 2.30
C (USD) Hedged Accumulation Shares 0.48
I (EUR) Accumulation Shares EMIX Smaller Europe x UK 1.36 12.55 (9.94)
I (USD) Accumulation Shares EMIX Smaller Europe x UK 10.94 22.68 (9.57)
I (USD) Hedged Accumulation Shares 3.04
R (GBP) Accumulation Shares EMIX Smaller Europe x UK 7.53 18.89 (9.56)
R (GBP) Hedged Accumulation Shares 1.21
R (GBP) Income Shares EMIX Smaller Europe x UK 7.53 18.89 (9.56)
U1 (EUR) Income Shares EMIX Smaller Europe x UK 1.64 12.55 (9.69)
U1 (GBP) Accumulation Shares EMIX Smaller Europe x UK 7.07 18.89 (9.95)
U1 (GBP) Hedged Accumulation Shares 1.08
U1 (GBP) Income Shares EMIX Smaller Europe x UK 7.62 18.89 (9.48)
U2 (GBP) Accumulation Shares EMIX Smaller Europe x UK 6.89 18.89 (10.09)
Please note that the returns of different share classes and benchmarks may vary, depending on a number of factors, including the currency denomination of the share class and/or benchmark and fees charged. Hedged share classes do not share a benchmark. The fund does not track a benchmark, all returns are net of fees and the returns of the income share classes are gross of distributions.

Jupiter Asset Management Series Plc Annual Report and Audited Financial Statements for the financial year ended 31 December 2020
Investment Managers’ Reports (continued) For the financial year ended 31 December 2020
Investment Manager – Jupiter Investment Management Limited
Jupiter Merian Global Equity Income Fund (IRL)
47
Performance of the fund The sub-fund underperformed its benchmark during the calendar year 2020 but was one of the strongest performing income biased funds in the peer group. The ability to generate income whilst controlling exposure to cheaper stocks has helped to deal with a difficult environment for value. Given the strong underperformance to value stocks, the fund was held back by some of the cheaper names held. However, this was somewhat offset by the tilt towards quality stocks which performed well over the year. The fund is also tilted away from the glamour names that have driven markets higher, with positioning that would perform well as these momentum stocks reverse course. This positioning detracted from performance as the glamour names continued to be bought by the market into the fourth quarter of the year, though this positioning shielded the fund from the momentum breakdown seen in November and December.
Market and Outlook 2020 was a year of shocks both to the global economy and equity markets. The year began with expectations high for a second Trump term in the November US presidential election. Earnings and employment growth signalled a strong global economy. The arrival of Covid, whilst quickly becoming a tragedy for individual citizens, has led to a severe earnings recession in a number of sectors and the global economy suffering negative earnings growth. With that backdrop the behaviour of equity markets seems a little perverse, with only European markets falling. The outperformance of growth, and underperformance of value, also accelerated in 2020 and market leadership narrowed as the winners and losers from the new “stay at home” reality became apparent. 2021 earnings revisions, which have been on a downward path throughout 2020, have begun to inflect higher towards the end of the year. Throughout 2020, 1 trillion USD has gone into US money market funds looking for safety in a highly unstable macro and political environment. Rates at or around zero could mean some of this money looking for better yield in equity markets as the recovery continues. In a period of very low interest rates, long duration assets have been very attractive, hence the outperformance of growth stocks. Growth has also been quite concentrated, leading to a smaller number of growth companies being overly rewarded. This has led to the concentration of markets becoming the highest in 20 years, with for instance 5 companies making up 22% of US equity capitalisation. The Fed and other global central banks are likely to be on hold for the foreseeable future and the economy will expand in 2021 if only due to a bounceback from 2020. Growth will be more widespread, and high operationally leveraged companies which were crushed in 2020 should enjoy strong earnings growth.
Jupiter Merian Global Equity Income Fund (IRL) absolute and relative returns of share classes and benchmarks from 1 January 2020 to 31 December 2020. Share Class Benchmark Share Class
returns (%) Benchmark returns (%)
Relative returns (%)
A (GBP) Income Shares MSCI AC World Index - Net Return 6.45 12.67 (5.52)
A (USD) Income Shares MSCI AC World Index - Net Return 9.92 16.25 (5.45)
I (EUR) Accumulation Shares MSCI AC World Index - Net Return 1.37 6.65 (4.95)
I (EUR) Income Shares MSCI AC World Index - Net Return 1.37 6.65 (4.95)
I (USD) Income Shares MSCI AC World Index - Net Return 10.80 16.25 (4.69)
R (GBP) Accumulation Shares MSCI AC World Index - Net Return 7.16 12.67 (4.89)
R (GBP) Income Shares MSCI AC World Index - Net Return 7.26 12.67 (4.80)
S (GBP) Accumulation Shares MSCI AC World Index - Net Return 6.98 12.67 (5.04)
U1 (GBP) Accumulation Shares MSCI AC World Index - Net Return 7.25 12.67 (4.81)
U1 (GBP) Income Shares MSCI AC World Index - Net Return 7.25 12.67 (4.81)
Please note that the returns of different share classes and benchmarks may vary, depending on a number of factors, including the currency denomination of the share class and/or benchmark and fees charged. The fund does not track a benchmark, all returns are net of fees and the returns of the income share classes are gross of distributions.

Jupiter Asset Management Series Plc Annual Report and Audited Financial Statements for the financial year ended 31 December 2020
Investment Managers’ Reports (continued) For the financial year ended 31 December 2020
Investment Manager – Jupiter Investment Management Limited
Jupiter Gold & Silver Fund
48
Performance of the Fund
The calendar year 2020 was positive overall for the Gold & Silver Fund with consistent inflows throughout the year and solid absolute and relative performance. There was substantial volatility within the twelve-month period, as seen in all asset classes, with a precipitous drop in March (driven by sharply rising real rates) followed by a strong consistent rally in Q2 and Q3 and a back-filling quarter at the end of the year. Sentiment towards the Gold and Silver mining equities did pick up in Q2 and Q3 but at the end of the year had fallen back to very low levels again.
July was especially strong for the fund as Silver started to show its natural Beta to rising Gold prices, albeit Silver mining equities showed limited Beta on the way up in July and concomitantly behaved quite well on a relative basis in Q4, when major Gold miners fell back hard from their highs in early Q3. All of this led to the fund’s differentiated asset allocation blend and process showing a differentiated outcome comparted to a pure gold mining fund or benchmark. This had not been the case on the quieter four years preceding this twelve-month period and we think is a sign of things to come. Smaller development and exploration stocks delivered as a subset within the portfolio as capital has now been made available by investors; this is the key to the overall secular Gold mining cycle and is a sign of a healthy bull market rather than a short term blip in a longer term downtrend.
The outstanding performer in 2020 within the fund was De Grey Mining, a world-class exploration and development story in the Pilbara region of northern Western Australia. The fund has built a strong position in the name thanks to some well-timed capital raises, and we expect this new Gold mining district to continue to surprise the market and the wider mining industry in 2021 as the drills keep turning and cheap ounces are added to De Grey’s resource base. A number of the fund’s holdings participated in M&A activity in 2020 but we expect that trend to accelerate rather than dissipate over the next calendar year. Silver miners were (as mentioned above) surprisingly quiet overall in 2020 but we anticipate a big rerating for them should the spot Silver price move through $30 with momentum.
Market & Outlook
On a macro basis the set up for the fund is terrific moving into 2021. The combination of falling real rates (the Fed are trying to generate inflation and state they will hold rates down, both of which benefit Gold and Silver) and a swathe of new fiscal and monetary policies being rolled out soon bode very well for the sector. Most interesting for the fund is the putative New Green Deal, which would involve a big ramp in demand for Silver.
The overall managed money Gold mining space remains tiny at around $17bn AUM at the end of this year. That has scope to double, triple etc. over the foreseeable future purely based on a continued momentum build, let alone should asset allocators start to move towards Gold and Silver miners to be core allocations. With the miners raising dividends, showing consistent earnings growth and margin expansion dynamics, we believe that before long equity allocators will find this little considered subset irresistible, especially in light of obvious problems being felt elsewhere.
Jupiter Gold & Silver Fund absolute and relative returns of share classes and benchmarks from 1 January 2020 to 31 December 2020. Share Class Benchmark Share Class
returns (%) Benchmark returns (%)
Relative returns (%)
A (EUR) Accumulation Shares Gold & Silver Composite Benchmark (EUR) 28.46 15.95 10.79
A (GBP) Accumulation Shares Gold & Silver Composite Benchmark (£) 35.92 22.68 10.79
A (USD) Accumulation Shares Gold & Silver Composite Benchmark 40.47 26.41 11.12
C (USD) Accumulation Shares Gold & Silver Composite Benchmark 38.34 26.41 9.44
I (EUR) Accumulation Shares Gold & Silver Composite Benchmark (EUR) 29.44 15.95 11.63
I (USD) Accumulation Shares Gold & Silver Composite Benchmark 41.53 26.41 11.96
R (GBP) Accumulation Shares Gold & Silver Composite Benchmark (£) 36.95 22.68 11.63
U1 (GBP) Accumulation Shares Gold & Silver Composite Benchmark (£) 37.08 22.68 11.73
U2 (GBP) Accumulation Shares Gold & Silver Composite Benchmark (£) 37.19 22.68 11.82
U3 (GBP) Accumulation Shares Gold & Silver Composite Benchmark (£) 34.63 22.68 9.73
Please note that the returns of different share classes and benchmarks may vary, depending on a number of factors, including the currency denomination of the share class and/or benchmark and fees charged. The fund does not track a benchmark, all returns are net of fees and the returns of the income share classes are gross of distributions.

Jupiter Asset Management Series Plc Annual Report and Audited Financial Statements for the financial year ended 31 December 2020
Investment Managers’ Reports (continued) For the financial year ended 31 December 2020
Investment Manager – Jupiter Investment Management Limited
Jupiter UK Specialist Equity Fund
49
The COVID-19 pandemic was the overwhelming driver of financial markets over 2020. The pandemic, and the measures taken by governments to control it, had a severe impact on global economic output. Governments intervened with very substantial fiscal stimulus, while central banks lowered interest rates and materially increased their purchases of government bonds. The economic fallout varied hugely between sectors, countries, and individuals. Online businesses, for instance, saw rapid acceleration in adoption, while businesses dependent on the physical interaction of people unsurprisingly suffered.
Equity markets fell sharply in February and March, as the economic impact of the pandemic was digested. The equally dramatic recovery over the summer was largely led by stocks seen to benefit from the near-term and long-term impact of the pandemic. This meant a significant outperformance of “growth” and “quality” stocks over cyclical and “value”. Finally, in late autumn, a number of highly efficacious Phase III vaccine trial results were announced, leading to a sharp reversal in these thematic trends, and further gains in overall equity markets. Against this turbulent backdrop, the fund delivered pleasing double-digit returns, with much lower volatility than equity markets. On the long book, the top three positive contributors were S4 Capital (digital marketing), ASOS (a new position in e-commerce) and the Hut Group (the fund’s last material unlisted holding, which completed a successful IPO). The main negative contributors were stocks heavily affected by the pandemic: including SSP Group (concessions in airports and train stations), Hyve Group (business events) and Workspace (flexible office space). On the short book, the main positives were an owner of shopping centres, a high street retailer and a TV company. The main negatives were a bicycle retailer, a pub company and a financial services business. Thematically, the fund is currently reasonably broadly based, with a mix of both longer term structural winners, and more cyclical businesses with the potential to enjoy a recovery in 2021. The short book has a mix of longer term structural losers, combined with some positions in expensively rated growth and quality businesses, to hedge against further market rotation away from this theme. As ever, the core driver of future returns from the strategy will be principally driven by good stock selection on both the long and active short books. Net exposure remains very low.
Jupiter UK Specialist Equity Fund absolute and relative returns of share classes and benchmarks from 1 January 2020 to 31 December 2020. Share Class Benchmark Share Class
returns (%) Benchmark returns (%)
Relative returns (%)
A (GBP) Accumulation Shares Sterling Overnight Interbank Average Rate 13.80 0.19 13.58
A (USD) Hedged Accumulation Shares Federal Funds Effective Overnight Rate 14.29 0.39 13.85
F (EUR) Hedged Accumulation Shares Euro Overnight Index Average Rate 14.27 (0.46) 14.80
F (GBP) Accumulation Shares Sterling Overnight Interbank Average Rate 14.24 0.19 14.03
F (USD) Hedged Accumulation Shares Federal Funds Effective Overnight Rate 15.46 0.39 15.01
I (EUR) Hedged Accumulation Shares Euro Overnight Index Average Rate 14.01 (0.46) 14.54
I (USD) Hedged Accumulation Shares Federal Funds Effective Overnight Rate 14.67 0.39 14.23
R (GBP) Accumulation Shares Sterling Overnight Interbank Average Rate 13.94 0.19 13.73
X (GBP) Accumulation Shares Sterling Overnight Interbank Average Rate 18.75 0.19 18.53
Please note that the returns of different share classes and benchmarks may vary, depending on a number of factors, including the currency denomination of the share class and/or benchmark and fees charged. Hedged share classes do not show a benchmark. The fund does not track a benchmark, all returns are net of fees and the returns of the income share classes are gross of distributions.

Jupiter Asset Management Series Plc Annual Report and Audited Financial Statements for the financial year ended 31 December 2020
Investment Managers’ Reports (continued) For the financial year ended 31 December 2020
Investment Manager – Jupiter Investment Management Limited
Jupiter Financials Contingent Capital Fund
50
2020 was a roller coaster ride for all credit markets and especially so for the contingent capital (CoCo) market given that it had never experienced a period of such elevated market volatility as we saw during the first quarter, as the Coronavirus pandemic emerged from China and wrought significant economic damage. Economies around the world buckled under the strain of wholesale lockdowns not experienced since the end of the WWII. One of the challenges that the market had faced in attracting investors prior to the crisis was that the liquidity and robustness of the CoCo market had never been tested, as the first CoCo issues were brought to the market in 2013, some 5 years after the end of the Global Financial Crisis. However, CoCos, while experiencing a significant widening in spreads in sympathy with other credits markets, passed the test and importantly stayed liquid throughout the crisis. 2020 started for the CoCo market in very much the same vein as 2019 had ended with the market seeing significant investor appetite after 2019 had seen the fund deliver a return of around 24%. The general optimism around risk markets and the economic outlook continued into the start of 2020. The search for yield continued apace and CoCos saw heavy investor appetite and new issues clearing easily in the market. The fund delivered a further strong performance by the 20th February and outperforming its benchmark. However, that was the high-water mark for the first quarter as Covid-19 shut significant parts of the economy down and caused a major repricing of all risk markets. The fund showed a peak to trough drawdown of nearly -30% from those highs. Despite the severity of the drawdown, it should be noted that the market stayed relatively liquid compared to other parts of the credit market during this period of volatility, particularly relative to high yield but also relative to large parts of the investment grade market. Investment banks were reporting significant two-way flow in the market over this period. We had always argued that this was a liquid asset class and it proved to be the case over a very stressed period. However, this liquidity also proved to be a negative for the market as we saw a negative selection bias for the market, in the form of investors selling CoCos as they were one of the few liquidity points in the credit markets. We believe this accentuated the drawdown for CoCos. Around this time, we saw regulators impose the suspension of equity dividend payments on banks and initially it was speculated that CoCo coupons (as they are also discretionary) would be subject to the same suspension. However, the regulators realise that the CoCo market would be unduly affected by this and it would not make a significant contribution to capital preservation for the banks as the suspension of dividends would. In effect regulators confirmed that the rule would not apply to CoCo coupons. The combination of strong support for credit markets and this policy around coupons saw the CoCo market make a strong recovery from the lows seen in March. By August, the fund was again showing a positive performance for the year and extended this performance for the year. The rally was relatively consistent across all names, and into 2021 that is what we think may change as the economic distress to various businesses and households becomes more apparent. That is where we believe our preference for well-capitalised national champion banks will benefit the fund as there starts to be a value differential placed on different banking names.

Jupiter Asset Management Series Plc Annual Report and Audited Financial Statements for the financial year ended 31 December 2020
Investment Managers’ Reports (continued) For the financial year ended 31 December 2020
Investment Manager – Jupiter Investment Management Limited
Jupiter Financials Contingent Capital Fund (continued)
51
Jupiter Financials Contingent Capital Fund absolute and relative returns of share classes and benchmarks from 1 January 2020 to 31 December 2020. Share Class Benchmark Share Class
returns (%) Benchmark returns (%)
Relative returns (%)
A (EUR) Hedged Accumulation Shares 4.53
A (EUR) Hedged Income Shares 4.53
A (USD) Accumulation Shares Financial Contingent Capital Benchmark 6.79 7.85 (0.99)
A (USD) Income Shares Financial Contingent Capital Benchmark 6.81 7.85 (0.96)
C (USD) Accumulation Shares Financial Contingent Capital Benchmark 5.18 7.85 (2.48)
F (EUR) Hedged Income Shares 5.70
F (GBP) Hedged Income Shares 5.34
F (USD) Income Shares Financial Contingent Capital Benchmark 7.98 7.85 0.12
I (CHF) Hedged Accumulation Shares 5.20
I (EUR) Hedged Accumulation Shares 5.23
I (EUR) Hedged Income Shares 5.34
I (USD) Accumulation Shares Financial Contingent Capital Benchmark 7.59 7.85 (0.24)
I (USD) Income Shares Financial Contingent Capital Benchmark 7.59 7.85 (0.24)
R (GBP) Hedged Accumulation Shares 4.75
Please note that the returns of different share classes and benchmarks may vary, depending on a number of factors, including the currency denomination of the share class and/or benchmark and fees charged. Hedged share classes do not share a benchmark. The fund does not track a benchmark, all returns are net of fees and the returns of the income share classes are gross of distributions.

Jupiter Asset Management Series Plc Annual Report and Audited Financial Statements for the financial year ended 31 December 2020
Portfolio of Investments Jupiter China Equity Fund
52
Nominal Security Description Value USD % of Net
Assets
Common Stock
Communications - 27.79% (2019 - 21.56%)
81,680 Alibaba Group Holding Ltd 2,450,651 4.50%
8,499 Alibaba Group Holding Ltd (DR) 2,026,077 3.72%
12,554 Baidu Inc (DR) 2,757,235 5.06%
32,950 JD.com Inc 1,453,575 2.67%
49,800 Meituan 1,892,423 3.47%
62,700 Tencent Holdings Ltd 4,561,448 8.37%
15,141,409 27.79%
Consumer, Cyclical - 13.25% (2019 - 13.32%)
39,627 China Tourism Group Duty Free Corp Ltd 1,711,468 3.14%
732,600 Chow Tai Fook Jewellery Group Ltd 921,356 1.69%
170,900 Gree Electric Appliances Inc of Zhuhai 1,618,636 2.97%
1,130,000 Guangzhou Automobile Group Co Ltd 1,256,440 2.31%
31,000 Huazhu Group Ltd 1,383,547 2.54%
31,400 Pop Mart International Group Ltd 329,491 0.60%
7,220,938 13.25%
Consumer, Non-cyclical - 12.68% (2019 - 8.99%)
136,000 Akeso Inc 666,620 1.22%
561,000 Cathay Media And Education Group Inc 594,827 1.10%
115,738 Jiangsu Hengrui Medicine Co Ltd 1,972,563 3.62%
34,451 Jiangsu Yanghe Brewery Joint-Stock Co Ltd 1,243,172 2.28%
22,000 Wuliangye Yibin Co Ltd 981,789 1.80%
109,500 Wuxi Biologics Cayman Inc 1,451,989 2.66%
6,910,960 12.68%
Financial - 26.91% (2019 - 41.16%)
337,800 AIA Group Ltd 4,139,418 7.60%
3,460,000 China Construction Bank Corp 2,628,739 4.82%
1,116,800 Guangzhou R&F Properties Co Ltd 1,436,239 2.64%
45,000 Hong Kong Exchanges & Clearing Ltd 2,466,934 4.53%
3,160,000 Industrial & Commercial Bank of China Ltd 2,050,270 3.76%
158,500 Ping An Insurance Group Co of China Ltd 1,942,267 3.56%
14,663,867 26.91%
Industrial - 9.13% (2019 - 8.24%)
224,500 Anhui Conch Cement Co Ltd 1,405,923 2.58%
119,190 Luxshare Precision Industry Co Ltd 1,022,806 1.88%
328,630 NARI Technology Co Ltd 1,335,164 2.45%
1,010,200 Zoomlion Heavy Industry Science and Technology Co Ltd 1,211,843 2.22%
4,975,736 9.13%
Technology - 3.11% (2019 - 0.00%)
71,000 Glodon Co Ltd 854,849 1.57%
295,000 Semiconductor Manufacturing International Corp 840,950 1.54%
1,695,799 3.11%

Jupiter Asset Management Series Plc Annual Report and Audited Financial Statements for the financial year ended 31 December 2020
Portfolio of Investments (continued) Jupiter China Equity Fund (continued)
53
Nominal Security Description Value USD % of Net
Assets
Common Stock (continued)
Utilities - 5.16% (2019 - 3.35%)
191,500 ENN Energy Holdings Ltd 2,811,040 5.16%
2,811,040 5.16%
Total Common Stock 53,419,749 98.03%
Total Transferable Securities 53,419,749 98.03%
Financial Assets at Fair Value Through Profit or Loss (Cost USD 39,503,049) (2019: USD 51,043,514) 53,419,749 98.03%
Currency Exchange Contracts - (0.00%) (2019 - (0.00%))
Counterparty Actual
Settle Date Issue
Currency Currency
Bought Settle
Currency Currency
Sold Unrealised
Loss USD
Citibank 05/01/2021 USD 652,293 HKD 5,058,036 (163) (0.00%)
Unrealised Loss on Currency Exchange Contracts at 31 December 2020 (163) (0.00%)
Value USD
Total Financial Derivatives Instruments (163) (0.00%)
Financial Liabilities at Fair Value Through Profit or Loss (Cost USD Nil) (2019: USD Nil) (163) (0.00%)
Cash at Bank 2,120,175 3.89%
Other Net Liabilities (1,044,525) (1.92%)
Net Assets Value as at 31 December 2020 54,495,236 100.00%
Portfolio Analysis % of Total
Assets
Transferable securities admitted to official stock exchange listing 94.78%
Other current assets 5.22%
Total Assets 100.00%

Jupiter Asset Management Series Plc Annual Report and Audited Financial Statements for the financial year ended 31 December 2020
Portfolio of Investments (continued) Jupiter Merian World Equity Fund
54
Nominal Security Description Value USD % of Net
Assets
Common Stock
Basic Materials - 2.40% (2019 - 3.19%)
180,731 Alumina Ltd 256,707 0.12%
5,531 Arconic Corp 163,441 0.08%
11,423 BHP Group Ltd 375,165 0.17%
11,019 BHP Group PLC 291,721 0.13%
8,173 Iluka Resources Ltd 41,058 0.02%
8,585 International Paper Co 426,159 0.20%
44,900 Mitsubishi Gas Chemical Co Inc 1,032,048 0.48%
349,653 Mount Gibson Iron Ltd 248,997 0.11%
395 NewMarket Corp 157,727 0.07%
1,100 Nissan Chemical Corp 68,947 0.03%
15,900 Nitto Denko Corp 1,423,926 0.66%
122,526 Perseus Mining Ltd 123,294 0.06%
7,168 Pretium Resources Inc 83,091 0.04%
1,768 Rio Tinto Ltd 155,779 0.07%
32,522 South32 Ltd 62,179 0.03%
11,405 Torex Gold Resources Inc 174,304 0.08%
3,186 voestalpine AG 115,414 0.05%
5,199,957 2.40%
Communications - 14.55% (2019 - 9.89%)
2,076 Alphabet Inc - Class A 3,604,455 1.66%
1,220 Alphabet Inc - Class C 2,122,214 0.98%
1,833 Amazon.com Inc 6,022,963 2.78%
9,823 Ascom Holding AG 146,191 0.07%
2,100 ASKUL Corp 78,446 0.04%
11,866 ChannelAdvisor Corp 193,416 0.09%
2,284 Charter Communications Inc 1,492,571 0.69%
2,898 Cisco Systems Inc 128,903 0.06%
580 Cogeco Communications Inc 44,909 0.02%
9,871 Comcast Corp 505,494 0.23%
20,763 eBay Inc 1,049,570 0.49%
13,993 Facebook Inc 3,804,277 1.75%
2,610 GoDaddy Inc 217,465 0.10%
163,472 ITV PLC 238,891 0.11%
1,788 Maxar Technologies Inc 62,759 0.03%
113,261 Mediaset Espana Comunicacion SA 595,523 0.27%
2,164 Netflix Inc 1,135,213 0.52%
12,219 New York Times Co 630,378 0.29%
18,636 News Corp 336,007 0.15%
21,903 NortonLifeLock Inc 454,487 0.21%

Jupiter Asset Management Series Plc Annual Report and Audited Financial Statements for the financial year ended 31 December 2020
Portfolio of Investments (continued) Jupiter Merian World Equity Fund (continued)
55
Nominal Security Description Value USD % of Net
Assets
Common Stock (continued)
Communications - 14.55% (2019 - 9.89%) (continued)
79,712 Pearson PLC 738,038 0.34%
11,396 Publicis Groupe SA 574,721 0.27%
49,379 Rightmove PLC 438,590 0.20%
5,136 Snap Inc 253,462 0.12%
88 Stamps.com Inc 18,350 0.01%
21,096 Telefonaktiebolaget LM Ericsson 253,363 0.12%
12,825 Telenet Group Holding NV 550,612 0.25%
2,085 Thomson Reuters Corp 171,280 0.08%
4,574 VeriSign Inc 981,123 0.45%
34,597 Verizon Communications Inc 2,011,470 0.93%
38,038 Vivendi SA 1,234,376 0.57%
336,846 Vodafone Group PLC 558,937 0.26%
1,056 Walt Disney Co 191,316 0.09%
8,983 Yelp Inc 284,222 0.13%
3,236 Zillow Group Inc 422,136 0.19%
31,546,128 14.55%
Consumer, Cyclical - 7.62% (2019 - 9.23%)
113,196 888 Holdings PLC 444,931 0.21%
13,300 Bayerische Motoren Werke AG 1,186,166 0.55%
4,041 Bed Bath & Beyond Inc 75,365 0.03%
5,500 Bridgestone Corp 180,585 0.08%
56 CarMax Inc 5,299 0.00%
8,097 Continental AG 1,222,107 0.56%
19,681 Daimler AG 1,406,453 0.65%
3,100 Daiwa House Industry Co Ltd 92,159 0.04%
133,949 Ford Motor Co 1,186,788 0.55%
490,200 Genting Singapore Ltd 315,325 0.15%
1,164 Home Depot Inc 308,763 0.14%
8,251 Industria de Diseno Textil SA 265,071 0.12%
11,600 ITOCHU Corp 333,599 0.15%
3,700 Jardine Cycle & Carriage Ltd 54,741 0.03%
38,530 Kindred Group PLC (DR) 380,526 0.18%
67,717 Kingfisher PLC 250,921 0.12%
2,600 Komeri Co Ltd 73,561 0.03%
14,600 K's Holdings Corp 203,421 0.09%
1,371 Linamar Corp 73,691 0.03%
11,133 Lions Gate Entertainment Corp 124,467 0.06%
77 Lowe's Cos Inc 12,363 0.01%
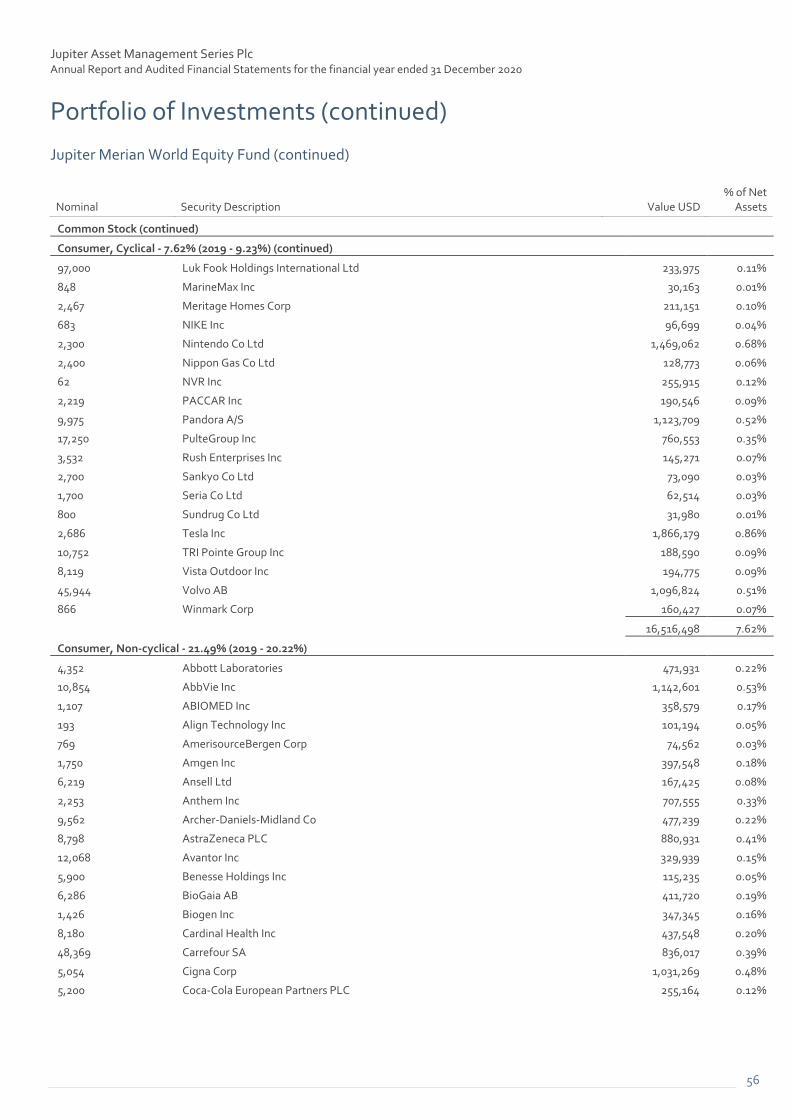
Jupiter Asset Management Series Plc Annual Report and Audited Financial Statements for the financial year ended 31 December 2020
Portfolio of Investments (continued) Jupiter Merian World Equity Fund (continued)
56
Nominal Security Description Value USD % of Net
Assets
Common Stock (continued)
Consumer, Cyclical - 7.62% (2019 - 9.23%) (continued)
97,000 Luk Fook Holdings International Ltd 233,975 0.11%
848 MarineMax Inc 30,163 0.01%
2,467 Meritage Homes Corp 211,151 0.10%
683 NIKE Inc 96,699 0.04%
2,300 Nintendo Co Ltd 1,469,062 0.68%
2,400 Nippon Gas Co Ltd 128,773 0.06%
62 NVR Inc 255,915 0.12%
2,219 PACCAR Inc 190,546 0.09%
9,975 Pandora A/S 1,123,709 0.52%
17,250 PulteGroup Inc 760,553 0.35%
3,532 Rush Enterprises Inc 145,271 0.07%
2,700 Sankyo Co Ltd 73,090 0.03%
1,700 Seria Co Ltd 62,514 0.03%
800 Sundrug Co Ltd 31,980 0.01%
2,686 Tesla Inc 1,866,179 0.86%
10,752 TRI Pointe Group Inc 188,590 0.09%
8,119 Vista Outdoor Inc 194,775 0.09%
45,944 Volvo AB 1,096,824 0.51%
866 Winmark Corp 160,427 0.07%
16,516,498 7.62%
Consumer, Non-cyclical - 21.49% (2019 - 20.22%)
4,352 Abbott Laboratories 471,931 0.22%
10,854 AbbVie Inc 1,142,601 0.53%
1,107 ABIOMED Inc 358,579 0.17%
193 Align Technology Inc 101,194 0.05%
769 AmerisourceBergen Corp 74,562 0.03%
1,750 Amgen Inc 397,548 0.18%
6,219 Ansell Ltd 167,425 0.08%
2,253 Anthem Inc 707,555 0.33%
9,562 Archer-Daniels-Midland Co 477,239 0.22%
8,798 AstraZeneca PLC 880,931 0.41%
12,068 Avantor Inc 329,939 0.15%
5,900 Benesse Holdings Inc 115,235 0.05%
6,286 BioGaia AB 411,720 0.19%
1,426 Biogen Inc 347,345 0.16%
8,180 Cardinal Health Inc 437,548 0.20%
48,369 Carrefour SA 836,017 0.39%
5,054 Cigna Corp 1,031,269 0.48%
5,200 Coca-Cola European Partners PLC 255,164 0.12%

Jupiter Asset Management Series Plc Annual Report and Audited Financial Statements for the financial year ended 31 December 2020
Portfolio of Investments (continued) Jupiter Merian World Equity Fund (continued)
57
Nominal Security Description Value USD % of Net
Assets
Common Stock (continued)
Consumer, Non-cyclical - 21.49% (2019 - 20.22%) (continued)
135 Corcept Therapeutics Inc 3,533 0.00%
11,038 DaVita Inc 1,274,889 0.58%
27,900 Duskin Co Ltd 777,729 0.36%
18,139 Edwards Lifesciences Corp 1,625,980 0.74%
3,228 Eli Lilly and Co 539,108 0.25%
2,046 FibroGen Inc 77,687 0.04%
182,000 First Pacific Co Ltd 57,986 0.03%
23,097 Fisher & Paykel Healthcare Corp Ltd 551,218 0.25%
2,425 FTI Consulting Inc 268,375 0.12%
414 Genmab A/S 168,140 0.08%
10,382 Getinge AB 244,800 0.11%
2,565 Gilead Sciences Inc 145,307 0.07%
2,531 Globus Medical Inc 164,313 0.08%
2,495 Hain Celestial Group Inc 99,501 0.05%
5,189 Hologic Inc 372,311 0.17%
1,735 Humana Inc 704,601 0.33%
323,100 Hutchison Port Holdings Trust 63,974 0.03%
1,161 IDEXX Laboratories Inc 576,971 0.27%
6,846 Incyte Corp 594,644 0.27%
4,449 Ingredion Inc 350,403 0.16%
4,756 IQVIA Holdings Inc 844,285 0.39%
500 IR Japan Holdings Ltd 79,950 0.04%
22,288 Ironwood Pharmaceuticals Inc 256,535 0.12%
2,604 Jamieson Wellness Inc 76,241 0.04%
4,730 Johnson & Johnson 738,117 0.34%
12,472 Kforce Inc 530,559 0.24%
5,424 Korn Ferry 235,727 0.11%
35,683 Kraft Heinz Co 1,237,130 0.57%
1,595 ManpowerGroup Inc 144,108 0.07%
6,791 McKesson Corp 1,177,695 0.54%
1,581 Medpace Holdings Inc 217,957 0.10%
14,499 Merck & Co Inc 1,168,474 0.54%
2,519 Molson Coors Beverage Co 113,960 0.05%
3,810 Mondelez International Inc 220,980 0.10%
13,834 Monster Beverage Corp 1,265,258 0.58%
2,110 National Beverage Corp 180,996 0.08%
4,480 Natus Medical Inc 89,824 0.04%
5,245 Nestle SA 620,957 0.29%
1,500 Novo Nordisk A/S 106,066 0.05%

Jupiter Asset Management Series Plc Annual Report and Audited Financial Statements for the financial year ended 31 December 2020
Portfolio of Investments (continued) Jupiter Merian World Equity Fund (continued)
58
Nominal Security Description Value USD % of Net
Assets
Common Stock (continued)
Consumer, Non-cyclical - 21.49% (2019 - 20.22%) (continued)
2,200 Olympus Corp 48,167 0.02%
36,600 Ono Pharmaceutical Co Ltd 1,103,699 0.51%
9,354 Owens & Minor Inc 259,667 0.12%
1,152 Patterson Cos Inc 34,802 0.02%
2,259 PayPal Holdings Inc 522,981 0.24%
685 Pharma Mar SA 59,902 0.03%
6,347 Philip Morris International Inc 517,154 0.24%
13,408 Procter & Gamble Co 1,847,220 0.85%
10,203 Puma Biotechnology Inc 106,009 0.05%
31,356 QinetiQ Group PLC 138,740 0.06%
16,129 Quanex Building Products Corp 361,451 0.17%
18,623 Radius Health Inc 343,594 0.16%
11,002 Randstad NV 722,697 0.33%
627 Regeneron Pharmaceuticals Inc 299,894 0.14%
38,006 Resources Connection Inc 474,315 0.22%
6,687 Reynolds Consumer Products Inc 200,744 0.09%
4,675 Robert Half International Inc 290,318 0.13%
6,023 Roche Holding AG 2,113,076 0.97%
14,842 Sanofi 1,440,821 0.66%
492 Sartorius Stedim Biotech 177,353 0.08%
825 Seagen Inc 151,553 0.07%
14,054 Societe BIC SA 804,329 0.37%
6,898 Spectrum Brands Holdings Inc 532,595 0.25%
1,306 Square Inc 288,678 0.13%
112,520 Summerset Group Holdings Ltd 1,022,167 0.47%
17,043 Surmodics Inc 733,872 0.34%
14,654 Swedish Match AB 1,148,897 0.53%
14,900 Taiko Pharmaceutical Co Ltd 233,045 0.11%
691 Teladoc Health Inc 140,667 0.06%
3,902 Thermo Fisher Scientific Inc 1,801,670 0.83%
2,253 Triton International Ltd/Bermuda 108,865 0.05%
3,729 UnitedHealth Group Inc 1,286,468 0.59%
3,189 Vanda Pharmaceuticals Inc 42,382 0.02%
1,821 Vertex Pharmaceuticals Inc 423,710 0.20%
1,639 Viscofan SA 117,529 0.05%
675 West Pharmaceutical Services Inc 188,960 0.09%
46,598,082 21.49%
Energy - 0.74% (2019 - 2.48%)
11,914 Cabot Oil & Gas Corp 196,224 0.09%

Jupiter Asset Management Series Plc Annual Report and Audited Financial Statements for the financial year ended 31 December 2020
Portfolio of Investments (continued) Jupiter Merian World Equity Fund (continued)
59
Nominal Security Description Value USD % of Net
Assets
Common Stock (continued)
Energy - 0.74% (2019 - 2.48%) (continued)
17,298 EQT Corp 224,528 0.10%
23,107 John Wood Group PLC 98,252 0.05%
758 REX American Resources Corp 56,751 0.03%
57,754 Royal Dutch Shell PLC 1,020,809 0.47%
1,596,564 0.74%
Financial - 15.44% (2019 - 21.25%)
1,900 77 Bank Ltd 25,883 0.01%
12,481 Affiliated Managers Group Inc 1,259,832 0.58%
54 Afterpay Ltd 4,932 0.00%
7,608 Alexander & Baldwin Inc 129,564 0.06%
1,955 American Financial Group Inc/OH 170,808 0.08%
18,176 American Homes 4 Rent 543,826 0.25%
1,893 American National Group Inc 181,349 0.08%
72,519 Artis Real Estate Investment Trust 602,569 0.28%
12,196 Artisan Partners Asset Management Inc 606,629 0.28%
20,674 Associated Banc-Corp 353,525 0.16%
54,999 Australia & New Zealand Banking Group Ltd 966,384 0.45%
259,960 Aviva PLC 1,159,820 0.53%
253,183 Banco Bilbao Vizcaya Argentaria SA 1,261,777 0.58%
27,867 Bank of New York Mellon Corp 1,161,775 0.54%
1,362 Bank of Nova Scotia 73,571 0.03%
847 BlackRock Inc 600,472 0.28%
4,291 Boardwalk Real Estate Investment Trust 113,703 0.05%
41,501 Cadence BanCorp 684,351 0.32%
3,739 Citigroup Inc 227,556 0.10%
16,354 CMC Markets PLC 86,267 0.04%
7,628 Comerica Inc 425,185 0.20%
10,389 Corporate Office Properties Trust 266,790 0.12%
600 Daito Trust Construction Co Ltd 56,120 0.03%
1,815 Douglas Emmett Inc 52,399 0.02%
110,404 GAM Holding AG 271,342 0.13%
4,765 GEO Group Inc 42,885 0.02%
13,700 Goldcrest Co Ltd 213,612 0.10%
5,406 Goldman Sachs Group Inc 1,402,587 0.64%
10,500 Hong Kong Exchanges & Clearing Ltd 575,618 0.27%
20,222 HSBC Holdings PLC 104,773 0.05%
16,442 Janus Henderson Group PLC 534,529 0.25%
26,117 Jefferies Financial Group Inc 629,681 0.29%
4,020 JPMorgan Chase & Co 503,947 0.23%

Jupiter Asset Management Series Plc Annual Report and Audited Financial Statements for the financial year ended 31 December 2020
Portfolio of Investments (continued) Jupiter Merian World Equity Fund (continued)
60
Nominal Security Description Value USD % of Net
Assets
Common Stock (continued)
Financial - 15.44% (2019 - 21.25%) (continued)
65,700 Keiyo Bank Ltd 265,821 0.12%
6,970 KKR Real Estate Finance Trust Inc 124,484 0.06%
83,048 Man Group PLC/Jersey 156,528 0.07%
20,375 Manulife Financial Corp 360,359 0.17%
4,139 Mastercard Inc 1,471,621 0.68%
2,759 Mercury General Corp 142,585 0.07%
8,907 Morgan Stanley 604,251 0.28%
4,000 MS&AD Insurance Group Holdings Inc 121,904 0.06%
1,763 National Western Life Group Inc 361,415 0.17%
21,419 NN Group NV 938,898 0.43%
139,141 Nordea Bank Abp 1,144,887 0.53%
162,400 Oversea-Chinese Banking Corp Ltd 1,236,373 0.57%
17,320 Piedmont Office Realty Trust Inc 279,718 0.13%
18,368 Plus500 Ltd 363,495 0.17%
68,246 Ratos AB 322,506 0.15%
9,351 Regions Financial Corp 148,961 0.07%
1,041 RenaissanceRe Holdings Ltd 171,005 0.08%
36,094 SITE Centers Corp 365,271 0.17%
15,170 State Street Corp 1,098,611 0.50%
36,341 Suncorp Group Ltd 273,984 0.13%
20,300 Suruga Bank Ltd 66,573 0.03%
111,245 Svenska Handelsbanken AB 1,129,583 0.52%
40,965 Sydbank AS 908,906 0.42%
3,094 Synovus Financial Corp 100,215 0.05%
102,800 T&D Holdings Inc 1,213,870 0.56%
66,200 United Overseas Bank Ltd 1,131,722 0.52%
6,744 Visa Inc 1,472,620 0.67%
48,824 Wells Fargo & Co 1,452,514 0.66%
2,108 Western Alliance Bancorp 126,543 0.06%
18,924 Weyerhaeuser Co 636,793 0.29%
33,486,077 15.44%
Industrial - 10.29% (2019 - 9.07%)
3,345 A O Smith Corp 183,005 0.08%
4,464 Acuity Brands Inc 538,046 0.25%
6,972 AGCO Corp 712,399 0.33%
5,668 Agilent Technologies Inc 665,367 0.31%
40,200 Amada Co Ltd 441,921 0.20%
6,218 Astec Industries Inc 359,960 0.17%
3,278 Avnet Inc 114,206 0.05%

Jupiter Asset Management Series Plc Annual Report and Audited Financial Statements for the financial year ended 31 December 2020
Portfolio of Investments (continued) Jupiter Merian World Equity Fund (continued)
61
Nominal Security Description Value USD % of Net
Assets
Common Stock (continued)
Industrial - 10.29% (2019 - 9.07%) (continued)
23,332 bpost SA 242,551 0.11%
1,172 Bucher Industries AG 540,033 0.25%
7,068 Carrier Global Corp 266,676 0.12%
11,609 D/S Norden A/S 210,272 0.10%
41,100 DMG Mori Co Ltd 625,682 0.29%
14,332 Emerson Electric Co 1,143,980 0.53%
9,998 Expeditors International of Washington Inc 945,611 0.44%
1,997 FedEx Corp 519,180 0.24%
19,749 Finning International Inc 418,462 0.19%
18 Forbo Holding AG 30,998 0.01%
2,914 Franklin Electric Co Inc 201,299 0.09%
6,922 Gates Industrial Corp PLC 88,878 0.04%
18,380 GEA Group AG 668,188 0.31%
28,936 General Electric Co 309,905 0.14%
17,200 Glory Ltd 347,287 0.16%
18,909 GrafTech International Ltd 196,465 0.09%
13,596 Howmet Aerospace Inc 385,583 0.18%
5,600 Hoya Corp 775,355 0.36%
5,791 Kuehne + Nagel International AG 1,320,380 0.61%
1,154 L3Harris Technologies Inc 216,548 0.10%
4,059 Lincoln Electric Holdings Inc 473,279 0.22%
1,585 Louisiana-Pacific Corp 59,501 0.03%
5,619 Masco Corp 307,753 0.14%
2,159 Matthews International Corp 63,000 0.03%
50,785 MDU Resources Group Inc 1,315,332 0.61%
3,900 Meitec Corp 202,823 0.09%
9,700 Nikon Corp 61,269 0.03%
25,000 Nippon Yusen KK 582,642 0.27%
5,139 Packaging Corp of America 706,458 0.33%
9,058 Pentair PLC 477,175 0.22%
973 PerkinElmer Inc 136,784 0.06%
843 Regal Beloit Corp 102,458 0.05%
2,874 Rockwell Automation Inc 715,913 0.33%
84,390 Royal Mail PLC 387,681 0.18%
7,540 Signify NV 320,983 0.15%
82,000 SITC International Holdings Co Ltd 177,062 0.08%
16,853 Stantec Inc 546,766 0.25%
47,500 Techtronic Industries Co Ltd 677,649 0.31%

Jupiter Asset Management Series Plc Annual Report and Audited Financial Statements for the financial year ended 31 December 2020
Portfolio of Investments (continued) Jupiter Merian World Equity Fund (continued)
62
Nominal Security Description Value USD % of Net
Assets
Common Stock (continued)
Industrial - 10.29% (2019 - 9.07%) (continued)
13,581 Terex Corp 474,113 0.22%
5,053 Uponor OYJ 112,997 0.05%
12,081 Valmet OYJ 347,856 0.16%
4,500 Venture Corp Ltd 66,134 0.03%
1,689 Waters Corp 414,751 0.19%
29,100 Yamato Holdings Co Ltd 742,852 0.34%
5,487 Zehnder Group AG 367,814 0.17%
22,309,282 10.29%
Technology - 23.71% (2019 - 17.81%)
14,460 Activision Blizzard Inc 1,324,247 0.60%
1,668 Adobe Inc 829,747 0.38%
9,823 Advanced Micro Devices Inc 906,565 0.42%
327 Akamai Technologies Inc 34,221 0.02%
2,368 Amkor Technology Inc 35,875 0.02%
71,807 Apple Inc 9,602,032 4.43%
11,678 Applied Materials Inc 1,015,752 0.47%
4,037 ASM International NV 896,697 0.41%
216 ASML Holding NV 106,308 0.05%
2,471 Atos SE 228,884 0.11%
4,506 Autodesk Inc 1,349,141 0.62%
1,623 Broadcom Inc 705,729 0.33%
9,501 Cadence Design Systems Inc 1,285,010 0.59%
8,600 Capcom Co Ltd 559,064 0.26%
1,048 Capgemini SE 163,323 0.08%
15,499 Cerner Corp 1,208,612 0.56%
4,808 Cirrus Logic Inc 394,016 0.18%
6,799 Citrix Systems Inc 872,244 0.40%
11,134 Cognizant Technology Solutions Corp 902,633 0.42%
6,798 Computacenter PLC 226,381 0.10%
17,785 Dialog Semiconductor PLC 985,990 0.45%
9,430 Dropbox Inc 213,118 0.10%
2,753 Electronic Arts Inc 391,064 0.18%
1,555 Elmos Semiconductor SE 52,055 0.02%
2,018 FormFactor Inc 86,532 0.04%
1,448 Fortinet Inc 214,333 0.10%
1,500 Fujitsu Ltd 216,926 0.10%
25,800 Fukui Computer Holdings Inc 1,003,813 0.46%
40,391 Intel Corp 1,969,061 0.91%
1,499 International Business Machines Corp 186,386 0.09%

Jupiter Asset Management Series Plc Annual Report and Audited Financial Statements for the financial year ended 31 December 2020
Portfolio of Investments (continued) Jupiter Merian World Equity Fund (continued)
63
Nominal Security Description Value USD % of Net
Assets
Common Stock (continued)
Technology - 23.71% (2019 - 17.81%) (continued)
1,118 Lam Research Corp 541,615 0.25%
1,024 Logitech International SA 99,866 0.05%
3,377 Manhattan Associates Inc 354,889 0.16%
2,535 Melexis NV 250,851 0.12%
35,173 Microsoft Corp 7,797,151 3.60%
654 Nemetschek SE 49,285 0.02%
4,700 Nomura Research Institute Ltd 168,500 0.08%
3,741 NVIDIA Corp 1,967,130 0.91%
18,366 Open Text Corp 836,589 0.39%
26,636 Oracle Corp 1,715,358 0.79%
1,394 Paradox Interactive AB 43,758 0.02%
5,819 Progress Software Corp 259,527 0.12%
2,966 Qorvo Inc 496,419 0.23%
11,588 QUALCOMM Inc 1,737,621 0.79%
18,982 Rovio Entertainment OYJ 147,939 0.07%
1,905 salesforce.com Inc 423,672 0.20%
1,247 ServiceNow Inc 682,583 0.31%
7,220 Skyworks Solutions Inc 1,102,855 0.51%
4,881 SolarWinds Corp 73,069 0.03%
29,691 STMicroelectronics NV 1,114,920 0.51%
1,172 Sykes Enterprises Inc 44,079 0.02%
10,232 TeamViewer AG 551,558 0.25%
8,459 Teradyne Inc 1,017,533 0.47%
6,501 Texas Instruments Inc 1,057,713 0.49%
700 Tokyo Electron Ltd 260,806 0.12%
130,000 VSTECS Holdings Ltd 106,649 0.05%
319 Xero Ltd 36,253 0.02%
915 Zebra Technologies Corp 351,131 0.16%
414 Zoom Video Communications Inc 146,308 0.07%
51,401,386 23.71%
Utilities - 3.41% (2019 - 5.38%)
621,712 A2A SpA 996,363 0.46%
42,887 AltaGas Ltd 631,197 0.29%
14,695 Avangrid Inc 668,476 0.31%
4,888 Boralex Inc 182,998 0.08%
286,474 Centrica PLC 181,278 0.08%
30,434 Hydro One Ltd 687,651 0.32%
5,385 National Fuel Gas Co 220,516 0.10%
24,687 National Grid PLC 292,016 0.13%

Jupiter Asset Management Series Plc Annual Report and Audited Financial Statements for the financial year ended 31 December 2020
Portfolio of Investments (continued) Jupiter Merian World Equity Fund (continued)
64
Nominal Security Description Value USD % of Net
Assets
Common Stock (continued)
Utilities - 3.41% (2019 - 5.38%) (continued)
11,889 NiSource Inc 268,097 0.12%
4,915 NorthWestern Corp 281,630 0.13%
3,211 ONE Gas Inc 243,715 0.11%
15,233 Portland General Electric Co 640,700 0.30%
7,469 Public Service Enterprise Group Inc 428,422 0.20%
68,200 Shizuoka Gas Co Ltd 684,216 0.32%
4,354 TransAlta Corp 33,100 0.02%
3,078 UGI Corp 106,006 0.05%
43,123 Vistra Corp 840,467 0.39%
7,386,848 3.41%
Total Common Stock 216,040,822 99.65%
Preferred Stock
Consumer, Non-cyclical - 0.06% (2019 - 0.01%)
1,710 Draegerwerk AG & Co KGaA 132,222 0.06%
132,222 0.06%
Total Transferable Securities 216,173,044 99.71%
Currency Exchange Contracts - 0.01% (2019 - 0.01%)
Counterparty Actual Settle Date
Issue Currency
Currency Bought
Settle Currency
Currency Sold
Unrealised Gain USD
Citibank 15/01/2021 EUR 801,678 USD 972,994 11,321 0.01%
Citibank 15/01/2021 USD 17 EUR 14 - 0.00%
Unrealised Gain on Currency Exchange Contracts at 31 December 2020 11,321 0.01%
Value USD
Total Financial Derivatives Instruments 11,321 0.01%
Financial Assets at Fair Value Through Profit or Loss (Cost USD 171,037,269) (2019: USD 287,993,546) 216,184,365 99.72%
Futures - (0.00%) (2019 - (0.00%))
Nominal Security Description No of
Contracts Maturity
Date Unrealised
Loss USD
Bank of America Merrill Lynch 177,000 DJ Euro Stoxx 50 Future 5 19/03/2021 (908) (0.00%) Bank of America Merrill Lynch 372,638 S&P 500 Emini Index Future 2 19/03/2021 (638) (0.00%)
(1,546) (0.00%)

Jupiter Asset Management Series Plc Annual Report and Audited Financial Statements for the financial year ended 31 December 2020
Portfolio of Investments (continued) Jupiter Merian World Equity Fund (continued)
65
Currency Exchange Contracts - (0.00%) (2019 - (0.00%))
Counterparty Actual Settle Date
Issue Currency
Currency Bought
Settle Currency
Currency Sold
Unrealised Loss USD
% of Net Assets
Citibank 15/01/2021 EUR 8,474 USD 10,413 (8) (0.00%)
Unrealised Loss on Currency Exchange Contracts at 31 December 2020 (8) (0.00%)
Value USD
Total Financial Derivatives Instruments (1,554) (0.00%)
Financial Liabilities at Fair Value Through Profit or Loss (Cost USD Nil) (2019: USD Nil) (1,554) (0.00%)
Cash at Bank 542,178 0.25%
Other Net Assets 69,470 0.03%
Net Assets Value as at 31 December 2020 216,794,459 100.00%
Portfolio Analysis % of Total
Assets
Transferable securities admitted to official stock exchange listing 99.36%
OTC financial derivative instruments 0.01%
Other current assets 0.63%
Total Assets 100.00%

Jupiter Asset Management Series Plc Annual Report and Audited Financial Statements for the financial year ended 31 December 2020
Portfolio of Investments (continued) Jupiter Pacific Equity Fund
66
Nominal Security Description Value USD % of Net
Assets
Common Stock
Basic Materials - 7.08% (2019 - 5.61%)
373,084 Alumina Ltd 529,922 0.76%
50,099 BHP Group Ltd 1,645,399 2.37%
73,100 Chifeng Jilong Gold Mining Co Ltd 200,193 0.29%
10,264 Dongkuk Steel Mill Co Ltd 76,723 0.11%
1,181 Fortescue Metals Group Ltd 21,419 0.03%
11,174 Hyundai Steel Co 407,339 0.59%
40,939 Iluka Resources Ltd 205,661 0.30%
20,152 Jindal Steel & Power Ltd 73,521 0.11%
78,012 Kingfa Sci & Tech Co Ltd 204,460 0.29%
762,108 Mount Gibson Iron Ltd 542,717 0.78%
95,000 Nine Dragons Paper Holdings Ltd 134,795 0.19%
113,206 Perseus Mining Ltd 113,915 0.16%
1,673 Rio Tinto Ltd 147,408 0.21%
40,710 Sandfire Resources Ltd 168,587 0.24%
104,648 South32 Ltd 200,077 0.29%
14,878 Tata Steel Ltd 130,775 0.19%
12,385 Vedanta Ltd 27,256 0.04%
80,000 Zijin Mining Group Co Ltd 90,603 0.13%
4,920,770 7.08%
Communications - 19.21% (2019 - 12.16%)
19,300 Alibaba Group Holding Ltd (DR) 4,600,927 6.62%
900 Baidu Inc (DR) 197,667 0.28%
18,900 JD.com Inc (DR) 1,691,928 2.43%
37,100 Meituan 1,409,817 2.03%
487 NAVER Corp 131,131 0.19%
1,300 Pinduoduo Inc (DR) 232,843 0.34%
14,610 PLDT Inc 407,660 0.59%
10,500 Sohu.com Ltd (DR) 169,155 0.25%
398,200 Telekom Malaysia Bhd 535,554 0.77%
54,400 Tencent Holdings Ltd 3,957,620 5.69%
8,400 Tongcheng-Elong Holdings Ltd 16,253 0.02%
13,350,555 19.21%
Consumer, Cyclical - 8.61% (2019 - 5.60%)
20,951 Ashok Leyland Ltd 27,433 0.04%
5,818 Breville Group Ltd 115,153 0.17%
23,500 BYD Co Ltd 615,953 0.89%
271,000 China Dongxiang Group Co Ltd 28,315 0.04%
2,788 China Tourism Group Duty Free Corp Ltd 120,412 0.17%
117,000 Chow Sang Sang Holdings International Ltd 132,808 0.19%
6,362 Coway Co Ltd 425,775 0.61%
2,885 Domino's Pizza Enterprises Ltd 193,568 0.28%
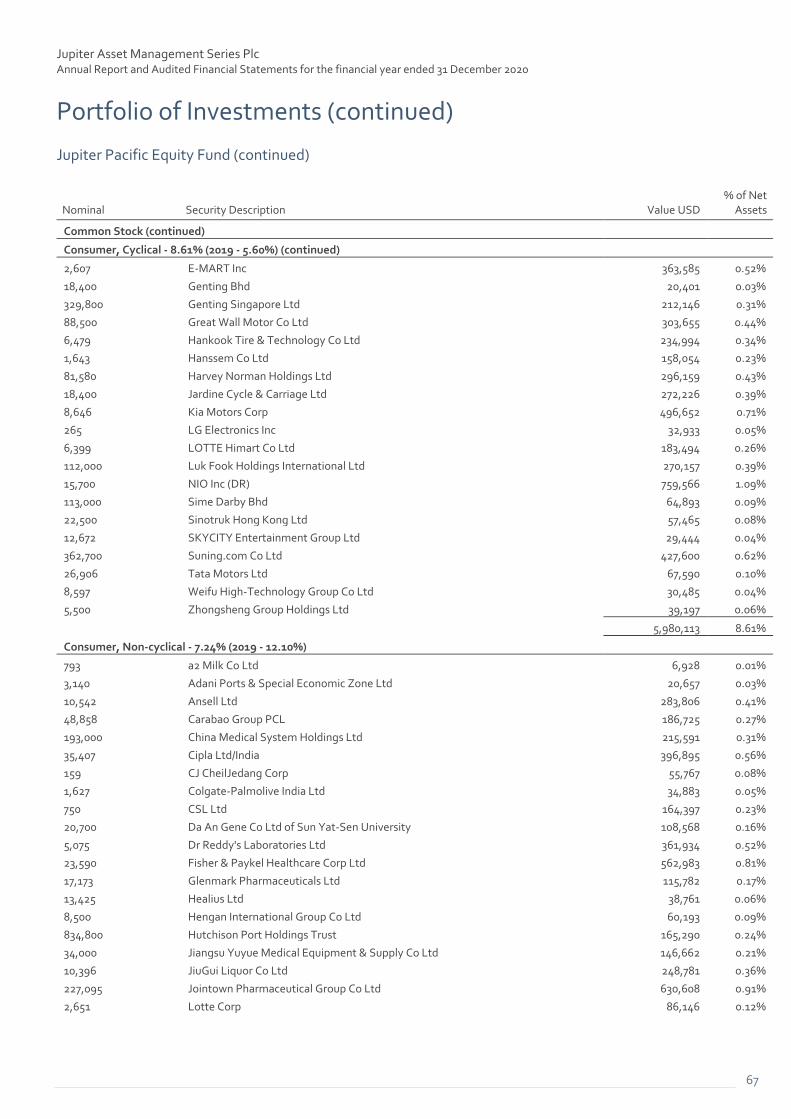
Jupiter Asset Management Series Plc Annual Report and Audited Financial Statements for the financial year ended 31 December 2020
Portfolio of Investments (continued) Jupiter Pacific Equity Fund (continued)
67
Nominal Security Description Value USD % of Net
Assets
Common Stock (continued)
Consumer, Cyclical - 8.61% (2019 - 5.60%) (continued)
2,607 E-MART Inc 363,585 0.52%
18,400 Genting Bhd 20,401 0.03%
329,800 Genting Singapore Ltd 212,146 0.31%
88,500 Great Wall Motor Co Ltd 303,655 0.44%
6,479 Hankook Tire & Technology Co Ltd 234,994 0.34%
1,643 Hanssem Co Ltd 158,054 0.23%
81,580 Harvey Norman Holdings Ltd 296,159 0.43%
18,400 Jardine Cycle & Carriage Ltd 272,226 0.39%
8,646 Kia Motors Corp 496,652 0.71%
265 LG Electronics Inc 32,933 0.05%
6,399 LOTTE Himart Co Ltd 183,494 0.26%
112,000 Luk Fook Holdings International Ltd 270,157 0.39%
15,700 NIO Inc (DR) 759,566 1.09%
113,000 Sime Darby Bhd 64,893 0.09%
22,500 Sinotruk Hong Kong Ltd 57,465 0.08%
12,672 SKYCITY Entertainment Group Ltd 29,444 0.04%
362,700 Suning.com Co Ltd 427,600 0.62%
26,906 Tata Motors Ltd 67,590 0.10%
8,597 Weifu High-Technology Group Co Ltd 30,485 0.04%
5,500 Zhongsheng Group Holdings Ltd 39,197 0.06%
5,980,113 8.61%
Consumer, Non-cyclical - 7.24% (2019 - 12.10%)
793 a2 Milk Co Ltd 6,928 0.01%
3,140 Adani Ports & Special Economic Zone Ltd 20,657 0.03%
10,542 Ansell Ltd 283,806 0.41%
48,858 Carabao Group PCL 186,725 0.27%
193,000 China Medical System Holdings Ltd 215,591 0.31%
35,407 Cipla Ltd/India 396,895 0.56%
159 CJ CheilJedang Corp 55,767 0.08%
1,627 Colgate-Palmolive India Ltd 34,883 0.05%
750 CSL Ltd 164,397 0.23%
20,700 Da An Gene Co Ltd of Sun Yat-Sen University 108,568 0.16%
5,075 Dr Reddy's Laboratories Ltd 361,934 0.52%
23,590 Fisher & Paykel Healthcare Corp Ltd 562,983 0.81%
17,173 Glenmark Pharmaceuticals Ltd 115,782 0.17%
13,425 Healius Ltd 38,761 0.06%
8,500 Hengan International Group Co Ltd 60,193 0.09%
834,800 Hutchison Port Holdings Trust 165,290 0.24%
34,000 Jiangsu Yuyue Medical Equipment & Supply Co Ltd 146,662 0.21%
10,396 JiuGui Liquor Co Ltd 248,781 0.36%
227,095 Jointown Pharmaceutical Group Co Ltd 630,608 0.91%
2,651 Lotte Corp 86,146 0.12%

Jupiter Asset Management Series Plc Annual Report and Audited Financial Statements for the financial year ended 31 December 2020
Portfolio of Investments (continued) Jupiter Pacific Equity Fund (continued)
68
Nominal Security Description Value USD % of Net
Assets
Common Stock (continued)
Consumer, Non-cyclical - 7.24% (2019 - 12.10%) (continued)
414 Orion Corp/Republic of Korea 47,258 0.07%
179 Seegene Inc 31,803 0.05%
21,730 Summerset Group Holdings Ltd 197,402 0.28%
1,401,100 Thai Union Group PCL 636,016 0.91%
216,500 Zhou Hei Ya International Holdings Co Ltd 230,113 0.33%
5,033,949 7.24%
Diversified - 0.04% (2019 - 0.25%)
151,300 YTL Corp Bhd 28,774 0.04%
28,774 0.04%
Energy - 1.01% (2019 - 3.79%)
9,367 Deterra Royalties Ltd 34,803 0.05%
34,000 LONGi Green Energy Technology Co Ltd 479,342 0.69%
41,800 Petronas Gas Bhd 178,527 0.25%
50,000 Shougang Fushan Resources Group Ltd 11,738 0.02%
704,410 1.01%
Financial - 25.45% (2019 - 31.37%)
1,299 Afterpay Ltd 118,648 0.17%
160,000 Agile Group Holdings Ltd 212,988 0.31%
48,600 AIA Group Ltd 595,547 0.86%
73,037 Australia & New Zealand Banking Group Ltd 1,283,328 1.85%
410,600 Bank Central Asia Tbk PT 989,178 1.42%
20,600 Bank of East Asia Ltd 44,003 0.06%
234,400 Bank of Jiangsu Co Ltd 195,698 0.28%
10,150 Bank of Queensland Ltd 60,810 0.09%
58,218 BNK Financial Group Inc 304,409 0.44%
329,000 China Everbright Bank Co Ltd 125,191 0.18%
177,000 China Galaxy Securities Co Ltd 110,960 0.16%
288,000 China Life Insurance Co Ltd 635,250 0.91%
17,300 China Merchants Bank Co Ltd 116,263 0.17%
2,890,000 China South City Holdings Ltd 428,698 0.62%
738,000 CITIC Ltd 522,618 0.75%
3,184 Commonwealth Bank of Australia 202,366 0.29%
34,000 Country Garden Services Holdings Co Ltd 230,028 0.33%
138,000 Dah Sing Banking Group Ltd 141,693 0.20%
235,200 Dah Sing Financial Holdings Ltd 662,895 0.95%
83,425 Genworth Mortgage Insurance Australia Ltd 154,335 0.22%
153,000 GF Securities Co Ltd 216,301 0.31%
32,320 Goodman Group 473,077 0.68%
9,110 Hana Financial Group Inc 289,327 0.42%
4,600 Hang Seng Bank Ltd 79,331 0.11%
44,912 Hanwha Life Insurance Co Ltd 100,880 0.15%
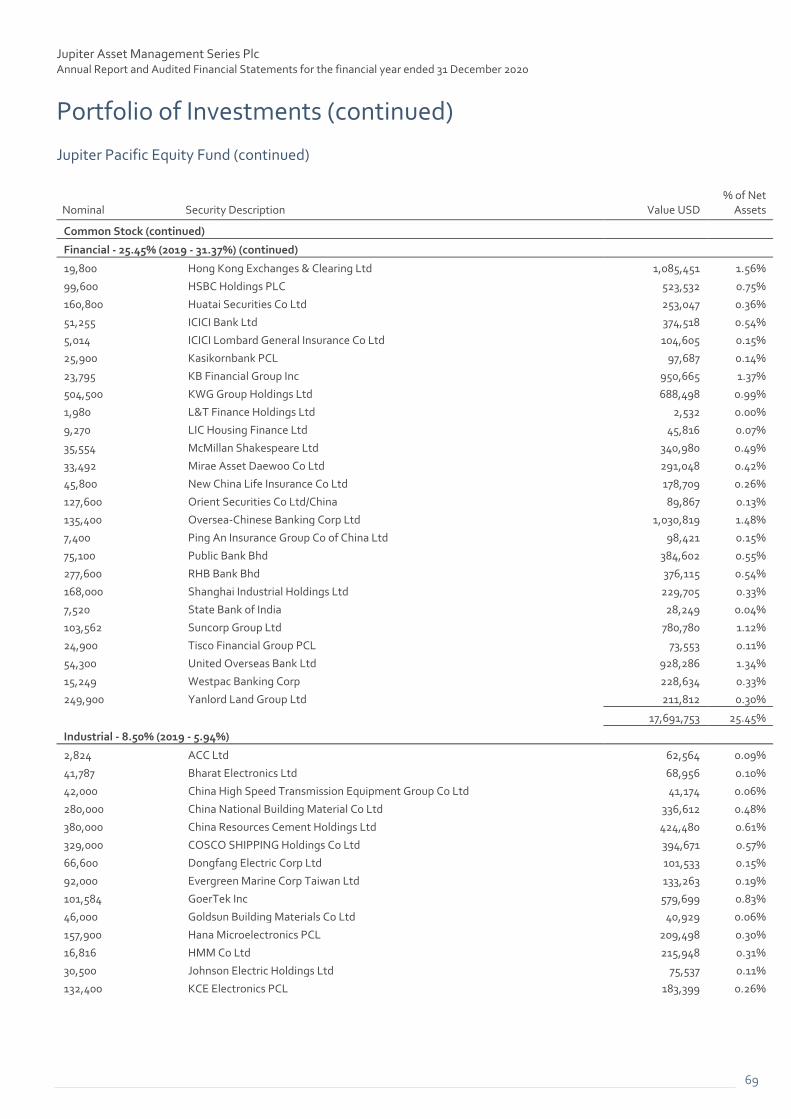
Jupiter Asset Management Series Plc Annual Report and Audited Financial Statements for the financial year ended 31 December 2020
Portfolio of Investments (continued) Jupiter Pacific Equity Fund (continued)
69
Nominal Security Description Value USD % of Net
Assets
Common Stock (continued)
Financial - 25.45% (2019 - 31.37%) (continued)
19,800 Hong Kong Exchanges & Clearing Ltd 1,085,451 1.56%
99,600 HSBC Holdings PLC 523,532 0.75%
160,800 Huatai Securities Co Ltd 253,047 0.36%
51,255 ICICI Bank Ltd 374,518 0.54%
5,014 ICICI Lombard General Insurance Co Ltd 104,605 0.15%
25,900 Kasikornbank PCL 97,687 0.14%
23,795 KB Financial Group Inc 950,665 1.37%
504,500 KWG Group Holdings Ltd 688,498 0.99%
1,980 L&T Finance Holdings Ltd 2,532 0.00%
9,270 LIC Housing Finance Ltd 45,816 0.07%
35,554 McMillan Shakespeare Ltd 340,980 0.49%
33,492 Mirae Asset Daewoo Co Ltd 291,048 0.42%
45,800 New China Life Insurance Co Ltd 178,709 0.26%
127,600 Orient Securities Co Ltd/China 89,867 0.13%
135,400 Oversea-Chinese Banking Corp Ltd 1,030,819 1.48%
7,400 Ping An Insurance Group Co of China Ltd 98,421 0.15%
75,100 Public Bank Bhd 384,602 0.55%
277,600 RHB Bank Bhd 376,115 0.54%
168,000 Shanghai Industrial Holdings Ltd 229,705 0.33%
7,520 State Bank of India 28,249 0.04%
103,562 Suncorp Group Ltd 780,780 1.12%
24,900 Tisco Financial Group PCL 73,553 0.11%
54,300 United Overseas Bank Ltd 928,286 1.34%
15,249 Westpac Banking Corp 228,634 0.33%
249,900 Yanlord Land Group Ltd 211,812 0.30%
17,691,753 25.45%
Industrial - 8.50% (2019 - 5.94%)
2,824 ACC Ltd 62,564 0.09%
41,787 Bharat Electronics Ltd 68,956 0.10%
42,000 China High Speed Transmission Equipment Group Co Ltd 41,174 0.06%
280,000 China National Building Material Co Ltd 336,612 0.48%
380,000 China Resources Cement Holdings Ltd 424,480 0.61%
329,000 COSCO SHIPPING Holdings Co Ltd 394,671 0.57%
66,600 Dongfang Electric Corp Ltd 101,533 0.15%
92,000 Evergreen Marine Corp Taiwan Ltd 133,263 0.19%
101,584 GoerTek Inc 579,699 0.83%
46,000 Goldsun Building Materials Co Ltd 40,929 0.06%
157,900 Hana Microelectronics PCL 209,498 0.30%
16,816 HMM Co Ltd 215,948 0.31%
30,500 Johnson Electric Holdings Ltd 75,537 0.11%
132,400 KCE Electronics PCL 183,399 0.26%

Jupiter Asset Management Series Plc Annual Report and Audited Financial Statements for the financial year ended 31 December 2020
Portfolio of Investments (continued) Jupiter Pacific Equity Fund (continued)
70
Nominal Security Description Value USD % of Net
Assets
Common Stock (continued)
Industrial - 8.50% (2019 - 5.94%) (continued)
7,300 Lens Technology Co Ltd 34,168 0.05%
274,000 Lonking Holdings Ltd 84,824 0.12%
2,468 LS Corp 162,217 0.23%
15,500 Luxshare Precision Industry Co Ltd 133,010 0.19%
39,058 Pan Ocean Co Ltd 180,495 0.26%
7,000 Pixart Imaging Inc 47,833 0.07%
2,749 Samsung Electro-Mechanics Co Ltd 450,450 0.65%
28,089 SF Holding Co Ltd 378,956 0.55%
1,394,000 Shanghai Electric Group Co Ltd 427,953 0.62%
5,499 Shenzhen Inovance Technology Co Ltd 78,452 0.11%
217,000 Sinotrans Ltd 78,934 0.11%
36,799 Supermax Corp Bhd 54,981 0.08%
28,000 Techtronic Industries Co Ltd 399,456 0.57%
937 UltraTech Cement Ltd 67,659 0.10%
57,000 U-Ming Marine Transport Corp 74,856 0.11%
323,200 Zoomlion Heavy Industry Science and Technology Co Ltd 387,713 0.56%
5,910,220 8.50%
Technology - 19.63% (2019 - 18.89%)
445,000 Acer Inc 374,558 0.54%
24,475 HCL Technologies Ltd 316,709 0.46%
68,817 Infosys Ltd 1,181,313 1.70%
235,000 Innolux Corp 117,927 0.17%
36,000 MediaTek Inc 957,086 1.38%
6,266 Mphasis Ltd 132,044 0.19%
64,000 Novatek Microelectronics Corp 840,493 1.21%
46,000 Realtek Semiconductor Corp 639,303 0.92%
30,023 Samsung Electronics Co Ltd 2,238,676 3.22%
239,106 Taiwan Semiconductor Manufacturing Co Ltd 4,510,185 6.49%
22,202 Tata Consultancy Services Ltd 870,390 1.25%
596,000 United Microelectronics Corp 1,000,129 1.44%
19,000 Vanguard International Semiconductor Corp 78,440 0.11%
61,838 Wipro Ltd 326,699 0.47%
515 Xero Ltd 58,528 0.08%
13,642,480 19.63%
Utilities - 0.98% (2019 - 2.18%)
165,000 China Longyuan Power Group Corp Ltd 165,372 0.24%
406,100 Gulf Energy Development PCL 464,252 0.66%
235,400 Malakoff Corp Bhd 52,376 0.08%
682,000 0.98%
Total Common Stock 67,945,024 97.75%

Jupiter Asset Management Series Plc Annual Report and Audited Financial Statements for the financial year ended 31 December 2020
Portfolio of Investments (continued) Jupiter Pacific Equity Fund (continued)
71
Nominal Security Description Value USD % of Net
Assets
Preferred Stock
Technology - 0.72% (2019 - 0.55%)
7,366 Samsung Electronics Co Ltd 499,070 0.72%
499,070 0.72%
Total Transferable Securities 68,444,094 98.47%
Futures - 0.01% (2019 - 0.00%)
Counterparty Nominal Security Description No of
Contracts Maturity
Date Unrealised
Gain USD
Bank of America Merrill Lynch 1,117,913 S&P 500 Emini Index Future 6 19/03/2021 10,013 0.01%
10,013 0.01%
Value USD
Total Financial Derivatives Instruments 10,013 0.01%
Financial Assets at Fair Value Through Profit or Loss (Cost USD 51,434,607) (2019: USD 79,179,696) 68,454,107 98.48%
Cash at Bank 1,754,695 2.52%
Other Net Liabilities (697,788) (1.00%)
Net Assets Value as at 31 December 2020 69,511,014 100.00%
Portfolio Analysis % of Total
Assets
Transferable securities admitted to official stock exchange listing 97.00%
Financial derivative instruments dealt in on a regulated market 0.01%
Other current assets 2.99%
Total Assets 100.00%

Jupiter Asset Management Series Plc Annual Report and Audited Financial Statements for the financial year ended 31 December 2020
Portfolio of Investments (continued) Merian European Equity Fund
72
Nominal Security Description Value EUR % of Net
Assets
Common Stock
Basic Materials - 3.46% (2019 - 6.62%)
27,293 Acerinox SA 248,039 0.58%
3,279 ArcelorMittal SA 62,232 0.15%
2,139 Aurubis AG 136,768 0.32%
11,839 BHP Group PLC 255,372 0.60%
3,119 Brenntag AG 201,082 0.48%
65,994 Ferrexpo PLC 210,247 0.50%
2,651 Fresnillo PLC 33,621 0.08%
20,877 Kloeckner & Co SE 167,277 0.40%
4,974 voestalpine AG 146,808 0.35%
1,461,446 3.46%
Communications - 9.17% (2019 - 5.62%)
358 APG SGA SA 65,032 0.15%
15,543 Ascom Holding AG 188,470 0.46%
10,226 Auto Trader Group PLC 67,704 0.16%
7,881 Bollore SA 26,906 0.06%
5,917 Eutelsat Communications SA 54,661 0.13%
268,359 ITV PLC 319,525 0.76%
67,841 Mediaset Espana Comunicacion SA 290,631 0.69%
3,957 Metropole Television SA 52,074 0.12%
45,425 Moneysupermarket.com Group PLC 130,826 0.31%
174 New Work SE 48,633 0.12%
43,924 Pearson PLC 331,351 0.78%
8,445 Publicis Groupe SA 347,005 0.82%
72,108 Rightmove PLC 521,833 1.23%
4,834 Telefonaktiebolaget LM Ericsson 47,302 0.11%
37,088 Television Francaise 1 243,297 0.58%
24,814 Vivendi SA 656,082 1.55%
357,833 Vodafone Group PLC 483,775 1.14%
3,875,107 9.17%
Consumer, Cyclical - 12.74% (2019 - 9.73%)
79,663 888 Holdings PLC 255,123 0.60%
7,306 Bayerische Motoren Werke AG 530,890 1.26%
18,668 Borussia Dortmund GmbH & Co KGaA 101,694 0.24%
4,239 Continental AG 521,291 1.23%
12,200 Daimler AG 710,345 1.68%
2,893 De' Longhi SpA 74,668 0.18%
1,103 Fielmann AG 73,570 0.17%
1,131 Hornbach Baumarkt AG 40,490 0.10%
468 Hornbach Holding AG & Co KGaA 36,691 0.09%
24,365 Industria de Diseno Textil SA 637,754 1.51%
5,724 Kindred Group PLC (DR) 46,059 0.11%

Jupiter Asset Management Series Plc Annual Report and Audited Financial Statements for the financial year ended 31 December 2020
Portfolio of Investments (continued) Merian European Equity Fund (continued)
73
Nominal Security Description Value EUR % of Net
Assets
Common Stock (continued)
Consumer, Cyclical - 12.74% (2019 - 9.73%) (continued)
64,505 Kingfisher PLC 194,744 0.45%
445 LVMH Moet Hennessy Louis Vuitton SE 229,731 0.54%
6,815 Pandora A/S 625,516 1.48%
5,446 Renault SA 195,852 0.46%
33,477 Rexel SA 435,034 1.03%
3,507 Takkt AG 37,665 0.09%
1,449 Trigano SA 210,322 0.50%
899 Valeo SA 29,128 0.07%
19,739 Volvo AB 383,941 0.91%
166 Zalando SE 15,146 0.04%
5,385,654 12.74%
Consumer, Non-cyclical - 26.43% (2019 - 25.51%)
3,908 Adecco Group AG 214,020 0.51%
8,252 AstraZeneca PLC 673,207 1.59%
3,257 BioGaia AB 173,811 0.41%
1,715 BioMerieux 199,283 0.47%
2,126 Boiron SA 85,997 0.20%
10,598 British American Tobacco PLC 319,782 0.76%
33,849 Carrefour SA 476,679 1.13%
6 Chocoladefabriken Lindt & Spruengli AG 47,906 0.11%
180 DiaSorin SpA 30,582 0.07%
9,247 Essity AB 245,028 0.58%
2,452 Etablissements Franz Colruyt NV 119,008 0.29%
1,619 Genmab A/S 535,735 1.27%
9,137 Getinge AB 175,536 0.42%
1,075 GlaxoSmithKline PLC 16,147 0.04%
443 Heineken Holding NV 34,200 0.08%
399 Henkel AG & Co KGaA 31,631 0.07%
1,206 Medacta Group SA 97,602 0.23%
26,264 Mediclinic International PLC 83,060 0.20%
17,527 Nestle SA 1,690,656 4.00%
6,016 Novartis AG 465,428 1.10%
17,041 Novo Nordisk A/S 981,778 2.32%
5,654 Orkla ASA 47,042 0.11%
25,942 Pagegroup PLC 130,043 0.31%
837 Pharma Mar SA 59,636 0.14%
10,707 PZ Cussons PLC 27,563 0.07%
10,417 Randstad NV 557,518 1.32%
5,265 Roche Holding AG 1,504,985 3.56%
11,291 Sanofi 893,062 2.11%
797 Sartorius Stedim Biotech 234,079 0.55%

Jupiter Asset Management Series Plc Annual Report and Audited Financial Statements for the financial year ended 31 December 2020
Portfolio of Investments (continued) Merian European Equity Fund (continued)
74
Nominal Security Description Value EUR % of Net
Assets
Common Stock (continued)
Consumer, Non-cyclical - 26.43% (2019 - 25.51%) (continued)
8,191 Societe BIC SA 381,946 0.90%
4,040 Swedish Match AB 258,070 0.61%
255 Tecan Group AG 102,243 0.24%
4,984 Unilever PLC 244,132 0.58%
610 Viscofan SA 35,639 0.08%
11,173,034 26.43%
Energy - 2.08% (2019 - 3.29%)
61,168 Royal Dutch Shell PLC 880,825 2.08%
880,825 2.08%
Financial - 15.07% (2019 - 22.02%)
863 Allianz SE 174,326 0.41%
167,347 Aviva PLC 608,322 1.44%
116,003 Banco Bilbao Vizcaya Argentaria SA 471,030 1.12%
1,495 BNP Paribas SA 65,160 0.15%
10,299 CMC Markets PLC 44,263 0.10%
13,456 CNP Assurances 178,427 0.42%
2,659 Deutsche Bank AG 23,867 0.06%
2,863 EXOR NV 189,903 0.45%
79,758 GAM Holding AG 159,712 0.38%
14,945 Gjensidige Forsikring ASA 273,313 0.65%
1,072 Grupo Catalana Occidente SA 31,008 0.07%
137,042 HSBC Holdings PLC 578,507 1.37%
5,255 IG Group Holdings PLC 50,064 0.12%
86,137 Just Group PLC 66,306 0.16%
8,665 KBC Group NV 499,884 1.18%
297,111 Man Group PLC/Jersey 456,261 1.08%
37,931 Natwest Group PLC 70,375 0.17%
6,927 Ninety One PLC 17,601 0.04%
13,961 NN Group NV 498,617 1.18%
76,860 Nordea Bank Abp 515,276 1.22%
11,805 Plus500 Ltd 190,342 0.45%
84,885 Ratos AB 326,831 0.77%
38,691 Standard Chartered PLC 201,632 0.48%
52,573 Svenska Handelsbanken AB 434,943 1.03%
13,413 Sydbank AS 242,473 0.57%
6,368,443 15.07%
Industrial - 13.92% (2019 - 14.13%)
12,899 Alfa Laval AB 292,199 0.69%
1,500 Atlas Copco AB 55,443 0.13%
17,440 bpost SA 147,717 0.35%
851 Bucher Industries AG 319,487 0.76%

Jupiter Asset Management Series Plc Annual Report and Audited Financial Statements for the financial year ended 31 December 2020
Portfolio of Investments (continued) Merian European Equity Fund (continued)
75
Nominal Security Description Value EUR % of Net
Assets
Common Stock (continued)
Industrial - 13.92% (2019 - 14.13%) (continued)
810 Buzzi Unicem SpA 15,805 0.04%
8,752 Cementir Holding NV 58,245 0.14%
9,553 D/S Norden A/S 140,980 0.33%
4,947 Epiroc AB 74,216 0.18%
147 Forbo Holding AG 206,257 0.49%
19,237 GEA Group AG 569,800 1.35%
562 HeidelbergCement AG 34,687 0.08%
780 Huber + Suhner AG 50,393 0.12%
1 Interroll Holding AG 2,495 0.01%
4,741 Inwido AB 57,222 0.14%
6,146 Krones AG 407,633 0.96%
2,731 Kuehne + Nagel International AG 507,339 1.20%
13,036 LafargeHolcim Ltd 586,285 1.39%
74,555 Royal Mail PLC 279,056 0.66%
6,065 Schneider Electric SE 727,648 1.72%
772 Siemens AG 91,050 0.21%
11,161 Siemens Energy AG 337,732 0.79%
11,405 Signify NV 395,582 0.94%
10,770 Tarkett SA 153,257 0.36%
10,208 Valmet OYJ 239,480 0.57%
622 Verallia SA 18,178 0.04%
2,123 Zehnder Group AG 115,951 0.27%
5,884,137 13.92%
Technology - 10.78% (2019 - 6.63%)
3,391 ASM International NV 613,686 1.45%
2,447 ASML Holding NV 981,247 2.32%
2,208 Atos SE 166,638 0.40%
1,360 Capgemini SE 172,686 0.41%
3,553 Dialog Semiconductor PLC 160,489 0.38%
9,900 EMIS Group PLC 118,894 0.28%
2,763 Logitech International SA 219,548 0.52%
1,045 Melexis NV 84,253 0.20%
3,681 Micro Focus International PLC 17,419 0.04%
2,060 Nemetschek SE 126,484 0.30%
1,081 Paradox Interactive AB 27,647 0.07%
32,723 Rovio Entertainment OYJ 207,791 0.49%
14,518 Sage Group PLC 94,635 0.22%
5,863 SAP SE 630,273 1.49%
479 Software AG 16,013 0.04%
18,703 STMicroelectronics NV 572,218 1.35%
6,153 TeamViewer AG 270,240 0.64%
9,024 TomTom NV 76,140 0.18%
4,556,301 10.78%

Jupiter Asset Management Series Plc Annual Report and Audited Financial Statements for the financial year ended 31 December 2020
Portfolio of Investments (continued) Merian European Equity Fund (continued)
76
Nominal Security Description Value EUR % of Net
Assets
Common Stock (continued)
Utilities - 4.03% (2019 - 5.54%)
343,304 A2A SpA 448,269 1.07%
666,764 Centrica PLC 343,766 0.81%
14,381 Endesa SA 322,997 0.76%
95,005 Hera SpA 283,400 0.67%
31,566 National Grid PLC 304,221 0.72%
1,702,653 4.03%
Total Common Stock 41,287,600 97.68%
Preferred Stock
Consumer, Cyclical - 1.18% (2019 - 0.12%)
2,195 Porsche Automobil Holding SE 124,786 0.30%
2,446 Volkswagen AG 371,890 0.88%
496,676 1.18%
Consumer, Non-cyclical - 0.19% (2019 - 0.26%)
1,293 Draegerwerk AG & Co KGaA 81,459 0.19%
81,459 0.19%
Industrial - 0.17% (2019 - 0.00%)
207 Sartorius AG 71,456 0.17%
71,456 0.17%
Total Transferable Securities 41,937,191 99.22%
Futures - 0.00% (2019 - 0.00%)
Counterparty Nominal Security Description No of
Contracts Maturity
Date Unrealised
Gain EUR
Bank of America Merrill Lynch 318,600 DJ Euro Stoxx 50 Future 9 19/03/2021 452 0.00%
452 0.00%
Value EUR
Total Financial Derivatives Instruments 452 0.00%
Financial Assets at Fair Value Through Profit or Loss (Cost EUR 37,442,483) (2019: EUR 45,313,358) 41,937,643 99.22%
Cash at Bank 327,745 0.78%
Other Net Assets 2,054 0.00%
Net Assets Value as at 31 December 2020 42,267,442 100.00%
Portfolio Analysis % of Total
Assets
Transferable securities admitted to official stock exchange listing 98.91%
Financial derivative instruments dealt in on a regulated market 0.00%
Other current assets 1.09%
Total Assets 100.00%

Jupiter Asset Management Series Plc Annual Report and Audited Financial Statements for the financial year ended 31 December 2020
Portfolio of Investments (continued) Jupiter Merian US Equity Income Fund
77
Nominal Security Description Value USD % of Net
Assets
Common Stock
Basic Materials - 1.68% (2019 - 0.36%)
27,935 International Paper Co 1,386,693 1.11%
8,743 Newmont Corp 527,990 0.42%
1,530 Reliance Steel & Aluminium Co 182,315 0.15%
2,096,998 1.68%
Communications - 17.80% (2019 - 11.67%)
1,621 Alphabet Inc - Class A 2,814,461 2.25%
1,049 Alphabet Inc - Class C 1,824,756 1.46%
1,473 Amazon.com Inc 4,840,057 3.87%
1,045 Charter Communications Inc 682,897 0.54%
24,658 Cisco Systems Inc 1,096,788 0.88%
15,894 Comcast Corp 813,932 0.65%
27,418 eBay Inc 1,385,980 1.11%
13,406 Facebook Inc 3,644,689 2.91%
48,313 Interpublic Group of Cos Inc 1,133,423 0.91%
1,642 Netflix Inc 861,377 0.69%
21,766 NortonLifeLock Inc 451,645 0.36%
4,002 Snap Inc 197,499 0.16%
154 Stamps.com Inc 32,112 0.03%
202 VeriSign Inc 43,329 0.03%
35,780 Verizon Communications Inc 2,080,249 1.66%
2,831 Zillow Group Inc 369,304 0.29%
22,272,498 17.80%
Consumer, Cyclical - 3.68% (2019 - 6.62%)
4,211 Bed Bath & Beyond Inc 78,535 0.06%
149,726 Ford Motor Co 1,326,572 1.06%
412 Home Depot Inc 109,287 0.09%
1,229 Meritage Homes Corp 105,190 0.08%
2,638 Nu Skin Enterprises Inc 143,243 0.11%
29,946 PulteGroup Inc 1,320,319 1.06%
2,137 Tesla Inc 1,484,745 1.19%
1,349 Vista Outdoor Inc 32,363 0.03%
4,600,254 3.68%
Consumer, Non-cyclical - 19.78% (2019 - 20.30%)
5,993 Abbott Laboratories 649,881 0.52%
15,687 AbbVie Inc 1,651,370 1.32%
563 ABIOMED Inc 182,367 0.15%
4,479 Amgen Inc 1,017,494 0.81%
1,480 Anthem Inc 464,794 0.38%
4,160 Avantor Inc 113,734 0.09%
3,046 B&G Foods Inc 85,745 0.07%
1,129 Biogen Inc 275,002 0.22%

Jupiter Asset Management Series Plc Annual Report and Audited Financial Statements for the financial year ended 31 December 2020
Portfolio of Investments (continued) Jupiter Merian US Equity Income Fund (continued)
78
Nominal Security Description Value USD % of Net
Assets
Common Stock (continued)
Consumer, Non-cyclical - 19.78% (2019 - 20.30%) (continued)
16,395 Cardinal Health Inc 876,969 0.70%
759 Charles River Laboratories International Inc 188,680 0.15%
1,588 Cigna Corp 324,031 0.26%
1,522 DaVita Inc 175,791 0.14%
6,394 Edwards Lifesciences Corp 573,158 0.46%
19,766 Gilead Sciences Inc 1,119,744 0.90%
682 Humana Inc 276,967 0.22%
1,962 IDEXX Laboratories Inc 975,036 0.78%
4,223 Incyte Corp 366,810 0.29%
1,911 IQVIA Holdings Inc 339,241 0.27%
6,625 Johnson & Johnson 1,033,831 0.83%
40,335 Kraft Heinz Co 1,398,414 1.12%
1,911 ManpowerGroup Inc 172,659 0.14%
7,591 McKesson Corp 1,316,431 1.05%
2,026 Medifast Inc 390,856 0.31%
1,854 Medpace Holdings Inc 255,592 0.20%
22,932 Merck & Co Inc 1,848,090 1.48%
9,759 Monster Beverage Corp 892,558 0.72%
7,273 National Beverage Corp 623,878 0.50%
6,039 Owens & Minor Inc 167,643 0.13%
9,578 Philip Morris International Inc 780,415 0.62%
240 Procter & Gamble Co 33,065 0.03%
8,668 Puma Biotechnology Inc 90,061 0.07%
675 Quidel Corp 124,814 0.10%
273 Regeneron Pharmaceuticals Inc 130,576 0.10%
2,168 Rent-A-Center Inc/TX 83,208 0.07%
7,655 Reynolds Consumer Products Inc 229,803 0.18%
10,187 SpartanNash Co 175,318 0.14%
9,841 Spectrum Brands Holdings Inc 759,824 0.61%
1,752 Square Inc 387,262 0.31%
4,953 Surmodics Inc 213,276 0.17%
4,181 Thermo Fisher Scientific Inc 1,930,493 1.54%
14,825 Triton International Ltd/Bermuda 716,344 0.57%
2,802 UnitedHealth Group Inc 966,662 0.77%
669 Vertex Pharmaceuticals Inc 155,663 0.12%
770 West Pharmaceutical Services Inc 215,554 0.17%
24,749,104 19.78%
Energy - 0.64% (2019 - 3.50%)
15,949 Cabot Oil & Gas Corp 262,680 0.21%
11,955 EQT Corp 155,176 0.12%
9,114 Exxon Mobil Corp 379,142 0.31%
796,998 0.64%

Jupiter Asset Management Series Plc Annual Report and Audited Financial Statements for the financial year ended 31 December 2020
Portfolio of Investments (continued) Jupiter Merian US Equity Income Fund (continued)
79
Nominal Security Description Value USD % of Net
Assets
Common Stock (continued)
Financial - 12.02% (2019 - 23.41%)
7,076 Alexander & Baldwin Inc 120,504 0.10%
11,428 American Financial Group Inc/OH 998,464 0.80%
33,079 Artisan Partners Asset Management Inc 1,645,349 1.32%
53,693 Associated Banc-Corp 918,150 0.73%
1,554 BlackRock Inc 1,101,693 0.88%
5,188 Cathay General Bancorp 165,653 0.13%
7,748 Comerica Inc 431,874 0.34%
12,019 Corporate Office Properties Trust 308,648 0.25%
7,061 Highwoods Properties Inc 276,368 0.22%
16,299 Investors Bancorp Inc 171,221 0.14%
25,654 Janus Henderson Group PLC 834,012 0.67%
14,396 Jefferies Financial Group Inc 347,088 0.28%
1,129 JPMorgan Chase & Co 141,531 0.11%
22,734 KKR Real Estate Finance Trust Inc 406,029 0.32%
971 Mastercard Inc 345,239 0.28%
18,568 Morgan Stanley 1,259,653 1.01%
42,423 Navient Corp 415,321 0.33%
20 New York Community Bancorp Inc 210 0.00%
19,681 Physicians Realty Trust 350,519 0.28%
1,847 Prosperity Bancshares Inc 128,145 0.10%
17,522 Prudential Financial Inc 1,357,079 1.08%
16,114 Regions Financial Corp 256,696 0.21%
62,370 SITE Centers Corp 631,184 0.50%
17,836 Starwood Property Trust Inc 343,878 0.27%
3,956 State Street Corp 286,494 0.23%
2,327 T Rowe Price Group Inc 348,073 0.28%
12,627 Uniti Group Inc 146,978 0.12%
1,559 Visa Inc 340,423 0.27%
9,466 Wells Fargo & Co 281,614 0.23%
31,222 Western Union Co 680,015 0.54%
15,038,105 12.02%
Industrial - 6.65% (2019 - 5.53%)
1,932 3M Co 336,381 0.27%
5,416 AGCO Corp 553,407 0.44%
7,588 Agilent Technologies Inc 890,755 0.71%
4,194 Avnet Inc 146,119 0.12%
16,091 Carrier Global Corp 607,113 0.49%
13,161 Emerson Electric Co 1,050,511 0.84%
1,433 FedEx Corp 372,551 0.29%
6,633 General Electric Co 71,039 0.06%
6,822 GrafTech International Ltd 70,881 0.06%
1,348 Huntington Ingalls Industries Inc 227,192 0.18%

Jupiter Asset Management Series Plc Annual Report and Audited Financial Statements for the financial year ended 31 December 2020
Portfolio of Investments (continued) Jupiter Merian US Equity Income Fund (continued)
80
Nominal Security Description Value USD % of Net
Assets
Common Stock (continued)
Industrial - 6.65% (2019 - 5.53%) (continued)
1,243 Lockheed Martin Corp 440,221 0.35%
3,278 Louisiana-Pacific Corp 123,056 0.10%
58,477 MDU Resources Group Inc 1,514,554 1.21%
2,337 Otis Worldwide Corp 155,925 0.12%
6,078 Pentair PLC 320,189 0.26%
4,309 Rockwell Automation Inc 1,073,372 0.86%
390 Universal Display Corp 90,121 0.07%
1,116 Waters Corp 274,045 0.22%
8,317,432 6.65%
Technology - 30.40% (2019 - 26.75%)
7,493 Activision Blizzard Inc 686,209 0.55%
3,930 Adobe Inc 1,954,979 1.56%
4,798 Advanced Micro Devices Inc 442,807 0.35%
56,175 Apple Inc 7,511,721 6.00%
15,331 Applied Materials Inc 1,333,490 1.07%
2,592 Autodesk Inc 776,071 0.63%
3,606 Broadcom Inc 1,567,997 1.25%
6,396 Cadence Design Systems Inc 865,059 0.69%
7,895 Cerner Corp 615,652 0.49%
89 Citrix Systems Inc 11,418 0.01%
2,142 Cognizant Technology Solutions Corp 173,652 0.14%
17,626 Dropbox Inc 398,348 0.32%
5,784 HP Inc 140,667 0.12%
40,384 Intel Corp 1,968,720 1.57%
12,959 International Business Machines Corp 1,611,322 1.29%
195 Lam Research Corp 94,468 0.08%
32,437 Microsoft Corp 7,190,634 5.75%
3,430 NVIDIA Corp 1,803,597 1.44%
27,634 Oracle Corp 1,779,630 1.42%
3,301 Progress Software Corp 147,225 0.12%
12,016 QUALCOMM Inc 1,801,799 1.44%
2,631 salesforce.com Inc 585,134 0.47%
1,927 Schrodinger Inc/United States 157,706 0.13%
1,101 ServiceNow Inc 602,665 0.48%
8,029 Skyworks Solutions Inc 1,226,430 0.98%
3,584 SolarWinds Corp 53,652 0.04%
5,014 Teradyne Inc 603,134 0.48%
11,017 Texas Instruments Inc 1,792,466 1.43%
366 Zoom Video Communications Inc 129,344 0.10%
38,025,996 30.40%
Utilities - 2.14% (2019 - 3.63%)
26,015 Avangrid Inc 1,183,422 0.95%
705 National Fuel Gas Co 28,870 0.02%

Jupiter Asset Management Series Plc Annual Report and Audited Financial Statements for the financial year ended 31 December 2020
Portfolio of Investments (continued) Jupiter Merian US Equity Income Fund (continued)
81
Nominal Security Description Value USD % of Net
Assets
Common Stock (continued)
Utilities - 2.14% (2019 - 3.63%) (continued)
14,886 NorthWestern Corp 852,968 0.68%
6,803 Public Service Enterprise Group Inc 390,220 0.31%
11,415 Vistra Corp 222,478 0.18%
2,677,958 2.14%
Total Common Stock 118,575,343 94.79%
Total Transferable Securities 118,575,343 94.79%
Futures - 0.02% (2019 - 0.00%)
Counterparty Nominal Security Description No of
Contracts Maturity
Date Unrealised
Gain USD
Bank of America Merrill Lynch 7,639,069 S&P 500 Emini Index Future 41 19/03/2021 27,240 0.02%
27,240 0.02%
Currency Exchange Contracts - 0.08% (2019 - 0.02%)
Actual Settle Date
Issue Currency
Currency Bought
Settle Currency
Currency Sold
Citibank 15/01/2021 EUR 9,135,320 USD 11,114,319 102,180 0.08%
Unrealised Gain on Currency Exchange Contracts at 31 December 2020 102,180 0.08%
Value USD
Total Financial Derivatives Instruments 129,420 0.10%
Financial Assets at Fair Value Through Profit or Loss (Cost USD 100,350,241) (2019: USD 199,138,388) 118,704,763 94.89%
Currency Exchange Contracts - (0.02%) (2019 - (0.01%))
Actual Settle Date
Issue Currency
Currency Bought
Settle Currency
Currency Sold
Unrealised Loss USD
Citibank 15/01/2021 USD 7,038,936 EUR 5,758,036 (30,868) (0.02%)
Unrealised Loss on Currency Exchange Contracts at 31 December 2020 (30,868) (0.02%)
Value USD
Total Financial Derivatives Instruments (30,868) (0.02%)
Financial Liabilities at Fair Value Through Profit or Loss (Cost USD Nil) (2019: USD Nil) (30,868) (0.02%)
Cash at Bank 3,130,911 2.50%
Other Net Assets 3,288,285 2.63%
Net Assets Value as at 31 December 2020 125,093,091 100.00%

Jupiter Asset Management Series Plc Annual Report and Audited Financial Statements for the financial year ended 31 December 2020
Portfolio of Investments (continued) Jupiter Merian US Equity Income Fund (continued)
82
Portfolio Analysis % of Total
Assets
Transferable securities admitted to official stock exchange listing 90.62%
Financial derivative instruments dealt in on a regulated market 0.02%
OTC financial derivative instruments 0.08%
Other current assets 9.28%
Total Assets 100.00%

Jupiter Asset Management Series Plc Annual Report and Audited Financial Statements for the financial year ended 31 December 2020
Portfolio of Investments (continued) Jupiter Merian North American Equity Fund (IRL)
83
Nominal Security Description Value USD % of Net
Assets
Common Stock
Basic Materials - 0.80% (2019 - 0.74%)
9,944 Allegheny Technologies Inc 167,358 0.04%
4,123 Franco-Nevada Corp 520,936 0.11%
23,046 International Paper Co 1,144,003 0.24%
792 NewMarket Corp 316,254 0.07%
44,871 Pretium Resources Inc 520,141 0.11%
69,099 Torex Gold Resources Inc 1,056,049 0.23%
3,724,741 0.80%
Communications - 17.79% (2019 - 12.13%)
7,563 Alphabet Inc - Class A 13,131,259 2.81%
3,820 Alphabet Inc - Class C 6,644,966 1.42%
5,447 Amazon.com Inc 17,898,025 3.83%
11,471 Charter Communications Inc 7,496,184 1.60%
11,315 Cisco Systems Inc 503,291 0.11%
19,919 Comcast Corp 1,020,052 0.22%
85,595 eBay Inc 4,326,827 0.93%
50,738 Facebook Inc 13,794,140 2.95%
7,827 Netflix Inc 4,105,966 0.88%
5,620 New York Times Co 289,936 0.06%
16,001 NortonLifeLock Inc 332,021 0.07%
11,608 Sirius XM Holdings Inc 74,407 0.02%
13,689 Snap Inc 675,552 0.14%
24,470 Thomson Reuters Corp 2,010,180 0.43%
8,972 VeriSign Inc 1,924,494 0.41%
137,762 Verizon Communications Inc 8,009,483 1.71%
7,336 Zillow Group Inc 956,981 0.20%
83,193,764 17.79%
Consumer, Cyclical - 3.71% (2019 - 7.83%)
23,270 Bed Bath & Beyond Inc 433,986 0.09%
37,115 Cineplex Inc 273,998 0.06%
591,190 Ford Motor Co 5,237,943 1.12%
52,508 Lions Gate Entertainment Corp 587,039 0.13%
1,328 Nu Skin Enterprises Inc 72,110 0.02%
113,041 PulteGroup Inc 4,983,978 1.07%
25,875 Qurate Retail Inc 286,695 0.06%
7,096 Tesla Inc 4,930,159 1.04%
13,639 TRI Pointe Group Inc 239,228 0.05%
13,411 Vista Outdoor Inc 321,730 0.07%
17,366,866 3.71%
Consumer, Non-cyclical - 16.65% (2019 - 20.69%)
2,871 Abbott Laboratories 311,331 0.07%
15,756 AbbVie Inc 1,658,634 0.35%
5,170 ABIOMED Inc 1,674,666 0.36%

Jupiter Asset Management Series Plc Annual Report and Audited Financial Statements for the financial year ended 31 December 2020
Portfolio of Investments (continued) Jupiter Merian North American Equity Fund (IRL) (continued)
84
Nominal Security Description Value USD % of Net
Assets
Common Stock (continued)
Consumer, Non-cyclical - 16.65% (2019 - 20.69%) (continued)
2,800 AmerisourceBergen Corp 271,488 0.06%
1,061 Amgen Inc 241,027 0.05%
7,228 Anthem Inc 2,269,953 0.49%
41,505 Avantor Inc 1,134,747 0.24%
8,132 Biogen Inc 1,980,793 0.42%
30,251 Cardinal Health Inc 1,618,126 0.35%
12,434 Cigna Corp 2,537,158 0.54%
43,060 DaVita Inc 4,973,430 1.06%
64,945 Edwards Lifesciences Corp 5,821,670 1.24%
808 FTI Consulting Inc 89,421 0.02%
2,923 Humana Inc 1,187,060 0.25%
4,838 IDEXX Laboratories Inc 2,404,292 0.51%
37,578 Incyte Corp 3,264,025 0.70%
12,773 IQVIA Holdings Inc 2,267,463 0.48%
5,551 Johnson & Johnson 866,234 0.19%
44,241 Kforce Inc 1,882,012 0.40%
9,278 Korn Ferry 403,222 0.09%
85,884 Kraft Heinz Co 2,977,598 0.64%
30,679 McKesson Corp 5,320,352 1.14%
11,062 Medpace Holdings Inc 1,525,007 0.33%
34,656 Merck & Co Inc 2,792,927 0.59%
79,442 Monster Beverage Corp 7,265,765 1.55%
19,376 National Beverage Corp 1,662,073 0.36%
32,788 Owens & Minor Inc 910,195 0.19%
5,213 PepsiCo Inc 767,927 0.16%
102,173 Puma Biotechnology Inc 1,061,577 0.23%
3,187 Quidel Corp 589,308 0.13%
7,602 Radius Health Inc 140,257 0.03%
2,191 Regeneron Pharmaceuticals Inc 1,047,955 0.22%
37,133 Spectrum Brands Holdings Inc 2,867,039 0.61%
4,615 Square Inc 1,020,100 0.22%
434 Teladoc Health Inc 88,349 0.02%
17,754 Thermo Fisher Scientific Inc 8,197,554 1.75%
1,800 UnitedHealth Group Inc 620,982 0.13%
6,546 Vertex Pharmaceuticals Inc 1,523,123 0.33%
2,483 West Pharmaceutical Services Inc 695,091 0.15%
77,929,931 16.65%
Energy - 0.99% (2019 - 3.49%)
85,845 Cabot Oil & Gas Corp 1,413,867 0.30%
344,582 Crescent Point Energy Corp 822,689 0.18%
109,696 EQT Corp 1,423,854 0.30%
743 Exxon Mobil Corp 30,909 0.01%

Jupiter Asset Management Series Plc Annual Report and Audited Financial Statements for the financial year ended 31 December 2020
Portfolio of Investments (continued) Jupiter Merian North American Equity Fund (IRL) (continued)
85
Nominal Security Description Value USD % of Net
Assets
Common Stock (continued)
Energy - 0.99% (2019 - 3.49%) (continued)
9,005 Parex Resources Inc 126,521 0.03%
7,732 REX American Resources Corp 578,895 0.12%
17,069 Tourmaline Oil Corp 235,129 0.05%
4,631,864 0.99%
Financial - 11.92% (2019 - 19.30%)
51,025 Affiliated Managers Group Inc 5,150,464 1.10%
3,761 Alliance Data Systems Corp 277,110 0.06%
16,481 American Financial Group Inc/OH 1,439,945 0.31%
109,439 American Homes 4 Rent 3,274,415 0.70%
47,737 Artisan Partners Asset Management Inc 2,374,438 0.51%
11,987 Associated Banc-Corp 204,978 0.04%
2,233 Bank of Nova Scotia 120,620 0.03%
3,057 BlackRock Inc 2,167,230 0.46%
328,862 Cadence BanCorp 5,422,934 1.16%
44,279 Corporate Office Properties Trust 1,137,085 0.24%
114,030 GEO Group Inc 1,026,270 0.22%
11,857 Goldman Sachs Group Inc 3,076,299 0.66%
17,728 Great-West Lifeco Inc 416,573 0.09%
21,517 Hartford Financial Services Group Inc 1,031,525 0.22%
53,066 Janus Henderson Group PLC 1,725,176 0.37%
95,969 Jefferies Financial Group Inc 2,313,813 0.50%
1,964 JPMorgan Chase & Co 246,207 0.05%
111,713 Manulife Financial Corp 1,975,793 0.42%
3,561 Mastercard Inc 1,266,114 0.27%
65,290 Morgan Stanley 4,429,274 0.95%
628 National Western Life Group Inc 128,740 0.03%
9,586 Prosperity Bancshares Inc 665,077 0.14%
10,603 Prudential Financial Inc 821,202 0.18%
16,075 Regions Financial Corp 256,075 0.05%
10,805 RenaissanceRe Holdings Ltd 1,774,937 0.38%
86,987 SITE Centers Corp 880,308 0.19%
12,808 Starwood Property Trust Inc 246,938 0.05%
26,819 State Street Corp 1,942,232 0.42%
12,937 Visa Inc 2,824,923 0.60%
188,063 Wells Fargo & Co 5,594,874 1.20%
16,673 Western Alliance Bancorp 1,000,880 0.21%
24,431 Western Union Co 532,107 0.11%
55,744,556 11.92%
Industrial - 10.53% (2019 - 7.31%)
22,817 Acuity Brands Inc 2,750,133 0.59%
28,898 AGCO Corp 2,952,798 0.63%
26,828 Agilent Technologies Inc 3,149,339 0.67%

Jupiter Asset Management Series Plc Annual Report and Audited Financial Statements for the financial year ended 31 December 2020
Portfolio of Investments (continued) Jupiter Merian North American Equity Fund (IRL) (continued)
86
Nominal Security Description Value USD % of Net
Assets
Common Stock (continued)
Industrial - 10.53% (2019 - 7.31%) (continued)
17,343 Astec Industries Inc 1,003,986 0.21%
10,319 Avnet Inc 359,514 0.08%
64,229 Carrier Global Corp 2,423,360 0.52%
64,520 Emerson Electric Co 5,149,986 1.10%
5,776 FedEx Corp 1,501,644 0.32%
145,258 General Electric Co 1,555,713 0.33%
216,182 GrafTech International Ltd 2,246,131 0.48%
71,910 Howmet Aerospace Inc 2,039,368 0.44%
1,200 Huntington Ingalls Industries Inc 202,248 0.04%
3,297 L3Harris Technologies Inc 618,682 0.13%
2,319 Lockheed Martin Corp 821,297 0.19%
229,889 MDU Resources Group Inc 5,954,125 1.27%
1,268 Mettler-Toledo International Inc 1,437,760 0.31%
2,610 Northrop Grumman Corp 789,812 0.17%
8,305 Packaging Corp of America 1,141,688 0.24%
16,229 Pentair PLC 854,944 0.18%
16,665 Rockwell Automation Inc 4,151,252 0.89%
92,985 Stantec Inc 3,016,737 0.64%
58,346 Terex Corp 2,036,859 0.44%
12,509 Waters Corp 3,071,710 0.66%
49,229,086 10.53%
Technology - 31.87% (2019 - 23.30%)
37,727 Activision Blizzard Inc 3,455,039 0.73%
7,019 Adobe Inc 3,491,602 0.75%
27,766 Advanced Micro Devices Inc 2,562,524 0.55%
216,499 Apple Inc 28,950,246 6.19%
30,028 Applied Materials Inc 2,611,835 0.56%
21,760 Autodesk Inc 6,515,162 1.39%
41,781 Cadence Design Systems Inc 5,650,880 1.21%
78,438 Cerner Corp 6,116,595 1.31%
12,538 Cirrus Logic Inc 1,027,489 0.22%
26,983 Citrix Systems Inc 3,461,649 0.74%
6,205 Cognizant Technology Solutions Corp 503,039 0.11%
53,508 Dropbox Inc 1,209,281 0.26%
12,368 DXC Technology Co 301,037 0.06%
2,810 Enghouse Systems Ltd 133,802 0.03%
168,685 Intel Corp 8,223,394 1.76%
14,066 International Business Machines Corp 1,748,966 0.37%
10,493 Manhattan Associates Inc 1,102,709 0.24%
116,517 Microsoft Corp 25,829,489 5.52%
17,936 NVIDIA Corp 9,431,287 2.02%
59,078 Open Text Corp 2,691,058 0.58%

Jupiter Asset Management Series Plc Annual Report and Audited Financial Statements for the financial year ended 31 December 2020
Portfolio of Investments (continued) Jupiter Merian North American Equity Fund (IRL) (continued)
87
Nominal Security Description Value USD % of Net
Assets
Common Stock (continued)
Technology - 31.87% (2019 - 23.30%) (continued)
111,919 Oracle Corp 7,207,584 1.54%
31,323 Progress Software Corp 1,397,006 0.30%
48,490 QUALCOMM Inc 7,271,076 1.55%
5,678 salesforce.com Inc 1,262,787 0.27%
3,553 ServiceNow Inc 1,944,841 0.42%
35,477 Skyworks Solutions Inc 5,419,112 1.16%
25,473 SolarWinds Corp 381,331 0.08%
38,970 Teradyne Inc 4,687,701 1.00%
23,709 Texas Instruments Inc 3,857,454 0.82%
1,577 VMware Inc 217,705 0.05%
1,051 Zoom Video Communications Inc 371,423 0.08%
149,035,103 31.87%
Utilities - 2.29% (2019 - 4.43%)
143,875 AltaGas Ltd 2,117,504 0.45%
65,455 Avangrid Inc 2,977,548 0.64%
69,006 Hydro One Ltd 1,559,179 0.34%
12,517 Portland General Electric Co 526,465 0.11%
180,860 Vistra Corp 3,524,961 0.75%
10,705,657 2.29%
Total Common Stock 451,561,568 96.55%
Total Transferable Securities 451,561,568 96.55%
Futures - 0.01% (2019 - 0.01%)
Counterparty Nominal Security Description No of
Contracts Maturity
Date Unrealised
Gain USD
Bank of America Merrill Lynch 16,209,731 S&P 500 Emini Index Future 87 19/03/2021 46,595 0.01%
46,595 0.01%
Currency Exchange Contracts - 0.23% (2019 - 0.01%)
Actual Settle Date
Issue Currency
Currency Bought
Settle Currency
Currency Sold
Citibank 15/01/2021 EUR 7,646,204 USD 9,281,239 106,902 0.02%
Citibank 15/01/2021 GBP 22,245,514 USD 29,372,679 991,932 0.21%
Citibank 15/01/2021 USD 607 EUR 495 - 0.00%
Citibank 15/01/2021 USD 2 GBP 1 - 0.00%
Unrealised Gain on Currency Exchange Contracts at 31 December 2020 1,098,834 0.23%
Value USD
Total Financial Derivatives Instruments 1,145,429 0.24%
Financial Assets at Fair Value Through Profit or Loss (Cost USD 354,317,192) (2019: USD 1,031,984,510) 452,706,997 96.79%

Jupiter Asset Management Series Plc Annual Report and Audited Financial Statements for the financial year ended 31 December 2020
Portfolio of Investments (continued) Jupiter Merian North American Equity Fund (IRL) (continued)
88
Currency Exchange Contracts - (0.00%) (2019 - (0.01%))
Counterparty Actual Settle Date
Issue Currency
Currency Bought
Settle Currency
Currency Sold
Unrealised Loss USD
% of Net Assets
Citibank 15/01/2021 USD 194,816 EUR 159,361 (849) (0.00%)
Citibank 15/01/2021 USD 876,187 GBP 655,998 (19,231) (0.00%)
Unrealised Loss on Currency Exchange Contracts at 31 December 2020 (20,080) (0.00%)
Value USD
Total Financial Derivatives Instruments (20,080) (0.00%)
Financial Liabilities at Fair Value Through Profit or Loss (Cost USD Nil) (2019: USD Nil) (20,080) (0.00%)
Cash at Bank 3,684,457 0.79%
Other Net Assets 11,353,277 2.42%
Net Assets Value as at 31 December 2020 467,724,651 100.00%
Portfolio Analysis % of Total
Assets
Transferable securities admitted to official stock exchange listing 95.80%
Financial derivative instruments dealt in on a regulated market 0.01%
OTC financial derivative instruments 0.23%
Other current assets 3.96%
Total Assets 100.00%

Jupiter Asset Management Series Plc Annual Report and Audited Financial Statements for the financial year ended 31 December 2020
Portfolio of Investments (continued) Merian Global Dynamic Bond Fund
89
Nominal Security Description Coupon
Rate Maturity
Date Value USD % of Net
Assets
Corporate Bonds - 16.86% (2019 - 24.64%)
500,000 Aeroports de Paris 2.75 04/02/2030 759,772 0.31%
200,000 Air Liquide Finance SA 1.00 04/02/2025 259,561 0.11%
200,000 Air Products and Chemicals Inc 0.80 05/05/2032 262,596 0.11%
1,427,000 Amazon.com Inc 2.40 22/02/2023 1,502,207 0.62%
500,000 Apple Inc 0.50 15/11/2031 645,292 0.27%
990,000 Aroundtown SA 5.38 21/03/2029 1,197,257 0.50%
1,000,000 Australia & New Zealand Banking Group Ltd 1.08 23/11/2021 1,008,186 0.42%
2,000,000 Australia & New Zealand Banking Group Ltd 4.50 19/03/2024 2,233,003 0.92%
359,000 Bank of America Corp 2.50 21/10/2022 367,147 0.15%
1,350,000 Bank of America Corp 1.17 23/07/2024 1,379,891 0.57%
427,000 Bank of Montreal 0.68 13/04/2021 428,155 0.18%
610,000 Berkshire Hathaway Energy Co 3.70 15/07/2030 736,309 0.31%
500,000 Carrefour SA 2.63 15/12/2027 717,768 0.30%
2,000,000 Caterpillar Financial Services Corp 2.95 26/02/2022 2,082,531 0.86%
300,000 Coca-Cola European Partners PLC 1.75 27/03/2026 404,239 0.17%
490,000 Comcast Corp 3.40 04/01/2030 569,989 0.24%
450,000 Daimler Finance North America LLC 0.66 22/02/2021 450,527 0.19%
1,600,000 Daimler Finance North America LLC 1.09 22/02/2022 1,612,207 0.67%
400,000 Deutsche Wohnen SE 1.00 30/04/2025 516,886 0.21%
300,000 Deutsche Wohnen SE 1.50 30/04/2030 412,799 0.17%
500,000 EDP - Energias de Portugal SA 1.63 15/04/2027 676,634 0.28%
700,000 EnBW International Finance BV 0.63 17/04/2025 892,158 0.37%
176,000 Ford Motor Co 8.50 21/04/2023 201,407 0.08%
1,270,000 Hastings Group Finance PLC 3.00 24/05/2025 1,883,056 0.78%
500,000 John Deere Cash Management SA 1.85 04/02/2028 706,142 0.29%
500,000 John Deere Cash Management SA 2.20 04/02/2032 755,226 0.31%
1,000,000 JPMorgan Chase & Co 0.94 23/04/2024 1,014,702 0.42%
300,000 Koninklijke Ahold Delhaize NV 1.75 04/02/2027 413,810 0.17%
122,000 Koninklijke Philips NV 1.38 30/03/2025 160,332 0.07%
1,130,000 Logicor 2019-1 UK PLC 1.88 17/11/2026 1,647,399 0.68%
435,000 MetLife Inc 4.55 23/03/2030 549,873 0.23%
600,000 Mizuho Financial Group Inc 1.16 28/02/2022 606,064 0.25%
2,000,000 National Australia Bank Ltd/New York 3.38 20/09/2021 2,063,554 0.86%
400,000 Pinewood Finance Co Ltd 3.25 30/09/2025 562,646 0.23%
225,000 Prologis International Funding II SA 1.63 17/06/2032 314,823 0.13%
1,000,000 Santander UK Group Holdings PLC 2.88 08/05/2021 1,026,414 0.43%
340,000 Sovereign Housing Capital PLC 2.38 11/04/2048 556,803 0.23%
600,000 Suez SA 1.25 04/02/2027 796,219 0.33%
270,000 Tesco Corporate Treasury Services PLC 2.75 27/04/2030 417,079 0.17%
2,000,000 Toyota Motor Credit Corp 0.50 13/04/2021 2,003,447 0.83%
200,000 Unilever Finance Netherlands BV 1.75 25/03/2030 287,376 0.12%

Jupiter Asset Management Series Plc Annual Report and Audited Financial Statements for the financial year ended 31 December 2020
Portfolio of Investments (continued) Merian Global Dynamic Bond Fund (continued)
90
Nominal Security Description Coupon
Rate Maturity
Date Value USD % of Net
Assets
Corporate Bonds - 16.86% (2019 - 24.64%) (continued)
1,190,000 Verizon Communications Inc 2.50 04/08/2031 1,872,482 0.78%
1,500,000 Wells Fargo & Co 1.24 26/07/2021 1,511,425 0.63%
2,000,000 Westpac Banking Corp 3.65 15/05/2023 2,202,609 0.91%
40,668,002 16.86%
Government Security - 69.49% (2019 - 68.78%)
5,400,000 Canadian Government Bond 1.25 03/01/2025 4,416,263 1.83%
30,000,000 China Government Bond 2.20 27/07/2025 4,545,545 1.88%
2,240,000 Cyprus Government International Bond 0.63 12/03/2024 2,826,536 1.17%
2,075,000 Cyprus Government International Bond 1.50 16/04/2027 2,817,786 1.17%
4,100,000 Deutsche Bundesrepublik Inflation Linked Bond 0.50 15/04/2030 6,410,092 2.66%
420,000 Egypt Government International Bond 7.90 21/02/2048 468,899 0.19%
8,200,000 French Republic Government Bond OAT 0.10 03/01/2026 10,840,398 4.49%
580,000 Hellenic Republic Government Bond 1.88 23/07/2026 783,829 0.32%
4,338,000 Hellenic Republic Government Bond 1.50 18/06/2030 5,797,116 2.40%
44,800,000,000 Indonesia Treasury Bond 7.00 15/09/2030 3,475,732 1.44%
38,000,000,000 Indonesia Treasury Bond 8.38 15/03/2034 3,220,077 1.33%
5,500,000 Italy Buoni Ordinari del Tesoro BOT 0.00 14/07/2021 6,771,607 2.81%
5,150,000 Italy Buoni Poliennali Del Tesoro 1.00 15/07/2022 6,490,709 2.69%
3,100,000 Italy Buoni Poliennali Del Tesoro 0.10 15/05/2023 4,002,474 1.66%
4,672,000 Italy Buoni Poliennali Del Tesoro 0.65 15/10/2023 5,901,302 2.45%
5,000 Italy Buoni Poliennali Del Tesoro 1.30 15/05/2028 7,203 0.00%
2,150,000 Italy Buoni Poliennali Del Tesoro 0.40 15/05/2030 2,836,230 1.18%
1,685,000 Italy Buoni Poliennali Del Tesoro 2.55 15/09/2041 3,556,991 1.47%
232,150,000 Japan Government Thirty Year Bond 0.60 20/06/2050 2,230,524 0.92%
750,000,000 Japanese Government CPI Linked Bond 0.10 03/10/2026 7,403,304 3.07%
763,000,000 Japanese Government CPI Linked Bond 0.10 03/10/2027 7,553,075 3.13%
400,000 Mexican Bonos 8.50 31/05/2029 2,465,904 1.03%
814,400 Mexican Bonos 8.50 18/11/2038 5,105,963 2.12%
81,000,000 Republic of South Africa Government Bond 10.50 21/12/2026 6,561,275 2.72%
63,550,000 Republic of South Africa Government Bond 9.00 31/01/2040 3,857,519 1.60%
295,900,000 Russian Federal Bond - OFZ 7.65 04/10/2030 4,528,026 1.88%
390,000 Ukraine Government International Bond 7.75 09/01/2027 453,031 0.19%
5,100,000 United States Treasury Inflation Indexed Bonds 0.13 15/04/2025 5,523,174 2.29%
5,400,000 United States Treasury Inflation Indexed Bonds 0.25 15/07/2029 6,212,137 2.58%
4,000,000 United States Treasury Inflation Indexed Bonds 0.13 15/07/2030 4,548,550 1.89%
3,000,000 United States Treasury Note/Bond 1.38 31/01/2021 3,019,963 1.25%
2,500,000 United States Treasury Note/Bond 2.13 15/08/2021 2,550,890 1.06%
13,850,000 United States Treasury Note/Bond 1.50 31/10/2021 14,041,902 5.82%
11,162,700 United States Treasury Note/Bond 1.63 31/12/2021 11,330,141 4.70%
100,000 United States Treasury Note/Bond 1.75 31/07/2024 106,196 0.04%
4,600,000 United States Treasury Note/Bond 1.75 15/11/2029 4,976,792 2.06%
167,637,155 69.49%
Total Transferable Securities 208,305,157 86.35%

Jupiter Asset Management Series Plc Annual Report and Audited Financial Statements for the financial year ended 31 December 2020
Portfolio of Investments (continued) Merian Global Dynamic Bond Fund (continued)
91
Nominal Security Description
Value USD % of Net
Assets
Investment Funds - 5.98% (2019 - 5.52%)
351,532 Jupiter Asset Management Series Plc - Jupiter Emerging Market Debt Fund (UCITS) 4,187,625* 1.74%
569,827 Jupiter Asset Management Series Plc - Jupiter Financials Contingent Capital Fund (UCITS) 6,227,297* 2.58%
382,385 Jupiter Asset Management Series Plc - Jupiter Local Currency Emerging Market Debt Fund (UCITS) 4,017,452* 1.66%
14,432,374 5.98%
Total Investment Funds 14,432,374 5.98%
Futures - 0.01% (2019 - 0.12%)
Counterparty Nominal Security Description No of
Contracts Maturity
Date Unrealised
Gain USD
Bank of America Merrill Lynch 5,157,070 Euro-Bund Future 29 08/03/2021 12,445 0.01% Bank of America Merrill Lynch (7,961,977) US 10 Year Ultra Future (51) 22/03/2021 4,846 0.00% Bank of America Merrill Lynch (2,759,218) US Treasury Note (20) 22/03/2021 782 0.00% Bank of America Merrill Lynch (2,550,938) US Ultra Bond (CBT) (12) 22/03/2021 3,750 0.00%
21,823 0.01%
Swaps - 0.54% (2019 - 0.94%)
Barclays 1,450,000 IRS GBP/LIBOR/fixing 6M, R:GBP 1.099 25/07/2049 284,917 0.12%
Barclays 1,500,000 IRS GBP/LIBOR/fixing 6M, R:GBP 1.099 25/07/2049 294,741 0.12%
Barclays 3,864,000 CDX IG Credit Future Version 6 5 year 20/06/2025 353,576 0.15%
Goldman Sachs 3,933,000 CDX IG Credit Future Version 7 5 year 20/06/2025 359,890 0.15%
1,293,124 0.54%
Currency Exchange Contracts - 0.37% (2019 - 0.59%)
Actual Settle Date
Issue Currency
Currency Bought
Settle Currency
Currency Sold
Australia And New Zealand Banking Group 29/01/2021 EUR 3,750,000 USD 4,566,521 39,341 0.02%
Citibank 15/01/2021 AUD 3,262,981 USD 2,458,254 67,868 0.03%
Citibank 15/01/2021 EUR 10,270,323 USD 12,545,102 64,976 0.02%
Citibank 15/01/2021 USD 2,112 EUR 1,720 - 0.00%
Citibank 15/01/2021 USD 92,166 ZAR 1,349,377 428 0.00%
Citibank 15/01/2021 ZAR 46,194,123 USD 3,039,178 101,377 0.04%
Goldman Sachs 29/01/2021 EUR 1,950,000 USD 2,390,835 4,214 0.00%
Goldman Sachs 29/01/2021 JPY 186,609,960 USD 1,800,000 11,255 0.00%
Goldman Sachs 29/01/2021 SEK 20,837,702 EUR 2,050,000 34,160 0.01%
Goldman Sachs 29/01/2021 USD 1,115,042 RUB 82,000,000 21,723 0.01%
HSBC 29/01/2021 GBP 1,758,382 EUR 1,950,000 5,332 0.00%
*These amounts have been eliminated at a company level in the SOFP.

Jupiter Asset Management Series Plc Annual Report and Audited Financial Statements for the financial year ended 31 December 2020
Portfolio of Investments (continued) Merian Global Dynamic Bond Fund (continued)
92
Currency Exchange Contracts - 0.37% (2019 - 0.59%) (continued)
Counterparty Actual Settle Date
Issue Currency
Currency Bought
Settle Currency
Currency Sold
Unrealised Gain USD
% of Net Assets
HSBC 29/01/2021 INR 160,000,000 USD 2,166,466 17,694 0.01%
HSBC 29/01/2021 JPY 43,727,326 USD 423,683 739 0.00%
HSBC 29/01/2021 MXN 49,782,679 USD 2,459,046 36,759 0.02%
HSBC 29/01/2021 NOK 1,897,282 USD 213,792 8,869 0.00%
HSBC 29/01/2021 USD 1,111,897 MXN 22,150,000 1,434 0.00%
Societe Generale 29/01/2021 GBP 1,770,343 EUR 1,950,000 21,649 0.01%
Societe Generale 29/01/2021 INR 115,000,000 USD 1,555,462 14,403 0.01%
Societe Generale 29/01/2021 SEK 28,900,000 USD 3,461,413 78,057 0.03%
Toronto Dominion Bank 29/01/2021 AUD 5,594,314 USD 4,117,915 213,612 0.09%
Toronto Dominion Bank 29/01/2021 EUR 614,231 USD 747,415 7,002 0.00%
Toronto Dominion Bank 29/01/2021 NOK 29,446,667 EUR 2,800,000 16,746 0.01%
Toronto Dominion Bank 29/01/2021 SEK 17,161,636 USD 2,012,910 88,927 0.04%
Toronto Dominion Bank 29/01/2021 USD 1,873,751 MXN 37,352,509 1,124 0.00%
Toronto Dominion Bank 29/01/2021 ZAR 16,600,000 USD 1,082,059 44,434 0.02%
Unrealised Gain on Currency Exchange Contracts at 31 December 2020 902,123 0.37%
Value USD
Total Financial Derivatives Instruments 2,217,070 0.92%
Financial Assets at Fair Value Through Profit or Loss (Cost USD 205,319,438) (2019: USD 147,533,524) 224,954,601 93.25%
Futures - (0.09%) (2019 - (0.31%))
Counterparty Nominal Security Description No of
Contracts Maturity
Date Unrealised
Loss USD
Bank of America Merrill Lynch (10,563,025) Canada 10 Year Bond Future (71) 22/03/2021 (5,588) (0.00%) Bank of America Merrill Lynch (6,766,200) Euro Buxl 30 Year Bond (30) 08/03/2021 (117,826) (0.05%) Bank of America Merrill Lynch (8,788,975) Euro-Bobl Future (65) 08/03/2021 (14,759) (0.01%) Bank of America Merrill Lynch (760,050) Euro-BTP Future (5) 08/03/2021 (9,773) (0.00%) Bank of America Merrill Lynch (4,030,800) Euro-OAT Future (24) 08/03/2021 (5,425) (0.00%) Bank of America Merrill Lynch 1,670,295,000 Japan 10 Year Bond (OSE) 11 15/03/2021 (9,072) (0.00%) Bank of America Merrill Lynch (2,303,075) Long Gilt Future (17) 29/03/2021 (14,146) (0.01%) Bank of America Merrill Lynch 3,972,891 US Long Bond (CBT) 23 22/03/2021 (28,391) (0.01%) Bank of America Merrill Lynch (10,342,571) US Treasury Note (82) 31/03/2021 (17,617) (0.01%)
(222,597) (0.09%)

Jupiter Asset Management Series Plc Annual Report and Audited Financial Statements for the financial year ended 31 December 2020
Portfolio of Investments (continued) Merian Global Dynamic Bond Fund (continued)
93
Swaps - (0.61%) (2019 - (1.55%))
Counterparty Nominal Security Description Maturity
Date Unrealised
Loss USD % of Net
Assets
Barclays 5,014,000 CDX IG Credit Future Version 7 5 year 20/06/2025 (458,807) (0.19%)
Citibank 2,900,000 IRS GBP/LIBOR/fixing 6M, R:GBP 1.099 25/07/2049 (569,834) (0.24%)
Goldman Sachs 2,783,000 CDX IG Credit Future Version 9 5 year 20/06/2025 (254,659) (0.11%)
Goldman Sachs 5,000,000 CDX iTraxx Europe Crossover Series 34 Version 1 10Year 20/12/2030 (81,731) (0.03%)
HSBC 4,100,000 IRS GBP/LIBOR/fixing 6M, R:GBP 0.624 08/08/2024 (99,968) (0.04%)
(1,464,999) (0.61%)
Currency Exchange Contracts - (1.41%) (2019 - (0.88%))
Actual Settle Date
Issue Currency
Currency Bought
Settle Currency
Currency Sold
Citibank 15/01/2021 USD 63,829 AUD 83,977 (1,184) (0.00%)
Citibank 15/01/2021 USD 95,868 EUR 78,670 (725) (0.00%)
Citibank 15/01/2021 USD 41,264 ZAR 618,237 (770) (0.00%)
Citibank 15/01/2021 ZAR 452,396 USD 30,892 (137) (0.00%)
Goldman Sachs 29/01/2021 USD 4,472,384 GBP 3,350,000 (100,711) (0.04%)
Goldman Sachs 29/01/2021 USD 3,489,638 MXN 70,293,753 (34,590) (0.01%)
Goldman Sachs 29/01/2021 USD 4,798,078 SEK 40,000,000 (100,803) (0.04%)
HSBC 29/01/2021 BRL 14,850,000 USD 2,948,301 (90,403) (0.04%)
HSBC 29/01/2021 HUF 1,356,436,250 USD 4,595,027 (26,129) (0.01%)
HSBC 29/01/2021 USD 66,793,585 EUR 56,017,043 (2,006,789) (0.84%)
HSBC 29/01/2021 USD 4,379,218 HUF 1,327,718,880 (92,953) (0.04%)
HSBC 29/01/2021 USD 7,138,167 ZAR 109,431,397 (289,153) (0.13%)
Societe Generale 29/01/2021 USD 1,311,612 IDR 18,650,000,000 (26,674) (0.01%)
Societe Generale 29/01/2021 USD 6,764,126 SEK 57,200,000 (241,237) (0.11%)
Societe Generale 29/01/2021 USD 1,801,524 ZAR 27,022,207 (32,365) (0.01%)
Toronto Dominion Bank 29/01/2021 USD 4,400,404 CAD 5,723,621 (95,142) (0.04%)
Toronto Dominion Bank 29/01/2021 USD 261,327 CHF 236,732 (7,656) (0.00%)
Toronto Dominion Bank 29/01/2021 USD 3,557,758 GBP 2,666,499 (82,288) (0.03%)
Toronto Dominion Bank 29/01/2021 USD 14,615,361 JPY 1,522,381,671 (160,970) (0.06%)
Unrealised Loss on Currency Exchange Contracts at 31 December 2020 (3,390,679) (1.41%)
Value USD
Total Financial Derivatives Instruments (5,078,275) (2.11%)
Financial Liabilities at Fair Value Through Profit or Loss (Cost USD Nil) (2019: USD Nil) (5,078,275) (2.11%)
Cash at Bank 14,975,547 6.21%
Other Net Assets 6,384,474 2.65%
Net Assets Value as at 31 December 2020 241,236,347 100.00%

Jupiter Asset Management Series Plc Annual Report and Audited Financial Statements for the financial year ended 31 December 2020
Portfolio of Investments (continued) Merian Global Dynamic Bond Fund (continued)
94
Portfolio Analysis % of Total
Assets
Transferable securities admitted to official stock exchange listing 69.37%
Transferable securities dealt in on another regulated market 12.63%
UCITS 5.68%
Financial derivative instruments dealt in on a regulated market 0.01%
OTC financial derivative instruments 0.86%
Other current assets 11.45%
Total Assets 100.00%
The following securities have been pledged by the Sub-Fund as collateral in respect of Credit Default Swaps and Interest Rate Swaps:
Counterparty Stock Description Nominal Market Value
Goldman Sachs Deutsche Bundesrepublik Inflation Linked Bond 527,000 670,393
Morgan Stanley Deutsche Bundesrepublik Inflation Linked Bond 82,000 127,609

Jupiter Asset Management Series Plc Annual Report and Audited Financial Statements for the financial year ended 31 December 2020
Portfolio of Investments (continued) Jupiter Emerging Market Debt Fund
95
Nominal Security Description Coupon
Rate Maturity
Date Value USD % of Net
Assets
Corporate Bonds - 41.22% (2019 - 24.95%)
900,000 AES Gener SA 6.35 10/07/2079 1,009,197 1.06%
1,073,000 Banco Continental SAECA 2.75 12/10/2025 1,072,858 1.12%
1,000,000 Braskem Netherlands Finance BV 4.50 31/01/2030 1,048,660 1.10%
450,000 China SCE Group Holdings Ltd 7.00 05/02/2025 477,472 0.50%
562,200 Cometa Energia SA de CV 6.38 24/04/2035 664,631 0.69%
1,000,000 Corp Nacional del Cobre de Chile 4.50 08/01/2047 1,247,895 1.30%
912,000 DAE Sukuk Difc Ltd 3.75 15/02/2026 940,989 0.98%
600,000 Dar Al-Arkan Sukuk Co Ltd 6.88 04/10/2022 622,055 0.65%
650,000 DP World Salaam 6.00 01/01/2169 728,529 0.76%
800,000 Ecopetrol SA 5.88 28/05/2045 972,714 1.02%
900,000 Eskom Holdings SOC Ltd 5.75 26/01/2021 920,266 0.96%
540,000 FEL Energy VI Sarl 5.75 12/01/2040 573,254 0.60%
1,068,000 Gazprom PJSC via Gaz Finance PLC 4.60 26/01/2169 1,123,456 1.17%
1,000,000 Gtlk Europe Capital DAC 4.65 03/10/2027 1,055,318 1.10%
500,000 Hutama Karya Persero PT 3.75 05/11/2030 562,107 0.59%
400,000 Indonesia Asahan Aluminium Persero PT 6.76 15/11/2048 550,231 0.58%
900,000 Industrias Penoles SAB de CV 0.00 08/06/2050 1,064,340 1.11%
750,000 KazMunayGas National Co JSC 4.75 19/04/2027 878,713 0.92%
1,100,000 KazMunayGas National Co JSC 5.75 19/04/2047 1,488,080 1.56%
650,000 Minejesa Capital BV 5.63 08/10/2037 730,883 0.76%
700,000 NBK Tier 1 Financing Ltd 5.75 09/04/2021 716,056 0.75%
650,000 NBM US Holdings Inc 6.63 08/06/2029 764,355 0.80%
511,000 NWD Finance BVI Ltd 4.80 09/06/2169 515,812 0.54%
600,000 OCP SA 6.88 25/04/2044 794,690 0.83%
600,000 Oil and Gas Holding Co BSCC 7.63 11/07/2024 680,791 0.71%
300,000 Pertamina Persero PT 5.63 20/05/2043 372,820 0.40%
700,000 Pertamina Persero PT 6.50 11/07/2048 993,279 1.04%
715,000 Petrobras Global Finance BV 6.90 19/03/2049 923,593 0.97%
2,000,000 Petroleos de Venezuela SA 12.75 17/02/2022 80,160 0.08%
6,000,000 Petroleos de Venezuela SA 6.00 16/05/2024 238,966 0.25%
2,500,000 Petroleos de Venezuela SA 5.50 04/12/2037 98,950 0.10%
1,305,000 Petroleos Mexicanos 6.88 16/10/2025 1,449,061 1.51%
950,000 Petroleos Mexicanos 6.50 13/03/2027 1,020,622 1.07%
115,000 Petroleos Mexicanos 9.50 15/09/2027 132,782 0.14%
475,000 Petroleos Mexicanos 7.69 23/01/2050 493,999 0.52%
700,000 Petropavlovsk 2016 Ltd 8.13 14/11/2022 739,761 0.77%
500,000 Powerlong Real Estate Holdings Ltd 6.95 23/07/2023 538,405 0.56%
700,000 Qatar Reinsurance Co Ltd 4.95 13/09/2169 716,680 0.75%
500,000 Resorts World Las Vegas LLC / RWLV Capital Inc 4.63 16/04/2029 517,533 0.54%
1,000,000 Sasol Financing USA LLC 6.50 27/09/2028 1,105,312 1.16%
400,000 Saudi Arabian Oil Co 4.25 16/04/2039 471,769 0.49%
1,100,000 Sharjah Sukuk Program Ltd 3.23 23/10/2029 1,160,895 1.21%

Jupiter Asset Management Series Plc Annual Report and Audited Financial Statements for the financial year ended 31 December 2020
Portfolio of Investments (continued) Jupiter Emerging Market Debt Fund (continued)
96
Nominal Security Description Coupon
Rate Maturity
Date Value USD % of Net
Assets
Corporate Bonds - 41.22% (2019 - 24.95%) (continued)
200,000 Southern Gas Corridor CJSC 6.88 24/03/2026 245,882 0.26%
700,000 State Oil Co of the Azerbaijan Republic 6.95 18/03/2030 913,716 0.96%
375,000 State Savings Bank of Ukraine Via SSB #1 PLC 9.38 03/10/2023 405,891 0.42%
324,450 State Savings Bank of Ukraine Via SSB #1 PLC 9.63 20/03/2025 356,513 0.37%
500,000 TBC Bank JSC 5.75 19/06/2024 521,730 0.55%
1,100,000 TC Ziraat Bankasi AS 5.13 29/09/2023 1,116,318 1.17%
1,035,000 Turkiye Vakiflar Bankasi TAO 6.50 01/08/2026 1,065,338 1.11%
1,000,000 Ukreximbank Via Biz Finance PLC 9.75 22/01/2025 1,096,212 1.15%
800,000 Uzbek Industrial and Construction Bank ATB 5.75 12/02/2024 844,370 0.88%
800,000 YPF SA 6.95 21/07/2027 602,149 0.63%
39,426,058 41.22%
Government Security - 57.15% (2019 - 70.70%)
1,000,000 Angolan Government International Bond 8.25 05/09/2028 964,948 1.01%
500,000 Angolan Government International Bond 9.38 05/08/2048 475,192 0.50%
57,738 Argentine Republic Government International Bond 1.00 07/09/2029 25,366 0.03%
5,000,000 Argentine Republic Government International Bond 0.00 15/12/2035 19,500 0.02%
3,104,000 Argentine Republic Government International Bond 0.13 07/09/2046 1,144,578 1.20%
400,000 Bahrain Government International Bond 7.38 14/05/2030 479,725 0.50%
350,000 Bahrain Government International Bond 5.63 30/09/2031 376,611 0.39%
500,000 Bahrain Government International Bond 6.00 19/09/2044 526,392 0.55%
400,000 Banque Centrale de Tunisie International Bond 6.75 31/10/2023 473,433 0.49%
1,100,000 Benin Government International Bond 5.75 26/03/2026 1,489,373 1.56%
750,000 Brazilian Government International Bond 3.88 06/12/2030 791,721 0.83%
400,000 Colombia Government International Bond 6.13 18/01/2041 546,873 0.57%
500,000 Colombia Government International Bond 5.20 15/05/2049 636,140 0.67%
500,000 Costa Rica Government International Bond 6.13 19/02/2031 477,424 0.50%
200,000 Development Bank of Mongolia LLC 7.25 23/10/2023 219,525 0.23%
750,000 Development Bank of the Republic of Belarus JSC 6.75 05/02/2024 771,769 0.81%
500,000 Dominican Republic International Bond 4.88 23/09/2032 562,698 0.59%
1,000,000 Dominican Republic International Bond 7.45 30/04/2044 1,301,217 1.36%
1,000,000 Dominican Republic International Bond 6.85 27/01/2045 1,250,073 1.31%
714,425 Ecuador Government International Bond 0.50 31/07/2035 390,831 0.41%
1,000,000 Ecuador Government International Bond 0.50 31/07/2040 509,937 0.53%
930,000 Egypt Government International Bond 7.60 03/01/2029 1,095,314 1.15%
800,000 Egypt Government International Bond 7.63 29/05/2032 912,677 0.95%
900,000 Egypt Government International Bond 8.70 03/01/2049 1,068,538 1.12%
8,000,000 Egypt Treasury Bills 0.00 19/01/2021 505,792 0.53%
8,000,000 Egypt Treasury Bills 0.00 01/12/2021 507,040 0.53%
900,000 Ghana Government International Bond 8.13 26/03/2032 967,394 1.01%
700,000 Ghana Government International Bond 8.63 16/06/2049 719,239 0.75%
750,000 Guatemala Government Bond 5.38 24/04/2032 922,811 0.96%
500,000 Honduras Government International Bond 6.25 19/01/2027 594,579 0.62%
417,000 Istanbul Metropolitan Municipality 6.38 12/09/2025 428,050 0.45%
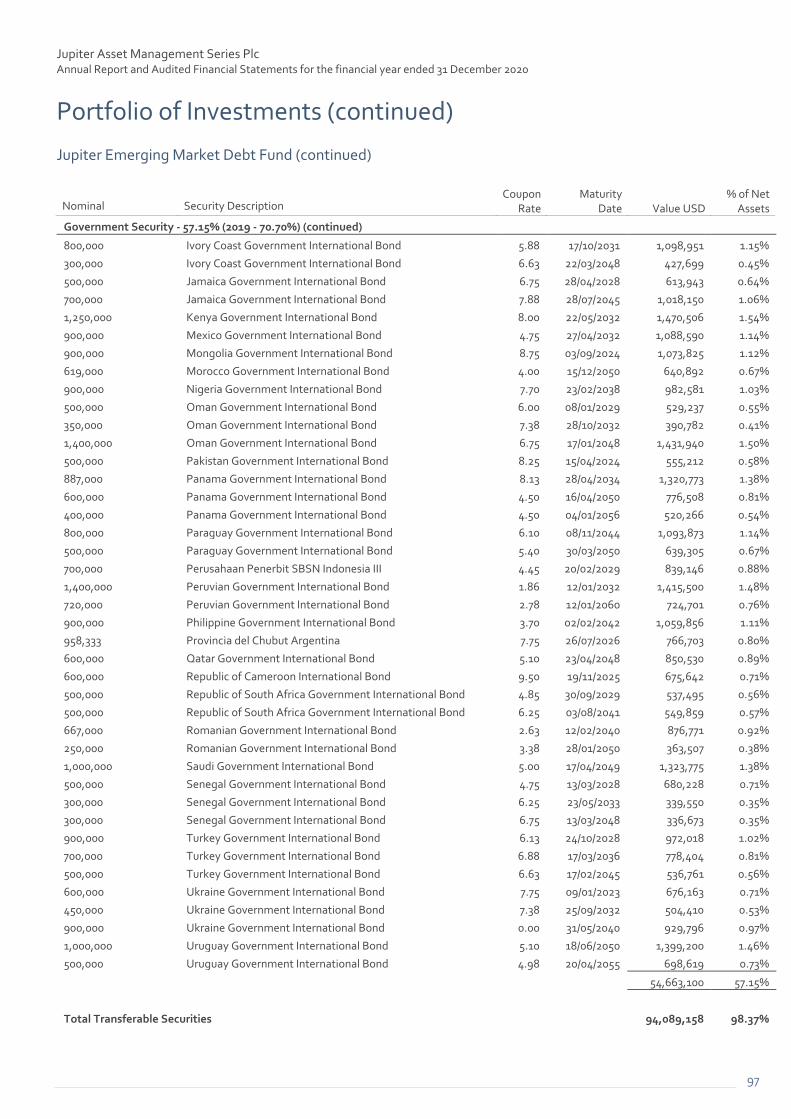
Jupiter Asset Management Series Plc Annual Report and Audited Financial Statements for the financial year ended 31 December 2020
Portfolio of Investments (continued) Jupiter Emerging Market Debt Fund (continued)
97
Nominal Security Description Coupon
Rate Maturity
Date Value USD % of Net
Assets
Government Security - 57.15% (2019 - 70.70%) (continued)
800,000 Ivory Coast Government International Bond 5.88 17/10/2031 1,098,951 1.15%
300,000 Ivory Coast Government International Bond 6.63 22/03/2048 427,699 0.45%
500,000 Jamaica Government International Bond 6.75 28/04/2028 613,943 0.64%
700,000 Jamaica Government International Bond 7.88 28/07/2045 1,018,150 1.06%
1,250,000 Kenya Government International Bond 8.00 22/05/2032 1,470,506 1.54%
900,000 Mexico Government International Bond 4.75 27/04/2032 1,088,590 1.14%
900,000 Mongolia Government International Bond 8.75 03/09/2024 1,073,825 1.12%
619,000 Morocco Government International Bond 4.00 15/12/2050 640,892 0.67%
900,000 Nigeria Government International Bond 7.70 23/02/2038 982,581 1.03%
500,000 Oman Government International Bond 6.00 08/01/2029 529,237 0.55%
350,000 Oman Government International Bond 7.38 28/10/2032 390,782 0.41%
1,400,000 Oman Government International Bond 6.75 17/01/2048 1,431,940 1.50%
500,000 Pakistan Government International Bond 8.25 15/04/2024 555,212 0.58%
887,000 Panama Government International Bond 8.13 28/04/2034 1,320,773 1.38%
600,000 Panama Government International Bond 4.50 16/04/2050 776,508 0.81%
400,000 Panama Government International Bond 4.50 04/01/2056 520,266 0.54%
800,000 Paraguay Government International Bond 6.10 08/11/2044 1,093,873 1.14%
500,000 Paraguay Government International Bond 5.40 30/03/2050 639,305 0.67%
700,000 Perusahaan Penerbit SBSN Indonesia III 4.45 20/02/2029 839,146 0.88%
1,400,000 Peruvian Government International Bond 1.86 12/01/2032 1,415,500 1.48%
720,000 Peruvian Government International Bond 2.78 12/01/2060 724,701 0.76%
900,000 Philippine Government International Bond 3.70 02/02/2042 1,059,856 1.11%
958,333 Provincia del Chubut Argentina 7.75 26/07/2026 766,703 0.80%
600,000 Qatar Government International Bond 5.10 23/04/2048 850,530 0.89%
600,000 Republic of Cameroon International Bond 9.50 19/11/2025 675,642 0.71%
500,000 Republic of South Africa Government International Bond 4.85 30/09/2029 537,495 0.56%
500,000 Republic of South Africa Government International Bond 6.25 03/08/2041 549,859 0.57%
667,000 Romanian Government International Bond 2.63 12/02/2040 876,771 0.92%
250,000 Romanian Government International Bond 3.38 28/01/2050 363,507 0.38%
1,000,000 Saudi Government International Bond 5.00 17/04/2049 1,323,775 1.38%
500,000 Senegal Government International Bond 4.75 13/03/2028 680,228 0.71%
300,000 Senegal Government International Bond 6.25 23/05/2033 339,550 0.35%
300,000 Senegal Government International Bond 6.75 13/03/2048 336,673 0.35%
900,000 Turkey Government International Bond 6.13 24/10/2028 972,018 1.02%
700,000 Turkey Government International Bond 6.88 17/03/2036 778,404 0.81%
500,000 Turkey Government International Bond 6.63 17/02/2045 536,761 0.56%
600,000 Ukraine Government International Bond 7.75 09/01/2023 676,163 0.71%
450,000 Ukraine Government International Bond 7.38 25/09/2032 504,410 0.53%
900,000 Ukraine Government International Bond 0.00 31/05/2040 929,796 0.97%
1,000,000 Uruguay Government International Bond 5.10 18/06/2050 1,399,200 1.46%
500,000 Uruguay Government International Bond 4.98 20/04/2055 698,619 0.73%
54,663,100 57.15%
Total Transferable Securities 94,089,158 98.37%

Jupiter Asset Management Series Plc Annual Report and Audited Financial Statements for the financial year ended 31 December 2020
Portfolio of Investments (continued) Jupiter Emerging Market Debt Fund (continued)
98
Currency Exchange Contracts - 0.21% (2019 - 0.12%)
Counterparty Actual Settle Date
Issue Currency
Currency Bought
Settle Currency
Currency Sold
Unrealised Gain USD
% of Net Assets
Canadian Imperial Bank 29/01/2021 EUR 55,267 USD 66,702 1,179 0.00%
Citibank 15/01/2021 EUR 5,701,566 USD 6,921,325 79,155 0.08%
Citibank 15/01/2021 SEK 1,839,962 USD 217,399 7,908 0.01%
Citibank 15/01/2021 SGD 308,963 USD 231,105 2,712 0.00%
Citibank 15/01/2021 ZAR 6,618,326 USD 435,396 14,558 0.01%
Goldman Sachs 26/02/2021 RUB 52,000,000 USD 681,079 10,105 0.01%
Goldman Sachs 26/02/2021 USD 707,196 RUB 52,000,000 16,113 0.02%
Goldman Sachs 29/01/2021 MXN 9,200,000 USD 456,319 4,914 0.01%
HSBC 26/02/2021 BRL 2,400,000 USD 445,923 15,633 0.02%
HSBC 26/02/2021 IDR 7,000,000,000 USD 493,479 7,931 0.01%
HSBC 26/02/2021 INR 68,000,000 USD 903,474 22,142 0.02%
Morgan Stanley 26/02/2021 CLP 350,000,000 USD 484,489 7,961 0.01%
Morgan Stanley 29/01/2021 EUR 611,546 USD 743,677 7,442 0.01%
Unrealised Gain on Currency Exchange Contracts at 31 December 2020 197,753 0.21%
Value USD
Total Financial Derivatives Instruments 197,753 0.21%
Financial Assets at Fair Value Through Profit or Loss (Cost USD 90,032,245) (2019: USD 114,978,818) 94,286,911 98.58%
Currency Exchange Contracts - (0.20%) (2019 - (0.02%))
Counterparty Actual Settle Date
Issue Currency
Currency Bought
Settle Currency
Currency Sold
Unrealised Loss USD
Canadian Imperial Bank 29/01/2021 USD 354,747 EUR 297,009 (10,042) (0.01%)
Citibank 15/01/2021 USD 6,655 EUR 5,421 (1) (0.00%)
Citibank 15/01/2021 USD 37,743 SGD 50,000 (96) (0.00%)
Citibank 15/01/2021 ZAR 90,303 USD 6,173 (35) (0.00%)
Goldman Sachs 26/02/2021 BRL 2,500,000 USD 492,941 (12,154) (0.01%)
Goldman Sachs 26/02/2021 USD 447,261 BRL 2,400,000 (14,311) (0.01%)
Goldman Sachs 28/01/2021 USD 1,031,324 HKD 8,000,000 (700) (0.00%)
HSBC 29/01/2021 USD 5,087,063 EUR 4,266,312 (152,839) (0.17%)
HSBC 29/01/2021 USD 456,942 MXN 9,200,000 (4,307) (0.00%)
Unrealised Loss on Currency Exchange Contracts at 31 December 2020 (194,485) (0.20%)
Value USD
Total Financial Derivatives Instruments (194,485) (0.20%)
Financial Liabilities at Fair Value Through Profit or Loss (Cost USD Nil) (2019: USD Nil) (194,485) (0.20%)
Cash at Bank 2,409,975 2.52%
Other Net Liabilities (852,771) (0.90%)
Net Assets Value as at 31 December 2020 95,649,630 100.00%

Jupiter Asset Management Series Plc Annual Report and Audited Financial Statements for the financial year ended 31 December 2020
Portfolio of Investments (continued) Jupiter Emerging Market Debt Fund (continued)
99
Portfolio Analysis % of Total
Assets
Transferable securities admitted to official stock exchange listing 90.46%
Transferable securities dealt in on another regulated market 6.65%
OTC financial derivative instruments 0.20%
Other current assets 2.69%
Total Assets 100.00%

Jupiter Asset Management Series Plc Annual Report and Audited Financial Statements for the financial year ended 31 December 2020
Portfolio of Investments (continued) Jupiter Global Emerging Markets Focus Fund
100
Nominal Security Description Value USD % of Net
Assets
Common Stock
Basic Materials - 3.31% (2019 - 1.36%)
113,023 Asian Paints Ltd 4,272,004 2.13%
2,124,600 TOA Paint Thailand PCL 2,375,649 1.18%
6,647,653 3.31%
Communications - 17.88% (2019 - 18.43%)
46,764 Alibaba Group Holding Ltd (DR) 11,148,070 5.55%
4,583 MercadoLibre Inc 7,850,404 3.91%
9,002,100 My EG Services Bhd 4,296,845 2.14%
173,561 Tencent Holdings Ltd 12,626,625 6.28%
35,921,944 17.88%
Consumer, Cyclical - 7.91% (2019 - 9.09%)
18,696,700 Ace Hardware Indonesia Tbk PT 2,282,055 1.14%
600,540 ANTA Sports Products Ltd 9,520,283 4.74%
3,512,545 JNBY Design Ltd 4,077,749 2.03%
15,880,087 7.91%
Consumer, Non-cyclical - 14.91% (2019 - 16.23%)
21,855 Kweichow Moutai Co Ltd 6,677,012 3.32%
3,513 LG Household & Health Care Ltd 5,238,962 2.61%
662,538 Localiza Rent a Car SA 8,794,789 4.37%
3,107,000 Union Medical Healthcare Ltd 2,424,670 1.21%
1,077,489 YDUQS Participacoes SA 6,828,936 3.40%
29,964,369 14.91%
Diversified - 0.32% (2019 - 0.74%)
98,212 Inversiones La Construccion SA 649,466 0.32%
649,466 0.32%
Financial - 25.83% (2019 - 32.94%)
73,489 Bajaj Finance Ltd 5,315,623 2.65%
2,477,300 Bank Central Asia Tbk PT 5,968,075 2.97%
304,335 Bank of Georgia Group PLC 5,063,195 2.52%
16,116 Credicorp Ltd 2,637,383 1.31%
162,642 HDFC Bank Ltd (DR) 11,710,224 5.83%
1,845,745 Odontoprev SA 5,170,292 2.57%
724,882 Ping An Insurance Group Co of China Ltd 8,882,740 4.42%
4,206,186 Transaction Capital Ltd 7,149,789 3.56%
51,897,321 25.83%
Industrial - 7.70% (2019 - 3.19%)
104,043 L&T Technology Services Ltd 3,329,190 1.66%
750,000 Sinbon Electronics Co Ltd 5,765,580 2.87%
446,500 Techtronic Industries Co Ltd 6,369,900 3.17%
15,464,670 7.70%
Technology - 21.16% (2019 - 15.17%)
453,937 Advantech Co Ltd 5,654,466 2.81%
34,000 ASPEED Technology Inc 2,075,253 1.03%

Jupiter Asset Management Series Plc Annual Report and Audited Financial Statements for the financial year ended 31 December 2020
Portfolio of Investments (continued) Jupiter Global Emerging Markets Focus Fund (continued)
101
Nominal Security Description Value USD % of Net
Assets
Common Stock (continued)
Technology - 21.16% (2019 - 15.17%) (continued)
9,269 Globant SA 2,019,530 1.01%
327,123 Infosys Ltd (DR) 5,538,192 2.77%
47,000 Parade Technologies Ltd 1,856,730 0.92%
133,180 Samsung Electronics Co Ltd 9,930,615 4.94%
141,745 Taiwan Semiconductor Manufacturing Co Ltd (DR) 15,436,031 7.68%
42,510,817 21.16%
Total Common Stock 198,936,327 99.02%
Total Transferable Securities 198,936,327 99.02%
Financial Assets at Fair Value Through Profit or Loss (Cost USD 138,279,321) (2019: USD 124,555,620) 198,936,327 99.02%
Cash at Bank 2,015,182 1.00%
Other Net Liabilities (40,170) (0.02%)
Net Assets Value as at 31 December 2020 200,911,339 100.00%
Portfolio Analysis % of Total
Assets
Transferable securities admitted to official stock exchange listing 97.86%
Other current assets 2.14%
Total Assets 100.00%

Jupiter Asset Management Series Plc Annual Report and Audited Financial Statements for the financial year ended 31 December 2020
Portfolio of Investments (continued) Merian Asian Equity Income Fund
102
Nominal Security Description Value USD % of Net
Assets
Common Stock
Basic Materials - 7.93% (2019 - 6.66%)
111,766 Alumina Ltd 158,750 0.66%
16,918 BHP Group Ltd 555,637 2.31%
25,275 Castrol India Ltd 42,418 0.18%
29,500 Chifeng Jilong Gold Mining Co Ltd 80,789 0.34%
1,557 Dongkuk Steel Mill Co Ltd 11,638 0.05%
5,009 Fortescue Metals Group Ltd 90,843 0.38%
4,528 Hyundai Steel Co 165,065 0.69%
12,971 Iluka Resources Ltd 65,161 0.27%
6,306 Jindal Steel & Power Ltd 23,006 0.09%
37,600 Kingfa Sci & Tech Co Ltd 98,545 0.40%
334,155 Mount Gibson Iron Ltd 237,960 0.99%
32,000 Nine Dragons Paper Holdings Ltd 45,404 0.19%
27,700 Perseus Mining Ltd 27,874 0.12%
2,319 Rio Tinto Ltd 204,327 0.85%
8,195 Tata Steel Ltd 72,033 0.30%
24,000 Zijin Mining Group Co Ltd 27,181 0.11%
1,906,631 7.93%
Communications - 17.85% (2019 - 9.27%)
6,400 Alibaba Group Holding Ltd (DR) 1,525,696 6.35%
3,800 China Literature Ltd 29,826 0.12%
5,605 JD.com Inc (DR) 501,760 2.09%
11,800 Meituan 448,405 1.87%
84 NAVER Corp 22,618 0.09%
400 Pinduoduo Inc (DR) 71,644 0.30%
8,450 PLDT Inc 235,779 0.98%
4,000 Sohu.com Ltd (DR) 64,440 0.27%
141,700 Telekom Malaysia Bhd 190,578 0.79%
16,500 Tencent Holdings Ltd 1,200,381 4.99%
4,291,127 17.85%
Consumer, Cyclical - 9.39% (2019 - 5.87%)
8,212 Apollo Tyres Ltd 20,008 0.08%
1,917 Breville Group Ltd 37,942 0.16%
7,500 BYD Co Ltd 196,581 0.82%
315,000 China Dongxiang Group Co Ltd 32,912 0.14%
694 China Tourism Group Duty Free Corp Ltd 29,973 0.12%
144,000 Chow Sang Sang Holdings International Ltd 163,456 0.68%
1,625 Coway Co Ltd 108,753 0.45%
495 Domino's Pizza Enterprises Ltd 33,212 0.14%
778 E-MART Inc 108,504 0.45%
107,700 Genting Singapore Ltd 69,279 0.29%
38,000 Great Wall Motor Co Ltd 130,383 0.54%

Jupiter Asset Management Series Plc Annual Report and Audited Financial Statements for the financial year ended 31 December 2020
Portfolio of Investments (continued) Merian Asian Equity Income Fund (continued)
103
Nominal Security Description Value USD % of Net
Assets
Common Stock (continued)
Consumer, Cyclical - 9.39% (2019 - 5.87%) (continued)
2,657 Hankook Tire & Technology Co Ltd 96,370 0.40%
52,135 Harvey Norman Holdings Ltd 189,265 0.79%
6,400 Jardine Cycle & Carriage Ltd 94,687 0.39%
2,905 Kia Motors Corp 166,872 0.69%
2,712 LOTTE Himart Co Ltd 77,768 0.32%
59,000 Luk Fook Holdings International Ltd 142,315 0.59%
5,500 NIO Inc (DR) 266,090 1.11%
203 Page Industries Ltd 76,676 0.32%
108,100 Sime Darby Bhd 62,079 0.26%
5,000 Sinotruk Hong Kong Ltd 12,770 0.05%
6,600 Suning.com Co Ltd 7,781 0.03%
9,318 Tata Motors Ltd 23,407 0.10%
25,699 Weifu High-Technology Group Co Ltd 91,128 0.38%
10,000 Yadea Group Holdings Ltd 20,664 0.09%
2,258,875 9.39%
Consumer, Non-cyclical - 6.09% (2019 - 9.00%)
3,271 Ansell Ltd 88,060 0.37%
18,904 Carabao Group PCL 72,247 0.30%
69,000 China Medical System Holdings Ltd 77,077 0.32%
13,179 Cipla Ltd/India 147,730 0.61%
267 CSL Ltd 58,525 0.24%
4,100 Da An Gene Co Ltd of Sun Yat-Sen University 21,504 0.10%
365 Dr Reddy's Laboratories Ltd 26,031 0.11%
6,949 Fisher & Paykel Healthcare Corp Ltd 165,840 0.69%
5,145 Glenmark Pharmaceuticals Ltd 34,688 0.14%
5,500 Hengan International Group Co Ltd 38,949 0.16%
135,200 Hutchison Port Holdings Trust 26,770 0.11%
8,200 Jiangsu Yuyue Medical Equipment & Supply Co Ltd 35,371 0.15%
3,398 JiuGui Liquor Co Ltd 81,316 0.34%
74,699 Jointown Pharmaceutical Group Co Ltd 207,428 0.86%
2,800 Livzon Pharmaceutical Group Inc 10,853 0.05%
1,332 Lotte Corp 43,284 0.18%
55 Seegene Inc 9,772 0.04%
2,667 Tata Consumer Products Ltd 21,544 0.09%
482,600 Thai Union Group PCL 219,072 0.91%
73,500 Zhou Hei Ya International Holdings Co Ltd 78,122 0.32%
1,464,183 6.09%
Energy - 1.90% (2019 - 6.26%)
157,000 China Coal Energy Co Ltd 47,186 0.20%
12,200 LONGi Green Energy Technology Co Ltd 171,999 0.72%
14,183 Oil & Natural Gas Corp Ltd 18,067 0.07%
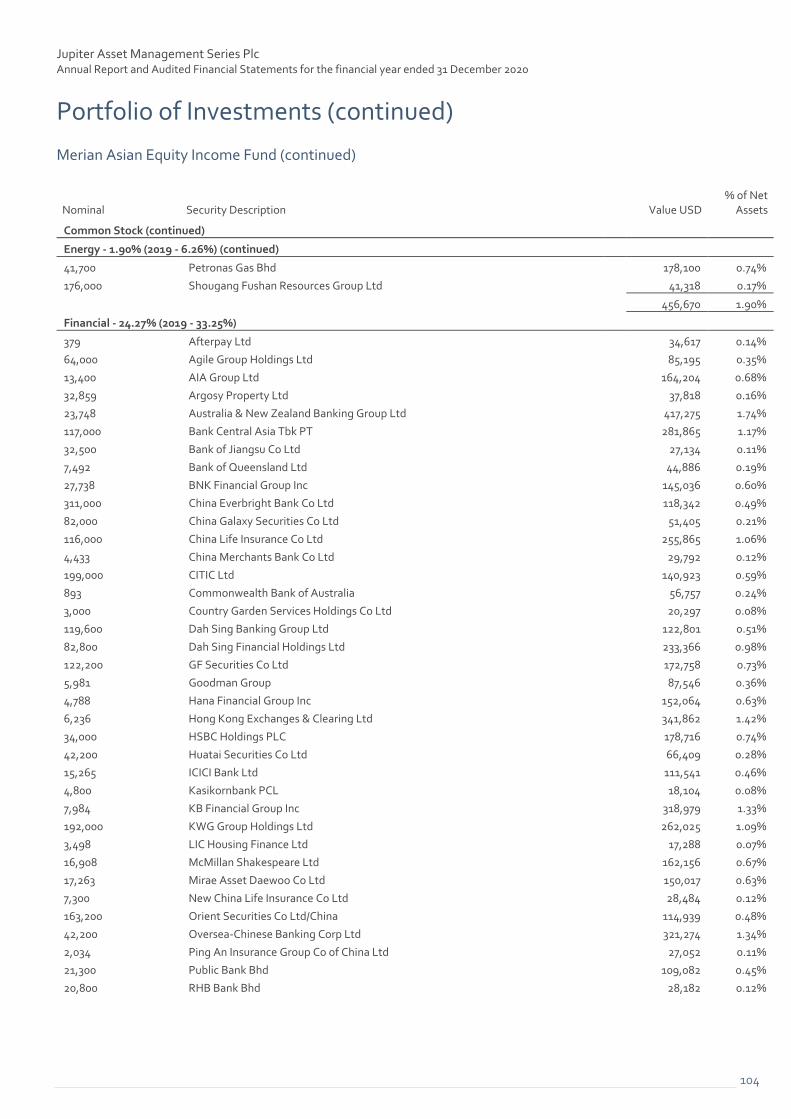
Jupiter Asset Management Series Plc Annual Report and Audited Financial Statements for the financial year ended 31 December 2020
Portfolio of Investments (continued) Merian Asian Equity Income Fund (continued)
104
Nominal Security Description Value USD % of Net
Assets
Common Stock (continued)
Energy - 1.90% (2019 - 6.26%) (continued)
41,700 Petronas Gas Bhd 178,100 0.74%
176,000 Shougang Fushan Resources Group Ltd 41,318 0.17%
456,670 1.90%
Financial - 24.27% (2019 - 33.25%)
379 Afterpay Ltd 34,617 0.14%
64,000 Agile Group Holdings Ltd 85,195 0.35%
13,400 AIA Group Ltd 164,204 0.68%
32,859 Argosy Property Ltd 37,818 0.16%
23,748 Australia & New Zealand Banking Group Ltd 417,275 1.74%
117,000 Bank Central Asia Tbk PT 281,865 1.17%
32,500 Bank of Jiangsu Co Ltd 27,134 0.11%
7,492 Bank of Queensland Ltd 44,886 0.19%
27,738 BNK Financial Group Inc 145,036 0.60%
311,000 China Everbright Bank Co Ltd 118,342 0.49%
82,000 China Galaxy Securities Co Ltd 51,405 0.21%
116,000 China Life Insurance Co Ltd 255,865 1.06%
4,433 China Merchants Bank Co Ltd 29,792 0.12%
199,000 CITIC Ltd 140,923 0.59%
893 Commonwealth Bank of Australia 56,757 0.24%
3,000 Country Garden Services Holdings Co Ltd 20,297 0.08%
119,600 Dah Sing Banking Group Ltd 122,801 0.51%
82,800 Dah Sing Financial Holdings Ltd 233,366 0.98%
122,200 GF Securities Co Ltd 172,758 0.73%
5,981 Goodman Group 87,546 0.36%
4,788 Hana Financial Group Inc 152,064 0.63%
6,236 Hong Kong Exchanges & Clearing Ltd 341,862 1.42%
34,000 HSBC Holdings PLC 178,716 0.74%
42,200 Huatai Securities Co Ltd 66,409 0.28%
15,265 ICICI Bank Ltd 111,541 0.46%
4,800 Kasikornbank PCL 18,104 0.08%
7,984 KB Financial Group Inc 318,979 1.33%
192,000 KWG Group Holdings Ltd 262,025 1.09%
3,498 LIC Housing Finance Ltd 17,288 0.07%
16,908 McMillan Shakespeare Ltd 162,156 0.67%
17,263 Mirae Asset Daewoo Co Ltd 150,017 0.63%
7,300 New China Life Insurance Co Ltd 28,484 0.12%
163,200 Orient Securities Co Ltd/China 114,939 0.48%
42,200 Oversea-Chinese Banking Corp Ltd 321,274 1.34%
2,034 Ping An Insurance Group Co of China Ltd 27,052 0.11%
21,300 Public Bank Bhd 109,082 0.45%
20,800 RHB Bank Bhd 28,182 0.12%

Jupiter Asset Management Series Plc Annual Report and Audited Financial Statements for the financial year ended 31 December 2020
Portfolio of Investments (continued) Merian Asian Equity Income Fund (continued)
105
Nominal Security Description Value USD % of Net
Assets
Common Stock (continued)
Financial - 24.27% (2019 - 33.25%) (continued)
83,000 Shanghai Industrial Holdings Ltd 113,485 0.47%
39,820 Suncorp Group Ltd 300,213 1.25%
17,300 United Overseas Bank Ltd 295,752 1.23%
5,885 Westpac Banking Corp 88,236 0.37%
118,400 Yanlord Land Group Ltd 100,354 0.42%
5,834,096 24.27%
Industrial - 8.14% (2019 - 6.60%)
13,569 Bharat Electronics Ltd 22,391 0.09%
20,000 China High Speed Transmission Equipment Group Co Ltd 19,606 0.08%
118,000 China National Building Material Co Ltd 141,858 0.59%
178,000 China Resources Cement Holdings Ltd 198,836 0.83%
24,800 Dongfang Electric Corp Ltd 37,808 0.16%
1,179 Escorts Ltd 20,491 0.09%
28,000 Evergreen Marine Corp Taiwan Ltd 40,558 0.17%
39,993 GoerTek Inc 228,224 0.95%
25,000 Goldsun Building Materials Co Ltd 22,244 0.09%
72,500 Hana Microelectronics PCL 96,191 0.40%
4,671 HMM Co Ltd 59,984 0.25%
8,262 India Cements Ltd 19,090 0.08%
11,500 Johnson Electric Holdings Ltd 28,481 0.11%
54,786 KCE Electronics PCL 75,889 0.32%
12,700 Kossan Rubber Industries 14,208 0.06%
4,200 Lens Technology Co Ltd 19,658 0.08%
308,000 Lonking Holdings Ltd 95,349 0.40%
1,145 LS Corp 75,259 0.31%
1,210 Luxshare Precision Industry Co Ltd 10,383 0.04%
8,000 Pixart Imaging Inc 54,666 0.23%
4 Samsung Electro-Mechanics Co Ltd 655 0.00%
7,798 SF Holding Co Ltd 105,205 0.44%
210,000 Shanghai Electric Group Co Ltd 64,469 0.27%
97,000 Sinotrans Ltd 35,284 0.15%
55,000 SITC International Holdings Co Ltd 118,761 0.49%
12,392 Supermax Corp Bhd 18,515 0.08%
7,500 Techtronic Industries Co Ltd 106,997 0.45%
647,700 TPI Polene PCL 39,779 0.16%
143 UltraTech Cement Ltd 10,326 0.04%
14,000 U-Ming Marine Transport Corp 18,386 0.08%
300 Venture Corp Ltd 4,409 0.02%
126,600 Zoomlion Heavy Industry Science and Technology Co Ltd 151,870 0.63%
1,955,830 8.14%
Technology - 18.58% (2019 - 17.74%)
177,000 Acer Inc 148,982 0.62%
7,000 ASE Technology Holding Co Ltd 20,254 0.08%

Jupiter Asset Management Series Plc Annual Report and Audited Financial Statements for the financial year ended 31 December 2020
Portfolio of Investments (continued) Merian Asian Equity Income Fund (continued)
106
Nominal Security Description Value USD % of Net
Assets
Common Stock (continued)
Technology - 18.58% (2019 - 17.74%) (continued)
10,953 HCL Technologies Ltd 141,733 0.59%
18,488 Infosys Ltd 317,365 1.32%
13,000 MediaTek Inc 345,614 1.44%
1,796 Mphasis Ltd 37,847 0.16%
3,108 NetDragon Websoft Holdings Ltd 6,968 0.03%
24,000 Novatek Microelectronics Corp 315,185 1.31%
16,000 Quanta Computer Inc 46,068 0.19%
19,000 Realtek Semiconductor Corp 264,060 1.10%
9,680 Samsung Electronics Co Ltd 721,793 3.00%
68,337 Taiwan Semiconductor Manufacturing Co Ltd 1,289,020 5.36%
9,392 Tata Consultancy Services Ltd 368,197 1.53%
2,237 Tech Mahindra Ltd 29,796 0.13%
212,000 United Microelectronics Corp 355,751 1.48%
10,000 Vanguard International Semiconductor Corp 41,284 0.17%
3,382 Wipro Ltd 17,868 0.07%
4,467,785 18.58%
Utilities - 0.73% (2019 - 3.58%)
11,000 China Longyuan Power Group Corp Ltd 11,025 0.05%
10,000 China Resources Power Holdings Co Ltd 10,771 0.04%
65,500 Gulf Energy Development PCL 74,879 0.31%
352,192 Malakoff Corp Bhd 78,362 0.33%
175,037 0.73%
Total Common Stock 22,810,234 94.88%
Preferred Stock
Technology - 0.74% (2019 - 0.52%)
2,625 Samsung Electronics Co Ltd 177,852 0.74%
177,852 0.74%
Total Transferable Securities 22,988,086 95.62%
Futures - 0.04% (2019 - 0.01%)
Counterparty Nominal Security Description No of
Contracts Maturity
Date Unrealised
Gain USD
Bank of America Merrill Lynch 1,117,913 S&P 500 Emini Index Future 6 19/03/2021 10,118 0.04%
10,118 0.04%
Value USD
Total Financial Derivatives Instruments 10,118 0.04%

Jupiter Asset Management Series Plc Annual Report and Audited Financial Statements for the financial year ended 31 December 2020
Portfolio of Investments (continued) Merian Asian Equity Income Fund (continued)
107
Value USD % of Net
Assets Financial Assets at Fair Value Through Profit or Loss (Cost USD 18,279,447) (2019: USD 127,956,712) 22,998,204 95.66%
Cash at Bank 1,500,962 6.24%
Other Net Liabilities (458,518) (1.90%)
Net Assets Value as at 31 December 2020 24,040,648 100.00%
Portfolio Analysis % of Total
Assets
Transferable securities admitted to official stock exchange listing 92.74%
Financial derivative instruments dealt in on a regulated market 0.04%
Other current assets 7.22%
Total Assets 100.00%

Jupiter Asset Management Series Plc Annual Report and Audited Financial Statements for the financial year ended 31 December 2020
Portfolio of Investments (continued) Jupiter Local Currency Emerging Market Debt Fund
108
Nominal Security Description Coupon
Rate Maturity
Date Value USD % of Net
Assets
Corporate Bonds - 6.33% (2019 - 3.09%)
1,000,000 AES Gener SA 7.13 26/03/2079 1,147,998 0.75%
280,000,000 Development Bank of Kazakhstan JSC 8.95 05/04/2023 669,879 0.44%
800,000 DP World Salaam 6.00 01/01/2169 896,651 0.58%
15,000,000 European Bank for Reconstruction & Development 10.00 13/10/2021 1,985,925 1.29%
10,000,000 First Abu Dhabi Bank PJSC 3.40 18/08/2025 1,554,552 1.01%
191,400 Petroleos Mexicanos 7.65 24/11/2021 971,857 0.64%
947,000 Petroleos Mexicanos 6.88 16/10/2025 1,051,541 0.68%
336,500 Petroleos Mexicanos 7.47 11/12/2026 1,444,594 0.94%
9,722,997 6.33%
Government Security - 90.34% (2019 - 90.98%)
20,000,000 Agricultural Development Bank of China 2.85 08/11/2025 3,077,643 2.00%
2,848,000,000 Bogota Distrito Capital 9.75 26/07/2028 993,268 0.65%
1,100,000,000 Bonos de la Tesoreria de la Republica en pesos 2.80 10/01/2033 1,502,493 0.98%
525,000,000 Bonos de la Tesoreria de la Republica en pesos 5.00 03/01/2035 910,269 0.59%
9,000 Brazil Letras do Tesouro Nacional 0.00 07/01/2023 1,538,457 1.00%
4,629 Brazil Letras do Tesouro Nacional 0.00 01/01/2024 767,850 0.50%
14,000 Brazil Notas do Tesouro Nacional Serie F 10.00 01/01/2023 3,105,905 2.03%
22,170 Brazil Notas do Tesouro Nacional Serie F 10.00 01/01/2025 4,938,717 3.21%
13,873 Brazil Notas do Tesouro Nacional Serie F 10.00 01/01/2027 3,152,241 2.05%
8,000,000 China Development Bank 3.23 27/11/2025 1,237,273 0.80%
11,000,000 China Government Bond 2.20 27/07/2025 1,675,616 1.09%
2,000,000,000 Colombian TES 7.00 05/04/2022 647,510 0.42%
5,100,000,000 Colombian TES 10.00 24/07/2024 1,876,148 1.22%
5,600,000,000 Colombian TES 5.75 11/03/2027 1,741,970 1.13%
2,600,000,000 Colombian TES 6.00 28/04/2028 842,830 0.55%
6,043,000,000 Colombian TES 7.75 18/09/2030 2,112,246 1.37%
4,000,000,000 Colombian TES 7.25 18/10/2034 1,324,294 0.86%
69,000,000 Czech Republic Government Bond 2.40 17/09/2025 3,498,414 2.28%
12,000,000 Czech Republic Government Bond 2.00 13/10/2033 605,631 0.39%
22,000,000 Egypt Government Bond 14.20 07/07/2023 1,511,273 0.98%
23,000,000 Egypt Treasury Bills 0.00 30/03/2021 1,421,136 0.92%
14,000,000 Egypt Treasury Bills 0.00 01/12/2021 887,321 0.58%
37,000,000,000 Export-Import Bank of Korea 8.40 30/11/2021 2,740,687 1.78%
217,000,000 Hungary Government Bond 1.50 23/08/2023 749,733 0.49%
553,000,000 Hungary Government Bond 5.50 24/06/2025 2,272,730 1.48%
496,000,000 Hungary Government Bond 3.00 21/08/2030 1,835,143 1.19%
280,370,000 Hungary Government Bond 3.25 22/10/2031 1,055,668 0.69%
28,100,000,000 Indonesia Treasury Bond 8.38 15/09/2026 2,336,340 1.52%
43,440,000,000 Indonesia Treasury Bond 6.13 15/05/2028 3,155,723 2.05%
26,000,000,000 Indonesia Treasury Bond 9.00 15/03/2029 2,249,070 1.46%
42,500,000,000 Indonesia Treasury Bond 6.63 15/05/2033 3,121,067 2.03%

Jupiter Asset Management Series Plc Annual Report and Audited Financial Statements for the financial year ended 31 December 2020
Portfolio of Investments (continued) Jupiter Local Currency Emerging Market Debt Fund (continued)
109
Nominal Security Description Coupon
Rate Maturity
Date Value USD % of Net
Assets
Government Security - 90.34% (2019 - 90.98%) (continued)
51,290,000,000 Indonesia Treasury Bond 8.38 15/03/2034 4,346,255 2.84%
150,000,000 Indonesia Treasury Bond 7.50 15/05/2038 11,645 0.01%
33,000,000,000 Korea Development Bank 6.00 22/01/2025 2,536,437 1.65%
8,700,000 Malaysia Government Bond 3.50 31/05/2027 2,312,533 1.50%
11,700,000 Malaysia Government Bond 3.73 15/06/2028 3,173,972 2.06%
6,500,000 Malaysia Government Bond 3.89 15/08/2029 1,796,053 1.17%
635,000 Mexican Bonos 7.50 06/03/2027 3,653,590 2.38%
460,000 Mexican Bonos 8.50 31/05/2029 2,835,788 1.85%
607,810 Mexican Bonos 7.75 29/05/2031 3,607,266 2.35%
295,500 Mexican Bonos 7.75 23/11/2034 1,760,173 1.15%
262,000 Mexican Bonos 8.50 18/11/2038 1,642,636 1.07%
250,000 Mexican Bonos 7.75 13/11/2042 1,456,072 0.95%
4,000,000 Nigeria OMO Bills 4.89 06/08/2038 1,175,730 0.76%
11,616 Peru Government Bond 6.35 08/12/2028 4,156,893 2.70%
4,637 Peru Government Bond 6.95 08/12/2031 1,699,638 1.11%
5,000,000 Republic of Poland Government Bond 2.50 25/07/2026 1,501,807 0.98%
2,700,000 Republic of Poland Government Bond 2.75 25/10/2029 831,601 0.54%
28,229,467 Republic of South Africa Government Bond 10.50 21/12/2026 2,286,683 1.49%
26,600,000 Republic of South Africa Government Bond 8.00 31/01/2030 1,790,425 1.16%
35,550,503 Republic of South Africa Government Bond 7.00 28/02/2031 2,134,716 1.39%
23,374,317 Republic of South Africa Government Bond 8.25 31/03/2032 1,470,317 0.96%
69,500,000 Republic of South Africa Government Bond 8.88 28/02/2035 4,315,739 2.81%
28,000,000 Republic of South Africa Government Bond 8.50 31/01/2037 1,648,627 1.07%
13,000,000 Republic of South Africa Government Bond 9.00 31/01/2040 789,107 0.51%
5,000,000,000 Republic of Uzbekistan Bond 14.50 25/11/2023 485,259 0.32%
6,400,000 Romania Government Bond 4.50 17/06/2024 1,754,463 1.14%
11,000,000 Romania Government Bond 5.00 02/12/2029 3,319,367 2.16%
87,697,000 Russian Federal Bond - OFZ 7.10 16/10/2024 1,269,941 0.83%
127,000,000 Russian Federal Bond - OFZ 7.95 10/07/2026 1,930,477 1.26%
163,799,000 Russian Federal Bond - OFZ 8.15 02/03/2027 2,556,788 1.66%
101,000,000 Russian Federal Bond - OFZ 7.05 19/01/2028 1,500,176 0.98%
93,000,000 Russian Federal Bond - OFZ 6.90 23/05/2029 1,344,272 0.87%
190,000,000 Russian Federal Bond - OFZ 7.65 04/10/2030 2,907,486 1.89%
128,287,000 Russian Federal Bond - OFZ 8.50 17/09/2031 2,059,864 1.34%
76,000,000 Russian Federal Bond - OFZ 7.25 05/10/2034 1,113,284 0.72%
46,730,000 Thailand Government Bond 3.40 17/06/2036 1,954,267 1.27%
23,000,000 Thailand Government Bond 3.30 17/06/2038 958,282 0.62%
15,650,682 Turkey Government Bond 10.60 02/11/2026 2,049,306 1.33%
57,000,000 Uruguay Government International Bond 3.88 07/02/2040 1,650,186 1.07%
4,550,000 Zambia Government Bond 11.00 29/08/2021 197,234 0.13%
138,869,021 90.34%
Total Transferable Securities 148,592,018 96.67%

Jupiter Asset Management Series Plc Annual Report and Audited Financial Statements for the financial year ended 31 December 2020
Portfolio of Investments (continued) Jupiter Local Currency Emerging Market Debt Fund (continued)
110
Swaps - 0.75% (2019 - 0.16%)
Counterparty Nominal Security Description Maturity
Date Unrealised
Gain USD % of Net
Assets
Citibank 35,000,000 IRS PLN/WIBOR/fixing 6M, R:PLN 0.99500 11/03/2025 197,697 0.13%
HSBC 130,000,000 IRS THB/THBFIX/fixing 6M, R:THB 2.185 16/10/2027 384,719 0.25%
HSBC 150,000,000 IRS THB/THBFIX/fixing 6M, R:THB 2.270 09/04/2028 488,140 0.31%
Morgan Stanley 20,000,000 IRS Non-Deliverable IRS CNY-CNREPOFIX/fixing 1W, R:CNY 1.940 08/04/2025 85,633 0.06%
1,156,189 0.75%
Currency Exchange Contracts - 1.53% (2019 - 1.60%)
Actual Settle Date
Issue Currency
Currency Bought
Settle Currency
Currency Sold
Citibank 15/01/2021 AUD 14,178,619 USD 10,681,380 295,368 0.19%
Citibank 15/01/2021 USD 24 AUD 31 - 0.00%
Citibank 26/02/2021 USD 1,302,904 PEN 4,670,000 12,359 0.01%
Citibank 15/01/2021 USD 429,133 ZAR 6,283,422 1,952 0.00%
Citibank 15/01/2021 ZAR 513,797,315 USD 33,809,010 1,122,015 0.73%
Goldman Sachs 26/02/2021 CLP 609,014,000 USD 798,664 58,219 0.04%
Goldman Sachs 26/02/2021 RUB 40,500,000 USD 530,456 7,870 0.01%
Goldman Sachs 26/02/2021 USD 2,855,984 RUB 210,000,000 65,072 0.04%
HSBC 26/02/2021 BRL 12,036,000 USD 2,236,302 78,402 0.05%
HSBC 26/02/2021 CLP 630,000,000 USD 816,281 70,129 0.05%
HSBC 26/02/2021 CNY 59,420,000 USD 8,992,947 90,469 0.06%
HSBC 29/01/2021 HUF 431,439,710 USD 1,423,018 30,204 0.02%
HSBC 26/02/2021 INR 221,735,000 USD 2,956,686 61,571 0.04%
HSBC 26/02/2021 PHP 14,768,000 USD 305,130 1,527 0.00%
HSBC 29/01/2021 PLN 36,488,632 USD 9,714,415 115,805 0.07%
JP Morgan Securities 29/01/2021 TRY 5,300,000 USD 655,411 51,073 0.03%
Morgan Stanley 26/02/2021 CLP 550,000,000 USD 761,341 12,509 0.01%
Morgan Stanley 26/02/2021 MYR 8,500,000 USD 2,082,420 28,436 0.02%
Societe Generale 26/02/2021 COP 3,896,230,000 USD 1,060,255 77,444 0.05%
Societe Generale 29/01/2021 THB 280,415,386 USD 9,250,252 109,452 0.07% Toronto Dominion Bank 29/01/2021 CZK 45,607,747 USD 2,076,137 57,257 0.04%
Unrealised Gain on Currency Exchange Contracts at 31 December 2020 2,347,133 1.53%
Value USD
Total Financial Derivatives Instruments 3,503,322 2.28%
Financial Assets at Fair Value Through Profit or Loss (Cost USD 140,873,837) (2019: USD 425,735,253) 152,095,340 98.95%

Jupiter Asset Management Series Plc Annual Report and Audited Financial Statements for the financial year ended 31 December 2020
Portfolio of Investments (continued) Jupiter Local Currency Emerging Market Debt Fund (continued)
111
Swaps - (0.24%) (2019 - (0.04%))
Counterparty Nominal Security Description Maturity
Date Unrealised
Loss USD % of Net
Assets
Barclays 60,000,000 IRS Non-Deliverable IRS CNY-CNREPOFIX/fixing 1W, R:CNY 1.940 08/04/2025 (256,898) (0.17%)
JP Morgan Securities 17,500,000 IRS PLN/WIBOR/fixing 6M, R:PLN 0.99500 11/03/2025 (98,849) (0.06%)
Morgan Stanley 14,500,000 IRS Non-Deliverable IRS CNY-CNREPOFIX/fixing 1W, R:CNY 2.485 27/07/2025 (15,054) (0.01%)
(370,801) (0.24%)
Currency Exchange Contracts - (0.24%) (2019 - (0.76%))
Actual Settle Date
Issue Currency
Currency Bought
Settle Currency
Currency Sold
Citibank 15/01/2021 USD 348,190 AUD 458,246 (6,572) (0.00%)
Citibank 15/01/2021 USD 363,453 ZAR 5,455,251 (7,443) (0.00%)
Goldman Sachs 26/02/2021 BRL 3,900,000 USD 768,988 (18,960) (0.01%)
Goldman Sachs 26/02/2021 USD 2,236,507 BRL 12,038,000 (78,665) (0.06%)
Goldman Sachs 28/01/2021 USD 1,546,986 HKD 12,000,000 (1,050) (0.00%)
Goldman Sachs 29/01/2021 USD 2,307,071 MXN 46,513,635 (24,932) (0.02%)
Goldman Sachs 29/01/2021 USD 224,896 RON 923,692 (7,608) (0.00%)
Goldman Sachs 26/02/2021 USD 995,983 RUB 75,000,000 (923) (0.00%)
HSBC 29/01/2021 USD 1,226,962 EUR 1,029,003 (36,864) (0.02%)
HSBC 29/01/2021 USD 767,711 MXN 15,456,996 (7,235) (0.00%)
HSBC 29/01/2021 USD 1,041,137 ZAR 15,961,105 (42,174) (0.03%)
JP Morgan Securities 29/01/2021 MXN 27,326,261 USD 1,372,110 (2,135) (0.00%)
JP Morgan Securities 29/01/2021 PLN 5,500,000 USD 1,506,808 (25,080) (0.02%)
Societe Generale 26/02/2021 USD 4,067,694 IDR 58,318,000,000 (108,920) (0.08%)
Unrealised Loss on Currency Exchange Contracts at 31 December 2020 (368,561) (0.24%)
Value USD
Total Financial Derivatives Instruments (739,362) (0.48%)
Financial Liabilities at Fair Value Through Profit or Loss (Cost USD Nil) (2019: USD Nil) (739,362) (0.48%)
Cash at Bank 3,571,923 2.32%
Other Net Liabilities (1,216,641) (0.79%)
Net Assets Value as at 31 December 2020 153,711,260 100.00%
Portfolio Analysis % of Total
Assets
Transferable securities admitted to official stock exchange listing 87.99%
Transferable securities dealt in on another regulated market 6.87%
OTC financial derivative instruments 2.24%
Other current assets 2.90%
Total Assets 100.00%

Jupiter Asset Management Series Plc Annual Report and Audited Financial Statements for the financial year ended 31 December 2020
Portfolio of Investments (continued) Jupiter UK Alpha Fund (IRL)
112
Nominal Security Description Value GBP % of Net
Assets
Common Stock
Banks - 8.40% (2019 - 10.91%)
1,212,752 Barclays PLC 1,788,688 4.60%
4,043,447 Lloyds Banking Group PLC 1,479,194 3.80%
3,267,882 8.40%
Construction & Materials - 1.94% (2019 - 2.30%)
24,508 CRH PLC 754,601 1.94%
754,601 1.94%
Electricity - 5.76% (2019 - 2.16%)
465,496 Drax Group PLC 1,742,352 4.48%
33,305 SSE PLC 499,408 1.28%
2,241,760 5.76%
Food & Drug Retailers - 2.67% (2019 - 4.16%)
446,049 Tesco PLC 1,037,287 2.67%
1,037,287 2.67%
Food Producers - 2.11% (2019 - 2.03%)
122,412 Tate & Lyle PLC 822,853 2.11%
822,853 2.11%
General Industrials - 7.97% (2019 - 2.63%)
311,688 DS Smith PLC 1,175,531 3.02%
606,199 Melrose Industries PLC 1,081,611 2.78%
107,752 THG Holdings PLC 843,159 2.17%
3,100,301 7.97%
General Retailers - 7.56% (2019 - 6.18%)
15,779 Next PLC 1,116,206 2.87%
427,525 Pets at Home Group PLC 1,824,249 4.69%
2,940,455 7.56%
Health Care Equipment & Services - 2.41% (2019 - 3.21%)
61,512 Smith & Nephew PLC 938,058 2.41%
938,058 2.41%
Household Goods & Home Construction - 2.83% (2019 - 0.00%)
667,754 Taylor Wimpey PLC 1,100,459 2.83%
1,100,459 2.83%
Industrial Engineering - 3.94% (2019 - 2.18%)
76,944 Weir Group PLC 1,532,917 3.94%
1,532,917 3.94%
Life Insurance - 6.65% (2019 - 8.91%)
92,938 Prudential PLC 1,259,542 3.24%
117,525 St James's Place PLC 1,327,739 3.41%
2,587,281 6.65%
Mining - 6.90% (2019 - 6.04%)
467,575 Glencore PLC 1,096,580 2.82%

Jupiter Asset Management Series Plc Annual Report and Audited Financial Statements for the financial year ended 31 December 2020
Portfolio of Investments (continued)
Jupiter UK Alpha Fund (IRL) (continued)
113
Nominal Security Description Value GBP % of Net
Assets
Common Stock (continued)
Mining - 6.90% (2019 - 6.04%) (continued)
28,795 Rio Tinto PLC 1,588,188 4.08%
2,684,768 6.90%
Mobile Telecommunications - 1.28% (2019 - 1.89%)
408,130 Vodafone Group PLC 496,204 1.28%
496,204 1.28%
Oil & Gas Producers - 4.60% (2019 - 7.17%)
353,603 BP PLC 908,495 2.33%
69,535 Royal Dutch Shell PLC 881,634 2.27%
1,790,129 4.60%
Personal Goods - 2.20% (2019 - 2.20%)
47,625 Burberry Group PLC 857,250 2.20%
857,250 2.20%
Pharmaceuticals & Biotechnology - 7.37% (2019 - 7.82%)
19,933 AstraZeneca PLC 1,462,385 3.75%
104,350 GlaxoSmithKline PLC 1,409,560 3.62%
2,871,945 7.37%
Software & Computer Services - 4.38% (2019 - 4.46%)
132,128 Micro Focus International PLC 562,271 1.44%
195,295 Sage Group PLC 1,144,819 2.94%
1,707,090 4.38%
Support Services - 6.02% (2019 - 6.59%)
45,192 Experian PLC 1,268,088 3.26%
10,491 Fidelity National Information Services Inc 1,072,545 2.76%
2,340,633 6.02%
Travel & Leisure - 12.40% (2019 - 11.77%)
145,889 Entain PLC 1,655,475 4.25%
203,352 International Consolidated Airlines Group SA 327,753 0.84%
338,554 SSP Group PLC 1,132,125 2.91%
54,644 Whitbread PLC 1,710,630 4.40%
4,825,983 12.40%
Total Common Stock 37,897,856 97.39%
Total Transferable Securities 37,897,856 97.39%
Currency Exchange Contracts - 0.00% (2019 - 0.00%)
Counterparty Actual Settle Date
Issue Currency
Currency Bought
Settle Currency
Currency Sold
Unrealised Gain GBP
Citibank 15/01/2021 GBP 26,258 USD 35,027 597 0.00%
Unrealised Gain on Currency Exchange Contracts at 31 December 2020 597 0.00%
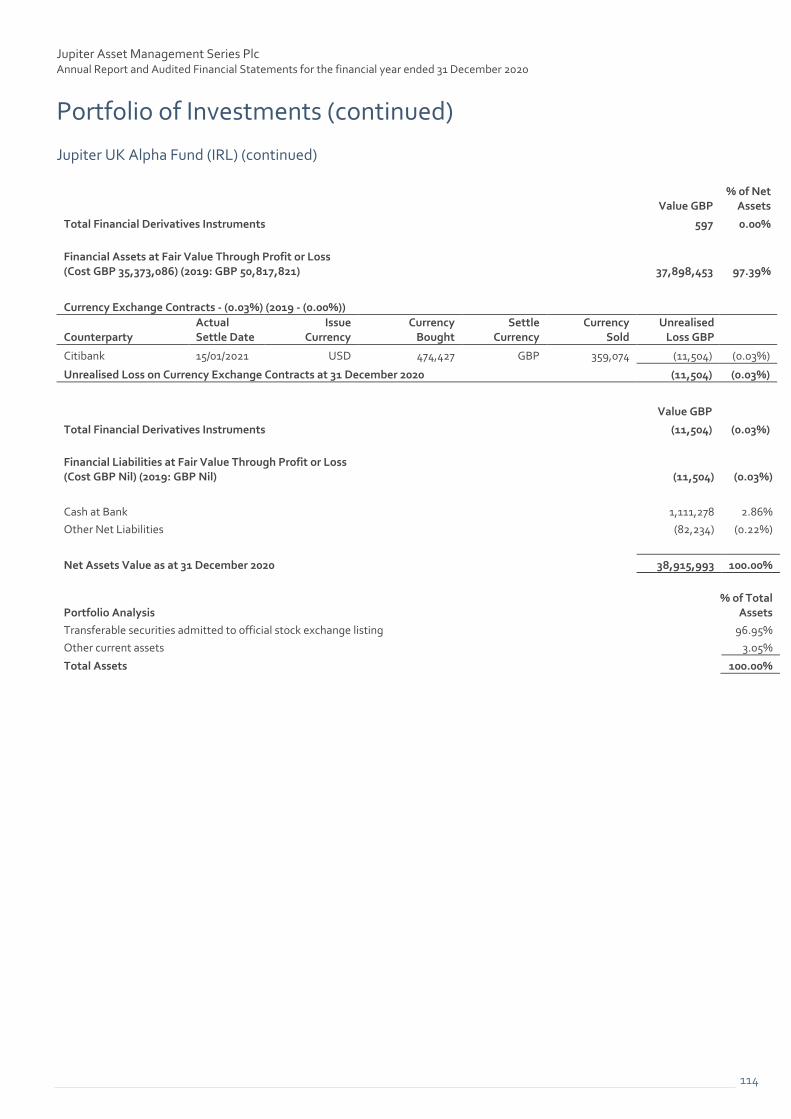
Jupiter Asset Management Series Plc Annual Report and Audited Financial Statements for the financial year ended 31 December 2020
Portfolio of Investments (continued)
Jupiter UK Alpha Fund (IRL) (continued)
114
Value GBP % of Net
Assets
Total Financial Derivatives Instruments 597 0.00%
Financial Assets at Fair Value Through Profit or Loss (Cost GBP 35,373,086) (2019: GBP 50,817,821) 37,898,453 97.39%
Currency Exchange Contracts - (0.03%) (2019 - (0.00%))
Counterparty Actual Settle Date
Issue Currency
Currency Bought
Settle Currency
Currency Sold
Unrealised Loss GBP
Citibank 15/01/2021 USD 474,427 GBP 359,074 (11,504) (0.03%)
Unrealised Loss on Currency Exchange Contracts at 31 December 2020 (11,504) (0.03%)
Value GBP
Total Financial Derivatives Instruments (11,504) (0.03%)
Financial Liabilities at Fair Value Through Profit or Loss (Cost GBP Nil) (2019: GBP Nil) (11,504) (0.03%)
Cash at Bank 1,111,278 2.86%
Other Net Liabilities (82,234) (0.22%)
Net Assets Value as at 31 December 2020 38,915,993 100.00%
Portfolio Analysis % of Total
Assets
Transferable securities admitted to official stock exchange listing 96.95%
Other current assets 3.05%
Total Assets 100.00%

Jupiter Asset Management Series Plc Annual Report and Audited Financial Statements for the financial year ended 31 December 2020
Portfolio of Investments (continued) Jupiter UK Smaller Companies Focus Fund
115
Nominal Security Description Value GBP % of Net
Assets
Common Stock
Aerospace & Defense - 2.54% (2019 - 0.00%)
62,553 Avon Rubber PLC 1,979,802 0.66%
1,978,950 Chemring Group PLC 5,649,902 1.88%
7,629,704 2.54%
Chemicals - 1.82% (2019 - 1.79%)
1,218,572 Synthomer PLC 5,478,700 1.82%
5,478,700 1.82%
Construction & Materials - 4.20% (2019 - 2.55%)
3,654,747 Breedon Group PLC 3,194,249 1.07%
785,254 Marshalls PLC 5,869,774 1.95%
231,747 Morgan Sindall Group PLC 3,550,364 1.18%
12,614,387 4.20%
Electronic & Electrical Equipment - 1.30% (2019 - 0.13%)
83,293 XP Power Ltd 3,906,442 1.30%
3,906,442 1.30%
Equity Investment Instruments - 3.50% (2019 - 1.94%)
5,588,286 Merian Chrysalis Investments Co Ltd 10,505,978 3.50%
10,505,978 3.50%
Financial Services - 12.01% (2019 - 19.84%)
1,060,437 Alpha FX Group PLC 13,785,681 4.59%
421,355 Liontrust Asset Management PLC 5,477,615 1.82%
3,965,176 OSB Group PLC 16,796,486 5.60%
36,059,782 12.01%
General Industrials - 7.94% (2019 - 1.08%)
3,055,642 THG Holdings PLC 23,834,008 7.94%
23,834,008 7.94%
General Retailers - 11.76% (2019 - 7.78%)
164,514 ASOS PLC 7,868,705 2.62%
4,607,667 boohoo Group PLC 15,804,298 5.26%
2,011,454 DFS Furniture PLC 4,425,199 1.48%
379,936 Dunelm Group PLC 4,608,624 1.53%
624,304 Pets at Home Group PLC 2,598,353 0.87%
35,305,179 11.76%
Household Goods & Home Construction - 3.99% (2019 - 3.95%)
4,185,078 Accrol Group Holdings PLC 2,657,525 0.89%
315,322 Bellway PLC 9,317,765 3.10%
11,975,290 3.99%
Industrial Engineering - 1.57% (2019 - 1.66%)
880,788 Vesuvius PLC 4,725,428 1.57%
4,725,428 1.57%
Industrial Transportation - 1.10% (2019 - 0.00%)
9,341,208 DX Group PLC 3,306,788 1.10%
3,306,788 1.10%

Jupiter Asset Management Series Plc Annual Report and Audited Financial Statements for the financial year ended 31 December 2020
Portfolio of Investments (continued) Jupiter UK Smaller Companies Focus Fund (continued)
116
Nominal Security Description Value GBP % of Net
Assets
Common Stock (continued)
Leisure Goods - 0.90% (2019 - 0.00%)
340,128 Team17 Group PLC 2,693,814 0.90%
2,693,814 0.90%
Media - 10.07% (2019 - 9.18%)
2,376,217 Ascential PLC 9,124,673 3.04%
317,870 Future PLC 5,524,581 1.84%
3,358,788 Hyve Group PLC 3,798,789 1.26%
615,742 Ocean Outdoor Ltd 3,153,147 1.05%
1,728,272 S4 Capital PLC 8,641,360 2.88%
30,242,550 10.07%
Mobile Telecommunications - 3.91% (2019 - 3.38%)
712,977 Gamma Communications PLC 11,728,472 3.91%
11,728,472 3.91%
Pharmaceuticals & Biotechnology - 1.36% (2019 - 3.78%)
387,765 Ergomed PLC 4,090,921 1.36%
4,090,921 1.36%
Real Estate Investment & Services - 3.54% (2019 - 5.96%)
1,138,637 Helical PLC 4,252,809 1.42%
3,018,960 Purplebricks Group PLC 3,200,098 1.07%
333,434 Savills PLC 3,182,628 1.05%
10,635,535 3.54%
Real Estate Investment Trusts - 1.12% (2019 - 4.08%)
437,759 Workspace Group PLC 3,366,367 1.12%
3,366,367 1.12%
Software & Computer Services - 8.59% (2019 - 7.72%)
417,500 Actual Experience PLC 613,725 0.20%
877,930 Aptitude Software Group PLC 3,906,789 1.30%
1,083,096 Blancco Technology Group PLC 2,393,642 0.80%
545,161 Blue Prism Group plc 9,376,769 3.12%
878,719 Bytes Technology Group PLC 2,943,709 0.99%
883,128 Funding Circle Holdings PLC 794,815 0.26%
3,169,495 Learning Technologies Group PLC 5,768,481 1.92%
25,797,930 8.59%
Support Services - 10.15% (2019 - 13.51%)
1,057,172 Electrocomponents PLC 9,202,682 3.07%
1,038,984 Keystone Law Group PLC 5,246,869 1.75%
3,888,954 Kin & Carta PLC 5,522,315 1.84%
1,353,335 Knights Group Holdings PLC 5,325,373 1.77%
7,255,217 Speedy Hire PLC 5,165,715 1.72%
30,462,954 10.15%
Technology Hardware & Equipment - 1.62% (2019 - 1.74%)
1,840,839 Spirent Communications PLC 4,859,815 1.62%
4,859,815 1.62%

Jupiter Asset Management Series Plc Annual Report and Audited Financial Statements for the financial year ended 31 December 2020
Portfolio of Investments (continued) Jupiter UK Smaller Companies Focus Fund (continued)
117
Nominal Security Description Value GBP % of Net
Assets
Common Stock (continued)
Travel & Leisure - 3.36% (2019 - 3.66%)
705,579 JET2 PLC 10,089,780 3.36%
10,089,780 3.36%
Total Common Stock 289,309,824 96.35%
Total Transferable Securities 289,309,824 96.35%
Financial Assets at Fair Value Through Profit or Loss (Cost GBP 205,163,520) (2019: GBP 264,522,434) 289,309,824 96.35%
Cash at Bank 13,980,337 4.66%
Other Net Liabilities (3,018,222) (1.01%)
Net Assets Value as at 31 December 2020 300,271,939 100.00%
Portfolio Analysis % of Total
Assets
Transferable securities admitted to official stock exchange listing 94.85%
Other current assets 5.15%
Total Assets 100.00%

Jupiter Asset Management Series Plc Annual Report and Audited Financial Statements for the financial year ended 31 December 2020
Portfolio of Investments (continued) Jupiter UK Dynamic Equity Fund
118
Nominal Security Description Value GBP % of Net
Assets
Common Stock
Aerospace & Defense - 3.48% (2019 - 0.00%)
83,224 Avon Rubber PLC 2,663,168 0.64%
4,117,223 Chemring Group PLC 11,764,965 2.84%
14,428,133 3.48%
Chemicals - 0.94% (2019 - 1.08%)
874,606 Synthomer PLC 3,913,862 0.94%
3,913,862 0.94%
Construction & Materials - 1.04% (2019 - 0.00%)
575,369 Marshalls PLC 4,313,829 1.04%
4,313,829 1.04%
Financial Services - 13.17% (2019 - 11.26%)
762,393 Alpha FX Group PLC 9,911,109 2.39%
1,115,993 IntegraFin Holdings PLC 6,204,921 1.50%
512,855 Intermediate Capital Group PLC 8,839,056 2.13%
426,313 Liontrust Asset Management PLC 5,478,122 1.32%
5,671,606 OSB Group PLC 24,132,684 5.83%
54,565,892 13.17%
General Industrials - 9.14% (2019 - 0.00%)
3,447,533 Melrose Industries PLC 6,151,261 1.48%
4,050,774 THG Holdings PLC 31,697,307 7.66%
37,848,568 9.14%
General Retailers - 20.04% (2019 - 13.64%)
154,901 ASOS PLC 7,422,081 1.79%
8,955,718 boohoo Group PLC 30,767,369 7.43%
2,307,093 DFS Furniture PLC 5,219,798 1.26%
1,138,803 HomeServe PLC 11,689,813 2.82%
1,350,191 JD Sports Fashion PLC 11,569,787 2.79%
2,550,716 Pets at Home Group PLC 10,883,905 2.63%
357,123 WH Smith PLC 5,456,839 1.32%
83,009,592 20.04%
Household Goods & Home Construction - 7.16% (2019 - 3.40%)
1,604,506 Barratt Developments PLC 10,753,399 2.60%
680,049 Persimmon PLC 18,895,161 4.56%
29,648,560 7.16%
Leisure Goods - 2.07% (2019 - 0.00%)
40,593 Games Workshop Group PLC 4,580,920 1.11%
495,195 Team17 Group PLC 3,961,560 0.96%
8,542,480 2.07%
Media - 8.74% (2019 - 7.52%)
3,465,385 Ascential PLC 13,352,128 3.22%
589,769 Future PLC 10,391,730 2.51%
2,499,664 S4 Capital PLC 12,485,822 3.01%
36,229,680 8.74%

Jupiter Asset Management Series Plc Annual Report and Audited Financial Statements for the financial year ended 31 December 2020
Portfolio of Investments (continued) Jupiter UK Dynamic Equity Fund (continued)
119
Nominal Security Description Value GBP % of Net
Assets
Common Stock (continued)
Mobile Telecommunications - 2.60% (2019 - 2.13%)
653,508 Gamma Communications PLC 10,782,882 2.60%
10,782,882 2.60%
Pharmaceuticals & Biotechnology - 3.02% (2019 - 3.43%)
1,124,622 Clinigen Group PLC 7,588,387 1.83%
469,266 Ergomed PLC 4,903,830 1.19%
12,492,217 3.02%
Real Estate Investment Trusts - 6.50% (2019 - 6.72%)
1,298,107 Segro PLC 12,281,390 2.96%
1,412,125 UNITE Group PLC 14,650,797 3.54%
26,932,187 6.50%
Software & Computer Services - 1.66% (2019 - 4.10%)
150,440 Blue Prism Group plc 2,599,603 0.63%
1,258,837 Bytes Technology Group PLC 4,275,010 1.03%
6,874,613 1.66%
Support Services - 6.52% (2019 - 17.80%)
2,285,841 Electrocomponents PLC 20,086,828 4.85%
1,189,054 Knights Group Holdings PLC 4,678,927 1.13%
1,876,248 Serco Group PLC 2,256,188 0.54%
27,021,943 6.52%
Technology Hardware & Equipment - 1.70% (2019 - 1.97%)
2,670,737 Spirent Communications PLC 7,057,423 1.70%
7,057,423 1.70%
Travel & Leisure - 11.32% (2019 - 11.68%)
1,281,341 JET2 PLC 18,579,445 4.48%
1,536,882 Loungers PLC 3,427,247 0.84%
2,120,469 Trainline PLC 9,959,843 2.40%
324,625 Wizz Air Holdings PLC 14,929,504 3.60%
46,896,039 11.32%
Total Common Stock 410,557,900 99.10%
Total Transferable Securities 410,557,900 99.10%
Contracts For Difference - 0.02% (2019 - 0.02%)
Counterparty Nominal Security Description Unrealised
Gain GBP Citibank 354,183 Fresnillo PLC 51,357 0.01%
Citibank (220,809) GB164 22,081 0.01%
73,438 0.02%
Currency Exchange Contracts - 0.00% (2019 - 0.01%)
Actual Settle Date
Issue Currency
Currency Bought
Settle Currency
Currency Sold
Citibank 15/01/2021 GBP 884,357 EUR 963,372 17,785 0.00%
Unrealised Gain on Currency Exchange Contracts at 31 December 2020 17,785 0.00%
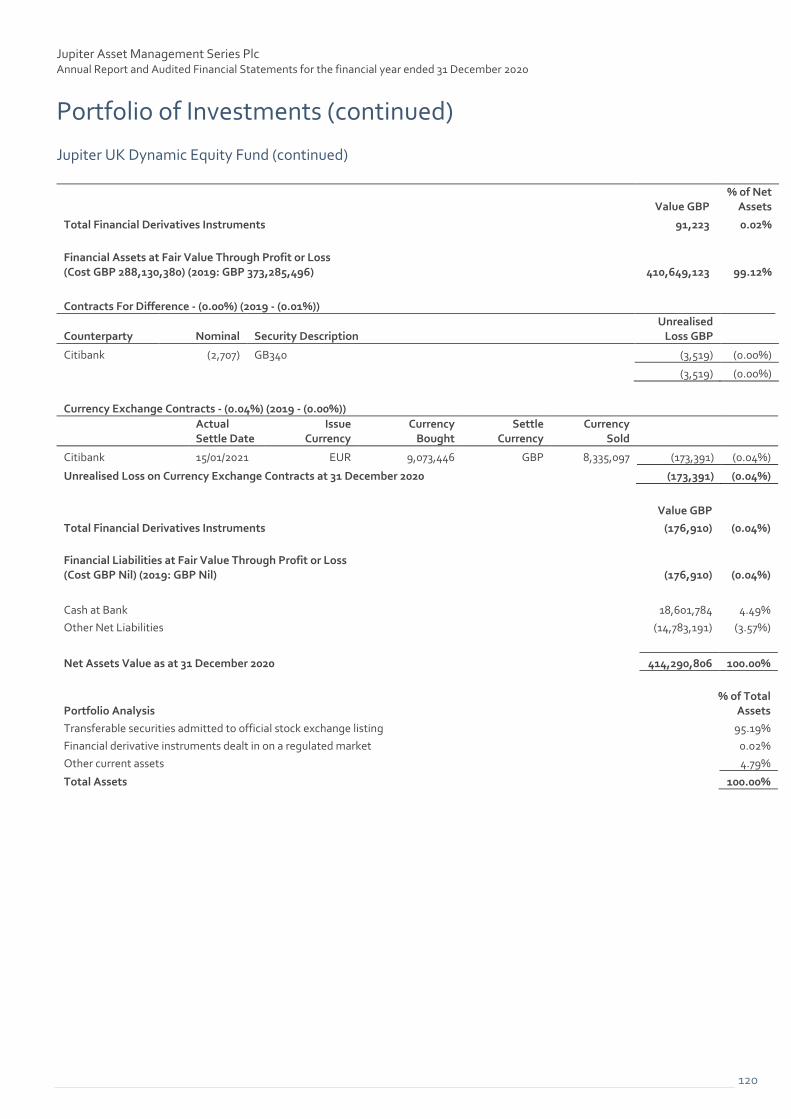
Jupiter Asset Management Series Plc Annual Report and Audited Financial Statements for the financial year ended 31 December 2020
Portfolio of Investments (continued) Jupiter UK Dynamic Equity Fund (continued)
120
Value GBP % of Net
Assets
Total Financial Derivatives Instruments 91,223 0.02%
Financial Assets at Fair Value Through Profit or Loss (Cost GBP 288,130,380) (2019: GBP 373,285,496) 410,649,123 99.12%
Contracts For Difference - (0.00%) (2019 - (0.01%))
Counterparty Nominal Security Description Unrealised
Loss GBP Citibank (2,707) GB340 (3,519) (0.00%)
(3,519) (0.00%)
Currency Exchange Contracts - (0.04%) (2019 - (0.00%))
Actual Settle Date
Issue Currency
Currency Bought
Settle Currency
Currency Sold
Citibank 15/01/2021 EUR 9,073,446 GBP 8,335,097 (173,391) (0.04%)
Unrealised Loss on Currency Exchange Contracts at 31 December 2020 (173,391) (0.04%)
Value GBP
Total Financial Derivatives Instruments (176,910) (0.04%)
Financial Liabilities at Fair Value Through Profit or Loss (Cost GBP Nil) (2019: GBP Nil) (176,910) (0.04%)
Cash at Bank 18,601,784 4.49%
Other Net Liabilities (14,783,191) (3.57%)
Net Assets Value as at 31 December 2020 414,290,806 100.00%
Portfolio Analysis % of Total
Assets
Transferable securities admitted to official stock exchange listing 95.19%
Financial derivative instruments dealt in on a regulated market 0.02%
Other current assets 4.79%
Total Assets 100.00%

Jupiter Asset Management Series Plc Annual Report and Audited Financial Statements for the financial year ended 31 December 2020
Portfolio of Investments (continued) Jupiter Merian Global Equity Absolute Return Fund
121
Nominal Security Description Value USD % of Net
Assets
Common Stock
Basic Materials - 3.73% (2019 - 2.18%)
256,336 Acerinox SA 2,859,212 0.21%
7,289,394 Alumina Ltd 10,353,722 0.75%
111,712 BHP Group Ltd 3,668,951 0.27%
111,500 China Hongqiao Group Ltd 102,115 0.01%
90,101 IGO Ltd 444,958 0.03%
901,152 Iluka Resources Ltd 4,527,013 0.33%
27,659 K+S AG 264,789 0.02%
51,900 Mitsubishi Gas Chemical Co Inc 1,192,947 0.09%
1,207,000 Nine Dragons Paper Holdings Ltd 1,712,600 0.12%
105,100 Nitto Denko Corp 9,412,240 0.68%
16,313 Olin Corp 406,520 0.03%
739,924 Perseus Mining Ltd 744,560 0.05%
1,114,567 South32 Ltd 2,130,945 0.15%
335,100 Tokuyama Corp 7,533,365 0.54%
181,051 Torex Gold Resources Inc 2,767,025 0.20%
3,066,000 Zijin Mining Group Co Ltd 3,472,344 0.25%
51,593,306 3.73%
Communications - 4.90% (2019 - 4.84%)
14,800 Alibaba Group Holding Ltd (DR) 3,528,172 0.26%
3,800 Baidu Inc (DR) 834,594 0.06%
45,259 ChannelAdvisor Corp 737,722 0.05%
1,934 Charter Communications Inc 1,263,850 0.09%
334,200 China Literature Ltd 2,623,150 0.19%
122,100 Dip Corp 3,261,448 0.24%
64,077 Domain Holdings Australia Ltd 222,699 0.02%
9,876 Facebook Inc 2,684,988 0.19%
10,239 GoDaddy Inc 853,113 0.06%
166,200 JD.com Inc (DR) 14,878,224 1.08%
75,427 Maxar Technologies Inc 2,647,488 0.19%
609,586 Mediaset Espana Comunicacion SA 3,205,183 0.23%
93,200 Meituan 3,541,642 0.25%
31,407 New York Times Co 1,620,287 0.12%
128,080 News Corp 2,309,282 0.17%
35,389 SEEK Ltd 781,518 0.06%
7,973 Snap Inc 393,468 0.03%
229,800 Sohu.com Ltd (DR) 3,702,078 0.27%
99,163 Telefonaktiebolaget LM Ericsson 1,190,947 0.09%
48,494 Telenet Group Holding NV 2,081,979 0.15%
27,400 Tencent Holdings Ltd 1,993,360 0.14%
1,083,200 Tongcheng-Elong Holdings Ltd 2,095,830 0.15%

Jupiter Asset Management Series Plc Annual Report and Audited Financial Statements for the financial year ended 31 December 2020
Portfolio of Investments (continued) Jupiter Merian Global Equity Absolute Return Fund (continued)
122
Nominal Security Description Value USD % of Net
Assets
Common Stock (continued)
Communications - 4.90% (2019 - 4.84%) (continued)
11,245 VeriSign Inc 2,412,053 0.17%
25,936 Verizon Communications Inc 1,507,919 0.11%
133,411 Yelp Inc 4,221,124 0.30%
23,973 Zillow Group Inc 3,127,278 0.23%
67,719,396 4.90%
Consumer, Cyclical - 11.04% (2019 - 6.65%)
20,270 Adient PLC 713,301 0.05%
60,943 Bayerische Motoren Werke AG 5,435,225 0.39%
96,525 Bed Bath & Beyond Inc 1,800,191 0.13%
82,924 Breville Group Ltd 1,641,270 0.12%
322,500 BYD Co Ltd 8,452,973 0.61%
2,066,000 Cathay Pacific Airways Ltd 1,910,757 0.14%
168,393 CECONOMY AG 1,183,743 0.09%
139,495 Cineplex Inc 1,029,807 0.07%
77,761 Continental AG 11,736,730 0.85%
209,038 Daimler AG 14,938,368 1.08%
4,900 Daiwa House Industry Co Ltd 145,671 0.01%
8,115 Domino's Pizza Enterprises Ltd 544,473 0.04%
8,215 Electrolux AB 193,050 0.01%
1,139,219 Ford Motor Co 10,093,480 0.73%
13,132,100 Genting Singapore Ltd 8,447,316 0.61%
610,500 Great Wall Motor Co Ltd 2,094,707 0.15%
479,642 Harvey Norman Holdings Ltd 1,741,242 0.13%
310,710 Industria de Diseno Textil SA 9,981,834 0.72%
262,300 Jardine Cycle & Carriage Ltd 3,880,705 0.29%
649,025 Kindred Group PLC (DR) 6,409,839 0.46%
23,600 Lawson Inc 1,100,257 0.08%
199,694 Lions Gate Entertainment Corp 2,232,579 0.16%
154,800 Man Wah Holdings Ltd 335,856 0.02%
28,302 MarineMax Inc 1,006,702 0.07%
25,326 Meritage Homes Corp 2,167,652 0.16%
12,300 Nintendo Co Ltd 7,856,291 0.57%
122,833 NIO Inc (DR) 5,942,661 0.43%
22,100 Nippon Gas Co Ltd 1,185,785 0.09%
1,775,000 Pacific Textiles Holdings Ltd 1,165,392 0.08%
75,917 Pandora A/S 8,552,244 0.62%
133,480 PulteGroup Inc 5,885,133 0.43%
8,065 Rush Enterprises Inc 331,713 0.02%
29,063 Shoe Carnival Inc 1,127,354 0.08%
2,232,500 Sinotruk Hong Kong Ltd 5,701,809 0.41%
70,003 SKYCITY Entertainment Group Ltd 162,656 0.01%
480,000 Skyworth Group Ltd 133,737 0.01%

Jupiter Asset Management Series Plc Annual Report and Audited Financial Statements for the financial year ended 31 December 2020
Portfolio of Investments (continued) Jupiter Merian Global Equity Absolute Return Fund (continued)
123
Nominal Security Description Value USD % of Net
Assets
Common Stock (continued)
Consumer, Cyclical - 11.04% (2019 - 6.65%) (continued)
10,196 Steelcase Inc 136,932 0.01%
43,600 Sundrug Co Ltd 1,742,899 0.13%
219,585 TRI Pointe Group Inc 3,851,521 0.28%
11,614 Vista Outdoor Inc 278,620 0.02%
95,810 Viva Energy Group Ltd 141,649 0.01%
332,828 Volvo AB 7,945,626 0.57%
79,904 Wabash National Corp 1,386,334 0.10%
152,746,084 11.04%
Consumer, Non-cyclical - 12.32% (2019 - 11.79%)
162,633 a2 Milk Co Ltd 1,420,903 0.10%
1,806 Adecco Group AG 121,391 0.01%
11,063 Agios Pharmaceuticals Inc 492,525 0.04%
4,681 Alkermes PLC 95,726 0.01%
13,618 Alnylam Pharmaceuticals Inc 1,784,503 0.13%
14,998 Amicus Therapeutics Inc 344,054 0.02%
60,935 Ansell Ltd 1,640,459 0.12%
981 Automatic Data Processing Inc 170,508 0.01%
83,570 Avantor Inc 2,284,804 0.17%
2,919 Biogen Inc 711,010 0.05%
87,959 Brookdale Senior Living Inc 384,381 0.03%
4,295,000 China Medical System Holdings Ltd 4,797,744 0.35%
2,991 Cigna Corp 610,314 0.04%
5,200 Coca-Cola European Partners PLC 255,164 0.02%
85,011 Corcept Therapeutics Inc 2,224,738 0.16%
24,000 Dai Nippon Printing Co Ltd 431,960 0.03%
38,080 DaVita Inc 4,398,240 0.32%
80,739 Edwards Lifesciences Corp 7,237,444 0.52%
5,400 Eisai Co Ltd 386,249 0.03%
368 Enanta Pharmaceuticals Inc 15,287 0.00%
21,442 Essity AB 697,347 0.05%
58,212 FibroGen Inc 2,210,310 0.16%
268,684 Fisher & Paykel Healthcare Corp Ltd 6,412,234 0.46%
24,845 Genmab A/S 10,090,460 0.73%
40,080 GenMark Diagnostics Inc 581,962 0.04%
395,674 Getinge AB 9,329,695 0.66%
301,736 GrainCorp Ltd 978,611 0.07%
9,700 H.U. Group Holdings Inc 261,546 0.02%
8,211 Hain Celestial Group Inc 327,455 0.02%
193,466 Healius Ltd 558,576 0.04%
443,500 Hengan International Group Co Ltd 3,140,668 0.23%
29,248 Incyte Corp 2,540,481 0.18%
28,289 Ingredion Inc 2,228,042 0.16%

Jupiter Asset Management Series Plc Annual Report and Audited Financial Statements for the financial year ended 31 December 2020
Portfolio of Investments (continued) Jupiter Merian Global Equity Absolute Return Fund (continued)
124
Nominal Security Description Value USD % of Net
Assets
Common Stock (continued)
Consumer, Non-cyclical - 12.32% (2019 - 11.79%) (continued)
5,400 IR Japan Holdings Ltd 863,455 0.06%
154,842 Ironwood Pharmaceuticals Inc 1,782,231 0.13%
130,626 Kala Pharmaceuticals Inc 898,707 0.06%
223,137 Kraft Heinz Co 7,736,160 0.56%
28,930 Ligand Pharmaceuticals Inc 2,969,086 0.21%
31,700 Livzon Pharmaceutical Group Inc 122,874 0.01%
10,137 McKesson Corp 1,757,959 0.13%
32,067 Medpace Holdings Inc 4,420,757 0.32%
18,558 Meridian Bioscience Inc 360,953 0.03%
6,422 Merit Medical Systems Inc 351,669 0.03%
18,460 Molson Coors Beverage Co 835,130 0.06%
25,390 Novo Nordisk A/S 1,795,351 0.13%
129,900 Olympus Corp 2,844,023 0.21%
175,900 Ono Pharmaceutical Co Ltd 5,304,390 0.38%
49,171 Orkla ASA 502,122 0.04%
29,342 Owens & Minor Inc 814,534 0.06%
54,146 Patterson Cos Inc 1,635,751 0.12%
22,760 Pharma Mar SA 1,990,332 0.14%
20,600 Pharmaron Beijing Co Ltd 348,092 0.03%
12,400 Pola Orbis Holdings Inc 251,934 0.02%
255,527 Puma Biotechnology Inc 2,654,926 0.19%
177,096 Radius Health Inc 3,267,421 0.24%
200,668 Randstad NV 13,181,434 0.95%
29,434 Roche Holding AG 10,326,462 0.75%
7,891 Sage Therapeutics Inc 699,616 0.05%
4,076 Select Medical Holdings Corp 111,805 0.01%
15,500 Shionogi & Co Ltd 847,450 0.06%
62,800 Sinopharm Group Co Ltd 152,777 0.01%
107,792 SpartanNash Co 1,855,100 0.13%
57,041 Spectrum Brands Holdings Inc 4,404,136 0.32%
1,443 Square Inc 318,961 0.02%
147,358 Swedish Match AB 11,553,105 0.84%
12,736 Thermo Fisher Scientific Inc 5,880,593 0.43%
26,983 Tivity Health Inc 529,137 0.04%
1,089,000 Uni-President China Holdings Ltd 1,108,309 0.08%
1,082,000 United Laboratories International Holdings Ltd 767,619 0.06%
23,136 Vanda Pharmaceuticals Inc 307,477 0.02%
20,946 Viscofan SA 1,501,994 0.11%
65,000 YA-MAN Ltd 1,178,722 0.09%
2,773,000 Zhou Hei Ya International Holdings Co Ltd 2,947,360 0.21%
170,344,705 12.32%

Jupiter Asset Management Series Plc Annual Report and Audited Financial Statements for the financial year ended 31 December 2020
Portfolio of Investments (continued) Jupiter Merian Global Equity Absolute Return Fund (continued)
125
Nominal Security Description Value USD % of Net
Assets
Common Stock (continued)
Energy - 0.68% (2019 - 4.49%)
1,739,000 China Coal Energy Co Ltd 522,651 0.04%
292,320 Deterra Royalties Ltd 1,086,097 0.07%
50,925 EQT Corp 661,007 0.05%
25,200 Inpex Corp 135,945 0.01%
59,994 Lundin Energy AB 1,633,856 0.12%
168,982 MRC Global Inc 1,118,661 0.08%
443,366 NOW Inc 3,156,766 0.23%
99,785 Subsea 7 SA 1,021,322 0.07%
100,045 Whitehaven Coal Ltd 127,389 0.01%
9,463,694 0.68%
Financial - 19.65% (2019 - 14.75%)
136,400 Acom Co Ltd 583,635 0.04%
64,044 Affiliated Managers Group Inc 6,464,601 0.47%
254,000 A-Living Smart City Services Co Ltd 1,127,063 0.08%
3,610 Alliance Data Systems Corp 265,985 0.02%
16,320 Artisan Partners Asset Management Inc 811,757 0.06%
183,934 Associated Banc-Corp 3,145,271 0.23%
800,780 Australia & New Zealand Banking Group Ltd 14,070,453 1.02%
1,744,631 Banco Bilbao Vizcaya Argentaria SA 8,694,638 0.63%
80,342 Bank OZK 2,511,491 0.18%
11,244 Boardwalk Real Estate Investment Trust 297,944 0.02%
1,303,000 BOC Hong Kong Holdings Ltd 3,949,738 0.29%
7,842 Brighthouse Financial Inc 280,508 0.02%
446,440 Cadence BanCorp 7,361,796 0.53%
5,756,500 China Galaxy Securities Co Ltd 3,608,700 0.26%
4,911,000 China Life Insurance Co Ltd 10,832,335 0.78%
4,935,000 CITIC Ltd 3,494,745 0.25%
63,508 Comerica Inc 3,539,936 0.26%
22,316 Corporate Office Properties Trust 573,075 0.04%
608,000 Country Garden Services Holdings Co Ltd 4,113,440 0.30%
15,200 Daito Trust Construction Co Ltd 1,421,704 0.10%
1,686,544 GAM Holding AG 4,145,044 0.30%
381,483 GEO Group Inc 3,433,347 0.25%
3,050,000 GF Securities Co Ltd 4,311,878 0.31%
160,856 Gjensidige Forsikring ASA 3,610,521 0.26%
75 GLP J-REIT 118,323 0.01%
3,211 Goldman Sachs Group Inc 833,094 0.06%
510,400 Hang Seng Bank Ltd 8,802,340 0.64%
199,700 Hong Kong Exchanges & Clearing Ltd 10,947,704 0.79%
2,306,200 Huatai Securities Co Ltd 3,629,216 0.26%
95,200 Hulic Co Ltd 1,046,539 0.08%
26,000 Hysan Development Co Ltd 95,414 0.01%

Jupiter Asset Management Series Plc Annual Report and Audited Financial Statements for the financial year ended 31 December 2020
Portfolio of Investments (continued) Jupiter Merian Global Equity Absolute Return Fund (continued)
126
Nominal Security Description Value USD % of Net
Assets
Common Stock (continued)
Financial - 19.65% (2019 - 14.75%) (continued)
55,707 Invesco Mortgage Capital Inc 187,176 0.01%
47,194 Janus Henderson Group PLC 1,534,277 0.11%
101,516 Jefferies Financial Group Inc 2,447,551 0.18%
3,485 KBC Group NV 246,758 0.02%
60,200 Keppel DC REIT 128,017 0.01%
64,000 Kerry Properties Ltd 162,135 0.01%
13,820 KKR Real Estate Finance Trust Inc 246,825 0.02%
5,980,500 KWG Group Holdings Ltd 8,161,673 0.59%
145,681 McMillan Shakespeare Ltd 1,397,151 0.10%
70,400 Mitsubishi Estate Co Ltd 1,131,837 0.08%
331 Mori Hills REIT Investment Corp 457,006 0.03%
60,900 MS&AD Insurance Group Holdings Inc 1,855,982 0.13%
83,750 Navient Corp 819,913 0.06%
889,300 New China Life Insurance Co Ltd 3,470,002 0.25%
136,960 NN Group NV 6,003,615 0.43%
1,626,483 Nordea Bank Abp 13,383,111 0.97%
1,830,300 Oversea-Chinese Banking Corp Ltd 13,934,324 1.01%
13,602 Physicians Realty Trust 242,252 0.02%
95,325 Piedmont Office Realty Trust Inc 1,539,499 0.11%
442,347 Ratos AB 2,090,374 0.15%
63,760 Realogy Holdings Corp 848,008 0.06%
2,343 RenaissanceRe Holdings Ltd 384,885 0.03%
101,000 Shanghai Industrial Holdings Ltd 138,097 0.01%
803,077 SITE Centers Corp 8,127,139 0.59%
3,700 Sompo Holdings Inc 149,809 0.01%
46,433 Starwood Property Trust Inc 895,228 0.06%
66,300 State Street Corp 4,801,446 0.35%
68,000 Sun Hung Kai Properties Ltd 877,132 0.06%
1,494,864 Suncorp Group Ltd 11,270,149 0.81%
3,213,800 Suruga Bank Ltd 10,539,600 0.76%
819,998 Svenska Handelsbanken AB 8,326,270 0.60%
89,609 Synovus Financial Corp 2,902,436 0.21%
1,433,600 T&D Holdings Inc 16,928,058 1.22%
6,101 Texas Capital Bancshares Inc 357,763 0.03%
33,293 TPG RE Finance Trust Inc 350,242 0.03%
824,100 United Overseas Bank Ltd 14,088,403 1.02%
218,994 Wells Fargo & Co 6,515,072 0.47%
71,375 Westpac Banking Corp 1,070,150 0.08%
133,749 Weyerhaeuser Co 4,500,654 0.33%
211,000 Wharf Real Estate Investment Co Ltd 1,098,202 0.08%
271,730,456 19.65%

Jupiter Asset Management Series Plc Annual Report and Audited Financial Statements for the financial year ended 31 December 2020
Portfolio of Investments (continued) Jupiter Merian Global Equity Absolute Return Fund (continued)
127
Nominal Security Description Value USD % of Net
Assets
Common Stock (continued)
Industrial - 10.54% (2019 - 9.07%)
25,818 Acuity Brands Inc 3,111,844 0.23%
100,447 Alfa Laval AB 2,792,722 0.20%
1,085,968 ALS Ltd 8,078,104 0.58%
336,100 Amada Co Ltd 3,694,767 0.27%
36,385 Astec Industries Inc 2,106,328 0.15%
51,103 AZZ Inc 2,398,775 0.17%
26,454 Barco NV 584,024 0.04%
17,899 Bilfinger SE 569,200 0.04%
5,586 Bucher Industries AG 2,573,911 0.19%
187,000 China High Speed Transmission Equipment Group Co Ltd 183,321 0.01%
3,466,000 China National Building Material Co Ltd 4,166,779 0.30%
2,376,000 China Resources Cement Holdings Ltd 2,654,119 0.19%
3,865,500 COSCO SHIPPING Holdings Co Ltd 4,637,081 0.34%
1,244,600 DMG Mori Co Ltd 18,947,038 1.37%
296,071 Epiroc AB 5,451,517 0.39%
185 Forbo Holding AG 318,589 0.02%
8,348 Gates Industrial Corp PLC 107,188 0.01%
271,221 GEA Group AG 9,859,997 0.71%
8,100 Glory Ltd 163,548 0.01%
285,968 Golden Ocean Group Ltd 1,327,715 0.10%
300,998 GrafTech International Ltd 3,127,369 0.23%
4,600 Hoya Corp 636,899 0.05%
265,500 Johnson Electric Holdings Ltd 657,539 0.05%
73,441 Kuehne + Nagel International AG 16,744,954 1.21%
72,788 LafargeHolcim Ltd 4,017,843 0.29%
2,932,000 Lonking Holdings Ltd 907,677 0.07%
5,340 Louisiana-Pacific Corp 200,464 0.01%
52,317 Manitowoc Co Inc 692,154 0.05%
15,424 MDU Resources Group Inc 399,482 0.03%
57,362 Mycronic AB 1,726,155 0.12%
7,600 Nippon Yusen KK 177,123 0.01%
9,300 Otsuka Corp 491,777 0.04%
2,872,000 Pacific Basin Shipping Ltd 540,871 0.04%
954,000 Shanghai Electric Group Co Ltd 292,874 0.02%
158,967 Signify NV 6,767,326 0.49%
1,091,000 SITC International Holdings Co Ltd 2,355,788 0.17%
39,743 SNC-Lavalin Group Inc 682,307 0.05%
535,000 Techtronic Industries Co Ltd 7,632,467 0.55%
154,403 Terex Corp 5,390,209 0.39%
1,051 Universal Display Corp 242,865 0.02%
31,604 Uponor OYJ 706,739 0.05%

Jupiter Asset Management Series Plc Annual Report and Audited Financial Statements for the financial year ended 31 December 2020
Portfolio of Investments (continued) Jupiter Merian Global Equity Absolute Return Fund (continued)
128
Nominal Security Description Value USD % of Net
Assets
Common Stock (continued)
Industrial - 10.54% (2019 - 9.07%) (continued)
257,392 Valmet OYJ 7,411,250 0.54%
1,000 Venture Corp Ltd 14,697 0.00%
123,600 Yamato Holdings Co Ltd 3,155,207 0.23%
5,882,800 Zoomlion Heavy Industry Science and Technology Co Ltd 7,057,048 0.51%
145,755,651 10.54%
Technology - 7.16% (2019 - 7.66%)
33,878 Activision Blizzard Inc 3,102,547 0.22%
61,844 Amkor Technology Inc 936,937 0.07%
34,992 ams AG 769,236 0.06%
3,967 Applied Materials Inc 345,050 0.02%
58,486 ASM International NV 12,990,891 0.94%
45,749 Autodesk Inc 13,697,708 0.99%
41,800 Capcom Co Ltd 2,717,313 0.20%
20,647 Cirrus Logic Inc 1,692,022 0.12%
120,463 Data#3 Ltd 523,101 0.04%
181,685 Dialog Semiconductor PLC 10,072,507 0.73%
87,843 Dropbox Inc 1,985,252 0.14%
21,489 DXC Technology Co 523,042 0.04%
99,373 Glu Mobile Inc 907,275 0.07%
190,087 Intel Corp 9,266,741 0.67%
42,816 Logitech International SA 4,175,643 0.30%
39,316 Manhattan Associates Inc 4,131,718 0.30%
3,094 Nemetschek SE 233,162 0.02%
546,000 NetDragon Websoft Holdings Ltd 1,224,048 0.09%
142,900 Nomura Research Institute Ltd 5,123,128 0.38%
3,208 NVIDIA Corp 1,686,863 0.12%
216,529 Oracle Corp 13,944,468 1.01%
7,528 Progress Software Corp 335,749 0.02%
36,677 QUALCOMM Inc 5,499,716 0.40%
55,473 Rovio Entertainment OYJ 432,338 0.03%
11,600 Seiko Epson Corp 172,314 0.01%
7,592 Skyworks Solutions Inc 1,159,678 0.08%
18,626 TeamViewer AG 1,004,038 0.07%
2,688 Teradyne Inc 323,340 0.02%
98,975,825 7.16%
Utilities - 3.99% (2019 - 3.20%)
456,011 AltaGas Ltd 6,711,417 0.49%
1,630,000 CGN Power Co Ltd 351,124 0.03%
4,650,000 China Longyuan Power Group Corp Ltd 4,660,473 0.34%
142,000 China Resources Power Holdings Co Ltd 152,943 0.01%
80,648 Endesa SA 2,223,165 0.16%
84,821 Hydro One Ltd 1,916,517 0.14%

Jupiter Asset Management Series Plc Annual Report and Audited Financial Statements for the financial year ended 31 December 2020
Portfolio of Investments (continued) Jupiter Merian Global Equity Absolute Return Fund (continued)
129
Nominal Security Description Value USD % of Net
Assets
Common Stock (continued)
Utilities - 3.99% (2019 - 3.20%) (continued)
50,921 National Fuel Gas Co 2,085,215 0.15%
110,805 Naturgy Energy Group SA 2,586,314 0.19%
6,200 Portland General Electric Co 260,772 0.02%
2,855,500 Power Assets Holdings Ltd 15,469,900 1.11%
49,500 Toho Gas Co Ltd 3,280,307 0.24%
635,200 Tokyo Electric Power Co Holdings Inc 1,676,363 0.12%
113,500 Tokyo Gas Co Ltd 2,625,371 0.19%
241,070 UGI Corp 8,302,451 0.59%
147,941 Vistra Corp 2,883,370 0.21%
55,185,702 3.99%
Total Common Stock 1,023,514,819 74.01%
Preferred Stock
Consumer, Non-cyclical - 0.06% (2019 - 0.00%)
9,956 Draegerwerk AG & Co KGaA 769,828 0.06%
769,828 0.06%
Government Security - 19.52% (2019 - 31.46%) Coupon
Rate Maturity
Date
80,000,000 United States Treasury Bill 0.00 27/05/2021 79,972,864 5.78%
190,000,000 United States Treasury Bill 0.00 01/07/2021 189,999,278 13.74%
269,972,142 19.52%
Total Transferable Securities 1,294,256,789 93.59%
Contracts For Difference - 2.51% (2019 - 1.20%)
Counterparty Nominal Security Description Unrealised
Gain USD
Bank of America Merrill Lynch 7,449,047 A2A SpA 463,986 0.03%
Bank of America Merrill Lynch 1,236,062 Aggreko PLC 21,087 0.00%
Bank of America Merrill Lynch (1,511,293) AS006 431,322 0.03%
Bank of America Merrill Lynch (42,080) AS010 14,332 0.00%
Bank of America Merrill Lynch 2,914,000 ASE Technology Holding Co Ltd 282,113 0.02%
Bank of America Merrill Lynch (244,643) AU003 587,034 0.04%
Bank of America Merrill Lynch (122,361) AU020 36,938 0.00%
Bank of America Merrill Lynch (1,541,829) AU023 417,708 0.03%
Bank of America Merrill Lynch (529,956) AU035 20,511 0.00%
Bank of America Merrill Lynch (678,463) AU048 36,762 0.00%
Bank of America Merrill Lynch (2,387,934) AU061 545,272 0.04%
Bank of America Merrill Lynch (1,835,855) AU064 127,894 0.01%
Bank of America Merrill Lynch (66,481) AU073 - 0.00%
Bank of America Merrill Lynch (560,731) AU076 39,335 0.00%
Bank of America Merrill Lynch (2,790,362) AU102 10,799 0.00%

Jupiter Asset Management Series Plc Annual Report and Audited Financial Statements for the financial year ended 31 December 2020
Portfolio of Investments (continued) Jupiter Merian Global Equity Absolute Return Fund (continued)
130
Contracts For Difference - 2.51% (2019 - 1.20%) (continued)
Counterparty Nominal Security Description Unrealised
Gain USD % of Net
Assets
Bank of America Merrill Lynch (703,588) AU104 65,353 0.00%
Bank of America Merrill Lynch (57,042) AU106 22,960 0.00%
Bank of America Merrill Lynch (1,100,353) AU107 4,259 0.00%
Bank of America Merrill Lynch (1,984,127) AU110 141,315 0.01%
Bank of America Merrill Lynch (3,401,009) AU111 52,651 0.00%
Bank of America Merrill Lynch (126,391) AU112 8,948 0.00%
Bank of America Merrill Lynch (372,600) BR019 8,608 0.00%
Bank of America Merrill Lynch (3,900) BR025 413 0.00%
Bank of America Merrill Lynch (78,035) BR06 88,338 0.01%
Bank of America Merrill Lynch 468,504 Buzzi Unicem SpA 73,315 0.01%
Bank of America Merrill Lynch (35,873) CA055 144,529 0.01%
Bank of America Merrill Lynch (342,519) CA061 135,914 0.01%
Bank of America Merrill Lynch (56,193) CA067 37,071 0.00%
Bank of America Merrill Lynch 756,024 Centamin PLC 35,598 0.00%
Bank of America Merrill Lynch 753,000 China Steel Corp 11,802 0.00%
Bank of America Merrill Lynch 4,159 CJ CheilJedang Corp 2,597 0.00%
Bank of America Merrill Lynch (604,000) CN024 4,675 0.00%
Bank of America Merrill Lynch (4,520,000) CN089 40,812 0.00%
Bank of America Merrill Lynch (644,000) CN096 3,323 0.00%
Bank of America Merrill Lynch (113,500) CN124 542,082 0.04%
Bank of America Merrill Lynch 13,403 Coway Co Ltd 27,101 0.00%
Bank of America Merrill Lynch 227,988 Dongkuk Steel Mill Co Ltd 51,515 0.00%
Bank of America Merrill Lynch 4,881,000 Evergreen Marine Corp Taiwan Ltd 1,927,404 0.14%
Bank of America Merrill Lynch (253,261) GB078 240,227 0.02%
Bank of America Merrill Lynch (95,845) GB080 255,078 0.02%
Bank of America Merrill Lynch 157,000 Global Unichip Corp 81,001 0.01%
Bank of America Merrill Lynch 5,320,576 Goldsun Building Materials Co Ltd 63,953 0.00%
Bank of America Merrill Lynch 64,725 Hera SpA 4,369 0.00%
Bank of America Merrill Lynch (3,219,000) HK012 174,392 0.01%
Bank of America Merrill Lynch (7,738,000) HK036 59,887 0.00%
Bank of America Merrill Lynch (2,338,000) HK043 30,158 0.00%
Bank of America Merrill Lynch (1,719,500) HK050 97,591 0.01%
Bank of America Merrill Lynch (11,267,000) HK057 501,195 0.04%
Bank of America Merrill Lynch (2,528,000) HK062 39,130 0.00%
Bank of America Merrill Lynch (5,636,000) HK064 232,636 0.02%
Bank of America Merrill Lynch 201,830 HMM Co Ltd 91,923 0.01%
Bank of America Merrill Lynch 205,930 Hyundai Steel Co 43,084 0.00%
Bank of America Merrill Lynch 2,697,000 Innolux Corp 16,444 0.00%
Bank of America Merrill Lynch (81,461) IT021 2,849 0.00%
Bank of America Merrill Lynch (200,271) IT036 55,797 0.00%
Bank of America Merrill Lynch (415,726) IT037 69,393 0.01%
Bank of America Merrill Lynch (643,300) JP007 137,317 0.01%
Bank of America Merrill Lynch (175,400) JP018 197,413 0.01%
Bank of America Merrill Lynch (21,100) JP028 7,165 0.00%
Bank of America Merrill Lynch (404,100) JP050 58,812 0.00%

Jupiter Asset Management Series Plc Annual Report and Audited Financial Statements for the financial year ended 31 December 2020
Portfolio of Investments (continued) Jupiter Merian Global Equity Absolute Return Fund (continued)
131
Contracts For Difference - 2.51% (2019 - 1.20%) (continued)
Counterparty Nominal Security Description Unrealised
Gain USD % of Net
Assets
Bank of America Merrill Lynch (36,100) JP075 8,056 0.00%
Bank of America Merrill Lynch (58,200) JP102 330,345 0.02%
Bank of America Merrill Lynch (8,300) JP127 55,808 0.00%
Bank of America Merrill Lynch (7,800) JP139 1,514 0.00%
Bank of America Merrill Lynch (121,300) JP154 176,539 0.01%
Bank of America Merrill Lynch (321,300) JP178 1,303,094 0.09%
Bank of America Merrill Lynch (69,600) JP200 22,285 0.00%
Bank of America Merrill Lynch (242,000) JP216 32,872 0.00%
Bank of America Merrill Lynch (479,700) JP229 428,199 0.04%
Bank of America Merrill Lynch (5,700) JP232 7,466 0.00%
Bank of America Merrill Lynch (2,700) JP235 4,192 0.00%
Bank of America Merrill Lynch (11,100) JP241 7,539 0.00%
Bank of America Merrill Lynch (178,900) JP244 8,679 0.00%
Bank of America Merrill Lynch (22,600) JP255 37,277 0.00%
Bank of America Merrill Lynch (22,500) JP280 24,232 0.00%
Bank of America Merrill Lynch (208,600) JP285 - 0.00%
Bank of America Merrill Lynch (13,200) JP286 10,246 0.00%
Bank of America Merrill Lynch (6,400) JP287 35,395 0.00%
Bank of America Merrill Lynch 38,637 Kia Motors Corp 11,988 0.00%
Bank of America Merrill Lynch (3,688,800) KY006 214,118 0.03%
Bank of America Merrill Lynch 21,006 Lotte Corp 20,135 0.00%
Bank of America Merrill Lynch 4,582 Lotte Shopping Co Ltd 9,306 0.00% Bank of America Merrill Lynch 2,057,000 Macronix International 136,305 0.01% Bank of America Merrill Lynch 15,067 Mando Corp 73,191 0.01% Bank of America Merrill Lynch 502,000 MediaTek Inc 840,975 0.06% Bank of America Merrill Lynch (8,370,000) MO002 539,823 0.04% Bank of America Merrill Lynch 576,717 Netcare Ltd 22,401 0.00% Bank of America Merrill Lynch (24,787) NL033 259,520 0.02% Bank of America Merrill Lynch (718,454) NZ005 88,409 0.01% Bank of America Merrill Lynch (177,824) NZ009 41,190 0.00% Bank of America Merrill Lynch 177,118 Pan Ocean Co Ltd 138,487 0.01% Bank of America Merrill Lynch 315,000 Pixart Imaging Inc 3,289 0.00% Bank of America Merrill Lynch 2,017,000 Quanta Computer Inc 152,223 0.01%
Bank of America Merrill Lynch 84,042 Reinet Investments SCA 43,696 0.00%
Bank of America Merrill Lynch (5,706) SA010 6,289 0.00%
Bank of America Merrill Lynch (107,600) SG012 8,076 0.00%
Bank of America Merrill Lynch (839,500) SG014 25,412 0.00%
Bank of America Merrill Lynch (2,022,100) SG024 30,605 0.00%
Bank of America Merrill Lynch (2,538,200) SG025 19,208 0.00%
Bank of America Merrill Lynch (2,209,700) SG026 167,224 0.01%
Bank of America Merrill Lynch (2,648,300) SG028 75,007 0.01%
Bank of America Merrill Lynch (2,893) SK005 39,678 0.00%
Bank of America Merrill Lynch (31,645) SK020 6,825 0.00%
Bank of America Merrill Lynch 633,000 Taiwan Glass Industry Corp 14,725 0.00%

Jupiter Asset Management Series Plc Annual Report and Audited Financial Statements for the financial year ended 31 December 2020
Portfolio of Investments (continued) Jupiter Merian Global Equity Absolute Return Fund (continued)
132
Contracts For Difference - 2.51% (2019 - 1.20%) (continued)
Counterparty Nominal Security Description Unrealised
Gain USD % of Net
Assets
Bank of America Merrill Lynch 107,000 Taiwan Semiconductor Manufacturing Co Ltd 71,525 0.02%
Bank of America Merrill Lynch 1,303,000 Tung Ho Steel Enterprise Corp 76,671 0.01%
Bank of America Merrill Lynch (3,777,000) TW010 19,954 0.00%
Bank of America Merrill Lynch (572,000) TW017 42,525 0.00%
Bank of America Merrill Lynch (117,000) TW021 520,164 0.05%
Bank of America Merrill Lynch (1,517,000) TW043 18,412 0.00%
Bank of America Merrill Lynch (1,988,000) TW081 15,067 0.00%
Bank of America Merrill Lynch 1,103,000 U-Ming Marine Transport Corp 186,432 0.01%
Bank of America Merrill Lynch 8,116,000 United Microelectronics Corp 669,716 0.05%
Bank of America Merrill Lynch (25,071) US011 119,087 0.01%
Bank of America Merrill Lynch (144,214) US545 364,861 0.04%
Bank of America Merrill Lynch (24,164) US618 41,804 0.00%
Bank of America Merrill Lynch (45,946) US647 64,324 0.00%
Bank of America Merrill Lynch (39,967) US681 150,276 0.01%
Bank of America Merrill Lynch (53,139) US682 - 0.00%
Bank of America Merrill Lynch (34,525) US687 24,858 0.00%
Bank of America Merrill Lynch (85,600) US809 421,880 0.04%
Bank of America Merrill Lynch 113,600 Usinas Siderurgicas de Minas Gerais SA Usiminas 17,278 0.00%
Bank of America Merrill Lynch 509,000 Vanguard International Semiconductor Corp 63,158 0.00%
Bank of America Merrill Lynch 2,456,000 Winbond Electronics Corp 431,527 0.04%
Citibank (52,000) BR021 13,115 0.00%
Citibank (83,300) BR032 9,462 0.00%
Citibank 499,600 Cia Paranaense de Energia 230,842 0.03%
Citibank 1,683,000 Novatek Microelectronics Corp 3,252,482 0.24%
Citibank 1,159,900 Qualicorp Consultoria e Corretora de Seguros SA 107,187 0.01%
Citibank (253,214) SK022 891,455 0.07%
Citibank (24,428) SK026 54,337 0.00%
Citibank 829,200 TOTVS SA 541,177 0.04%
Citibank 73,700 WEG SA 67,255 0.00%
Goldman Sachs 24,951 Atos SE 46,951 0.00%
Goldman Sachs (47,266) BD004 18,163 0.00%
Goldman Sachs 29,200 Bollore SA 6,451 0.00%
Goldman Sachs (9,065) CA056 14,595 0.00%
Goldman Sachs (253,826) CA059 149,509 0.01%
Goldman Sachs 7,204 Capgemini SE 85,103 0.01%
Goldman Sachs 227,823 Carrefour SA 122,241 0.01%
Goldman Sachs 9,565,307 Centrica PLC 248,693 0.02%
Goldman Sachs (169,300) CN057 675,384 0.05%
Goldman Sachs 57,553 Dunelm Group PLC 38,096 0.00%
Goldman Sachs (109,510) FR031 576,606 0.04%
Goldman Sachs (133,559) FR035 145,072 0.01%
Goldman Sachs (57,021) FR063 125,973 0.01%
Goldman Sachs (14,682) FR089 9,565 0.00%
Goldman Sachs (143,941) GB073 38,210 0.00%
Goldman Sachs (30,706) GB076 15,561 0.00%

Jupiter Asset Management Series Plc Annual Report and Audited Financial Statements for the financial year ended 31 December 2020
Portfolio of Investments (continued) Jupiter Merian Global Equity Absolute Return Fund (continued)
133
Contracts For Difference - 2.51% (2019 - 1.20%) (continued)
Counterparty Nominal Security Description Unrealised
Gain USD % of Net
Assets
Goldman Sachs (72,473) GB093 63,006 0.00%
Goldman Sachs (13,067) GB119 4,624 0.00%
Goldman Sachs (954,294) GB139 307,371 0.02%
Goldman Sachs (41,467) GB264 75,885 0.01%
Goldman Sachs (261,086) GB343 949,620 0.07%
Goldman Sachs (178,882) GB344 59,171 0.00%
Goldman Sachs (541,178) GB345 28,805 0.00%
Goldman Sachs 257,259 Great Portland Estates PLC 38,622 0.00%
Goldman Sachs 51,569 Hochschild Mining PLC 8,754 0.00%
Goldman Sachs 10,015,959 ITV PLC 1,062,825 0.08%
Goldman Sachs 1,437,741 Man Group PLC/Jersey 238,411 0.03%
Goldman Sachs 85,891 Moneysupermarket.com Group PLC 17,584 0.00%
Goldman Sachs 96,622 National Grid PLC 6,361 0.00%
Goldman Sachs 94,938 Natwest Group PLC 259 0.00%
Goldman Sachs 178,349 Pagegroup PLC 21,420 0.00%
Goldman Sachs 792,421 Pearson PLC 106,688 0.01%
Goldman Sachs 98,183 Publicis Groupe SA 183,599 0.01%
Goldman Sachs 44,007 Renault SA 15,799 0.00%
Goldman Sachs 294,070 Rexel SA 368,145 0.03%
Goldman Sachs 1,725,901 Rightmove PLC 697,231 0.05%
Goldman Sachs 43,258 Sanofi 70,640 0.01%
Goldman Sachs (12,956) SE047 6,994 0.00%
Goldman Sachs 9,259 Trigano SA 85,798 0.01%
Goldman Sachs (22,665) US061 4,533 0.00%
Goldman Sachs (119,262) US070 125,225 0.01%
Goldman Sachs (16,325) US163 26,120 0.00%
Goldman Sachs (112,671) US323 191,863 0.01%
Goldman Sachs (98,316) US458 99,358 0.01%
Goldman Sachs (25,564) US489 27,353 0.00%
Goldman Sachs (241,890) US546 203,188 0.01%
Goldman Sachs (50,129) US560 393,483 0.03%
Goldman Sachs (101,817) US596 31,563 0.00%
Goldman Sachs (8,086) US635 72,289 0.01%
Goldman Sachs (38,350) US692 75,166 0.01%
Goldman Sachs (124,140) US723 292,970 0.02%
Goldman Sachs (20,001) US757 90,274 0.01%
Goldman Sachs (33,370) US764 26,696 0.00%
Goldman Sachs (30,906) US765 4,636 0.00%
Goldman Sachs (3,480) US768 11,310 0.00%
Goldman Sachs (1,714) US771 162,196 0.01%
Goldman Sachs (115,170) US772 182,443 0.01%
Goldman Sachs (32,142) US778 51,427 0.00%
Goldman Sachs (71,206) US779 85,447 0.01%
Goldman Sachs (5,485) US780 8,831 0.00%

Jupiter Asset Management Series Plc Annual Report and Audited Financial Statements for the financial year ended 31 December 2020
Portfolio of Investments (continued) Jupiter Merian Global Equity Absolute Return Fund (continued)
134
Contracts For Difference - 2.51% (2019 - 1.20%) (continued)
Counterparty Nominal Security Description Unrealised
Gain USD % of Net
Assets
Goldman Sachs (165,566) US788 334,443 0.02%
Goldman Sachs (5,292) US792 214,220 0.02%
Goldman Sachs (36,811) US793 400,872 0.04%
Goldman Sachs (27,928) US795 58,876 0.00%
Goldman Sachs (1,764) US803 85,360 0.01%
Goldman Sachs (26,214) US805 20,709 0.00%
Goldman Sachs 431,272 Vivendi SA 801,554 0.06% Morgan Stanley (86,539) BE007 4,241 0.00% Morgan Stanley (112,286) DE019 114,386 0.01% Morgan Stanley (107,849) DE033 124,426 0.01% Morgan Stanley (267,511) DE062 65,666 0.00% Morgan Stanley (6,104) DE072 11,238 0.00% Morgan Stanley (194,266) ES005 222,934 0.02% Morgan Stanley (14,944) IE013 70,363 0.01% Morgan Stanley (360,781) NL001 79,262 0.01% Morgan Stanley (34,924) NL029 147,410 0.01% Morgan Stanley (26,289) NL043 12,100 0.00% Morgan Stanley (909,586) PT004 66,983 0.00% Morgan Stanley (320,754) PT005 27,557 0.00% Morgan Stanley (17,039) SE020 1,252 0.00% Morgan Stanley (81,473) SE034 28,926 0.00% Morgan Stanley (65,049) SE043 796 0.00% Morgan Stanley (472,993) SE044 24,610 0.00% Morgan Stanley (14,906) SE046 4,792 0.00%
34,717,296 2.51%
Currency Exchange Contracts - 1.99% (2019 - 0.65%)
Actual Settle Date
Issue Currency
Currency Bought
Settle Currency
Currency Sold
Australia And New Zealand Banking Group 29/01/2021 USD 3,774,805 HKD 29,260,721 55 0.00%
Canadian Imperial Bank 29/01/2021 AUD 7,626,824 USD 5,795,494 109,750 0.01%
Citibank 15/01/2021 CHF 5,989,390 USD 6,746,761 55,747 0.00%
Citibank 15/01/2021 CNH 234,584 USD 35,807 218 0.00%
Citibank 15/01/2021 EUR 488,048,756 USD 592,481,159 6,753,395 0.48%
Citibank 15/01/2021 GBP 443,339,223 USD 584,933,202 20,214,639 1.48%
Citibank 15/01/2021 SEK 2,090,726 USD 247,022 8,991 0.00%
Citibank 15/01/2021 SGD 1,454,181 USD 1,087,624 12,869 0.00%
HSBC 29/01/2021 JPY 414,084,863 USD 3,968,345 50,804 0.00%
JP Morgan Securities 29/01/2021 CHF 3,747,600 USD 4,220,036 38,223 0.00%
Morgan Stanley 29/01/2021 EUR 20,935,734 USD 25,440,888 273,009 0.02%
Toronto Dominion Bank 29/01/2021 CHF 3,598,281 USD 4,084,641 3,952 0.00%
Toronto Dominion Bank 29/01/2021 USD 175,199,650 HKD 1,357,859,487 30,342 0.00%
Unrealised Gain on Currency Exchange Contracts at 31 December 2020 27,551,994 1.99%

Jupiter Asset Management Series Plc Annual Report and Audited Financial Statements for the financial year ended 31 December 2020
Portfolio of Investments (continued) Jupiter Merian Global Equity Absolute Return Fund (continued)
135
Value USD % of Net
Assets
Total Financial Derivatives Instruments 62,269,290 4.50%
Financial Assets at Fair Value Through Profit or Loss (Cost USD 1,139,711,312) (2019: USD 3,500,466,309) 1,356,526,079 98.09%
Contracts For Difference - (2.62%) (2019 - (2.39%))
Counterparty Nominal Security Description Unrealised
Loss USD Bank of America Merrill Lynch 7,675,000 Acer Inc (153,769) (0.01%)
Bank of America Merrill Lynch (65,660) AU038 (11,962) (0.00%)
Bank of America Merrill Lynch (336,015) AU043 (33,409) (0.00%)
Bank of America Merrill Lynch (9,937) AU067 (2,000) (0.00%)
Bank of America Merrill Lynch (323,662) AU090 (12,527) (0.00%)
Bank of America Merrill Lynch (184,465) AU101 (25,701) (0.00%)
Bank of America Merrill Lynch (10,747) AU103 (38,017) (0.00%)
Bank of America Merrill Lynch (70,570) AU105 (22,396) (0.00%)
Bank of America Merrill Lynch (254,056) AU108 (35,171) (0.00%)
Bank of America Merrill Lynch (99,515) AU113 (40,055) (0.00%)
Bank of America Merrill Lynch 3,155,331 Aviva PLC (77,515) (0.01%)
Bank of America Merrill Lynch 281,069 Barloworld Ltd (22,934) (0.00%)
Bank of America Merrill Lynch 192,757 BNK Financial Group Inc (40,527) (0.00%)
Bank of America Merrill Lynch (374,700) BR05 (84,401) (0.01%)
Bank of America Merrill Lynch (67,141) CA069 (24,783) (0.00%)
Bank of America Merrill Lynch 346,000 Cheng Shin Rubber Industry Co Ltd (19,458) (0.00%)
Bank of America Merrill Lynch (2,608,000) CN007 (127,834) (0.01%)
Bank of America Merrill Lynch (493,000) CN025 (41,335) (0.00%)
Bank of America Merrill Lynch (33,500) CN050 (3,457) (0.00%)
Bank of America Merrill Lynch (152,900) CN059 (258,366) (0.03%)
Bank of America Merrill Lynch (7,919,726) CN078 (337,117) (0.02%)
Bank of America Merrill Lynch (1,171,000) CN093 (4,531) (0.00%)
Bank of America Merrill Lynch (21,450,000) CN109 (27,668) (0.00%)
Bank of America Merrill Lynch (26) CN120 (54) (0.00%)
Bank of America Merrill Lynch (239,500) CN121 (70,436) (0.01%)
Bank of America Merrill Lynch (847,000) CN125 (163,882) (0.01%)
Bank of America Merrill Lynch (824,500) CN126 (138,258) (0.01%)
Bank of America Merrill Lynch 45,457 E-MART Inc (10,324) (0.00%)
Bank of America Merrill Lynch (68,759) GB218 (182,054) (0.01%)
Bank of America Merrill Lynch (477,273) GB232 (517,849) (0.04%)
Bank of America Merrill Lynch (221,113) GB245 (745,384) (0.05%)
Bank of America Merrill Lynch (629,512) GB251 (106,106) (0.01%)
Bank of America Merrill Lynch (470,358) GB274 (32,739) (0.00%)
Bank of America Merrill Lynch 26,000 Gourmet Master Co Ltd (17,355) (0.00%)
Bank of America Merrill Lynch 13,024 Hankook Tire & Technology Co Ltd (864) (0.00%)
Bank of America Merrill Lynch (1,945,000) HK004 (263,430) (0.02%)
Bank of America Merrill Lynch (10,918,000) HK025 (112,665) (0.01%)

Jupiter Asset Management Series Plc Annual Report and Audited Financial Statements for the financial year ended 31 December 2020
Portfolio of Investments (continued) Jupiter Merian Global Equity Absolute Return Fund (continued)
136
Contracts For Difference - (2.62%) (2019 - (2.39%)) (continued)
Counterparty Nominal Security Description Unrealised
Loss USD % of Net
Assets
Bank of America Merrill Lynch (1,345,000) HK026 (373,007) (0.04%)
Bank of America Merrill Lynch (2,769,000) HK053 (67,863) (0.00%)
Bank of America Merrill Lynch (445,200) HK055 (71,783) (0.01%)
Bank of America Merrill Lynch (13,420,000) HK059 (363,520) (0.04%)
Bank of America Merrill Lynch (1,126,000) HK063 (225,126) (0.02%)
Bank of America Merrill Lynch (407,194) IT025 (201,157) (0.01%)
Bank of America Merrill Lynch (441,893) IT038 (213,146) (0.02%)
Bank of America Merrill Lynch (130,255) IT039 (47,161) (0.00%)
Bank of America Merrill Lynch (66,200) JP041 (163,790) (0.01%)
Bank of America Merrill Lynch (3,500) JP064 (17,659) (0.00%)
Bank of America Merrill Lynch (55,100) JP074 (58,808) (0.00%)
Bank of America Merrill Lynch (34,200) JP124 (77,980) (0.01%)
Bank of America Merrill Lynch (188,100) JP184 (20,076) (0.00%)
Bank of America Merrill Lynch (12,800) JP218 (47,612) (0.00%)
Bank of America Merrill Lynch (20,300) JP236 (51,210) (0.00%)
Bank of America Merrill Lynch (119,100) JP237 (36,979) (0.00%)
Bank of America Merrill Lynch (22,500) JP239 (10,915) (0.00%)
Bank of America Merrill Lynch (143,000) JP240 (443,991) (0.03%)
Bank of America Merrill Lynch (290,400) JP243 (126,794) (0.01%)
Bank of America Merrill Lynch (5,100) JP278 (2,969) (0.00%)
Bank of America Merrill Lynch (17,200) JP279 (99,297) (0.01%)
Bank of America Merrill Lynch (17,600) JP281 (47,814) (0.00%)
Bank of America Merrill Lynch (17,300) JP282 (20,478) (0.00%)
Bank of America Merrill Lynch (145,900) JP283 (92,015) (0.01%)
Bank of America Merrill Lynch (23,800) JP284 (5,092) (0.00%)
Bank of America Merrill Lynch 173,119 KB Financial Group Inc (370,999) (0.03%)
Bank of America Merrill Lynch 879,276 Kingfisher PLC (7,200) (0.00%)
Bank of America Merrill Lynch 16,551 Kumho Petrochemical Co Ltd (14,810) (0.00%)
Bank of America Merrill Lynch 3,922 LOTTE Himart Co Ltd (1,006) (0.00%)
Bank of America Merrill Lynch 8,085 LS Corp (16,239) (0.00%)
Bank of America Merrill Lynch 221,804 Mirae Asset Daewoo Co Ltd (19,823) (0.00%)
Bank of America Merrill Lynch 1,422 Naspers Ltd (8,756) (0.00%)
Bank of America Merrill Lynch (409,157) NZ006 (82,927) (0.01%)
Bank of America Merrill Lynch (155,299) NZ007 (17,986) (0.00%)
Bank of America Merrill Lynch 8,726,541 Old Mutual Ltd (169,476) (0.01%)
Bank of America Merrill Lynch 14,690 Orion Corp/Republic of Korea (28,559) (0.00%)
Bank of America Merrill Lynch 309,000 Pou Chen Corp (1,120) (0.00%)
Bank of America Merrill Lynch 404,523 Resilient REIT Ltd (15,988) (0.00%)
Bank of America Merrill Lynch (176,224) RO01 (10,836) (0.00%)
Bank of America Merrill Lynch 803,229 Royal Mail PLC (142,512) (0.01%)
Bank of America Merrill Lynch (287,955) SA007 (7,849) (0.00%)
Bank of America Merrill Lynch (486,028) SA017 (36,100) (0.00%)
Bank of America Merrill Lynch (79,381) SA021 (11,035) (0.00%)
Bank of America Merrill Lynch (132,726) SA024 (16,868) (0.00%)

Jupiter Asset Management Series Plc Annual Report and Audited Financial Statements for the financial year ended 31 December 2020
Portfolio of Investments (continued) Jupiter Merian Global Equity Absolute Return Fund (continued)
137
Contracts For Difference - (2.62%) (2019 - (2.39%)) (continued)
Counterparty Nominal Security Description Unrealised
Loss USD % of Net
Assets
Bank of America Merrill Lynch (10,590) SA044 (15,151) (0.00%)
Bank of America Merrill Lynch (379,300) SG027 (31,245) (0.00%)
Bank of America Merrill Lynch (2,603,034) SK021 (284,531) (0.02%)
Bank of America Merrill Lynch (60,413) SK030 (20,126) (0.00%)
Bank of America Merrill Lynch (18,630) SK031 (39,817) (0.00%)
Bank of America Merrill Lynch (8,833) SK062 (1,726) (0.00%)
Bank of America Merrill Lynch 52,081 Tiger Brands Ltd (13,042) (0.00%)
Bank of America Merrill Lynch (2,072,000) TW001 (317,729) (0.02%)
Bank of America Merrill Lynch (18,553,000) TW006 (293,787) (0.02%)
Bank of America Merrill Lynch (3,563,500) TW022 (419,150) (0.04%)
Bank of America Merrill Lynch (1,104,000) TW029 (249,019) (0.02%)
Bank of America Merrill Lynch (1,820,000) TW038 (40,582) (0.00%)
Bank of America Merrill Lynch (1,972,000) TW046 (63,974) (0.00%)
Bank of America Merrill Lynch (281,000) TW048 (2,139) (0.00%)
Bank of America Merrill Lynch (9,269,000) TW051 (737,089) (0.05%)
Bank of America Merrill Lynch (10,410,070) TW057 (234,050) (0.02%)
Bank of America Merrill Lynch (5,209,729) TW060 (62,833) (0.00%)
Bank of America Merrill Lynch (5,924,350) TW067 (69,712) (0.01%)
Bank of America Merrill Lynch (13,579,850) TW073 (74,743) (0.01%)
Bank of America Merrill Lynch (141,000) TW088 (6,373) (0.00%)
Bank of America Merrill Lynch (45,000) TW094 (32,838) (0.00%)
Bank of America Merrill Lynch (88,210) US267 (221,407) (0.02%)
Bank of America Merrill Lynch (22,180) US609 (63,213) (0.00%)
Bank of America Merrill Lynch (19,034) US631 (156,269) (0.01%)
Bank of America Merrill Lynch (63,874) US680 (235,056) (0.02%)
Bank of America Merrill Lynch (41,850) US753 (6,696) (0.00%)
Bank of America Merrill Lynch (4,161) US766 (44,772) (0.00%)
Bank of America Merrill Lynch (32,859) US773 (181,382) (0.01%)
Bank of America Merrill Lynch 292,200 YDUQS Participacoes SA (46,692) (0.00%)
Citibank (729,600) BR01 (275,310) (0.02%)
Citibank (1,106,700) BR010 (1,517,016) (0.11%)
Citibank 32,800 Cia de Saneamento Basico do Estado de Sao Paulo (17,365) (0.00%)
Citibank 1,017,000 Realtek Semiconductor Corp (108,537) (0.01%)
Goldman Sachs 11,650 Accor SA (24,594) (0.00%)
Goldman Sachs 16,467 AstraZeneca PLC (43,479) (0.00%)
Goldman Sachs (82,295) BD003 (68,305) (0.00%)
Goldman Sachs (31,627) CA018 (24,342) (0.00%)
Goldman Sachs (115,135) CA023 (24,414) (0.00%)
Goldman Sachs (5,892) CA068 (19,851) (0.00%)
Goldman Sachs (18,600) CN059 (562,244) (0.05%)
Goldman Sachs (68,900) CN092 (53,053) (0.00%)
Goldman Sachs (648,600) CN123 (177,636) (0.01%)
Goldman Sachs 102,473 CNP Assurances (5,031) (0.00%)
Goldman Sachs 272,582 Eutelsat Communications SA (64,474) (0.00%)

Jupiter Asset Management Series Plc Annual Report and Audited Financial Statements for the financial year ended 31 December 2020
Portfolio of Investments (continued) Jupiter Merian Global Equity Absolute Return Fund (continued)
138
Contracts For Difference - (2.62%) (2019 - (2.39%)) (continued)
Counterparty Nominal Security Description Unrealised
Loss USD % of Net
Assets
Goldman Sachs (253,825) FR026 (688,486) (0.05%)
Goldman Sachs (46,567) GB109 (80,552) (0.01%)
Goldman Sachs (264,990) GB186 (268,756) (0.02%)
Goldman Sachs (194,244) GB347 (266,203) (0.02%)
Goldman Sachs 92,947 HSBC Holdings PLC (40,498) (0.00%)
Goldman Sachs (46,997) NL044 (136,994) (0.01%)
Goldman Sachs 183,790 Plus500 Ltd (268,395) (0.02%)
Goldman Sachs (20,887) PR001 (79,579) (0.01%)
Goldman Sachs 33 Remy Cointreau SA (23) (0.00%)
Goldman Sachs 100,991 Royal Dutch Shell PLC (127,219) (0.01%)
Goldman Sachs 17,852 Sartorius Stedim Biotech (46,012) (0.00%)
Goldman Sachs 70,622 Societe BIC SA (335,444) (0.02%)
Goldman Sachs 223,125 STMicroelectronics NV (735,061) (0.06%)
Goldman Sachs (11,814) SZ058 (139,996) (0.01%)
Goldman Sachs (5,996) SZ059 (1,072) (0.00%)
Goldman Sachs (8,035) US108 (7,475) (0.00%)
Goldman Sachs (2,131) US173 (980) (0.00%)
Goldman Sachs (769) US194 (1,600) (0.00%)
Goldman Sachs (870) US195 (339) (0.00%)
Goldman Sachs (19,046) US215 (31,426) (0.00%)
Goldman Sachs (259,624) US228 (321,934) (0.02%)
Goldman Sachs (31,352) US241 (948,398) (0.08%)
Goldman Sachs (33,092) US246 (3,640) (0.00%)
Goldman Sachs (11,732) US252 (36,604) (0.00%)
Goldman Sachs (29,413) US380 (109,416) (0.01%)
Goldman Sachs (5,374) US413 (73,194) (0.01%)
Goldman Sachs (41,034) US418 (176,446) (0.01%)
Goldman Sachs (77,951) US452 (558,129) (0.05%)
Goldman Sachs (19,349) US515 (169,691) (0.01%)
Goldman Sachs (1,577) US539 (2,082) (0.00%)
Goldman Sachs (13,007) US598 (31,664) (0.00%)
Goldman Sachs (749) US601 (30,904) (0.00%)
Goldman Sachs (3,449) US617 (170,156) (0.01%)
Goldman Sachs (40,832) US622 (817) (0.00%)
Goldman Sachs (9,980) US628 (173,353) (0.01%)
Goldman Sachs (21,430) US629 (331,522) (0.02%)
Goldman Sachs (42,282) US666 (499,350) (0.04%)
Goldman Sachs (14,379) US667 (85,699) (0.01%)
Goldman Sachs (52,644) US669 (37,904) (0.00%)
Goldman Sachs (110,190) US670 (192,833) (0.01%)
Goldman Sachs (32,837) US671 (13,865) (0.00%)
Goldman Sachs (155,487) US672 (391,827) (0.03%)
Goldman Sachs (56,523) US674 (14,131) (0.00%)
Goldman Sachs (33,443) US676 (89,962) (0.01%)

Jupiter Asset Management Series Plc Annual Report and Audited Financial Statements for the financial year ended 31 December 2020
Portfolio of Investments (continued) Jupiter Merian Global Equity Absolute Return Fund (continued)
139
Contracts For Difference - (2.62%) (2019 - (2.39%)) (continued)
Counterparty Nominal Security Description Unrealised
Loss USD % of Net
Assets
Goldman Sachs (35,973) US678 (110,077) (0.01%)
Goldman Sachs (23,348) US684 (218,771) (0.02%)
Goldman Sachs (112,750) US704 (20,295) (0.00%)
Goldman Sachs (29,286) US759 (79,658) (0.01%)
Goldman Sachs (12,392) US762 (474,985) (0.04%)
Goldman Sachs (74,584) US763 (524,326) (0.05%)
Goldman Sachs (25,899) US767 (254,558) (0.02%)
Goldman Sachs (3,417) US770 (69,297) (0.01%)
Goldman Sachs (2,842) US774 (36,548) (0.00%)
Goldman Sachs (213,193) US777 (61,826) (0.00%)
Goldman Sachs (67,682) US783 (2,707) (0.00%)
Goldman Sachs (29,390) US784 (84,937) (0.01%)
Goldman Sachs (28,240) US785 (156,450) (0.01%)
Goldman Sachs (43,425) US786 (167,525) (0.01%)
Goldman Sachs (1,383) US789 (53,605) (0.00%)
Goldman Sachs (725) US790 (1,421) (0.00%)
Goldman Sachs (18,920) US791 (140,576) (0.01%)
Goldman Sachs (7,919) US794 (8,632) (0.00%)
Goldman Sachs (10,267) US796 (38,604) (0.00%)
Goldman Sachs (26,192) US797 (42,533) (0.00%)
Goldman Sachs (15,319) US799 (53,080) (0.00%)
Goldman Sachs (12,111) US800 (144,484) (0.01%)
Goldman Sachs (28,988) US801 (260,539) (0.02%)
Goldman Sachs (8,548) US802 (114,516) (0.01%)
Goldman Sachs (28,847) US804 (311,548) (0.02%)
Goldman Sachs (12,203) US806 (256,141) (0.03%)
Goldman Sachs (21,812) US807 (6,762) (0.00%)
Goldman Sachs (20,420) US808 (4,551) (0.00%)
Goldman Sachs (28,344) US810 (17,843) (0.00%)
Goldman Sachs (38,446) US811 (362,930) (0.04%)
Goldman Sachs (33,080) US812 (5,954) (0.00%)
Goldman Sachs (43,596) US813 (221,468) (0.02%)
Goldman Sachs (39,477) US814 (21,573) (0.00%)
Goldman Sachs 2,760,831 Vodafone Group PLC (251,887) (0.02%)
Morgan Stanley (14,332) AS022 (64,205) (0.00%)
Morgan Stanley (26,637) BE012 (142,214) (0.01%)
Morgan Stanley (78,221) DE012 (100,022) (0.01%)
Morgan Stanley (17,843) DE020 (4,818) (0.00%)
Morgan Stanley (115,662) DE053 (1,192,445) (0.09%)
Morgan Stanley (20,143) DE071 (74,786) (0.02%)
Morgan Stanley (517) DE073 (23,319) (0.00%)
Morgan Stanley (9,850) DK011 (13,649) (0.00%)
Morgan Stanley (6,849) DK014 (188,681) (0.01%)
Morgan Stanley (34,009) DK016 (113,887) (0.01%)

Jupiter Asset Management Series Plc Annual Report and Audited Financial Statements for the financial year ended 31 December 2020
Portfolio of Investments (continued) Jupiter Merian Global Equity Absolute Return Fund (continued)
140
Contracts For Difference - (2.62%) (2019 - (2.39%)) (continued)
Counterparty Nominal Security Description Unrealised
Loss USD % of Net
Assets
Morgan Stanley (33,424) DK020 (8,822) (0.00%)
Morgan Stanley (61,856) DK024 (66,325) (0.00%)
Morgan Stanley (445,977) ES022 (38,316) (0.00%)
Morgan Stanley (86,660) ES030 (291,179) (0.02%)
Morgan Stanley (31,819) ES031 (126,922) (0.01%)
Morgan Stanley (89,523) ES032 (104,382) (0.01%)
Morgan Stanley (38,445) FI006 (38,220) (0.00%)
Morgan Stanley (24,896) FI008 (9,778) (0.00%)
Morgan Stanley (72,963) FOI01 (450,757) (0.03%)
Morgan Stanley (2,662,391) GB088 (19,606) (0.00%)
Morgan Stanley (40,744) IE004 (27,504) (0.00%)
Morgan Stanley (22,595) IE022 (5,546) (0.00%)
Morgan Stanley (463,755) LU006 (36,997) (0.00%)
Morgan Stanley (136,868) NL022 (22,678) (0.00%)
Morgan Stanley (150,942) NL026 (174,143) (0.01%)
Morgan Stanley (137,342) NL031 (989,487) (0.08%)
Morgan Stanley (76,463) NO012 (339,214) (0.02%)
Morgan Stanley (107,935) NO015 (23,752) (0.00%)
Morgan Stanley (122,467) NO016 (477,905) (0.03%)
Morgan Stanley (1,753,074) NO017 (836,206) (0.07%)
Morgan Stanley (199,524) NO018 (165,088) (0.01%)
Morgan Stanley (25,980) NO019 (6,860) (0.00%)
Morgan Stanley (147,971) SE010 (239,477) (0.02%)
Morgan Stanley (546,252) SE013 (43,469) (0.00%)
Morgan Stanley (5,279,816) SE035 (439,543) (0.03%)
Morgan Stanley (132,198) SE037 (62,310) (0.00%)
Morgan Stanley (276,091) SE038 (228,493) (0.02%)
Morgan Stanley (187,485) SE039 (176,738) (0.01%)
Morgan Stanley (370,881) SE042 (608,433) (0.04%)
Morgan Stanley (98,861) SE045 (221,790) (0.03%)
Morgan Stanley (18,866) SE048 (5,047) (0.00%)
Morgan Stanley (4,071) SZ002 (286,528) (0.02%)
Morgan Stanley (4,232) SZ016 (27,144) (0.00%)
Morgan Stanley (2,411) SZ028 (243,591) (0.02%)
Morgan Stanley (310) SZ031 (15,871) (0.00%)
Morgan Stanley (4,270) SZ042 (6,302) (0.00%)
Morgan Stanley (164,311) SZ050 (59,688) (0.00%)
Morgan Stanley (24,142) SZ051 (486,458) (0.04%)
Morgan Stanley (16,109) SZ053 (24,687) (0.00%)
(36,276,978) (2.62%)

Jupiter Asset Management Series Plc Annual Report and Audited Financial Statements for the financial year ended 31 December 2020
Portfolio of Investments (continued) Jupiter Merian Global Equity Absolute Return Fund (continued)
141
Currency Exchange Contracts - (1.23%) (2019 - (0.90%))
Counterparty Actual Settle Date
Issue Currency
Currency Bought
Settle Currency
Currency Sold
Unrealised Loss USD
% of Net Assets
Australia And New Zealand Banking Group 29/01/2021 USD 73,034,766 AUD 99,158,458 (3,739,873) (0.27%)
Canadian Imperial Bank 29/01/2021 USD 40,546,259 SGD 54,275,547 (528,867) (0.04%)
Citibank 15/01/2021 USD 146,685 CHF 129,793 (728) (0.00%)
Citibank 15/01/2021 USD 18,602,829 EUR 15,245,759 (116,128) (0.01%)
Citibank 15/01/2021 USD 5,189,097 GBP 3,856,285 (74,628) (0.00%)
Citibank 15/01/2021 USD 103,930 SGD 139,070 (1,315) (0.00%)
HSBC 29/01/2021 HKD 35,974,537 USD 4,641,091 (231) (0.00%)
HSBC 29/01/2021 USD 161,110,676 EUR 135,177,484 (4,914,841) (0.36%)
HSBC 29/01/2021 USD 5,315,217 SEK 44,977,506 (193,238) (0.01%)
Morgan Stanley 29/01/2021 USD 18,099,793 CAD 23,533,213 (384,072) (0.03%)
Morgan Stanley 29/01/2021 USD 49,314,733 CHF 44,711,804 (1,488,246) (0.11%)
Morgan Stanley 29/01/2021 USD 24,824,587 DKK 154,996,974 (760,566) (0.05%)
Morgan Stanley 29/01/2021 USD 3,923,743 GBP 2,941,844 (92,176) (0.01%)
Morgan Stanley 29/01/2021 USD 5,384,313 NOK 47,827,481 (228,634) (0.02%)
Morgan Stanley 29/01/2021 USD 9,194,400 NZD 13,134,332 (314,613) (0.02%)
Toronto Dominion Bank 29/01/2021 HKD 33,271,533 USD 4,292,904 (744) (0.00%)
Toronto Dominion Bank 29/01/2021 USD 126,345,916 JPY 13,158,105,887 (1,367,484) (0.10%)
Toronto Dominion Bank 29/01/2021 USD 63,515,915 SEK 540,884,970 (2,726,843) (0.20%)
Unrealised Loss on Currency Exchange Contracts at 31 December 2020 (16,933,227) (1.23%)
Value USD
Total Financial Derivatives Instruments (53,210,205) (3.85%)
Financial Liabilities at Fair Value Through Profit or Loss (Cost USD Nil) (2019: USD Nil) (53,210,205) (3.85%)
Cash at Bank 37,613,177 2.72%
Other Net Assets 42,058,252 3.04%
Net Assets Value as at 31 December 2020 1,382,987,303 100.00%
Portfolio Analysis % of Total
Assets
Transferable securities admitted to official stock exchange listing 68.54%
Transferable securities dealt in on another regulated market 18.07%
Financial derivative instruments dealt in on a regulated market 2.32%
OTC financial derivative instruments 1.84%
Other current assets 9.23%
Total Assets 100.00%
The following securities have been pledged by the Sub-Fund as collateral in respect of Contracts for Difference:
Counterparty Stock Description Nominal Market Value
Bank of America Merrill Lynch Tokuyama Corp 115,200 2,585,291
Bank of America Merrill Lynch United States Treasury Bil 105,000,000 104,999,816
Bank of America Merrill Lynch United States Treasury Bill 14,216,180 14,210,956
Bank of America Merrill Lynch United States Treasury Note/Bond 985,000 986,096

Jupiter Asset Management Series Plc Annual Report and Audited Financial Statements for the financial year ended 31 December 2020
Portfolio of Investments (continued) Jupiter Strategic Absolute Return Bond Fund
142
Nominal Security Description Coupon
Rate Maturity
Date Value USD % of Net
Assets
Corporate Bonds - 9.90% (2019 - 4.80%)
200,000 Abanca Corp Bancaria SA 6.13 18/01/2029 281,822 0.23%
300,000 Aeroports de Paris 2.75 04/02/2030 455,863 0.37%
200,000 Air Liquide Finance SA 1.00 04/02/2025 259,561 0.21%
200,000 Air Products and Chemicals Inc 0.80 05/05/2032 262,596 0.21%
300,000 Apple Inc 0.50 15/11/2031 387,176 0.32%
34,150,000 Asian Development Bank 6.20 10/06/2026 493,966 0.40%
280,000 Berkshire Hathaway Energy Co 3.70 15/07/2030 337,978 0.28%
200,000 Carrefour SA 2.63 15/12/2027 287,107 0.23%
260,000 Coca-Cola European Partners PLC 1.75 27/03/2026 350,340 0.29%
230,000 Comcast Corp 3.40 04/01/2030 267,546 0.22%
200,000 Cooperatieve Rabobank UA 4.00 04/10/2029 218,115 0.18%
350,000 Coventry Building Society 1.88 24/10/2023 497,108 0.41%
300,000 Credit Suisse Group AG 1.25 17/07/2025 385,414 0.31%
300,000 Deutsche Wohnen SE 1.00 30/04/2025 387,665 0.32%
200,000 Deutsche Wohnen SE 1.50 30/04/2030 275,199 0.22%
200,000 Digital Stout Holding LLC 3.30 19/07/2029 321,544 0.26%
200,000 EDP - Energias de Portugal SA 1.63 15/04/2027 270,654 0.22%
300,000 EnBW International Finance BV 0.63 17/04/2025 382,353 0.31%
144,000 Ford Motor Co 8.50 21/04/2023 164,787 0.13%
200,000 Glencore Finance Europe Ltd 3.13 26/03/2026 301,947 0.25%
400,000 John Deere Cash Management SA 2.20 04/02/2032 604,181 0.49%
300,000 Koninklijke Ahold Delhaize NV 1.75 04/02/2027 413,810 0.34%
280,000 Logicor 2019-1 UK PLC 1.88 17/11/2026 408,206 0.34%
320,000 MetLife Inc 4.55 23/03/2030 404,505 0.33%
650,000 Morgan Stanley 1.40 20/01/2022 652,101 0.53%
460,000 Natwest Group PLC 1.69 15/05/2023 465,859 0.38%
200,000 Phoenix Group Holdings PLC 5.38 07/06/2027 231,630 0.19%
300,000 Pinewood Finance Co Ltd 3.25 30/09/2025 421,985 0.34%
125,000 Prologis International Funding II SA 1.63 17/06/2032 174,902 0.14%
270,000 Sovereign Housing Capital PLC 2.38 11/04/2048 442,168 0.36%
300,000 Suez SA 1.25 04/02/2027 398,109 0.33%
220,000 Tesco Corporate Treasury Services PLC 2.75 27/04/2030 339,842 0.28%
440,000 UBS Group AG 1.43 23/05/2023 446,443 0.36%
100,000 Unilever Finance Netherlands BV 1.75 25/03/2030 143,688 0.12%
12,136,170 9.90%
Government Security - 78.17% (2019 - 88.73%)
16,000,000 China Government Bond 2.20 27/07/2025 2,424,291 1.98%
750,000 Cyprus Government International Bond 0.63 12/03/2024 946,385 0.77%
829,000 Cyprus Government International Bond 1.50 16/04/2027 1,125,757 0.92%
2,050,000 Deutsche Bundesrepublik Inflation Linked Bond 0.50 15/04/2030 3,205,046 2.62%
420,000 Egypt Government International Bond 7.90 21/02/2048 468,899 0.38%
3,650,000 French Republic Government Bond OAT 0.10 03/01/2026 4,825,299 3.94%
265,000 Hellenic Republic Government Bond 1.88 23/07/2026 358,129 0.29%
1,801,000 Hellenic Republic Government Bond 1.50 18/06/2030 2,406,779 1.97%

Jupiter Asset Management Series Plc Annual Report and Audited Financial Statements for the financial year ended 31 December 2020
Portfolio of Investments (continued) Jupiter Strategic Absolute Return Bond Fund (continued)
143
Nominal Security Description Coupon
Rate Maturity
Date Value USD % of Net
Assets
Government Security - 78.17% (2019 - 88.73%) (continued)
26,500,000,000 Indonesia Treasury Bond 7.00 15/09/2030 2,055,957 1.68%
8,150,000,000 Indonesia Treasury Bond 8.38 15/03/2034 690,622 0.56%
3,000,000 Italy Buoni Ordinari del Tesoro BOT 0.00 14/07/2021 3,693,604 3.02%
1,100,000 Italy Buoni Poliennali Del Tesoro 0.10 15/05/2023 1,420,233 1.16%
800,000 Italy Buoni Poliennali Del Tesoro 0.40 15/05/2030 1,055,342 0.85%
805,000 Italy Buoni Poliennali Del Tesoro 2.55 15/09/2041 1,699,334 1.39%
69,350,000 Japan Government Thirty Year Bond 0.60 20/06/2050 666,323 0.54%
474,800,000 Japanese Government CPI Linked Bond 0.10 03/10/2026 4,686,785 3.83%
287,800,000 Japanese Government CPI Linked Bond 0.10 03/10/2027 2,848,984 2.33%
150,000 Mexican Bonos 8.50 31/05/2029 924,714 0.76%
373,200 Mexican Bonos 8.50 18/11/2038 2,339,815 1.91%
32,950,000 Republic of South Africa Government Bond 10.50 21/12/2026 2,669,062 2.18%
33,900,000 Republic of South Africa Government Bond 9.00 31/01/2040 2,057,748 1.68%
118,200,000 Russian Federal Bond - OFZ 7.65 04/10/2030 1,808,763 1.47%
395,000 Ukraine Government International Bond 7.75 09/01/2027 458,839 0.37%
1,450,000 United States Treasury Inflation Indexed Bonds 0.13 15/04/2025 1,570,314 1.28%
1,800,000 United States Treasury Inflation Indexed Bonds 0.25 15/07/2029 2,070,712 1.69%
2,480,000 United States Treasury Inflation Indexed Bonds 0.13 15/07/2030 2,820,101 2.30%
11,500,000 United States Treasury Note/Bond 1.75 31/07/2021 11,691,484 9.55%
8,500,000 United States Treasury Note/Bond 2.13 15/08/2021 8,673,026 7.08%
7,050,000 United States Treasury Note/Bond 1.50 31/10/2021 7,147,683 5.84%
5,800,000 United States Treasury Note/Bond 1.63 31/12/2021 5,887,001 4.81%
9,350,000 United States Treasury Note/Bond 0.38 31/03/2022 9,389,541 7.67%
100,000 United States Treasury Note/Bond 1.75 31/07/2024 106,196 0.09%
125,000 United States Treasury Note/Bond 1.75 15/11/2029 135,240 0.11%
1,400,000 United States Treasury Note/Bond 0.63 15/05/2030 1,368,409 1.12%
1,500,000 Uruguay Government International Bond 9.88 20/06/2022 37,134 0.03%
95,733,551 78.17%
Total Transferable Securities 107,869,721 88.07%
Investment Funds - 6.05% (2019 - 4.35%)
164,002 Jupiter Asset Management Series Plc - Jupiter Emerging Market Debt Fund (UCITS) 1,953,674* 1.60%
307,401 Jupiter Asset Management Series Plc - Jupiter Financials Contingent Capital Fund (UCITS) 3,359,401* 2.74%
199,053 Jupiter Asset Management Series Plc - Jupiter Local Currency Emerging Market Debt Fund (UCITS) 2,091,311* 1.71%
7,404,386 6.05%
Total Investment Funds 7,404,386 6.05%
*These amounts have been eliminated at a company level in the SOFP.

Jupiter Asset Management Series Plc Annual Report and Audited Financial Statements for the financial year ended 31 December 2020
Portfolio of Investments (continued) Jupiter Strategic Absolute Return Bond Fund (continued)
144
Futures - 0.01% (2019 - 0.32%)
Counterparty Nominal Security Description No of
Contracts Maturity
Date Unrealised
Gain USD % of Net
Assets
Bank of America Merrill Lynch (455,535,000) Japan 10 Year Bond (OSE) (3) 15/03/2021 2,474 0.00% Bank of America Merrill Lynch 1,379,609 US Treasury Note 10 22/03/2021 3,672 0.01%
6,146 0.01%
Swaps - 0.37% (2019 - 0.57%)
Citibank 1,450,000 IRS GBP/LIBOR/fixing 6M, R:GBP 1.099 25/07/2049 284,917 0.24%
Citibank 840,000 IRS GBP/LIBOR/fixing 6M, R:GBP 1.099 25/07/2049 165,055 0.13%
Morgan Stanley 21,800,000 IRS JPY/LIBOR/fixing 6M, R:JPY 0.075 18/10/2026 1,290 0.00%
Barclays 13,100,000 IRS JPY/LIBOR/fixing 6M, R:JPY 0.066 07/10/2026 705 0.00%
451,967 0.37%
Currency Exchange Contracts - 2.03% (2019 - 0.64%)
Actual Settle Date
Issue Currency
Currency Bought
Settle Currency
Currency Sold
Australia And New Zealand Banking Group 29/01/2021 EUR 1,500,000 USD 1,826,609 15,737 0.01%
Canadian Imperial Bank 29/01/2021 AUD 550,000 USD 419,955 5,895 0.00%
Citibank 15/01/2021 EUR 35,364,470 USD 42,938,514 482,586 0.38%
Citibank 15/01/2021 GBP 51,804,627 USD 68,984,467 1,727,656 1.42%
Citibank 15/01/2021 USD 79 EUR 64 - 0.00%
Citibank 15/01/2021 USD 90 GBP 65 - 0.00%
Goldman Sachs 29/01/2021 EUR 950,000 USD 1,164,766 2,053 0.00%
Goldman Sachs 29/01/2021 JPY 46,652,490 USD 450,000 2,814 0.00%
Goldman Sachs 29/01/2021 SEK 6,607,076 EUR 650,000 10,831 0.01%
Goldman Sachs 29/01/2021 USD 686,074 RUB 50,400,000 14,084 0.01%
HSBC 29/01/2021 GBP 856,647 EUR 950,000 2,598 0.00%
HSBC 29/01/2021 INR 18,000,000 USD 243,727 1,991 0.00%
HSBC 29/01/2021 MXN 18,668,505 USD 922,142 13,785 0.01%
HSBC 29/01/2021 NOK 295,220 USD 33,266 1,380 0.00%
HSBC 29/01/2021 USD 459,316 MXN 9,150,000 592 0.00%
Morgan Stanley 29/01/2021 USD 521,299 ZAR 7,642,739 2,666 0.00%
RBS 29/01/2021 INR 28,450,000 USD 385,353 3,018 0.00%
Societe Generale 29/01/2021 GBP 862,475 EUR 950,000 10,547 0.01%
Societe Generale 29/01/2021 INR 47,400,000 USD 641,121 5,936 0.00%
Societe Generale 29/01/2021 SEK 12,700,000 USD 1,521,665 33,743 0.03%
Societe Generale 29/01/2021 ZAR 3,500,000 USD 237,231 283 0.00%
Toronto Dominion Bank 29/01/2021 AUD 2,103,014 USD 1,548,006 80,301 0.07%
Toronto Dominion Bank 29/01/2021 NOK 15,249,167 EUR 1,450,000 8,672 0.01%
Toronto Dominion Bank 29/01/2021 SEK 8,124,757 USD 952,963 42,100 0.04%
Toronto Dominion Bank 29/01/2021 USD 1,241,939 MXN 24,737,550 1,753 0.00%
Toronto Dominion Bank 29/01/2021 ZAR 7,000,000 USD 456,290 18,737 0.03%
Unrealised Gain on Currency Exchange Contracts at 31 December 2020 2,489,758 2.03%

Jupiter Asset Management Series Plc Annual Report and Audited Financial Statements for the financial year ended 31 December 2020
Portfolio of Investments (continued) Jupiter Strategic Absolute Return Bond Fund (continued)
145
Value USD % of Net
Assets
Total Financial Derivatives Instruments 2,947,871 2.41%
Financial Assets at Fair Value Through Profit or Loss (Cost USD 109,194,177) (2019: USD 178,930,660) 118,221,978 96.53%
Futures - (0.11%) (2019 - (0.03%))
Counterparty Nominal Security Description No of
Contracts Maturity
Date Unrealised
Loss USD
Bank of America Merrill Lynch (4,612,025) Canada 10 Year Bond Future (31) 22/03/2021 (2,439) (0.00%) Bank of America Merrill Lynch (2,255,400) Euro Buxl 30 Year Bond (10) 08/03/2021 (39,275) (0.02%) Bank of America Merrill Lynch (4,597,310) Euro-Bobl Future (34) 08/03/2021 (7,720) (0.01%) Bank of America Merrill Lynch (1,064,070) Euro-BTP Future (7) 08/03/2021 (11,513) (0.01%) Bank of America Merrill Lynch (1,600,470) Euro-Bund Future (9) 08/03/2021 (10,162) (0.01%) Bank of America Merrill Lynch (6,550,050) Euro-OAT Future (39) 08/03/2021 (33,003) (0.03%) Bank of America Merrill Lynch (4,064,250) Long Gilt Future (30) 29/03/2021 (30,913) (0.03%) Bank of America Merrill Lynch (2,810,109) US 10 Year Ultra Future (18) 22/03/2021 (3,700) (0.00%) Bank of America Merrill Lynch (1,036,406) US Long Bond (CBT) (6) 22/03/2021 (469) (0.00%) Bank of America Merrill Lynch (2,763,516) US Ultra Bond (CBT) (13) 22/03/2021 (1,516) (0.00%)
(140,710) (0.11%)
Swaps - (0.49%) (2019 - (1.37%))
Citibank 2,900,000 IRS GBP/LIBOR/fixing 6M, R:GBP 1.099 25/07/2049 (569,834) (0.46%)
Goldman Sachs 2,000,000 CDX iTraxx Europe Crossover Series 34 Version 1 10Year 20/12/2030 (32,692) (0.03%)
(602,526) (0.49%)
Currency Exchange Contracts - (0.99%) (2019 - (0.76%))
Actual Settle Date
Issue Currency
Currency Bought
Settle Currency
Currency Sold
Citibank 15/01/2021 USD 1,281,588 EUR 1,045,423 (1,998) (0.00%)
Citibank 15/01/2021 USD 222,377 GBP 165,886 (4,052) (0.00%)
Goldman Sachs 29/01/2021 RUB 14,000,000 USD 189,915 (3,239) (0.00%)
Goldman Sachs 29/01/2021 USD 1,869,056 GBP 1,400,000 (42,088) (0.03%)
Goldman Sachs 29/01/2021 USD 1,014,284 MXN 20,449,320 (10,961) (0.01%)
Goldman Sachs 29/01/2021 USD 2,399,039 SEK 20,000,000 (50,401) (0.04%)
HSBC 29/01/2021 BRL 6,150,000 USD 1,221,013 (37,440) (0.03%)
HSBC 29/01/2021 HUF 460,103,176 USD 1,558,633 (8,863) (0.01%)
HSBC 29/01/2021 USD 22,858,702 EUR 19,158,034 (671,289) (0.56%)
HSBC 29/01/2021 USD 132,798 GBP 100,000 (3,713) (0.00%)
HSBC 29/01/2021 USD 1,485,046 HUF 450,245,726 (31,521) (0.03%)
HSBC 29/01/2021 USD 1,824,410 JPY 188,293,047 (3,180) (0.00%)

Jupiter Asset Management Series Plc Annual Report and Audited Financial Statements for the financial year ended 31 December 2020
Portfolio of Investments (continued) Jupiter Strategic Absolute Return Bond Fund (continued)
146
Currency Exchange Contracts - (0.99%) (2019 - (0.76%)) (continued)
Counterparty Actual Settle Date
Issue Currency
Currency Bought
Settle Currency
Currency Sold
Unrealised Loss USD
% of Net Assets
HSBC 29/01/2021 USD 2,727,712 ZAR 41,817,086 (110,494) (0.10%)
Morgan Stanley 29/01/2021 BRL 1,500,000 USD 295,497 (6,820) (0.01%)
Morgan Stanley 29/01/2021 MXN 4,700,000 USD 236,551 (921) (0.00%)
Morgan Stanley 29/01/2021 USD 548,017 EUR 450,000 (4,683) (0.00%)
Societe Generale 29/01/2021 JPY 48,500,000 USD 471,098 (353) (0.00%)
Societe Generale 29/01/2021 RUB 17,000,000 USD 231,807 (5,129) (0.00%)
Societe Generale 29/01/2021 USD 123,074 IDR 1,750,000,000 (2,503) (0.00%)
Societe Generale 29/01/2021 USD 2,719,841 SEK 23,000,000 (97,001) (0.08%)
Societe Generale 29/01/2021 USD 895,655 ZAR 13,398,105 (13,611) (0.01%) Toronto Dominion Bank 29/01/2021 USD 1,009,263 EUR 829,419 (9,448) (0.01%) Toronto Dominion Bank 29/01/2021 USD 1,146,480 GBP 859,274 (26,517) (0.02%) Toronto Dominion Bank 29/01/2021 USD 4,907,974 JPY 511,218,447 (53,944) (0.05%)
Unrealised Loss on Currency Exchange Contracts at 31 December 2020 (1,200,169) (0.99%)
Value USD
Total Financial Derivatives Instruments (1,943,405) (1.59%)
Financial Liabilities at Fair Value Through Profit or Loss (Cost USD Nil) (2019: USD Nil) (1,943,405) (1.59%)
Cash at Bank 2,651,055 2.16%
Other Net Assets 3,536,228 2.90%
Net Assets Value as at 31 December 2020 122,465,856 100.00%
Portfolio Analysis % of Total
Assets
Transferable securities admitted to official stock exchange listing 78.06%
Transferable securities dealt in on another regulated market 6.93%
UCITS 5.83%
OTC financial derivative instruments 2.32%
Other current assets 6.86%
Total Assets 100.00%
The following securities have been pledged by the Sub-Fund as collateral in respect of Credit Default Swaps and Interest Rate Swaps:
Counterparty Stock Description Nominal Market Value
Goldman Sachs Deutsche Bundesrepublik Inflation Linked Bond 333,000 423,607
Morgan Stanley Deutsche Bundesrepublik Inflation Linked Bond 17,000 19,381

Jupiter Asset Management Series Plc Annual Report and Audited Financial Statements for the financial year ended 31 December 2020
Portfolio of Investments (continued) Jupiter Europe (ex UK) Smaller Companies Fund
147
Nominal Security Description Value EUR % of Net
Assets
Common Stock
Basic Materials - 4.06% (2019 - 0.00%)
18,073 Corticeira Amorim SGPS SA 208,020 1.11%
5,280 IMCD NV 552,420 2.95%
760,440 4.06%
Consumer, Cyclical - 16.15% (2019 - 15.54%)
15,192 Brunello Cucinelli SpA 542,506 2.90%
9,540 CTS Eventim AG & Co KGaA 519,930 2.78%
38,956 Dometic Group AB 422,580 2.26%
29,407 MARR SpA 495,214 2.65%
3,060 MIPS AB 157,041 0.84%
3,308 Puma SE 305,825 1.63%
142 Rational AG 108,311 0.58%
15,287 Thule Group AB 470,264 2.51%
3,021,671 16.15%
Consumer, Non-cyclical - 23.32% (2019 - 11.18%)
37,230 Davide Campari-Milano NV 348,659 1.86%
1,782 DiaSorin SpA 302,762 1.62%
16,672 Elekta AB 184,053 0.98%
24,585 Elis SA 332,635 1.78%
6,110 Eurofins Scientific SE 425,623 2.27%
14,057 Fagron 268,840 1.44%
572 Hypoport SE 295,438 1.58%
78,198 Karnov Group AB 462,157 2.47%
2,558 Orpea SA 275,688 1.47%
2,121 Remy Cointreau SA 324,195 1.73%
2,089 STRATEC SE 255,694 1.37%
714 Tecan Group AG 286,281 1.53%
1,385 Virbac SA 331,708 1.77%
12,535 Vitrolife AB 270,825 1.45%
4,364,558 23.32%
Financial - 15.37% (2019 - 24.92%)
14,714 Avanza Bank Holding AB 341,973 1.83%
54,866 doValue SpA 528,634 2.82%
42,496 FinecoBank Banca Fineco SpA 570,190 3.05%
2,033 GRENKE AG 79,023 0.42%
14,035 Nexity SA 500,207 2.67%
11,258 Nigeria OMO Bills 290,219 1.55%
9,077 Nordnet AB publ 117,342 0.63%
5,992 VZ Holding AG 449,467 2.40%
2,877,055 15.37%
Industrial - 29.78% (2019 - 23.18%)
61 Belimo Holding AG 433,025 2.31%
16,266 Carel Industries SpA 311,657 1.67%
32,396 Fluidra SA 656,829 3.51%

Jupiter Asset Management Series Plc Annual Report and Audited Financial Statements for the financial year ended 31 December 2020
Portfolio of Investments (continued) Jupiter Europe (ex UK) Smaller Companies Fund (continued)
148
Nominal Security Description Value EUR % of Net
Assets
Common Stock (continued)
Industrial - 29.78% (2019 - 23.18%) (continued)
5,042 Gerresheimer AG 445,209 2.38%
11,689 GVS SpA 178,491 0.95%
42,112 Infrastrutture Wireless Italiane SpA 417,540 2.23%
57,039 Irish Continental Group PLC 255,963 1.37%
4,894 Kingspan Group PLC 288,134 1.54%
2,457 Knorr-Bremse AG 274,275 1.47%
173 LEM Holding SA 276,980 1.48%
110,217 Marel HF 556,596 2.97%
18,318 SIG Combibloc Group AG 347,834 1.86%
3,535 Somfy SA 488,537 2.61%
4,368 Stabilus SA 252,907 1.35%
1,903 VAT Group AG 388,460 2.08%
5,572,437 29.78%
Technology - 11.33% (2019 - 3.99%)
17,465 Lectra 437,498 2.34%
3,526 Nemetschek SE 216,496 1.16%
2,603 Nexus AG 131,972 0.70%
4,634 SimCorp A/S 564,598 3.02%
26,698 Solutions 30 SE 280,062 1.49%
6,157 Ubisoft Entertainment SA 490,343 2.62%
2,120,969 11.33%
Total Common Stock 18,717,130 100.01%
Total Transferable Securities 18,717,130 100.01%
Currency Exchange Contracts - 0.02% (2019 - 0.00%)
Counterparty Actual Settle Date
Issue Currency
Currency Bought
Settle Currency
Currency Sold
Unrealised Gain EUR
Citibank 15/01/2021 EUR 7,487 USD 9,083 89 0.00%
Citibank 15/01/2021 GBP 158,261 EUR 172,168 3,771 0.02%
Citibank 15/01/2021 USD 16,305 EUR 13,272 7 0.00%
Unrealised Gain on Currency Exchange Contracts at 31 December 2020 3,867 0.02%
Value EUR
Total Financial Derivatives Instruments 3,867 0.02%
Financial Assets at Fair Value Through Profit or Loss (Cost EUR 15,587,056) (2019: EUR 154,792,252) 18,720,997 100.03%

Jupiter Asset Management Series Plc Annual Report and Audited Financial Statements for the financial year ended 31 December 2020
Portfolio of Investments (continued) Jupiter Europe (ex UK) Smaller Companies Fund (continued)
149
Currency Exchange Contracts - (0.04%) (2019 - (0.01%))
Counterparty Actual Settle Date
Issue Currency
Currency Bought
Settle Currency
Currency Sold
Unrealised Loss EUR
% of Net Assets
Citibank 15/01/2021 EUR 1,985 GBP 1,818 (37) (0.00%)
Citibank 15/01/2021 USD 693,410 EUR 571,370 (6,622) (0.04%)
Unrealised Loss on Currency Exchange Contracts at 31 December 2020 (6,659) (0.04%)
Value EUR
Total Financial Derivatives Instruments (6,659) (0.04%)
Financial Liabilities at Fair Value Through Profit or Loss (Cost EUR Nil) (2019: EUR Nil) (6,659) (0.04%)
Cash at Bank 99,952 0.53%
Other Net Liabilities (98,371) (0.52%)
Net Assets Value as at 31 December 2020 18,715,919 100.00%
Portfolio Analysis % of Total
Assets
Transferable securities admitted to official stock exchange listing 99.01%
OTC financial derivative instruments 0.02%
Other current assets 0.97%
Total Assets 100.00%

Jupiter Asset Management Series Plc Annual Report and Audited Financial Statements for the financial year ended 31 December 2020
Portfolio of Investments (continued) Jupiter Merian Global Equity Income Fund (IRL)
150
Nominal Security Description Value USD % of Net
Assets
Common Stock
Basic Materials - 4.96% (2019 - 4.37%)
16,305 Acerinox SA 181,869 0.23%
110,596 Alumina Ltd 157,089 0.20%
16,901 BHP Group Ltd 555,079 0.71%
3,090 BHP Group PLC 81,806 0.10%
31,295 CAP SA 420,286 0.54%
2,466 Chemours Co 62,414 0.08%
17,500 Chifeng Jilong Gold Mining Co Ltd 47,926 0.06%
15,205 Ferrexpo PLC 59,454 0.08%
82,900 Hunan Valin Steel Co Ltd 60,592 0.08%
765 Hyundai Steel Co 27,887 0.04%
9,164 International Paper Co 454,901 0.58%
57,100 Kingfa Sci & Tech Co Ltd 149,652 0.19%
10,448 Koza Altin Isletmeleri AS 138,216 0.17%
7,404 Labrador Iron Ore Royalty Corp 193,052 0.25%
20,400 Mitsubishi Gas Chemical Co Inc 468,904 0.60%
64,030 Mount Gibson Iron Ltd 45,597 0.06%
41,000 Nine Dragons Paper Holdings Ltd 58,174 0.07%
5,700 Nitto Denko Corp 510,464 0.65%
803 Rio Tinto Ltd 70,752 0.09%
7,774 Russel Metals Inc 139,508 0.18%
3,883,622 4.96%
Communications - 13.50% (2019 - 8.31%)
2,249 ADTRAN Inc 33,150 0.04%
2,300 Alibaba Group Holding Ltd (DR) 548,297 0.70%
467 Alphabet Inc - Class A 810,829 1.03%
393 Alphabet Inc - Class C 683,631 0.87%
600 Amazon.com Inc 1,971,510 2.52%
91,827 Bezeq The Israeli Telecommunication Corp Ltd 90,128 0.12%
358 Cisco Systems Inc 15,924 0.02%
16,111 Corus Entertainment Inc 54,408 0.07%
7,592 eBay Inc 383,776 0.49%
5,301 Eutelsat Communications SA 60,104 0.08%
4,072 Facebook Inc 1,107,055 1.40%
9,688 Interpublic Group of Cos Inc 227,280 0.29%
56,545 ITV PLC 82,633 0.11%
5,600 JD.com Inc (DR) 501,312 0.64%
72,786 Mediaset Espana Comunicacion SA 382,706 0.49%
3,000 Meituan 114,001 0.15%
535 Naspers Ltd 110,082 0.14%
522 Netflix Inc 273,836 0.35%
3,853 New York Times Co 198,776 0.25%
12,636 NortonLifeLock Inc 262,197 0.33%
7,301 Pearson PLC 67,599 0.09%

Jupiter Asset Management Series Plc Annual Report and Audited Financial Statements for the financial year ended 31 December 2020
Portfolio of Investments (continued) Jupiter Merian Global Equity Income Fund (IRL) (continued)
151
Nominal Security Description Value USD % of Net
Assets
Common Stock (continued)
Communications - 13.50% (2019 - 8.31%) (continued)
4,430 PLDT Inc 123,609 0.16%
3,697 Publicis Groupe SA 186,446 0.24%
7,514 Shaw Communications Inc 132,246 0.17%
1,148 Snap Inc 56,654 0.07%
66 Stamps.com Inc 13,762 0.02%
116,000 Telekom Malaysia Bhd 156,013 0.20%
7,666 Telenet Group Holding NV 329,122 0.42%
2,600 Tencent Holdings Ltd 189,151 0.24%
24,890 Turkcell Iletisim Hizmetleri AS 54,104 0.07%
11,758 Verizon Communications Inc 683,610 0.87%
9,256 Vivendi SA 300,368 0.38%
142,725 Vodafone Group PLC 236,827 0.30%
1,068 Zillow Group Inc 139,321 0.18%
10,580,467 13.50%
Consumer, Cyclical - 8.52% (2019 - 6.69%)
43,481 888 Holdings PLC 170,907 0.22%
39,246 Arcelik AS 160,314 0.20%
6,810 Barloworld Ltd 42,519 0.05%
4,383 Bayerische Motoren Werke AG 390,900 0.50%
1,117 Bed Bath & Beyond Inc 20,832 0.03%
935 Best Buy Co Inc 94,790 0.12%
770 bet-at-home.com AG 30,124 0.04%
161 Big Lots Inc 7,047 0.01%
7,500 BYD Co Ltd 196,581 0.25%
4,900 Chiyoda Co Ltd 43,502 0.06%
61,000 Chow Sang Sang Holdings International Ltd 69,242 0.09%
2,415 Continental AG 364,504 0.47%
23,094 Controladora Nemak SAB de CV 3,091 0.00%
6,874 Daimler AG 491,233 0.63%
40,093 Ford Motor Co 355,224 0.45%
8,132 Harvey Norman Holdings Ltd 29,522 0.04%
649 Home Depot Inc 172,154 0.22%
5,053 Industria de Diseno Textil SA 162,332 0.21%
6,700 ITOCHU Corp 192,682 0.25%
37,967 Kindred Group PLC (DR) 374,966 0.48%
16,924 Kingfisher PLC 62,711 0.08%
1,105 Lowe's Cos Inc 177,419 0.23%
39,000 Luk Fook Holdings International Ltd 94,072 0.12%
5,317 Newell Brands Inc 112,082 0.14%
900 Nintendo Co Ltd 574,851 0.73%
4,622 NIO Inc (DR) 223,612 0.29%
300 Nippon Gas Co Ltd 16,097 0.02%
437 Nu Skin Enterprises Inc 23,729 0.03%

Jupiter Asset Management Series Plc Annual Report and Audited Financial Statements for the financial year ended 31 December 2020
Portfolio of Investments (continued) Jupiter Merian Global Equity Income Fund (IRL) (continued)
152
Nominal Security Description Value USD % of Net
Assets
Common Stock (continued)
Consumer, Cyclical - 8.52% (2019 - 6.69%) (continued)
1,319 PACCAR Inc 113,263 0.14%
85,000 Pacific Textiles Holdings Ltd 55,808 0.07%
3,303 Pandora A/S 372,091 0.47%
1,143 PetMed Express Inc 37,067 0.05%
5,561 PulteGroup Inc 245,184 0.31%
3,100 Sekisui House Ltd 63,164 0.08%
1,200 Seria Co Ltd 44,127 0.06%
21,685 Superior Plus Corp 208,795 0.27%
776 Takkt AG 10,229 0.01%
869 Tesla Inc 603,764 0.77%
1,066 TRI Pointe Group Inc 18,698 0.02%
4,974 Volvo AB 118,745 0.15%
4,200 VTech Holdings Ltd 32,587 0.04%
26,699 Weifu High-Technology Group Co Ltd 94,674 0.12%
6,675,235 8.52%
Consumer, Non-cyclical - 18.36% (2019 - 17.32%)
399 Abbott Laboratories 43,268 0.06%
6,527 AbbVie Inc 687,097 0.88%
79 ABIOMED Inc 25,590 0.03%
6,604 Altria Group Inc 269,047 0.35%
1,308 Amgen Inc 297,138 0.38%
503 Anthem Inc 157,967 0.20%
2,225 Archer-Daniels-Midland Co 111,050 0.15%
1,549 AstraZeneca PLC 155,099 0.20%
2,114 Avantor Inc 57,797 0.07%
2,970 B&G Foods Inc 83,606 0.11%
514 BioGaia AB 33,666 0.04%
223 Biogen Inc 54,318 0.07%
10,200 Carabao Group PCL 38,982 0.05%
5,712 Cardinal Health Inc 305,535 0.39%
10,091 Carrefour SA 174,414 0.22%
181 Cigna Corp 36,933 0.05%
3,572 Coor Service Management Holding AB 31,814 0.04%
5,600 Da An Gene Co Ltd of Sun Yat-Sen University 29,371 0.04%
960 DaVita Inc 110,880 0.14%
5,008 Edwards Lifesciences Corp 448,917 0.57%
1,386 Eli Lilly and Co 231,476 0.31%
10,864 Ennis Inc 190,337 0.24%
2,747 Fisher & Paykel Healthcare Corp Ltd 65,558 0.08%
5,265 Gilead Sciences Inc 298,262 0.38%
246 Gruma SAB de CV 2,975 0.00%
15,285 Grupo Bimbo SAB de CV 33,229 0.04%
24,500 Hengan International Group Co Ltd 173,498 0.22%

Jupiter Asset Management Series Plc Annual Report and Audited Financial Statements for the financial year ended 31 December 2020
Portfolio of Investments (continued) Jupiter Merian Global Equity Income Fund (IRL) (continued)
153
Nominal Security Description Value USD % of Net
Assets
Common Stock (continued)
Consumer, Non-cyclical - 18.36% (2019 - 17.32%) (continued)
640 Hologic Inc 45,920 0.06%
525 Humana Inc 213,208 0.27%
1,306 Ingredion Inc 102,861 0.13%
157 IQVIA Holdings Inc 27,871 0.04%
100 IR Japan Holdings Ltd 15,990 0.02%
27,500 Jiangsu Yuyue Medical Equipment & Supply Co Ltd 118,624 0.15%
1,800 JiuGui Liquor Co Ltd 43,075 0.05%
1,364 Johnson & Johnson 212,852 0.27%
142,896 Jointown Pharmaceutical Group Co Ltd 396,800 0.51%
14,356 Kraft Heinz Co 497,723 0.64%
8,700 Livzon Pharmaceutical Group Inc 33,723 0.04%
1,983 McKesson Corp 343,892 0.44%
397 Medifast Inc 76,589 0.10%
245 Medpace Holdings Inc 33,776 0.04%
7,886 Merck & Co Inc 635,533 0.81%
3,337 Mondelez International Inc 193,546 0.25%
2,255 National Beverage Corp 193,434 0.25%
2,049 Nestle SA 242,582 0.32%
65,314 Netcare Ltd 55,812 0.07%
1,043 Novo Nordisk A/S 73,752 0.09%
12,000 Ono Pharmaceutical Co Ltd 361,869 0.46%
771 Owens & Minor Inc 21,403 0.03%
3,735 Patterson Cos Inc 112,834 0.14%
1,434 PayPal Holdings Inc 331,985 0.42%
3,411 Pfizer Inc 125,320 0.16%
5,131 Philip Morris International Inc 418,074 0.53%
5,347 Procter & Gamble Co 736,656 0.94%
3,988 Puma Biotechnology Inc 41,435 0.05%
7,100 Qualicorp Consultoria e Corretora de Seguros SA 47,814 0.06%
129 Quidel Corp 23,853 0.03%
1,745 Radius Health Inc 32,195 0.04%
2,179 Randstad NV 143,134 0.18%
5,362 Rent-A-Center Inc/TX 205,794 0.26%
168 Robert Half International Inc 10,433 0.01%
2,137 Roche Holding AG 749,733 0.96%
4,834 Sanofi 469,271 0.60%
180 Seagen Inc 33,066 0.04%
6,371 Societe BIC SA 364,621 0.47%
3,157 SpartanNash Co 54,332 0.07%
1,326 Spectrum Brands Holdings Inc 102,380 0.13%
426 Square Inc 94,163 0.12%
4,028 Swedish Match AB 315,802 0.40%
1,600 Taiko Pharmaceutical Co Ltd 25,025 0.03%
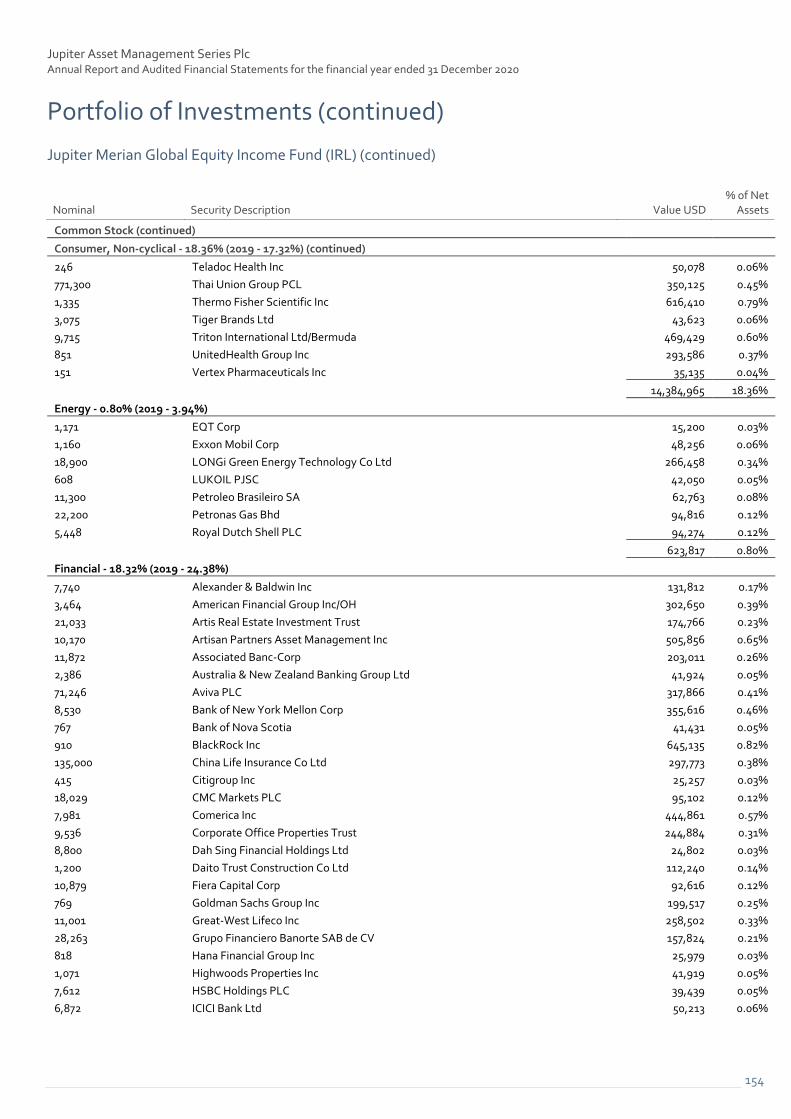
Jupiter Asset Management Series Plc Annual Report and Audited Financial Statements for the financial year ended 31 December 2020
Portfolio of Investments (continued) Jupiter Merian Global Equity Income Fund (IRL) (continued)
154
Nominal Security Description Value USD % of Net
Assets
Common Stock (continued)
Consumer, Non-cyclical - 18.36% (2019 - 17.32%) (continued)
246 Teladoc Health Inc 50,078 0.06%
771,300 Thai Union Group PCL 350,125 0.45%
1,335 Thermo Fisher Scientific Inc 616,410 0.79%
3,075 Tiger Brands Ltd 43,623 0.06%
9,715 Triton International Ltd/Bermuda 469,429 0.60%
851 UnitedHealth Group Inc 293,586 0.37%
151 Vertex Pharmaceuticals Inc 35,135 0.04%
14,384,965 18.36%
Energy - 0.80% (2019 - 3.94%)
1,171 EQT Corp 15,200 0.03%
1,160 Exxon Mobil Corp 48,256 0.06%
18,900 LONGi Green Energy Technology Co Ltd 266,458 0.34%
608 LUKOIL PJSC 42,050 0.05%
11,300 Petroleo Brasileiro SA 62,763 0.08%
22,200 Petronas Gas Bhd 94,816 0.12%
5,448 Royal Dutch Shell PLC 94,274 0.12%
623,817 0.80%
Financial - 18.32% (2019 - 24.38%)
7,740 Alexander & Baldwin Inc 131,812 0.17%
3,464 American Financial Group Inc/OH 302,650 0.39%
21,033 Artis Real Estate Investment Trust 174,766 0.23%
10,170 Artisan Partners Asset Management Inc 505,856 0.65%
11,872 Associated Banc-Corp 203,011 0.26%
2,386 Australia & New Zealand Banking Group Ltd 41,924 0.05%
71,246 Aviva PLC 317,866 0.41%
8,530 Bank of New York Mellon Corp 355,616 0.46%
767 Bank of Nova Scotia 41,431 0.05%
910 BlackRock Inc 645,135 0.82%
135,000 China Life Insurance Co Ltd 297,773 0.38%
415 Citigroup Inc 25,257 0.03%
18,029 CMC Markets PLC 95,102 0.12%
7,981 Comerica Inc 444,861 0.57%
9,536 Corporate Office Properties Trust 244,884 0.31%
8,800 Dah Sing Financial Holdings Ltd 24,802 0.03%
1,200 Daito Trust Construction Co Ltd 112,240 0.14%
10,879 Fiera Capital Corp 92,616 0.12%
769 Goldman Sachs Group Inc 199,517 0.25%
11,001 Great-West Lifeco Inc 258,502 0.33%
28,263 Grupo Financiero Banorte SAB de CV 157,824 0.21%
818 Hana Financial Group Inc 25,979 0.03%
1,071 Highwoods Properties Inc 41,919 0.05%
7,612 HSBC Holdings PLC 39,439 0.05%
6,872 ICICI Bank Ltd 50,213 0.06%

Jupiter Asset Management Series Plc Annual Report and Audited Financial Statements for the financial year ended 31 December 2020
Portfolio of Investments (continued) Jupiter Merian Global Equity Income Fund (IRL) (continued)
155
Nominal Security Description Value USD % of Net
Assets
Common Stock (continued)
Financial - 18.32% (2019 - 24.38%) (continued)
10,132 IGM Financial Inc 279,221 0.36%
13,070 Janus Henderson Group PLC 424,906 0.54%
1,543 Jefferies Financial Group Inc 37,202 0.05%
544 JPMorgan Chase & Co 68,196 0.09%
4,297 KB Financial Group Inc 171,675 0.22%
8,928 KKR Real Estate Finance Trust Inc 159,454 0.20%
168,500 KWG Group Holdings Ltd 229,954 0.29%
193,617 Man Group PLC/Jersey 364,927 0.47%
21,294 Manulife Financial Corp 376,613 0.48%
655 Mastercard Inc 232,885 0.30%
4,555 Mercury General Corp 235,402 0.30%
4,698 MGM Growth Properties LLC 146,437 0.19%
66,300 Mitsubishi UFJ Financial Group Inc 293,401 0.37%
3,800 Mizuho Financial Group Inc 48,207 0.06%
9,700 MS&AD Insurance Group Holdings Inc 295,616 0.38%
32,131 Navient Corp 314,562 0.40%
9,159 NN Group NV 401,483 0.51%
49,232 Nordea Bank Abp 405,093 0.52%
174,191 Old Mutual Ltd 141,192 0.18%
57,700 Oversea-Chinese Banking Corp Ltd 439,278 0.56%
20,338 Physicians Realty Trust 362,220 0.46%
25,501 Piedmont Office Realty Trust Inc 411,841 0.53%
10,051 Plus500 Ltd 198,905 0.25%
167,600 Postal Savings Bank of China Co Ltd 122,500 0.16%
2,633 Prudential Financial Inc 203,926 0.26%
14,000 Shanghai Industrial Holdings Ltd 19,142 0.02%
22,241 SITE Centers Corp 225,079 0.29%
1,800 Sompo Holdings Inc 72,880 0.09%
521 State Street Corp 37,731 0.05%
10,688 Suncorp Group Ltd 80,579 0.10%
39,145 Svenska Handelsbanken AB 397,479 0.51%
12,172 Sydbank AS 270,065 0.34%
1,906 T Rowe Price Group Inc 285,099 0.36%
34,000 T&D Holdings Inc 401,475 0.51%
38,500 Tisco Financial Group PCL 113,727 0.15%
23,600 United Overseas Bank Ltd 403,454 0.51%
11,273 Uniti Group Inc 131,218 0.17%
1,543 Visa Inc 336,929 0.43%
4,731 Wells Fargo & Co 140,747 0.18%
11,078 Western Union Co 241,279 0.31%
14,352,974 18.32%
Industrial - 7.25% (2019 - 8.22%)
1,502 Agilent Technologies Inc 176,320 0.23%
16,400 Amada Co Ltd 180,286 0.23%

Jupiter Asset Management Series Plc Annual Report and Audited Financial Statements for the financial year ended 31 December 2020
Portfolio of Investments (continued) Jupiter Merian Global Equity Income Fund (IRL) (continued)
156
Nominal Security Description Value USD % of Net
Assets
Common Stock (continued)
Industrial - 7.25% (2019 - 8.22%) (continued)
16,295 bpost SA 169,397 0.22%
108,000 China National Building Material Co Ltd 129,836 0.17%
132,000 China Resources Cement Holdings Ltd 147,451 0.19%
11,383 D/S Norden A/S 206,178 0.26%
131,267 ElSewedy Electric Co 81,573 0.10%
6,687 Emerson Electric Co 533,756 0.68%
108 FedEx Corp 28,078 0.04%
1,836 Finning International Inc 38,903 0.05%
235 GEA Group AG 8,543 0.01%
48,593 GoerTek Inc 277,301 0.35%
1,335 GrafTech International Ltd 13,871 0.02%
101,500 Hana Microelectronics PCL 134,668 0.17%
4,635 Inwido AB 68,661 0.09%
79,200 KCE Electronics PCL 109,707 0.14%
33,300 Kossan Rubber Industries 37,253 0.05%
1,791 Kuehne + Nagel International AG 408,358 0.52%
2,300 Lens Technology Co Ltd 10,765 0.01%
14,138 MDU Resources Group Inc 366,174 0.46%
9,600 Meitec Corp 499,258 0.64%
5,500 Nippon Yusen KK 128,181 0.16%
450 PerkinElmer Inc 63,261 0.08%
1,542 Rockwell Automation Inc 384,112 0.49%
9,915 Royal Mail PLC 45,549 0.06%
4,586 Signify NV 195,229 0.25%
140,000 SITC International Holdings Co Ltd 302,301 0.39%
29,600 Sri Trang Gloves Thailand PCL 75,087 0.10%
33,272 Supermax Corp Bhd 49,712 0.06%
4,380 Transcontinental Inc 72,306 0.09%
472 United Parcel Service Inc 78,461 0.10%
4,846 Uponor OYJ 108,368 0.14%
7,089 Valmet OYJ 204,118 0.26%
1,100 WEG SA 16,040 0.02%
5,600 Yamato Holdings Co Ltd 142,954 0.18%
158,400 Zoomlion Heavy Industry Science and Technology Co Ltd 190,018 0.24%
5,682,034 7.25%
Technology - 23.13% (2019 - 18.02%)
39,000 Acer Inc 32,826 0.04%
3,572 Activision Blizzard Inc 327,124 0.42%
208 Adobe Inc 103,470 0.13%
3,073 Advanced Micro Devices Inc 283,607 0.36%
22,642 Apple Inc 3,027,688 3.86%
5,965 Applied Materials Inc 518,836 0.65%
2,112 ASM International NV 469,117 0.60%

Jupiter Asset Management Series Plc Annual Report and Audited Financial Statements for the financial year ended 31 December 2020
Portfolio of Investments (continued) Jupiter Merian Global Equity Income Fund (IRL) (continued)
157
Nominal Security Description Value USD % of Net
Assets
Common Stock (continued)
Technology - 23.13% (2019 - 18.02%) (continued)
18,360 Asseco Poland SA 338,760 0.43%
1,824 Autodesk Inc 546,124 0.70%
989 Broadcom Inc 430,047 0.55%
1,402 Cadence Design Systems Inc 189,621 0.24%
2,923 Cerner Corp 227,936 0.29%
3,265 Check Point Software Technologies Ltd 437,902 0.56%
422 Cirrus Logic Inc 34,583 0.04%
1,909 Citrix Systems Inc 244,906 0.31%
1,315 Cognizant Technology Solutions Corp 106,607 0.14%
5,320 Computer Programs and Systems Inc 143,214 0.18%
175 Electronic Arts Inc 24,859 0.03%
468 FormFactor Inc 20,068 0.03%
11,000 Fukui Computer Holdings Inc 427,982 0.55%
4,984 Infosys Ltd 85,555 0.11%
13,527 Intel Corp 659,441 0.84%
4,156 International Business Machines Corp 516,757 0.66%
579 Lam Research Corp 280,497 0.36%
292 Logitech International SA 28,477 0.04%
11,000 MediaTek Inc 292,443 0.37%
11,542 Microsoft Corp 2,558,631 3.27%
36,000 Novatek Microelectronics Corp 472,778 0.60%
1,546 NVIDIA Corp 812,933 1.04%
8,793 Oracle Corp 566,269 0.72%
322 Qorvo Inc 53,893 0.07%
3,986 QUALCOMM Inc 597,701 0.76%
64,000 Quanta Computer Inc 184,271 0.24%
14,000 Realtek Semiconductor Corp 194,571 0.25%
462 salesforce.com Inc 102,749 0.13%
476 Seagate Technology PLC 28,846 0.04%
688 ServiceNow Inc 376,597 0.48%
3,122 Skyworks Solutions Inc 476,886 0.61%
5,633 STMicroelectronics NV 211,524 0.27%
12,000 Taiwan Semiconductor Manufacturing Co Ltd 226,352 0.29%
2,304 Tata Consultancy Services Ltd 90,324 0.12%
832 Teradyne Inc 100,081 0.13%
3,884 Texas Instruments Inc 631,927 0.81%
400 Tokyo Electron Ltd 149,032 0.19%
278,000 United Microelectronics Corp 466,503 0.60%
54 Zoom Video Communications Inc 19,084 0.02%
18,119,399 23.13%
Utilities - 3.41% (2019 - 6.10%)
319,591 A2A SpA 512,180 0.65%
24,082 AltaGas Ltd 354,431 0.45%

Jupiter Asset Management Series Plc Annual Report and Audited Financial Statements for the financial year ended 31 December 2020
Portfolio of Investments (continued) Jupiter Merian Global Equity Income Fund (IRL) (continued)
158
Nominal Security Description Value USD % of Net
Assets
Common Stock (continued)
Utilities - 3.41% (2019 - 6.10%) (continued)
942 Atco Ltd/Canada 26,996 0.03%
6,001 Avangrid Inc 272,985 0.35%
24,524 Drax Group PLC 125,280 0.16%
25,400 Gulf Energy Development PCL 29,037 0.04%
594 Hydro One Ltd 13,421 0.02%
581,800 Malakoff Corp Bhd 129,450 0.17%
22,170 National Grid PLC 262,243 0.33%
6,815 NorthWestern Corp 390,500 0.50%
7,123 Portland General Electric Co 299,593 0.38%
8,500 Power Assets Holdings Ltd 46,049 0.06%
6,687 PPL Corp 184,494 0.24%
1,304 Vistra Corp 25,415 0.03%
2,672,074 3.41%
Total Common Stock 76,974,587 98.25%
Preferred Stock
Energy - 0.16% (2019 - 0.00%)
66 Transneft PJSC 124,102 0.16%
124,102 0.16%
Technology - 0.10% (2019 - 0.09%)
1,132 Samsung Electronics Co Ltd 76,697 0.10%
76,697 0.10%
Utilities - 0.09% (2019 - 0.04%)
11,400 Cia de Transmissao de Energia Eletrica Paulista 61,036 0.08%
600 Cia Paranaense de Energia 8,657 0.01%
69,693 0.09%
Total Transferable Securities 77,245,079 98.60%
Futures - 0.00% (2019 - 0.01%)
Counterparty Nominal Security Description No of
Contracts Maturity
Date Unrealised
Gain USD
Bank of America Merrill Lynch 283,200 DJ Euro Stoxx 50 Future 8 19/03/2021 344 0.00% Bank of America Merrill Lynch 558,956 S&P 500 Emini Index Future 3 19/03/2021 3,529 0.00%
3,873 0.00%
Value USD
Total Financial Derivatives Instruments 3,873 0.00%
Financial Assets at Fair Value Through Profit or Loss (Cost USD 62,049,732) (2019: USD 128,470,220) 77,248,952 98.60%

Jupiter Asset Management Series Plc Annual Report and Audited Financial Statements for the financial year ended 31 December 2020
Portfolio of Investments (continued) Jupiter Merian Global Equity Income Fund (IRL) (continued)
159
Value USD % of Net
Assets
Cash at Bank 1,131,746 1.44%
Other Net Liabilities (32,553) (0.04%)
Net Assets Value as at 31 December 2020 78,348,145 100.00%
Portfolio Analysis % of Total
Assets
Transferable securities admitted to official stock exchange listing 97.44%
Transferable securities dealt in on another regulated market 0.09%
Other current assets 2.47%
Total Assets 100.00%

Jupiter Asset Management Series Plc Annual Report and Audited Financial Statements for the financial year ended 31 December 2020
Portfolio of Investments (continued) Jupiter Gold & Silver Fund
160
Nominal Security Description Value USD % of Net
Assets
Common Stock
Basic Materials - 76.44% (2019 - 78.48%)
56,744,955 Artemis Resources Ltd 5,051,195 0.50%
20,962,200 Cartier Resources Inc 5,103,497 0.51%
3,686,664 Coeur Mining Inc 38,156,972 3.81%
62,614,285 De Grey Mining Ltd 49,193,586 4.92%
5,033,333 DGO Gold Ltd 10,908,944 1.09%
29,810,534 Discovery Metals Corp 45,887,580 4.59%
3,687,317 Endeavour Silver Corp 18,620,476 1.86%
9,550,259 Evolution Mining Ltd 36,887,966 3.69%
4,138,105 First Majestic Silver Corp 55,508,399 5.55%
3,830,505 Fortuna Silver Mines Inc 31,467,124 3.15%
1,794,453 Fresnillo PLC 27,662,239 2.76%
18,370,292 Gold Road Resources Ltd 18,840,870 1.88%
5,279,361 Hecla Mining Co 34,210,259 3.42%
8,974,305 Hochschild Mining PLC 25,451,617 2.54%
194,185,810 Investigator Resources Ltd 11,122,905 1.11%
634,699 Kirkland Lake Gold Ltd 26,219,418 2.62%
1,906,132 Lundin Gold Inc 16,362,229 1.64%
2,492,857 MAG Silver Corp 51,020,077 5.10%
2,038,028 New Pacific Metals Corp 12,852,719 1.28%
1,523,517 Northern Star Resources Ltd 14,965,042 1.50%
1,722,482 Novagold Resources Inc 16,656,401 1.66%
11,559,697 Osisko Mining Inc 33,590,580 3.36%
1,449,657 Pan American Silver Corp 50,027,663 5.00%
1,383,059 Pretium Resources Inc 15,847,667 1.58%
15,612,000 Reunion Gold Corp 1,348,716 0.13%
3,944,207 Reyna Silver Corp 4,243,748 0.42%
46,261,574 S2 Resources Ltd 4,655,140 0.47%
5,321,616 Sabina Gold & Silver Corp 13,750,192 1.37%
4,000,000 Salazar Resources Ltd 1,178,042 0.12%
4,072,063 Saracen Mineral Holdings Ltd 14,971,907 1.50%
1,081,139 Seabridge Gold Inc 22,779,599 2.28%
3,220,087 Silvercorp Metals Inc 21,521,201 2.15%
9,366,667 Stavely Minerals Ltd 5,763,964 0.58%
550,594 Wheaton Precious Metals Corp 22,981,794 2.30%
764,809,718 76.44%
Consumer, Cyclical - 0.25% (2019 - 0.30%)
4,774,529 Mene Inc 2,512,318 0.25%
2,512,318 0.25%
Financial - 1.27% (2019 - 0.53%)
4,314,559 GoldMoney Inc 8,369,561 0.84%
1,735,715 O3 Mining Inc 4,321,226 0.43%
12,690,787 1.27%

Jupiter Asset Management Series Plc Annual Report and Audited Financial Statements for the financial year ended 31 December 2020
Portfolio of Investments (continued) Jupiter Gold & Silver Fund (continued)
161
Nominal Security Description Value USD % of Net
Assets
Common Stock (continued)
Industrial - 2.16% (2019 - 1.68%)
6,807,757 Alexco Resource Corp 21,653,515 2.16%
21,653,515 2.16%
Total Common Stock 801,666,338 80.12%
Warrants
Basic Materials - 0.50% (2019 - 0.01%)
6,750,000 Discovery Metals Corp 4,961,518 0.50%
4,961,518 0.50%
Consumer, Non-cyclical - 0.00% (2019 - 0.00%)
662,500 Mene Inc 9,105 0.00%
9,105 0.00%
Total Transferable Securities 806,636,961 80.62%
Investment Funds - 18.66% (2019 - 18.45%)
127,749 Quadriga Investors - Igneo Fund (UCITS) 15,543,267 1.56%
3,854,420 Sprott Physical Gold and Silver Trust (AIF) 74,583,027 7.45%
2,857,221 Sprott Physical Gold Trust (AIF) 43,115,465 4.31%
5,719,159 Sprott Physical Silver Trust (AIF) 53,416,945 5.34%
186,658,704 18.66%
Total Investment Funds 186,658,704 18.66%
Currency Exchange Contracts - 0.00% (2019 - 0.00%)
Counterparty Actual Settle Date
Issue Currency
Currency Bought
Settle Currency
Currency Sold
Unrealised Gain USD
Citibank 15/01/2021 SGD 106,418 USD 79,664 872 0.00%
Unrealised Gain on Currency Exchange Contracts at 31 December 2020 872 0.00%
Value USD
Total Financial Derivatives Instruments 872 0.00%
Financial Assets at Fair Value Through Profit or Loss (Cost USD 680,546,186) (2019: USD 439,003,719) 993,296,537 99.28%
Currency Exchange Contracts - (0.00%) (2019 - (0.00%))
Counterparty Actual Settle Date
Issue Currency
Currency Bought
Settle Currency
Currency Sold
Unrealised Loss USD
Citibank 15/01/2021 USD 8,185 SGD 10,919 (79) (0.00%)
Unrealised Loss on Currency Exchange Contracts at 31 December 2020 (79) (0.00%)

Jupiter Asset Management Series Plc Annual Report and Audited Financial Statements for the financial year ended 31 December 2020
Portfolio of Investments (continued) Jupiter Gold & Silver Fund (continued)
162
Value USD % of Net
Assets
Total Financial Derivatives Instruments (79) (0.00%)
Financial Liabilities at Fair Value Through Profit or Loss (Cost USD Nil) (2019: USD Nil) (79) (0.00%)
Cash at Bank 280,677 0.03%
Other Net Assets 6,961,183 0.69%
Net Assets Value as at 31 December 2020 1,000,538,318 100.00%
Portfolio Analysis % of Total
Assets
Transferable securities admitted to official stock exchange listing 79.39%
Transferable securities dealt in on another regulated market 0.49%
AIF 16.95%
UCITS 1.54%
Other current assets 1.63%
Total Assets 100.00%

Jupiter Asset Management Series Plc Annual Report and Audited Financial Statements for the financial year ended 31 December 2020
Portfolio of Investments (continued) Jupiter UK Specialist Equity Fund
163
Nominal Security Description Value GBP % of Net
Assets
Common Stock
Aerospace & Defense - 3.10% (2019 - 0.00%)
95,746 Avon Rubber PLC 3,063,872 0.67%
3,893,586 Chemring Group PLC 11,125,922 2.43%
14,189,794 3.10%
Construction & Materials - 2.47% (2019 - 2.82%)
5,356,273 Breedon Group PLC 4,659,958 1.02%
889,186 Marshalls PLC 6,666,672 1.45%
11,326,630 2.47%
Electronic & Electrical Equipment - 1.00% (2019 - 0.00%)
97,163 XP Power Ltd 4,571,519 1.00%
4,571,519 1.00%
Equity Investment Instruments - 3.33% (2019 - 2.27%)
8,112,820 Merian Chrysalis Investments Co Ltd 15,272,384 3.33%
15,272,384 3.33%
Financial Services - 9.36% (2019 - 9.13%)
857,548 Alpha FX Group PLC 11,148,124 2.43%
1,357,184 IntegraFin Holdings PLC 7,545,943 1.65%
319,774 Liontrust Asset Management PLC 4,109,096 0.90%
4,721,037 OSB Group PLC 20,088,012 4.38%
42,891,175 9.36%
General Industrials - 6.72% (2019 - 0.00%)
4,136,182 Melrose Industries PLC 7,379,983 1.61%
2,994,857 THG Holdings PLC 23,434,756 5.11%
30,814,739 6.72%
General Retailers - 17.03% (2019 - 8.95%)
341,932 ASOS PLC 16,383,672 3.58%
5,763,115 boohoo Group PLC 19,799,182 4.32%
3,069,178 DFS Furniture PLC 6,944,015 1.52%
769,267 Dunelm Group PLC 9,481,216 2.07%
836,709 HomeServe PLC 8,588,818 1.87%
2,219,764 Pets at Home Group PLC 9,471,733 2.07%
480,700 WH Smith PLC 7,345,096 1.60%
78,013,732 17.03%
Household Goods & Home Construction - 0.15% (2019 - 0.00%)
421,030 Taylor Wimpey PLC 693,857 0.15%
693,857 0.15%
Industrial Engineering - 1.32% (2019 - 1.64%)
1,118,439 Vesuvius PLC 6,047,959 1.32%
6,047,959 1.32%
Leisure Goods - 2.32% (2019 - 0.00%)
55,599 Games Workshop Group PLC 6,274,347 1.37%
545,105 Team17 Group PLC 4,360,840 0.95%
10,635,187 2.32%

Jupiter Asset Management Series Plc Annual Report and Audited Financial Statements for the financial year ended 31 December 2020
Portfolio of Investments (continued) Jupiter UK Specialist Equity Fund (continued)
164
Nominal Security Description Value GBP % of Net
Assets
Common Stock (continued)
Media - 15.10% (2019 - 12.56%)
4,894,652 Ascential PLC 18,859,094 4.12%
1,812,643 Auto Trader Group PLC 10,792,476 2.36%
628,822 Future PLC 11,079,844 2.42%
7,033,997 Hyve Group PLC 7,913,247 1.72%
1,531,236 Ocean Outdoor Ltd 7,965,838 1.74%
2,516,019 S4 Capital PLC 12,567,515 2.74%
69,178,014 15.10%
Mobile Telecommunications - 1.59% (2019 - 1.21%)
440,449 Gamma Communications PLC 7,267,409 1.59%
7,267,409 1.59%
Pharmaceuticals & Biotechnology - 2.13% (2019 - 2.90%)
772,966 Clinigen Group PLC 5,215,588 1.14%
435,638 Ergomed PLC 4,552,417 0.99%
9,768,005 2.13%
Real Estate Investment & Services - 2.38% (2019 - 3.54%)
5,807,377 Foxtons Group PLC 3,002,414 0.66%
2,486,498 Purplebricks Group PLC 2,600,877 0.57%
550,188 Savills PLC 5,290,058 1.15%
10,893,349 2.38%
Real Estate Investment Trusts - 2.79% (2019 - 5.02%)
568,585 Segro PLC 5,379,383 1.18%
712,858 UNITE Group PLC 7,395,902 1.61%
12,775,285 2.79%
Software & Computer Services - 2.51% (2019 - 3.10%)
382,869 Blue Prism Group plc 6,615,976 1.44%
1,441,161 Bytes Technology Group PLC 4,894,183 1.07%
11,510,159 2.51%
Support Services - 9.54% (2019 - 16.87%)
290,449 Ashtead Group PLC 10,008,873 2.18%
2,266,656 Electrocomponents PLC 19,918,240 4.35%
2,427,601 Kin & Carta PLC 3,416,848 0.75%
1,058,388 Knights Group Holdings PLC 4,164,757 0.91%
975,697 Robert Walters PLC 4,658,953 1.01%
1,281,392 Serco Group PLC 1,540,874 0.34%
43,708,545 9.54%
Technology Hardware & Equipment - 1.57% (2019 - 1.43%)
2,722,381 Spirent Communications PLC 7,193,892 1.57%
7,193,892 1.57%
Travel & Leisure - 8.24% (2019 - 8.84%)
1,015,163 JET2 PLC 14,719,864 3.21%
2,367,220 Trainline PLC 11,118,832 2.42%
259,566 Wizz Air Holdings PLC 11,937,440 2.61%
37,776,136 8.24%
Total Common Stock 424,527,770 92.65%

Jupiter Asset Management Series Plc Annual Report and Audited Financial Statements for the financial year ended 31 December 2020
Portfolio of Investments (continued) Jupiter UK Specialist Equity Fund (continued)
165
Nominal Security Description Coupon
Rate
Maturity
Date Value GBP % of Net
Assets
Government Security - 5.46% (2019 - 12.98%)
25,000,000 United Kingdom Treasury 0.00 06/01/2021 25,006,400 5.46%
25,006,400 5.46%
Total Transferable Securities 449,534,170 98.11%
Contracts For Difference - 1.30% (2019 - 0.45%)
Counterparty Nominal Security Description Unrealised
Gain GBP Citibank 1,836,088 Barratt Developments PLC 1,593,724 0.34%
Citibank 336,408 Bellway PLC 899,891 0.20%
Citibank 317,517 Computacenter PLC 666,786 0.15%
Citibank 388,101 Fresnillo PLC 56,275 0.01%
Citibank (57,349) GB080 88,891 0.02%
Citibank (2,429,169) GB142 19,433 0.00%
Citibank (417,283) GB164 41,728 0.01%
Citibank (125,023) GB221 31,256 0.01%
Citibank (326,277) GB229 130,511 0.03%
Citibank (1,313,494) GB235 68,302 0.01%
Citibank (5,392,865) GB256 806,233 0.18%
Citibank (445,036) GB348 320,426 0.07%
Citibank 1,762,434 Synthomer PLC 234,404 0.05%
Citibank 6,962,295 Taylor Wimpey PLC 992,127 0.22%
5,949,987 1.30%
Currency Exchange Contracts - 0.00% (2019 - 0.05%)
Actual Settle Date
Issue Currency
Currency Bought
Settle Currency
Currency Sold
Unrealised Gain GBP
Citibank 15/01/2021 GBP 560,437 EUR 616,148 6,200 0.00%
Citibank 15/01/2021 GBP 465,640 USD 621,727 10,158 0.00%
Unrealised Gain on Currency Exchange Contracts at 31 December 2020 16,358 0.00%
Value GBP
Total Financial Derivatives Instruments 5,966,345 1.30%
Financial Assets at Fair Value Through Profit or Loss (Cost GBP 335,029,226) (2019: GBP 354,548,748) 455,500,515 99.41%
Contracts For Difference - (5.00%) (2019 - (1.24%))
Counterparty Nominal Security Description Unrealised
Loss GBP Citibank (1,617,680) AE004 (818,734) (0.18%)
Citibank (740,494) GB071 (189,566) (0.04%)
Citibank (296,833) GB081 (369,557) (0.08%)

Jupiter Asset Management Series Plc Annual Report and Audited Financial Statements for the financial year ended 31 December 2020
Portfolio of Investments (continued) Jupiter UK Specialist Equity Fund (continued)
166
Contracts For Difference - (5.00%) (2019 - (1.24%)) (continued)
Counterparty Nominal Security Description Unrealised
Loss GBP % of Net
Assets
Citibank (2,874,266) GB088 (401,934) (0.09%)
Citibank (356,861) GB098 (558,487) (0.12%)
Citibank (85,261) GB109 (115,955) (0.03%)
Citibank (191,326) GB113 (97,576) (0.02%)
Citibank (186,044) GB115 (26,046) (0.01%)
Citibank (1,165,012) GB126 (130,481) (0.03%)
Citibank (514,852) GB140 (230,396) (0.05%)
Citibank (15,650) GB141 (16,266,610) (3.56%)
Citibank (2,011,129) GB167 (221,224) (0.05%)
Citibank (700,868) GB169 (290,860) (0.06%)
Citibank (161,048) GB186 (158,632) (0.03%)
Citibank (1,575,947) GB213 (387,683) (0.08%)
Citibank (392,541) GB222 (516,191) (0.11%)
Citibank (42,452) GB230 (63,678) (0.01%)
Citibank (295,141) GB238 (151,998) (0.03%)
Citibank (232,879) GB241 (3,493) (0.00%)
Citibank (2,485,702) GB249 (217,499) (0.05%)
Citibank (539,602) GB254 (137,599) (0.03%)
Citibank (751,089) GB340 (976,416) (0.21%)
Citibank (2,386,144) GB350 (83,515) (0.02%)
Citibank (435,722) GB351 (276,683) (0.06%)
Citibank (170,170) GB352 (56,156) (0.01%)
Citibank (560,690) GB353 (47,659) (0.01%)
Citibank 857,565 WPP PLC (118,168) (0.03%)
(22,912,796) (5.00%)
Currency Exchange Contracts - (0.34%) (2019 - (0.01%))
Actual Settle Date
Issue Currency
Currency Bought
Settle Currency
Currency Sold
Citibank 15/01/2021 EUR 32,370,407 GBP 29,776,653 (658,981) (0.14%)
Citibank 15/01/2021 USD 35,799,080 GBP 27,131,063 (904,189) (0.20%)
Unrealised Loss on Currency Exchange Contracts at 31 December 2020 (1,563,170) (0.34%)
Value GBP
Total Financial Derivatives Instruments (24,475,966) (5.34%)
Financial Liabilities at Fair Value Through Profit or Loss (Cost GBP Nil) (2019: GBP Nil) (24,475,966) (5.34%)
Cash at Bank 23,208,248 5.07%
Other Net Assets 3,959,395 0.86%
Net Assets Value as at 31 December 2020 458,192,192 100.00%
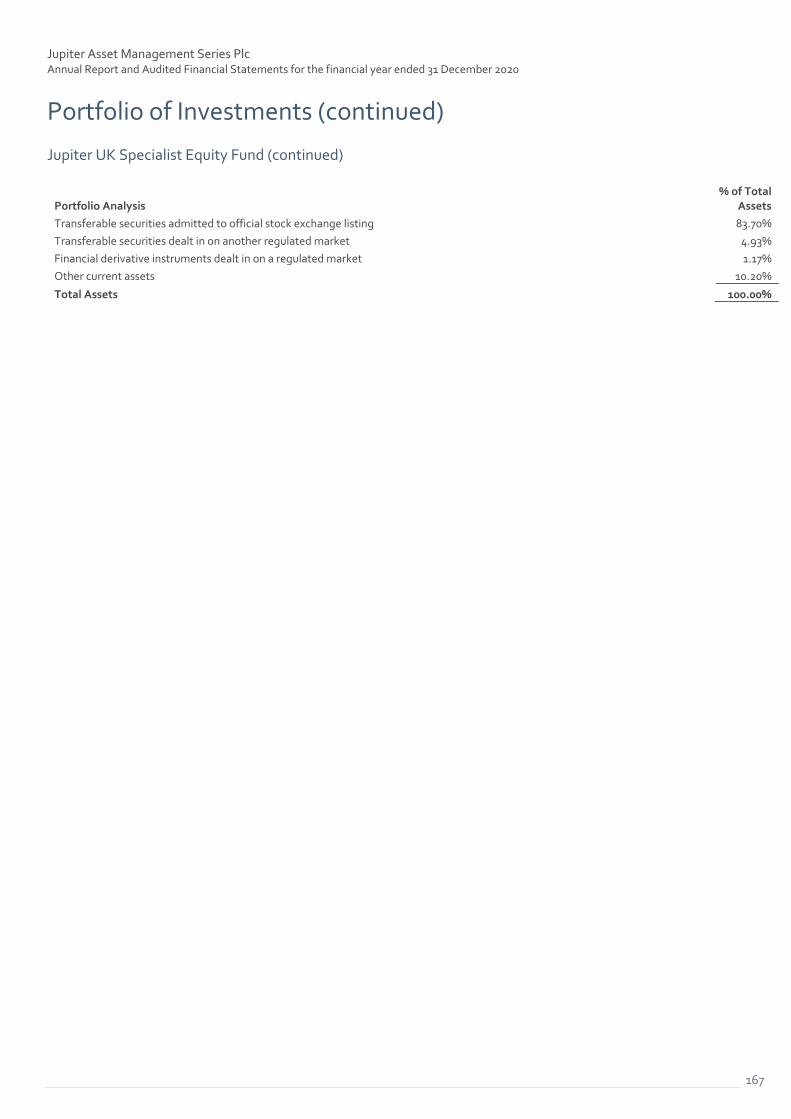
Jupiter Asset Management Series Plc Annual Report and Audited Financial Statements for the financial year ended 31 December 2020
Portfolio of Investments (continued) Jupiter UK Specialist Equity Fund (continued)
167
Portfolio Analysis % of Total
Assets
Transferable securities admitted to official stock exchange listing 83.70%
Transferable securities dealt in on another regulated market 4.93%
Financial derivative instruments dealt in on a regulated market 1.17%
Other current assets 10.20%
Total Assets 100.00%

Jupiter Asset Management Series Plc Annual Report and Audited Financial Statements for the financial year ended 31 December 2020
Portfolio of Investments (continued) Jupiter Financials Contingent Capital Fund
168
Nominal Security Description Coupon
Rate Maturity
Date Value USD % of Net
Assets
Corporate Bonds - 96.16% (2019 - 97.84%)
800,000 Abanca Corp Bancaria SA 7.50 02/01/2167 1,041,532 0.80%
800,000 ABN AMRO Bank NV 4.38 22/09/2168 1,057,998 0.81%
2,200,000 AIB Group PLC 5.25 09/04/2168 2,891,416 2.22%
1,400,000 AIB Group PLC 6.25 23/12/2168 1,907,215 1.46%
1,000,000 Arion Banki HF 6.25 26/08/2168 951,536 0.73%
3,600,000 Banco Bilbao Vizcaya Argentaria SA 6.50 05/12/2167 3,873,240 2.97%
2,400,000 Banco Santander SA 6.25 11/09/2021 3,028,900 2.32%
830,000 Bank of Ireland Group PLC 7.50 19/11/2168 1,176,417 0.90%
800,000 Bankia SA 6.38 19/12/2166 1,057,377 0.81%
600,000 Barclays PLC 7.88 15/09/2022 875,627 0.67%
600,000 Barclays PLC 7.25 15/03/2023 872,937 0.67%
1,000,000 Barclays PLC 7.75 15/12/2166 1,078,775 0.83%
1,000,000 Barclays PLC 6.38 15/03/2168 1,482,858 1.14%
2,200,000 BAWAG Group AG 5.00 14/11/2166 2,789,659 2.14%
2,200,000 CaixaBank SA 5.25 23/06/2169 2,776,970 2.14%
1,000,000 Citigroup Inc 5.95 29/12/2049 1,074,395 0.82%
4,007,000 Coventry Building Society 6.88 18/09/2167 6,160,878 4.72%
2,500,000 Credit Agricole SA 8.13 23/03/2167 3,051,010 2.34%
2,900,000 Credit Suisse Group AG 7.50 17/07/2023 3,262,960 2.50%
2,250,000 Credit Suisse Group AG 7.50 11/12/2023 2,518,075 1.93%
1,500,000 Credit Suisse Group AG 5.10 24/07/2169 1,595,592 1.22%
1,800,000 Danske Bank A/S 7.00 26/12/2166 2,006,225 1.54%
3,000,000 Deutsche Pfandbriefbank AG 5.75 28/04/2166 3,852,938 2.96%
2,000,000 Direct Line Insurance Group PLC 4.75 07/06/2166 2,765,701 2.12%
1,400,000 FinecoBank Banca Fineco SpA 5.88 03/12/2168 1,839,809 1.41%
2,800,000 HSBC Holdings PLC 6.88 29/12/2049 2,865,107 2.20%
2,600,000 HSBC Holdings PLC 5.88 28/03/2167 3,967,812 3.04%
1,000,000 Ibercaja Banco SA 7.00 06/07/2166 1,296,955 0.99%
1,300,000 IKB Deutsche Industriebank AG 4.00 31/01/2028 1,632,034 1.26%
2,000,000 Intesa Sanpaolo SpA 7.70 29/12/2049 2,329,061 1.79%
500,000 Intesa Sanpaolo SpA 5.50 01/03/2169 665,395 0.51%
1,000,000 Intesa Sanpaolo SpA 5.88 01/03/2169 1,404,343 1.08%
1,000,000 JPMorgan Chase & Co 6.10 29/10/2049 1,111,956 0.85%
1,000,000 La Mondiale SAM 4.38 24/04/2168 1,345,203 1.03%
2,000,000 Lloyds Banking Group PLC 7.50 27/06/2044 2,256,287 1.73%
1,000,000 Lloyds Banking Group PLC 5.13 27/03/2168 1,431,257 1.10%
3,900,000 Nationwide Building Society 5.88 20/12/2167 5,743,017 4.40%
2,700,000 Natwest Group PLC 8.63 15/08/2021 2,809,283 2.15%
2,000,000 Natwest Group PLC 6.00 29/09/2168 2,195,833 1.68%
1,621,000 Natwest Group PLC 5.13 12/02/2169 2,333,719 1.79%
1,000,000 Oaknorth Bank PLC 7.75 06/01/2028 1,346,026 1.03%
2,644,000 Pension Insurance Corp PLC 7.38 25/01/2168 4,434,688 3.40%
1,800,000 Phoenix Group Holdings PLC 5.75 26/10/2166 2,646,234 2.03%
2,705,000 Rothesay Life PLC 6.88 12/03/2167 4,237,788 3.25%
750,000 Societe Generale SA 6.75 07/04/2021 949,968 0.73%
1,900,000 Societe Generale SA 7.38 29/12/2049 1,994,836 1.53%

Jupiter Asset Management Series Plc Annual Report and Audited Financial Statements for the financial year ended 31 December 2020
Portfolio of Investments (continued) Jupiter Financials Contingent Capital Fund (continued)
169
Nominal Security Description Coupon
Rate Maturity
Date Value USD % of Net
Assets
Corporate Bonds - 96.16% (2019 - 97.84%) (continued)
1,499,000 Societe Generale SA 5.38 18/05/2169 1,602,477 1.23%
1,000,000 Standard Chartered PLC 6.00 26/01/2169 1,101,244 0.84%
400,000 Stichting AK Rabobank Certificaten 6.50 29/12/2049 652,714 0.50%
400,000 Svenska Handelsbanken AB 4.38 01/03/2169 422,993 0.32%
2,480,000 UBS Group AG 7.00 19/02/2025 2,978,611 2.28%
2,370,000 UBS Group AG 7.00 31/07/2167 2,672,636 2.05%
1,000,000 UniCredit SpA 6.75 29/09/2049 1,278,886 0.98%
4,000,000 UniCredit SpA 5.38 03/06/2166 5,044,859 3.87%
3,160,000 Unione di Banche Italiane SpA 5.88 20/06/2168 4,173,219 3.20%
1,000,000 Virgin Money UK PLC 9.25 08/06/2167 1,504,908 1.15%
125,419,389 96.16%
Total Transferable Securities 125,419,389 96.16%
Currency Exchange Contracts - 0.90% (2019 - 0.47%)
Counterparty Actual Settle Date
Issue Currency
Currency Bought
Settle Currency
Currency Sold
Unrealised Gain USD
Citibank 15/01/2021 CHF 10,708 USD 12,063 100 0.00%
Citibank 15/01/2021 EUR 18,638,493 USD 22,618,252 266,407 0.21%
Citibank 15/01/2021 GBP 18,559,070 USD 24,494,480 838,222 0.64%
Citibank 15/01/2021 USD 87 EUR 71 - 0.00%
Citibank 15/01/2021 USD 53 GBP 39 - 0.00%
HSBC 29/01/2021 EUR 648,612 USD 774,720 21,925 0.02%
RBS 29/01/2021 GBP 1,437,349 USD 1,920,620 41,519 0.03%
Unrealised Gain on Currency Exchange Contracts at 31 December 2020 1,168,173 0.90%
Value USD
Total Financial Derivatives Instruments 1,168,173 0.90%
Financial Assets at Fair Value Through Profit or Loss (Cost USD 112,705,941) (2019: USD 348,739,935) 126,587,562 97.06%
Currency Exchange Contracts - (1.68%) (2019 - (0.21%))
Counterparty Actual
Settle Date Issue
Currency Currency
Bought Settle
Currency Currency
Sold Unrealised
Loss USD
Canadian Imperial Bank 29/01/2021 USD 39,017,510 GBP 29,174,195 (808,293) (0.62%)
Citibank 15/01/2021 USD 346,998 EUR 285,434 (3,462) (0.00%)
Citibank 15/01/2021 USD 31,188 GBP 23,222 (508) (0.00%)
HSBC 29/01/2021 USD 45,585,703 EUR 38,238,715 (1,379,245) (1.06%)
Unrealised Loss on Currency Exchange Contracts at 31 December 2020 (2,191,508) (1.68%)
Value USD
Total Financial Derivatives Instruments (2,191,508) (1.68%)
Financial Liabilities at Fair Value Through Profit or Loss (Cost USD Nil) (2019: USD Nil) (2,191,508) (1.68%)

Jupiter Asset Management Series Plc Annual Report and Audited Financial Statements for the financial year ended 31 December 2020
Portfolio of Investments (continued) Jupiter Financials Contingent Capital Fund (continued)
170
Value USD % of Net
Assets
Cash at Bank 4,928,306 3.78%
Other Net Assets 1,097,553 0.84%
Net Assets Value as at 31 December 2020 130,421,913 100.00%
Portfolio Analysis % of Total
Assets
Transferable securities admitted to official stock exchange listing 86.85%
Transferable securities dealt in on another regulated market 6.66%
OTC financial derivative instruments 0.87%
Other current assets 5.62%
Total Assets 100.00%

INDEPENDENT AUDITOR’S REPORT TO THE MEMBERS OF JUPITER ASSET
MANAGEMENT SERIES PLC
Report on the audit of the financial statements
Opinion
We have audited the English language version of the financial statements of Jupiter Asset
Management Series Plc (‘the Company’) for the year ended 31 December 2020 set out on pages 174
to 350, which comprise the Statement of Operations, Statement of Financial Position, Statement of
Changes in Net Assets Attributable to Redeemable Participating Shareholders and related notes,
including the summary of significant accounting policies set out in note 3.The financial reporting
framework that has been applied in their preparation is Irish Law and FRS 102 The Financial
Reporting Standard applicable in the UK and Republic of Ireland issued in the United Kingdom by the
Financial Reporting Council.
In our opinion:
• the financial statements give a true and fair view of the assets, liabilities and financial position of the
Company as at 31 December 2020 and of its changes in net assets attributable to holders of
redeemable participating shares for the year then ended;
• the financial statements have been properly prepared in accordance with FRS 102 The Financial
Reporting Standard applicable in the UK and Republic of Ireland; and
• the financial statements have been properly prepared in accordance with the requirements of the
Companies Act 2014, the European Communities (Undertakings for Collective Investment in
Transferable Securities) Regulations 2011 and the Central Bank (Supervision and Enforcement) Act
2013 (Section 48(1)) (Undertakings for Collective Investment in Transferable Securities) Regulations
2019.
Basis for opinion
We conducted our audit in accordance with International Standards on Auditing (Ireland) (ISAs
(Ireland)) and applicable law. Our responsibilities under those standards are further described in the
Auditor's responsibilities for the audit of the financial statements section of our report. We are
independent of the Company in accordance with ethical requirements that are relevant to our audit of
financial statements in Ireland, including the Ethical Standard issued by the Irish Auditing and
Accounting Supervisory Authority (IAASA), and we have fulfilled our other ethical responsibilities in
accordance with these requirements.
We believe that the audit evidence we have obtained is sufficient and appropriate to provide a basis
for our opinion.
Conclusions relating to going concern
In auditing the financial statements, we have concluded that the directors’ use of the going concern
basis of accounting in the preparation of the financial statements is appropriate.
Based on the work we have performed, we have not identified any material uncertainties relating to
events or conditions that, individually or collectively, may cast significant doubt on the Company’s
ability to continue as a going concern for a period of at least twelve months from the date when the
financial statements are authorised for issue.

INDEPENDENT AUDITOR’S REPORT TO THE MEMBERS OF JUPITER ASSET
MANAGEMENT SERIES PLC (continued)
Other information
The directors are responsible for the other information presented in the Annual Report together with
the financial statements. The other information comprises the information included in the directors’
report, the directory, general information, depositary’s report, investment advisers’ reports, portfolio of
investments, significant purchases and sales (unaudited), price record (unaudited), total expense
ratios (unaudited), fund performance (unaudited), events during the financial year (unaudited) and
supplementary information (unaudited). The financial statements and our auditor’s report thereon do
not comprise part of the other information. Our opinion on the financial statements does not cover the
other information and, accordingly, we do not express an audit opinion or, except as explicitly stated
below, any form of assurance conclusion thereon.
Our responsibility is to read the other information and, in doing so, consider whether, based on our
financial statements audit work, the information therein is materially misstated or inconsistent with the
financial statements or our audit knowledge. Based solely on that work we have not identified material
misstatements in the other information.
Based solely on our work on the other information undertaken during the course of the audit, we
report that:
• we have not identified material misstatements in the directors’ report;
• in our opinion, the information given in the directors’ report is consistent with the financial
statements;
• in our opinion, the directors’ report has been prepared in accordance with the Companies Act 2014.
The Securities and Futures Commission of Hong Kong Code on Unit Trusts and Mutual Funds
We report that the following sub-funds of the Company: Merian Asian Equity Income Fund, Jupiter Emerging Market Debt Fund, Jupiter Europe (ex UK) Smaller Companies Fund, Merian European Equity Fund, Jupiter Merian Global Equity Income Fund (IRL), Jupiter Gold & Silver Fund, Jupiter Merian North American Equity Fund, Jupiter Pacific Equity Fund, Merian Global Dynamic Bond Fund, Jupiter UK Alpha Fund (IRL), Jupiter Merian World Equity Fund have been properly prepared in accordance with the requirements of the Securities and Futures Commission of Hong Kong Code on Unit Trusts and Mutual Funds relevant for an Irish registered UCITS. We note that the Sub-Funds, Jupiter China Equity Fund, Merian Japanese Equity Fund, Jupiter Merian US Equity Income Fund, Merian European Best Ideas Fund, Merian Investment Grade Corporate Bond Fund, Jupiter Global Emerging Markets Focus Fund, Jupiter Local Currency Emerging Market Debt Fund, Jupiter UK Smaller Companies Focus Fund, Jupiter UK Dynamic Equity Fund, Merian Global Strategic Bond Fund (IRL), Jupiter Merian Global Equity Absolute Return Fund, Jupiter Strategic Absolute Return Bond Fund, Merian Pan African Fund, Merian Monthly Income High Yield Bond Fund, Merian Compass Portfolio 2, Merian Compass Portfolio 3, Merian Compass Portfolio 4, Merian Compass Portfolio 5, Jupiter UK Specialist Equity Fund, Merian Style Premia Absolute Return Fund and Jupiter Financials Contingent Capital Fund are not/no longer authorised in Hong Kong and not available to the public in Hong Kong.
Opinions on other matters prescribed by the Companies Act 2014
We have obtained all the information and explanations which we consider necessary for the purposes
of our audit.
In our opinion the accounting records of the Company were sufficient to permit the financial
statements to be readily and properly audited and the financial statements are in agreement with the
accounting records.

INDEPENDENT AUDITOR’S REPORT TO THE MEMBERS OF JUPITER ASSET
MANAGEMENT SERIES PLC (continued)
Matters on which we are required to report by exception
The Companies Act 2014 requires us to report to you if, in our opinion, the disclosures of directors’
remuneration and transactions required by Sections 305 to 312 of the Act are not made. We have
nothing to report in this regard.
Respective responsibilities and restrictions on use
Responsibilities of directors for the financial statements
As explained more fully in the directors’ responsibilities statement set out on pages 18- 19, the
directors are responsible for: the preparation of the financial statements including being satisfied that
they give a true and fair view; such internal control as they determine is necessary to enable the
preparation of financial statements that are free from material misstatement, whether due to fraud or
error; assessing the Company’s ability to continue as a going concern, disclosing, as applicable,
matters related to going concern; and using the going concern basis of accounting unless they either
intend to liquidate the Company or to cease operations, or have no realistic alternative but to do so.
Auditor’s responsibilities for the audit of the financial statements
Our objectives are to obtain reasonable assurance about whether the financial statements as a whole
are free from material misstatement, whether due to fraud or error, and to issue an auditor’s report
that includes our opinion. Reasonable assurance is a high level of assurance, but is not a guarantee
that an audit conducted in accordance with ISAs (Ireland) will always detect a material misstatement
when it exists. Misstatements can arise from fraud or error and are considered material if, individually
or in the aggregate, they could reasonably be expected to influence the economic decisions of users
taken on the basis of these financial statements.
A fuller description of our responsibilities is provided on IAASA’s website at
http://www.iaasa.ie/Publications/Auditing-standards/International-Standards-on-Auditing-for-use-in-
Ire/Description-of-the-auditor-s-responsibilities-for.
The purpose of our audit work and to whom we owe our responsibilities
Our report is made solely to the Company’s members, as a body, in accordance with Section 391 of
the Companies Act 2014. Our audit work has been undertaken so that we might state to the
Company’s members those matters we are required to state to them in an auditor’s report and for no
other purpose. To the fullest extent permitted by law, we do not accept or assume responsibility to
anyone other than the Company and the Company’s members, as a body, for our audit work, for this
report, or for the opinions we have formed.
Liam McNally 29 April 2021 for and on behalf of KPMG Chartered Accountants, Statutory Audit Firm 1 Harbourmaster Place, IFSC, Dublin

Jupiter Asset Management Series Plc Annual Report and Audited Financial Statements for the financial year ended 31 December 2020
Financial Statements Statement of Operations for the financial year ended 31 December 2020
174
Jupiter China
Equity Fund
Merian Global Strategic
Bond Fund (IRL)*
Jupiter Merian World
Equity Fund Jupiter Pacific
Equity Fund Merian European
Equity Fund Merian Japanese
Equity Fund(b)
Jupiter Merian US Equity
Income Fund
Jupiter Merian North American
Equity Fund (IRL)
Notes USD USD USD USD EUR JPY USD USD
Income Investment income 3e 1,094,549 - 4,250,305 1,598,641 918,685 - 3,552,485 12,224,064 Other income 15,798 1,918 17,857 8,553 165,815 - 53,262 105,812 Net gain/(loss) on financial assets/liabilities at fair value through profit or loss 3i 13,732,167 - 18,397,596 15,059,431 (1,175,848) - 6,553,036 73,915,258 Net investment income 14,842,514 1,918 22,665,758 16,666,625 (91,348) - 10,158,783 86,245,134 Expenses Operating expenses 8,9 1,174,407 1,918 3,646,568 1,916,375 1,041,697 - 2,504,895 7,743,493 Net income 13,668,107 - 19,019,190 14,750,250 (1,133,045) - 7,653,888 78,501,641 Finance costs Distributions 10 - - - - - - 1,659,198 2,936,470
Taxation Foreign Tax Withheld 73,599 - 882,738 142,649 75,493 - 894,312 3,294,439 Capital Gains Tax 4 - - - - - - - - 73,599 - 882,738 142,649 75,493 - 894,312 3,294,439
Change in Net Assets Attributable to Redeemable Participating Shareholders 13,594,508 - 18,136,452 14,607,601 (1,208,538) - 5,100,378 72,270,732

Jupiter Asset Management Series Plc Annual Report and Audited Financial Statements for the financial year ended 31 December 2020
Financial Statements (continued) Statement of Operations for the financial year ended 31 December 2020 (continued)
175
Merian Global Dynamic
Bond Fund
Jupiter Emerging Market
Debt Fund
Merian European Best
Ideas Fund^^
Merian Investment Grade Corporate
Bond Fund***
Jupiter Global Emerging
Markets Focus Fund
Merian Asian Equity
Income Fund
Jupiter Local Currency Emerging
Market Debt Fund
Jupiter UK Alpha
Fund (IRL)
Notes USD USD EUR USD USD USD USD GBP
Income Investment income 3e 239,916 - - - 2,629,461 1,513,370 - 958,168 Other income 140,678 29,954 31,102 1,666 23,637 196,771 108,041 12,124 Net gain/(loss) on financial assets/liabilities at fair value through profit or loss 3i 25,577,794 5,413,216 (2,138) (52) 31,211,219 (18,952,454) (22,065,666) (9,128,863) Net investment income 25,958,388 5,443,170 28,964 1,614 33,864,317 (17,242,313) (21,957,625) (8,158,571) Expenses Operating expenses 8,9 3,326,226 2,328,879 71,438 1,614 3,060,145 1,541,275 5,381,611 546,674 Net income 22,632,162 3,114,291 (42,474) - 30,804,172 (18,783,588) (27,339,236) (8,705,245) Finance costs Distributions 10 1,980,416 3,265,555 - - - 95,958 20,660,357 720,526
Taxation Foreign Tax Withheld 54,377 (218) (42,474) - 293,858 102,474 770,585 5,059 Capital Gains Tax 4 122,402 22,071 - - (71,247) - 990,887 - 176,779 21,853 (42,474) - 222,611 102,474 1,761,472 5,059
Change in Net Assets Attributable to Redeemable Participating Shareholders 20,474,967 (173,117) - - 30,581,561 (18,982,020) (49,761,065) (9,430,830)

Jupiter Asset Management Series Plc Annual Report and Audited Financial Statements for the financial year ended 31 December 2020
Financial Statements (continued) Statement of Operations for the financial year ended 31 December 2020 (continued)
176
Jupiter UK Smaller Companies
Focus Fund
Jupiter UK Dynamic Equity Fund
Jupiter Merian Global
Equity Absolute Return Fund
Jupiter Strategic Absolute Return
Bond Fund Merian Pan
African Fund(c)
Merian Monthly Income High Yield
Bond Fund(a)
Jupiter Europe (ex UK) Smaller
Companies Fund
Jupiter Merian Global Equity
Income Fund (IRL)
Notes GBP GBP USD USD USD USD EUR USD
Income Investment income 3e 2,081,832 4,080,471 3,886,996 180,549 - - 503,087 2,973,451 Other income 146,931 10,619 741,721 85,503 - - 47,257 2,233 Net gain/(loss) on financial assets/liabilities at fair value through profit or loss 3i 34,954,956 36,327,480 (44,252,037) 8,634,378 - - (16,994,070) (264,909) Net investment income 37,183,719 40,418,570 (39,623,320) 8,900,430 - - (16,443,726) 2,710,775 Expenses Operating expenses 8,9 7,837,511 21,958,091 25,423,791 1,588,800 - - 662,383 1,398,380 Net income 29,346,208 18,460,479 (65,047,111) 7,311,630 - - (17,106,109) 1,312,395 Finance costs Distributions 10 2,235,422 4,319,290 - 2,880 - - 250,921 1,770,270
Taxation Foreign Tax Withheld 42,312 88,372 3,464,370 38,661 - - (103,512) 530,165 Capital Gains Tax 4 - - - 110,289 - - - (16,475)
42,312 88,372 3,464,370 148,950 - - (103,512) 513,690
Change in Net Assets Attributable to Redeemable Participating Shareholders 27,068,474 14,052,817 (68,511,481) 7,159,800 - - (17,253,518) (971,565)

Jupiter Asset Management Series Plc Annual Report and Audited Financial Statements for the financial year ended 31 December 2020
Financial Statements (continued) Statement of Operations for the financial year ended 31 December 2020 (continued)
177
Jupiter Gold & Silver
Fund
Merian Compass
Portfolio 2^
Merian Compass
Portfolio 3^
Merian Compass
Portfolio 4^
Merian Compass
Portfolio 5^
Jupiter UK Specialist
Equity Fund
Merian Style Premia Absolute
Return Fund**
Jupiter Financials Contingent
Capital Fund Combined Total December 2020
Notes USD USD USD USD USD GBP USD USD USD
Income Investment income 3e 3,268,991 - - - - 2,871,191 - - 51,940,874 Other income 81,777 1,601 83 90 92 110,636 1,270,434 22,215 3,551,348 Net gain/(loss) on financial assets/liabilities at fair value through profit or loss 3i 263,638,917 (4) (893) (1,566) (614) 77,834,232 (479) (5,429,107) 530,036,054
Net investment income 266,989,685 1,597 (810) (1,476) (522) 80,816,059 1,269,955 (5,406,892) 585,528,276
Expenses Operating expenses 8,9 8,588,611 1,597 2,047 9,825 2,808 24,474,307 1,281,755 2,052,275 145,778,670
Net income 258,401,074 - (2,857) (11,301) (3,330) 56,341,752 (11,800) (7,459,167) 439,749,606
Finance costs Distributions 10 - - - - - - - 12,434,298 54,485,078
Taxation Foreign Tax Withheld 254,157 - (2,857) (11,301) (3,330) 100,529 (11,800) (49,472) 10,941,656 Capital Gains Tax 4 - - - - - - - - 1,157,927
254,157 - (2,857) (11,301) (3,330) 100,529 (11,800) (49,472) 12,099,583
Change in Net Assets Attributable to Redeemable Participating Shareholders 258,146,917 - - - - 56,241,223 - (19,843,993) 373,164,945
The Company has not recognised gains and losses in the financial period other than those dealt with in the Statement of Operations. All results are from continuing activities. The accompanying notes form an integral part of the financial statements.

Jupiter Asset Management Series Plc Annual Report and Audited Financial Statements for the financial year ended 31 December 2020
Financial Statements (continued) Statement of Operations for the financial year ended 31 December 2019
178
Merian
China Equity Fund
Merian Global Strategic
Bond Fund (IRL)* Merian World
Equity Fund Merian Pacific
Equity Fund Merian European
Equity Fund Merian Japanese
Equity Fund(b) Merian US Equity
Income Fund
Merian North American
Equity Fund
Notes USD USD USD USD EUR JPY USD USD
Income Investment income 3e 1,570,366 8,907 6,910,649 2,538,723 982,626 - 6,032,423 23,501,811 Other income 18,807 40,350 133,468 80,982 80,294 - 322,963 276,591 Net gain/(loss) on financial assets/liabilities at fair value through profit or loss 3i 9,926,957 174,965 66,441,887 13,176,937 7,715,889 - 48,199,786 285,214,503 Net investment income 11,516,130 224,222 73,486,004 15,796,642 8,778,809 - 54,554,470 308,992,905 Expenses Operating expenses 8,9 1,323,540 104,861 5,453,881 2,397,093 930,431 - 3,423,062 12,263,284 Net income 10,192,590 119,361 68,032,123 13,399,549 7,848,378 - 51,131,408 296,729,621 Finance costs Distributions 10 - 36,105 - - - - 2,917,245 3,371,503
Taxation Foreign Tax Withheld 80,109 2,614 1,250,143 206,684 51,130 - 1,174,812 6,094,000 Capital Gains Tax 4 - (103) - - - - - - 80,109 2,511 1,250,143 206,684 51,130 - 1,174,812 6,094,000
Change in Net Assets Attributable to Redeemable Participating Shareholders 10,112,481 80,745 66,781,980 13,192,865 7,797,248 - 47,040,053 287,264,118

Jupiter Asset Management Series Plc Annual Report and Audited Financial Statements for the financial year ended 31 December 2020
Financial Statements (continued) Statement of Operations for the financial year ended 31 December 2019 (continued)
179
Merian Global Dynamic
Bond Fund
Merian Emerging
Market Debt Fund
Merian European
Best Ideas Fund^^
Merian Investment Grade Corporate
Bond Fund***
Merian Global Emerging
Markets Fund
Merian Asian Equity
Income Fund
Merian Local Currency Emerging
Market Debt Fund
Merian UK Alpha
Fund (IRL)
Notes USD USD EUR USD USD USD USD GBP
Income Investment income 3e 250,163 - 1,320,639 17,021 3,075,447 6,935,078 - 3,174,513 Other income 273,302 128,687 316,156 58,676 35,066 80,667 244,698 9,183 Net gain/(loss) on financial assets/liabilities at fair value through profit or loss 3i 18,142,843 32,219,038 8,587,865 746,380 26,145,628 36,815,292 63,910,663 13,464,874 Net investment income 18,666,308 32,347,725 10,224,660 822,077 29,256,141 43,831,037 64,155,361 16,648,570 Expenses Operating expenses 8,9 3,018,026 3,455,801 1,084,390 205,149 1,940,748 4,599,716 7,292,091 800,527 Net income 15,648,282 28,891,924 9,140,270 616,928 27,315,393 39,231,321 56,863,270 15,848,043 Finance costs Distributions 10 2,610,735 4,764,060 - 28,301 - 195,140 32,440,221 1,978,540
Taxation Foreign Tax Withheld 29,692 19,877 (36,572) - 304,452 482,866 1,377,177 14,055 Capital Gains Tax 4 110,459 23,665 - - 490,386 - 1,074,858 - 140,151 43,542 (36,572) - 794,838 482,866 2,452,035 14,055
Change in Net Assets Attributable to Redeemable Participating Shareholders 12,897,396 24,084,322 9,176,842 588,627 26,520,555 38,553,315 21,971,014 13,855,448

Jupiter Asset Management Series Plc Annual Report and Audited Financial Statements for the financial year ended 31 December 2020
Financial Statements (continued) Statement of Operations for the financial year ended 31 December 2019 (continued)
180
Merian UK Smaller Companies Focus Fund
Merian UK Dynamic Equity Fund
Merian Global Equity Absolute
Return Fund
Merian Strategic Absolute Return Bond Fund
Merian Pan African Fund(c)
Merian Monthly Income High Yield
Bond Fund(a)
Merian Europe (ex UK) Smaller
Companies Fund
Merian Global Equity
Income Fund (IRL)
Notes GBP GBP USD USD USD USD EUR USD
Income Investment income 3e 6,373,532 10,585,884 147,591,421 566,419 - - 5,754,688 6,029,515 Other income 36,992 118,534 8,155,679 55,157 - 356 70,218 14,647 Net gain/(loss) on financial assets/liabilities at fair value through profit or loss 3i 82,076,469 129,035,419 (1,199,068,903) 13,968,603 - 7,250 53,731,391 26,388,201 Net investment income 88,486,993 139,739,837 (1,043,321,803) 14,590,179 - 7,606 59,556,297 32,432,363 Expenses Operating expenses 8,9 4,431,372 6,485,613 291,212,129 1,433,985 - 7,606 2,267,207 2,089,141 Net income 84,055,621 133,254,224 (1,334,533,932) 13,156,194 - - 57,289,090 30,343,222 Finance costs Distributions 10 - 2,633,826 - 8,655 - - 420,265 4,260,372
Taxation Foreign Tax Withheld 100,083 127,927 15,533,438 162,793 - - (79,503) 1,014,970 Capital Gains Tax 4 - - - 65,984 - - - 51,877 100,083 127,927 15,533,438 228,777 - (79,503) 1,066,847
Change in Net Assets Attributable to Redeemable Participating Shareholders 83,955,538 130,492,471 (1,350,067,370) 12,918,762 - - 56,948,328 25,016,003

Jupiter Asset Management Series Plc Annual Report and Audited Financial Statements for the financial year ended 31 December 2020
Financial Statements (continued) Statement of Operations for the financial year ended 31 December 2019 (continued)
181
Merian Gold & Silver
Fund
Merian Compass
Portfolio 2^
Merian Compass
Portfolio 3^
Merian Compass
Portfolio 4^
Merian Compass
Portfolio 5^
Merian UK Specialist
Equity Fund
Merian Style Premia Absolute
Return Fund**
Merian Financials Contingent
Capital Fund Combined Total December 2019
Notes USD USD USD USD USD GBP USD USD USD
Income Investment income 3e 2,078,755 129,397 1,058,319 1,758,597 223,322 7,984,431 248,626 - 255,529,181 Other income 54,389 53,481 686,720 1,054,230 120,178 92,968 2,413,871 55,051 15,209,930 Net gain/(loss) on financial assets/liabilities at fair value through profit or loss 3i 149,340,198 834,554 12,892,158 28,679,784 5,028,056 42,941,675 (4,864,102) 67,562,795 114,480,893
Net investment income 151,473,342 1,017,432 14,637,197 31,492,611 5,371,556 51,019,074 (2,201,605) 67,617,846 385,220,004
Expenses Operating expenses 8,9 4,329,213 183,881 1,892,059 3,015,897 412,555 17,682,741 3,343,702 2,218,830 398,036,653
Net income 147,144,129 833,551 12,745,138 28,476,714 4,959,001 33,336,333 (5,545,307) 65,399,016 (12,816,649)
Finance costs Distributions 10 - - - - - - - 16,630,780 73,636,720
Taxation Foreign Tax Withheld 236,829 7,557 110,511 182,805 16,709 197,941 122,205 32,726 28,933,476 Capital Gains Tax 4 - - - - - - - - 1,817,126
236,829 7,557 110,511 182,805 16,709 197,941 122,205 32,726 30,750,602
Change in Net Assets Attributable to Redeemable Participating Shareholders 146,907,300 825,994 12,634,627 28,293,909 4,942,292 33,138,392 (5,667,512) 48,735,510 (117,203,971)
The Company has not recognised gains and losses in the financial period other than those dealt with in the Statement of Operations. All results are from continuing activities. The accompanying notes form an integral part of the financial statements.

Jupiter Asset Management Series Plc Annual Report and Audited Financial Statements for the financial year ended 31 December 2020
Financial Statements (continued) Statement of Financial Position as at 31 December 2020
182
Jupiter China
Equity Fund
Merian Global Strategic
Bond Fund (IRL)*
Jupiter Merian World
Equity Fund Jupiter Pacific
Equity Fund Merian European
Equity Fund Merian Japanese
Equity Fund(b)
Jupiter Merian US Equity
Income Fund
Jupiter Merian North American
Equity Fund (IRL)
Notes USD USD USD USD EUR JPY USD USD
Assets
Financial Assets at Fair Value Through Profit or Loss:
- Transferable Securities 3c, 11 53,419,749 - 216,173,044 68,444,094 41,937,191 - 118,575,343 451,561,568
- Investment Funds 3c, 11 - - - - - - - - - Financial Derivative
Instruments 3c, 11 - - 11,321 10,013 452 -
129,420 1,145,429
Cash and Cash Equivalents 7 2,120,175 - 542,178 1,754,695 327,745 - 3,130,911 3,684,457
Due from Broker 7 653,758 - 50,442 59,649 36,931 - 2,416,274 1,739,005
Other Assets 166,165 - 790,044 292,511 99,125 - 6,601,661 13,249,038
Total Assets 56,359,847 - 217,567,029 70,560,962 42,401,444 - 130,853,609 471,379,497
Liabilities Financial Liabilities at Fair Value Through Profit or Loss:
- Financial Derivative Instruments 3c, 11 163 - 1,554 - -
- 30,868 20,080
Due to Broker 7 1,325 - 1,230 2,004 56 - 1,991,247 818,082
Bank Overdraft 7 640,768 - 124,281 - - - - -
Other Liabilities 1,222,355 - 645,505 1,047,944 133,946 - 3,738,403 2,816,684
Total Liabilities 1,864,611 - 772,570 1,049,948 134,002 - 5,760,518 3,654,846
Net Assets Attributable to Redeemable Participating Shareholders 54,495,236 - 216,794,459 69,511,014 42,267,442 - 125,093,091 467,724,651

Jupiter Asset Management Series Plc Annual Report and Audited Financial Statements for the financial year ended 31 December 2020
Financial Statements (continued) Statement of Financial Position as at 31 December 2020 (continued)
183
Merian Global Dynamic
Bond Fund
Jupiter Emerging
Market Debt Fund
Merian European Best
Ideas Fund^^
Merian Investment Grade Corporate
Bond Fund***
Jupiter Global Emerging Markets
Focus Fund
Merian Asian Equity
Income Fund
Jupiter Local Currency Emerging
Market Debt Fund
Jupiter UK Alpha
Fund (IRL)
Notes USD USD EUR USD USD USD USD GBP
Assets
Financial Assets at Fair Value Through Profit or Loss:
- Transferable Securities 3c, 11 208,305,157 94,089,158 - - 198,936,327 22,988,086 148,592,018 37,897,856
- Investment Funds 3c, 11 14,432,374 - - - - - - - - Financial Derivative
Instruments 3c, 11 2,217,070 197,753 - - - 10,118 3,503,322 597
Cash and Cash Equivalents 7 14,975,547 2,409,975 - - 2,015,182 1,500,962 3,571,923 1,111,278
Due from Broker 7 6,591,472 180,292 - - 26,321 130,836 851,391 - Other Assets 7,508,294 4,884 - - 2,313,246 157,415 120,212 80,349
Total Assets 254,029,914 96,882,062 - - 203,291,076 24,787,417 156,638,866 39,090,080
Liabilities Financial Liabilities at Fair Value Through Profit or Loss:
- Financial Derivative Instruments 3c, 11 5,078,275 194,485 - - - - 739,362 11,504
Due to Broker 7 1,425,257 57,617 - - 26,382 73,072 439,930 -
Bank Overdraft 7 - 9 - - - - 3,133 -
Other Liabilities 6,290,035 980,321 - - 2,353,355 673,697 1,745,181 162,583
Total Liabilities 12,793,567 1,232,432 - - 2,379,737 746,769 2,927,606 174,087 Net Assets Attributable to Redeemable Participating Shareholders 241,236,347 95,649,630 - - 200,911,339 24,040,648 153,711,260 38,915,993

Jupiter Asset Management Series Plc Annual Report and Audited Financial Statements for the financial year ended 31 December 2020
Financial Statements (continued) Statement of Financial Position as at 31 December 2020 (continued)
184
Jupiter UK Smaller
Companies Focus Fund
Jupiter UK Dynamic Equity Fund
Jupiter Merian Global
Equity Absolute Return Fund
Jupiter Strategic Absolute Return Bond Fund
Merian Pan African Fund(c)
Merian Monthly Income High
Yield Bond Fund(a)
Jupiter Europe (ex UK) Smaller
Companies Fund
Jupiter Merian Global
Equity Income Fund (IRL)
Notes GBP GBP USD USD USD USD EUR USD
Assets
Financial Assets at Fair Value Through Profit or Loss:
- Transferable Securities 3c, 11 289,309,824 410,557,900 1,294,256,789 107,869,721 - - 18,717,130 77,245,079
- Investment Funds 3c, 11 - - - 7,404,386 - - - - - Financial Derivative
Instruments 3c, 11 - 91,223 62,269,290 2,947,871 - - 3,867 3,873
Cash and Cash Equivalents 7 13,980,337 18,601,784 37,613,177 2,651,055 - - 99,952 1,131,746
Due from Broker 7 189,006 910,650 85,448,683 3,543,692 - - 27,155 666,596
Other Assets 1,544,614 1,127,872 14,822,466 2,507,894 - - 56,166 151,486
Total Assets 305,023,781 431,289,429 1,494,410,405 126,924,619 - - 18,904,270 79,198,780
Liabilities Financial Liabilities at Fair Value Through Profit or Loss:
- Financial Derivative Instruments 3c, 11 - 176,910 53,210,205 1,943,405 - - 6,659 -
Due to Broker 7 - - 32,665,533 1,794,643 - - 27,128 596,455
Bank Overdraft 7 - - 6,054,710 - - - 16,912 -
Other Liabilities 4,751,842 16,821,713 19,492,654 720,715 - - 137,652 254,180
Total Liabilities 4,751,842 16,998,623 111,423,102 4,458,763 - - 188,351 850,635 Net Assets Attributable to Redeemable Participating Shareholders 300,271,939 414,290,806 1,382,987,303 122,465,856 - - 18,715,919 78,348,145

Jupiter Asset Management Series Plc Annual Report and Audited Financial Statements for the financial year ended 31 December 2020
Financial Statements (continued) Statement of Financial Position as at 31 December 2020 (continued)
185
Jupiter Gold & Silver
Fund
Merian Compass
Portfolio 2^
Merian Compass
Portfolio 3^
Merian Compass
Portfolio 4^
Merian Compass
Portfolio 5^
Jupiter UK Specialist
Equity Fund
Merian Style Premia Absolute
Return Fund**
Jupiter Financials Contingent
Capital Fund
Combined Total
December 2020
Notes USD USD USD USD USD GBP USD USD USD
Assets
Financial Assets at Fair Value Through Profit or Loss:
- Transferable Securities 3c, 11 806,636,961 - - - - 449,534,170 - 125,419,389 5,689,705,470
- Investment Funds 3c, 11 186,658,704 - - - - - - - 186,658,704 - Financial Derivative
Instruments 3c, 11 872 - - - - 5,966,345 - 1,168,173 81,901,018
Cash and Cash Equivalents 7 280,677 - - - - 23,208,248 - 4,928,306 160,615,981
Due from Broker 7 2,931,789 - - - - 26,544,667 - 2,133,021 145,290,041
Other Assets 13,224,785 - - - - 1,973,838 - 476,491 69,037,724
Total Assets 1,009,733,788 - - - - 507,227,268 - 134,125,380 6,333,208,938
Liabilities Financial Liabilities at Fair Value Through Profit or Loss:
- Financial Derivative Instruments 3c, 11 79 - - - - 24,475,966 - 2,191,508 97,133,105
Due to Broker 7 3,424,510 - - - - 9,961,416 - 440,323 57,407,629
Bank Overdraft 7 1,461,393 - - - - - - - 8,304,987
Other Liabilities 4,309,488 - - - - 14,597,694 - 1,071,636 97,360,998
Total Liabilities 9,195,470 - - - - 49,035,076 - 3,703,467 260,206,719
Net Assets Attributable to Redeemable Participating Shareholders 1,000,538,318 - - - - 458,192,192 - 130,421,913 6,073,002,219
The accompanying notes form an integral part of the financial statements.


Jupiter Asset Management Series Plc Annual Report and Audited Financial Statements for the financial year ended 31 December 2020
Financial Statements (continued) Statement of Financial Position as at 31 December 2019
187
Merian China
Equity Fund
Merian Global Strategic
Bond Fund (IRL)*
Merian World
Equity Fund
Merian Pacific
Equity Fund
Merian European
Equity Fund
Merian Japanese
Equity Fund(b)
Merian US Equity
Income Fund
Merian North American
Equity Fund
Notes USD USD USD USD EUR JPY USD USD
Assets
Financial Assets at Fair Value Through Profit or Loss:
- Transferable Securities 3c, 11 59,086,440 - 320,155,521 87,644,069 49,048,921 - 219,947,338 1,149,712,099
- Investment Funds 3c, 11 - - - - 20,442 - - - - Financial Derivative
Instruments 3c, 11 - - 28,964 - - - 33,830 186,552
Cash and Cash Equivalents 7 710,786 - 5,415,030 2,129,635 425,017 - 4,521,825 12,510,931
Due from Broker 7 417,232 - 760,017 88,946 64,371 - 2,769,385 1,788,367
Other Assets 830,609 25 856,766 505,736 45,006 - 925,418 4,589,207
Total Assets 61,045,067 25 327,216,298 90,368,386 49,603,757 - 228,197,796 1,168,787,156
Liabilities Financial Liabilities at Fair Value Through Profit or Loss:
- Financial Derivative Instruments 3c, 11 145 - 10,921 608 3,780 - 18,923 159,627
Due to Broker 7 246,986 - 527,877 102,090 38,126 - 2,670,139 1,528,338
Bank Overdraft 7 632,348 25 - - - - - -
Other Liabilities 1,288,545 - 1,982,595 1,232,902 248,945 - 9,378,991 8,403,484
Total Liabilities 2,168,024 25 2,521,393 1,335,600 290,851 - 12,068,053 10,091,449 Net Assets Attributable to Redeemable Participating Shareholders 58,877,043 - 324,694,905 89,032,786 49,312,906 - 216,129,743 1,158,695,707

Jupiter Asset Management Series Plc Annual Report and Audited Financial Statements for the financial year ended 31 December 2020
Financial Statements (continued) Statement of Financial Position as at 31 December 2019 (continued)
188
Merian Global Dynamic
Bond Fund
Merian Emerging
Market Debt Fund
Merian European
Best Ideas Fund^^
Merian Investment Grade Corporate
Bond Fund***
Merian Global Emerging
Markets Fund
Merian Asian Equity
Income Fund
Merian Local Currency Emerging
Market Debt Fund
Merian UK Alpha
Fund (IRL)
Notes USD USD EUR USD USD USD USD GBP
Assets
Financial Assets at Fair Value Through Profit or Loss:
- Transferable Securities 3c, 11 143,078,008 118,999,759 - - 148,547,369 140,280,249 451,793,125 60,340,178
- Investment Funds 3c, 11 8,448,426 - - - - - - - - Financial Derivative
Instruments 3c, 11 2,521,322 263,556 - - - 12,109 8,429,876 449
Cash and Cash Equivalents 7 496,035 5,965,432 66,274 - 829,226 1,772,407 27,467,310 2,689,404
Due from Broker 7 5,325,369 99,841 - - 175,777 39,958 3,140,928 17,468 Other Assets 191,667 82,702 - - 867,007 541,408 2,758,732 232,917
Total Assets 160,060,827 125,411,290 66,274 - 150,419,379 142,646,131 493,589,971 63,280,416
Liabilities Financial Liabilities at Fair Value Through Profit or Loss:
- Financial Derivative Instruments 3c, 11 4,202,756 23,020 - - - - 3,861,192 1,141
Due to Broker 7 1,506,816 99,421 - - 89,517 55,046 916,919 17,504
Bank Overdraft 7 - - - - - - 4,489,755 -
Other Liabilities 1,203,494 878,592 66,274 - 1,504,861 544,230 4,067,989 156,303
Total Liabilities 6,913,066 1,001,033 66,274 - 1,594,378 599,276 13,335,855 174,948 Net Assets Attributable to Redeemable Participating Shareholders 153,147,761 124,410,257 - - 148,825,001 142,046,855 480,254,116 63,105,468

Jupiter Asset Management Series Plc Annual Report and Audited Financial Statements for the financial year ended 31 December 2020
Financial Statements (continued) Statement of Financial Position as at 31 December 2019 (continued)
189
Merian UK Smaller Companies Focus Fund
Merian UK Dynamic Equity Fund
Merian Global Equity Absolute
Return Fund
Merian Strategic Absolute Return Bond Fund
Merian Pan African Fund(c)
Merian Monthly Income High
Yield Bond Fund(a)
Merian Europe (ex UK) Smaller
Companies Fund
Merian Global Equity Income
Fund (IRL)
Notes GBP GBP USD USD USD USD EUR USD
Assets
Financial Assets at Fair Value Through Profit or Loss:
- Transferable Securities 3c, 11 347,816,096 497,418,284 3,710,796,218 174,689,040 - - 170,209,206 142,483,888
- Investment Funds 3c, 11 - - - 8,135,049 - - - - - Financial Derivative
Instruments 3c, 11 - 127,510 71,477,899 2,852,687 - - 95 15,105
Cash and Cash Equivalents 7 1,077,861 9,510,682 91,593,504 1,705,011 - 962 5,692,132 2,951,885
Due from Broker 7 6,986 2,437,461 264,979,129 5,827,137 - - 320,370 1,303,943
Other Assets 2,273,984 1,251,395 31,024,710 80,831 - 356 123,364 290,091
Total Assets 351,174,927 510,745,332 4,169,871,460 193,289,755 - 1,318 176,345,167 147,044,912
Liabilities Financial Liabilities at Fair Value Through Profit or Loss:
- Financial Derivative Instruments 3c, 11 - 29,142 127,035,362 4,028,854 - - 14,023 3,855
Due to Broker 7 - 44,504 86,830,751 1,833,691 - - 1,130,947 1,181,475
Bank Overdraft 7 - - 12,829,000 - - - - -
Other Liabilities 909,803 1,073,490 85,129,271 658,330 - 1,318 288,193 353,243
Total Liabilities 909,803 1,147,136 311,824,384 6,520,875 - 1,318 1,433,163 1,538,573 Net Assets Attributable to Redeemable Participating Shareholders 350,265,124 509,598,196 3,858,047,076 186,768,880 - - 174,912,004 145,506,339

Jupiter Asset Management Series Plc Annual Report and Audited Financial Statements for the financial year ended 31 December 2020
Financial Statements (continued) Statement of Financial Position as at 31 December 2019 (continued)
190
Merian Gold &
Silver Fund
Merian Compass
Portfolio 2^
Merian Compass
Portfolio 3^
Merian Compass
Portfolio 4^
Merian Compass
Portfolio 5^
Merian UK Specialist
Equity Fund
Merian Style Premia Absolute
Return Fund**
Merian Financials Contingent
Capital Fund
Combined Total
December 2019
Notes USD USD USD USD USD GBP USD USD USD
Assets
Financial Assets at Fair Value Through Profit or Loss:
- Transferable Securities 3c, 11 464,045,203 - - - - 433,587,253 - 377,494,157 9,728,924,340
- Investment Funds 3c, 11 105,665,986 - - - - - - - 105,688,932 - Financial Derivative
Instruments 3c, 11 - - - - - 2,197,184 - 1,911,819 90,814,059
Cash and Cash Equivalents 7 4,630,249 6,504 151,296 161,365 35,191 2,811,988 378,780 2,031,829 193,721,227
Due from Broker 7 3,638,613 - - - - 7,739,298 - 2,955,091 307,255,662
Other Assets 4,418,083 16,189 52,572 78,259 10,785 178,663 - 5,525,575 59,051,210
Total Assets 582,398,134 22,693 203,868 239,624 45,976 446,514,386 378,780 389,918,471 10,485,455,430
Liabilities Financial Liabilities at Fair Value Through Profit or Loss:
- Financial Derivative Instruments 3c, 11 1,198 - - - - 5,467,454 - 2,851,812 149,501,384
Due to Broker 7 4,846,525 - - - - 182,116 - 297,917 104,369,196
Bank Overdraft 7 1,539,685 - - - - 1,337 - - 19,492,584
Other Liabilities 3,159,777 22,693 203,868 239,624 45,976 1,967,248 378,780 953,304 127,749,739
Total Liabilities 9,547,185 22,693 203,868 239,624 45,976 7,618,155 378,780 4,103,033 401,112,903 Net Assets Attributable to Redeemable Participating Shareholders 572,850,949 - - - - 438,896,231 - 385,815,438 10,084,342,527
The accompanying notes form an integral part of the financial statements.

Jupiter Asset Management Series Plc Annual Report and Audited Financial Statements for the financial year ended 31 December 2020
Financial Statements (continued) Statement of Changes in Net Assets Attributable to Redeemable Participating Shareholders for the financial year ended 31 December 2020
191
Jupiter China
Equity Fund
Merian Global Strategic
Bond Fund (IRL)*
Jupiter Merian World
Equity Fund
Jupiter Pacific
Equity Fund
Merian European
Equity Fund Merian Japanese
Equity Fund(b)
Jupiter Merian US Equity
Income Fund
Jupiter Merian North American
Equity Fund (IRL)
USD USD USD USD EUR JPY USD USD
Value of Fund at 1 January 2020 58,877,043 - 324,694,905 89,032,786 49,312,906 - 216,129,743 1,158,695,707 Proceeds from Shares Issued 28,423,514 - 109,060,480 26,759,364 9,182,463 - 492,245,729 921,833,504 Payments for Shares Redeemed (46,399,829) - (235,097,378) (60,888,737) (15,019,389) - (588,382,759) (1,685,075,292)
40,900,728 - 198,658,007 54,903,413 43,475,980 - 119,992,713 395,453,919 Change in Net Assets Attributable to
Redeemable Participating Shares 13,594,508 - 18,136,452 14,607,601 (1,208,538) - 5,100,378 72,270,732
Net Assets at 31 December 2020 54,495,236 - 216,794,459 69,511,014 42,267,442 - 125,093,091 467,724,651
Merian Global Dynamic
Bond Fund
Jupiter Emerging Market
Debt Fund
Merian European Best
Ideas Fund^^
Merian Investment Grade Corporate
Bond Fund***
Jupiter Global Emerging Markets
Focus Fund
Merian Asian Equity
Income Fund
Jupiter Local Currency Emerging
Market Debt Fund
Jupiter UK Alpha
Fund (IRL)
USD USD EUR USD USD USD USD GBP
Value of Fund at 1 January 2020 153,147,761 124,410,257 - - 148,825,001 142,046,855 480,254,116 63,105,468 Proceeds from Shares Issued 412,211,458 35,213,031 - - 133,009,951 28,546,730 232,129,795 15,205,876 Payments for Shares Redeemed (344,597,839) (63,800,541) - - (111,505,174) (127,570,917) (508,911,586) (29,964,521)
220,761,380 95,822,747 - - 170,329,778 43,022,668 203,472,325 48,346,823 Change in Net Assets Attributable to
Redeemable Participating Shares 20,474,967 (173,117) - - 30,581,561 (18,982,020) (49,761,065) (9,430,830)
Net Assets at 31 December 2020 241,236,347 95,649,630 - - 200,911,339 24,040,648 153,711,260 38,915,993

Jupiter Asset Management Series Plc Annual Report and Audited Financial Statements for the financial year ended 31 December 2020
Financial Statements (continued) Statement of Changes in Net Assets Attributable to Redeemable Participating Shareholders for the financial year ended 31 December 2020 (continued)
192
Jupiter UK Smaller Companies
Focus Fund
Jupiter UK Dynamic Equity Fund
Jupiter Merian Global Equity Absolute
Return Fund
Jupiter Strategic Absolute Return Bond Fund
Merian Pan African Fund(c)
Merian Monthly Income High Yield
Bond Fund(a)
Jupiter Europe (ex UK) Smaller
Companies Fund
Jupiter Merian Global Equity
Income Fund (IRL)
GBP GBP USD USD USD USD EUR USD
Value of Fund at 1 January 2020 350,265,124 509,598,196 3,858,047,076 186,768,880 - - 174,912,004 145,506,339 Proceeds from Shares Issued 120,912,542 77,904,082 1,225,388,280 102,031,834 - - 5,241,031 7,376,316 Payments for Shares Redeemed (197,974,201) (187,264,289) (3,631,936,572) (173,494,658) - - (144,183,598) (73,562,945)
273,203,465 400,237,989 1,451,498,784 115,306,056 - - 35,969,437 79,319,710 Change in Net Assets Attributable to
Redeemable Participating Shares 27,068,474 14,052,817 (68,511,481) 7,159,800 - - (17,253,518) (971,565)
Net Assets at 31 December 2020 300,271,939 414,290,806 1,382,987,303 122,465,856 - - 18,715,919 78,348,145
Jupiter
Gold & Silver Fund
Merian Compass
Portfolio 2^
Merian Compass
Portfolio 3^
Merian Compass
Portfolio 4^
Merian Compass
Portfolio 5^
Jupiter UK Specialist
Equity Fund
Merian Style Premia Absolute
Return Fund**
Jupiter Financials Contingent
Capital Fund
USD USD USD USD USD GBP USD USD
Value of Fund at 1 January 2020 572,850,949 - - - - 438,896,231 - 385,815,438 Proceeds from Shares Issued 850,689,084 - - - - 112,971,983 - 155,608,915 Payments for Shares Redeemed (681,148,632) - - - - (149,917,245) - (391,158,447)
742,391,401 - - - - 401,950,969 - 150,265,906 Change in Net Assets Attributable to
Redeemable Participating Shares 258,146,917 - - - - 56,241,223 - (19,843,993)
Net Assets at 31 December 2020 1,000,538,318 - - - - 458,192,192 - 130,421,913

Jupiter Asset Management Series Plc Annual Report and Audited Financial Statements for the financial year ended 31 December 2020
Financial Statements (continued) Statement of Changes in Net Assets Attributable to Redeemable Participating Shareholders for the financial year ended 31 December 2019
193
Merian China
Equity Fund
Merian Global Strategic Bond
Fund (IRL)*
Merian World
Equity Fund
Merian Pacific
Equity Fund
Merian European
Equity Fund Merian Japanese
Equity Fund(b)
Merian US Equity
Income Fund
Merian North American
Equity Fund
USD USD USD USD EUR JPY USD USD
Value of Fund at 1 January 2019 56,706,266 7,439,479 371,578,972 88,326,760 26,943,304 - 263,653,792 1,357,714,243 Proceeds from Shares Issued 26,081,400 67,300 301,825,857 47,620,351 22,296,166 - 404,210,374 910,143,318 Payments for Shares Redeemed (34,023,104) (7,587,524) (415,491,904) (60,107,190) (7,723,812) - (498,774,476) (1,396,425,972)
48,764,562 (80,745) 257,912,925 75,839,921 41,515,658 - 169,089,690 871,431,589 Change in Net Assets Attributable to
Redeemable Participating Shares 10,112,481 80,745 66,781,980 13,192,865 7,797,248 - 47,040,053 287,264,118
Net Assets at 31 December 2019 58,877,043 - 324,694,905 89,032,786 49,312,906 - 216,129,743 1,158,695,707
Merian Global Dynamic
Bond Fund
Merian Emerging Market
Debt Fund
Merian European Best
Ideas Fund^^
Merian Investment Grade Corporate
Bond Fund***
Merian Global Emerging
Markets Fund
Merian Asian Equity
Income Fund
Merian Local Currency Emerging
Market Debt Fund
Merian UK Alpha
Fund (IRL)
USD USD EUR USD USD USD USD GBP
Value of Fund at 1 January 2019 203,397,122 190,151,986 58,858,967 12,371,008 125,143,197 318,787,450 378,833,499 93,652,465 Proceeds from Shares Issued 75,357,344 247,852,379 1,522,070 562,713 62,388,171 14,756,766 367,490,495 23,680,000 Payments for Shares Redeemed (138,504,101) (337,678,430) (69,557,879) (13,522,348) (65,226,922) (230,050,676) (288,040,892) (68,082,445)
140,250,365 100,325,935 (9,176,842) (588,627) 122,304,446 103,493,540 458,283,102 49,250,020 Change in Net Assets Attributable to
Redeemable Participating Shares 12,897,396 24,084,322 9,176,842 588,627 26,520,555 38,553,315 21,971,014 13,855,448
Net Assets at 31 December 2019 153,147,761 124,410,257 - - 148,825,001 142,046,855 480,254,116 63,105,468

Jupiter Asset Management Series Plc Annual Report and Audited Financial Statements for the financial year ended 31 December 2020
Financial Statements (continued) Statement of Changes in Net Assets Attributable to Redeemable Participating Shareholders for the financial year ended 31 December 2019 (continued)
194
Merian UK
Smaller Companies Focus Fund
Merian UK Dynamic Equity Fund
Merian Global Equity Absolute Return Fund
Merian Strategic Absolute Return Bond Fund
Merian Pan African Fund(c)
Merian Monthly Income High Yield
Bond Fund(a)
Merian Europe (ex UK) Smaller
Companies Fund
Merian Global Equity Income
Fund (IRL)
GBP GBP USD USD USD USD EUR USD
Value of Fund at 1 January 2019 324,940,665 451,737,710 13,111,897,789 149,280,506 - - 244,541,463 165,967,399 Proceeds from Shares Issued 66,881,427 44,308,765 3,632,913,333 78,784,016 - - 20,652,036 17,141,121 Payments for Shares Redeemed (125,512,506) (116,940,750) (11,536,696,676) (54,214,404) - - (147,229,823) (62,618,184)
266,309,586 379,105,725 5,208,114,446 173,850,118 - - 117,963,676 120,490,336 Change in Net Assets Attributable to
Redeemable Participating Shares 83,955,538 130,492,471 (1,350,067,370) 12,918,762 - - 56,948,328 25,016,003
Net Assets at 31 December 2019 350,265,124 509,598,196 3,858,047,076 186,768,880 - - 174,912,004 145,506,339
Merian Gold & Silver
Fund Merian Compass
Portfolio 2^ Merian Compass
Portfolio 3^ Merian Compass
Portfolio 4^ Merian Compass
Portfolio 5^
Merian UK Specialist
Equity Fund
Merian Style Premia Absolute
Return Fund**
Merian Financials Contingent
Capital Fund
USD USD USD USD USD GBP USD USD
Value of Fund at 1 January 2019 291,618,201 24,204,374 235,708,683 379,167,527 52,391,347 566,746,712 82,544,516 251,253,050 Proceeds from Shares Issued 343,589,842 1,456,197 23,088,235 24,337,650 1,055,322 91,935,803 26,095 160,451,791 Payments for Shares Redeemed (209,264,394) (26,486,565) (271,431,545) (431,799,086) (58,388,961) (252,924,676) (76,903,099) (74,6124,913)
425,943,649 (825,994) (12,634,627) (28,293,909) (4,942,292) 405,757,839 5,667,512 337,079,928 Change in Net Assets Attributable to
Redeemable Participating Shares 146,907,300 825,994 12,634,627 28,293,909 4,942,292 33,138,392 (5,667,512) 48,735,510
Net Assets at 31 December 2019 572,850,949 - - - - 438,896,231 - 385,815,438

Jupiter Asset Management Series Plc Annual Report and Audited Financial Statements for the financial year ended 31 December 2020
Notes to the Financial Statements for the financial year ended 31 December 2020
195
1. Reporting Entity Jupiter Asset Management Series Plc (the “Company”) is an open-ended investment company with variable capital organised under the laws of Ireland. The Company is organised in the form of an umbrella fund insofar as the share capital of the Company will be divided into different series of Shares with each series of Shares representing a portfolio of assets which will comprise a separate fund (each a “Sub-Fund”). As at 31 December 2020, the Company has 21 Sub-Funds in operation (31 December 2019: 21 Sub-Funds). Merian Global Strategic Bond Fund (IRL)*, Merian Investment Grade Corporate Bond Fund*** and Merian Style Premia Absolute Return Fund** closed during 2019. The assets of Merian Compass Portfolio 2^, Merian Compass Portfolio 3^, Merian Compass Portfolio 4^ and Merian Compass Portfolio 5^ were transferred into Quilter Investors ICAV during 2019. The assets of Merian European Best Ideas Fund^^ were transferred into Merian European Equity Fund during 2019. Merian Japanese Equity Fund(b), Merian Pan African Fund(c) and Merian Monthly Income High Yield Bond Fund(a) closed during 2018. These Sub-Funds were revoked by the Central Bank of Ireland post year end and they are therefore included in this Annual Report and Audited Financial Statements for the financial year ended 31 December 2020. See subsequent events note for further details. However, no Investment Advisers’ reports are included for these funds as they were dormant and not active for the full financial year ended 31 December 2020.
2. Basis of Preparation The Company is incorporated in Ireland and authorised by the Central Bank of Ireland (“Central Bank”). The financial statements are prepared in accordance with Financial Reporting Standard 102 applicable in the UK and Republic of Ireland (“FRS 102”) issued by the Financial Reporting Council (“FRC”) in September 2015 and promulgated by the Institute of Chartered Accountants in Ireland (“ICAI”), Irish statute comprising the Companies Act 2014 (as amended) and the European Communities (Undertakings for Collective Investment in Transferable Securities) Regulations 2011 (as amended) (“the UCITS Regulations”) and the Central Bank (Supervision and Enforcement) Act 2013 (Section 48(1)) (Undertakings for Collective Investment in Transferable Securities) Regulations 2019 (the “Central Bank UCITS Regulations”). The format and certain wordings of the financial statements have been adapted from those contained in the FRS 102 and the Companies Act 2014 so that, in the opinion of the Directors, they more appropriately reflect the nature of the Company’s business as an investment fund. The Company has availed of the exemption available to open-ended investment funds under FRS 102 and are not presenting a cash flow statement. Measurement Convention The financial statements are prepared under the historical cost convention as modified by the revaluation of financial assets and financial liabilities at fair value through profit or loss. The debt instruments are held in the financial statements at an amount that includes accrued interest.
Going Concern The financial statements of the Company have been prepared on the going concern basis.
3. Significant Accounting Policies
The principal accounting policies and estimates applied in the preparation of these financial statements are set out below. These policies have been consistently applied to all the periods presented, unless otherwise stated.
a. Estimates and Judgements The preparation of financial statements in conformity with FRS 102 requires management to make judgements, estimates and assumptions that may affect the reported amounts of assets, liabilities, income and expenses.

Jupiter Asset Management Series Plc Annual Report and Audited Financial Statements for the financial year ended 31 December 2020
Notes to the Financial Statements for the financial year ended 31 December 2020 (continued)
196
3. Significant Accounting Policies (continued) a. Estimates and Judgements (continued) The estimates and associated assumptions are based on historical experience and various other factors which are believed to be reasonable under the circumstances, the results of which form the basis of making the judgements about carrying values of assets and liabilities which are not readily apparent from others. Estimates and underlying assumptions are reviewed on an ongoing basis. Revisions to accounting estimates are recognised in the period in which the estimates are revised and in any future accounting periods affected. Information about assumptions and estimation uncertainties that have a significant risk of resulting in a material adjustment within the next financial year, as well as critical judgement in applying accounting policies that have the most significant effect on the amounts recognised in the financial statements are included in Note 11. b. Foreign Currency Translation Functional and Presentation Currency of the Company The Company has adopted United States Dollar (“USD”) as its presentation currency as a substantial part of the Company’s assets and liabilities are denominated in USD. Functional and Presentation Currency of the Sub-Funds Items included in the Company’s financial statements are measured using the currency of the primary economic environment in which the respective Sub-Funds operate (the “functional currency”). The functional currency, which is either Euro (“EUR”), United States Dollar (“USD”) or Pound Sterling (“GBP”), is shown in the Statement of Financial Position for each Sub-Fund. The Sub-Funds also adopted these functional currencies as their presentation currency.
Transactions and Balances Transactions in foreign currencies are translated to the Sub-Fund's functional currency at the foreign exchange rate at the date of the transaction. Assets and liabilities in foreign currencies are translated into the functional currency at the rates prevailing at the financial year end date. Translation of Sub-Funds for the purposes of calculating the Company values For the purposes of calculating the overall value of the Company, for all Sub-Funds where USD is not the functional currency, all assets and liabilities in the Statement of Financial Position are translated to USD at financial year end exchange rates and all income and expenses are translated to USD using an average rate of exchange for the financial year. c. Financial Instruments
The Company has chosen to implement the recognition and measurement provisions of IAS 39 and only the disclosure requirements of Sections 11 and 12 of FRS 102. The majority of the Company’s financial instruments are classified in categories that require measurement at fair value through profit or loss, with the basis for arriving at this position being set out below. Classification The Company classifies financial assets and financial liabilities into the following categories: Financial assets at fair value through profit or loss:
- Held for trading: transferable securities, investment funds and financial derivative instruments. Financial assets at amortised cost:
- Loans and receivables: cash and cash equivalents, due from broker, collateral cash, deposits with credit institutions and other assets.

Jupiter Asset Management Series Plc Annual Report and Audited Financial Statements for the financial year ended 31 December 2020
Notes to the Financial Statements for the financial year ended 31 December 2020 (continued)
197
3. Significant Accounting Policies (continued) c. Financial Instruments (continued)
Classification (continued) The Company classifies financial assets and financial liabilities into the following categories (continued): Financial liabilities at fair value through profit or loss:
- Held for trading: financial derivative instruments. Financial liabilities at amortised cost:
- Other liabilities: due to broker, bank overdraft and other liabilities and Net Assets Attributable to Redeemable Participating Shareholders.
A financial instrument is classified as held for trading if:
- it is acquired or incurred principally for the purpose of selling or repurchasing it in the near term; - on initial recognition, it is part of a portfolio that is managed together and for which there is evidence of a recent pattern
of short-term profit taking; or - is a derivative, other than a designated and effective hedging instrument.
Recognition and Measurement Financial assets and financial liabilities at fair value through profit or loss are recognised as of the day the transaction takes place (trade date), the date on which the Sub-Fund commits to purchase or sell the asset. Investments are initially recognised at fair value, and costs for all financial assets and financial liabilities carried at fair value through profit or loss are expensed as incurred. Other financial assets and financial liabilities are recognised on the date in which they originated. Financial assets and financial liabilities not at fair value through profit or loss are initially recognised at fair value plus transaction costs that are directly attributable to their acquisition or issue. Subsequent to initial recognition, all instruments classified at fair value through profit or loss are measured at fair value with changes in their fair value recognised in the Statement of Operations. Financial assets and liabilities, other than those at fair value through profit or loss, are measured at amortised cost using the effective interest rate, with other assets being measured using effective interest rate and less impairment losses, if any. Financial liabilities arising from the redeemable shares issued by the Company are carried at the redemption amount representing the investors’ right to a residual interest in the Company’s assets. Fair Value Measurement ‘Fair value’ is the price that would be received to sell an asset or paid to transfer a liability in an orderly transaction between market participants at the measurement date in the principal or, in its absence, the most advantageous market to which the Sub-Fund has access at that date. The fair value of a liability reflects its non-performance risk. i) Transferable Securities When available, the Sub-Funds measure the fair value of an investment using the quoted price in an active market for that instrument. A market is regarded as ‘active’ if transactions for the asset or liability take place with sufficient frequency and volume to provide pricing information on an ongoing basis. Sub-funds measure instruments quoted in an active market at a last traded price, without any deduction for estimated future selling cost. The last traded price provides a reasonable approximation of exit price. If there is no quoted price in an active market, then the Sub-Fund uses valuation techniques that maximise the use of relevant observable inputs and minimise the use of unobservable inputs. The chosen valuation technique incorporates all of the factors that market participants would take into account in pricing a transaction.

Jupiter Asset Management Series Plc Annual Report and Audited Financial Statements for the financial year ended 31 December 2020
Notes to the Financial Statements for the financial year ended 31 December 2020 (continued)
198
3. Significant Accounting Policies (continued) c. Financial Instruments (continued)
Fair Value Measurement (continued)
ii) Investment Funds The fair value of investment funds is based on the underlying fund administrator’s calculation of the net asset value per share (market value of the Sub-Fund’s assets less liabilities divided by the number of shares) which will be the latest bid price published by the investment funds taking into account any adjustments that may be required to account for illiquidity, low trading volumes or any such factors that may indicate that the bid price may not be fair value. The fair value of any investments in closed-ended investment funds is based on the bid prices available on the principal market for such security at the valuation date taking into account any adjustments that may be required to account for illiquidity, low trading volumes or any such factors that may indicate that the bid price may not be fair value. iii) Financial Derivative Instruments
Currency Exchange Contracts The Sub-Funds may employ currency exchange contracts to purchase or sell a specific currency at a future date at a price set at the time of the contract. The base currency of each Sub-Fund is either GBP, EUR or USD but securities in a Sub-Fund may be denominated in a large range of currencies. Consequently, a Sub-Fund may enter into currency exchange contracts to hedge against exchange rate risk. Performance may be significantly influenced by movements in foreign exchange rates because currency positions held by a Sub-Fund may not correspond with the currency of the securities invested in. The unrealized gain or loss on open currency exchange contracts is calculated as the difference between the contract price and the spot price as at financial year end. Any changes in fair value are recognised in the Statement of Operations. Futures contracts Futures contracts are commitments either to purchase or sell a designated financial instrument, currency, commodity or an index at a specified future date for a specified price and may be settled in cash or another financial asset. Futures are standardised exchange-traded contracts. Initial margin requirements for futures are met in cash or other instruments, and changes in the futures contract values are settled daily. Daily fluctuations in the value of a futures contract are recorded for financial reporting purposes as unrealised gains or losses by the Sub-Funds and are recorded as a realised gain or loss when the position is closed. Options A Sub-Fund may purchase and sell (write) call and put options on securities, securities indices and foreign currencies traded on a national securities exchange or in an over-the-counter market. When a Sub-Fund purchases a call or a put option, a premium is paid by the Sub-Fund. The premium on purchased put options exercised is subtracted from the proceeds of the sale of the underlying security or foreign currency in determining the realised gain or loss. The premium on purchased call options exercised is included in determining initial fair value of the securities or foreign currency purchased. Premiums paid on the purchase of options which expire unexercised are treated as realised losses. The option is subsequently marked-to-market to reflect the fair value of the option purchased, which is reported within financial assets at fair value through profit or loss on the Statement of Financial Position for each relevant Sub-Fund. The over-the-counter options are valued at close of business on the dealing day at the settlement price as provided by the counterparty/broker and the values are independently valued, at a minimum, weekly. The fair value of exchange traded options are based upon their quoted daily settlement prices on the relevant exchange. In the event of it being impossible or incorrect to carry out a valuation of a specific investment in accordance with the valuation rules, or if such valuation is not representative of a security’s fair market value, the Directors are entitled to use other generally recognised valuation methods in order to reach a proper valuation of that specific instrument, provided that such method of valuation has been approved by the Depositary.

Jupiter Asset Management Series Plc Annual Report and Audited Financial Statements for the financial year ended 31 December 2020
Notes to the Financial Statements for the financial year ended 31 December 2020 (continued)
199
3. Significant Accounting Policies (continued) c. Financial Instruments (continued)
Fair Value Measurement (continued)
iii) Financial Derivative Instruments (continued) Swap contracts Swap contracts are carried at fair value based upon the fair value of the underlying assets, the risk associated with the underlying assets, and any additional provisions of the derivative contract.
Interest rate swaps (“IRSs”) are measured initially at fair value on the date on which the derivative contract is entered into and subsequently remeasured at fair value. Fair values are obtained from counterparties or from quoted market prices in active markets, including recent market transactions, and from valuation techniques using discounted cash flow models and option pricing models as appropriate. IRSs are included in assets when the fair value is positive, and in liabilities when the fair value is negative, unless there is the legal ability and intention to settle the asset and liability on a net basis. Revenues/payments arising on IRSs are included in the net gain on investment activities in the Statement of Operations. Credit default swap (“CDS”) and Credit Default Index swap (“CDX”) contracts are valued at fair value based on a pricing methodology utilising certain factors which include the credit risk of the reference obligations of the underlying issuers, as well as the specific terms of the contract. Certain CDS and CDX contracts entered into may include upfront fees that are paid by the buyer to the seller of the CDS and CDX contracts at the date of transaction. Such fees are reported as unrealised gains or losses in the Statement of Financial Position and as net gains and losses in the Statement of Operations. These upfront payments represent the amounts paid or received when initially entering into the swap agreement to compensate for differences between the stated terms of the swap agreement and the prevailing market conditions and are included as realised gains or losses on the Statement of Operations upon termination or maturity of the swap.
Contracts for difference Contracts for difference may be used either as a substitute for direct investment in the underlying equity or fixed income security or as an alternative to and for the same purposes as futures and options. Changes in the value of open contracts for difference are recognised as unrealised gains or losses on contracts for difference and are included in net gain/loss on financial assets and financial liabilities at fair value through profit and loss in the Statement of Operations, until the contracts are terminated, at which time realised gains and losses are recognised as a realised gain or loss and included in net gain/loss on financial assets and financial liabilities at fair value through profit and loss in the Statement of Operations. Unrealised gains or losses on contracts for difference are shown in the Statement of Financial Position. Amortised cost measurement Financial asset and liabilities other than those classified at fair value through profit or loss are held at amortised cost. The amortised cost of the financial asset or financial liability is the amount at which the financial asset or financial liability is measured at initial recognition, minus principal repayments, plus or minus the accumulative amortisation using the effective interest method of any difference between the initial amount recognised and the maturity amount, minus any reduction for impairment. i) Cash and Cash Equivalents/Due to/from Broker Cash amounts held comprise of current deposits in banks which are readily available. Cash equivalents are short-term highly liquid investments that are readily convertible to known amounts of cash, are subject to an insignificant risk of changes in value and are held for the purpose of meeting short-term cash commitments rather than for investment or other purposes.

Jupiter Asset Management Series Plc Annual Report and Audited Financial Statements for the financial year ended 31 December 2020
Notes to the Financial Statements for the financial year ended 31 December 2020 (continued)
200
3. Significant Accounting Policies (continued)
c. Financial Instruments (continued)
i) Cash and Cash Equivalents/Due to/from Broker (continued)
Due to/from Broker is an amount which is made up of margin cash, spot contracts and collateral pledged. The margin cash and cash collateral is held by or due to brokers for open futures contracts and represents the exchange traded futures contracts margin deposits. This amount is the minimum deemed by the brokers and counterparties for collateral requirements and is as such restricted and therefore reported separately to the unrestricted cash on the Sub-Fund’s Statements of Financial Position.
Sub-Fund’s assets may be deposited by or received by the Sub-Fund for collateral purposes with counterparties in respect of OTC financial derivative instruments held by the Sub-Fund. Such assets remain in the ownership of the relevant Sub-Fund and are recorded as an asset on the Statement of Financial Position. In relation to cash received as collateral this will be recorded as an asset and a related liability to repay the collateral will be recorded as a liability on the Statement of Financial Position.
Investments pledged by the Sub-Funds as collateral are recognised at fair value in the relevant Sub-Fund’s Portfolio of Investments and are referenced accordingly at the base of the Portfolio of Investments. Securities received by the Sub-Funds as collateral from counterparties do not form part of the Net Asset Value of the Sub-Funds and are disclosed at the end of the relevant Portfolio of Investments.
ii) Other Assets and Other Liabilities Other assets and liabilities represent amounts receivable and payable respectively, for transactions contracted for but not yet paid for by the end of the reporting period. These amounts held relate to subscription and redemption monies and dividend transactions. Other assets and liabilities are primarily non-interest bearing and short term in nature.
Fund asset cash balances, including an appropriate equal and opposing liability, are reflected at a Sub-Fund level on the Statement of Financial Position. The fund asset cash receivables are included in the Other Assets and fund asset cash payables are included in the Other Liabilities on the Statement of Financial Position respectively. They represent umbrella cash collection account balances attributable to the individual Sub-Funds of the Company. These amounts relate to subscription and redemption monies, including dividend money, that are due to an individual Sub-Fund, as Sub-Fund assets, and which are held in an umbrella cash collection account in the name of the Company.
Offsetting Financial assets and financial liabilities are offset and the net amount presented in the Statement of Financial Position when, and only when, the Sub-Fund has a legally enforceable right to offset the recognised amounts and it intends either to settle on a net basis or to realise the asset and settle the liability simultaneously. The Company’s financial assets and financial liabilities are not subject to offsetting, enforceable master netting arrangements and similar agreements. Income and expenses are presented on a net basis for gains and losses from financial instruments at fair value through profit or loss and foreign exchange gains and losses.
Derecognition Each Sub-Fund derecognises a financial asset when the contractual rights to the cash flows from the asset expire, or it transfers the rights to receive the contractual cash flows in a transaction in which substantially all of the risks and rewards of ownership of the financial asset are transferred or in which the sub-fund neither transfers nor retains substantially all of the risks and rewards of ownership and does not retain control of the financial asset.
On derecognition of a financial asset, the difference between the carrying amount of the asset (or the carrying amount allocated to the portion of the asset that is derecognised) and the consideration received (including any new asset obtained less any new liability assumed) is recognised in the Statement of Operations. Any interest in such transferred financial assets that is created or retained by the Company is recognised as a separate asset or liability.
The Company derecognises a financial liability when its contractual obligations are discharged or cancelled, or expire.

Jupiter Asset Management Series Plc Annual Report and Audited Financial Statements for the financial year ended 31 December 2020
Notes to the Financial Statements for the financial year ended 31 December 2020 (continued)
201
3. Significant Accounting Policies (continued)
d. Cross Investments
During the financial years ended 31 December 2020 and 31 December 2019 a number of the Sub-Funds invested in other Sub-Funds in the Company (the “Cross Investments”). The fair value of these investments as of 31 December 2020 is disclosed within each relevant Sub-Fund’s Portfolio of Investments. For details on how these are eliminated at a Company level, please refer to the Related Parties note. For the purposes of producing the combined Company total financial statements, investments by Sub-Funds within the Company in the units of other Sub-Funds within the Company, also known as “Cross Investments” must be eliminated in order to prevent double counting. e. Dividend income/expense
Dividend income arising on the underlying equity investments of the Company is recognised as income of the relevant Sub-Fund on the ex-dividend date. Income is shown gross of any non-recoverable withholding taxes, which is disclosed separately in the Statement of Operations, and net of any tax credits. The Sub-Funds incur expenses on contract for differences equal to the dividends due on these securities. Such dividend expense is recognised in the Statement of Operations as dividend expense on contract for differences when the shareholders’ right to receive payment is established. f. Interest income/expense
Interest income and interest expense recognised in the Statement of Operations comprise interest on financial assets and liabilities measured at amortised cost calculated using the effective interest rate method. When calculating the effective interest rate, the Sub-Funds estimate future cash flows considering all contractual terms but not future credit losses. Interest received or receivable and interest paid or payable are recognised in the Statement of Operations and included in other income and operational expenses, respectively. Interest income from bonds and swap contracts is recognised in the Statement of Operations as part of net gain/loss on financial assets/liabilities at fair value through profit or loss. g. Expenses All expenses are recognised in the Statement of Operations on an accruals basis. Expenses arising on the disposal of investments are deducted from the disposal proceeds. h. Transaction Costs
Transaction costs are incurred on the acquisition or disposal of financial assets or liabilities at fair value through profit or loss. Transaction costs are incremental costs that are directly attributable to the acquisition, issue or disposal of a financial asset or liability. They include fees and commissions paid to agents, advisers, brokers or dealers. Transaction costs, when incurred, are expensed immediately in the Statement of Operations. i. Realised Gains and Losses Net realised gains and losses from financial instruments at fair value through profit or loss include all realised gains and losses and coupon interest earned from debt securities held by the Sub-Funds. Realised gains and losses on sales of investments are calculated based on the average cost of the investment in local currency and are included in net gain/loss on financial assets/liabilities at fair value through profit or loss in the Statement of Operations.

Jupiter Asset Management Series Plc Annual Report and Audited Financial Statements for the financial year ended 31 December 2020
Notes to the Financial Statements for the financial year ended 31 December 2020 (continued)
202
3. Significant Accounting Policies (continued)
j. Unrealised Gains and Losses
Unrealised gains and losses on investments are the difference between the average cost of the investment and its value at the reporting period end and are included in net gain/loss on financial assets/liabilities at fair value through profit or loss in the Statement of Operations. k. Redeemable Participating Shares In accordance with the Prospectus, the Company issues redeemable participating shares, which are redeemable at the holder's option and are classified as financial liabilities. Redeemable participating Shares can be put back into the Sub-Fund at any time for cash equal to a proportionate share of the Sub-Fund's net asset value ("NAV"). The redeemable participating share is carried at the redemption amount that is payable at the year end date if the holder exercises the right to put the share back into the Sub-Fund. Save as may be otherwise described in the Supplement for the relevant Sub-Fund the Net Asset Value per redeemable participating share is determined as at 12 noon GMT on each valuation day in accordance with the provisions set out in the Prospectus. An anti-dilution levy ("ADL") is applied daily where the pending deals are over a fixed percentage of the NAV. The ADL is included within Other Income in the Statement of Operations. l. Taxation The Sub-Funds currently incur withholding taxes imposed by certain countries on investment income and capital gains. Such income or gains are recorded gross of withholding taxes in the Statement of Operations. Withholding taxes are shown as a separate item in the Statement of Operations. m. Borrowing Costs Borrowing costs are recognised as an expense in the financial year in which they are incurred.
4. Taxation The Company qualifies as investment undertaking as defined in Section 739B of the Taxes Consolidated Act 1997. On that basis, Irish tax is not chargeable to the Company on its income or capital gains. Irish tax can arise on the happening of a “chargeable event” in the Company. A chargeable event includes any payments of distributions to Shareholders, any encashment, repurchase, redemption, cancellation or transfer of Shares and any deemed disposal of Shares for Irish tax purposes arising as a result of holding Shares in the Company for a period of eight years or more. Where a chargeable event occurs, the Company is required to account for the Irish tax thereon. A gain on a chargeable event may not arise in respect of:
(i) any transactions (which might otherwise be a chargeable event) in relation to Shares held in a recognised clearing system
as designated by order of the Revenue Commissioners of Ireland; or; (ii) a transfer of Shares between spouses and any transfer of Shares between spouses or former spouses on the occasion of
judicial separation and/or divorce; or; (iii) an exchange by a Shareholder, effected by way of arm’s length bargain where no payment is made to the Shareholder,
of Shares in the Company for other Shares in the Company; or; (iv) an exchange of Shares arising on a qualifying amalgamation or reconstruction of the Company with another Irish
investment fund.

Jupiter Asset Management Series Plc Annual Report and Audited Financial Statements for the financial year ended 31 December 2020
Notes to the Financial Statements for the financial year ended 31 December 2020 (continued)
203
4. Taxation (continued)
A gain on a chargeable event may not arise in respect of (continued):
(v) a Shareholder who is not an Irish resident and not ordinarily resident in Ireland at the time of the chargeable event, provided the necessary signed statutory declarations are held by the Company; or;
(vi) a Shareholder who is an exempt Irish resident and it (or an intermediary acting on its behalf) has made the necessary declaration to that effect.
In the absence of an appropriate declaration, the Company will be liable to Irish tax on the occurrence of a chargeable event.
Dividends, interest and capital gains (if any) received on investments made by the Company may be subject to withholding taxes or capital gains taxes imposed by the country from which the investment income/gains are received and such taxes may not be recoverable by the Company or its Shareholders.
The Company may be subject to taxes imposed on realised and unrealised gains on securities of certain foreign countries in which the Company invests. The foreign tax expense, if any, is recorded on an accrual basis and is included in capital gains taxes in the Statement of Operations. The amount of foreign tax owed, if any, is included in other liabilities in the Statement of Financial Position.
Under Brazilian, Indian and Pakistani income tax laws, capital gains tax is payable on the sale of assets, investments and capital accumulation. Included in the capital gains tax expense in the Statement of Operations is USD 1,157,927 (31 December 2019: USD 1,818,284) included in other liabilities in the Statement of Financial Position is a payable of USD 709,720 (31 December 2019: USD 992,266).
5. Related Parties Related Party Transactions
Jupiter Asset Management (Europe) Limited is the Manager and Distributor of the Company. Jupiter Investment Management Limited is the Investment Manager. The Manager, the Investment Manager and all Investment Advisers are listed in the Directory. Please see Note 9 relating to the Management Fee paid by the Company for the financial year to the Manager. The Manager is responsible for the payment of the investment management fee to the Investment Manager out of the Management Fee.
The Directors are entitled to a fee by way of remuneration for their services. The aggregate amount of Directors’ remuneration in any one financial year shall not exceed EUR 60,000 for each of the Directors, inclusive of sub-committee and chair fees. The Directors may also be reimbursed for reasonable reimbursements and out of pocket expenses properly incurred by them in attending and returning from meetings of the Board of Directors of the Company or in connection with the business of the Company. These are paid by the Company. Total Directors’ fees and expenses were USD 216,273 for the financial year ended 31 December 2020 (31 December 2019: USD 191,408) and the amount payable at the financial year end for 2020 was USD Nil (31 December 2019: USD Nil).
Nicola Stronach, who was an employee of the Investment Manager, Jupiter Investment Management Limited until 26 November 2020, was not entitled to receive a Director’s fee or other compensation in connection with her role as a Director of the Company. Jasveer Singh, as employee of Jupiter Asset Management, was not entitled to receive a Director’s fee or other compensation in connection with his role as a Director of the Company.
Distribution fees are also regarded as related party transactions, details of these transactions are disclosed in Note 10.
At the financial year end, related parties have Shareholdings in the Company with a value of USD 40,095,090 (at 31 December 2019: USD 54,223,250). Subscriptions during the financial year with related parties amounted to USD 37,254,734 (31 December 2019 USD 57,571,753). Redemptions during the financial year with related parties amounted to USD 31,985,977 (31 December 2019: USD 23,184,041).

Jupiter Asset Management Series Plc Annual Report and Audited Financial Statements for the financial year ended 31 December 2020
Notes to the Financial Statements for the financial year ended 31 December 2020 (continued)
204
5. Related Parties (continued)
During the financial year, the following transactions took place with Merian Chrysalis Investment Co Ltd, an equity investment instrument managed by the Investment Manager:
Sub-Fund Trade Date Trade Type Security Quantity Proceeds (GBP)
Jupiter UK Specialist Equity Fund 01 December 2020 Sale Secret Escapes 15,371 860,622
Jupiter UK Smaller Companies Focus Fund 01 December 2020 Sale Secret Escapes 17,108 957,877
As at 31 December 2020, the following Sub-Funds held shares in Merian Chrysalis Investment Co Ltd:
Sub-Fund Nominal Value (GBP)
Jupiter UK Smaller Companies Focus Fund 5,588,286 10,505,978
Jupiter UK Specialist Equity Fund 8,112,820 15,272,384
The related party disclosures above include amounts attributable to parties who were considered to be related parties as at the date transactions took place. In the opinion of the Directors, there are no other related party transactions required to be disclosed in accordance with FRS 102.
Significant Shareholders During the financial year, there were no investors holding greater than 20% of the net asset value of the Company. (31
December 2019: Nil).
As at 31 December 2020, the following investors held greater than 20% of the Shares of the specific Sub-Funds of the Company listed below:
Sub-Fund Investor % Holding
Merian European Equity Fund Tokio Marine & Nichido Financial Life Insurance Co 68.81%
Jupiter Merian US Equity Income Fund Clearstream Banking S.A. 44.05%
Jupiter Global Emerging Markets Focus Fund Fundsettle EOC Nominees Ltd - Cirilium Moderate Fund 33.35%
Merian Asian Equity Income Fund Fundsettle EOC Nominees Ltd 64.53%
Jupiter UK Smaller Companies Focus Fund Minster Nominees Ltd 28.04%
Jupiter UK Dynamic Equity Fund Minster Nominees Ltd 28.65%
Jupiter Merian Global Equity Absolute Return Fund Fundsettle EOC Nominees Ltd 30.44%
Jupiter Strategic Absolute Return Bond Fund Fundsettle EOC Nominees Ltd - Cirilium Balanced Fund 64.77%
Jupiter Europe (ex UK) Smaller Companies Fund Winterflood Client Nominees Ltd 53.28%
Jupiter UK Specialist Equity Fund Fundsettle EOC Nominees Ltd 23.73%
As at 31 December 2019, the following investors held greater than 20% of the Shares of the specific Sub-Funds of the Company listed below:
Sub-Fund Investor % Holding
Merian China Equity Fund Caceis Bank Luxembourg Branch 22.38%
Merian European Equity Fund Tokio Marine & Nichido Financial Life Insurance Co 57.75%
Merian US Equity Income Fund Clearstream Banking S.A. 70.26%
Merian Asian Equity Income Fund Fundsettle EOC Nominees Ltd - Cirilium Balanced Fund 27.25%
Fundsettle EOC Nominees Ltd - Cirilium Moderate Fund 26.69%
Merian UK Alpha Fund (IRL) Clearstream Banking S.A. 27.17%
Merian UK Smaller Companies Focus Fund Clearstream Banking S.A. 25.71%
Merian Global Equity Absolute Return Fund Clearstream Banking S.A. 28.62%
Merian Strategic Absolute Return Bond Fund Fundsettle EOC Nominees Ltd - Cirilium Balanced Fund 59.73%
Fundsettle EOC Nominees Ltd - Cirilium Conservative Fund 31.15%
Merian Europe (ex UK) Smaller Companies Fund FNZ (UK) Nominees Ltd 20.69%
Merian UK Specialist Equity Fund Fundsettle EOC Nominees Ltd 22.10%

Jupiter Asset Management Series Plc Annual Report and Audited Financial Statements for the financial year ended 31 December 2020
Notes to the Financial Statements for the financial year ended 31 December 2020 (continued)
205
5. Related Parties (continued) In-specie During the financial year ended 31 December 2020, there were no in-specie transfers. During the financial year ended 31 December 2019, the following in-specie transactions took place: 30 August 2019: - The assets of Merian European Best Ideas Fund^^ were transferred into corresponding Share Classes in Merian European Equity Fund through an in-specie transaction of EUR 13,989,372. Ex-specie During the financial year ended 31 December 2020, the following ex-specie transactions took place: 25 November 2020: - Jupiter UK Dynamic Equity Fund transferred securities to 2 funds in Northern Trust for an amount of GBP 61,584,946 and transferred cash to 2 funds in Northern Trust for an amount of GBP 1,060,730. 2 December 2020: - Jupiter UK Smaller Companies Focus Fund transferred securities to 2 funds in Northern Trust for an amount of GBP 77,695,498 and transferred cash to 2 funds in Northern Trust for an amount of GBP 1,522,391. During the financial year ended 31 December 2019, the following ex-specie transactions took place: 7 June 2019: - Merian Compass Portfolio 2^ transferred securities to Quilter Investors Compass Portfolio 2 for an amount of USD 19,492,114, Merian Compass Portfolio 3^ transferred securities to Quilter Investors Compass Portfolio 3 for an amount of USD 245,054,663, Merian Compass Portfolio 4^ transferred securities to Quilter Investors Compass Portfolio 4 for an amount of USD 400,189,964 and Merian Compass Portfolio 5^ transferred securities to Quilter Investors Compass Portfolio 5 for an amount of USD 51,960,984.
Investments in related entities For the purposes of producing the combined Company financial statements, the value of investments in related entities and the gains and losses arising at Sub-Fund level from investments in related entities during the financial year must be eliminated in order to prevent double counting. The value of Cross Investments eliminated on combination is USD 21,836,760 (31 December 2019: USD 16,583,475) on the Statement of Financial Position and USD 1,028,438 (31 December 2019: USD 8,157,523) on the Statement of Operations.

Jupiter Asset Management Series Plc Annual Report and Audited Financial Statements for the financial year ended 31 December 2020
Notes to the Financial Statements for the financial year ended 31 December 2020 (continued)
206
5. Related Parties (continued)
Investments in related entities (continued)
In the ordinary course of business, the Sub-Funds may execute purchases and sales transactions with other related parties, some of whom were managed by the Investment Manager and Investment Advisers. All such transactions are carried out on normal commercial terms, negotiated at arm’s length and in the best interest of the Shareholders. During the financial year ended 31 December 2020, purchases transactions amounted to USD Nil and sales transactions amounted to USD 142,002 relating to Jupiter Fund Management Plc . Please refer to pages 207 and 208 for details on transactions during the financial year ended 31 December 2019. Additionally there were purchases and sales of transferable securities during the financial year under review which are deemed to be related party transactions. During the year ended 31 December 2020, related party purchases of transferable securities amounted to USD Nil and related party sales transactions amounted to USD 99,151,479. Cross Investments
Investing Sub-Fund Sub-Fund Share Class Investing Sub-Fund Currency
Cost of Investment
31 December 2020
Market Value
31 December 2020
Purchases Sales
Net realised and movement
in unrealised gain/(loss)
Merian Global Dynamic Bond Fund
Jupiter Asset Management Series Plc - Jupiter Emerging Market Debt Fund (UCITS) I (USD) USD 3,967,884 4,187,625 5,204,115 1,414,791 241,937
Jupiter Asset Management Series Plc - Jupiter Local Currency Emerging Market Debt Fund (UCITS) I (USD) USD 3,624,814 4,017,452 6,547,174 2,704,728 175,006
Jupiter Asset Management Series Plc - Jupiter Financials Contingent Capital Fund (UCITS) F (USD) Income USD 5,775,223 6,227,297 4,355,237 6,803,246 383,244
Jupiter Strategic Absolute Return Bond Fund
Jupiter Asset Management Series Plc - Jupiter Emerging Market Debt Fund (UCITS) I (USD) USD 1,792,337 1,953,674 5,603,316 4,082,504 244,546
Jupiter Asset Management Series Plc - Jupiter Local Currency Emerging Market Debt Fund (UCITS) I (USD) USD 1,947,081 2,091,311 7,542,008 5,323,031 (127,666)
Jupiter Asset Management Series Plc - Jupiter Financials Contingent Capital Fund (UCITS) F (USD) Income USD 3,150,694 3,359,401 2,314,072 7,012,775 111,371
*All of the above transactions are carried out on normal commercial terms, negotiated at arm’s length and in the best interest of the Shareholders.

Jupiter Asset Management Series Plc Annual Report and Audited Financial Statements for the financial year ended 31 December 2020
Notes to the Financial Statements for the financial year ended 31 December 2020 (continued)
207
5. Related Parties (continued)
Investments in related entities (continued)
During the financial year ended 31 December 2019 the below Sub-Funds, in the ordinary course of business, executed purchases and sales transactions with other related parties, some of whom were managed by the Investment Manager and Investment Advisers. All transactions were carried out on normal commercial terms, negotiated at arm’s length and in the best interest of the Shareholders. Details of holdings at 31 December 2019 are outlined below.
Sub-Fund with investment in related party
Related party Share Class Investing Sub-Fund Currency
Number of shares held at 31 December 2019
Market Value 31
December 2019 Purchases Sales
Merian Compass Portfolio 2^
Merian Investment Funds Series I - Merian UK Equity Income Fund (UCITS) U2 (GBP) Income USD - - - 15,824
Quilter Investors Bond 1 Fund (UCITS) A (GBP) Income USD - - - 887,251
Quilter Investors Bond 2 Fund (UCITS) A (GBP) USD - - 21,371 1,118,462
Quilter Investors Bond 3 Fund (UCITS) A (GBP) Income USD - - - 711,122
Quilter Investors Emerging Markets Equity Growth Fund (UCITS) U2 (GBP) USD - - 664 150,807
Quilter Investors Equity 1 Fund (UCITS) A (GBP) USD - - 17 5,909
Quilter Investors Europe ex UK Equity Fund (UCITS) U2 (GBP) Income USD - - 354 37,354
Quilter Investors Europe ex UK Equity Income Fund (UCITS) U2 (GBP) USD - - 52,446 53,579
Quilter Investors Global Best Ideas Fund (UCITS) A (GBP) USD - - - 500,152
Quilter Investors Global Dynamic Equity Fund (UCITS) A (GBP) USD - - - 2,729,825
Quilter Investors High Yield Bond Fund (UCITS) A (GBP) Income USD - - - 540,661
Quilter Investors Japanese Equity Fund (UCITS) A (GBP) USD - - - 35,910
Quilter Investors US Equity Growth Fund (UCITS) U2 (GBP) USD - - - 126,531
Merian Compass Portfolio 3^
Merian Investment Funds Series I - Merian UK Equity Income Fund (UCITS) U2 (GBP) Income USD - - - 195,238
Quilter Investors Bond 1 Fund (UCITS) A (GBP) Income USD - - - 5,709,527
Quilter Investors Bond 2 Fund (UCITS) A (GBP) USD - - 631,369 7,682,861
Quilter Investors Bond 3 Fund (UCITS) A (GBP) Income USD - - - 4,489,950
Quilter Investors Emerging Markets Equity Growth Fund (UCITS) U2 (GBP) USD - - 12,642 2,871,054
Quilter Investors Equity 1 Fund (UCITS) A (GBP) USD - - 39 13,990
Quilter Investors Europe ex UK Equity Fund (UCITS) U2 (GBP) Income USD - - 16,029 1,726,904
Quilter Investors Europe ex UK Equity Income Fund (UCITS) U2 (GBP) USD - - 1,243,645 1,734,082
Quilter Investors Global Best Ideas Fund (UCITS) A (GBP) USD - - - 7,807,687
Quilter Investors Global Dynamic Equity Fund (UCITS) A (GBP) USD - - - 48,225,166

Jupiter Asset Management Series Plc Annual Report and Audited Financial Statements for the financial year ended 31 December 2020
Notes to the Financial Statements for the financial year ended 31 December 2020 (continued)
208
5. Related Parties (continued)
Investments in related entities (continued)
Sub-Fund with investment in related party
Related party Share Class Investing Sub-Fund Currency
Number of shares held at 31 December 2019
Market Value 31
December 2019 Purchases Sales
Merian Compass Portfolio 3^ (continued)
Quilter Investors High Yield Bond Fund (UCITS) A (GBP) Income USD - - - 3,630,651
Quilter Investors Japanese Equity Fund (UCITS) A (GBP) USD - - - 457,594
Quilter Investors US Equity Growth Fund (UCITS) U2 (GBP) USD - - 2,485,795 3,781,272
Merian Compass Portfolio 4^
Merian Investment Funds Series I - Merian UK Equity Income Fund (UCITS) U2 (GBP) Income USD - - - 499,600
Quilter Investors Bond 1 Fund (UCITS) A (GBP) Income USD - - - 4,121,148
Quilter Investors Bond 2 Fund (UCITS) A (GBP) USD - - 80,142 4,927,742
Quilter Investors Bond 3 Fund (UCITS) A (GBP) Income USD - - - 3,199,477
Quilter Investors Emerging Markets Equity Growth Fund (UCITS) U2 (GBP) USD - - 1,750,827 8,545,863
Quilter Investors Equity 1 Fund (UCITS) A (GBP) USD - - 82 29,099
Quilter Investors Europe ex UK Equity Fund (UCITS) U2 (GBP) Income USD - - 37,573 3,804,875
Quilter Investors Europe ex UK Equity Income Fund (UCITS) U2 (GBP) USD - - 3,637,593 3,670,620
Quilter Investors Global Best Ideas Fund (UCITS) A (GBP) USD - - - 17,935,675
Quilter Investors Global Dynamic Equity Fund (UCITS) A (GBP) USD - - - 78,321,826
Quilter Investors High Yield Bond Fund (UCITS) A (GBP) Income USD - - - 2,790,570
Quilter Investors Japanese Equity Fund (UCITS) A (GBP) USD - - - 789,943
Quilter Investors US Equity Growth Fund (UCITS) U2 (GBP) USD - - 2,581,652 8,320,505
Merian Compass Portfolio 5^
Merian Investment Funds Series I - Merian UK Equity Income Fund (UCITS) U2 (GBP) Income USD - - - 29,288
Quilter Investors Emerging Markets Equity Growth Fund (UCITS) U2 (GBP) USD - - 287,598 1,933,151
Quilter Investors Equity 1 Fund (UCITS) A (GBP) USD - - 18 6,464
Quilter Investors Europe ex UK Equity Fund (UCITS) U2 (GBP) Income USD - - 4,397 453,113
Quilter Investors Europe ex UK Equity Income Fund (UCITS) U2 (GBP) USD - - 206,254 214,113
Quilter Investors Global Best Ideas Fund (UCITS) A (GBP) USD - - - 2,859,581
Quilter Investors Global Dynamic Equity Fund (UCITS) A (GBP) USD - - - 11,029,899
Quilter Investors Japanese Equity Fund (UCITS) A (GBP) USD - - - 56,623
Quilter Investors US Equity Growth Fund (UCITS) U2 (GBP) USD - - 637,408 3,477,424

Jupiter Asset Management Series Plc Annual Report and Audited Financial Statements for the financial year ended 31 December 2020
Notes to the Financial Statements for the financial year ended 31 December 2020 (continued)
209
5. Related Parties (continued)
Investments in related entities (continued) Additionally there were purchases and sales of transferable securities during the financial year 1 January 2019 to 31 December 2019 which are deemed to be related party transactions. Such purchases amounted to USD 13,161,409 and sales amounted to USD 41,760,750. These are not included in the table above.
Cross Investments
Investing Sub-Fund Sub-Fund Share Class Investing Sub-Fund Currency
Cost of Investment
31 December 2019
Market Value
31 December 2019
Purchases Sales
Net realised and movement in
unrealised gain/(loss)
Merian Global Strategic Bond Fund (IRL)*
Merian Global Investors Series Plc - Merian Financials Contingent Capital Fund (UCITS) F (USD) Income USD - - 10,903 535,181 27,338
Merian Global Dynamic Bond Fund**
Merian Global Investors Series PLC - Merian Emerging Market Debt Fund (UCITS)
I (USD) Accumulation USD 155,562 156,364 155,562 - 802
Merian Global Investors Series Plc - Merian Financials Contingent Capital Fund (UCITS) F (USD) Income USD 7,718,891 8,292,062 11,187,342 3,535,059 639,780
Merian Investment Grade Corporate Bond Fund****
Merian Global Investors Series Plc - Merian Financials Contingent Capital Fund (UCITS)
F (USD) Income USD - - 107,032 536,459 47,285
Merian Strategic Absolute Return Bond Fund
Merian Global Investors Series PLC - Merian Emerging Market Debt Fund (UCITS)
I (USD) Accumulation USD 187,350 188,316 187,350 - 966
Merian Global Investors Series Plc - Merian Financials Contingent Capital Fund (UCITS) F (USD) Income USD 7,370,814 7,946,733 7,344,046 11,752,432 1,298,783
Merian Compass Portfolio 2^ Merian Global Investors Series Plc - Merian Asian Equity Income Fund (UCITS) A (GBP) USD - - - 102,043 10,513
Merian Global Investors Series Plc - Merian Europe (ex UK) Smaller Companies Fund (UCITS) U2 (GBP) USD - - 38,559 71,073 4,224
Merian Global Investors Series Plc - Merian Financials Contingent Capital Fund (UCITS) I (USD) Income USD - - - 370,286 17,473
Merian Global Investors Series Plc - Merian Global Emerging Markets Fund (UCITS) U2 (GBP) USD - - - 71,096 5,992
Merian Global Investors Series Plc - Merian Global Equity Income Fund (IRL) (UCITS) R (GBP) Income USD - - - 714,866 45,862
Merian Global Investors Series Plc - Merian Local Currency Emerging Market Debt Fund (UCITS) U2 (GBP) Income USD - - - 137,531 (1,029)

Jupiter Asset Management Series Plc Annual Report and Audited Financial Statements for the financial year ended 31 December 2020
Notes to the Financial Statements for the financial year ended 31 December 2020 (continued)
210
5. Related Parties (continued)
Cross Investments (continued)
Investing Sub-Fund Sub-Fund Share Class Investing Sub-Fund Currency
Cost of Investment
31 December 2019
Market Value
31 December 2019
Purchases Sales
Net realised and movement
in unrealised gain/(loss)
Merian Compass Portfolio 2^ (continued)
Merian Global Investors Series Plc - Merian Style Premia Absolute Return Fund (UCITS) F (USD) USD - - - 321,187 (10,729)
Merian Global Investors Series Plc - Merian UK Specialist Equity Fund (UCITS) F (GBP) USD - - - 301,596 22,246
Merian Global Investors Series Plc - Merian UK Specialist Equity Fund (UCITS) R (GBP) USD - - - 207,163 11,396
Merian Global Investors Series Plc - Merian European Best Ideas Fund (UCITS) U2 (GBP) USD - - - 99,257 9,352
Merian Compass Portfolio 3^
Merian Global Investors Series Plc - Merian Asian Equity Income Fund (UCITS) A (GBP) USD - - - 2,971,464 286,549
Merian Global Investors Series Plc - Merian Europe (ex UK) Smaller Companies Fund (UCITS) U2 (GBP) USD - - - 1,526,931 185,453
Merian Global Investors Series Plc - Merian Financials Contingent Capital Fund (UCITS) I (USD) Income USD - - - 1,008,766 51,680
Merian Global Investors Series Plc - Merian Global Emerging Markets Fund (UCITS) U2 (GBP) USD - - - 2,048,749 172,674
Merian Global Investors Series Plc - Merian Global Equity Income Fund (IRL) (UCITS) R (GBP) Income USD - - - 6,069,721 414,697
Merian Global Investors Series Plc - Merian Local Currency Emerging Market Debt Fund (UCITS) U2 (GBP) Income USD - - - 941,376 (5,935)
Merian Global Investors Series Plc - Merian Style Premia Absolute Return Fund (UCITS) F (USD) USD - - - 2,256,131 (119,052)
Merian Global Investors Series Plc - Merian UK Specialist Equity Fund (UCITS) F (GBP) USD - - - 2,242,384 165,403
Merian Global Investors Series Plc - Merian UK Specialist Equity Fund (UCITS) R (GBP) USD - - - 1,399,906 101,882
Merian Global Investors Series Plc - Merian European Best Ideas Fund (UCITS) U2 (GBP) USD - - - 1,893,876 189,584
Merian Compass Portfolio 4^ Merian Global Investors Series Plc - Merian Asian Equity Income Fund (UCITS) A (GBP) USD - - - 11,683,338 1,203,488

Jupiter Asset Management Series Plc Annual Report and Audited Financial Statements for the financial year ended 31 December 2020
Notes to the Financial Statements for the financial year ended 31 December 2020 (continued)
211
5. Related Parties (continued)
Cross Investments (continued)
Investing Sub-Fund Sub-Fund Share Class Investing Sub-Fund Currency
Cost of Investment
31 December 2019
Market Value
31 December 2019
Purchases Sales
Net realised and movement
in unrealised gain/(loss)
Merian Compass Portfolio 4^ (continued)
Merian Global Investors Series Plc - Merian Europe (ex UK) Smaller Companies Fund (UCITS) U2 (GBP) USD - - 1,036,230 4,649,071 346,653
Merian Global Investors Series Plc - Merian Financials Contingent Capital Fund (UCITS) I (USD) Income USD - - - 2,518,000 131,370
Merian Global Investors Series Plc - Merian Global Emerging Markets Fund (UCITS) U2 (GBP) USD - - - 4,384,437 369,531
Merian Global Investors Series Plc - Merian Global Equity Income Fund (IRL) (UCITS) R (GBP) Income USD - - - 14,946,950 1,013,761
Merian Global Investors Series Plc - Merian Local Currency Emerging Market Debt Fund (UCITS) U2 (GBP) Income USD - - - 699,344 (2,713)
Merian Global Investors Series Plc - Merian Style Premia Absolute Return Fund (UCITS) F (USD) USD - - - 2,411,288 (144,397)
Merian Global Investors Series Plc - Merian UK Specialist Equity Fund (UCITS) F (GBP) USD - - - 2,069,579 145,126
Merian Global Investors Series Plc - Merian UK Specialist Equity Fund (UCITS) R (GBP) USD - - - 1,810,319 131,750
Merian Global Investors Series Plc - Merian European Best Ideas Fund (UCITS) U2 (GBP) USD - - - 6,697,757 670,471
Merian Compass Portfolio 5^
Merian Global Investors Series Plc - Merian Asian Equity Income Fund (UCITS) A (GBP) USD - - - 1,332,000 137,210
Merian Global Investors Series Plc - Merian Europe (ex UK) Smaller Companies Fund (UCITS) U2 (GBP) USD - - - 574,980 69,810
Merian Global Investors Series Plc - Merian Global Emerging Markets Fund (UCITS) U2 (GBP) USD - - - 1,556,037 143,626
Merian Global Investors Series Plc - Merian Global Equity Income Fund (IRL) (UCITS) R (GBP) Income USD - - 325,885 2,816,760 157,818
Merian Global Investors Series Plc - Merian European Best Ideas Fund (UCITS) U2 (GBP) USD - - - 1,989,150 210,830
*All of the above transactions are carried out on normal commercial terms, negotiated at arm’s length and in the best interest of the Shareholders.

Jupiter Asset Management Series Plc Annual Report and Audited Financial Statements for the financial year ended 31 December 2020
Notes to the Financial Statements for the financial year ended 31 December 2020 (continued)
212
6. Share Capital
Subscriber Shares The authorised share capital of the Company is EUR 38,082 represented by 30,000 Subscriber Shares of no par value and 500,000,000,000 redeemable participating shares of no par value. The Company has repurchased all but one of the Subscriber Shares, held by Jupiter Asset Management (Europe) Limited, the Management Company. The Subscriber Shares entitle the Shareholders holding them to attend and vote at all meetings of the Company. The Subscriber Shares entitles the Shareholder to participate equally on a pro rata basis in the dividends and net assets of the Company, this entitlement shall be limited to the amount subscribed and any accrued income thereon. Redeemable Participating Shares The creation of the various share classes is intended to offer greater flexibility to both retail and institutional clients. Each share class may also be distinguished by the Management Fee, initial charge, contingent deferred sales charge and redemption charges applicable and the minimum subscription requirements. Each share class in each Sub-Fund has equal voting, distribution and liquidation rights in proportion to the number of the Shares held in that Sub-Fund. The net assets attributable to holders of redeemable participating shares are at all times equal to the Net Asset Value of the Company. The redeemable participating shares can be redeemed at the option of the Shareholder. Redeemable participating shares may be redeemed on each dealing date or such other date or dates as the Board of Directors shall from time to time determine (Valuation Day) at the Net Asset Value per Share. Capital Management The Company is an externally managed UCITS. The Manager is subject to externally imposed minimum capital requirements by the CBI. The Company considers redeemable participating shares as capital. Redeemable participating shares issued by each Sub-Fund provide a shareholder with the right to request redemption of their shares for cash, at a value proportionate to the total value of all redeemable participating shares, in a Sub-Fund at each redemption date and are classified as liabilities. The Company's objective in managing redeemable participating shares is to ensure a stable base to maximise returns to shareholders and to manage liquidity risk arising from redemptions.

Jupiter Asset Management Series Plc Annual Report and Audited Financial Statements for the financial year ended 31 December 2020
Notes to the Financial Statements for the financial year ended 31 December 2020 (continued)
213
6. Share Capital (continued)
Share Movement All share classes are accumulation unless otherwise stated.
Jupiter China Equity Fund Share Class
Class A (USD) Class B (USD) Class C (USD) Class C2 (USD) Class I (USD) Class S (GBP) Class U1 (GBP)
Shares in issue at 1 January 2019 782,287 257,542 153,253 260,642 500,000 29,946 33,385 Subscriptions during the financial year 268,588 182,117 296 234,385 300,210 3,205 29,132 Redemptions during the financial year (334,352) (213,873) (28,784) (368,528) (362,704) (8,841) (21,294)
Shares in issue at 31 December 2019 716,523 225,786 124,765 126,499 437,506 24,310 41,223
USD USD USD USD USD USD USD Value of Shares issued during 2019 14,326,775 4,730,649 6,909 3,224,101 3,115,693 85,908 591,365 Value of Shares redeemed during 2019 (18,145,769) (5,595,857) (681,633) (4,897,623) (4,026,795) (241,279) (434,148)
Net Value of Shares issued/redeemed during 2019 (3,818,994) (865,208) (674,724) (1,673,522) (911,102) (155,371) 157,217
Shares in issue at 1 January 2020 716,523 225,786 124,765 126,499 437,506 24,310 41,223 Subscriptions during the financial year 197,674 252,262 128 435,229 9,000 11,474 24,345 Redemptions during the financial year (339,295) (358,068) (30,583) (531,289) (384,766) (11,566) (18,651)
Shares in issue at 31 December 2020 574,902 119,980 94,310 30,439 61,740 24,218 46,917
USD USD USD USD USD USD USD Value of Shares issued during the financial year 12,427,113 7,810,281 2,676 7,131,168 116,035 380,614 555,627 Value of Shares redeemed during the financial year (21,079,641) (10,707,827) (824,417) (8,706,573) (4,309,296) (364,111) (407,964)
Net Value of Shares issued/redeemed during the financial year (8,652,528) (2,897,546) (821,741) (1,575,405) (4,193,261) 16,503 147,663
Net Assets as at 31 December 2020 USD 43,392,621 USD 4,283,392 USD 3,059,414 USD 554,799 USD 938,353 GBP 683,950 GBP 976,848 Net Assets as at 31 December 2019 USD 41,156,695 USD 6,201,906 USD 3,126,729 USD 1,777,498 USD 5,020,201 GBP 537,101 GBP 669,663 Net Assets as at 31 December 2018 USD 38,058,745 USD 6,053,452 USD 3,301,599 USD 3,134,982 USD 4,818,566 GBP 576,738 GBP 471,913

Jupiter Asset Management Series Plc Annual Report and Audited Financial Statements for the financial year ended 31 December 2020
Notes to the Financial Statements for the financial year ended 31 December 2020 (continued)
214
6. Share Capital (continued) Share Movement (continued)
Merian Global Strategic Bond Fund (IRL)* Share Class
Class A (EUR) Hedged
Class A (GBP) Income
Class A (USD)
Class A (USD) Income
Class B (USD)
Class B (USD) Income
Class C (USD)
Class S (GBP) Income
Shares in issue at 1 January 2019 8,597 109,983 1,863,135 15,925 8,568 26,035 75,251 24,009 Subscriptions during the financial year - 4,040 780 - - - - 17 Redemptions during the financial year (8,597) (114,023) (1,863,915) (15,925) (8,568) (26,035) (75,251) (24,026)
Shares in issue at 31 December 2019 - - - - - - - -
USD USD USD USD USD USD USD USD Value of Shares issued during 2019 - 48,622 1,419 - - - - 218 Value of Shares redeemed during 2019 (97,184) (1,381,703) (3,404,045) (121,327) (108,541) (191,360) (968,724) (302,516)
Net Value of Shares issued/redeemed during 2019 (97,184) (1,333,081) (3,402,626) (121,327) (108,541) (191,360) (968,724) (302,298)
Net Assets as at 31 December 2019 EUR - GBP - USD - USD - USD - USD - USD - GBP - Net Assets as at 31 December 2018 EUR 86,815 GBP 1,039,601 USD 3,348,000 USD 120,149 USD 107,114 USD 190,413 USD 956,710 GBP 235,885
Merian Global Strategic Bond Fund (IRL)* Share Class
Class U1 (GBP) Income
Shares in issue at 1 January 2019 71,554 Subscriptions during the financial year 1,223 Redemptions during the financial year (72,777)
Shares in issue at 31 December 2019 -
USD Value of Shares issued during 2019 17,041 Value of Shares redeemed during 2019 (1,012,124)
Net Value of Shares issued/redeemed during 2019 (995,083)
Net Assets as at 31 December 2019 GBP - Net Assets as at 31 December 2018 GBP 774,703
*The Fund closed in 2019 and there was no units held in 2020.

Jupiter Asset Management Series Plc Annual Report and Audited Financial Statements for the financial year ended 31 December 2020
Notes to the Financial Statements for the financial year ended 31 December 2020 (continued)
215
6. Share Capital (continued)
Share Movement (continued)
Jupiter Merian World Equity Fund Share Class
Class A (EUR)
Class A (EUR) Hedged
Class A (USD)
Class B (USD)
Class C (USD)
Class C2 (USD)
Class I (EUR)
Class I (USD)
Shares in issue at 1 January 2019 1,174,640 513,619 129,080,961 39,671 815,032 51,846 2,810,489 6,246,785 Subscriptions during the financial year 120,434 58,332 100,789,478 12,989 51,168 7,319 2,450,640 5,266,031 Redemptions during the financial year (1,017,827) (380,134) (164,468,555) (21,576) (407,771) (25,346) (1,171,750) (5,569,564)
Shares in issue at 31 December 2019 277,247 191,817 65,401,884 31,084 458,429 33,819 4,089,379 5,943,252
USD USD USD USD USD USD USD USD Value of Shares issued during 2019 1,831,020 780,509 164,023,057 301,244 1,129,550 87,991 40,856,668 90,846,998 Value of Shares redeemed during 2019 (15,471,940) (5,139,333) (267,728,638) (488,117) (9,173,604) (304,230) (18,948,854) (96,321,280)
Net Value of Shares issued/redeemed during 2019 (13,640,920) (4,358,824) (103,705,581) (186,873) (8,044,054) (216,239) 21,907,814 (5,474,282)
Shares in issue at 1 January 2020 277,247 191,817 65,401,884 31,084 458,429 33,819 4,089,379 5,943,252 Subscriptions during the financial year 2,003 - 47,715,943 32,661 1,263 114,058 617,276 892,116 Redemptions during the financial year (171,818) (135,079) (60,913,495) (47,523) (169,328) (145,411) (4,023,217) (3,134,398)
Shares in issue at 31 December 2020 107,432 56,738 52,204,332 16,222 290,364 2,466 683,438 3,700,970
USD USD USD USD USD USD USD USD Value of Shares issued during the financial year 33,403 - 81,249,735 772,227 24,793 1,334,197 9,575,860 15,724,560 Value of Shares redeemed during the financial year (2,451,933) (1,923,184) (101,149,885) (1,121,306) (3,724,579) (1,776,326) (65,096,241) (55,625,956)
Net Value of Shares issued/redeemed during the financial year (2,418,530) (1,923,184) (19,900,150) (349,079) (3,699,786) (442,129) (55,520,381) (39,901,396)
Net Assets as at 31 December 2020 EUR 1,656,288 EUR 810,053 USD 106,013,271 USD 456,751 USD 7,860,144 USD 35,909 EUR 11,447,423 USD 80,653,955 Net Assets as at 31 December 2019 EUR 4,055,476 EUR 2,429,010 USD 115,294,190 USD 768,302 USD 10,938,154 USD 432,295 EUR 64,504,751 USD 111,585,765 Net Assets as at 31 December 2018 EUR 13,984,101 EUR 5,569,939 USD 188,896,314 USD 823,902 USD 16,390,728 USD 556,680 EUR 35,808,291 USD 96,631,695

Jupiter Asset Management Series Plc Annual Report and Audited Financial Statements for the financial year ended 31 December 2020
Notes to the Financial Statements for the financial year ended 31 December 2020 (continued)
216
6. Share Capital (continued) Share Movement (continued)
Jupiter Merian World Equity Fund (continued) Share Class
Class S (GBP) Class U1 (GBP)
Shares in issue at 1 January 2019 28,202 213,559 Subscriptions during the financial year 22,137 58,638 Redemptions during the financial year (6,679) (78,042)
Shares in issue at 31 December 2019 43,660 194,155
USD USD Value of Shares issued during 2019 709,985 1,258,835 Value of Shares redeemed during 2019 (213,935) (1,658,350)
Net Value of Shares issued/redeemed during 2019 496,050 (399,515)
Shares in issue at 1 January 2020 43,660 194,155 Subscriptions during the financial year 89 15,154 Redemptions during the financial year (24,956) (61,382)
Shares in issue at 31 December 2020 18,793 147,927
USD USD Value of Shares issued during the financial year 3,449 342,256 Value of Shares redeemed during the financial year (867,616) (1,360,352)
Net Value of Shares issued/redeemed during the financial year (864,167) (1,018,096)
Net Assets as at 31 December 2020 GBP 554,492 GBP 2,887,310 Net Assets as at 31 December 2019 GBP 1,149,789 GBP 3,372,153 Net Assets as at 31 December 2018 GBP 634,725 GBP 3,160,712

Jupiter Asset Management Series Plc Annual Report and Audited Financial Statements for the financial year ended 31 December 2020
Notes to the Financial Statements for the financial year ended 31 December 2020 (continued)
217
6. Share Capital (continued)
Share Movement (continued) Jupiter Pacific Equity Fund Share Class
Class A (EUR) Class A (USD) Class B (USD) Class C (USD) Class C2 (USD) Class I (USD) Class R (GBP) Class S (GBP)
Shares in issue at 1 January 2019 76,471 20,321,382 109,454 169,390 429,681 113,331 25,521 11,903 Subscriptions during the financial year 13,284 6,651,288 65,305 644 1,648,609 197,981 2,475 5,608 Redemptions during the financial year (26,716) (9,017,764) (92,726) (43,390) (1,792,984) (105,984) (10,400) (4,806)
Shares in issue at 31 December 2019 63,039 17,954,906 82,033 126,644 285,306 205,328 17,596 12,705
USD USD USD USD USD USD USD USD Value of Shares issued during 2019 534,474 24,528,423 2,455,001 22,831 17,466,770 2,402,079 49,453 137,561 Value of Shares redeemed during 2019 (1,093,752) (33,088,775) (3,479,501) (1,563,892) (19,135,749) (1,257,750) (204,429) (112,737)
Net Value of Shares issued/redeemed during 2019 (559,278) (8,560,352) (1,024,500) (1,541,061) (1,668,979) 1,144,329 (154,976) 24,824
Shares in issue at 1 January 2020 63,039 17,954,906 82,033 126,644 285,306 205,328 17,596 12,705 Subscriptions during the financial year 2,428 3,824,375 5,836 779 952,451 126,511 4,285 1,519 Redemptions during the financial year (19,955) (9,964,958) (59,268) (34,984) (1,236,871) (276,685) (11,829) (5,545)
Shares in issue at 31 December 2020 45,512 11,814,323 28,601 92,439 886 55,154 10,052 8,679
USD USD USD USD USD USD USD USD Value of Shares issued during the financial year 104,625 14,799,099 234,347 24,603 9,972,198 1,475,473 91,372 47,503 Value of Shares redeemed during the financial year (839,129) (39,979,051) (2,350,882) (1,254,844) (12,053,771) (3,852,289) (245,221) (129,557)
Net Value of Shares issued/redeemed during the financial year (734,504) (25,179,952) (2,116,535) (1,230,241) (2,081,573) (2,376,816) (153,849) (82,054)
Net Assets as at 31 December 2020 EUR 2,014,939 USD 58,910,131 USD 1,411,457 USD 4,363,875 USD 12,449 USD 912,135 GBP 197,393 GBP 206,922 Net Assets as at 31 December 2019 EUR 2,413,468 USD 70,823,310 USD 3,240,024 USD 4,804,483 USD 3,234,463 USD 2,666,325 GBP 280,323 GBP 246,349 Net Assets as at 31 December 2018 EUR 2,471,753 USD 69,022,452 USD 3,765,526 USD 5,619,890 USD 4,241,838 USD 1,257,876 GBP 359,490 GBP 204,616

Jupiter Asset Management Series Plc Annual Report and Audited Financial Statements for the financial year ended 31 December 2020
Notes to the Financial Statements for the financial year ended 31 December 2020 (continued)
218
6. Share Capital (continued) Share Movement (continued)
Jupiter Pacific Equity Fund (continued) Share Class
Class U1 (GBP)
Shares in issue at 1 January 2019 57,399 Subscriptions during the financial year 1,401 Redemptions during the financial year (10,330)
Shares in issue at 31 December 2019 48,470
USD Value of Shares issued during 2019 23,759 Value of Shares redeemed during 2019 (170,605)
Net Value of Shares issued/redeemed during 2019 (146,846)
Shares in issue at 1 January 2020 48,470 Subscriptions during the financial year 538 Redemptions during the financial year (10,213)
Shares in issue at 31 December 2020 38,795
USD Value of Shares issued during the financial year 10,144 Value of Shares redeemed during the financial year (183,993)
Net Value of Shares issued/redeemed during the financial year (173,849)
Net Assets as at 31 December 2020 GBP 641,942 Net Assets as at 31 December 2019 GBP 650,147 Net Assets as at 31 December 2018 GBP 680,233

Jupiter Asset Management Series Plc Annual Report and Audited Financial Statements for the financial year ended 31 December 2020
Notes to the Financial Statements for the financial year ended 31 December 2020 (continued)
219
6. Share Capital (continued)
Share Movement (continued) Merian European Equity Fund Share Class
Class A (EUR)
Class A (GBP) Class A (USD) Hedged
Class A (USD) Class B (USD)
Class C (USD)
Class I (EUR)
Class R (GBP)
Shares in issue at 1 January 2019 29,284,048 - - 181,657 54,435 98,899 - - Subscriptions during the financial year 16,738,522 128,527 21,844 222,810 8,724 109,120 12,501 78,431 Redemptions during the financial year (4,219,603) (81,076) - (95,912) (31,120) (75,626) - (4,242)
Shares in issue at 31 December 2019 41,802,967 47,451 21,844 308,555 32,039 132,393 12,501 74,189
EUR EUR EUR EUR EUR EUR EUR EUR Value of Shares issued during 2019 14,349,799 1,418,537 197,835 3,515,325 117,868 1,387,507 125,014 909,650 Value of Shares redeemed during 2019 (3,713,008) (928,217) - (1,545,142) (415,522) (966,712) - (49,666)
Net Value of Shares issued/redeemed during 2019 10,636,791 490,320 197,835 1,970,183 (297,654) 420,795 125,014 859,984
Shares in issue at 1 January 2020 41,802,967 47,451 21,844 308,555 32,039 132,393 12,501 74,189 Subscriptions during the financial year 4,189,244 27 - 88,899 101,728 1,556 291,257 902 Redemptions during the financial year (11,299,306) (10,660) (21,844) (168,451) (110,358) (46,353) (24,925) (31,062)
Shares in issue at 31 December 2020 34,692,905 36,818 - 229,003 23,409 87,596 278,833 44,029
EUR EUR EUR EUR EUR EUR EUR EUR Value of Shares issued during the financial year 3,483,737 321 - 1,416,853 1,304,760 16,553 2,904,529 9,774 Value of Shares redeemed during the financial year (9,479,485) (121,619) (183,335) (2,564,764) (1,444,345) (559,009) (259,994) (344,091)
Net Value of Shares issued/redeemed during the financial year (5,995,748) (121,298) (183,335) (1,147,911) (139,585) (542,456) 2,644,535 (334,317)
Net Assets as at 31 December 2020 EUR 32,179,746 GBP 394,966 USD - USD 4,777,570 USD 401,167 USD 1,442,784 EUR 3,047,031 GBP 483,098 Net Assets as at 31 December 2019 EUR 39,199,781 GBP 486,862 USD 241,042 USD 5,953,221 USD 513,478 USD 2,056,631 EUR 137,169 GBP 772,307 Net Assets as at 31 December 2018 EUR 22,244,316 GBP - USD - USD 2,895,401 USD 731,119 USD 1,291,042 EUR - GBP -

Jupiter Asset Management Series Plc Annual Report and Audited Financial Statements for the financial year ended 31 December 2020
Notes to the Financial Statements for the financial year ended 31 December 2020 (continued)
220
6. Share Capital (continued)
Share Movement (continued) Merian European Equity Fund (continued) Share Class
Class S (GBP) Class U1 (GBP) Class U2 (GBP)
Shares in issue at 1 January 2019 12,580 16,214 - Subscriptions during the financial year 15 9,875 12,904 Redemptions during the financial year (2,929) (3,414) (207)
Shares in issue at 31 December 2019 9,666 22,675 12,697
EUR EUR EUR Value of Shares issued during 2019 289 131,720 142,622 Value of Shares redeemed during 2019 (57,317) (45,767) (2,461)
Net Value of Shares issued/redeemed during 2019 (57,028) 85,953 140,161
Shares in issue at 1 January 2020 9,666 22,675 12,697 Subscriptions during the financial year 37 764 3,319 Redemptions during the financial year (180) (4,064) (453)
Shares in issue at 31 December 2020 9,523 19,375 15,563
EUR EUR EUR Value of Shares issued during the financial year 744 9,301 35,891 Value of Shares redeemed during the financial year (3,718) (53,894) (5,135)
Net Value of Shares issued/redeemed during the financial year (2,974) (44,593) 30,756
Net Assets as at 31 December 2020 GBP 180,667 GBP 252,532 GBP 168,690 Net Assets as at 31 December 2019 GBP 174,350 GBP 280,108 GBP 130,671 Net Assets as at 31 December 2018 GBP 193,004 GBP 169,809 GBP -

Jupiter Asset Management Series Plc Annual Report and Audited Financial Statements for the financial year ended 31 December 2020
Notes to the Financial Statements for the financial year ended 31 December 2020 (continued)
221
6. Share Capital (continued)
Share Movement (continued) Jupiter Merian US Equity Income Fund Share Class
Class A (EUR)
Class A (EUR) Hedged
Class A (GBP)
Class A (USD)
Class A (USD) Income
Class A (USD) Income (F)
Class B (USD)
Class B (USD) Income
Shares in issue at 1 January 2019 870,476 154,395 37,875 2,727,011 1,192,775 - 44,676 40,017 Subscriptions during the financial year 789,552 3,519,787 55,161 3,383,810 2,724,322 44,829 1,040,255 33,947 Redemptions during the financial year (1,650,941) (3,519,895) (88,763) (4,527,399) (3,363,917) (8,746) (1,072,638) (58,775)
Shares in issue at 31 December 2019 9,087 154,287 4,273 1,583,422 553,180 36,083 12,293 15,189
USD USD USD USD USD USD USD USD Value of Shares issued during 2019 18,788,623 60,830,544 1,207,454 99,508,055 35,384,438 434,084 22,138,615 403,866 Value of Shares redeemed during 2019 (38,997,722) (61,283,024) (1,933,297) (133,774,527) (43,532,494) (87,883) (23,086,231) (690,099)
Net Value of Shares issued/redeemed during 2019 (20,209,099) (452,480) (725,843) (34,266,472) (8,148,056) 346,201 (947,616) (286,233)
Shares in issue at 1 January 2020 9,087 154,287 4,273 1,583,422 553,180 36,083 12,293 15,189 Subscriptions during the financial year 600,623 7,559,271 215,615 3,927,428 2,153,209 1,966,411 623,686 92,073 Redemptions during the financial year (607,122) (7,570,964) (217,551) (4,280,098) (2,323,427) (1,792,114) (607,814) (58,386)
Shares in issue at 31 December 2020 2,588 142,594 2,337 1,230,752 382,962 210,380 28,165 48,876
USD USD USD USD USD USD USD USD Value of Shares issued during the financial year 15,275,326 142,100,625 5,224,303 123,661,999 29,538,157 18,202,670 13,831,980 1,122,892 Value of Shares redeemed during the financial year (15,941,635) (143,832,129) (4,478,300) (133,290,748) (30,889,240) (16,862,913) (13,124,461) (726,006)
Net Value of Shares issued/redeemed during the financial year (666,309) (1,731,504) 746,003 (9,628,749) (1,351,083) 1,339,757 707,519 396,886
Net Assets as at 31 December 2020 EUR 61,338 EUR 2,579,010 GBP 45,541 USD 44,503,749 USD 5,889,964 USD 2,312,839 USD 729,403 USD 666,980 Net Assets as at 31 December 2019 EUR 208,138 EUR 2,528,043 GBP 76,188 USD 50,578,188 USD 7,646,466 USD 367,826 USD 285,258 USD 188,512 Net Assets as at 31 December 2018 EUR 16,171,663 EUR 2,161,977 GBP 578,351 USD 72,067,451 USD 13,915,668 USD - USD 869,901 USD 424,188

Jupiter Asset Management Series Plc Annual Report and Audited Financial Statements for the financial year ended 31 December 2020
Notes to the Financial Statements for the financial year ended 31 December 2020 (continued)
222
6. Share Capital (continued)
Share Movement (continued) Jupiter Merian US Equity Income Fund (continued) Share Class
Class C (USD)
Class C (USD) Income
Class C2 (USD) Income
Class C2 (USD) Income (F)
Class I (USD)
Class I (USD) Income
Class N (USD)
Class R (GBP)
Shares in issue at 1 January 2019 553,213 44,423 224,718 - 663,680 19,197 176,586 4,537 Subscriptions during the financial year 44,283 329 10,038,686 239,696 74,294 - 37,835 2,392 Redemptions during the financial year (181,074) (22,568) (10,233,681) (139,136) (643,407) - (178,691) (641)
Shares in issue at 31 December 2019 416,422 22,184 29,723 100,560 94,567 19,197 35,730 6,288
USD USD USD USD USD USD USD USD Value of Shares issued during 2019 994,943 3,841 103,298,831 2,379,202 - 1,766,197 - 46,821 Value of Shares redeemed during 2019 (4,083,615) (265,326) (106,188,129) (1,410,820) (123,744) (14,941,128) - (12,341)
Net Value of Shares issued/redeemed during 2019 (3,088,672) (261,485) (2,889,298) 968,382 (123,744) (13,174,931) - 34,480
Shares in issue at 1 January 2020 416,422 22,184 29,723 100,560 94,567 19,197 35,730 6,288 Subscriptions during the financial year 32,730 2,043 8,919,479 2,065,181 9,846 7,634 - 137 Redemptions during the financial year (112,914) (12,852) (8,482,977) (2,148,512) (21,777) (2,886) (30,851) (5,335)
Shares in issue at 31 December 2020 336,238 11,375 466,225 17,229 82,636 23,945 4,879 1,090
USD USD USD USD USD USD USD USD Value of Shares issued during the financial year 854,868 26,037 89,932,469 19,411,787 270,627 100,139 - 2,679 Value of Shares redeemed during the financial year (2,548,805) (150,948) (86,322,108) (20,638,253) (531,333) (36,816) (310,078) (112,191)
Net Value of Shares issued/redeemed during the financial year (1,693,937) (124,911) 3,610,361 (1,226,466) (260,706) 63,323 (310,078) (109,512)
Net Assets as at 31 December 2020 USD 9,036,155 USD 154,099 USD 5,597,377 USD 186,040 USD 2,408,189 USD 330,390 USD 59,648 GBP 19,230 Net Assets as at 31 December 2019 USD 10,039,863 USD 274,579 USD 324,606 USD 1,017,033 USD 2,416,098 USD 236,187 USD 390,440 GBP 100,614 Net Assets as at 31 December 2018 USD 11,209,770 USD 471,818 USD 2,100,762 USD - USD 13,939,547 USD 197,820 USD 1,616,879 GBP 61,773

Jupiter Asset Management Series Plc Annual Report and Audited Financial Statements for the financial year ended 31 December 2020
Notes to the Financial Statements for the financial year ended 31 December 2020 (continued)
223
6. Share Capital (continued)
Share Movement (continued) Jupiter Merian US Equity Income Fund (continued) Share Class
Class R (GBP) Income
Class S (GBP)
Class U1 (GBP)
Class U1 (GBP) Income
Class U2 (GBP)
Class U2 (GBP) Income
Shares in issue at 1 January 2019 306,463 86,102 127,992 8,029 122,358 7,237,883 Subscriptions during the financial year 1,679,771 16,660 3,856 - 2,143 1,216,839 Redemptions during the financial year (1,881,859) (27,033) (73,794) (5,501) (90,278) (1,321,260)
Shares in issue at 31 December 2019 104,375 75,729 58,054 2,528 34,223 7,133,462
USD USD USD USD USD USD Value of Shares issued during 2019 35,216,481 409,342 74,995 - 49,161 20,916,077 Value of Shares redeemed during 2019 (39,209,955) (655,852) (1,413,018) (77,335) (2,107,829) (23,096,718)
Net Value of Shares issued/redeemed during 2019 (3,993,474) (246,510) (1,338,023) (77,335) (2,058,668) (2,180,641)
Shares in issue at 1 January 2020 104,375 75,729 58,054 2,528 34,223 7,133,462 Subscriptions during the financial year 1,332,438 8,861 7,205 33,350 238 175,921 Redemptions during the financial year (1,260,057) (22,724) (19,497) (25,352) (7,872) (5,318,847)
Shares in issue at 31 December 2020 176,756 61,866 45,762 10,526 26,589 1,990,536
USD USD USD USD USD USD Value of Shares issued during the financial year 28,802,579 217,345 155,378 413,976 5,862 3,094,031 Value of Shares redeemed during the financial year (26,351,625) (598,934) (403,714) (360,936) (184,628) (90,686,958)
Net Value of Shares issued/redeemed during the financial year 2,450,954 (381,589) (248,336) 53,040 (178,766) (87,592,927)
Net Assets as at 31 December 2020 GBP 3,235,647 GBP 1,381,959 GBP 799,391 GBP 130,285 GBP 557,735 GBP 30,449,223 Net Assets as at 31 December 2019 GBP 1,760,996 GBP 1,536,318 GBP 918,896 GBP 28,805 GBP 650,033 GBP 100,380,978 Net Assets as at 31 December 2018 GBP 4,479,945 GBP 1,487,103 GBP 1,722,452 GBP 79,282 GBP 1,974,215 GBP 88,093,898

Jupiter Asset Management Series Plc Annual Report and Audited Financial Statements for the financial year ended 31 December 2020
Notes to the Financial Statements for the financial year ended 31 December 2020 (continued)
224
6. Share Capital (continued)
Share Movement (continued) Jupiter Merian North American Equity Fund (IRL) Share Class
Class A (EUR) Class A (USD) Class B (USD) Class C (USD) Class C2 (USD) Class I (EUR) Class I (EUR) Hedged
Class I (USD)
Shares in issue at 1 January 2019 1,031,992 8,039,704 276,427 1,349,633 499,822 3,032,405 - 36,704,666 Subscriptions during the financial year 781,076 11,824,309 1,951,816 83,690 7,298,342 2,055,940 - 10,157,361 Redemptions during the financial year (951,366) (14,539,077) (2,042,131) (714,582) (7,654,512) (3,482,461) - (25,291,306)
Shares in issue at 31 December 2019 861,702 5,324,936 186,112 718,741 143,652 1,605,884 - 21,570,721
USD USD USD USD USD USD USD USD Value of Shares issued during 2019 17,995,708 355,556,568 43,329,688 1,913,059 87,893,775 26,258,435 - 167,624,614 Value of Shares redeemed during 2019 (21,841,472) (437,736,400) (45,568,566) (16,380,315) (92,663,202) (45,664,990) - (424,310,779)
Net Value of Shares issued/redeemed during 2019 (3,845,764) (82,179,832) (2,238,878) (14,467,256) (4,769,427) (19,406,555) - (256,686,165)
Shares in issue at 1 January 2020 861,702 5,324,936 186,112 718,741 143,652 1,605,884 - 21,570,721 Subscriptions during the financial year 146,468 16,811,676 2,617,749 13,121 6,009,016 228,548 717,263 8,301,042 Redemptions during the financial year (751,170) (17,316,135) (2,695,027) (267,902) (5,836,904) (1,672,248) (68,441) (22,163,706)
Shares in issue at 31 December 2020 257,000 4,820,477 108,834 463,960 315,764 162,184 648,822 7,708,057
USD USD USD USD USD USD USD USD Value of Shares issued during the financial year 3,612,592 549,020,523 61,615,738 344,204 73,847,061 3,173,290 8,504,153 150,921,165 Value of Shares redeemed during the financial year (18,888,145) (566,775,670) (64,202,693) (6,194,730) (71,591,474) (22,684,915) (890,405) (399,424,387)
Net Value of Shares issued/redeemed during the financial year (15,275,553) (17,755,147) (2,586,955) (5,850,526) 2,255,587 (19,511,625) 7,613,748 (248,503,222)
Net Assets as at 31 December 2020 EUR 6,106,688 USD 183,136,237 USD 3,001,742 USD 13,133,386 USD 4,692,503 EUR 2,167,594 EUR 7,566,126 USD 163,632,579 Net Assets as at 31 December 2019 EUR 19,161,077 USD 173,177,993 USD 4,446,832 USD 17,684,738 USD 1,851,350 EUR 19,935,918 EUR - USD 389,002,114 Net Assets as at 31 December 2018 EUR 18,366,759 USD 213,464,138 USD 5,461,228 USD 27,526,383 USD 5,321,827 EUR 29,901,298 EUR - USD 536,216,459

Jupiter Asset Management Series Plc Annual Report and Audited Financial Statements for the financial year ended 31 December 2020
Notes to the Financial Statements for the financial year ended 31 December 2020 (continued)
225
6. Share Capital (continued)
Share Movement (continued)
Jupiter Merian North American Equity Fund (IRL) (continued)
Share Class
Class N (USD) Class P2 (GBP) Income
Class P2 (USD)
Class P2 (USD) Income
Class R (GBP)
Class R (GBP) Hedged
Class S (GBP)
Class U1 (GBP)
Shares in issue at 1 January 2019 1,403,126 21,463,361 4,751,415 8,342,960 496,518 5,340,286 17,005 1,169,216 Subscriptions during the financial year 8,302 1,222,007 7,580,145 2,014,895 96,241 2,189,011 228,369 124,539 Redemptions during the financial year (1,088,363) (6,663,513) (3,920,490) (2,823,232) (220,822) (5,389,320) (230,513) (895,987)
Shares in issue at 31 December 2019 323,065 16,021,855 8,411,070 7,534,623 371,937 2,139,977 14,861 397,768
USD USD USD USD USD USD USD USD Value of Shares issued during 2019 76,234 17,157,193 80,817,183 20,899,394 2,558,941 35,885,556 6,224,276 2,746,458 Value of Shares redeemed during 2019 (10,769,968) (94,074,247) (42,938,094) (30,142,992) (5,879,013) (90,898,824) (6,459,447) (20,217,677)
Net Value of Shares issued/redeemed during 2019 (10,693,734) (76,917,054) 37,879,089 (9,243,598) (3,320,072) (55,013,268) (235,171) (17,471,219)
Shares in issue at 1 January 2020 323,065 16,021,855 8,411,070 7,534,623 371,937 2,139,977 14,861 397,768 Subscriptions during the financial year - 815,923 940,504 722,884 49,170 190,489 231,577 20,418 Redemptions during the financial year (254,312) (16,773,200) (6,895,088) (8,257,507) (230,488) (2,088,466) (232,088) (159,539)
Shares in issue at 31 December 2020 68,753 64,578 2,456,486 - 190,619 242,000 14,350 258,647
USD USD USD USD USD USD USD USD Value of Shares issued during the financial year - 11,045,884 10,416,298 7,395,430 1,463,200 2,959,736 7,179,623 467,363 Value of Shares redeemed during the financial year (2,599,554) (259,697,757) (80,785,852) (95,536,219) (6,463,389) (37,101,978) (7,376,636) (3,835,519)
Net Value of Shares issued/redeemed during the financial year (2,599,554) (248,651,873) (70,369,554) (88,140,789) (5,000,189) (34,142,242) (197,013) (3,368,156)
Net Assets as at 31 December 2020 USD 841,729 GBP 846,389 USD 33,860,804 USD - GBP 4,783,243 GBP 3,847,032 GBP 377,123 GBP 5,414,253 Net Assets as at 31 December 2019 USD 3,424,080 GBP 184,932,373 USD 97,898,352 USD 86,200,987 GBP 8,199,147 GBP 29,697,888 GBP 343,904 GBP 7,305,796 Net Assets as at 31 December 2018 USD 12,280,340 GBP 208,001,903 USD 44,537,452 USD 78,025,494 GBP 9,181,559 GBP 61,221,347 GBP 330,869 GBP 17,991,587

Jupiter Asset Management Series Plc Annual Report and Audited Financial Statements for the financial year ended 31 December 2020
Notes to the Financial Statements for the financial year ended 31 December 2020 (continued)
226
6. Share Capital (continued)
Share Movement (continued)
Jupiter Merian North American Equity Fund (IRL) (continued)
Share Class
Class U1 (GBP) Hedged
Class U2 (GBP)
Shares in issue at 1 January 2019 - 38,842 Subscriptions during the financial year 3,259,454 8,983 Redemptions during the financial year (750,271) (31,910)
Shares in issue at 31 December 2019 2,509,183 15,915
USD USD Value of Shares issued during 2019 43,009,529 196,707 Value of Shares redeemed during 2019 (10,195,295) (684,691)
Net Value of Shares issued/redeemed during 2019 32,814,234 (487,984)
Shares in issue at 1 January 2020 2,509,183 15,915 Subscriptions during the financial year 2,073,576 31,597 Redemptions during the financial year (3,170,456) (14,454)
Shares in issue at 31 December 2020 1,412,303 33,058
USD USD Value of Shares issued during the financial year 29,211,399 655,845 Value of Shares redeemed during the financial year (40,694,864) (331,105)
Net Value of Shares issued/redeemed during the financial year (11,483,465) 324,740
Net Assets as at 31 December 2020 GBP 17,744,220 GBP 680,552 Net Assets as at 31 December 2019 GBP 27,476,627 GBP 287,222 Net Assets as at 31 December 2018 GBP - GBP 587,010

Jupiter Asset Management Series Plc Annual Report and Audited Financial Statements for the financial year ended 31 December 2020
Notes to the Financial Statements for the financial year ended 31 December 2020 (continued)
227
6. Share Capital (continued)
Share Movement (continued) Merian Global Dynamic Bond Fund Share Class
Class A (AUD) Hedged
Class A (AUD) Hedged Income (F)
Class A (EUR) Hedged
Class A (GBP) Income
Class A (USD)
Class A (USD) Income
Class A (USD) Income (F)
Class A (ZAR) Hedged Income (F)
Shares in issue at 1 January 2019 74,252 - 653,503 31,543 4,772,069 3,762,304 58 473,547 Subscriptions during the financial year 3,720 136,415 1,118,389 57 715,550 338,831 1,229,316 2,988,805 Redemptions during the financial year (24,921) (17,211) (1,508,950) (10,895) (2,490,472) (1,702,688) (152,672) (753,249)
Shares in issue at 31 December 2019 53,051 119,204 262,942 20,705 2,997,147 2,398,447 1,076,702 2,709,103
USD USD USD USD USD USD USD USD Value of Shares issued during 2019 29,476 982,954 14,308,751 754 15,051,290 3,443,701 12,971,906 1,935,451 Value of Shares redeemed during 2019 (203,854) (123,925) (19,261,816) (145,055) (51,198,839) (17,467,634) (1,616,116) (479,637)
Net Value of Shares issued/redeemed during 2019 (174,378) 859,029 (4,953,065) (144,301) (36,147,549) (14,023,933) 11,355,790 1,455,814
Shares in issue at 1 January 2020 53,051 119,204 262,942 20,705 2,997,147 2,398,447 1,076,702 2,709,103 Subscriptions during the financial year 207,128 42,204 1,690,705 115,153 8,549,183 2,068,226 522,601 2,300,449 Redemptions during the financial year (198,546) (78,223) (1,168,297) (14,156) (7,338,447) (2,379,707) (585,509) (2,180,701)
Shares in issue at 31 December 2020 61,633 83,185 785,350 121,702 4,207,883 2,086,966 1,013,794 2,828,851
USD USD USD USD USD USD USD USD Value of Shares issued during the financial year 1,851,424 315,782 25,124,449 1,744,372 203,145,966 23,062,722 5,809,189 1,369,404 Value of Shares redeemed during the financial year (1,765,608) (585,404) (17,457,964) (218,409) (174,399,919) (26,527,455) (6,507,686) (1,344,754)
Net Value of Shares issued/redeemed during the financial year 85,816 (269,622) 7,666,485 1,525,963 28,746,047 (3,464,733) (698,497) 24,650
Net Assets as at 31 December 2020 AUD 840,260 AUD 935,364 EUR 10,165,080 GBP 1,390,220 USD 103,938,344 USD 24,054,104 USD 11,585,466 ZAR 28,801,742 Net Assets as at 31 December 2019 AUD 646,688 AUD 1,244,853 EUR 3,066,509 GBP 221,019 USD 65,515,729 USD 24,985,344 USD 11,386,083 ZAR 25,442,356 Net Assets as at 31 December 2018 AUD 831,828 AUD - EUR 7,148,149 GBP 328,434 USD 94,801,463 USD 36,807,218 USD 580 ZAR 4,265,903

Jupiter Asset Management Series Plc Annual Report and Audited Financial Statements for the financial year ended 31 December 2020
Notes to the Financial Statements for the financial year ended 31 December 2020 (continued)
228
6. Share Capital (continued)
Share Movement (continued) Merian Global Dynamic Bond Fund (continued) Share Class
Class B (USD)
Class B (USD)
Income Class C (USD)
Class C (USD)
Income
Class C2 (AUD) Hedged
Income (F) Class C2 (USD)
Income (F)
Class C2 (ZAR) Hedged
Income (F) Class I (USD)
Shares in issue at 1 January 2019 200,107 1,765,029 1,014,960 568,694 200,538 1,702,660 4,344,442 376,086 Subscriptions during the financial year 505,248 428,939 385,122 81,482 2,193 785,697 90,241 25,379 Redemptions during the financial year (526,337) (939,233) (214,894) (149,074) (193,762) (2,321,828) (4,068,780) (69,927)
Shares in issue at 31 December 2019 179,018 1,254,735 1,185,188 501,102 8,969 166,529 365,903 331,538
USD USD USD USD USD USD USD USD Value of Shares issued during 2019 8,159,062 3,868,921 6,343,465 724,890 14,144 7,189,140 56,935 276,504 Value of Shares redeemed during 2019 (8,476,581) (8,491,554) (3,491,378) (1,304,081) (1,248,927) (21,669,424) (2,610,850) (714,430)
Net Value of Shares issued/redeemed during 2019 (317,519) (4,622,633) 2,852,087 (579,191) (1,234,783) (14,480,284) (2,553,915) (437,926)
Shares in issue at 1 January 2020 179,018 1,254,735 1,185,188 501,102 8,969 166,529 365,903 331,538 Subscriptions during the financial year 3,091,050 3,480,899 333,141 62,743 150,164 3,945,393 2,219,018 1,003,198 Redemptions during the financial year (2,812,477) (2,276,070) (338,456) (152,661) (16,863) (3,293,586) (951,529) (211,123)
Shares in issue at 31 December 2020 457,591 2,459,564 1,179,873 411,184 142,270 818,336 1,633,392 1,123,613
USD USD USD USD USD USD USD USD Value of Shares issued during the financial year 55,337,451 34,223,923 6,053,082 568,521 1,050,471 39,049,876 1,267,928 12,236,898 Value of Shares redeemed during the financial year (50,434,019) (22,320,886) (5,951,588) (1,414,987) (113,681) (32,448,414) (585,949) (2,521,116)
Net Value of Shares issued/redeemed during the financial year 4,903,432 11,903,037 101,494 (846,466) 936,790 6,601,462 681,979 9,715,782
Net Assets as at 31 December 2020 USD 8,559,704 USD 24,859,368 USD 21,994,198 USD 3,949,907 AUD 1,405,545 USD 8,288,886 ZAR 16,238,884 USD 14,101,299 Net Assets as at 31 December 2019 USD 2,995,017 USD 11,581,000 USD 19,849,222 USD 4,418,395 AUD 83,391 USD 1,578,238 ZAR 3,410,203 USD 3,663,680 Net Assets as at 31 December 2018 USD 3,077,632 USD 15,462,142 USD 15,686,363 USD 4,782,949 AUD 1,804,725 USD 15,546,258 ZAR 39,011,786 USD 3,757,734

Jupiter Asset Management Series Plc Annual Report and Audited Financial Statements for the financial year ended 31 December 2020
Notes to the Financial Statements for the financial year ended 31 December 2020 (continued)
229
6. Share Capital (continued)
Share Movement (continued) Jupiter Emerging Market Debt Fund Share Class
Class A (EUR)
Class A (EUR)
Hedged Class A (SEK)
Hedged Class A (SGD)
Hedged Income Class A (USD)
Class A (USD)
Income Class A (USD)
Income (F)
Class A (ZAR) Hedged
Income (F)
Shares in issue at 1 January 2019 53,627 1,157,331 212,006 69,262 978,761 3,934,024 3,828 6,821 Subscriptions during the financial year 48,013 42,175 4,804 34 2,730,808 6,082,263 185,191 1,233,000 Redemptions during the financial year (34,319) (263,795) (23,806) (1,740) (2,823,449) (6,373,095) (107,568) (1,023,735)
Shares in issue at 31 December 2019 67,321 935,711 193,004 67,556 886,120 3,643,192 81,451 216,086
USD USD USD USD USD USD USD USD Value of Shares issued during 2019 1,159,859 740,967 19,588 6,733 191 65,635,343 51,382,279 802,904 Value of Shares redeemed during 2019 (846,960) (4,613,865) (229,072) (33,508) (10,052) (69,765,292) (53,888,231) (650,729)
Net Value of Shares issued/redeemed during 2019 312,899 (3,872,898) (209,484) (26,775) (9,861) (4,129,949) (2,505,952) 152,175
Shares in issue at 1 January 2020 67,321 935,711 193,004 67,556 886,120 3,643,192 81,451 216,086 Subscriptions during the financial year 32,432 70,288 3,566 16 342,584 355,922 22,882 65,733 Redemptions during the financial year (66,828) (664,803) (68,752) (34,204) (712,238) (1,011,500) (61,864) (194,174)
Shares in issue at 31 December 2020 32,925 341,196 127,818 33,368 516,466 2,987,614 42,469 87,645
USD USD USD USD USD USD USD USD Value of Shares issued during the financial year 778,920 1,303,574 5,470 83 8,820,564 2,981,951 213,309 38,334 Value of Shares redeemed during the financial year (1,571,832) (12,529,368) (96,205) (182,944) (16,678,100) (8,029,124) (581,791) (103,925)
Net Value of Shares issued/redeemed during the financial year (792,912) (11,225,794) (90,735) (182,861) (7,857,536) (5,047,173) (368,482) (65,591)
Net Assets as at 31 December 2020 EUR 726,211 EUR 5,711,392 SEK 1,844,804 SGD 259,085 USD 14,116,079 USD 25,808,638 USD 404,080 ZAR 810,695 Net Assets as at 31 December 2019 EUR 1,540,324 EUR 15,147,463 SEK 2,694,328 SGD 530,443 USD 22,967,729 USD 31,600,239 USD 789,129 ZAR 2,066,074 Net Assets as at 31 December 2018 EUR 1,033,929 EUR 16,586,061 SEK 2,619,159 SGD 503,833 USD 21,782,344 USD 31,336,212 USD 34,282 ZAR 60,708

Jupiter Asset Management Series Plc Annual Report and Audited Financial Statements for the financial year ended 31 December 2020
Notes to the Financial Statements for the financial year ended 31 December 2020 (continued)
230
6. Share Capital (continued)
Share Movement (continued) Jupiter Emerging Market Debt Fund (continued) Share Class
Class B (USD)
Class B (USD)
Income Class C (USD)
Class C (USD)
Income Class C2 (USD)
Income (F)
Class C2 (ZAR) Hedged
Income (F) Class I (USD)
Class S (GBP)
Income
Shares in issue at 1 January 2019 129,308 1,908,873 206,486 1,065,490 51,972 101,862 8,526,049 64,556 Subscriptions during the financial year 880,549 2,788,084 252,726 54,014 7,159,591 4,290,665 461,406 106,294 Redemptions during the financial year (929,799) (2,351,424) (81,026) (163,107) (7,078,582) (3,523,586) (8,525,059) (92,871)
Shares in issue at 31 December 2019 80,058 2,345,533 378,186 956,397 132,981 868,941 462,396 77,979
USD USD USD USD USD USD USD USD Value of Shares issued during 2019 802,904 16,801,367 24,330,998 4,888,408 490,663 67,598,961 2,792,153 1,359,126 Value of Shares redeemed during 2019 (650,729) (17,788,229) (20,549,667) (1,544,194) (1,479,501) (66,867,481) (2,203,706) (1,227,572)
Net Value of Shares issued/redeemed during 2019 152,175 (986,862) 3,781,331 3,344,214 (988,838) 731,480 588,447 131,554
USD USD USD USD USD USD USD USD Shares in issue at 1 January 2020 80,058 2,345,533 378,186 956,397 132,981 868,941 462,396 77,979 Subscriptions during the financial year - - 102,363 45,508 9 175 1,617,333 38,446 Redemptions during the financial year (31,658) (803,293) (133,974) (180,266) (73,593) (217,898) (829,294) (38,880)
Shares in issue at 31 December 2020 48,400 1,542,240 346,575 821,639 59,397 651,218 1,250,435 77,545
USD USD USD USD USD USD USD USD Value of Shares issued during the financial year - - 1,858,544 364,700 73 94 17,743,961 479,362 Value of Shares redeemed during the financial year (627,870) (6,711,304) (2,503,052) (1,530,299) (681,097) (124,290) (9,176,740) (482,462)
Net Value of Shares issued/redeemed during the financial year (627,870) (6,711,304) (644,508) (1,165,599) (681,024) (124,196) 8,567,221 (3,100)
Net Assets as at 31 December 2020 USD 1,016,410 USD 13,527,032 USD 7,181,570 USD 7,372,605 USD 546,352 ZAR 5,905,379 USD 14,911,776 GBP 761,376 Net Assets as at 31 December 2019 USD 1,613,004 USD 20,876,655 USD 7,545,155 USD 8,760,085 USD 1,264,081 ZAR 8,166,516 USD 5,189,045 GBP 795,527 Net Assets as at 31 December 2018 USD 2,267,222 USD 15,772,439 USD 3,596,975 USD 9,114,872 USD 462,179 ZAR 895,639 USD 81,564,876 GBP 623,685

Jupiter Asset Management Series Plc Annual Report and Audited Financial Statements for the financial year ended 31 December 2020
Notes to the Financial Statements for the financial year ended 31 December 2020 (continued)
231
6. Share Capital (continued)
Share Movement (continued) Jupiter Emerging Market Debt Fund (continued) Share Class
Class U1 (GBP) Income
Shares in issue at 1 January 2019 170,976 Subscriptions during the financial year 215,417 Redemptions during the financial year (211,567)
Shares in issue at 31 December 2019 174,826
USD Value of Shares issued during 2019 3,094,248 Value of Shares redeemed during 2019 (3,053,922)
Net Value of Shares issued/redeemed during 2019 40,326
Shares in issue at 1 January 2020 174,826 Subscriptions during the financial year 45,783 Redemptions during the financial year (157,089)
Shares in issue at 31 December 2020 63,520
USD Value of Shares issued during the financial year 624,092 Value of Shares redeemed during the financial year (2,190,138)
Net Value of Shares issued/redeemed during the financial year (1,566,046)
Net Assets as at 31 December 2020 GBP 692,554 Net Assets as at 31 December 2019 GBP 1,972,445 Net Assets as at 31 December 2018 GBP 1,820,230

Jupiter Asset Management Series Plc Annual Report and Audited Financial Statements for the financial year ended 31 December 2020
Notes to the Financial Statements for the financial year ended 31 December 2020 (continued)
232
6. Share Capital (continued)
Share Movement (continued) Merian European Best Ideas Fund^^ Share Class
Class A (EUR)
Class A (GBP)
Class A (USD)
Class A (USD) Hedged
Class C (USD)
Class C2 (USD) Hedged
Class I (EUR)
Class U1 (GBP)
Shares in issue at 1 January 2019 1,413,731 115,800 558,992 69,329 175,977 5,575 8,090 2,768 Subscriptions during the financial year 43,282 3,217 268 62 - - - 951 Redemptions during the financial year (1,457,013) (119,017) (559,260) (69,391) (175,977) (5,575) (8,090) (3,719)
Shares in issue at 31 December 2019 - - - - - - - -
EUR EUR EUR EUR EUR EUR EUR EUR Value of Shares issued during 2019 735,001 61,801 2,929 573 - - - 14,177 Value of Shares redeemed during 2019 (25,132,641) (2,499,795) (6,042,870) (663,378) (2,122,853) (50,228) (125,014) (56,121)
Net Value of Shares issued/redeemed during 2019 (24,397,640) (2,437,994) (6,039,941) (662,805) (2,122,853) (50,228) (125,014) (41,944)
Net Assets as at 31 December 2019 EUR - GBP - USD - USD - USD - USD - EUR - GBP - Net Assets as at 31 December 2018 EUR 21,645,682 GBP 1,922,465 USD 6,073,336 USD 636,424 USD 2,170,839 USD 53,093 EUR 109,537 GBP 32,957
Merian European Best Ideas Fund^^ (continued) Share Class
Class U2 (GBP)
Shares in issue at 1 January 2019 1,996,400 Subscriptions during the financial year 50,737 Redemptions during the financial year (2,047,137)
Shares in issue at 31 December 2019 -
EUR Value of Shares issued during 2019 707,589 Value of Shares redeemed during 2019 (32,864,979)
Net Value of Shares issued/redeemed during 2019 (32,157,390)
Net Assets as at 31 December 2019 GBP - Net Assets as at 31 December 2018 GBP 24,324,135
^^ The Fund closed in 2019 and there was no units held in 2020.

Jupiter Asset Management Series Plc Annual Report and Audited Financial Statements for the financial year ended 31 December 2020
Notes to the Financial Statements for the financial year ended 31 December 2020 (continued)
233
6. Share Capital (continued)
Share Movement (continued) Merian Investment Grade Corporate Bond Fund*** Share Class
Class A (GBP) Hedged Income
Class A (SEK) Hedged
Class A (USD)
Class A (USD) Income
Class C (USD)
Class I (USD)
Class S (GBP) Hedged Income
Class U1 (GBP) Hedged Income
Shares in issue at 1 January 2019 14,149 2,751,317 159,364 6,543 464,423 3,103 66,556 17,583 Subscriptions during the financial year 29 8,507 22,372 106 12,840 - 8,380 363 Redemptions during the financial year (14,178) (2,759,824) (181,736) (6,649) (477,263) (3,103) (74,936) (17,946)
Shares in issue at 31 December 2019 - - - - - - - -
USD USD USD USD USD USD USD USD Value of Shares issued during 2019 337 12,342 290,351 1,038 147,857 - 106,300 4,272 Value of Shares redeemed during 2019 (165,020) (3,948,429) (2,427,196) (66,779) (5,710,138) (32,002) (933,916) (209,774)
Net Value of Shares issued/redeemed during 2019 (164,683) (3,936,087) (2,136,845) (65,741) (5,562,281) (32,002) (827,616) (205,502)
Net Assets as at 31 December 2019 GBP - SEK - USD - USD - USD - USD - GBP - GBP - Net Assets as at 31 December 2018 GBP 127,107 SEK 35,005,004 USD 1,984,294 USD 62,272 USD 5,172,338 USD 30,411 GBP 642,054 GBP 157,914
Merian Investment Grade Corporate Bond Fund*** (continued)
Share Class
Class U2 (GBP) Hedged
Shares in issue at 1 January 2019 2,009 Subscriptions during the financial year 15 Redemptions during the financial year (2,024)
Shares in issue at 31 December 2019 -
USD Value of Shares issued during 2019 216 Value of Shares redeemed during 2019 (29,094)
Net Value of Shares issued/redeemed during 2019 (28,878)
Net Assets as at 31 December 2019 GBP - Net Assets as at 31 December 2018 GBP 21,821
*** The Fund closed in 2019 and there was no units held in 2020.

Jupiter Asset Management Series Plc Annual Report and Audited Financial Statements for the financial year ended 31 December 2020
Notes to the Financial Statements for the financial year ended 31 December 2020 (continued)
234
6. Share Capital (continued)
Share Movement (continued) Jupiter Global Emerging Markets Focus Fund Share Class
Class A (EUR) Class A (GBP) Class A (USD) Class B (USD) Class C (USD) Class C2 (USD) Class I (USD) Class R (GBP)
Shares in issue at 1 January 2019 2,619,137 199,962 895,671 89,727 227,085 137,621 244,157 72,189 Subscriptions during the financial year 396,054 2,401 1,149,475 219,694 6,605 1,024,714 923,598 135,744 Redemptions during the financial year (545,096) (81,845) (1,574,092) (232,750) (179,851) (1,063,333) (62,028) (27,159)
Shares in issue at 31 December 2019 2,470,095 120,518 471,054 76,671 53,839 99,002 1,105,727 180,774
USD USD USD USD USD USD USD USD Value of Shares issued during 2019 6,737,539 42,432 14,703,521 2,470,528 61,455 12,309,738 11,283,305 2,488,908 Value of Shares redeemed during 2019 (9,382,201) (1,434,246) (19,506,517) (2,629,342) (1,711,292) (12,821,433) (737,048) (507,903)
Net Value of Shares issued/redeemed during 2019 (2,644,662) (1,391,814) (4,802,996) (158,814) (1,649,837) (511,695) 10,546,257 1,981,005
Shares in issue at 1 January 2020 2,470,095 120,518 471,054 76,671 53,839 99,002 1,105,727 180,774 Subscriptions during the financial year 432,539 1,876 467,019 518,486 3,574 1,114,371 87,487 35,986 Redemptions during the financial year (1,116,009) (48,143) (676,068) (397,677) (8,817) (1,155,674) (863,571) (69,331)
Shares in issue at 31 December 2020 1,786,625 74,251 262,005 197,480 48,596 57,699 329,643 147,429
USD USD USD USD USD USD USD USD Value of Shares issued during the financial year 7,745,869 30,257 6,138,614 6,891,992 41,072 14,512,740 1,082,262 783,042 Value of Shares redeemed during the financial year (17,583,023) (897,818) (9,154,428) (5,129,768) (88,007) (15,040,205) (9,429,769) (1,354,744)
Net Value of Shares issued/redeemed during the financial year (9,837,154) (867,561) (3,015,814) 1,762,224 (46,935) (527,465) (8,347,507) (571,702)
Net Assets as at 31 December 2020 EUR 33,203,736 GBP 1,282,387 USD 4,409,810 USD 2,895,859 USD 600,618 USD 902,187 USD 5,249,507 GBP 2,704,449 Net Assets as at 31 December 2019 EUR 41,011,324 GBP 1,757,722 USD 6,489,672 USD 929,889 USD 555,526 USD 1,280,370 USD 14,284,197 GBP 2,780,955 Net Assets as at 31 December 2018 EUR 35,108,224 GBP 2,484,106 USD 10,177,337 USD 906,969 USD 1,966,903 USD 1,482,944 USD 2,578,273 GBP 939,760

Jupiter Asset Management Series Plc Annual Report and Audited Financial Statements for the financial year ended 31 December 2020
Notes to the Financial Statements for the financial year ended 31 December 2020 (continued)
235
6. Share Capital (continued)
Share Movement (continued)
Jupiter Global Emerging Markets Focus Fund (continued)
Share Class
Class S (GBP) Class U1 (GBP) Class U2 (GBP)
Shares in issue at 1 January 2019 164,585 318,183 2,971,591 Subscriptions during the financial year 9,022 27,479 571,581 Redemptions during the financial year (81,689) (215,703) (545,100)
Shares in issue at 31 December 2019 91,918 129,959 2,998,072
USD USD USD Value of Shares issued during 2019 174,671 463,687 11,652,387 Value of Shares redeemed during 2019 (1,559,188) (3,665,944) (11,271,808)
Net Value of Shares issued/redeemed during 2019 (1,384,517) (3,202,257) 380,579
Shares in issue at 1 January 2020 91,918 129,959 2,998,072 Subscriptions during the financial year 457 19,047 4,088,467 Redemptions during the financial year (27,233) (69,986) (2,249,950)
Shares in issue at 31 December 2020 65,142 79,020 4,836,589
USD USD USD Value of Shares issued during the financial year 7,475 314,564 95,462,064 Value of Shares redeemed during the financial year (544,535) (1,249,087) (51,033,790)
Net Value of Shares issued/redeemed during the financial year (537,060) (934,523) 44,428,274
Net Assets as at 31 December 2020 GBP 1,235,281 GBP 1,350,189 GBP 100,476,896 Net Assets as at 31 December 2019 GBP 1,465,090 GBP 1,861,886 GBP 52,123,658 Net Assets as at 31 December 2018 GBP 2,224,279 GBP 3,856,634 GBP 43,618,794
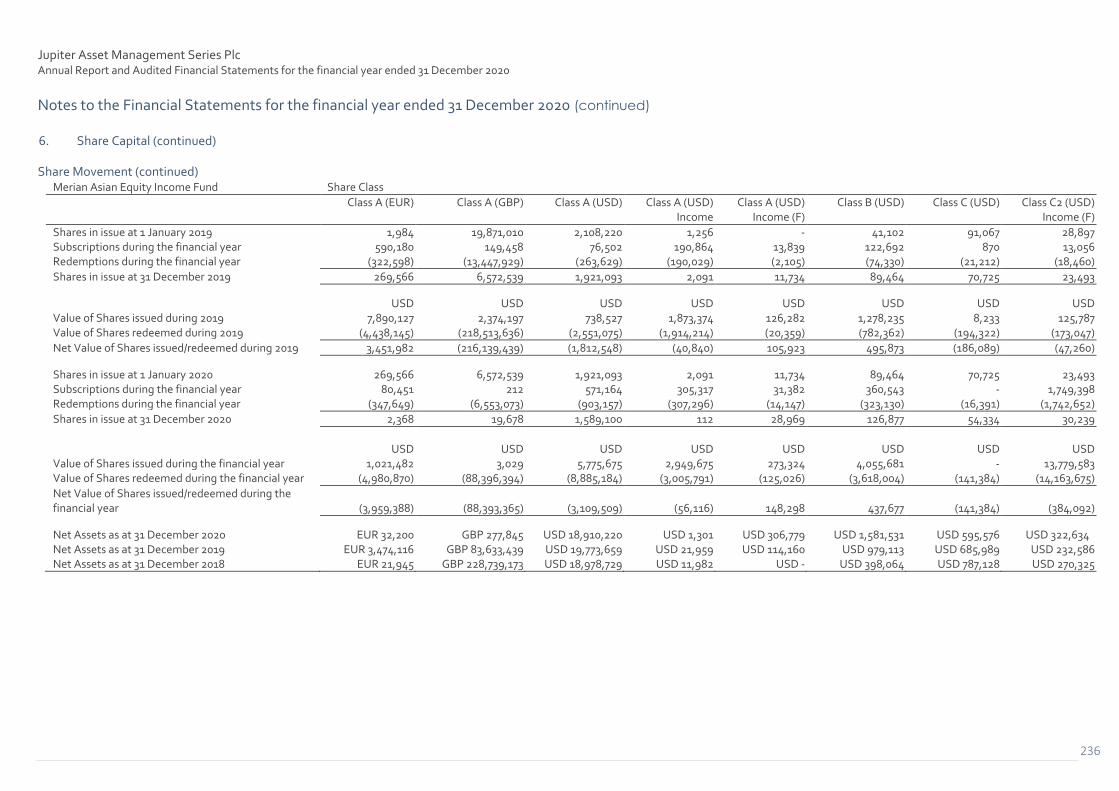
Jupiter Asset Management Series Plc Annual Report and Audited Financial Statements for the financial year ended 31 December 2020
Notes to the Financial Statements for the financial year ended 31 December 2020 (continued)
236
6. Share Capital (continued)
Share Movement (continued)
Merian Asian Equity Income Fund Share Class
Class A (EUR)
Class A (GBP)
Class A (USD)
Class A (USD) Income
Class A (USD) Income (F)
Class B (USD)
Class C (USD)
Class C2 (USD) Income (F)
Shares in issue at 1 January 2019 1,984 19,871,010 2,108,220 1,256 - 41,102 91,067 28,897 Subscriptions during the financial year 590,180 149,458 76,502 190,864 13,839 122,692 870 13,056 Redemptions during the financial year (322,598) (13,447,929) (263,629) (190,029) (2,105) (74,330) (21,212) (18,460)
Shares in issue at 31 December 2019 269,566 6,572,539 1,921,093 2,091 11,734 89,464 70,725 23,493
USD USD USD USD USD USD USD USD Value of Shares issued during 2019 7,890,127 2,374,197 738,527 1,873,374 126,282 1,278,235 8,233 125,787 Value of Shares redeemed during 2019 (4,438,145) (218,513,636) (2,551,075) (1,914,214) (20,359) (782,362) (194,322) (173,047)
Net Value of Shares issued/redeemed during 2019 3,451,982 (216,139,439) (1,812,548) (40,840) 105,923 495,873 (186,089) (47,260)
Shares in issue at 1 January 2020 269,566 6,572,539 1,921,093 2,091 11,734 89,464 70,725 23,493 Subscriptions during the financial year 80,451 212 571,164 305,317 31,382 360,543 - 1,749,398 Redemptions during the financial year (347,649) (6,553,073) (903,157) (307,296) (14,147) (323,130) (16,391) (1,742,652)
Shares in issue at 31 December 2020 2,368 19,678 1,589,100 112 28,969 126,877 54,334 30,239
USD USD USD USD USD USD USD USD Value of Shares issued during the financial year 1,021,482 3,029 5,775,675 2,949,675 273,324 4,055,681 - 13,779,583 Value of Shares redeemed during the financial year (4,980,870) (88,396,394) (8,885,184) (3,005,791) (125,026) (3,618,004) (141,384) (14,163,675)
Net Value of Shares issued/redeemed during the financial year (3,959,388) (88,393,365) (3,109,509) (56,116) 148,298 437,677 (141,384) (384,092)
Net Assets as at 31 December 2020 EUR 32,200 GBP 277,845 USD 18,910,220 USD 1,301 USD 306,779 USD 1,581,531 USD 595,576 USD 322,634 Net Assets as at 31 December 2019 EUR 3,474,116 GBP 83,633,439 USD 19,773,659 USD 21,959 USD 114,160 USD 979,113 USD 685,989 USD 232,586 Net Assets as at 31 December 2018 EUR 21,945 GBP 228,739,173 USD 18,978,729 USD 11,982 USD - USD 398,064 USD 787,128 USD 270,325

Jupiter Asset Management Series Plc Annual Report and Audited Financial Statements for the financial year ended 31 December 2020
Notes to the Financial Statements for the financial year ended 31 December 2020 (continued)
237
6. Share Capital (continued)
Share Movement (continued) Merian Asian Equity Income Fund (continued) Share Class
Class I (EUR)
Class I (USD)
Class R (GBP)
Class U1 (GBP) Class U1 (GBP) Income
Class U2 (GBP) Income
Shares in issue at 1 January 2019 100 30,838 21,459 19,707 2,816 380,357 Subscriptions during the financial year 99 7,852 13,713 1,230 1,197 726 Redemptions during the financial year - (49) (8,056) (8,247) (514) (66,533)
Shares in issue at 31 December 2019 199 38,641 27,116 12,690 3,499 314,550
USD USD USD USD USD USD Value of Shares issued during 2019 1,078 84,704 208,691 20,262 17,133 10,104 Value of Shares redeemed during 2019 - (548) (120,756) (136,568) (7,619) (986,632)
Net Value of Shares issued/redeemed during 2019 1,078 84,156 87,935 (116,306) 9,514 (976,528)
Shares in issue at 1 January 2020 199 38,641 27,116 12,690 3,499 314,550 Subscriptions during the financial year - 40,860 4,447 2,012 283 653 Redemptions during the financial year - (124) (18,869) (8,266) (1,817) (293,691)
Shares in issue at 31 December 2020 199 79,377 12,694 6,436 1,965 21,512
USD USD USD USD USD USD Value of Shares issued during the financial year - 560,002 76,642 38,301 4,164 9,172 Value of Shares redeemed during the financial year - (1,407) (298,121) (136,347) (26,394) (3,792,320)
Net Value of Shares issued/redeemed during the financial year - 558,595 (221,479) (98,046) (22,230) (3,783,148)
Net Assets as at 31 December 2020 EUR 2,327 USD 1,131,207 GBP 175,873 GBP 99,055 GBP 24,962 GBP 264,163 Net Assets as at 31 December 2019 EUR 2,184 USD 472,729 GBP 333,250 GBP 173,106 GBP 40,646 GBP 3,535,242 Net Assets as at 31 December 2018 EUR 933 USD 327,511 GBP 237,090 GBP 241,524 GBP 30,451 GBP 3,971,765

Jupiter Asset Management Series Plc Annual Report and Audited Financial Statements for the financial year ended 31 December 2020
Notes to the Financial Statements for the financial year ended 31 December 2020 (continued)
238
6. Share Capital (continued)
Share Movement (continued) Jupiter Local Currency Emerging Market Debt Fund Share Class
Class A (AUD) Hedged
Income (F) Class A (EUR)
Class A (GBP)
Income Class A (USD)
Class A (USD)
Income Class A (USD)
Income (F)
Class A (ZAR) Hedged
Income (F)
Class B (AUD) Hedged
Income (F)
Shares in issue at 1 January 2019 281,118 86,458 99,686 262,452 3,176,971 278,616 33,141,581 731,330 Subscriptions during the financial year 766,918 3,302,670 45,521 961,030 3,348,583 2,043,916 20,870,571 241,364 Redemptions during the financial year (193,764) (3,313,313) (23,520) (597,647) (3,508,959) (649,791) (14,841,494) (116,018)
Shares in issue at 31 December 2019 854,272 75,815 121,687 625,835 3,016,595 1,672,741 39,170,658 856,676
USD USD USD USD USD USD USD USD Value of Shares issued during 2019 4,406,948 41,183,907 383,920 8,431,610 18,642,798 17,576,253 11,768,992 1,400,561 Value of Shares redeemed during 2019 (1,106,938) (40,473,834) (198,820) (5,205,779) (19,517,896) (5,574,801) (8,484,581) (658,444)
Net Value of Shares issued/redeemed during 2019 3,300,010 710,073 185,100 3,225,831 (875,098) 12,001,452 3,284,411 742,117
Shares in issue at 1 January 2020 854,272 75,815 121,687 625,835 3,016,595 1,672,741 39,170,658 856,676 Subscriptions during the financial year 484,797 10,592 80,617 383,279 3,772,513 1,945,581 11,169,631 66,438 Redemptions during the financial year (434,493) (16,136) (63,351) (883,274) (5,166,169) (1,671,061) (16,799,074) (100,071)
Shares in issue at 31 December 2020 904,576 70,271 138,953 125,840 1,622,939 1,947,261 33,541,215 823,043
USD USD USD USD USD USD USD USD Value of Shares issued during the financial year 2,492,288 119,025 669,969 3,336,415 19,564,611 15,707,442 4,967,962 349,089 Value of Shares redeemed during the financial year (2,185,957) (188,405) (495,827) (7,698,032) (26,749,271) (13,552,756) (7,648,480) (513,733)
Net Value of Shares issued/redeemed during the financial year 306,331 (69,380) 174,142 (4,361,617) (7,184,660) 2,154,686 (2,680,518) (164,644)
Net Assets as at 31 December 2020 AUD 7,155,609 EUR 752,159 GBP 838,098 USD 1,185,470 USD 8,815,580 USD 16,042,925 ZAR 260,874,583 AUD 6,313,986 Net Assets as at 31 December 2019 AUD 7,320,868 EUR 877,614 GBP 801,283 USD 5,834,489 USD 17,218,776 USD 14,750,231 ZAR 330,728,434 AUD 7,192,923 Net Assets as at 31 December 2018 AUD 2,317,060 EUR 863,555 GBP 648,935 USD 2,156,118 USD 17,303,617 USD 2,345,435 ZAR 269,573,619 AUD 5,954,125

Jupiter Asset Management Series Plc Annual Report and Audited Financial Statements for the financial year ended 31 December 2020
Notes to the Financial Statements for the financial year ended 31 December 2020 (continued)
239
6. Share Capital (continued)
Share Movement (continued) Jupiter Local Currency Emerging Market Debt Fund (continued)
Share Class
Class B (USD)
Income
Class B (ZAR) Hedged
Income (F) Class C (USD)
Class C (USD)
Income
Class C2 (AUD) Hedged
Income (F) Class C2 (USD)
Income (F)
Class C2 (ZAR) Hedged
Income (F) Class I (USD)
Shares in issue at 1 January 2019 11,425,852 19,043,069 101,551 181,860 1,423,262 3,407,588 19,772,677 1,108,310 Subscriptions during the financial year 8,159,225 20,505,553 1,613 7,915 77,377 12,909,940 1,773,547 5,613 Redemptions during the financial year (7,852,506) (8,102,142) (47,346) (16,671) (967,717) (13,781,824) (13,591,253) (28,687)
Shares in issue at 31 December 2019 11,732,571 31,446,480 55,818 173,104 532,922 2,535,704 7,954,971 1,085,236
USD USD USD USD USD USD USD USD Value of Shares issued during 2019 44,787,628 11,522,895 13,399 35,416 447,184 114,358,416 992,027 52,834 Value of Shares redeemed during 2019 (42,879,097) (4,613,825) (388,731) (75,461) (5,488,926) (121,730,655) (7,458,241) (281,970)
Net Value of Shares issued/redeemed during 2019 1,908,531 6,909,070 (375,332) (40,045) (5,041,742) (7,372,239) (6,466,214) (229,136)
Shares in issue at 1 January 2020 11,732,571 31,446,480 55,818 173,104 532,922 2,535,704 7,954,971 1,085,236 Subscriptions during the financial year 3,032,567 6,310,491 - 27,415 6,042 14,369,273 806,032 2,056,924 Redemptions during the financial year (4,370,392) (6,921,695) (54,205) (108,120) (499,564) (16,372,158) (7,463,179) (1,158,399)
Shares in issue at 31 December 2020 10,394,746 30,835,276 1,613 92,399 39,400 532,819 1,297,824 1,983,761
USD USD USD USD USD USD USD USD Value of Shares issued during the financial year 15,501,800 2,946,203 - 122,758 28,762 118,378,217 367,264 20,033,232 Value of Shares redeemed during the financial year (22,218,464) (3,284,821) (432,043) (442,032) (2,513,668) (133,756,389) (3,219,022) (10,714,633)
Net Value of Shares issued/redeemed during the financial year (6,716,664) (338,618) (432,043) (319,274) (2,484,906) (15,378,172) (2,851,758) 9,318,599
Net Assets as at 31 December 2020 USD 54,860,664 ZAR 232,903,773 USD 13,771 USD 397,128 AUD 299,326 USD 4,463,673 ZAR 9,683,216 USD 20,792,066 Net Assets as at 31 December 2019 USD 65,766,667 ZAR 260,623,455 USD 478,281 USD 794,005 AUD 4,472,913 USD 23,008,663 ZAR 65,639,827 USD 11,144,497 Net Assets as at 31 December 2018 USD 61,759,587 ZAR 153,582,353 USD 776,791 USD 808,296 AUD 11,593,182 USD 29,824,242 ZAR 158,897,191 USD 9,920,682

Jupiter Asset Management Series Plc Annual Report and Audited Financial Statements for the financial year ended 31 December 2020
Notes to the Financial Statements for the financial year ended 31 December 2020 (continued)
240
6. Share Capital (continued)
Share Movement (continued) Jupiter Local Currency Emerging Market Debt Fund (continued)
Share Class
Class U1 (GBP) Income
Class U2 (GBP)
Class U2 (GBP) Income
Shares in issue at 1 January 2019 50,816 228 17,084,992 Subscriptions during the financial year 12,863 1,412 7,765,061 Redemptions during the financial year (29,814) - (2,019,374)
Shares in issue at 31 December 2019 33,865 1,640 22,830,679
USD USD USD Value of Shares issued during 2019 146,977 22,321 91,316,409 Value of Shares redeemed during 2019 (338,857) - (23,564,036)
Net Value of Shares issued/redeemed during 2019 (191,880) 22,321 67,752,373
Shares in issue at 1 January 2020 33,865 1,640 22,830,679 Subscriptions during the financial year 13,781 1,534 2,301,738 Redemptions during the financial year (40,608) (1,621) (25,132,417)
Shares in issue at 31 December 2020 7,038 1,553 -
USD USD USD Value of Shares issued during the financial year 143,446 22,506 27,378,806 Value of Shares redeemed during the financial year (427,881) (28,474) (272,841,698)
Net Value of Shares issued/redeemed during the financial year (284,435) (5,968) (245,462,892)
Net Assets as at 31 December 2020 GBP 58,702 GBP 20,259 GBP - Net Assets as at 31 December 2019 GBP 305,480 GBP 21,629 GBP 210,971,660 Net Assets as at 31 December 2018 GBP 449,495 GBP 2,706 GBP 154,332,146

Jupiter Asset Management Series Plc Annual Report and Audited Financial Statements for the financial year ended 31 December 2020
Notes to the Financial Statements for the financial year ended 31 December 2020 (continued)
241
6. Share Capital (continued)
Share Movement (continued) Jupiter UK Alpha Fund (IRL) Share Class
Class A (EUR)
Class A (GBP)
Class A (GBP) Income
Class A (USD)
Class A (USD) Hedged
Class I (EUR)
Class I (USD)
Class I (USD) Hedged
Shares in issue at 1 January 2019 5,333 35,391 77,308 144,091 46,338 3,379 12,589 61,892 Subscriptions during the financial year 2,891 27 4,827 154,993 7,053 3,624 29,251 1,415 Redemptions during the financial year (2,557) - - (137,311) (12,108) (5,188) (8,793) (13,783)
Shares in issue at 31 December 2019 5,667 35,418 82,135 161,773 41,283 1,815 33,047 49,524
GBP GBP GBP GBP GBP GBP GBP GBP Value of Shares issued during 2019 28,230 321 48,005 1,195,884 75,608 29,185 241,702 14,432 Value of Shares redeemed during 2019 (25,197) - - (1,031,285) (126,048) (43,274) (69,660) (147,182)
Net Value of Shares issued/redeemed during 2019 3,033 321 48,005 164,599 (50,440) (14,089) 172,042 (132,750)
Shares in issue at 1 January 2020 5,667 35,418 82,135 161,773 41,283 1,815 33,047 49,524 Subscriptions during the financial year 4,119 3,093 - 29,488 - 840 120,354 3,682 Redemptions during the financial year (5,165) (13,195) (42,135) (146,637) (13,595) (296) (29,803) (48,392)
Shares in issue at 31 December 2020 4,621 25,316 40,000 44,624 27,688 2,359 123,598 4,814
GBP GBP GBP GBP GBP GBP GBP GBP Value of Shares issued during the financial year 42,842 30,776 - 217,684 - 6,215 854,074 38,299 Value of Shares redeemed during the financial year (52,669) (124,952) (354,512) (1,010,270) (131,890) (2,487) (200,828) (487,707)
Net Value of Shares issued/redeemed during the financial year (9,827) (94,176) (354,512) (792,586) (131,890) 3,728 653,246 (449,408)
Net Assets as at 31 December 2020 EUR 48,366 GBP 297,809 GBP 375,676 USD 449,553 USD 366,518 EUR 21,510 USD 1,290,151 USD 64,885 Net Assets as at 31 December 2019 EUR 69,061 GBP 458,467 GBP 871,453 USD 1,735,797 USD 590,139 EUR 19,117 USD 364,575 USD 716,058 Net Assets as at 31 December 2018 EUR 50,521 GBP 375,640 GBP 701,240 USD 1,225,797 USD 534,543 EUR 27,490 USD 109,366 USD 716,406

Jupiter Asset Management Series Plc Annual Report and Audited Financial Statements for the financial year ended 31 December 2020
Notes to the Financial Statements for the financial year ended 31 December 2020 (continued)
242
6. Share Capital (continued)
Share Movement (continued) Jupiter UK Alpha Fund (IRL) (continued) Share Class
Class R (GBP)
Class R (GBP) Income
Class U1 (GBP)
Class U1 (GBP) Income
Class U1 (USD)
Class U2 (GBP)
Class U2 (GBP) Income
Class U2 (USD)
Shares in issue at 1 January 2019 45,820 307,508 1,206,975 1,209,540 131,402 827,881 4,779,744 45,889 Subscriptions during the financial year 20,785 100,553 69,753 1,156,673 7,394 40,100 527,864 16,748 Redemptions during the financial year (50,889) (87,512) (458,207) (854,641) (16,920) (460,215) (3,788,573) (1,270)
Shares in issue at 31 December 2019 15,716 320,549 818,521 1,511,572 121,876 407,766 1,519,035 61,367
GBP GBP GBP GBP GBP GBP GBP GBP Value of Shares issued during 2019 277,724 1,099,062 917,523 12,848,095 58,340 530,893 6,169,434 132,397 Value of Shares redeemed during 2019 (697,777) (935,490) (5,853,546) (9,257,779) (143,636) (5,677,603) (43,380,276) (9,880)
Net Value of Shares issued/redeemed during 2019 (420,053) 163,572 (4,936,023) 3,590,316 (85,296) (5,146,710) (37,210,842) 122,517
Shares in issue at 1 January 2020 15,716 320,549 818,521 1,511,572 121,876 407,766 1,519,035 61,367 Subscriptions during the financial year 4,229 134,800 45,944 942,337 - 35,332 306,012 1,425 Redemptions during the financial year (1,766) (201,498) (347,165) (1,029,449) (931) (109,250) (1,195,091) (61,058)
Shares in issue at 31 December 2020 18,179 253,851 517,300 1,424,460 120,945 333,848 629,956 1,734
GBP GBP GBP GBP GBP GBP GBP GBP Value of Shares issued during the financial year 54,925 1,249,239 575,187 8,600,698 - 373,500 3,150,205 12,232 Value of Shares redeemed during the financial year (21,883) (1,790,985) (3,816,601) (8,811,846) (6,408) (1,206,643) (11,514,372) (430,468)
Net Value of Shares issued/redeemed during the financial year 33,042 (541,746) (3,241,414) (211,148) (6,408) (833,143) (8,364,167) (418,236)
Net Assets as at 31 December 2020 GBP 239,176 GBP 2,612,386 GBP 6,735,892 GBP 14,808,529 USD 1,301,662 GBP 4,324,894 GBP 6,900,665 USD 18,564 Net Assets as at 31 December 2019 GBP 225,801 GBP 3,698,415 GBP 11,630,032 GBP 17,605,198 USD 1,385,077 GBP 5,759,554 GBP 18,629,064 USD 693,436 Net Assets as at 31 December 2018 GBP 535,788 GBP 3,010,642 GBP 13,946,484 GBP 11,944,789 USD 1,173,679 GBP 9,502,580 GBP 49,665,489 USD 407,262

Jupiter Asset Management Series Plc Annual Report and Audited Financial Statements for the financial year ended 31 December 2020
Notes to the Financial Statements for the financial year ended 31 December 2020 (continued)
243
6. Share Capital (continued)
Share Movement (continued)
Jupiter UK Smaller Companies Focus Fund Share Class
Class A (GBP) Income
Class R (GBP) Income
Class U1 (GBP) Income
Shares in issue at 1 January 2019 9,197,746 67,650,332 1,630,861 Subscriptions during the financial year 277,028 21,057,990 189,806 Redemptions during the financial year (2,971,915) (21,837,862) (912,760)
Shares in issue at 31 December 2019 6,502,859 66,870,460 907,907
GBP GBP GBP Value of Shares issued during 2019 4,479,218 58,928,088 3,474,121 Value of Shares redeemed during 2019 (48,483,229) (60,379,191) (16,650,086)
Net Value of Shares issued/redeemed during 2019 (44,004,011) (1,451,103) (13,175,965)
Shares in issue at 1 January 2020 6,502,859 66,870,460 907,907 Subscriptions during the financial year 319,915 35,106,762 813,143 Redemptions during the financial year (5,760,659) (28,820,646) (768,943)
Shares in issue at 31 December 2020 1,062,115 73,156,576 952,107
GBP GBP GBP Value of Shares issued during the financial year 5,526,740 99,965,791 15,420,011 Value of Shares redeemed during the financial year (105,835,337) (77,968,227) (14,170,637)
Net Value of Shares issued/redeemed during the financial year (100,308,597) 21,997,564 1,249,374
Net Assets as at 31 December 2020 GBP 21,539,545 GBP 256,395,313 GBP 22,337,081 Net Assets as at 31 December 2019 GBP 119,083,171 GBP 211,908,381 GBP 19,273,572
Net Assets as at 31 December 2018 GBP 131,707,238 GBP 166,383,670 GBP 26,849,757

Jupiter Asset Management Series Plc Annual Report and Audited Financial Statements for the financial year ended 31 December 2020
Notes to the Financial Statements for the financial year ended 31 December 2020 (continued)
244
6. Share Capital (continued)
Share Movement (continued)
Jupiter UK Dynamic Equity Fund Share Class
Class A (GBP) Income
Class I (EUR) Hedged
Class R (GBP) Income
Shares in issue at 1 January 2019 21,026,207 1,178,009 88,090,129 Subscriptions during the financial year 801,131 782,591 7,796,781 Redemptions during the financial year (3,886,938) (9,516) (21,143,013)
Shares in issue at 31 December 2019 17,940,400 1,951,084 74,743,897
GBP GBP GBP Value of Shares issued during 2019 3,709,410 3,165,932 37,433,423 Value of Shares redeemed during 2019 (17,621,055) (38,566) (99,281,129)
Net Value of Shares issued/redeemed during 2019 (13,911,645) 3,127,366 (61,847,706)
Shares in issue at 1 January 2020 17,940,400 1,951,084 74,743,897 Subscriptions during the financial year 1,185,002 661,551 15,030,593 Redemptions during the financial year (4,151,051) (1,192,205) (33,703,595)
Shares in issue at 31 December 2020 14,974,351 1,420,430 56,070,895
GBP GBP GBP Value of Shares issued during the financial year 5,439,975 2,726,855 69,737,252 Value of Shares redeemed during the financial year (18,078,114) (4,646,334) (164,539,841)
Net Value of Shares issued/redeemed during the financial year (12,638,139) (1,919,479) (94,802,589)
Net Assets as at 31 December 2020 GBP 83,801,129 EUR 7,993,076 GBP 323,301,589 Net Assets as at 31 December 2019 GBP 94,357,935 EUR 10,138,636 GBP 406,622,535 Net Assets as at 31 December 2018 GBP 83,843,657 EUR 4,670,216 GBP 363,705,470

Jupiter Asset Management Series Plc Annual Report and Audited Financial Statements for the financial year ended 31 December 2020
Notes to the Financial Statements for the financial year ended 31 December 2020 (continued)
245
6. Share Capital (continued)
Share Movement (continued)
Jupiter Merian Global Equity Absolute Return Fund Share Class
Class A (CHF) Hedged
Class A (EUR) Hedged
Class A (GBP) Hedged
Class A (RMB) Hedged
Class A (SGD) Hedged
Class A (USD)
Class A2 (CHF) Hedged
Class C (USD)
Shares in issue at 1 January 2019 487,513 1,023,903,366 74,001,679 219,058 1,427,078 956,638,898 1,268,259 23,049,480 Subscriptions during the financial year - 716,570,428 2,715,961 - 26,198 72,524,550 16,398 1,279,834 Redemptions during the financial year (205,409) (1,417,625,661) (60,313,522) (194,663) (1,001,382) (718,307,931) (1,042,541) (15,241,679)
Shares in issue at 31 December 2019 282,104 322,848,133 16,404,118 24,395 451,894 310,855,517 242,116 9,087,635
USD USD USD USD USD USD USD USD Value of Shares issued during 2019 - 999,886,223 5,106,695 - 216,583 88,010,547 153,720 13,081,711 Value of Shares redeemed during 2019 (1,970,529) (1,972,068,627) (114,612,534) (359,055) (7,966,868) (849,231,605) (9,474,121) (153,170,750)
Net Value of Shares issued/redeemed during 2019 (1,970,529) (972,182,404) (109,505,839) (359,055) (7,750,285) (761,221,058) (9,320,401) (140,089,039)
Shares in issue at 1 January 2020 282,104 322,848,133 16,404,118 24,395 451,894 310,855,517 242,116 9,087,635 Subscriptions during the financial year - 358,154,202 198,218 - 3,074 1,205,954 - 73,504 Redemptions during the financial year (36,032) (504,148,021) (8,981,347) (4,879) (320,315) (210,151,186) (173,418) (6,523,515)
Shares in issue at 31 December 2020 246,072 176,854,314 7,620,989 19,516 134,653 101,910,285 68,698 2,637,624
USD USD USD USD USD USD USD USD Value of Shares issued during the financial year - 452,603,054 337,730 - 21,090 1,294,846 - 689,733 Value of Shares redeemed during the financial year (328,153) (630,454,022) (14,938,528) (8,617) (2,278,917) (228,021,728) (1,500,239) (59,321,451)
Net Value of Shares issued/redeemed during the financial year (328,153) (177,850,968) (14,600,798) (8,617) (2,257,827) (226,726,882) (1,500,239) (58,631,718)
Net Assets as at 31 December 2020 CHF 2,065,392 EUR 192,941,680 GBP 9,854,731 RMB 236,293 SGD 1,323,436 USD 110,064,705 CHF 552,199 USD 23,791,779 Net Assets as at 31 December 2019 CHF 2,471,295 EUR 366,977,474 GBP 21,952,617 RMB 298,412 SGD 4,574,161 USD 344,413,015 CHF 2,033,206 USD 85,349,111 Net Assets as at 31 December 2018 CHF 5,038,881 EUR 1,368,139,678 GBP 114,858,006 RMB 3,040,806 SGD 16,571,806 USD 1,207,520,526 CHF 12,571,868 USD 250,352,398

Jupiter Asset Management Series Plc Annual Report and Audited Financial Statements for the financial year ended 31 December 2020
Notes to the Financial Statements for the financial year ended 31 December 2020 (continued)
246
6. Share Capital (continued)
Share Movement (continued)
Jupiter Merian Global Equity Absolute Return Fund (continued)
Share Class
Class I (CHF) Hedged
Class I (EUR) Hedged
Class I (SEK) Hedged
Class I (USD)
Class R (GBP) Hedged
Class U1 (GBP) Hedged
Class U2 (GBP) Hedged
Shares in issue at 1 January 2019 9,906,134 2,437,318,283 52,404,790 866,366,045 1,245,084,861 408,661,682 340,717,077 Subscriptions during the financial year 1,097,447 528,761,462 20,333 118,302,453 196,823,719 350,366,568 357,773,646 Redemptions during the financial year (9,888,165) (2,182,819,052) (20,317,807) (655,873,835) (1,217,514,990) (539,921,483) (328,414,497)
Shares in issue at 31 December 2019 1,115,416 783,260,693 32,107,316 328,794,663 224,393,590 219,106,767 370,076,226
USD USD USD USD USD USD USD Value of Shares issued during 2019 10,711,080 896,726,318 24,146 191,920,958 403,855,114 505,204,983 518,015,255 Value of Shares redeemed during 2019 (94,188,190) (3,647,947,683) (22,544,182) (1,047,880,463) (2,426,931,200) (735,330,096) (453,020,773)
Net Value of Shares issued/redeemed during 2019 (83,477,110) (2,751,221,365) (22,520,036) (855,959,505) (2,023,076,086) (230,125,113) 64,994,482
Shares in issue at 1 January 2020 1,115,416 783,260,693 32,107,316 328,794,663 224,393,590 219,106,767 370,076,226 Subscriptions during the financial year 15,880 415,847,768 - 8,924,552 24,237,852 9,730,169 45,757,011 Redemptions during the financial year (749,072) (987,584,451) (31,891,576) (300,198,234) (185,992,485) (180,153,002) (123,586,197)
Shares in issue at 31 December 2020 382,224 211,524,010 215,740 37,520,981 62,638,957 48,683,934 292,247,040
USD USD USD USD USD USD USD Value of Shares issued during the financial year 145,583 641,180,898 - 13,326,432 44,455,470 12,014,886 59,318,558 Value of Shares redeemed during the financial year (6,750,226) (1,491,858,260) (30,390,400) (444,378,662) (340,199,345) (224,796,038) (156,711,986)
Net Value of Shares issued/redeemed during the financial year (6,604,643) (850,677,362) (30,390,400) (431,052,230) (295,743,875) (212,781,152) (97,393,428)
Net Assets as at 31 December 2020 CHF 3,264,902 EUR 281,523,441 SEK 2,101,544 USD 55,558,954 GBP 88,514,859 GBP 47,859,657 GBP 295,787,025 Net Assets as at 31 December 2019 CHF 9,871,549 EUR 1,077,964,084 SEK 313,722,031 USD 495,658,151 GBP 325,605,691 GBP 221,017,601 GBP 384,018,850 Net Assets as at 31 December 2018 CHF 102,740,479 EUR 3,913,114,504 SEK 595,905,348 USD 1,476,802,722 GBP 2,081,034,837 GBP 474,333,614 GBP 406,271,043

Jupiter Asset Management Series Plc Annual Report and Audited Financial Statements for the financial year ended 31 December 2020
Notes to the Financial Statements for the financial year ended 31 December 2020 (continued)
247
6. Share Capital (continued)
Share Movement (continued) Jupiter Strategic Absolute Return Bond Fund Share Class
Class A (EUR) Hedged
Class A (GBP) Hedged
Class A (USD)
Class F2 (GBP) Hedged]
Class F2 (GBP) Hedged Income
Class I (EUR) Hedged
Class I (USD)
Class R (GBP) Hedged
Shares in issue at 1 January 2019 71,127 292,801 123,824 64,586,330 394,476 2,986,508 6,503 1,089 Subscriptions during the financial year 24,605 79,223 12,453 18,902,344 666 2,097,535 1,895,522 278,898 Redemptions during the financial year (35,994) (40,631) (8,332) (8,251,780) (201,358) (1,516,245) (516,483) (133,029)
Shares in issue at 31 December 2019 59,738 331,393 127,945 75,236,894 193,784 3,567,798 1,385,542 146,958
USD USD USD USD USD USD USD USD Value of Shares issued during 2019 269,360 1,020,180 127,119 25,324,935 789 23,730,283 19,540,620 3,550,053 Value of Shares redeemed during 2019 (390,551) (517,634) (85,470) (10,974,616) (244,281) (17,090,143) (5,412,329) (1,716,576)
Net Value of Shares issued/redeemed during 2019 (121,191) 502,546 41,649 14,350,319 (243,492) 6,640,140 14,128,291 1,833,477
Shares in issue at 1 January 2020 59,738 331,393 127,945 75,236,894 193,784 3,567,798 1,385,542 146,958 Subscriptions during the financial year 40,749 85,840 67,753 14,828,398 2,298 5,247,495 509,435 38,868 Redemptions during the financial year (11,505) (58,523) (35,055) (57,098,180) (3,588) (5,581,545) (1,481,289) (142,082)
Shares in issue at 31 December 2020 88,982 358,710 160,643 32,967,112 192,494 3,233,748 413,688 43,744
USD USD USD USD USD USD USD USD Value of Shares issued during the financial year 481,883 1,203,701 774,852 23,757,463 3,153 64,301,980 5,759,977 532,440 Value of Shares redeemed during the financial year (129,235) (810,981) (391,951) (79,483,983) (4,434) (64,720,218) (16,458,833) (1,891,053)
Net Value of Shares issued/redeemed during the financial year 352,648 392,720 382,901 (55,726,520) (1,281) (418,238) (10,698,856) (1,358,613)
Net Assets as at 31 December 2020 EUR 955,537 GBP 4,015,018 USD 1,863,514 GBP 39,151,578 GBP 197,914 EUR 35,441,882 USD 4,795,061 GBP 486,435 Net Assets as at 31 December 2019 EUR 595,409 GBP 3,425,710 USD 1,356,854 GBP 81,523,464 GBP 184,020 EUR 36,427,478 USD 14,652,417 GBP 1,508,977 Net Assets as at 31 December 2018 EUR 677,850 GBP 2,865,909 USD 1,221,826 GBP 65,916,808 GBP 360,472 EUR 29,108,299 USD 63,701 GBP 10,537

Jupiter Asset Management Series Plc Annual Report and Audited Financial Statements for the financial year ended 31 December 2020
Notes to the Financial Statements for the financial year ended 31 December 2020 (continued)
248
6. Share Capital (continued)
Share Movement (continued) Jupiter Strategic Absolute Return Bond Fund (continued)
Share Class
Class U1 (GBP) Hedged
Class U3 (EUR) Hedged
Class U3 (GBP) Hedged
Class U3 (USD)
Shares in issue at 1 January 2019 1,149,404 25,804 837,529 62,454 Subscriptions during the financial year 317,467 3,846 76,640 22,135 Redemptions during the financial year (1,070,849) (21,785) (298,921) (5,537)
Shares in issue at 31 December 2019 396,022 7,865 615,248 79,052
USD USD USD USD Value of Shares issued during 2019 3,959,753 43,431 991,092 226,398 Value of Shares redeemed during 2019 (13,594,567) (245,215) (3,873,433) (56,030)
Net Value of Shares issued/redeemed during 2019 (9,634,814) (201,784) (2,882,341) 170,368
Shares in issue at 1 January 2020 396,022 7,865 615,248 79,052 Subscriptions during the financial year 335,532 431 14,802 22,009 Redemptions during the financial year (269,839) (2,912) (401,079) (44,198)
Shares in issue at 31 December 2020 461,715 5,384 228,971 56,863
USD USD USD USD Value of Shares issued during the financial year 4,764,265 5,812 199,154 247,154 Value of Shares redeemed during the financial year (3,637,339) (34,562) (5,420,846) (511,223)
Net Value of Shares issued/redeemed during the financial year 1,126,926 (28,750) (5,221,692) (264,069)
Net Assets as at 31 December 2020 GBP 5,140,889 EUR 59,490 GBP 2,586,771 USD 667,416 Net Assets as at 31 December 2019 GBP 4,058,654 EUR 80,387 GBP 6,397,596 USD 844,541 Net Assets as at 31 December 2018 GBP 11,107,955 EUR 251,570 GBP 8,214,819 USD 617,792

Jupiter Asset Management Series Plc Annual Report and Audited Financial Statements for the financial year ended 31 December 2020
Notes to the Financial Statements for the financial year ended 31 December 2020 (continued)
249
6. Share Capital (continued)
Share Movement (continued) Jupiter Europe (ex UK) Smaller Companies Fund Share Class
Class A (EUR)
Class A (GBP)
Class A (USD)
Class A (USD) Hedged
Class C (USD) Hedged
Class I (EUR)
Class I (USD)
Class I (USD) Hedged
Shares in issue at 1 January 2019 4,506 28,427 275,074 70,624 50,276 777,273 301,791 64,560 Subscriptions during the financial year 870 1,109 - - - 2,100 30,558 5,165 Redemptions during the financial year (2,183) (4,907) (245,331) (48,840) - (65,018) (107,049) (69,625)
Shares in issue at 31 December 2019 3,193 24,629 29,743 21,784 50,276 714,355 225,300 100
EUR EUR EUR EUR EUR EUR EUR EUR Value of Shares issued during 2019 12,209 19,277 - - - 26,621 220,789 40,854 Value of Shares redeemed during 2019 (30,077) (81,586) (2,249,342) (367,553) - (918,167) (789,109) (577,573)
Net Value of Shares issued/redeemed during 2019 (17,868) (62,309) (2,249,342) (367,553) - (891,546) (568,320) (536,719)
Shares in issue at 1 January 2020 3,193 24,629 29,743 21,784 50,276 714,355 225,300 100 Subscriptions during the financial year 2,171 2,375 17,534 - - 9,505 48 - Redemptions during the financial year (3,020) (14,843) (18,907) (3,485) - (693,283) (208,622) -
Shares in issue at 31 December 2020 2,344 12,161 28,370 18,299 50,276 30,577 16,726 100
EUR EUR EUR EUR EUR EUR EUR EUR Value of Shares issued during the financial year 27,817 39,943 174,600 - - 146,679 403 - Value of Shares redeemed during the financial year (41,802) (239,123) (164,520) (27,312) - (9,096,493) (1,279,366) -
Net Value of Shares issued/redeemed during the financial year (13,985) (199,180) 10,080 (27,312) - (8,949,814) (1,278,963) -
Net Assets as at 31 December 2020 EUR 35,788 GBP 199,149 USD 357,221 USD 190,067 USD 506,951 EUR 491,140 USD 170,301 USD 1,063 Net Assets as at 31 December 2019 EUR 48,330 GBP 377,923 USD 339,591 USD 221,168 USD 504,544 EUR 11,320,486 USD 2,067,672 USD 1,031 Net Assets as at 31 December 2018 EUR 53,666 GBP 362,272 USD 2,521,025 USD 547,866 USD 391,463 EUR 9,610,124 USD 2,204,974 USD 503,804

Jupiter Asset Management Series Plc Annual Report and Audited Financial Statements for the financial year ended 31 December 2020
Notes to the Financial Statements for the financial year ended 31 December 2020 (continued)
250
6. Share Capital (continued)
Share Movement (continued) Jupiter Europe (ex UK) Smaller Companies Fund (continued)
Share Class
Class R (GBP)
Class R (GBP) Hedged
Class R (GBP) Income
Class U1 (EUR) Income
Class U1 (GBP)
Class U1 (GBP) Hedged
Class U1 (GBP) Income
Class U2 (GBP)
Shares in issue at 1 January 2019 444,012 107,273 16,241 75,735 2,445,104 24,589 1,116,391 10,321,040 Subscriptions during the financial year 85,625 5,535 6,452 3,313 399,816 79,416 347,743 223,834 Redemptions during the financial year (233,582) (40,705) (12,323) (68,655) (822,150) (90,155) (835,472) (5,649,621)
Shares in issue at 31 December 2019 296,055 72,103 10,370 10,393 2,022,770 13,850 628,662 4,895,253
EUR EUR EUR EUR EUR EUR EUR EUR Value of Shares issued during 2019 1,552,230 88,805 108,270 34,838 7,292,101 1,314,303 5,775,320 4,166,419 Value of Shares redeemed during 2019 (4,304,490) (655,653) (193,821) (710,348) (14,945,658) (1,550,974) (13,818,450) (105,836,957)
Net Value of Shares issued/redeemed during 2019 (2,752,260) (566,848) (85,551) (675,510) (7,653,557) (236,671) (8,043,130) (101,670,538)
Shares in issue at 1 January 2020 296,055 72,103 10,370 10,393 2,022,770 13,850 628,662 4,895,253 Subscriptions during the financial year 53,029 - 2,975 750 117,373 21 113,529 4,139 Redemptions during the financial year (177,059) (71,384) (4,504) (11,048) (2,044,846) (5,011) (138,845) (4,889,253)
Shares in issue at 31 December 2020 172,025 719 8,841 95 95,297 8,860 603,346 10,139
EUR EUR EUR EUR EUR EUR EUR EUR Value of Shares issued during the financial year 944,828 - 46,296 8,555 2,073,146 308 1,717,222 61,234 Value of Shares redeemed during the financial year (3,193,517) (960,169) (60,859) (100,564) (31,174,141) (74,200) (2,166,442) (95,605,090)
Net Value of Shares issued/redeemed during the financial year (2,248,689) (960,169) (14,563) (92,009) (29,100,995) (73,892) (449,220) (95,543,856)
Net Assets as at 31 December 2020 GBP 3,161,936 GBP 11,288 GBP 141,403 EUR 1,099 GBP 1,754,459 GBP 144,602 GBP 9,857,007 GBP 188,322 Net Assets as at 31 December 2019 GBP 5,060,860 GBP 1,117,982 GBP 157,596 EUR 120,880 GBP 34,781,899 GBP 223,624 GBP 9,750,256 GBP 85,064,334 Net Assets as at 31 December 2018 GBP 6,257,866 GBP 1,285,481 GBP 208,954 EUR 705,094 GBP 34,592,352 GBP 306,647 GBP 14,602,399 GBP 147,414,378

Jupiter Asset Management Series Plc Annual Report and Audited Financial Statements for the financial year ended 31 December 2020
Notes to the Financial Statements for the financial year ended 31 December 2020 (continued)
251
6. Share Capital (continued)
Share Movement (continued) Jupiter Merian Global Equity Income Fund (IRL) Share Class
Class A (GBP) Income
Class A (USD)
Class A (USD) Income
Class I (EUR)
Class I (EUR) Income
Class I (USD) Income
Class R (GBP)
Class R (GBP) Income
Shares in issue at 1 January 2019 138,753 9,900 147,241 369,193 112,094 196,548 256,216 7,320,303 Subscriptions during the financial year 3,896 - 13,830 101,545 12,044 59,765 160,912 311,779 Redemptions during the financial year (30,395) - (52,432) (140,803) (2,054) (83,429) (151,112) (2,531,767)
Shares in issue at 31 December 2019 112,254 9,900 108,639 329,935 122,084 172,884 266,016 5,100,315
USD USD USD USD USD USD USD USD Value of Shares issued during 2019 70,209 - 160,667 1,259,820 128,925 639,290 3,339,485 5,819,771 Value of Shares redeemed during 2019 (549,568) - (601,805) (1,786,494) (22,156) (918,510) (3,089,093) (47,119,647)
Net Value of Shares issued/redeemed during 2019 (479,359) - (441,138) (526,674) 106,769 (279,220) 250,392 (41,299,876)
Shares in issue at 1 January 2020 112,254 9,900 108,639 329,935 122,084 172,884 266,016 5,100,315 Subscriptions during the financial year 7,436 - 9,878 - - 2,155 49,242 231,574 Redemptions during the financial year (46,358) (9,900) (49,093) (52,304) - (75,512) (137,162) (3,472,797)
Shares in issue at 31 December 2020 73,332 - 69,424 277,631 122,084 99,527 178,096 1,859,092
USD USD USD USD USD USD USD USD Value of Shares issued during the financial year 136,286 - 117,042 - - 25,346 1,055,974 4,588,178 Value of Shares redeemed during the financial year (821,846) (103,415) (538,795) (647,468) - (723,268) (2,849,063) (62,629,554)
Net Value of Shares issued/redeemed during the financial year (685,560) (103,415) (421,753) (647,468) - (697,922) (1,793,089) (58,041,376)
Net Assets as at 31 December 2020 GBP 1,108,047 USD 915,131 USD 3,443,073 EUR 1,273,702 EUR 1,241,098 USD 3,236,954 GBP 915,131 GBP 29,322,123 Net Assets as at 31 December 2019 GBP 1,634,745 USD 104,136 USD 1,336,546 EUR 4,036,378 EUR 1,288,980 USD 1,996,018 GBP 4,511,778 GBP 76,943,831 Net Assets as at 31 December 2018 GBP 1,809,171 USD 87,195 USD 1,568,596 EUR 3,680,258 EUR 994,123 USD 1,949,403 GBP 3,740,024 GBP 98,127,001

Jupiter Asset Management Series Plc Annual Report and Audited Financial Statements for the financial year ended 31 December 2020
Notes to the Financial Statements for the financial year ended 31 December 2020 (continued)
252
6. Share Capital (continued)
Share Movement (continued) Jupiter Merian Global Equity Income Fund (IRL) (continued)
Share Class
Class S (GBP)
Class U1 (GBP)
Class U1 (GBP) Income
Shares in issue at 1 January 2019 935,882 189,305 213,954 Subscriptions during the financial year 13,775 164,515 104,847 Redemptions during the financial year (135,100) (141,163) (147,880)
Shares in issue at 31 December 2019 814,557 212,657 170,921
USD USD USD Value of Shares issued during 2019 281,417 3,427,644 1,940,607 Value of Shares redeemed during 2019 (2,779,389) (2,884,522) (2,725,710)
Net Value of Shares issued/redeemed during 2019 (2,497,972) 543,122 (785,103)
Shares in issue at 1 January 2020 814,557 212,657 170,921 Subscriptions during the financial year 11,400 38,146 19,827 Redemptions during the financial year (108,855) (93,383) (57,499)
Shares in issue at 31 December 2020 717,102 157,420 133,249
USD USD USD Value of Shares issued during the financial year 253,538 831,814 368,138 Value of Shares redeemed during the financial year (2,287,769) (1,901,840) (1,059,927)
Net Value of Shares issued/redeemed during the financial year (2,034,231) (1,070,026) (691,789)
Net Assets as at 31 December 2020 GBP 12,953,015 GBP 2,872,906 GBP 2,091,641 Net Assets as at 31 December 2019 GBP 13,753,072 GBP 3,618,755 GBP 2,566,510 Net Assets as at 31 December 2018 GBP 13,618,282 GBP 2,770,980 GBP 2,854,821

Jupiter Asset Management Series Plc Annual Report and Audited Financial Statements for the financial year ended 31 December 2020
Notes to the Financial Statements for the financial year ended 31 December 2020 (continued)
253
6. Share Capital (continued)
Share Movement (continued) Jupiter Gold & Silver Fund Share Class
Class A (EUR) Class A (GBP) Class A (SGD) Hedged
Class A (USD) Class C (USD) Class I (EUR) Class I (USD) Class R (GBP)
Shares in issue at 1 January 2019 19,891 405,824 - 2,458,201 414,667 113,151 1,853,403 6,094,548 Subscriptions during the financial year 162,706 705,784 - 2,687,851 452,656 258,595 2,231,787 6,077,786 Redemptions during the financial year (124,538) (669,910) - (948,779) (202,954) (102,924) (1,160,152) (4,605,971)
Shares in issue at 31 December 2019 58,059 441,698 - 4,197,273 664,369 268,822 2,925,038 7,566,363
USD USD USD USD USD USD USD USD Value of Shares issued during 2019 1,426,237 11,881,190 - 32,708,457 4,090,923 3,622,835 29,152,630 105,726,224 Value of Shares redeemed during 2019 (1,101,468) (11,443,887) - (11,787,817) (1,733,004) (1,323,145) (13,732,881) (79,107,838)
Net Value of Shares issued/redeemed during 2019 324,769 437,303 - 20,920,640 2,357,919 2,299,690 15,419,749 26,618,386
Shares in issue at 1 January 2020 58,059 441,698 4,197,273 664,369 268,822 2,925,038 7,566,363 Subscriptions during the financial year 290,255 866,247 9,100 9,464,467 421,728 3,396,208 8,836,674 7,965,615 Redemptions during the financial year (159,170) (828,448) - (5,912,341) (478,082) (952,197) (4,306,735) (8,625,094)
Shares in issue at 31 December 2020 189,144 479,497 9,100 7,749,399 608,015 2,712,833 7,454,977 6,906,884
USD USD USD USD USD USD USD USD Value of Shares issued during the financial year 3,629,188 19,822,400 68,078 165,240,899 4,867,130 75,243,477 158,099,476 185,950,940 Value of Shares redeemed during the financial year (1,932,746) (18,020,589) - (103,961,457) (5,591,913) (17,427,244) (71,901,838) (200,630,821)
Net Value of Shares issued/redeemed during the financial year 1,696,442 1,801,811 68,078 61,279,442 (724,783) 57,816,233 86,197,638 (14,679,881)
Net Assets as at 31 December 2020 EUR 2,199,243 GBP 10,015,161 SGD 98,015 USD 155,763,827 USD 8,536,456 EUR 50,595,597 USD 155,579,197 GBP 149,833,186 Net Assets as at 31 December 2019 EUR 528,256 GBP 6,823,627 SGD - USD 60,374,843 USD 6,777,768 EUR 3,893,655 USD 43,349,992 GBP 120,477,473 Net Assets as at 31 December 2018 EUR 126,052 GBP 4,609,715 SGD - USD 25,118,815 USD 3,052,063 EUR 1,133,229 USD 19,364,769 GBP 70,802,320

Jupiter Asset Management Series Plc Annual Report and Audited Financial Statements for the financial year ended 31 December 2020
Notes to the Financial Statements for the financial year ended 31 December 2020 (continued)
254
6. Share Capital (continued)
Share Movement (continued) Jupiter Gold & Silver Fund (continued) Share Class
Class U1 (GBP) Class U2 (GBP) Class U3 (GBP)
Shares in issue at 1 January 2019 6,497,480 3,061,139 291,157 Subscriptions during the financial year 5,389,673 2,528,475 1,148,053 Redemptions during the financial year (3,445,131) (1,533,990) (150,156)
Shares in issue at 31 December 2019 8,442,022 4,055,624 1,289,054
USD USD USD Value of Shares issued during 2019 95,687,213 41,515,143 17,778,990 Value of Shares redeemed during 2019 (60,731,372) (25,810,580) (2,492,402)
Net Value of Shares issued/redeemed during 2019 34,955,841 15,704,563 15,286,588
Shares in issue at 1 January 2020 8,442,022 4,055,624 1,289,054 Subscriptions during the financial year 8,933,440 1,422,618 850,810 Redemptions during the financial year (7,244,703) (3,381,299) (890,765)
Shares in issue at 31 December 2020 10,130,759 2,096,943 1,249,099
USD USD USD Value of Shares issued during the financial year 189,361,175 30,287,166 18,119,155 Value of Shares redeemed during the financial year (163,163,317) (78,530,610) (19,988,097)
Net Value of Shares issued/redeemed during the financial year 26,197,858 (48,243,444) (1,868,942)
Net Assets as at 31 December 2020 GBP 220,804,062 GBP 45,896,877 GBP 24,642,767 Net Assets as at 31 December 2019 GBP 134,932,517 GBP 65,043,743 GBP 18,989,311 Net Assets as at 31 December 2018 GBP 75,696,191 GBP 35,753,993 GBP 3,176,009

Jupiter Asset Management Series Plc Annual Report and Audited Financial Statements for the financial year ended 31 December 2020
Notes to the Financial Statements for the financial year ended 31 December 2020 (continued)
255
6. Share Capital (continued)
Share Movement (continued)
Merian Compass Portfolio 2^ Share Class
Class A (AUD) Hedged
Class A (EUR) Hedged
Class A (GBP) Hedged
Class A (SGD) Hedged
Class A (USD)
Shares in issue at 1 January 2019 129,068 151,239 1,291,858 156,143 466,025 Subscriptions during the financial year - 7,284 75,103 42,501 6,171 Redemptions during the financial year (129,068) (158,523) (1,366,961) (198,644) (472,196)
Shares in issue at 31 December 2019 - - - - -
USD USD USD USD USD
Value of Shares issued during 2019 - 79,958 988,539 323,441 64,259 Value of Shares redeemed during 2019 (937,090) (1,729,471) (17,386,346) (1,492,917) (4,940,741)
Net Value of Shares issued/redeemed during 2019 (937,090) (1,649,513) (16,397,807) (1,169,476) (4,876,482)
Net Assets as at 31 December 2019 AUD - EUR - GBP - SGD - USD - Net Assets as at 31 December 2018 AUD 1,286,585 EUR 1,418,847 GBP 12,433,747 SGD 1,537,244 USD 4,667,272
Merian Compass Portfolio 3^ Share Class
Class A (AUD) Hedged
Class A (EUR) Hedged
Class A (GBP) Hedged
Class A (SGD) Hedged
Class A (USD)
Class N (GBP) Hedged
Class N (SGD) Hedged
Class N (USD)
Shares in issue at 1 January 2019 845,923 1,714,673 7,083,540 2,386,858 5,579,342 731,308 5,531,990 17,281 Subscriptions during the financial year 185,159 62,976 828,039 202,786 107,009 78,234 496,460 267,680 Redemptions during the financial year (1,031,082) (1,777,649) (7,911,579) (2,589,644) (5,686,351) (809,542) (6,028,450) (284,961)
Shares in issue at 31 December 2019 - - - - - - - -
USD USD USD USD USD USD USD USD
Value of Shares issued during 2019 1,414,137 716,884 11,045,877 1,599,310 1,156,799 985,345 3,623,075 2,546,808 Value of Shares redeemed during 2019 (7,746,136) (20,163,099) (104,394,624) (20,240,462) (62,069,134) (10,057,510) (43,970,515) (2,790,065)
Net Value of Shares issued/redeemed during 2019 (6,331,999) (19,446,215) (93,348,747) (18,641,152) (60,912,335) (9,072,165) (40,347,440) (243,257)
Net Assets as at 31 December 2019 AUD - EUR - GBP - SGD - USD - GBP - SGD - USD - Net Assets as at 31 December 2018 AUD 8,590,860 EUR 16,452,460 GBP 69,590,112 SGD 24,046,882 USD 57,223,934 GBP 6,786,758 SGD 52,075,939 USD 159,131
^ The Fund closed in 2019 and there was no units held in 2020.

Jupiter Asset Management Series Plc Annual Report and Audited Financial Statements for the financial year ended 31 December 2020
Notes to the Financial Statements for the financial year ended 31 December 2020 (continued)
256
6. Share Capital (continued)
Share Movement (continued)
Merian Compass Portfolio 4^ Share Class
Class A (AUD) Hedged
Class A (EUR) Hedged
Class A (GBP) Hedged
Class A (SGD) Hedged
Class A (USD)
Class N (GBP) Hedged
Class N (SGD) Hedged
Class N (USD)
Shares in issue at 1 January 2019 878,865 3,294,772 11,871,246 2,811,426 6,948,869 1,465,876 10,388,718 79,880 Subscriptions during the financial year 143,192 44,390 409,918 236,206 80,045 81,432 1,385,146 289,743 Redemptions during the financial year (1,022,057) (3,339,162) (12,281,164) (3,047,632) (7,028,914) (1,547,308) (11,773,864) (369,623)
Shares in issue at 31 December 2019 - - - - - - - -
USD USD USD USD USD USD USD USD
Value of Shares issued during 2019 1,141,430 528,292 5,777,214 1,946,349 908,811 1,028,718 10,258,542 2,748,294 Value of Shares redeemed during 2019 (8,019,026) (39,598,448) (168,888,778) (24,899,747) (80,403,333) (19,447,102) (86,963,749) (3,578,903)
Net Value of Shares issued/redeemed during 2019 (6,877,596) (39,070,156) (163,111,564) (22,953,398) (79,494,522) (18,418,384) (76,705,207) (830,609)
Net Assets as at 31 December 2019 AUD - EUR - GBP - SGD - USD - GBP - SGD - USD - Net Assets as at 31 December 2018 AUD 9,109,259 EUR 32,384,318 GBP 119,092,339 SGD 28,993,113 USD 73,145,795 GBP 13,472,867 SGD 97,010,886 USD 712,691
Merian Compass Portfolio 5^ Share Class
Class A (AUD) Hedged
Class A (EUR) Hedged
Class A (GBP) Hedged
Class A (SGD) Hedged
Class A (USD)
Shares in issue at 1 January 2019 208,248 394,961 2,542,880 174,885 1,048,714 Subscriptions during the financial year - 16,052 39,139 1,242 24,003 Redemptions during the financial year (208,248) (411,013) (2,582,019) (176,127) (1,072,717)
Shares in issue at 31 December 2019 - - - - -
USD USD USD USD USD Value of Shares issued during 2019 - 199,478 556,136 10,722 288,986 Value of Shares redeemed during 2019 (1,706,028) (5,109,348) (37,206,250) (1,506,671) (12,860,664)
Net Value of Shares issued/redeemed during 2019 (1,706,028) (4,909,870) (36,650,114) (1,495,949) (12,571,678)
Net Assets as at 31 December 2019 AUD - EUR - GBP - SGD - USD - Net Assets as at 31 December 2018 AUD 2,224,113 EUR 4,000,207 GBP 26,236,161 SGD 1,852,560 USD 11,381,909
^ The Fund closed in 2019 and there was no units held in 2020.

Jupiter Asset Management Series Plc Annual Report and Audited Financial Statements for the financial year ended 31 December 2020
Notes to the Financial Statements for the financial year ended 31 December 2020 (continued)
257
6. Share Capital (continued)
Share Movement (continued)
Jupiter UK Specialist Equity Fund Share Class
Class A (EUR) Hedged
Class A (GBP)
Class A (USD) Hedged
Class F (EUR) Hedged
Class F (GBP)
Class F (USD) Hedged
Class I (EUR) Hedged
Class I (USD) Hedged
Shares in issue at 1 January 2019 61,167 692,474 5,326,108 1,523,009 15,053,763 753,593 3,803,443 904,619 Subscriptions during the financial year - 6,832 110,779 1,169 269,867 1,053 83,639 177,285 Redemptions during the financial year (3,360) (545,680) (2,252,808) (707,599) (5,055,188) (715,000) (2,010,078) (874,221)
Shares in issue at 31 December 2019 57,807 153,626 3,184,079 816,579 10,268,442 39,646 1,877,004 207,683
GBP GBP GBP GBP GBP GBP GBP GBP Value of Shares issued during 2019 - 81,873 1,053,701 12,872 3,379,582 9,936 851,916 1,753,584 Value of Shares redeemed during 2019 (33,385) (6,426,685) (22,344,083) (7,183,008) (60,629,621) (6,639,701) (20,581,584) (8,090,734)
Net Value of Shares issued/redeemed during 2019 (33,385) (6,344,812) (21,290,382) (7,170,136) (57,250,039) (6,629,765) (19,729,668) (6,337,150)
Shares in issue at 1 January 2020 57,807 153,626 3,184,079 816,579 10,268,442 39,646 1,877,004 207,683 Subscriptions during the financial year - 58,207 301,806 2,391 3,037,054 45,584 462,730 26,340 Redemptions during the financial year (57,807) (29,247) (1,284,283) (43,382) (2,328,812) (13,765) (769,790) (111,165)
Shares in issue at 31 December 2020 - 182,586 2,201,602 775,588 10,976,684 71,465 1,569,944 122,858
GBP GBP GBP GBP GBP GBP GBP GBP Value of Shares issued during the financial year - 796,250 3,201,613 28,204 41,085,063 505,694 5,558,572 285,890 Value of Shares redeemed during the financial year (611,491) (385,908) (13,705,386) (516,553) (30,171,444) (154,295) (8,654,909) (1,140,392)
Net Value of Shares issued/redeemed during the financial year (611,491) 410,342 (10,503,773) (488,349) 10,913,619 351,399 (3,096,337) (854,502)
Net Assets as at 31 December 2020 EUR - GBP 2,566,076 USD 32,571,745 EUR 10,802,623 GBP 159,622,702 USD 1,073,894 EUR 21,159,090 USD 1,785,496 Net Assets as at 31 December 2019 EUR 661,516 GBP 1,897,330 USD 41,217,235 EUR 9,953,603 GBP 130,707,808 USD 515,994 EUR 22,187,976 USD 2,632,125 Net Assets as at 31 December 2018 EUR 664,459 GBP 7,996,470 USD 63,576,688 EUR 17,486,274 GBP 177,806,627 USD 8,990,965 EUR 42,445,281 USD 10,529,950

Jupiter Asset Management Series Plc Annual Report and Audited Financial Statements for the financial year ended 31 December 2020
Notes to the Financial Statements for the financial year ended 31 December 2020 (continued)
258
6. Share Capital (continued)
Share Movement (continued)
Jupiter UK Specialist Equity Fund (continued) Share Class
Class R (GBP) Class X (GBP)
Shares in issue at 1 January 2019 22,116,943 192,226 Subscriptions during the financial year 6,844,389 159,832 Redemptions during the financial year (9,836,286) (62,923)
Shares in issue at 31 December 2019 19,125,046 289,135
GBP GBP Value of Shares issued during 2019 82,689,011 2,103,328 Value of Shares redeemed during 2019 (120,182,723) (813,152)
Net Value of Shares issued/redeemed during 2019 (37,493,712) 1,290,176
Shares in issue at 1 January 2020 19,125,046 289,135 Subscriptions during the financial year 4,425,812 73,888 Redemptions during the financial year (6,972,073) (154,003)
Shares in issue at 31 December 2020 16,578,785 209,020
GBP GBP Value of Shares issued during the financial year 60,472,188 1,038,509 Value of Shares redeemed during the financial year (92,389,804) (2,187,063)
Net Value of Shares issued/redeemed during the financial year (31,917,616) (1,148,554)
Net Assets as at 31 December 2020 GBP 237,853,642 GBP 3,446,262 Net Assets as at 31 December 2019 GBP 240,807,221 GBP 4,014,389 Net Assets as at 31 December 2018 GBP 259,057,240 GBP 2,458,155

Jupiter Asset Management Series Plc Annual Report and Audited Financial Statements for the financial year ended 31 December 2020
Notes to the Financial Statements for the financial year ended 31 December 2020 (continued)
259
6. Share Capital (continued)
Share Movement (continued)
Merian Style Premia Absolute Return Fund** Share Class
Class F (GBP) Hedged
Class F (USD)
Class F2 (GBP) Hedged
Class F2 (USD)
Class I (USD)
Class X (GBP) Hedged
Shares in issue at 1 January 2019 6,374,684 539,065 15,029 100 100 100 Subscriptions during the financial year 2,121 - - - - - Redemptions during the financial year (6,376,805) (539,065) (15,029) (100) (100) (100)
Shares in issue at 31 December 2019 - - - - - -
USD USD USD USD USD USD Value of Shares issued during 2019 26,095 - - - - - Value of Shares redeemed during 2019 (71,735,618) (4,983,151) (181,366) (924) (907) (1,133)
Net Value of Shares issued/redeemed during 2019 (71,709,523) (4,983,151) (181,366) (924) (907) (1,133)
Net Assets as at 31 December 2019 GBP - USD - GBP - USD - USD - GBP - Net Assets as at 31 December 2018 GBP 60,375,943 USD 5,271,289 GBP 142,399 USD 976 USD 961 GBP 955
** The Fund closed in 2019 and there was no units held in 2020.

Jupiter Asset Management Series Plc Annual Report and Audited Financial Statements for the financial year ended 31 December 2020
Notes to the Financial Statements for the financial year ended 31 December 2020 (continued)
260
6. Share Capital (continued)
Share Movement (continued)
Jupiter Financials Contingent Capital Fund Share Class
Class A (EUR) Hedged
Class A (EUR) Hedged Income
Class A (USD)
Class A (USD) Income
Class C (USD) Hedged
Class F (EUR) Hedged Income
Class F (GBP) Hedged Income
Class F (USD) Income
Shares in issue at 1 January 2019 - - 400,684 431,310 230,005 - 12,397,394 10,054,534 Subscriptions during the financial year 192,123 191,897 1,299,352 793,912 - 664,769 3,600,048 6,049,328 Redemptions during the financial year - - (303,679) (123,462) (28,093) - (1,930,949) (4,302,964)
Shares in issue at 31 December 2019 192,123 191,897 1,396,357 1,101,760 201,912 664,769 14,066,493 11,800,898
USD USD USD USD USD USD USD USD Value of Shares issued during 2019 2,155,262 2,148,046 14,303,319 7,573,860 - 7,596,586 44,910,058 61,005,719 Value of Shares redeemed during 2019 - - (3,500,536) (1,212,397) (278,092) - (23,775,848) (43,199,429)
Net Value of Shares issued/redeemed during 2019 2,155,262 2,148,046 10,802,783 6,361,463 (278,092) 7,596,586 21,134,210 17,806,290
Shares in issue at 1 January 2020 192,123 191,897 1,396,357 1,101,760 201,912 664,769 14,066,493 11,800,898 Subscriptions during the financial year 406,131 33,607 837,703 455,372 8,344 257,824 6,657,298 2,990,180 Redemptions during the financial year (131,752) (52,582) (521,305) (761,826) (137,206) (139,170) (18,965,410) (11,856,188)
Shares in issue at 31 December 2020 466,502 172,922 1,712,755 795,306 73,050 783,423 1,758,381 2,934,890
USD USD USD USD USD USD USD USD Value of Shares issued during the financial year 4,776,359 388,112 9,960,083 4,610,485 100,000 2,947,102 78,972,630 30,919,124 Value of Shares redeemed during the financial year (1,398,893) (594,313) (5,450,888) (6,377,703) (1,493,494) (1,636,499) (228,686,391) (120,940,352)
Net Value of Shares issued/redeemed during the financial year 3,377,466 (206,201) 4,509,195 (1,767,218) (1,393,494) 1,310,603 (149,713,761) (90,021,228)
Net Assets as at 31 December 2020 EUR 5,061,479 EUR 1,757,246 USD 21,879,078 USD 8,229,208 USD 885,194 EUR 8,187,231 GBP 17,991,404 USD 32,093,329 Net Assets as at 31 December 2019 EUR 1,994,186 EUR 1,979,344 USD 16,703,588 USD 11,327,084 USD 2,326,315 EUR 6,972,725 GBP 144,966,018 USD 126,825,723 Net Assets as at 31 December 2018 EUR - EUR - USD 3,941,111 USD 3,870,159 USD 2,212,364 EUR - GBP 112,367,502 USD 93,267,655

Jupiter Asset Management Series Plc Annual Report and Audited Financial Statements for the financial year ended 31 December 2020
Notes to the Financial Statements for the financial year ended 31 December 2020 (continued)
261
6. Share Capital (continued)
Share Movement (continued)
Jupiter Financials Contingent Capital Fund (continued)
Share Class
Class I (CHF)
Class I (EUR) Hedged
Class I (EUR) Hedged Income
Class I (USD) Class I (USD) Income
Class R (GBP) Hedged
Shares in issue at 1 January 2019 - - - 10,196 461,633 9,847 Subscriptions during the financial year 18 335,289 31,556 500,472 867,712 160,453 Redemptions during the financial year - (29,710) - (39,504) (81,223) (75,262)
Shares in issue at 31 December 2019 18 305,579 31,556 471,164 1,248,122 95,038
USD USD USD USD USD USD Value of Shares issued during 2019 180 4,135,462 352,142 5,459,380 8,798,699 2,013,078 Value of Shares redeemed during 2019 - (379,406) - (446,168) (798,583) (1,034,454)
Net Value of Shares issued/redeemed during 2019 180 3,756,056 352,142 5,013,212 8,000,116 978,624
Shares in issue at 1 January 2020 18 305,579 31,556 471,164 1,248,122 95,038 Subscriptions during the financial year 2,182 695,296 79,348 728,038 475,189 38,883 Redemptions during the financial year (1,200) (819,020) (2,439) (464,738) (805,428) (83,334)
Shares in issue at 31 December 2020 1,000 181,855 108,465 734,464 917,883 50,587
USD USD USD USD USD USD Value of Shares issued during the financial year 18,800 8,598,991 905,022 8,037,988 4,874,580 499,639 Value of Shares redeemed during the financial year (12,522) (10,449,478) (28,637) (5,530,616) (7,450,904) (1,107,757)
Net Value of Shares issued/redeemed during the financial year 6,278 (1,850,487) 876,385 2,507,372 (2,576,324) (608,118)
Net Assets as at 31 December 2020 CHF 10,789 EUR 2,288,874 EUR 1,129,200 USD 9,373,621 USD 9,939,919 GBP 616,878 Net Assets as at 31 December 2019 CHF 185 EUR 3,655,048 EUR 330,862 USD 5,589,048 USD 13,331,400 GBP 1,106,363 Net Assets as at 31 December 2018 CHF - EUR - EUR - USD 98,723 USD 4,271,034 GBP 95,448

Jupiter Asset Management Series Plc Annual Report and Audited Financial Statements for the financial year ended 31 December 2020
Notes to the Financial Statements for the financial year ended 31 December 2020 (continued)
262
7. Cash and Cash Equivalents, Due to and from Broker, Bank Overdraft and Collateral Received
All monies are held with Citibank N.A. London in the name of Citi Depositary Services Ireland Designated Activity Company as Depositary with the exception of margin cash and collateral cash held with brokers. Due to/from Broker amounts in the Statement of Financial Position is made up of margin cash, spot contracts and collateral pledged. Details of the credit risk associated with the Depositary and the below listed counterparties is set out at Note 11. The following table details the margin cash balances held with brokers as at 31 December 2020: Sub-Fund Amount Broker
Jupiter Merian World Equity Fund USD 49,214 Bank of America Merrill Lynch
Jupiter Pacific Equity Fund USD 56,640 Bank of America Merrill Lynch
Merian European Equity Fund EUR 36,873 Bank of America Merrill Lynch
Merian European Equity Fund EUR 1 Goldman Sachs
Jupiter Merian US Equity Income Fund USD 428,218 Bank of America Merrill Lynch
Jupiter Merian North American Equity Fund (IRL) USD 919,867 Bank of America Merrill Lynch
Merian Global Dynamic Bond Fund USD 949,781 Bank of America Merrill Lynch
Merian Global Dynamic Bond Fund USD (150) Barclays
Merian Global Dynamic Bond Fund USD 148,799 Goldman Sachs
Merian Global Dynamic Bond Fund USD 96,148 Morgan Stanley
Jupiter Emerging Market Debt Fund USD (17) Goldman Sachs
Merian Asian Equity Income Fund USD 56,578 Bank of America Merrill Lynch
Jupiter Local Currency Emerging Market Debt Fund USD 411,345 Morgan Stanley
Jupiter UK Dynamic Equity Fund GBP 173,797 Citibank
Jupiter Merian Global Equity Absolute Return Fund USD 5,144,616 Bank of America Merrill Lynch
Jupiter Merian Global Equity Absolute Return Fund USD 1,025,814 Citibank
Jupiter Merian Global Equity Absolute Return Fund USD (303,868) Goldman Sachs
Jupiter Merian Global Equity Absolute Return Fund USD (7,402,202) Morgan Stanley
Jupiter Strategic Absolute Return Bond Fund USD 740,472 Bank of America Merrill Lynch
Jupiter Strategic Absolute Return Bond Fund USD 108,019 Goldman Sachs
Jupiter Strategic Absolute Return Bond Fund USD 340,476 Morgan Stanley
Jupiter Merian Global Equity Income Fund (IRL) USD 69,228 Bank of America Merrill Lynch
Jupiter UK Specialist Equity Fund GBP (9,609,157) Citibank
Jupiter Financials Contingent Capital Fund USD (517) Bank of America Merrill Lynch
Jupiter Financials Contingent Capital Fund USD (3,570) Goldman Sachs
Company Level USD (10,018,127)
The following table details the collateral cash amounts pledged by the Sub-Funds and are held with brokers as at 31 December 2020:
Sub-Fund Amount Broker
Merian Global Dynamic Bond Fund USD 2,930,000 HSBC
Merian Global Dynamic Bond Fund USD 964,359 JP Morgan
Merian Global Dynamic Bond Fund USD 10,000 Societe Generale
Merian Global Dynamic Bond Fund USD 70,000 Toronto Dominion Bank
Jupiter Emerging Market Debt Fund USD 62,595 JP Morgan
Jupiter Emerging Market Debt Fund USD 60,000 Royal Bank of Scotland
Jupiter Local Currency Emerging Market Debt Fund USD (280,000) Citibank
Jupiter Local Currency Emerging Market Debt Fund USD 280,000 HSBC
Jupiter UK Dynamic Equity Fund GBP 720,000 Citibank Jupiter Merian Global Equity Absolute Return Fund USD 2,320,000 Australia and New Zealand Bank
Jupiter Merian Global Equity Absolute Return Fund USD 8,532,458 Bank of America Merrill Lynch
Jupiter Merian Global Equity Absolute Return Fund USD 3,160,285 Citibank
Jupiter Merian Global Equity Absolute Return Fund USD (3,910,000) Goldman Sachs
Jupiter Merian Global Equity Absolute Return Fund USD 4,670,000 HSBC
Jupiter Merian Global Equity Absolute Return Fund USD 6,033,014 JP Morgan
Jupiter Merian Global Equity Absolute Return Fund USD 29,490,000 Morgan Stanley
Jupiter Merian Global Equity Absolute Return Fund USD 4,000,000 Toronto Dominion Bank

Jupiter Asset Management Series Plc Annual Report and Audited Financial Statements for the financial year ended 31 December 2020
Notes to the Financial Statements for the financial year ended 31 December 2020 (continued)
263
7. Cash and Cash Equivalents, Due to and from Broker, Bank Overdraft and Collateral Received (continued)
The following table details the collateral cash amounts pledged by the Sub-Funds and are held with brokers as at 31 December 2020 (continued):
Sub-Fund Amount Broker
Jupiter Strategic Absolute Return Bond Fund USD 560,000 HSBC Jupiter UK Specialist Equity Fund GBP 26,160,000 Citibank Jupiter Financials Contingent Capital Fund USD 410,000 CIBC Jupiter Financials Contingent Capital Fund USD 1,030,000 HSBC Jupiter Financials Contingent Capital Fund USD 257,744 JP Morgan
Company Level USD 97,395,415
The following table details the collateral cash amounts received from the derivative counterparties as at 31 December 2020:
Sub-Fund Amount Broker
Merian Global Dynamic Bond Fund USD 660,000 HSBC Merian Global Dynamic Bond Fund USD 491,359 JP Morgan Jupiter Emerging Market Debt Fund USD 60,000 Royal Bank of Scotland Jupiter Local Currency Emerging Market Debt Fund USD 600,000 Citibank Jupiter Local Currency Emerging Market Debt Fund USD 1,500,000 HSBC Jupiter Merian Global Equity Absolute Return Fund USD (3,470,621) Goldman Sachs Jupiter Merian Global Equity Absolute Return Fund USD 1,730,564 JP Morgan Jupiter Merian Global Equity Absolute Return Fund USD 5,600,000 Morgan Stanley Jupiter Merian Global Equity Absolute Return Fund USD 1,290,000 Toronto Dominion Bank Jupiter UK Specialist Equity Fund GBP 1,650,000 Citibank Jupiter Financials Contingent Capital Fund USD (260,000) HSBC Jupiter Financials Contingent Capital Fund USD 257,744 JP Morgan
Company Level USD 10,714,596
The following table details the margin cash balances held with brokers as at 31 December 2019: Sub-Fund Amount Broker
Merian World Equity Fund USD 230,820 Bank of America Merrill Lynch
Merian Pacific Equity Fund USD 67,091 Bank of America Merrill Lynch
Merian European Equity Fund EUR 26,364 Bank of America Merrill Lynch
Merian European Equity Fund EUR 1 Goldman Sachs
Merian US Equity Income Fund USD 85,184 Bank of America Merrill Lynch
Merian North American Equity Fund USD 254,302 Bank of America Merrill Lynch
Merian Global Dynamic Bond Fund USD 1,323,169 Bank of America Merrill Lynch
Merian Global Dynamic Bond Fund USD (158) Barclays
Merian Global Dynamic Bond Fund USD 11,952 Credit Suisse
Merian Global Dynamic Bond Fund USD 1,476,247 Goldman Sachs
Merian Global Dynamic Bond Fund USD 670,928 Morgan Stanley
Merian Emerging Market Debt Fund USD 42 Bank of America Merrill Lynch
Merian Asian Equity Income Fund USD 38,856 Bank of America Merrill Lynch
Merian Local Currency Emerging Market Debt Fund USD 79 Bank of America Merrill Lynch
Merian Local Currency Emerging Market Debt Fund USD 8,035 Goldman Sachs
Merian Local Currency Emerging Market Debt Fund USD 1,506,737 Morgan Stanley
Merian UK Dynamic Equity Fund GBP 2,387,453 Citibank
Merian Global Equity Absolute Return Fund USD (46,467,194) Bank of America Merrill Lynch
Merian Global Equity Absolute Return Fund USD 28,251 Citibank
Merian Global Equity Absolute Return Fund USD (2,942,489) Goldman Sachs
Merian Global Equity Absolute Return Fund USD 309,539 Morgan Stanley
Merian Strategic Absolute Return Bond Fund USD 926,955 Bank of America Merrill Lynch
Merian Strategic Absolute Return Bond Fund USD 1,892,266 Goldman Sachs
Merian Strategic Absolute Return Bond Fund USD 1,170,653 Morgan Stanley
Merian Global Equity Income Fund (IRL) USD 122,283 Bank of America Merrill Lynch
Merian UK Specialist Equity Fund GBP (75,829) Citibank
Merian Financials Contingent Capital Fund USD 62,977 Bank of America Merrill Lynch
Merian Financials Contingent Capital Fund USD 2,595,931 Goldman Sachs
Company Level USD (33,535,625)

Jupiter Asset Management Series Plc Annual Report and Audited Financial Statements for the financial year ended 31 December 2020
Notes to the Financial Statements for the financial year ended 31 December 2020 (continued)
264
7. Cash and Cash Equivalents, Due to and from Broker, Bank Overdraft and Collateral Received (continued)
The following table details the collateral cash amounts pledged by the Sub-Funds and are held with brokers as at 31 December 2019:
Sub-Fund Amount Broker
Merian Global Dynamic Bond Fund USD 10,000 Goldman Sachs Merian Global Dynamic Bond Fund USD 330,000 Societe Generale Merian Local Currency Emerging Market Debt Fund USD 250,000 Goldman Sachs Merian Local Currency Emerging Market Debt Fund USD 460,000 Societe Generale Merian Global Equity Absolute Return Fund USD 3,270,000 Australia and New Zealand Bank Merian Global Equity Absolute Return Fund USD 129,205,900 Bank of America Merrill Lynch Merian Global Equity Absolute Return Fund USD 160,000 Citibank Merian Global Equity Absolute Return Fund USD 12,829,000 Goldman Sachs Merian Global Equity Absolute Return Fund USD 6,320,000 HSBC Merian Global Equity Absolute Return Fund USD 69,010,000 Morgan Stanley Merian Global Equity Absolute Return Fund USD 5,210,000 Royal Bank of Scotland Merian Global Equity Absolute Return Fund USD 1,180,000 Toronto Dominion Bank Merian UK Specialist Equity Fund GBP 7,660,000 Citibank
Company Level USD 238,382,485
The following table details the collateral cash amounts received from the derivative counterparties as at 31 December 2019:
Sub-Fund Amount Broker
Merian Local Currency Emerging Market Debt Fund USD 560,000 Citibank Merian Local Currency Emerging Market Debt Fund USD 1,090,000 HSBC Merian Local Currency Emerging Market Debt Fund USD 279,565 JP Morgan Merian Local Currency Emerging Market Debt Fund USD 300,000 Toronto Dominion Bank Merian Global Equity Absolute Return Fund USD 680,000 Danske Merian Financials Contingent Capital Fund USD 2,689,400 Royal Bank of Scotland
Company Level USD 5,598,965
8. Auditor’s Remuneration*
31 December 2020 31 December 2019
Audit services USD 230,663 USD 242,557 Tax advisory services Nil Nil Other assurance services Nil Nil Other non-audit services Nil USD 23,863
*All amounts stated above are exclusive of VAT.

Jupiter Asset Management Series Plc Annual Report and Audited Financial Statements for the financial year ended 31 December 2020
Notes to the Financial Statements for the financial year ended 31 December 2020 (continued)
265
9. Fees and Expenses
Management Fee
The Manager is entitled to receive a percentage fee (the “Management Fee”) in respect of each Class of Share. The Manager is responsible for the payment of the investment management fee to the Investment Manager out of the Management Fee. The Company pays to the Manager, in arrears, a monthly Management Fee. The amount of the Management Fee for each of the Classes of Shares of each Sub-Fund is set out in the Supplement
for the relevant Sub-Fund. The rates applicable at the financial year ended 31 December 2020 are detailed in the table below. The rates are expressed as a percentage per annum of the relevant Sub-Fund’s Net Asset Value. Management Fee charges are structured in such a way that there shall be no double charging of the Management Fee as a result of a Sub-Fund investing in other Sub-Funds of the Company.
Management Fee % of Net Assets Share Class
Sub-Fund Class A, B, C
and N Class
D1 Class
D2 Class
F Class
F1 and F2 Class
I Class
L2 Class
P1 Class
P2 Class
P3
Jupiter China Equity Fund 1.50% - - - - 0.75% - - - - Merian Global Strategic Bond Fund (IRL)* 1.00% - - - - 0.50% - - - - Jupiter Merian World Equity Fund 1.50% 1.35% 0.90% - - 0.75% - - - - Jupiter Pacific Equity Fund 1.50% - - - - 0.75% - - - - Merian European Equity Fund 1.50% - - - - 0.75% - - - - Jupiter Merian US Equity Income Fund 1.50% - - - - 0.75% - - - - Jupiter Merian North American Equity Fund (IRL) 1.50% - - - - 0.75% - 0.80% 0.15% - Merian Global Dynamic Bond Fund 1.00% - - - - 0.50% - - - - Jupiter Emerging Market Debt Fund 1.50% - - - - 0.75% - - - - Merian European Best Ideas Fund^^ 1.50% - - - - 0.75% - - - - Merian Investment Grade Corporate Bond Fund*** 1.00% - - - - 0.50% - - - - Jupiter Global Emerging Markets Focus Fund 1.50% - - - - 0.75% - - - - Merian Asian Equity Income Fund 1.50% - - - - 0.75% - - - - Jupiter Local Currency Emerging Market Debt Fund 1.75% - - - - 0.85% - - - - Jupiter UK Alpha Fund (IRL) 1.50% - - 0.525% - 0.75% - - - - Jupiter UK Smaller Companies Focus Fund 1.50% - - - - - - - - - Jupiter UK Dynamic Equity Fund 1.50% - - - - 1.00% - - - - Jupiter Merian Global Equity Absolute Return Fund 1.50% - - - - 0.75% - - - - Jupiter Strategic Absolute Return Bond Fund 0.80% - - - 0.50% 0.40% 0.70% - - - Jupiter Europe (ex UK) Smaller Companies Fund 1.50% - - - - 0.75% - - - - Jupiter Merian Global Equity Income Fund (IRL) 1.50% - - - - 0.75% - - - - Jupiter Gold & Silver Fund 1.50% - - - - 0.75% - - - -
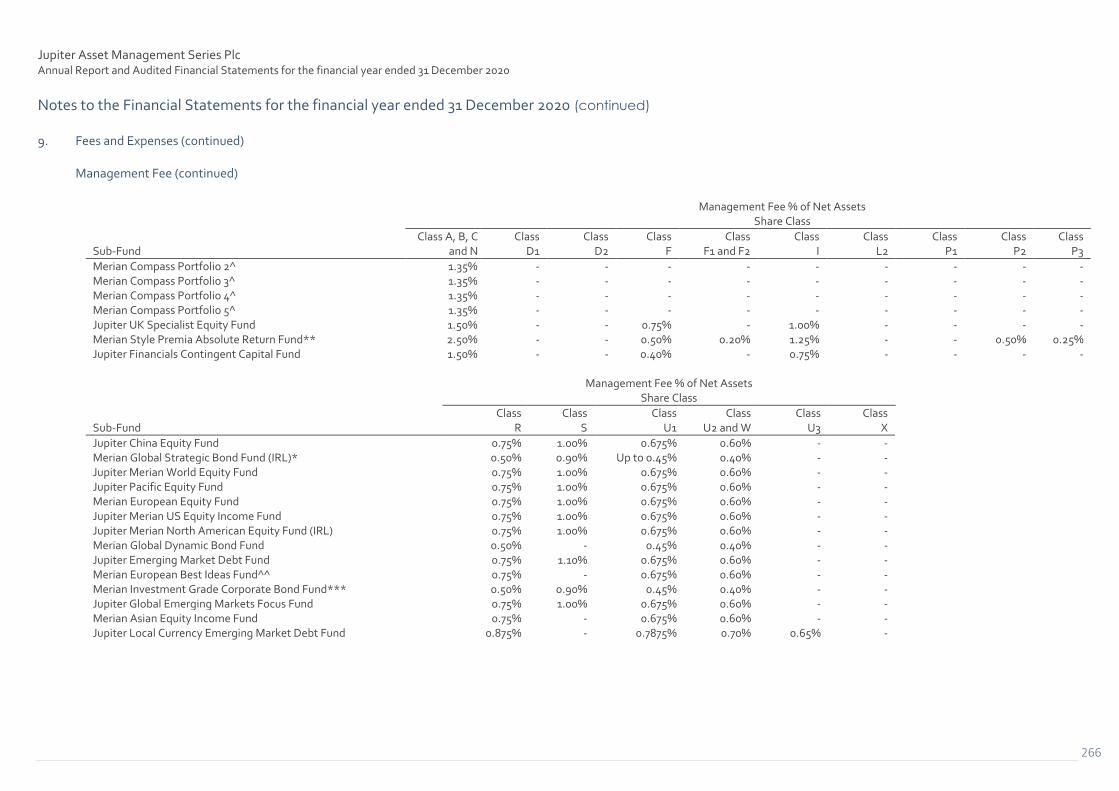
Jupiter Asset Management Series Plc Annual Report and Audited Financial Statements for the financial year ended 31 December 2020
Notes to the Financial Statements for the financial year ended 31 December 2020 (continued)
266
9. Fees and Expenses (continued)
Management Fee (continued)
Management Fee % of Net Assets Share Class
Sub-Fund Class A, B, C
and N Class
D1 Class
D2 Class
F Class
F1 and F2 Class
I Class
L2 Class
P1 Class
P2 Class
P3
Merian Compass Portfolio 2^ 1.35% - - - - - - - - - Merian Compass Portfolio 3^ 1.35% - - - - - - - - - Merian Compass Portfolio 4^ 1.35% - - - - - - - - - Merian Compass Portfolio 5^ 1.35% - - - - - - - - - Jupiter UK Specialist Equity Fund 1.50% - - 0.75% - 1.00% - - - - Merian Style Premia Absolute Return Fund** 2.50% - - 0.50% 0.20% 1.25% - - 0.50% 0.25% Jupiter Financials Contingent Capital Fund 1.50% - - 0.40% - 0.75% - - - -
Management Fee % of Net Assets Share Class
Sub-Fund Class
R Class
S Class
U1 Class
U2 and W Class
U3 Class
X
Jupiter China Equity Fund 0.75% 1.00% 0.675% 0.60% - - Merian Global Strategic Bond Fund (IRL)* 0.50% 0.90% Up to 0.45% 0.40% - - Jupiter Merian World Equity Fund 0.75% 1.00% 0.675% 0.60% - - Jupiter Pacific Equity Fund 0.75% 1.00% 0.675% 0.60% - - Merian European Equity Fund 0.75% 1.00% 0.675% 0.60% - - Jupiter Merian US Equity Income Fund 0.75% 1.00% 0.675% 0.60% - - Jupiter Merian North American Equity Fund (IRL) 0.75% 1.00% 0.675% 0.60% - - Merian Global Dynamic Bond Fund 0.50% - 0.45% 0.40% - - Jupiter Emerging Market Debt Fund 0.75% 1.10% 0.675% 0.60% - - Merian European Best Ideas Fund^^ 0.75% - 0.675% 0.60% - - Merian Investment Grade Corporate Bond Fund*** 0.50% 0.90% 0.45% 0.40% - - Jupiter Global Emerging Markets Focus Fund 0.75% 1.00% 0.675% 0.60% - - Merian Asian Equity Income Fund 0.75% - 0.675% 0.60% - - Jupiter Local Currency Emerging Market Debt Fund 0.875% - 0.7875% 0.70% 0.65% -

Jupiter Asset Management Series Plc Annual Report and Audited Financial Statements for the financial year ended 31 December 2020
Notes to the Financial Statements for the financial year ended 31 December 2020 (continued)
267
9. Fees and Expenses (continued)
Management Fee (continued)
Management Fee % of Net Assets Share Class
Sub-Fund Class
R Class
S Class
U1 Class
U2 and W Class
U3 Class
X
Jupiter UK Alpha Fund (IRL) 0.75% - 0.675% 0.60% - - Jupiter UK Smaller Companies Focus Fund 0.75% - 0.675% - - - Jupiter UK Dynamic Equity Fund 1.00% - - - - - Jupiter Merian Global Equity Absolute Return Fund 0.75% - 0.675% 0.60% - - Jupiter Strategic Absolute Return Bond Fund 0.40% - 0.36% 0.32% 0.25% - Jupiter Europe (ex UK) Smaller Companies Fund 0.75% - 0.675% 0.60% - - Jupiter Merian Global Equity Income Fund (IRL) 0.75% 1.00% 0.675% 0.60% - - Jupiter Gold & Silver Fund 0.75% - 0.675% 0.60% 0.15% - Merian Compass Portfolio 2^ 0.75% - - - - - Merian Compass Portfolio 3^ 0.75% - - - - - Merian Compass Portfolio 4^ 0.75% - - - - - Merian Compass Portfolio 5^ 0.75% - - - - - Jupiter UK Specialist Equity Fund 1.00% - - - - - Merian Style Premia Absolute Return Fund** 1.25% - 1.125% 1.00% - - Jupiter Financials Contingent Capital Fund 0.75% - 0.675% 0.60% - -
The Management Fee for each Sub-Fund shall accrue on each Dealing Day. The Company will not pay the out-of pocket expenses of the Manager. Out of the investment management fee paid by the Manager to the Investment Manager, the Investment Manager shall pay the fees and commissions payable to the relevant Investment Adviser and transition managers. The Investment Manager shall also pay those reasonable out-of-pocket expenses which the Investment Manager has previously agreed with the relevant Investment Adviser to pay out of its investment management fee.

Jupiter Asset Management Series Plc Annual Report and Audited Financial Statements for the financial year ended 31 December 2020
Notes to the Financial Statements for the financial year ended 31 December 2020 (continued)
268
9. Fees and Expenses (continued)
Management Fee (continued)
Sub-Fund CCY
Expense year ended
31 December 2020
Payable as at
31 December 2020
Expense year ended
31 December 2019
Payable as at
31 December 2019
Jupiter China Equity Fund USD 718,973 65,267 837,270 73,486 Merian Global Strategic Bond Fund (IRL)* USD - - 19,295 - Jupiter Merian World Equity Fund USD 2,601,047 208,726 4,061,907 307,925 Jupiter Pacific Equity Fund USD 1,056,827 86,654 1,312,005 113,603 Merian European Equity Fund EUR 602,086 50,286 532,625 63,542 Jupiter Merian US Equity Income Fund USD 1,526,236 113,493 2,364,992 185,872 Jupiter Merian North American Equity Fund (IRL) USD 5,584,220 406,498 9,490,778 689,205 Merian Global Dynamic Bond Fund USD 1,901,085 189,698 1,724,780 135,831 Jupiter Emerging Market Debt Fund USD 1,466,560 110,964 2,459,115 159,335 Merian European Best Ideas Fund^^ EUR - - 402,208 - Merian Investment Grade Corporate Bond Fund*** USD - - 64,492 - Jupiter Global Emerging Markets Focus Fund USD 1,472,571 139,597 1,385,005 124,565 Merian Asian Equity Income Fund USD 715,099 29,453 2,909,906 177,447 Jupiter Local Currency Emerging Market Debt Fund USD 3,436,082 211,117 4,758,399 450,719 Jupiter UK Alpha Fund (IRL) GBP 289,699 22,610 479,055 36,871 Jupiter UK Smaller Companies Focus Fund GBP 2,993,178 198,915 3,631,866 293,915 Jupiter UK Dynamic Equity Fund GBP 4,610,706 375,510 5,214,743 467,731 Jupiter Merian Global Equity Absolute Return Fund USD 17,299,667 1,040,857 76,791,408 3,248,270 Jupiter Strategic Absolute Return Bond Fund USD 540,274 41,340 749,553 72,947 Merian Monthly Income High Yield Bond Fund(a) USD - - - - Jupiter Europe (ex UK) Smaller Companies Fund EUR 290,458 11,484 1,506,498 99,561 Jupiter Merian Global Equity Income Fund (IRL) USD 774,626 53,580 1,293,907 100,478 Jupiter Gold & Silver Fund USD 5,927,070 659,122 3,031,313 348,933 Merian Compass Portfolio 2^ USD - - 125,105 - Merian Compass Portfolio 3^ USD - - 1,481,136 - Merian Compass Portfolio 4^ USD - - 2,414,929 - Merian Compass Portfolio 5^ USD - - 326,266 - Jupiter UK Specialist Equity Fund GBP 3,956,058 355,181 4,828,516 364,990 Merian Style Premia Absolute Return Fund** USD - - 167,125 - Jupiter Financials Contingent Capital Fund USD 1,439,561 87,110 1,490,052 171,522
Company Level USD 62,780,392 4,820,737 140,106,174 8,084,577
Performance Fee Jupiter Merian North American Equity Fund (IRL) The Investment Manager may be entitled to a performance fee out of the Jupiter Merian North American Equity Fund (IRL)’s assets. With respect to the Jupiter Merian North American Equity Fund (IRL), the performance fee is only applicable to the following Share Classes: Class P1 (USD) Accumulation, Class P1 (GBP) Hedged Accumulation, Class P1 (SGD) Hedged Accumulation, Class P1 (CHF) Hedged Accumulation, Class P1 (EUR) Hedged Accumulation, Class P2 (USD) Accumulation, Class P2 (GBP) Hedged Accumulation, Class P2 (SGD) Hedged Accumulation Class P2 (EUR) Hedged Accumulation, Class P2 (GBP) Income, Class P2 (USD) Income and Class P2 (CHF) Hedged Accumulation. The Performance Fee will be calculated and accrued daily and will be payable annually in arrears in respect of each Performance Period (“Performance Period of the Jupiter Merian North American Equity Fund (IRL)”). A Performance Period of the Jupiter Merian North American Equity Fund (IRL) will comprise of each successive twelve month period ending on 31 December. The “Index” is the MSCI North America Index (TICKER: MXNA). “Valuation Point” shall be 12.00 noon (Irish time) on each Dealing Day.

Jupiter Asset Management Series Plc Annual Report and Audited Financial Statements for the financial year ended 31 December 2020
Notes to the Financial Statements for the financial year ended 31 December 2020 (continued)
269
9. Fees and Expenses (continued) Performance Fee (continued) Jupiter Merian North American Equity Fund (IRL) (continued) “The Index Performance” in respect of a Performance Period of the Jupiter Merian North American Equity Fund (IRL) is the difference between the level of the Index calculated at the Valuation Point on the last Business Day of the previous Performance Period of the Jupiter Merian North American Equity Fund (IRL) and the level of the Index calculated at the Valuation Point on the last Business Day of the relevant Performance Period of the Jupiter Merian North American Equity Fund (IRL), expressed as a percentage. The “Sub-Fund Performance” in respect of the first Performance Period of the Jupiter Merian North American Equity Fund (IRL) is the difference between the opening Net Asset Value per Share and the Net Asset Value per Share at the Valuation Point on the last Business Day of the Performance Period of the Jupiter Merian North American Equity Fund (IRL), expressed as a percentage. For each Performance Period of the Jupiter Merian North American Equity Fund (IRL) thereafter, the Sub-Fund Performance is the difference between the Net Asset Value per Share at the Valuation Point on the last Business Day of the previous Performance Period of the Jupiter Merian North American Equity Fund (IRL) and the Net Asset Value per Share at the Valuation Point on the last Business Day of the relevant Performance Period of the Jupiter Merian North American Equity Fund (IRL), expressed as a percentage. Where a fair value adjustment has been made to the Net Asset Value per Share of the Jupiter Merian North American Equity Fund (IRL) then this will be excluded for the purposes of the calculation of the Performance Fee. For hedged share classes the Index will be the relevant hedged version of the Index. For all share classes, the Index will be priced at the Index valuation point according to the index provider’s pricing methodology. The exchange rates used in calculating the net asset values for all share classes will be the prevailing exchange rates at the Fund’s Valuation Point. In calculating the Net Asset Value per Share of each Class for Performance Fee purposes no deduction is made on account of Performance Fees accrued in the Performance Period of the Jupiter Merian North American Equity Fund (IRL) and any net income distributed to Shareholders in respect of the Performance Period of the Jupiter Merian North American Equity Fund (IRL) is added back. The “Percentage Outperformance” in respect of Performance Periods of the Jupiter Merian North American Equity Fund (IRL) where Sub-Fund Performance is greater than Index Performance is the arithmetical difference between Sub-Fund Performance and Index Performance, expressed as a percentage. In respect of Performance Periods of the Jupiter Merian North American Equity Fund (IRL) where Sub-Fund Performance is less than Index Performance, such underperformance, being the arithmetical difference between Sub-Fund Performance and Index Performance expressed in percentage points, will be carried forward and no Performance Fee will be payable in any subsequent Performance Period of the Jupiter Merian North American Equity Fund (IRL) unless Sub-Fund Performance measured against Index Performance has recovered any accumulated percentage underperformance for previous periods. In the Performance Period of the Jupiter Merian North American Equity Fund (IRL) in which any accumulated percentage underperformance is recovered, only that part of the Percentage Outperformance for such period as exceeds the accumulated percentage underperformance carried forward is taken into account for the purposes of calculating the performance fee payable for the Performance Period of the Jupiter Merian North American Equity Fund (IRL). The amount of Performance Fee payable in respect of each Share is a US Dollar amount equivalent to the opening Net Asset Value per Share on the first Business Day of the Performance Period of the Jupiter Merian North American Equity Fund (IRL) x Percentage Outperformance x 20%. and is payable on the average number of Shares in issue during the Performance Period of the Jupiter Merian North American Equity Fund (IRL). For the purposes of the first calculation of the Performance Fee, the initial offer price in respect of each Share Class was taken as the opening Net Asset Value. The first Performance Period will begin on the date on which the first shares of the relevant share classes are issued and will end on 31 December of the same year.

Jupiter Asset Management Series Plc Annual Report and Audited Financial Statements for the financial year ended 31 December 2020
Notes to the Financial Statements for the financial year ended 31 December 2020 (continued)
270
9. Fees and Expenses (continued) Performance Fee (continued)
Jupiter Merian North American Equity Fund (IRL) (continued) The Performance Fee accrues and is taken into account in the calculation of the Net Asset Value per Share on a daily basis.
The amount of the Performance Fee will be calculated by the Administrator. The calculation of the Performance Fee shall be verified by the Depositary.
The Investment Manager may, at its discretion, waive the Performance Fee payable in respect of a Performance Period of the Jupiter Merian North American Equity Fund (IRL).
Performance Fees are payable on net realised and net unrealised gains and losses as at the end of each Performance Period of the Jupiter Merian North American Equity Fund (IRL) and as a result, Performance Fees may be paid on unrealised gains which may subsequently never be realised.
Performance Fees may also be payable during a Performance Period of the Jupiter Merian North American Equity Fund (IRL) where there is a decline in the Net Asset Value per Share. During the year, the prospectus was updated to reflect performance fees changing to annual crystallisation effective from 1 January 2020. The Performance Period for each of the applicable Sub-Funds will end on 31 December each year. Performance Fees were USD Nil for the financial year ended 31 December 2020 (31 December 2019: USD Nil) and the amount accrued at the financial year ended 31 December 2020 was USD Nil (31 December 2019: USD Nil).
Jupiter UK Smaller Companies Focus Fund With respect to the Jupiter UK Smaller Companies Focus Fund, the Investment Manager may be entitled to a performance fee out of the Jupiter UK Smaller Companies Focus Fund’s assets. With respect to the Jupiter UK Smaller Companies Focus Fund, the performance fee is only applicable to the following share classes: Class A (GBP) Income Shares, Class R (GBP) Income Shares and Class U1 (GBP) Income Shares. The Performance Fee will be calculated and accrued daily and will be payable annually in arrears in respect of each Performance Period (“Performance Period of the Jupiter UK Smaller Companies Focus Fund”). A Performance Period of the Jupiter UK Smaller Companies Focus Fund will comprise of each successive twelve month period ending on 31 December. “The Index” is the Numis Smaller Companies Index excluding Investment Companies (TICKER: NSCXEITR). “The Index Performance” in respect of a Performance Period of the Jupiter UK Smaller Companies Focus Fund is the difference between the opening level of the Index on the first Business Day and on the closing level of the Index on the last Business Day of the Performance Period of the Jupiter UK Smaller Companies Focus Fund, expressed as a percentage. The “Sub-Fund Performance” in respect of a Performance Period of the Jupiter UK Smaller Companies Focus Fund is the difference between the opening Net Asset Value per Share on the first Business Day of the relevant Performance Period of the Jupiter UK Smaller Companies Focus Fund, which reflects the charging of a Performance Fee, if any, in respect of the previous Performance Period of the Jupiter UK Smaller Companies Focus Fund, and the Net Asset Value per Share (before the deduction of any unrealised Performance Fee) on the last Business Day of the relevant Performance Period of the Jupiter UK Smaller Companies Focus Fund, expressed as a percentage. In calculating the Net Asset Value per Share for Performance Fee purposes no deduction is made on account of Performance Fees accrued in the Performance Period of the Jupiter UK Smaller Companies Focus Fund and any net income distributed to Shareholders in respect of the period is added back. The “Percentage Outperformance” in respect of Performance Periods of the Jupiter UK Smaller Companies Focus Fund where Sub-Fund Performance is greater than Index Performance is the arithmetical difference between Sub-Fund Performance and Index Performance, expressed as a percentage.

Jupiter Asset Management Series Plc Annual Report and Audited Financial Statements for the financial year ended 31 December 2020
Notes to the Financial Statements for the financial year ended 31 December 2020 (continued)
271
9. Fees and Expenses (continued) Performance Fee (continued) Jupiter UK Smaller Companies Focus Fund (continued) In respect of Performance Periods of the Jupiter UK Smaller Companies Focus Fund where Sub-Fund Performance is less than Index Performance, such underperformance, being the arithmetical difference between Sub-Fund Performance and Index Performance expressed in percentage points, will be carried forward and no Performance Fee will be payable in any subsequent Performance Period of the Jupiter UK Smaller Companies Focus Fund unless Sub-Fund Performance measured against Index Performance has recovered any accumulated percentage underperformance for previous Performance Periods of the Jupiter UK Smaller Companies Focus Fund. In the Performance Period of the Jupiter UK Smaller Companies Focus Fund in which any accumulated percentage underperformance is recovered, only that part of the Percentage Outperformance for such period as exceeds the accumulated percentage underperformance carried forward is taken into account for the purposes of calculating the performance fee payable for the Performance Period of the Jupiter UK Smaller Companies Focus Fund. The amount of Performance Fee payable in respect of each Share is a Sterling amount equivalent to the opening Net Asset Value per Share on the first Business Day of the Performance Period of the Jupiter UK Smaller Companies Focus Fund x Percentage Outperformance x 10% and is payable on the average number of Shares in issue during the Performance Period of the Jupiter UK Smaller Companies Focus Fund. Furthermore the amount of Performance Fee payable in respect of a Performance Period of the Jupiter UK Smaller Companies Focus Fund is subject to a maximum amount (the “Cap”). The Cap is a Sterling amount equivalent to the opening Net Asset Value per Share on the first Business Day of the Performance Period of the Jupiter UK Smaller Companies Focus Fund x opening number of Shares in issue on the first Business Day of the Performance Period of the Jupiter UK Smaller Companies Focus Fund x 0.75%. The Performance Fee accrues and is taken into account in the calculation of the Net Asset Value per Share on a daily basis. The amount of the Performance Fee will be calculated by the Administrator. The calculation of the Performance Fee shall be verified by the Depositary. The calculation of the Performance Fee shall also be reviewed by the Auditors as part of the annual audit of the Company. The Investment Manager may, at its discretion, waive the Performance Fee payable in respect of a Performance Period of the Jupiter UK Smaller Companies Focus Fund. Performance Fees are payable on net realised and net unrealised gains and losses as at the end of each Performance Period of the Jupiter UK Smaller Companies Focus Fund and as a result, Performance Fees may be paid on unrealised gains which may subsequently never be realised. Performance Fees may also be payable during a Performance Period of the Jupiter UK Smaller Companies Focus Fund where there is a decline in the Net Asset Value per Share. During the year, the prospectus was updated to reflect performance fees changing to annual crystallisation effective from 1 January 2020. The Performance Period for each of the applicable Sub-Funds will end on 31 December each year. Performance Fees were GBP 4,034,391 for the financial year ended 31 December 2020 (31 December 2019: GBP Nil) and the amount accrued at the financial year ended 31 December 2020 was GBP 4,034,391 (31 December 2019: GBP Nil). Jupiter UK Dynamic Equity Fund The Investment Manager may be entitled to a performance fee (a portion of which may be payable to the Investment Adviser) out of the Jupiter UK Dynamic Equity Fund’s assets. With respect to the Jupiter UK Dynamic Equity Fund, the performance fee is only applicable to the following Share Classes: Class I (EUR) Hedged Accumulation Shares, Class A (GBP) Income Shares and Class R (GBP) Income Shares.

Jupiter Asset Management Series Plc Annual Report and Audited Financial Statements for the financial year ended 31 December 2020
Notes to the Financial Statements for the financial year ended 31 December 2020 (continued)
272
9. Fees and Expenses (continued) Performance Fee (continued)
Jupiter UK Dynamic Equity Fund (continued) The Performance Fee will be calculated and accrued daily and will be payable annually in arrears in respect of each Performance Period (“Performance Period of the Jupiter UK Dynamic Equity Fund”). A Performance Period of the Jupiter UK Dynamic Equity Fund will comprise of each successive twelve month period ending on 31 December. “The Index” is the FTSE 250 Index Excluding Investment Trusts (TICKER: MCIXM). “The Index Performance” in respect of a Performance Period of the Jupiter UK Dynamic Equity Fund, is the difference between the level of the Index calculated at the Valuation Point on the last Business Day of the previous Performance Period of the Jupiter UK Dynamic Equity Fund and the level of the Index calculated at the Valuation Point on the last Business Day of the relevant Performance Period of the Jupiter UK Dynamic Equity Fund, expressed as a percentage. The “Sub-Fund Performance” in respect of the first Performance Period of the Jupiter UK Dynamic Equity Fund is the difference between the opening Net Asset Value per Share and the Net Asset Value per Share at the Valuation Point on the last Business Day of the Performance Period of the Jupiter UK Dynamic Equity Fund, expressed as a percentage. For each Performance Period of the Jupiter UK Dynamic Equity Fund thereafter, the Sub-Fund Performance is the difference between the Net Asset Value per Share at the Valuation Point on the last Business Day of the previous Performance Period of the Jupiter UK Dynamic Equity Fund and the Net Asset Value per Share at the Valuation Point on the last Business Day of the relevant Performance Period of the Jupiter UK Dynamic Equity Fund, expressed as a percentage. In calculating the Net Asset Value per Share of each Class for Performance Fee purposes no deduction is made on account of Performance Fees accrued in the Performance Period of the Jupiter UK Dynamic Equity Fund and any net income distributed to Shareholders in respect of the Performance Period of the Jupiter UK Dynamic Equity Fund is added back. The “Percentage Outperformance” in respect of Performance Periods of the Jupiter UK Dynamic Equity Fund where Sub-Fund Performance is greater than Index Performance is the arithmetical difference between Sub-Fund Performance and Index Performance, expressed as a percentage. In respect of Performance Periods of the Jupiter UK Dynamic Equity Fund where Sub-Fund Performance is less than Index Performance, such underperformance, being the arithmetical difference between Sub-Fund Performance and Index Performance expressed in percentage points, will be carried forward and no Performance Fee will be payable in any subsequent Performance Period of the Jupiter UK Dynamic Equity Fund unless Sub-Fund Performance measured against Index Performance has recovered any accumulated percentage underperformance for previous periods. In the Performance Period of the Jupiter UK Dynamic Equity Fund in which any accumulated percentage underperformance is recovered, only that part of the Percentage Outperformance for such period as exceeds the accumulated percentage underperformance carried forward is taken into account for the purposes of calculating the performance fee payable for the Performance Period of the Jupiter UK Dynamic Equity Fund. The amount of Performance Fee payable in respect of each Share is a Sterling amount equivalent to the opening Net Asset Value per Share on the first Business Day of the Performance Period of the Jupiter UK Dynamic Equity Fund x Percentage Outperformance x 20% and is payable on the average number of Shares in issue during the Performance Period of the Jupiter UK Dynamic Equity Fund. For the purposes of the first calculation of the Performance Fee, the initial offer price in respect of each Share Class was taken as the opening Net Asset Value. The Performance Fee accrues and is taken into account in the calculation of the Net Asset Value per Share on a daily basis.

Jupiter Asset Management Series Plc Annual Report and Audited Financial Statements for the financial year ended 31 December 2020
Notes to the Financial Statements for the financial year ended 31 December 2020 (continued)
273
9. Fees and Expenses (continued)
Performance Fee (continued)
Jupiter UK Dynamic Equity Fund (continued) The amount of the Performance Fee will be calculated by the Administrator. The calculation of the Performance Fee shall be verified by the Depositary. The calculation of the Performance Fee shall also be reviewed by the Auditors as part of the annual audit of the Company.
The Investment Manager may, at its discretion, waive the Performance Fee payable in respect of a Performance Period of the Jupiter UK Dynamic Equity Fund.
Performance Fees are payable on net realised and net unrealised gains and losses as at the end of each Performance Period of the Jupiter UK Dynamic Equity Fund and as a result, Performance Fees may be paid on unrealised gains which may subsequently never be realised.
Performance Fees may also be payable during a Performance Period of the Jupiter UK Dynamic Equity Fund where there is a decline in the Net Asset Value per Share.
During the year, the prospectus was updated to reflect performance fees changing to annual crystallisation effective from 1 January 2020. The Performance Period for each of the applicable Sub-Funds will end on 31 December each year. Performance Fees were GBP 15,762,675 for the financial year ended 31 December 2020 (31 December 2019: GBP Nil) and the amount accrued at the financial year ended 31 December 2020 was GBP 15,762,675 (31 December 2019: GBP Nil).
Jupiter Merian Global Equity Absolute Return Fund The Investment Manager may be entitled to a performance fee (a portion of which may be payable to the Investment Adviser) out of the Jupiter Merian Global Equity Absolute Return Fund’s assets. The Performance Fee is applicable to all Share Classes with the exception of: Class A (CHF) Hedged Accumulation Shares and Class X (GBP) Hedged Accumulation Shares.
The Performance Fee will accrue on a daily basis and the accrual will be reflected in the Net Asset Value and will be payable annually in arrears in respect of each Performance Period which will comprise of each successive twelve month period ending on 31 December (a “Performance Period of the Jupiter Merian Global Equity Absolute Return Fund”).
The Performance Fee as at the end of each Performance Period of the Jupiter Merian Global Equity Absolute Return Fund shall be equal in aggregate to 20 per cent of the amount by which any increase in the Net Asset Value per Share of each Class during the Performance Period of the Jupiter Merian Global Equity Absolute Return Fund exceeds the “Hurdle Rate”, subject to the Net Asset Value High Water Mark (as defined below), multiplied by the weighted average number of total Shares in issue of each Class on each Dealing Day during the Performance Period of the Jupiter Merian Global Equity Absolute Return Fund.
The Hurdle Rate will be the average (1) Bank of England Base Rate for the GBP Share Classes, (2) ECB Main Refinancing Operations Rate for the EUR Share Classes, (3) Federal Reserve Funds Target Rate for the USD Share Classes, (4) 3 month Swiss franc (CHF) LIBOR interest rate for the CHF Share Classes, (5) Risk bank Repo rate for the SEK Share Classes, (6) Singapore Overnight Rate Average for the SGD Share Classes, and (7) People's Bank of China one-year loan prime rate for the RMB Share Classes during the Performance Period of the Jupiter Merian Global Equity Absolute Return Fund.
The initial issue price as set out in the section of the Supplement headed “Initial Offer Period and Subscription Price” was the starting price for the calculation of the first performance fee payable of any Share Class to which a performance fee is applicable. The first Performance Period for each new share class will begin on the date on which the first shares of the class are issued and will end on 31 December of the same year.
In calculating the Net Asset Value per Share of each Class for Performance Fee purposes, no deduction is made on account of Performance Fees accrued in the Performance Period of the Jupiter Merian Global Equity Absolute Return Fund and any net income distributed to Shareholders in respect of the period is added back.

Jupiter Asset Management Series Plc Annual Report and Audited Financial Statements for the financial year ended 31 December 2020
Notes to the Financial Statements for the financial year ended 31 December 2020 (continued)
274
9. Fees and Expenses (continued) Performance Fee (continued) Jupiter Merian Global Equity Absolute Return Fund (continued) The Performance Fee is only payable when the increase in the Net Asset Value of each Class exceeds the Hurdle Rate accrued during the relevant Performance Period. If, during a performance fee period, the performance of the Shares does not exceed the Hurdle Rate, no Performance Fee is payable. All Performance Fee payments shall be subject to the restriction that in paying a Performance Fee, the Net Asset Value per Share of each Class at the relevant Performance Period of the Jupiter Merian Global Equity Absolute Return Fund shall not be less than the Net Asset Value per Share Class on the last day that a Performance Fee was paid (the “Net Asset Value High Water Mark”). The Performance Fee is only payable on the increase in the Net Asset Value per Share of each Class during the Performance Period of the Jupiter Merian Global Equity Absolute Return Fund over the Net-Asset Value High Water Mark and the relevant Hurdle Rate during the Performance Period of the Jupiter Merian Global Equity Absolute Return Fund. The amount of the Performance Fee will be calculated by the Administrator. The calculation of the Performance Fee shall be verified by the Depositary. The calculation of the Performance Fee shall also be reviewed by the Auditors as part of the annual audit of the Company. The Investment Manager may, at its discretion, waive the Performance Fee payable in respect of a Performance Period of the Jupiter Merian Global Equity Absolute Return Fund. Performance Fees are payable on net realised and net unrealised gains and losses as at the end of each Performance Period of the Jupiter Merian Global Equity Absolute Return Fund and as a result, Performance Fees may be paid on unrealised gains which may subsequently never be realised. Performance Fees may be payable on net realised and net unrealised gains and losses attributable to both the performance of the Investment Manager and market movements in general. During the year, the prospectus was updated to reflect performance fees changing to annual crystallisation effective from 1 January 2020. The Performance Period for each of the applicable Sub-Funds will end on 31 December each year. Performance Fees were USD Nil for the financial year ended 31 December 2020 (31 December 2019: USD Nil) and the amount accrued at the financial year ended 31 December 2020 was USD Nil (31 December 2019: USD Nil). Jupiter Strategic Absolute Return Bond Fund The Investment Manager may be entitled to a performance fee out of the Jupiter Strategic Absolute Return Bond Fund’s assets. In 2018, the Jupiter Strategic Absolute Return Bond Fund introduced Share Classes subject to Performance Fee. Performance Fee is applicable to all Share Classes with the exception of: Class X, Class F1, Class F2 and Class L2. The Performance Fee will accrue on a daily basis and the accrual will be reflected in the Net Asset Value and will be payable annually in arrears in respect of each Performance Period (a “Performance Period of the Jupiter Strategic Absolute Return Bond Fund”). A Performance Period of the Jupiter Strategic Absolute Return Bond Fund will comprise of each successive twelve month period ending on 31 December.
The Performance Fee as at the end of each Performance Period of the Jupiter Strategic Absolute Return Bond Fund shall be equal in aggregate to 10 per cent. of the amount by which any increase in the Net Asset Value per Share of each Class during the Performance Period of the Jupiter Strategic Absolute Return Bond Fund exceeds the “Hurdle Rate”, subject to the Net Asset Value High Water Mark (as defined below) multiplied by the weighted average number of total Shares in issue of each Class on each Dealing Day during the Performance Period of the Jupiter Strategic Absolute Return Bond Fund.
The Hurdle Rate will be the average (1) Sterling Overnight Interbank Average Rate for the GBP Share Classes, (2) Euro Overnight Index Average Rate for the EUR Share Classes, (3) Federal Funds Effective Overnight Rate for the USD Share Classes, and (4) Swiss Average Overnight Rate for the CHF Share Classes, for the relevant Class currency during the Performance Period of the Jupiter Strategic Absolute Return Bond Fund.

Jupiter Asset Management Series Plc Annual Report and Audited Financial Statements for the financial year ended 31 December 2020
Notes to the Financial Statements for the financial year ended 31 December 2020 (continued)
275
9. Fees and Expenses (continued) Performance Fee (continued) Jupiter Strategic Absolute Return Bond Fund (continued) The initial issue price as set out above in the section of the Supplement headed “Initial Offer Period and Subscription Price” was the starting price for the calculation of the first performance fee payable of any share class to which a performance fee is applicable. The first Performance Period for each Class will begin on the date on which the first Shares of the relevant Class are issued and will end on 31 December in that year. In calculating the Net Asset Value per Share of each Class for Performance Fee purposes, no deduction is made on account of Performance Fees accrued in the Performance Period of the Jupiter Strategic Absolute Return Bond Fund and any net income distributed to Shareholders in respect of the period is added back. The Performance Fee is only payable when the increase in the Net Asset Value of each Class exceeds the Hurdle Rate accrued during the relevant Performance Period. If, during a performance fee period, the performance of the Shares does not exceed the Hurdle Rate, no Performance Fee is payable. All Performance Fee payments shall be subject to the restriction that in paying/accruing a Performance Fee, the Net Asset Value per Share of each Class at the relevant Performance Period of Jupiter Strategic Absolute Return Bond Fund shall not be less than the Net Asset Value per Share Class on the last day that a Performance Fee was paid (or the initial subscription price if higher) (the “Net Asset Value High Water Mark”). The Performance Fee is only payable on the increase in the Net Asset Value per Share of each Class during the Performance Period of the Jupiter Strategic Absolute Return Bond Fund in excess of the Net Asset Value High Water Mark and the relevant Hurdle Rate during the Performance Period of the Jupiter Strategic Absolute Return Bond Fund. The amount of the Performance Fee will be calculated by the Administrator. The Depositary shall verify the calculation of the Performance Fee as at each performance Period of the Jupiter Strategic Absolute Return Bond Fund. The calculation of the Performance Fee shall also be reviewed by the Auditors as part of the annual audit of the Company. The Investment Manager may, at its discretion, waive the Performance Fee payable in respect of a Performance Period of the Jupiter Strategic Absolute Return Bond Fund. Performance Fees are payable on net realised and net unrealised gains and losses as at the end of each Performance Period of the Jupiter Strategic Absolute Return Bond Fund and as a result, Performance Fees may be paid on unrealised gains which may subsequently never be realised. Performance Fees may be payable on net realised and net unrealised gains and losses attributable to both the performance of the Investment Manager and market movements in general. During the year, the prospectus was updated to reflect performance fees changing to annual crystallisation effective from 1 January 2020. The Performance Period for each of the applicable Sub-Funds will end on 31 December each year. Performance Fees were USD 427,142 for the financial year ended 31 December 2020 (31 December 2019: USD 194,269) and the amount accrued at the financial year ended 31 December 2020 was USD 427,142 (31 December 2019: USD 136,567). Jupiter Gold & Silver Fund With respect to the Jupiter Gold & Silver Fund, the Investment Manager may be entitled to a performance fee out of the Jupiter Gold & Silver Fund’s assets. With respect to the Jupiter Gold & Silver Fund, the performance fee is only applicable to the following share classes: Class U3 (EUR) Accumulation Shares, Class U3 (GBP) Accumulation Shares and Class U3 (USD) Accumulation Shares. The Performance Fee will be calculated and accrued daily and will be payable annually in arrears in respect of each Performance Period (“Performance Period of the Jupiter Gold & Silver Fund”). A Performance Period of the Jupiter Gold & Silver Fund will comprise of each successive twelve month period ending on 31 December.

Jupiter Asset Management Series Plc Annual Report and Audited Financial Statements for the financial year ended 31 December 2020
Notes to the Financial Statements for the financial year ended 31 December 2020 (continued)
276
9. Fees and Expenses (continued) Performance Fee (continued) Jupiter Gold & Silver Fund (continued) “The Benchmark” is a composite, made up of (i) a 50:50 split between the FTSE Gold Mines Index (TICKER TFTMIGMI) expressed in GBP and the XAU:GBP gold price for the U3 (GBP) Accumulation Shares, (ii) a 50:50 split between the FTSE Gold Mines Index (TICKER TFTMIGMI) expressed in EUR and XAU:EUR for the U3 (EUR) Accumulation Shares and (iii) a 50:50 split between the FTSE Gold Mines Index (TICKER: TFTMIGMI) expressed in USD and the XAU: USD gold price for the U3 (USD) Accumulation Shares. “The Benchmark Performance” in respect of a Performance Period of the Jupiter Gold & Silver Fund, the Benchmark Performance is the difference between the level of the Benchmark calculated at the Valuation Point on the last Business Day of the previous Performance Period of the Jupiter Gold & Silver Fund and the level of the Benchmark calculated at the Valuation Point on the last Business Day of the relevant Performance Period of the Jupiter Gold & Silver Fund, expressed as a percentage. The “Sub-Fund Performance” in respect of the first Performance Period of the Jupiter Gold & Silver Fund is the difference between the opening Net Asset Value per Share and the Net Asset Value per Share at the Valuation Point on the last Business Day of the Performance Period of the Jupiter Gold & Silver Fund, expressed as a percentage. For each Performance Period of the Jupiter Gold & Silver Fund thereafter, the Sub-Fund Performance is the difference between the Net Asset Value per Share at the Valuation Point on the last Business Day of the previous Performance Period of the Jupiter Gold & Silver Fund and the Net Asset Value per Share at the Valuation Point on the last Business Day of the relevant Performance Period of the Jupiter Gold & Silver Fund, expressed as a percentage. In calculating the Net Asset Value per Share of each Class U3 for Performance Fee purposes no deduction is made on account of Performance Fees accrued in the Performance Period of the Jupiter Gold & Silver Fund and any net income distributed to Shareholders in respect of the Performance Period of the Jupiter Gold & Silver Fund is added back. The “Percentage Outperformance” in respect of Performance Periods of the Jupiter Gold & Silver Fund where Fund Performance is greater than Benchmark Performance is the arithmetical difference between Fund Performance and Benchmark Performance, expressed as a percentage. In respect of Performance Periods of the Jupiter Gold & Silver Fund where Fund Performance is less than Benchmark Performance, such underperformance, being the arithmetical difference between Fund Performance and Benchmark Performance expressed in percentage points, will be carried forward and no Performance Fee will be payable in any subsequent Performance Period of the Jupiter Gold & Silver Fund unless Fund Performance measured against Benchmark Performance has recovered any accumulated percentage underperformance for previous periods. In the Performance Period of the Jupiter Gold & Silver Fund in which any accumulated percentage underperformance is recovered, only that part of the Percentage Outperformance for such period as exceeds the accumulated percentage underperformance carried forward is taken into account for the purposes of calculating the performance fee payable for the Performance Period of the Jupiter Gold & Silver Fund. The amount of Performance Fee payable in respect of each Share is a USD amount equivalent to the opening Net Asset Value per Share on the first Business Day of the Performance Period of the Jupiter Gold & Silver Fund x Percentage Outperformance x 20% and is payable based on the number of Shares in issue for the Class U3 (EUR) Accumulation Shares, Class U3 (GBP) Accumulation Shares and Class U3 (USD) Accumulation Shares during the Performance Period of the Jupiter Gold & Silver Fund. For the purposes of the first calculation of the Performance Fee, the initial offer price in respect of each Share Class was taken as the opening Net Asset Value. The first Performance Period for each Class will begin on the date on which the first Shares of the relevant Class are issued and will end on 31 December in that year. The Performance Fee accrues and is taken into account in the calculation of the Net Asset Value per Share on a daily basis.

Jupiter Asset Management Series Plc Annual Report and Audited Financial Statements for the financial year ended 31 December 2020
Notes to the Financial Statements for the financial year ended 31 December 2020 (continued)
277
9. Fees and Expenses (continued) Performance Fee (continued) Jupiter Gold & Silver Fund (continued) The amount of the Performance Fee will be calculated by the Administrator. The calculation of the Performance Fee shall be verified by the Depositary. The calculation of the Performance Fee shall also be reviewed by the Auditors as part of the annual audit of the Company. The Investment Manager may, at its discretion, waive the Performance Fee payable in respect of a Performance Period of the Jupiter Gold & Silver Fund. Performance Fees are payable on net realised and net unrealised gains and losses as at the end of each Performance Period of the Jupiter Gold & Silver Fund and as a result, Performance Fees may be paid on unrealised gains which may subsequently never be realised. Performance Fees may also be payable during a Performance Period of the Jupiter Gold & Silver Fund where there is a decline in the Net Asset Value per Share. During the year, the prospectus was updated to reflect performance fees changing to annual crystallisation effective from 1 January 2020. The Performance Period for each of the applicable Sub-Funds will end on 31 December each year. Performance Fees were USD 900,316 for the financial year ended 31 December 2020 (31 December 2019: USD 398,146) and the amount accrued at the financial year ended 31 December 2020 was USD 900,316 (31 December 2019: USD 398,146). Jupiter UK Specialist Equity Fund With respect to the Jupiter UK Specialist Equity Fund, the Investment Manager may be entitled to a performance fee out of the Jupiter UK Specialist Equity Fund’s assets. With respect to the Jupiter UK Specialist Equity Fund, the performance fee is applicable to all share classes with the exception of the Class X (GBP) Accumulation Shares. The Performance Fee will accrue on a daily basis and the accrual will be reflected in the Net Asset Value and will be payable annually in arrears in respect of each Performance Period (a “Performance Period of the Jupiter UK Specialist Equity Fund”). A Performance Period of the Jupiter UK Specialist Equity Fund will comprise of each successive twelve month period ending on 31 December. The Performance Fee as at the end of each Performance Period of the Jupiter UK Specialist Equity Fund for all Share Classes shall be equal in aggregate to 20 per cent of the amount by which any increase in the Net Asset Value per Share of each Class during the Performance Period of the Jupiter UK Specialist Equity Fund exceeds the “Hurdle Rate”, subject to the Net Asset Value High Water mark (as defined below), multiplied by the weighted average number of total Shares in issue of each Class on each Dealing Day during the Performance Period of the Jupiter UK Specialist Equity Fund. The Hurdle Rate will be the average of (1) Sterling Overnight Interbank Average Rate for the GBP Share Classes, (2) Euro Overnight Index Average Rate for the EUR Share Classes, (3) Federal Funds Effective Overnight Rate for the USD Share Classes, and (4) Swiss Average Overnight Rate for the CHF Share Classes for the relevant Class currency during the Performance Period of the Jupiter UK Specialist Equity Fund. The initial issue price, as set out in the section of the Supplement headed “Initial Offer Period and Subscription Price”, was the starting price for the calculation of the first performance fee payable of any Share Class to which a performance fee is applicable. The first Performance Period for each Class will begin on the date on which the first Shares of the relevant Class are issued and will end on 31 December in that year.
In calculating the Net Asset Value per Share of each Class for Performance Fee purposes, no deduction is made on account of Performance Fees accrued in the Performance Period of the Jupiter UK Specialist Equity Fund and any net income distributed to Shareholders in respect of the period is added back.
The Performance Fee is only payable when the increase in the Net Asset Value of each Class exceeds the Hurdle Rate accrued during the relevant Performance Period. If, during a performance fee period, the performance of the Shares does not exceed the Hurdle Rate, no Performance Fee is payable.

Jupiter Asset Management Series Plc Annual Report and Audited Financial Statements for the financial year ended 31 December 2020
Notes to the Financial Statements for the financial year ended 31 December 2020 (continued)
278
9. Fees and Expenses (continued)
Performance Fee (continued)
Jupiter UK Specialist Equity Fund (continued) The Depositary shall verify the calculation of the Performance Fee as at each Performance Period of the Jupiter UK Specialist Equity Fund.
All Performance Fee payments shall be subject to the restriction that in paying a Performance Fee, the Net Asset Value per Share of each Class at the relevant Performance Period of the Jupiter UK Specialist Equity Fund shall not be less than the Net Asset Value per Share Class on the last day that a Performance Fee was paid (the “Net Asset Value High Water Mark”). The Performance Fee is only payable on the increase in the Net Asset Value per Share of each Class during the Performance Period of the Jupiter UK Specialist Equity Fund over the Net Asset Value High Water Mark and the relevant Hurdle Rate during the Performance Period of the Jupiter UK Specialist Equity Fund.
The amount of the Performance Fee will be calculated by the Administrator. The calculation of the Performance Fee shall be verified by the Depositary. The calculation of the Performance Fee shall also be reviewed by the Auditors as part of the annual audit of the Company. The Investment Manager may, at its discretion, waive the Performance Fee payable in respect of a Performance Period of the Jupiter UK Specialist Equity Fund.
Performance Fees are payable on net realised and net unrealised gains and losses as at the end of each Performance Period of the Jupiter UK Specialist Equity Fund and as a result, Performance Fees may be paid on unrealised gains which may subsequently never be realised. Performance Fees may be payable on the net realised and net unrealised gains and losses attributable to both the performance of the Investment Manager and market movements in general.
During the year, the prospectus was updated to reflect performance fees changing to annual crystallisation effective from 1 January 2020. The Performance Period for each of the applicable Sub-Funds will end on 31 December each year. Performance Fees were GBP 13,142,136 for the financial year ended 31 December 2020 (31 December 2019: GBP 62,022) and the amount accrued at the financial year ended 31 December 2020 was GBP 13,142,136 (31 December 2019: GBP 62,022).
Merian Style Premia Absolute Return Fund** With respect to the Merian Style Premia Absolute Return Fund, the Investment Manager may be entitled to a performance fee out of the Merian Style Premia Absolute Return Fund’s** assets.
The Performance Fee accrued on a daily basis and the accrual reflected in the Net Asset Value and was payable semi-annually in arrears in respect of each Performance Period (a “Performance Period of the Merian Style Premia Absolute Return Fund**”). A Performance Period of the Merian Style Premia Absolute Return Fund** comprised of each successive six month period ended on either 31 December or 30 June as the case may be. The first Performance Period for each Class began on the date on which the first Shares of the relevant Class were issued and ended on 30 June or 31 December respectively in that year.
For the P2 and P3 Share Classes, the Performance Fee as at the end of each Performance Period of the Merian Style Premia Absolute Return Fund** would be equal in aggregate to 15 % of the amount by which any increase in the Net Asset Value per Share of each Class during the Performance Period of the Merian Style Premia Absolute Return Fund** exceeded the “Hurdle Rate”. For the F2 Share Classes, the Performance Fee as at the end of each Performance Period of the Merian Style Premia Absolute Return Fund** would be equal in aggregate to 10% of the amount by which any increase in the Net Asset Value per Share of each Class during the Performance Period of the Merian Style Premia Absolute Return Fund** exceeded the “Hurdle Rate”. For all Share Classes, the Hurdle Rate was the average (1) Sterling Overnight Interbank Average Rate for the GBP Share Classes, (2) Euro Overnight Index Average Rate for the EUR Share Classes, (3) Federal Funds Effective Overnight Rate for the USD Share Classes, and (4) Swiss Average Overnight Rate for the CHF Share Classes for the relevant Class currency during the Performance Period of the Merian Style Premia Absolute Return Fund** multiplied by the weighted average number of total Shares in issue of each Class on each Dealing Day during the Performance Period of the Merian Style Premia Absolute Return Fund**. Where no central bank base rate existed, an equivalent inter-bank reference rate was used.

Jupiter Asset Management Series Plc Annual Report and Audited Financial Statements for the financial year ended 31 December 2020
Notes to the Financial Statements for the financial year ended 31 December 2020 (continued)
279
9. Fees and Expenses (continued) Performance Fee (continued) Merian Style Premia Absolute Return Fund** (continued) The initial issue price as set out in the section of the Supplement headed “Initial Offer Period and Subscription Price” was the starting price for the calculation of the first performance fee payable of any Share Class to which a performance fee was applicable. In calculating the Net Asset Value per Share of each Class for Performance Fee purposes, no deduction was made on account of Performance Fees accrued in the Performance Period of the Merian Style Premia Absolute Return Fund** and any net income distributed to Shareholders in respect of the period was added back. The Performance Fee was only payable when the Net Asset Value of each Class exceeded the Hurdle Rate. If, during a performance fee period, the performance of the Shares did not exceed the Hurdle Rate, no Performance Fee was payable until such unachieved performance was reclaimed. The Depositary shall verify the calculation of the Performance Fee as at each Performance Period of the Merian Style Premia Absolute Return Fund. All Performance Fee payments were subject to the restriction that in paying/accruing a Performance Fee, the Net Asset Value per Share of each Class at the relevant Performance Period of Merian Style Premia Absolute Return Fund** would not be less than the Net Asset Value per Share Class on the last day that a Performance Fee was paid (or the initial subscription price if higher) (the “Net Asset Value High Water Mark”). The Performance Fee was only payable on the increase in the Net Asset Value per Share of each Class during the Performance Period of the Merian Style Premia Absolute Return Fund** in excess of the relevant Hurdle Rate during the Performance Period of the Merian Style Premia Absolute Return Fund**. The amount of the Performance Fee would be calculated by the Administrator. The calculation of the Performance Fee shall be verified by the Depositary at each Performance Period. The calculation of the Performance Fee would also be reviewed by the Auditors as part of the annual audit of the Company. The Investment Manager might, at its discretion, waive the Performance Fee payable in respect of a Performance Period of the Merian Style Premia Absolute Return Fund**. Performance Fees were payable on net realised and net unrealised gains and losses as at the end of each Performance Period of the Merian Style Premia Absolute Return Fund** and as a result, Performance Fees might be paid on unrealised gains which might subsequently never be realised. During the year, the prospectus was updated to reflect performance fees changing to annual crystallisation effective from 1 January 2020. The Performance Period for each of the applicable Sub-Funds will end on 31 December each year. Performance Fees were USD Nil for the financial year ended 31 December 2020 (31 December 2019: USD Nil) and the amount accrued at the financial year ended 31 December 2020 was USD Nil (31 December 2019: USD Nil). Administration Fee, Registrar and Transfer Agency Fees Jupiter Asset Management Series Plc will pay to the Administrator monthly in arrears an administration fee of up to 3.75 basis points per annum of the combined average Net Asset Value of the Sub-Funds and in the case of each Sub-Fund subject to a minimum fee per Sub-Fund of EUR 15,000 per annum. The administration fee shall accrue on each Dealing Day. Additional annual fees shall be payable for the second and each subsequent Class of Shares in each Sub-Fund which shall be charged at normal commercial rates.

Jupiter Asset Management Series Plc Annual Report and Audited Financial Statements for the financial year ended 31 December 2020
Notes to the Financial Statements for the financial year ended 31 December 2020 (continued)
280
9. Fees and Expenses (continued) Administration Fee, Registrar and Transfer Agency Fees (continued) The Administrator is also entitled to transaction fees it incurs for the Sub-Funds and fees for the registrar and transfer agency functions and maintenance services it performs payable out of Jupiter Asset Management Series Plc’s assets. These services are (i) maintaining the register of each Share Class of Jupiter Asset Management Series Plc and the annual shareholder account, (ii) servicing, and (iii) reporting, all of which shall be charged at normal commercial rates.
The Administrator will also be entitled to be reimbursed by the Company out of the assets of each Sub-Fund for all reasonable and vouched out-of-pocket expenses incurred by it and charged to it for the benefit of the Company in the performance of its duties to the Company. All fees will be invoiced and payable monthly.
The Administrator is entitled to the following fees for the registrar and transfer agency functions it performs, payable out of the Company assets: annual Company maintenance fee of EUR 3,500 per Sub-Fund per annum; annual account servicing fees of EUR 26 for each direct Account, EUR 12 for statutory financial statements maintained electronically through NSCC Networking and EUR 26 for Accounts maintained electronically through Fund settle/Vestima; transaction fees of EUR 5 for each automatic transaction and EUR 12 for each manual transaction.
All Sub-Funds are also subject to FATCA fees. The fees are included in the Transfer Agency fees and are recognised in the Statement of Operations on an accruals basis.
The following are the Administrator expense and related payables for each of the Sub-Funds.
Sub-Fund CCY
Expense year ended
31 December 2020
Payable as at
31 December 2020
Expense year ended
31 December 2019
Payable as at
31 December 2019
Jupiter China Equity Fund USD 143,294 38,006 121,068 38,677 Merian Global Strategic Bond Fund (IRL)* USD - - 27,860 - Jupiter Merian World Equity Fund USD 208,313 52,910 269,571 59,828 Jupiter Pacific Equity Fund USD 156,859 50,209 163,437 64,195 Merian European Equity Fund EUR 129,925 31,812 81,827 12,501 Jupiter Merian US Equity Income Fund USD 299,417 78,403 359,211 75,210 Jupiter Merian North American Equity Fund (IRL) USD 466,818 94,641 559,780 111,915 Merian Global Dynamic Bond Fund USD 320,741 81,245 287,697 78,949 Jupiter Emerging Market Debt Fund USD 272,692 72,643 286,554 76,096 Merian European Best Ideas Fund^^ EUR - - 92,968 - Merian Investment Grade Corporate Bond Fund*** USD - - 65,866 - Jupiter Global Emerging Markets Focus Fund USD 189,671 52,735 164,736 48,178 Merian Asian Equity Income Fund USD 154,391 50,663 190,824 50,089 Jupiter Local Currency Emerging Market Debt Fund USD 511,920 151,368 626,754 157,175 Jupiter UK Alpha Fund (IRL) GBP 125,991 34,487 152,594 32,530 Jupiter UK Smaller Companies Focus Fund GBP 182,063 46,030 154,215 32,592 Jupiter UK Dynamic Equity Fund GBP 159,441 39,666 154,957 28,938 Jupiter Merian Global Equity Absolute Return Fund USD 977,668 229,994 2,339,160 325,569 Jupiter Strategic Absolute Return Bond Fund USD 213,276 70,349 164,446 29,150 Merian Monthly Income High Yield Bond Fund(a) USD - - (1,321) 1,318 Jupiter Europe (ex UK) Smaller Companies Fund EUR 150,014 38,769 201,267 42,878 Jupiter Merian Global Equity Income Fund (IRL) USD 166,556 38,189 165,710 27,020 Jupiter Gold & Silver Fund USD 487,434 96,999 297,844 66,190 Merian Compass Portfolio 2^ USD - - 18,715 - Merian Compass Portfolio 3^ USD - - 57,621 - Merian Compass Portfolio 4^ USD - - 75,992 - Merian Compass Portfolio 5^ USD - - 17,973 - Jupiter UK Specialist Equity Fund GBP 170,051 31,617 187,183 36,342 Merian Style Premia Absolute Return Fund** USD - - 27,896 - Jupiter Financials Contingent Capital Fund USD 248,508 41,243 190,328 20,402
Company Level USD 5,961,396 1,493,471 7,729,059 1,464,874

Jupiter Asset Management Series Plc Annual Report and Audited Financial Statements for the financial year ended 31 December 2020
Notes to the Financial Statements for the financial year ended 31 December 2020 (continued)
281
9. Fees and Expenses (continued) Depositary Fee Jupiter Asset Management Series Plc will pay to the Depositary monthly in arrears a fiduciary fee of 1 basis point per annum of the combined average Net Asset Value of the Sub-Funds plus VAT (if any), and in the case of each Sub-Fund subject to a minimum fee of EUR 3,500 per annum. The fiduciary fee shall accrue on each Dealing Day. The Depositary is also entitled to sub-depositary fees and transaction charges which shall be charged at normal commercial rates and paid monthly in arrears. The Depositary is also entitled to be reimbursed by Jupiter Asset Management Series Plc for all reasonable disbursements and out-of-pocket expenses. Total Depositary fees were USD 1,812,011 for the financial year ended 31 December 2020 (31 December 2019: USD 2,890,945) and the amount payable at the financial year ended 31 December 2020 was USD 425,147 (31 December 2019: USD 405,488).
Sub-Fund CCY
Expense year ended
31 December 2020
Payable as at
31 December 2020
Expense year ended
31 December 2019
Payable as at
31 December 2019
Jupiter China Equity Fund USD 21,991 4,266 17,090 2,585
Merian Global Strategic Bond Fund (IRL)* USD - - 14,849 - Jupiter Merian World Equity Fund USD 102,697 31,664 160,878 27,944 Jupiter Pacific Equity Fund USD 108,116 32,673 209,610 39,394 Merian European Equity Fund EUR 52,896 18,634 52,344 10,479 Jupiter Merian US Equity Income Fund USD 50,734 13,127 52,751 7,746 Jupiter Merian North American Equity Fund (IRL) USD 99,362 17,889 139,352 15,701 Merian Global Dynamic Bond Fund USD 58,824 13,606 58,639 11,030 Jupiter Emerging Market Debt Fund USD 34,243 5,951 68,093 11,017 Merian European Best Ideas Fund^^ EUR 22,642 - 22,642 173 Merian Investment Grade Corporate Bond Fund*** USD - - 7,785 - Jupiter Global Emerging Markets Focus Fund USD 85,051 21,968 41,194 9,879 Merian Asian Equity Income Fund USD 99,796 24,320 241,519 43,382 Jupiter Local Currency Emerging Market Debt Fund USD 281,885 81,874 327,498 58,971 Jupiter UK Alpha Fund (IRL) GBP 9,542 2,563 11,319 2,094 Jupiter UK Smaller Companies Focus Fund GBP 28,480 3,453 24,547 2,334 Jupiter UK Dynamic Equity Fund GBP 34,082 3,524 27,615 2,536 Jupiter Merian Global Equity Absolute Return Fund USD 342,701 63,335 892,451 95,457 Jupiter Strategic Absolute Return Bond Fund USD 47,667 12,341 59,759 8,598 Merian Monthly Income High Yield Bond Fund(a) USD - - 1,255 - Jupiter Europe (ex UK) Smaller Companies Fund EUR 34,712 10,358 35,736 4,877 Jupiter Merian Global Equity Income Fund (IRL) USD 110,637 34,332 172,527 35,561 Jupiter Gold & Silver Fund USD 60,749 4,634 39,044 3,519 Merian Compass Portfolio 2^ USD - - 8,863 68 Merian Compass Portfolio 3^ USD - - 21,856 61 Merian Compass Portfolio 4^ USD - - 32,574 61 Merian Compass Portfolio 5^ USD - - 11,475 55 Jupiter UK Specialist Equity Fund GBP 34,425 3,306 34,161 2,325 Merian Style Premia Absolute Return Fund** USD - - 26,540 - Jupiter Financials Contingent Capital Fund USD 43,705 10,134 36,212 4,722
Company Level USD 1,812,011 425,147 2,890,663 405,488
Transaction Costs Transaction costs are expenses incurred when buying or selling a security. Transaction costs represents the brokers' commissions and spreads, which are the differences between the price the dealer paid for a security and the price the buyer pays.
Transaction costs on the purchase and sale of bonds, currency exchange contracts and swaps are included in the purchase and sale price of the investment. They cannot be practically or reliably gathered as they are embedded in the cost of the investment and cannot be separately verified or disclosed.
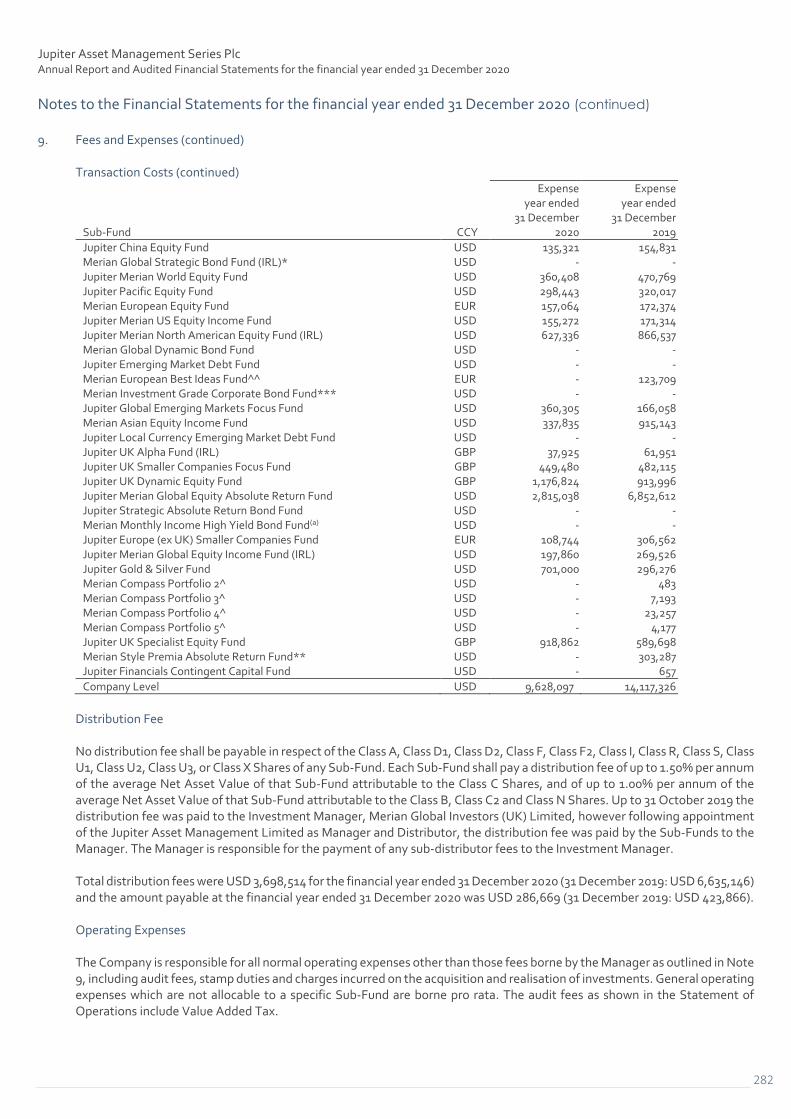
Jupiter Asset Management Series Plc Annual Report and Audited Financial Statements for the financial year ended 31 December 2020
Notes to the Financial Statements for the financial year ended 31 December 2020 (continued)
282
9. Fees and Expenses (continued) Transaction Costs (continued)
Sub-Fund CCY
Expense year ended
31 December 2020
Expense year ended
31 December 2019
Jupiter China Equity Fund USD 135,321 154,831 Merian Global Strategic Bond Fund (IRL)* USD - - Jupiter Merian World Equity Fund USD 360,408 470,769 Jupiter Pacific Equity Fund USD 298,443 320,017 Merian European Equity Fund EUR 157,064 172,374 Jupiter Merian US Equity Income Fund USD 155,272 171,314 Jupiter Merian North American Equity Fund (IRL) USD 627,336 866,537 Merian Global Dynamic Bond Fund USD - - Jupiter Emerging Market Debt Fund USD - - Merian European Best Ideas Fund^^ EUR - 123,709 Merian Investment Grade Corporate Bond Fund*** USD - - Jupiter Global Emerging Markets Focus Fund USD 360,305 166,058 Merian Asian Equity Income Fund USD 337,835 915,143 Jupiter Local Currency Emerging Market Debt Fund USD - - Jupiter UK Alpha Fund (IRL) GBP 37,925 61,951 Jupiter UK Smaller Companies Focus Fund GBP 449,480 482,115 Jupiter UK Dynamic Equity Fund GBP 1,176,824 913,996 Jupiter Merian Global Equity Absolute Return Fund USD 2,815,038 6,852,612 Jupiter Strategic Absolute Return Bond Fund USD - - Merian Monthly Income High Yield Bond Fund(a) USD - - Jupiter Europe (ex UK) Smaller Companies Fund EUR 108,744 306,562 Jupiter Merian Global Equity Income Fund (IRL) USD 197,860 269,526 Jupiter Gold & Silver Fund USD 701,000 296,276 Merian Compass Portfolio 2^ USD - 483 Merian Compass Portfolio 3^ USD - 7,193 Merian Compass Portfolio 4^ USD - 23,257 Merian Compass Portfolio 5^ USD - 4,177 Jupiter UK Specialist Equity Fund GBP 918,862 589,698 Merian Style Premia Absolute Return Fund** USD - 303,287 Jupiter Financials Contingent Capital Fund USD - 657
Company Level USD 9,628,097 14,117,326
Distribution Fee No distribution fee shall be payable in respect of the Class A, Class D1, Class D2, Class F, Class F2, Class I, Class R, Class S, Class U1, Class U2, Class U3, or Class X Shares of any Sub-Fund. Each Sub-Fund shall pay a distribution fee of up to 1.50% per annum of the average Net Asset Value of that Sub-Fund attributable to the Class C Shares, and of up to 1.00% per annum of the average Net Asset Value of that Sub-Fund attributable to the Class B, Class C2 and Class N Shares. Up to 31 October 2019 the distribution fee was paid to the Investment Manager, Merian Global Investors (UK) Limited, however following appointment of the Jupiter Asset Management Limited as Manager and Distributor, the distribution fee was paid by the Sub-Funds to the Manager. The Manager is responsible for the payment of any sub-distributor fees to the Investment Manager. Total distribution fees were USD 3,698,514 for the financial year ended 31 December 2020 (31 December 2019: USD 6,635,146) and the amount payable at the financial year ended 31 December 2020 was USD 286,669 (31 December 2019: USD 423,866). Operating Expenses The Company is responsible for all normal operating expenses other than those fees borne by the Manager as outlined in Note 9, including audit fees, stamp duties and charges incurred on the acquisition and realisation of investments. General operating expenses which are not allocable to a specific Sub-Fund are borne pro rata. The audit fees as shown in the Statement of Operations include Value Added Tax.

Jupiter Asset Management Series Plc Annual Report and Audited Financial Statements for the financial year ended 31 December 2020
Notes to the Financial Statements for the financial year ended 31 December 2020 (continued)
283
10. Distributions
Shareholders should note that, where set out in the relevant Supplement, distributions may be payable out of the capital of each Sub-Fund. Fixed distribution classes are denoted by an "(F)" at the end of the Share Class name, as shown in Note 6. These Share Classes will distribute regardless of what income is available therefore any shortfall is paid out of capital.
It should also be noted that certain Sub-Funds and Share Classes including the fixed distribution Share Classes listed above may charge certain fees and expenses to capital rather than income, which may result in the erosion of capital and in an increased risk that Shareholders in these Share Classes may not receive back the full amount invested when redeeming their holding.
Distributions out of capital may have different tax implications from distributions of income and capital gains and if you propose to invest in one or more of the relevant Share Classes, you are recommended to seek advice in this regard.
The following tables detail the distributions per Share for the financial years ended 31 December 2020 and 31 December 2019.
For the financial year ended 31 December 2020
Jupiter Merian US Equity Income Fund
Share Class 31 December
2019 31 January
2020 28 February
2020 31 March
2020 30 April
2020 29 May
2020 30 June
2020
Class A (USD) Income (F) USD 0.042475 USD 0.041482 USD 0.037168 USD 0.031707 USD 0.035835 USD 0.036533 USD 0.037151 Class A (USD) Income USD 0.021250 USD 0.013224 USD 0.020593 USD 0.017612 USD 0.019954 USD 0.020392 USD 0.020783 Class B (USD) Income USD 0.019102 USD 0.011870 USD 0.018455 USD 0.015769 USD 0.017852 USD 0.018221 USD 0.018534 Class C (USD) Income USD 0.019066 USD 0.011835 USD 0.018392 USD 0.015707 USD 0.017774 USD 0.018136 USD 0.018445 Class C2 (USD) Income (F) USD 0.042140 USD 0.041121 USD 0.036815 USD 0.031376 USD 0.035432 USD 0.036097 USD 0.036676 Class C2 (USD) Income USD 0.016817 USD 0.010444 USD 0.016237 USD 0.013878 USD 0.015710 USD 0.016038 USD 0.016309 Class I (EUR) Income USD - USD - USD - USD - USD - USD - USD - Class I (USD) Income USD 0.018898 USD 0.011772 USD 0.018353 USD 0.015705 USD 0.017805 USD 0.018210 USD 0.018575 Class R (GBP) Income USD 0.034233 USD 0.021326 USD 0.033243 USD 0.028446 USD 0.032250 USD 0.032981 USD 0.033642 Class U1 (GBP) Income USD 0.023135 USD 0.014398 USD 0.022456 USD 0.019217 USD 0.021787 USD 0.022285 USD 0.022734 Class U2 (GBP) Income USD 0.028546 USD 0.017788 USD 0.027733 USD 0.023735 USD 0.026912 USD 0.027528 USD 0.028084

Jupiter Asset Management Series Plc Annual Report and Audited Financial Statements for the financial year ended 31 December 2020
Notes to the Financial Statements for the financial year ended 31 December 2020 (continued)
284
10. Distributions (continued)
For the financial year ended 31 December 2020 (continued)
Jupiter Merian US Equity Income Fund (continued)
Share Class 31 July
2020 28 August
2020 30 September
2020 30 October
2020 30 November
2020 31 December
2020
Class A (USD) Income (F) USD 0.038455 USD 0.040983 USD 0.038872 USD 0.038696 USD 0.042237 USD 0.043516 Class A (USD) Income USD 0.020646 USD 0.018912 USD 0.020550 USD 0.008725 USD 0.020337 USD 0.030941 Class B (USD) Income USD 0.018478 USD 0.016845 USD 0.018289 USD 0.007759 USD 0.018069 USD 0.027466 Class C (USD) Income USD 0.018436 USD 0.016752 USD 0.018181 USD 0.007709 USD 0.017946 USD 0.027271 Class C2 (USD) Income (F) USD 0.037931 USD 0.040393 USD 0.038281 USD 0.038071 USD 0.041521 USD 0.042743 Class C2 (USD) Income USD 0.016278 USD 0.014819 USD 0.016089 USD 0.006825 USD 0.015896 USD 0.024165 Class I (EUR) Income USD - USD - USD - USD - USD - USD - Class I (USD) Income USD 0.018397 USD 0.016918 USD 0.018394 USD 0.007814 USD 0.018226 USD 0.027750 Class R (GBP) Income USD 0.033329 USD 0.030643 USD 0.033316 USD 0.014152 USD 0.033003 USD 0.050244 Class U1 (GBP) Income USD 0.022413 USD 0.020709 USD 0.022517 USD 0.009564 USD 0.022316 USD 0.033972 Class U2 (GBP) Income USD 0.027806 USD 0.025585 USD 0.027820 USD 0.011820 USD 0.027573 USD 0.041983
Jupiter Merian North American Equity Fund (IRL)
Share Class 31 December
2019 31 January
2020 28 February
2020 31 March
2020 30 April
2020 29 May
2020 30 June
2020
Class P2 (GBP) Income USD 0.143658 USD - USD - USD - USD - USD - USD - Class P2 (USD) Income USD 0.029329 USD - USD - USD 0.030613 USD - USD - USD 0.026252
Share Class 31 July
2020 28 August
2020 30 September
2020 30 October
2020 30 November
2020 31 December
2020
Class P2 (GBP) Income USD - USD - USD - USD - USD - USD 0.116933 Class P2 (USD) Income USD - USD - USD 0.019441 USD - USD - USD -

Jupiter Asset Management Series Plc Annual Report and Audited Financial Statements for the financial year ended 31 December 2020
Notes to the Financial Statements for the financial year ended 31 December 2020 (continued)
285
10. Distributions (continued)
For the financial year ended 31 December 2020 (continued)
Merian Global Dynamic Bond Fund
Share Class 31 December
2019 31 January
2020 28 February
2020 31 March
2020 30 April
2020 29 May
2020 30 June
2020
Class A (GBP) Income USD 0.094284 USD - USD - USD 0.067526 USD - USD - USD 0.089487 Class A (USD) Income USD 0.021692 USD 0.018818 USD 0.014044 USD 0.017183 USD 0.018232 USD 0.021469 USD 0.026579 Class A (USD) Income (F) USD 0.041859 USD 0.040534 USD 0.041524 USD 0.040968 USD 0.041627 USD 0.042276 USD 0.042536 Class A (AUD) Hedged Income (F) USD 0.024416 USD 0.022372 USD 0.022259 USD 0.020489 USD 0.022387 USD 0.023120 USD 0.023934 Class A (ZAR) Hedged Income (F) USD 0.005156 USD 0.004814 USD 0.004713 USD 0.004068 USD 0.004074 USD 0.004265 USD 0.004333 Class B (USD) Income USD 0.019229 USD 0.016667 USD 0.012429 USD 0.015193 USD 0.016107 USD 0.018949 USD 0.023441 Class C (USD) Income USD 0.018374 USD 0.015920 USD 0.011866 USD 0.014499 USD 0.015365 USD 0.018069 USD 0.022343 Class C2 (AUD) Hedged Income (F) USD 0.021739 USD 0.019886 USD 0.019770 USD 0.018188 USD 0.019830 USD 0.020461 USD 0.021134 Class C2 (USD) Income (F) USD 0.037514 USD 0.036295 USD 0.037137 USD 0.036607 USD 0.037166 USD 0.037699 USD 0.037893 Class C2 (ZAR) Hedged Income (F) USD 0.005117 USD 0.004781 USD 0.004678 USD 0.004026 USD 0.004020 USD 0.004199 USD 0.004257
Share Class 31 July
2020 28 August
2020 30 September
2020 30 October
2020 30 November
2020 31 December
2020
Class A (GBP) Income USD - USD - USD 0.069151 USD - USD - USD 0.083386 Class A (USD) Income USD 0.016204 USD 0.017919 USD 0.017120 USD 0.018857 USD 0.022671 USD 0.020234 Class A (USD) Income (F) USD 0.041189 USD 0.041122 USD 0.040821 USD 0.039778 USD 0.040325 USD 0.040473 Class A (AUD) Hedged Income (F) USD 0.025454 USD 0.025880 USD 0.024984 USD 0.024664 USD 0.026197 USD 0.027562 Class A (ZAR) Hedged Income (F) USD 0.003650 USD 0.003687 USD 0.003638 USD 0.003614 USD 0.003896 USD 0.004076 Class B (USD) Income USD 0.014276 USD 0.015774 USD 0.015058 USD 0.016572 USD 0.019908 USD 0.017753 Class C (USD) Income USD 0.013600 USD 0.015022 USD 0.014334 USD 0.015768 USD 0.018933 USD 0.016877 Class C2 (AUD) Hedged Income (F) USD 0.022458 USD 0.022818 USD 0.022006 USD 0.021706 USD 0.023036 USD 0.024216 Class C2 (USD) Income (F) USD 0.036661 USD 0.036573 USD 0.036273 USD 0.035316 USD 0.035772 USD 0.035873 Class C2 (ZAR) Hedged Income (F) USD 0.003581 USD 0.003615 USD 0.003564 USD 0.003536 USD 0.003808 USD 0.003980

Jupiter Asset Management Series Plc Annual Report and Audited Financial Statements for the financial year ended 31 December 2020
Notes to the Financial Statements for the financial year ended 31 December 2020 (continued)
286
10. Distributions (continued)
For the financial year ended 31 December 2020 (continued)
Jupiter Emerging Market Debt Fund
Share Class 31 December
2019 31 January
2020 28 February
2020 31 March
2020 30 April
2020 29 May
2020 30 June
2020
Class A (SGD) Hedged Income USD 0.033348 USD 0.033772 USD 0.029693 USD 0.029667 USD 0.010610 USD 0.022792 USD 0.025998 Class A (USD) Income USD 0.050016 USD 0.050352 USD 0.045537 USD 0.046411 USD 0.016948 USD 0.035907 USD 0.040285 Class A (USD) Income (F) USD 0.058534 USD 0.057705 USD 0.056852 USD 0.046888 USD 0.047309 USD 0.051308 USD 0.052670 Class A (ZAR) Hedged Income (F) USD 0.006668 USD 0.006255 USD 0.005881 USD 0.004226 USD 0.004202 USD 0.004691 USD 0.004855 Class B (USD) Income USD 0.051347 USD 0.051648 USD 0.046670 USD 0.047528 USD 0.017351 USD 0.036705 USD 0.041136 Class C (USD) Income USD 0.052853 USD 0.053140 USD 0.047996 USD 0.048857 USD 0.017833 USD 0.037695 USD 0.042215 Class C2 (USD) Income (F) USD 0.057430 USD 0.056625 USD 0.055662 USD 0.045865 USD 0.046239 USD 0.050036 USD 0.051247 Class C2 (ZAR) Hedged Income (F) USD 0.006554 USD 0.006148 USD 0.005775 USD 0.004143 USD 0.004115 USD 0.004595 USD 0.004754 Class S (GBP) Income USD 0.232460 USD - USD - USD 0.219835 USD - USD - USD 0.143454 Class U1 (GBP) Income USD 0.256968 USD - USD - USD 0.243237 USD - USD - USD 0.158884
Share Class 31 July
2020 28 August
2020 30 September
2020 30 October
2020 30 November
2020 31 December
2020
Class A (SGD) Hedged Income USD 0.024028 USD 0.022409 USD 0.025658 USD 0.022834 USD 0.024027 USD 0.025278 Class A (USD) Income USD 0.037113 USD 0.034135 USD 0.038929 USD 0.034514 USD 0.036022 USD 0.037482 Class A (USD) Income (F) USD 0.054342 USD 0.054425 USD 0.052956 USD 0.052994 USD 0.055281 USD 0.056295 Class A (ZAR) Hedged Income (F) USD 0.004814 USD 0.004870 USD 0.004700 USD 0.004738 USD 0.005249 USD 0.005568 Class B (USD) Income USD 0.037860 USD 0.034794 USD 0.039647 USD 0.035120 USD 0.036623 USD 0.038076 Class C (USD) Income USD 0.038823 USD 0.035664 USD 0.040621 USD 0.035968 USD 0.037491 USD 0.038962 Class C2 (USD) Income (F) USD 0.052755 USD 0.052795 USD 0.051324 USD 0.051319 USD 0.053488 USD 0.054423 Class C2 (ZAR) Hedged Income (F) USD 0.004717 USD 0.004776 USD 0.004611 USD 0.004653 USD 0.005150 USD 0.005458 Class S (GBP) Income USD - USD - USD 0.169940 USD - USD - USD 0.166773 Class U1 (GBP) Income USD - USD - USD 0.188370 USD - USD - USD 0.185089
Merian Asian Equity Income Fund
Share Class 31 December
2019 31 January
2020 28 February
2020 31 March
2020 30 April
2020 29 May
2020 30 June
2020
Class A (GBP) Income USD - USD - USD - USD - USD - USD - USD - Class A (USD) Income USD 0.057065 USD 0.005092 USD 0.026765 USD 0.030725 USD 0.012532 USD 0.022308 USD 0.034948 Class A (USD) Income (F) USD 0.047025 USD 0.043628 USD 0.041169 USD 0.035578 USD 0.038200 USD 0.037663 USD 0.040301 Class C2 (USD) Income (F) USD 0.047850 USD 0.044356 USD 0.041806 USD 0.036097 USD 0.038703 USD 0.038157 USD 0.040780 Class U1 (GBP) Income USD 0.082872 USD 0.007442 USD 0.039169 USD 0.045024 USD 0.018245 USD 0.032863 USD 0.051558 Class U2 (GBP) Income USD 0.080048 USD 0.007205 USD 0.037901 USD 0.043580 USD 0.017654 USD 0.031879 USD 0.049998

Jupiter Asset Management Series Plc Annual Report and Audited Financial Statements for the financial year ended 31 December 2020
Notes to the Financial Statements for the financial year ended 31 December 2020 (continued)
287
10. Distributions (continued)
For the financial year ended 31 December 2020 (continued)
Merian Asian Equity Income Fund (continued)
Share Class 31 July
2020 28 August
2020 30 September
2020 30 October
2020 30 November
2020 31 December
2020
Class A (GBP) Income USD - USD - USD - USD - USD - USD - Class A (USD) Income USD 0.038011 USD 0.030721 USD 0.035164 USD 0.008426 USD 0.002866 USD 0.030086 Class A (USD) Income (F) USD 0.043842 USD 0.045318 USD 0.043389 USD 0.044463 USD 0.047753 USD 0.049860 Class C2 (USD) Income (F) USD 0.044328 USD 0.045784 USD 0.043796 USD 0.044843 USD 0.048154 USD 0.050235 Class U1 (GBP) Income USD 0.056195 USD 0.045207 USD 0.052279 USD 0.012275 USD 0.004287 USD 0.044972 Class U2 (GBP) Income USD 0.054449 USD 0.043911 USD 0.050584 USD 0.011869 USD 0.004142 USD 0.043473
Jupiter Local Currency Emerging Market Debt Fund
Share Class 31 December
2019 31 January
2020 28 February
2020 31 March
2020 30 April
2020 29 May
2020 30 June
2020
Class A (AUD) Hedged Income (F) USD 0.036315 USD 0.033392 USD 0.031336 USD 0.024473 USD 0.027573 USD 0.029538 USD 0.030380 Class A (GBP) Income USD 0.176124 USD - USD - USD 0.138340 USD - USD - USD 0.099092 Class A (USD) Income USD 0.043043 USD 0.034081 USD 0.032019 USD 0.025402 USD 0.028514 USD 0.027916 USD 0.009338 Class A (USD) Income (F) USD 0.058787 USD 0.056798 USD 0.054917 USD 0.046173 USD 0.048405 USD 0.051033 USD 0.051048 Class A (ZAR) Hedged Income (F) USD 0.006264 USD 0.005749 USD 0.005308 USD 0.003882 USD 0.004003 USD 0.004346 USD 0.004386 Class B (AUD) Hedged Income (F) USD 0.035580 USD 0.032687 USD 0.030653 USD 0.023922 USD 0.026930 USD 0.028823 USD 0.029605 Class B (USD) Income USD 0.042289 USD 0.033454 USD 0.031406 USD 0.024894 USD 0.027921 USD 0.027309 USD 0.009133 Class B (ZAR) Hedged Income (F) USD 0.006149 USD 0.005639 USD 0.005203 USD 0.003801 USD 0.003916 USD 0.004248 USD 0.004281 Class C (USD) Income USD 0.034613 USD 0.027368 USD 0.025684 USD 0.020350 USD 0.022816 USD 0.022307 USD 0.007459 Class C2 (AUD) Hedged Income (F) USD 0.035567 USD 0.032672 USD 0.030627 USD 0.023895 USD 0.026898 USD 0.028753 USD 0.029503 Class C2 (USD) Income (F) USD 0.060493 USD 0.058397 USD 0.056414 USD 0.047387 USD 0.049637 USD 0.052236 USD 0.052170 Class C2 (ZAR) Hedged Income (F) USD 0.006122 USD 0.005615 USD 0.005179 USD 0.003783 USD 0.003898 USD 0.004226 USD 0.004256 Class U1 (GBP) Income USD 0.240974 USD - USD - USD 0.189699 USD - USD - USD 0.136117 Class U2 (GBP) Income USD 0.246801 USD - USD - USD 0.194380 USD - USD - USD -
Share Class 31 July
2020 28 August
2020 30 September
2020 30 October
2020 30 November
2020 31 December
2020
Class A (AUD) Hedged Income (F) USD 0.032517 USD 0.032465 USD 0.030604 USD 0.030350 USD 0.033629 USD 0.036228 Class A (GBP) Income USD - USD - USD 0.092113 USD - USD - USD 0.118297 Class A (USD) Income USD 0.020126 USD 0.019114 USD 0.021960 USD 0.021810 USD 0.028915 USD 0.027709 Class A (USD) Income (F) USD 0.052029 USD 0.050999 USD 0.049474 USD 0.049583 USD 0.052442 USD 0.053895 Class A (ZAR) Hedged Income (F) USD 0.004355 USD 0.004315 USD 0.004153 USD 0.004041 USD 0.004539 USD 0.004858

Jupiter Asset Management Series Plc Annual Report and Audited Financial Statements for the financial year ended 31 December 2020
Notes to the Financial Statements for the financial year ended 31 December 2020 (continued)
288
10. Distributions (continued)
For the financial year ended 31 December 2020 (continued)
Jupiter Local Currency Emerging Market Debt Fund (continued)
Share Class 31 July
2020 28 August
2020 30 September
2020 30 October
2020 30 November
2020 31 December
2020
Class B (AUD) Hedged Income (F) USD 0.031662 USD 0.031588 USD 0.029750 USD 0.029478 USD 0.032636 USD 0.035134 Class B (USD) Income USD 0.019646 USD 0.018645 USD 0.021403 USD 0.021238 USD 0.028133 USD 0.026938 Class B (ZAR) Hedged Income (F) USD 0.004247 USD 0.004205 USD 0.004043 USD 0.003931 USD 0.004412 USD 0.004718 Class C (USD) Income USD 0.016037 USD 0.015214 USD 0.017459 USD 0.017315 USD 0.022926 USD 0.021943 Class C2 (AUD) Hedged Income (F) USD 0.031500 USD 0.031376 USD 0.029511 USD 0.029198 USD 0.032320 USD 0.034793 Class C2 (USD) Income (F) USD 0.053127 USD 0.052036 USD 0.050434 USD 0.050503 USD 0.053371 USD 0.054803 Class C2 (ZAR) Hedged Income (F) USD 0.004215 USD 0.004167 USD 0.004000 USD 0.003884 USD 0.004358 USD 0.004661 Class U1 (GBP) Income USD - USD - USD 0.126857 USD - USD - USD 0.163397 Class U2 (GBP) Income USD - USD - USD - USD - USD - USD -
Jupiter UK Alpha Fund (IRL)
Share Class 31 December
2019 31 January
2020 28 February
2020 31 March
2020 30 April
2020 29 May
2020 30 June
2020
Class A (GBP) Income GBP 0.062976 GBP - GBP - GBP 0.065725 GBP - GBP - GBP 0.058230 Class A (USD) Income GBP - GBP - GBP - GBP - GBP - GBP - GBP - Class R (GBP) Income GBP 0.068402 GBP - GBP - GBP 0.071508 GBP - GBP - GBP 0.063538 Class U1 (GBP) Income GBP 0.069040 GBP - GBP - GBP 0.072687 GBP - GBP - GBP 0.063660 Class U2 (GBP) Income GBP 0.072688 GBP - GBP - GBP 0.076341 GBP - GBP - GBP 0.067254
Share Class 31 July
2020 28 August
2020 30 September
2020 30 October
2020 30 November
2020 31 December
2020
Class A (GBP) Income GBP - GBP - GBP 0.032431 GBP - GBP - GBP 0.025653 Class A (USD) Income GBP - GBP - GBP - GBP - GBP - GBP - Class R (GBP) Income GBP - GBP - GBP 0.035430 GBP - GBP - GBP 0.028079 Class U1 (GBP) Income GBP - GBP - GBP 0.035784 GBP - GBP - GBP 0.028363 Class U2 (GBP) Income GBP - GBP - GBP 0.037695 GBP - GBP - GBP 0.029883
Jupiter UK Smaller Companies Focus Fund
Share Class 31 December 2019 31 January
2020 28 February
2020 31 March
2020 30 April
2020 29 May
2020 30 June
2020
Class A (GBP) Income GBP 0.036873 GBP - GBP - GBP - GBP - GBP - GBP - Class R (GBP) Income GBP 0.027183 GBP - GBP - GBP - GBP - GBP - GBP - Class U1 (GBP) Income GBP 0.195975 GBP - GBP - GBP - GBP - GBP - GBP -

Jupiter Asset Management Series Plc Annual Report and Audited Financial Statements for the financial year ended 31 December 2020
Notes to the Financial Statements for the financial year ended 31 December 2020 (continued)
289
10. Distributions (continued)
For the financial year ended 31 December 2020 (continued)
Jupiter UK Smaller Companies Focus Fund (continued)
Share Class 31 July
2020 28 August
2020 30 September
2020 30 October
2020 30 November
2020 31 December
2020
Class A (GBP) Income GBP - GBP - GBP - GBP - GBP - GBP - Class R (GBP) Income GBP - GBP - GBP - GBP - GBP - GBP - Class U1 (GBP) Income GBP - GBP - GBP - GBP - GBP - GBP -
Jupiter UK Dynamic Equity Fund
Share Class 31 December
2019 31 January
2020 28 February
2020 31 March
2020 30 April
2020 29 May
2020 30 June
2020
Class A (GBP) Income GBP 0.027025 GBP - GBP - GBP - GBP - GBP - GBP - Class R (GBP) Income GBP 0.051301 GBP - GBP - GBP - GBP - GBP - GBP -
Share Class 31 July
2020 28 August
2020 30 September
2020 30 October
2020 30 November
2020 31 December
2020
Class A (GBP) Income GBP - GBP - GBP - GBP - GBP - GBP - Class R (GBP) Income GBP - GBP - GBP - GBP - GBP - GBP -
Jupiter Strategic Absolute Return Bond Fund
Share Class 31 December
2019 31 January
2020 28 February
2020 31 March
2020 30 April
2020 29 May
2020 30 June
2020
Class F2 (GBP) Hedged Income USD 0.005452 USD - USD - USD 0.002415 USD - USD - USD 0.004150
Share Class 31 July
2020 28 August
2020 30 September
2020 30 October
2020 30 November
2020 31 December
2020
Class F2 (GBP) Hedged Income USD - USD - USD 0.002972 USD - USD - USD 0.002549

Jupiter Asset Management Series Plc Annual Report and Audited Financial Statements for the financial year ended 31 December 2020
Notes to the Financial Statements for the financial year ended 31 December 2020 (continued)
290
10. Distributions (continued)
For the financial year ended 31 December 2020 (continued)
Jupiter Europe (ex UK) Smaller Companies Fund
Share Class 31 December
2019 31 January
2020 28 February
2020 31 March
2020 30 April
2020 29 May
2020 30 June
2020
Class R (GBP) Income EUR 0.381854 EUR - EUR - EUR - EUR - EUR - EUR - Class U1 (EUR) Income EUR 0.247982 EUR - EUR - EUR - EUR - EUR - EUR - Class U1 (GBP) Income EUR 0.388737 EUR - EUR - EUR - EUR - EUR - EUR -
Share Class 31 July
2020 28 August
2020 30 September
2020 30 October
2020 30 November
2020 31 December
2020
Class R (GBP) Income EUR - EUR - EUR - EUR - EUR - EUR 0.235782 Class U1 (EUR) Income EUR - EUR - EUR - EUR - EUR - EUR 0.153474 Class U1 (GBP) Income EUR - EUR - EUR - EUR - EUR - EUR 0.240754
Jupiter Merian Global Equity Income Fund (IRL)
Share Class 31 December
2019 31 January
2020 28 February
2020 31 March
2020 30 April
2020 29 May
2020 30 June
2020
Class A (GBP) Income USD 0.040792 USD 0.017995 USD 0.024122 USD 0.042828 USD 0.047779 USD 0.048547 USD 0.041044 Class A (USD) Income USD 0.026089 USD 0.011508 USD 0.015427 USD 0.027386 USD 0.030551 USD 0.031039 USD 0.026246 Class I (EUR) Income USD 0.025130 USD 0.011093 USD 0.014878 USD 0.026438 USD 0.029512 USD 0.030010 USD 0.025330 Class I (USD) Income USD 0.024475 USD 0.010803 USD 0.014491 USD 0.025752 USD 0.028746 USD 0.029226 USD 0.024668 Class R (GBP) Income USD 0.042244 USD 0.018647 USD 0.025011 USD 0.044446 USD 0.049615 USD 0.050449 USD 0.042578 Class U1 (GBP) Income USD 0.042044 USD 0.018560 USD 0.024896 USD 0.044238 USD 0.049385 USD 0.050198 USD 0.042378
Share Class 31 July
2020 28 August
2020 30 September
2020 30 October
2020 30 November
2020 31 December
2020
Class A (GBP) Income USD 0.037896 USD 0.046827 USD 0.051113 USD 0.016544 USD 0.022373 USD 0.038248 Class A (USD) Income USD 0.024224 USD 0.029932 USD 0.032672 USD 0.010575 USD 0.014302 USD 0.024448 Class I (EUR) Income USD 0.023448 USD 0.028994 USD 0.031668 USD 0.010256 USD 0.013880 USD 0.023741 Class I (USD) Income USD 0.022835 USD 0.028236 USD 0.030839 USD 0.009988 USD 0.013516 USD 0.023120 Class R (GBP) Income USD 0.039418 USD 0.048741 USD 0.053236 USD 0.017242 USD 0.023332 USD 0.039910 Class U1 (GBP) Income USD 0.039217 USD 0.048497 USD 0.052970 USD 0.017156 USD 0.023219 USD 0.039719

Jupiter Asset Management Series Plc Annual Report and Audited Financial Statements for the financial year ended 31 December 2020
Notes to the Financial Statements for the financial year ended 31 December 2020 (continued)
291
10. Distributions (continued)
For the financial year ended 31 December 2020 (continued)
Jupiter Financials Contingent Capital Fund
Share Class 31 December
2019 31 January
2020 28 February
2020 31 March
2020 30 April
2020 29 May
2020 30 June
2020
Class A(EUR) Hedged Income USD 0.057562 USD 0.051502 USD 0.045893 USD 0.051238 USD 0.052616 USD 0.054404 USD 0.060369 Class A(USD) Income USD 0.051655 USD 0.046277 USD 0.042055 USD 0.046692 USD 0.049018 USD 0.050587 USD 0.054393 Class F (EUR) Hedged Income USD 0.058495 USD 0.052398 USD 0.046734 USD 0.052228 USD 0.053688 USD 0.055562 USD 0.061710 Class F (GBP) Hedged Income USD 0.067713 USD 0.060616 USD 0.054733 USD 0.057604 USD 0.059890 USD 0.061359 USD 0.067003 Class F (USD) Income USD 0.053968 USD 0.048398 USD 0.044022 USD 0.048919 USD 0.051405 USD 0.053102 USD 0.057151 Class I (EUR) Hedged Income USD 0.058494 USD 0.052370 USD 0.046696 USD 0.052176 USD 0.053618 USD 0.055471 USD 0.061590 Class I (USD) Income USD 0.053646 USD 0.048094 USD 0.043733 USD 0.048584 USD 0.051036 USD 0.052706 USD 0.056708
Share Class 31 July
2020 28 August
2020 30 September
2020 30 October
2020 30 November
2020 31 December
2020
Class A(EUR) Hedged Income USD 0.058118 USD 0.050330 USD 0.055804 USD 0.052767 USD 0.057395 USD 0.056292 Class A(USD) Income USD 0.051623 USD 0.043183 USD 0.047986 USD 0.045542 USD 0.049331 USD 0.047119 Class F (EUR) Hedged Income USD 0.059465 USD 0.051542 USD 0.057200 USD 0.054138 USD 0.058935 USD 0.057857 Class F (GBP) Hedged Income USD 0.064176 USD 0.055881 USD 0.061557 USD 0.058287 USD 0.064295 USD 0.062538 Class F (USD) Income USD 0.054295 USD 0.045456 USD 0.050559 USD 0.048030 USD 0.052073 USD 0.049777 Class I (EUR) Hedged Income USD 0.059331 USD 0.051412 USD 0.057040 USD 0.053970 USD 0.058737 USD 0.057646 Class I (USD) Income USD 0.053857 USD 0.045077 USD 0.050123 USD 0.047601 USD 0.051592 USD 0.049303
The following Sub-Funds made no distributions in the financial year ended 31 December 2020: Jupiter China Equity Fund Merian Global Strategic Bond Fund (IRL)* Jupiter Merian World Equity Fund Jupiter Pacific Equity Fund Merian European Equity Fund Merian Japanese Equity Fund(b) Merian European Best Ideas Fund^^ Merian Investment Grade Corporate Bond Fund*** Jupiter Global Emerging Markets Focus Fund Jupiter Merian Global Equity Absolute Return Fund Merian Pan African Fund(c) Merian Monthly Income High Yield Bond Fund(a) Jupiter Gold & Silver Fund

Jupiter Asset Management Series Plc Annual Report and Audited Financial Statements for the financial year ended 31 December 2020
Notes to the Financial Statements for the financial year ended 31 December 2020 (continued)
292
10. Distributions (continued)
For the financial year ended 31 December 2020 (continued)
The following Sub-Funds made no distributions in the financial year ended 31 December 2020 (continued): Merian Compass Portfolio 2^ Merian Compass Portfolio 3^ Merian Compass Portfolio 4^ Merian Compass Portfolio 5^ Jupiter UK Specialist Equity Fund Merian Style Premia Absolute Return Fund**
For the financial year ended 31 December 2019
Merian Global Strategic Bond Fund (IRL)*
Share Class 31 December
2018 31 January
2019 28 February
2019 29 March
2019 30 April
2019 31 May
2019 28 June
2019
Class A (GBP) Income USD 0.085590 USD - USD - USD 0.078738 USD - USD - USD - Class A (USD) Income USD 0.022975 USD 0.025098 USD 0.009832 USD 0.014383 USD - USD - USD - Class B (USD) Income USD 0.022280 USD 0.024312 USD 0.009512 USD 0.013907 USD - USD - USD - Class S (GBP) Income USD 0.088952 USD - USD - USD 0.081847 USD - USD - USD - Class U1 (GBP) Income USD 0.097968 USD - USD - USD 0.090246 USD - USD - USD -
Share Class 31 July
2019 30 August
2019 30 September
2019 31 October
2019 29 November
2019 31 December
2019
Class A (GBP) Income USD - USD - USD - USD - USD - USD - Class A (USD) Income USD - USD - USD - USD - USD - USD - Class B (USD) Income USD - USD - USD - USD - USD - USD - Class S (GBP) Income USD - USD - USD - USD - USD - USD - Class U1 (GBP) Income USD - USD - USD - USD - USD - USD -
Merian US Equity Income Fund
Share Class 31 December
2018 31 January
2019 28 February
2019 29 March
2019 30 April
2019 31 May
2019 28 June
2019
Class A (USD) Income (F) USD - USD - USD - USD - USD - USD 0.039300 USD 0.040745 Class A (USD) Income USD 0.029420 USD 0.014199 USD 0.020655 USD 0.020976 USD 0.021664 USD 0.020419 USD 0.021214 Class B (USD) Income USD 0.026733 USD 0.012895 USD 0.018735 USD 0.018998 USD 0.019608 USD 0.018464 USD 0.019169 Class C (USD) Income USD 0.026791 USD 0.012921 USD 0.018767 USD 0.019021 USD 0.019621 USD 0.018470 USD 0.019167 Class C2 (USD) Income (F) USD - USD - USD - USD - USD - USD 0.039300 USD 0.040670

Jupiter Asset Management Series Plc Annual Report and Audited Financial Statements for the financial year ended 31 December 2020
Notes to the Financial Statements for the financial year ended 31 December 2020 (continued)
293
10. Distributions (continued)
For the financial year ended 31 December 2019 (continued)
Merian US Equity Income Fund (continued)
Share Class 31 December
2018 31 January
2019 28 February
2019 29 March
2019 30 April
2019 31 May
2019 28 June
2019
Class C2 (USD) Income USD 0.023580 USD 0.011368 USD 0.016501 USD 0.016725 USD 0.017260 USD 0.016254 USD 0.016873 Class I (EUR) Income USD 0.030646 USD 0.014802 USD 0.021548 USD 0.021905 USD 0.022640 USD - USD - Class I (USD) Income USD 0.025976 USD 0.012544 USD 0.018258 USD 0.018562 USD 0.019184 USD 0.018094 USD 0.018809 Class R (GBP) Income USD 0.047046 USD 0.022720 USD 0.033073 USD 0.033620 USD 0.034745 USD 0.032769 USD 0.034065 Class U1 (GBP) Income USD 0.031783 USD 0.015348 USD 0.022338 USD 0.022714 USD 0.023476 USD 0.022142 USD 0.023017 Class U2 (GBP) Income USD 0.039167 USD 0.018918 USD 0.027542 USD 0.028003 USD 0.028947 USD 0.027304 USD 0.028387
Share Class 31 July
2019 30 August
2019 30 September
2019 31 October
2019 29 November
2019 31 December
2019
Class A (USD) Income (F) USD 0.041496 USD 0.039655 USD 0.040170 USD 0.040805 USD 0.041984 USD 0.042475 Class A (USD) Income USD 0.021663 USD 0.020756 USD 0.021079 USD 0.019240 USD 0.022146 USD 0.021250 Class B (USD) Income USD 0.019557 USD 0.018699 USD 0.018974 USD 0.017435 USD 0.019900 USD 0.019102 Class C (USD) Income USD 0.019545 USD 0.018692 USD 0.018958 USD 0.017459 USD 0.019854 USD 0.019066 Class C2 (USD) Income (F) USD 0.041383 USD 0.039487 USD 0.039964 USD 0.040559 USD 0.041690 USD 0.042140 Class C2 (USD) Income USD 0.017215 USD 0.016468 USD 0.016709 USD 0.015351 USD 0.017511 USD 0.016817 Class I (EUR) Income USD - USD - USD - USD - USD - USD - Class I (USD) Income USD 0.019220 USD 0.018426 USD 0.018725 USD 0.017021 USD 0.019699 USD 0.018898 Class R (GBP) Income USD 0.034812 USD 0.033379 USD 0.033920 USD 0.030827 USD 0.035682 USD 0.034233 Class U1 (GBP) Income USD 0.023523 USD 0.022558 USD 0.022926 USD 0.020857 USD 0.024097 USD 0.023135 Class U2 (GBP) Income USD 0.029012 USD 0.027822 USD 0.028277 USD 0.025675 USD 0.029756 USD 0.028546
Merian North American Equity Fund
Share Class 31 December
2018 31 January
2019 28 February
2019 29 March
2019 30 April
2019 31 May
2019 28 June
2019
Class P2 (GBP) Income USD 0.096372 USD - USD - USD - USD - USD - USD - Class P2 (USD) Income USD 0.071288 USD - USD - USD 0.025048 USD - USD - USD 0.021107
Share Class 31 July
2019 30 August
2019 30 September
2019 31 October
2019 29 November
2019 31 December
2019
Class P2 (GBP) Income USD - USD - USD - USD - USD - USD 0.143658 Class P2 (USD) Income USD - USD - USD 0.034426 USD - USD - USD 0.029329

Jupiter Asset Management Series Plc Annual Report and Audited Financial Statements for the financial year ended 31 December 2020
Notes to the Financial Statements for the financial year ended 31 December 2020 (continued)
294
10. Distributions (continued)
For the financial year ended 31 December 2019 (continued)
Merian Global Dynamic Bond Fund
Share Class 31 December
2018 31 January
2019 28 February
2019 29 March
2019 30 April
2019 31 May
2019 28 June
2019
Class A (GBP) Income USD 0.171942 USD - USD - USD 0.137945 USD - USD - USD 0.106296 Class A (USD) Income USD 0.038475 USD 0.040127 USD 0.033557 USD 0.028380 USD 0.031909 USD 0.007155 USD 0.039660 Class A (USD) Income (F) USD 0.011782 USD 0.040239 USD 0.040081 USD 0.040512 USD 0.040305 USD 0.040968 USD 0.041794 Class A (AUD) Hedged Income (F) USD - USD - USD - USD - USD - USD 0.008929 USD 0.024402 Class A (ZAR) Hedged Income (F) USD 0.004828 USD 0.005256 USD 0.004980 USD 0.004832 USD 0.004879 USD 0.004805 USD 0.005103 Class B (USD) Income USD 0.034454 USD 0.035914 USD 0.030010 USD 0.025358 USD 0.028486 USD 0.006384 USD 0.035334 Class C (USD) Income USD 0.033086 USD 0.034471 USD 0.028793 USD 0.024320 USD 0.027307 USD 0.006120 USD 0.033834 Class C2 (AUD) Hedged Income (F) USD 0.021173 USD 0.021991 USD 0.021482 USD 0.021538 USD 0.021297 USD 0.021175 USD 0.021890 Class C2 (USD) Income (F) USD 0.036142 USD 0.036418 USD 0.036247 USD 0.036590 USD 0.036389 USD 0.036958 USD 0.037674 Class C2 (ZAR) Hedged Income (F) USD 0.004813 USD 0.005243 USD 0.004964 USD 0.004814 USD 0.004856 USD 0.004778 USD 0.005072
Share Class 31 July
2019 30 August
2019 30 September
2019 31 October
2019 29 November
2019 31 December
2019
Class A (GBP) Income USD - USD - USD 0.083780 USD - USD - USD 0.094284 Class A (USD) Income USD 0.023729 USD 0.019505 USD 0.018828 USD 0.021482 USD 0.026656 USD 0.021692 Class A (USD) Income (F) USD 0.041945 USD 0.042727 USD 0.042272 USD 0.042535 USD 0.042131 USD 0.041859 Class A (AUD) Hedged Income (F) USD 0.024090 USD 0.023932 USD 0.023753 USD 0.024391 USD 0.023740 USD 0.024416 Class A (ZAR) Hedged Income (F) USD 0.005106 USD 0.004853 USD 0.004808 USD 0.004850 USD 0.004973 USD 0.005156 Class B (USD) Income USD 0.021135 USD 0.017356 USD 0.016734 USD 0.019080 USD 0.023652 USD 0.019229 Class C (USD) Income USD 0.020237 USD 0.016612 USD 0.016008 USD 0.018245 USD 0.022608 USD 0.018374 Class C2 (AUD) Hedged Income (F) USD 0.021591 USD 0.021419 USD 0.021242 USD 0.021790 USD 0.021171 USD 0.021739 Class C2 (USD) Income (F) USD 0.037774 USD 0.038437 USD 0.037994 USD 0.038198 USD 0.037792 USD 0.037514 Class C2 (ZAR) Hedged Income (F) USD 0.005078 USD 0.004822 USD 0.004772 USD 0.004811 USD 0.004930 USD 0.005117

Jupiter Asset Management Series Plc Annual Report and Audited Financial Statements for the financial year ended 31 December 2020
Notes to the Financial Statements for the financial year ended 31 December 2020 (continued)
295
10. Distributions (continued)
For the financial year ended 31 December 2019 (continued)
Merian Emerging Market Debt Fund
Share Class 31 December
2018 31 January
2019 28 February
2019 29 March
2019 30 April
2019 31 May
2019 28 June
2019
Class A (SGD) Hedged Income USD 0.033072 USD 0.029892 USD 0.027028 USD 0.031647 USD 0.032604 USD 0.031661 USD 0.027676 Class A (USD) Income USD 0.049610 USD 0.044440 USD 0.040109 USD 0.047003 USD 0.048551 USD 0.047477 USD 0.041568 Class A (USD) Income (F) USD 0.054108 USD 0.056568 USD 0.057204 USD 0.057251 USD 0.057063 USD 0.056825 USD 0.058607 Class A (ZAR) Hedged Income (F) USD 0.006060 USD 0.006831 USD 0.006570 USD 0.006319 USD 0.006389 USD 0.006155 USD 0.006614 Class B (USD) Income USD 0.051475 USD 0.046073 USD 0.041544 USD 0.048644 USD 0.050205 USD 0.049058 USD 0.042908 Class C (USD) Income USD 0.053306 USD 0.047688 USD 0.042981 USD 0.050306 USD 0.051900 USD 0.050696 USD 0.044313 Class C2 (USD) Income (F) USD 0.053727 USD 0.056100 USD 0.056687 USD 0.056655 USD 0.056419 USD 0.056137 USD 0.057853 Class C2 (ZAR) Hedged Income (F) USD 0.005987 USD 0.006754 USD 0.006490 USD 0.006230 USD 0.006292 USD 0.006063 USD 0.006507 Class S (GBP) Income USD 0.233948 USD - USD - USD 0.202261 USD - USD - USD 0.211822 Class U1 (GBP) Income USD 0.257730 USD - USD - USD 0.222998 USD - USD - USD 0.233746
Share Class 31 July
2019 30 August
2019 30 September
2019 31 October
2019 29 November
2019 31 December
2019
Class A (SGD) Hedged Income USD 0.034894 USD 0.031738 USD 0.031114 USD 0.034303 USD 0.032400 USD 0.033348 Class A (USD) Income USD 0.052221 USD 0.048376 USD 0.047342 USD 0.051903 USD 0.048679 USD 0.050016 Class A (USD) Income (F) USD 0.058890 USD 0.058571 USD 0.058140 USD 0.057727 USD 0.057257 USD 0.058534 Class A (ZAR) Hedged Income (F) USD 0.006634 USD 0.006158 USD 0.006109 USD 0.006084 USD 0.006249 USD 0.006668 Class B (USD) Income USD 0.053866 USD 0.049852 USD 0.048738 USD 0.053388 USD 0.050022 USD 0.051347 Class C (USD) Income USD 0.055615 USD 0.051440 USD 0.050252 USD 0.055024 USD 0.051525 USD 0.052853 Class C2 (USD) Income (F) USD 0.058078 USD 0.057702 USD 0.057229 USD 0.056775 USD 0.056236 USD 0.057430 Class C2 (ZAR) Hedged Income (F) USD 0.006521 USD 0.006071 USD 0.006030 USD 0.005998 USD 0.006153 USD 0.006554 Class S (GBP) Income USD - USD - USD 0.228143 USD - USD - USD 0.232460 Class U1 (GBP) Income USD - USD - USD 0.251995 USD - USD - USD 0.256968

Jupiter Asset Management Series Plc Annual Report and Audited Financial Statements for the financial year ended 31 December 2020
Notes to the Financial Statements for the financial year ended 31 December 2020 (continued)
296
10. Distributions (continued)
For the financial year ended 31 December 2019 (continued)
Merian Investment Grade Corporate Bond Fund***
Share Class 31 December
2018 31 January
2019 28 February
2019 29 March
2019 30 April
2019 31 May
2019 28 June
2019
Class A (GBP) Hedged Income USD 0.091426 USD - USD - USD 0.083821 USD - USD - USD 0.095855 Class A (USD) Income USD 0.075053 USD - USD - USD 0.068430 USD - USD - USD 0.079209 Class S (GBP) Hedged Income USD 0.098158 USD - USD - USD 0.090021 USD - USD - USD 0.102960 Class U1 (GBP) Hedged Income USD 0.091333 USD - USD - USD 0.083846 USD - USD - USD 0.095982
Share Class 31 July
2019 30 August
2019 30 September
2019 31 October
2019 29 November
2019 31 December
2019
Class A (GBP) Hedged Income USD - USD - USD - USD - USD - USD - Class A (USD) Income USD - USD - USD - USD - USD - USD - Class S (GBP) Hedged Income USD - USD - USD - USD - USD - USD - Class U1 (GBP) Hedged Income USD - USD - USD - USD - USD - USD -
Merian Asian Equity Income Fund
Share Class 31 December
2018 31 January
2019 28 February
2019 29 March
2019 30 April
2019 31 May
2019 28 June
2019
Class A (GBP) Income USD 0.061588 USD 0.009672 USD 0.022537 USD 0.035867 USD 0.026608 USD 0.044590 USD 0.046809 Class A (USD) Income USD 0.043224 USD 0.006782 USD 0.015784 USD 0.025189 USD 0.018665 USD 0.031275 USD 0.032830 Class A (USD) Income (F) USD - USD - USD - USD - USD 0.003099 USD 0.049429 USD 0.051807 Class C2 (USD) Income (F) USD 0.053165 USD 0.054185 USD 0.054637 USD 0.055040 USD 0.055518 USD 0.050708 USD 0.053071 Class U1 (GBP) Income USD 0.062534 USD 0.009825 USD 0.022916 USD 0.036457 USD 0.027085 USD 0.045409 USD 0.047697 Class U2 (GBP) Income USD 0.060376 USD 0.009487 USD 0.022129 USD 0.035236 USD 0.026159 USD 0.043893 USD 0.046109
Share Class 31 July
2019 30 August
2019 30 September
2019 31 October
2019 29 November
2019 31 December
2019
Class A (GBP) Income USD 0.045959 USD - USD - USD - USD - USD - Class A (USD) Income USD 0.032235 USD 0.035494 USD 0.036165 USD 0.037155 USD 0.037279 USD 0.057065 Class A (USD) Income (F) USD 0.050743 USD 0.047697 USD 0.048515 USD 0.044436 USD 0.044571 USD 0.047025 Class C2 (USD) Income (F) USD 0.051943 USD 0.048757 USD 0.049548 USD 0.045343 USD 0.045394 USD 0.047850 Class U1 (GBP) Income USD 0.046866 USD 0.051642 USD 0.052653 USD 0.054152 USD 0.054439 USD 0.082872 Class U2 (GBP) Income USD 0.045309 USD 0.049950 USD 0.050928 USD 0.052406 USD 0.052668 USD 0.080048

Jupiter Asset Management Series Plc Annual Report and Audited Financial Statements for the financial year ended 31 December 2020
Notes to the Financial Statements for the financial year ended 31 December 2020 (continued)
297
10. Distributions (continued)
For the financial year ended 31 December 2019 (continued)
Merian Local Currency Emerging Market Debt Fund
Share Class 31 December
2018 31 January
2019 28 February
2019 29 March
2019 30 April
2019 31 May
2019 28 June
2019
Class A (AUD) Hedged Income (F) USD 0.035147 USD 0.037783 USD 0.036759 USD 0.035537 USD 0.034875 USD 0.033713 USD 0.036101 Class A (GBP) Income USD 0.182470 USD - USD - USD 0.165602 USD - USD - USD 0.172759 Class A (USD) Income USD 0.038594 USD 0.042758 USD 0.036805 USD 0.029931 USD 0.037200 USD 0.036931 USD 0.039994 Class A (USD) Income (F) USD 0.056121 USD 0.058627 USD 0.058126 USD 0.056617 USD 0.055865 USD 0.055163 USD 0.058249 Class A (ZAR) Hedged Income (F) USD 0.005892 USD 0.006647 USD 0.006262 USD 0.005854 USD 0.005858 USD 0.005601 USD 0.006158 Class B (AUD) Hedged Income (F) USD 0.034717 USD 0.037326 USD 0.036285 USD 0.035062 USD 0.034378 USD 0.033204 USD 0.035532 Class B (USD) Income USD 0.038283 USD 0.042407 USD 0.036472 USD 0.029635 USD 0.036808 USD 0.036516 USD 0.039507 Class B (ZAR) Hedged Income (F) USD 0.005842 USD 0.006586 USD 0.006200 USD 0.005791 USD 0.005790 USD 0.005531 USD 0.006075 Class C (USD) Income USD 0.031487 USD 0.034862 USD 0.029973 USD 0.024344 USD 0.030226 USD 0.029973 USD 0.032413 Class C2 (AUD) Hedged Income (F) USD 0.034734 USD 0.037345 USD 0.036304 USD 0.035079 USD 0.034396 USD 0.033221 USD 0.035550 Class C2 (USD) Income (F) USD 0.058349 USD 0.060885 USD 0.060317 USD 0.058697 USD 0.057892 USD 0.057123 USD 0.060276 Class C2 (ZAR) Hedged Income (F) USD 0.005821 USD 0.006562 USD 0.006177 USD 0.005770 USD 0.005769 USD 0.005511 USD 0.006054 Class U1 (GBP) Income USD 0.247531 USD - USD - USD 0.225268 USD - USD - USD 0.235508 Class U2 (GBP) Income USD 0.252702 USD - USD - USD 0.230068 USD - USD - USD 0.240707
Share Class 31 July
2019 30 August
2019 30 September
2019 31 October
2019 29 November
2019 31 December
2019
Class A (AUD) Hedged Income (F) USD 0.035616 USD 0.033389 USD 0.033813 USD 0.035182 USD 0.033810 USD 0.036315 Class A (GBP) Income USD - USD - USD 0.166222 USD - USD - USD 0.176124 Class A (USD) Income USD 0.039574 USD 0.031684 USD 0.038553 USD 0.041968 USD 0.031311 USD 0.043043 Class A (USD) Income (F) USD 0.058429 USD 0.056219 USD 0.056771 USD 0.057893 USD 0.056639 USD 0.058787 Class A (ZAR) Hedged Income (F) USD 0.006164 USD 0.005534 USD 0.005590 USD 0.005714 USD 0.005787 USD 0.006264 Class B (AUD) Hedged Income (F) USD 0.035020 USD 0.032830 USD 0.033218 USD 0.034532 USD 0.033156 USD 0.035580 Class B (USD) Income USD 0.039064 USD 0.031247 USD 0.037985 USD 0.041313 USD 0.030793 USD 0.042289 Class B (ZAR) Hedged Income (F) USD 0.006076 USD 0.005450 USD 0.005502 USD 0.005619 USD 0.005685 USD 0.006149 Class C (USD) Income USD 0.032038 USD 0.025616 USD 0.031127 USD 0.033839 USD 0.025213 USD 0.034613 Class C2 (AUD) Hedged Income (F) USD 0.035038 USD 0.032843 USD 0.033231 USD 0.034541 USD 0.033145 USD 0.035567 Class C2 (USD) Income (F) USD 0.060409 USD 0.058089 USD 0.058607 USD 0.059711 USD 0.058333 USD 0.060493 Class C2 (ZAR) Hedged Income (F) USD 0.006055 USD 0.005429 USD 0.005482 USD 0.005598 USD 0.005659 USD 0.006122 Class U1 (GBP) Income USD - USD - USD 0.227046 USD - USD - USD 0.240974 Class U2 (GBP) Income USD - USD - USD 0.232233 USD - USD - USD 0.246801

Jupiter Asset Management Series Plc Annual Report and Audited Financial Statements for the financial year ended 31 December 2020
Notes to the Financial Statements for the financial year ended 31 December 2020 (continued)
298
10. Distributions (continued)
For the financial year ended 31 December 2019 (continued)
Merian UK Alpha Fund (IRL)
Share Class 31 December
2018 31 January
2019 28 February
2019 29 March
2019 30 April
2019 31 May
2019 28 June
2019
Class A (GBP) Income GBP 0.055596 GBP - GBP - GBP 0.102648 GBP - GBP - GBP 0.143754 Class A (USD) Income GBP 0.034628 GBP - GBP - GBP 0.063873 GBP - GBP - GBP 0.089443 Class R (GBP) Income GBP 0.059937 GBP - GBP - GBP 0.110926 GBP - GBP - GBP 0.155547 Class U1 (GBP) Income GBP 0.060452 GBP - GBP - GBP 0.111904 GBP - GBP - GBP 0.156936 Class U2 (GBP) Income GBP 0.063598 GBP - GBP - GBP 0.117758 GBP - GBP - GBP 0.165170
Share Class 31 July
2019 30 August
2019 30 September
2019 31 October
2019 29 November
2019 31 December
2019
Class A (GBP) Income GBP - GBP - GBP 0.115204 GBP - GBP - GBP 0.062976 Class A (USD) Income GBP - GBP - GBP - GBP - GBP - GBP - Class R (GBP) Income GBP - GBP - GBP 0.124912 GBP - GBP - GBP 0.068402 Class U1 (GBP) Income GBP - GBP - GBP 0.126053 GBP - GBP - GBP 0.069040 Class U2 (GBP) Income GBP - GBP - GBP 0.132693 GBP - GBP - GBP 0.072688
Jupiter UK Smaller Companies Focus Fund
Share Class 31 December
2018 31 January
2019 28 February
2019 29 March
2019 30 April
2019 31 May
2019 28 June
2019
Class A (GBP) Income GBP - GBP - GBP - GBP - GBP - GBP - GBP - Class R (GBP) Income GBP - GBP - GBP - GBP - GBP - GBP - GBP - Class U1 (GBP) Income GBP - GBP - GBP - GBP - GBP - GBP - GBP -
Share Class 31 July
2019 30 August
2019 30 September
2019 31 October
2019 29 November
2019 31 December
2019
Class A (GBP) Income GBP - GBP - GBP - GBP - GBP - GBP 0.036873 Class R (GBP) Income GBP - GBP - GBP - GBP - GBP - GBP 0.027183 Class U1 (GBP) Income GBP - GBP - GBP - GBP - GBP - GBP 0.195975
Merian UK Dynamic Equity Fund
Share Class 31 December
2018 31 January
2019 28 February
2019 29 March
2019 30 April
2019 31 May
2019 28 June
2019
Class A (GBP) Income GBP 0.003951 GBP - GBP - GBP - GBP - GBP - GBP - Class R (GBP) Income GBP 0.028956 GBP - GBP - GBP - GBP - GBP - GBP -

Jupiter Asset Management Series Plc Annual Report and Audited Financial Statements for the financial year ended 31 December 2020
Notes to the Financial Statements for the financial year ended 31 December 2020 (continued)
299
10. Distributions (continued)
For the financial year ended 31 December 2019 (continued)
Merian UK Dynamic Equity Fund (continued)
Share Class 31 July
2019 30 August
2019 30 September
2019 31 October
2019 29 November
2019 31 December
2019
Class A (GBP) Income GBP - GBP - GBP - GBP - GBP - GBP 0.027025 Class R (GBP) Income GBP - GBP - GBP - GBP - GBP - GBP 0.051301
Merian Strategic Absolute Return Bond Fund
Share Class 31 December
2018 31 January
2019 28 February
2019 29 March
2019 30 April
2019 31 May
2019 28 June
2019
Class F2 (GBP) Hedged Income USD 0.007302 USD - USD - USD 0.006554 USD - USD - USD 0.006862
Share Class 31 July
2019 30 August
2019 30 September
2019 31 October
2019 29 November
2019 31 December
2019
Class F2 (GBP) Hedged Income USD - USD - USD 0.003853 USD - USD - USD 0.005452
Merian Europe (ex UK) Smaller Companies Fund
Share Class 31 December
2018 31 January
2019 28 February
2019 29 March
2019 30 April
2019 31 May
2019 28 June
2019
Class R (GBP) Income EUR 0.351097 EUR - EUR - EUR - EUR - EUR - EUR - Class U1 (EUR) Income EUR 0.227472 EUR - EUR - EUR - EUR - EUR - EUR - Class U1 (GBP) Income EUR 0.355910 EUR - EUR - EUR - EUR - EUR - EUR -
Share Class 31 July
2019 30 August
2019 30 September
2019 31 October
2019 29 November
2019 31 December
2019
Class R (GBP) Income EUR - EUR - EUR - EUR - EUR - EUR 0.381854 Class U1 (EUR) Income EUR - EUR - EUR - EUR - EUR - EUR 0.247982 Class U1 (GBP) Income EUR - EUR - EUR - EUR - EUR - EUR 0.388737
Merian Global Equity Income Fund (IRL)
Share Class 31 December
2018 31 January
2019 28 February
2019 29 March
2019 30 April
2019 31 May
2019 28 June
2019
Class A (GBP) Income USD 0.090362 USD 0.013279 USD 0.029156 USD 0.048459 USD 0.049214 USD 0.046518 USD 0.048669 Class A (USD) Income USD 0.057854 USD 0.008497 USD 0.018657 USD 0.031009 USD 0.031487 USD 0.029763 USD 0.031138 Class I (EUR) Income USD 0.029364 USD 0.008121 USD 0.017847 USD 0.029693 USD 0.030173 USD 0.028539 USD 0.029875 Class I (USD) Income USD 0.053545 USD 0.007913 USD 0.017386 USD 0.028922 USD 0.029392 USD 0.027800 USD 0.029102 Class R (GBP) Income USD 0.092379 USD 0.013655 USD 0.030002 USD 0.049912 USD 0.050722 USD 0.047975 USD 0.050222 Class U1 (GBP) Income USD 0.091988 USD 0.013592 USD 0.029866 USD 0.049689 USD 0.050491 USD 0.047760 USD 0.049998

Jupiter Asset Management Series Plc Annual Report and Audited Financial Statements for the financial year ended 31 December 2020
Notes to the Financial Statements for the financial year ended 31 December 2020 (continued)
300
10. Distributions (continued)
For the financial year ended 31 December 2019 (continued)
Merian Global Equity Income Fund (IRL) (continued)
Share Class 31 July
2019 30 August
2019 30 September
2019 31 October
2019 29 November
2019 31 December
2019
Class A (GBP) Income USD 0.048615 USD 0.052403 USD 0.053542 USD 0.054917 USD 0.053775 USD 0.040792 Class A (USD) Income USD 0.031103 USD 0.033521 USD 0.034250 USD 0.035129 USD 0.034414 USD 0.026089 Class I (EUR) Income USD 0.029863 USD 0.032210 USD 0.032932 USD 0.033799 USD 0.032894 USD 0.025130 Class I (USD) Income USD 0.029088 USD 0.031373 USD 0.032076 USD 0.032920 USD 0.032044 USD 0.024475 Class R (GBP) Income USD 0.050200 USD 0.054146 USD 0.055359 USD 0.056818 USD 0.055295 USD 0.042244 Class U1 (GBP) Income USD 0.049978 USD 0.053896 USD 0.055105 USD 0.056559 USD 0.055048 USD 0.042044
Merian Financials Contingent Capital Fund
Share Class 31 December
2018 31 January
2019 28 February
2019 29 March
2019 30 April
2019 31 May
2019 28 June
2019
Class A(EUR) Hedged Income USD - USD - USD - USD - USD - USD - USD - Class A(USD) Income USD 0.047731 USD 0.046038 USD 0.044393 USD 0.043733 USD 0.053208 USD 0.040551 USD 0.053225 Class F (EUR) Hedged Income USD - USD - USD - USD - USD - USD - USD - Class F (GBP) Hedged Income USD 0.061169 USD 0.059837 USD 0.058161 USD 0.058155 USD 0.069909 USD 0.062288 USD 0.068015 Class F (USD) Income USD 0.049323 USD 0.047615 USD 0.045956 USD 0.045309 USD 0.055178 USD 0.042089 USD 0.055265 Class I (EUR) Hedged Income USD - USD - USD - USD - USD - USD - USD - Class I (USD) Income USD 0.049202 USD 0.047484 USD 0.045816 USD 0.045160 USD 0.054979 USD 0.041926 USD 0.055044
Share Class 31 July
2019 30 August
2019 30 September
2019 31 October
2019 29 November
2019 31 December
2019
Class A(EUR) Hedged Income USD - USD - USD - USD 0.022310 USD 0.048876 USD 0.057562 Class A(USD) Income USD 0.050644 USD 0.047522 USD 0.047794 USD 0.050977 USD 0.043890 USD 0.051655 Class F (EUR) Hedged Income USD - USD - USD - USD 0.052227 USD 0.049614 USD 0.058495 Class F (GBP) Hedged Income USD 0.063692 USD 0.057942 USD 0.059165 USD 0.064465 USD 0.056725 USD 0.067713 Class F (USD) Income USD 0.052666 USD 0.049467 USD 0.049796 USD 0.053163 USD 0.045815 USD 0.053968 Class I (EUR) Hedged Income USD 0.013017 USD 0.054293 USD 0.054017 USD 0.057676 USD 0.049643 USD 0.058494 Class I (USD) Income USD 0.052430 USD 0.049230 USD 0.049543 USD 0.052877 USD 0.045554 USD 0.053646

Jupiter Asset Management Series Plc Annual Report and Audited Financial Statements for the financial year ended 31 December 2020
Notes to the Financial Statements for the financial year ended 31 December 2020 (continued)
301
10. Distributions (continued)
For the financial year ended 31 December 2019 (continued)
The following Sub-Funds made no distributions in the financial year ended 31 December 2019: Merian China Equity Fund Merian World Equity Fund Merian Pacific Equity Fund Merian European Equity Fund Merian European Best Ideas Fund^^ Merian Global Emerging Markets Fund Merian Global Equity Absolute Return Fund Merian Gold & Silver Fund Merian Compass Portfolio 2^ Merian Compass Portfolio 3^ Merian Compass Portfolio 4^ Merian Compass Portfolio 5^ Merian UK Specialist Equity Fund Merian Style Premia Absolute Return Fund**
11. Financial Instruments and Associated Risks
In pursuing its investment objectives, the Company holds financial derivative instruments. The Company’s financial derivative instruments held at 31 December 2020 and at 31 December 2019 are disclosed in the Portfolio of Investments. Efficient Portfolio Management (“EPM”) The Company may employ investment techniques and instruments for efficient portfolio management purposes and for hedging purposes, subject to the conditions and within the limits from time to time laid down by the Central Bank of Ireland (“Central Bank”) under the UCITS Regulations and in the Prospectus. These techniques and instruments may be exchange-traded or over-the-counter derivatives and shall include futures (such as currency future contracts), options, options on futures, currency exchange contracts, convertible securities, hybrid securities, structured notes, credit default swaps and swap agreements. For financial derivative instruments that were entered into during the financial year which remained open at year end and the resulting amount of commitments/exposures, please refer to the Portfolio of Investments. The Manager oversees the efficient portfolio management operations carried out by the Investment Manager. Efficient portfolio management transactions relating to the assets of a Sub-Fund may be entered into by the Investment Manager with one of the following aims: a) a reduction of risk; b) a reduction of cost with no increase or a minimal increase in risk; c) generation of additional capital or income with no, or an acceptably low level of risk (relative to the expected return) and the diversification requirements in accordance with the Central Bank’s Regulations. In relation to efficient portfolio management operations the Investment Manager will look to ensure that the techniques and instruments used are economically appropriate in that they will be realised in a cost-effective way. The use of efficient portfolio management techniques will only be used in line with the best interests of a Sub-Fund. The use of FDI (“Financial Derivative Instruments”) and efficient portfolio management techniques for the purposes outlined above will expose the Company to the risks including, but not limited to, market risk, global derivative exposure as Value-at-Risk (“VaR”) approach. Please refer to the Portfolio of Investments for range of FDIs which the Sub-Fund may have used for efficient portfolio management purposes during the period under review. Where necessary, the Company will accept collateral from its counterparties in order to reduce counterparty risk exposure generated through the use of over the counter derivative instruments and EPM techniques. The type and amount of collateral received is outlined in Note 7.

Jupiter Asset Management Series Plc Annual Report and Audited Financial Statements for the financial year ended 31 December 2020
Notes to the Financial Statements for the financial year ended 31 December 2020 (continued)
302
11. Financial Instruments and Associated Risks (continued)
Efficient Portfolio Management (“EPM”) (continued) For UCITS which have engaged in EPM techniques disclosures are required under the Central Bank UCITS Regulations. A UCITS is required to disclose the revenues arising from EPM techniques for the entire reporting period together with the direct and indirect operational costs and fees incurred, unless the costs associated with EPM techniques are embedded and not separately identifiable. All revenues from EPM techniques, net of direct and indirect operational costs, will be returned to the relevant Sub-Fund. Any direct and indirect operational costs/fees arising from EPM techniques do not include hidden revenue. Any gains or losses arising from EPM techniques and investments are recognised in the Statement of Operations. Repurchase, reverse repurchase and stock lending arrangements are EPM techniques. The Sub-Funds did not engage in any repurchase, reverse repurchase and stock lending arrangements during the financial year. Futures contracts will be used to hedge against market risk or gain exposure to an underlying market. Currency exchange contracts will be used to hedge or gain exposure to an increase in the value of an asset, currency, or deposit. Options will be used to hedge or achieve exposure to a particular market instead of using a physical security. Swaps (including swaptions) will be used to achieve profit as well as to hedge existing long positions. Currency exchange contracts will be used to reduce the risk of adverse market changes in exchange rates or to increase exposure to foreign currencies or to shift exposure to foreign currency fluctuations from one country to another. Credit default swaps will be used to isolate and transfer the exposure to or transfer the credit risk associated with a reference asset or index of reference assets.
The Company may, for the purposes of efficient portfolio management, enter into futures contracts, currency exchange contracts, options, swaps, swaptions, convertible securities and structured notes, in order to hedge currency and market exposure and/or for investment purposes. Futures, swaps, options, swaptions and currency exchange contracts open as at 31 December 2020 are disclosed in the Portfolio of Investments. Risk is inherent in the activities of each Sub-Fund but it is managed through a process of ongoing identification, measurement and monitoring, subject to risks limits and other controls. The main risks arising from the Company’s financial instruments are market risk, liquidity risk and credit risk.
(a) Market Price Risk
Market price risk results mainly from uncertainty about the future prices of financial instruments held. It represents the potential loss a Sub-Fund may suffer through holding market positions in the face of market movements and changes in exchange rates. The Sub-Funds manage the risk by ensuring careful selection of securities and other financial instruments within the specified limits detailed in the Prospectus. In practice, the actual trading results may differ from the sensitivity analysis below and the difference could be material. The following tables highlight the market price risk associated with the various financial instruments held by the Company, the market price risk of futures is shown separately by Sub-Fund. Financial derivative instruments other than Contracts for Difference and Futures do not include market price risk.

Jupiter Asset Management Series Plc Annual Report and Audited Financial Statements for the financial year ended 31 December 2020
Notes to the Financial Statements for the financial year ended 31 December 2020 (continued)
303
11. Financial Instruments and Associated Risks (continued) (a) Market Price Risk (continued) If the price of each of these investments to which the Sub-Funds had exposure at financial year end had increased or decreased by 5% with all other variables held constant, this would have increased or decreased net assets attributable to holders of redeemable shares as below.
Jupiter Asset
Management Series Plc
Impact of 5% price increase
Jupiter Asset Management
Series Plc Impact of 5% price
increase
Fair Value Fair Value 31-Dec-20 31-Dec-20 31-Dec-19 31-Dec-19 USD USD USD USD
Equities 4,699,006,948 234,950,347 7,149,838,041 357,491,902
Government Bonds 761,003,704 38,050,185 2,109,005,336 105,450,267
Corporate Bonds 227,372,616 11,368,631 470,081,809 23,504,090
Investment Funds 186,658,704 9,332,935 105,688,932 5,284,447
Contracts for Difference (24,615,098) (77,204,059) (50,372,671) (146,477,998)
Futures Nominal Nominal
Jupiter Merian World Equity Fund 589,879 29,494 4,406,894 220,345 Jupiter Pacific Equity Fund 1,117,913 55,896 1,450,744 72,537 Merian European Equity Fund 318,600 15,930 335,205 16,760 Jupiter Merian US Equity Income Fund 7,639,069 381,953 (3,707,456) (185,373) Jupiter Merian North American Equity Fund (IRL) 16,209,731 810,487 9,510,431 475,522 Merian Global Dynamic Bond Fund (33,516,774) (1,675,839) 90,338,267 4,516,913 Merian Asian Equity Income Fund 1,117,913 55,896 1,773,131 88,657 Jupiter Strategic Absolute Return Bond Fund (38,539,507) (1,926,975) (47,498,745) (2,374,937)
Jupiter Merian Global Equity Income Fund (IRL) 906,544 45,327 2,896,112 144,806
Jupiter Financials Contingent Capital Fund - - (4,477,302) (223,865)
Conversely, if the price of each of the underlying investments to which the relevant Company has exposure had decreased by 5%, this would have an equal but opposite effect on net assets attributable to holders of redeemable participating shares.
The above analysis is strictly a mathematical exercise and has many improbable assumptions including, (i) stocks of financial services companies perform exactly in line with the broad equities market (ii) both long and short positions in the portfolio perform exactly in line with stocks of financial services companies and (iii) the Investment Manager does not change the composition of the portfolio intra-period (Investors and prospective investors should not place any reliance on this analysis, as the actual effect of a 5% change in equity prices will differ materially from the effect described in the above). The Investment Manager does not believe this analysis should be used to assess the risk or potential performance of its strategy. Adherence to the investment guidelines and to investment and borrowing powers set out in the instrument of incorporation, the Prospectus and the notices issued by the Central Bank mitigates the risk of excessive exposure per industry to any particular type of security or issuer. Each Sub-Fund’s market risk is managed on a daily basis by the Manager and the policies and processes are detailed in the Company's risk management process. Each Sub-Fund's overall market positions are advised on a regular basis to the Board of Directors. Emerging markets provide new investment opportunities, such as elevated economic growth rates, higher expected returns and diversification benefits. Accordingly, these markets may be insufficiently liquid and levels of volatility in price movements may be greater than those experienced in more developed economies and markets. The value of the assets of a Sub-Fund investing in developing markets may be adversely affected by uncertainties. There can be no assurance that the Sub-Funds will achieve their investment objectives.

Jupiter Asset Management Series Plc Annual Report and Audited Financial Statements for the financial year ended 31 December 2020
Notes to the Financial Statements for the financial year ended 31 December 2020 (continued)
304
11. Financial Instruments and Associated Risks (continued)
(b) Liquidity Risk Liquidity risk is the risk that an entity will encounter difficulty in meeting obligations associated with financial liabilities. The Company’s constitutional documents provides for the creation and cancellation of Shares on each Dealing Day and it is therefore exposed to the liquidity risk of meeting shareholder redemptions at any time. Assets from a Sub-Fund may need to be sold if insufficient cash is available to finance redemptions. The Sub-Funds’ listed securities are considered to be readily realisable as they are principally listed on major European, Asian and US stock exchanges. In the case of transferable securities not traded on a Regulated Market liquidity is not automatically presumed. The Sub-Funds therefore assess the liquidity of such securities where this is necessary. If the security is assessed as insufficiently liquid to meet foreseeable redemption requests the security must only be bought or held if the other securities held in the portfolio are deemed sufficiently liquid so as to be able to ensure compliance with Regulation 104(1) of the UCITS Regulations. Therefore before making an investment, the Investment Manager may consider in relation to liquidity risk:
1. The volume and turnover in the transferable security; 2. If price is determined by supply and demand in the market, the issue size and the portion of the issue that the investment
manager plans to buy; 3. The opportunity and timeframe to buy or sell the transferable security; and 4. The quality of the secondary market in a transferable security and an analysis of the quality and number of intermediaries
and market makers available for that security. The risks associated with securities in which the Sub-Funds have invested are assessed on an ongoing basis. The Company may temporarily suspend the repurchase of Shares in any Sub-Fund. No suspensions have taken place during the financial year. More information on this type of liquidity risk can be found in the Prospectus. From 30 September 2020 the Manager has adopted the European Securities and Markets Authority (ESMA) Guidelines on Liquidity stress testing in UCITs and AIFs issued July 2020 and has enhanced its liquidity stress testing and policy, where appropriate in line with the ESMA guidance.

Jupiter Asset Management Series Plc Annual Report and Audited Financial Statements for the financial year ended 31 December 2020
Notes to the Financial Statements for the financial year ended 31 December 2020 (continued)
305
11. Financial Instruments and Associated Risks (continued)
(b) Liquidity Risk (continued)
Inflows and Outflows from currency exchange contracts and liabilities of other derivatives are detailed in the tables below. All other liabilities disclosed in the Statement of Financial Position on pages 182 to 190 are settled within 1 - 3 months. 31 December 2020
Sub-Fund
Sub-Fund CCY 1-3 Months 3 Months - 1 Year >1 Year
Jupiter Merian World Equity Fund USD (1,546) - - Merian Global Dynamic Bond Fund USD (222,597) - (1,464,999)
Jupiter Local Currency Emerging Market Debt Fund USD - - (370,801)
Jupiter UK Dynamic Equity Fund GBP - - (3,519) Jupiter Merian Global Equity Absolute Return Fund USD - - (36,276,978) Jupiter Strategic Absolute Return Bond Fund USD (140,710) - (602,526) Jupiter UK Specialist Equity Fund GBP - - (22,912,796)

Jupiter Asset Management Series Plc Annual Report and Audited Financial Statements for the financial year ended 31 December 2020
Notes to the Financial Statements for the financial year ended 31 December 2020 (continued)
306
11. Financial Instruments and Associated Risks (continued)
(b) Liquidity risk (continued)
Currency Exchange Contracts 31 December 2020 Inflows Outflows
Sub-Fund Sub-Fund CCY <1 Month 1-3 Months
3 Months - 1 Year <1 Month 1-3 Months
3 Months - 1 Year
Jupiter China Equity Fund USD 652,293 - - (652,456) - -
Jupiter Merian World Equity Fund USD 994,737 - - (983,424) - -
Merian European Equity Fund EUR
Jupiter Merian US Equity Income Fund USD 18,255,438 - - (18,184,126) - -
Jupiter Merian North American Equity Fund (IRL) USD 40,824,366 - - (39,745,612) - -
Merian Global Dynamic Bond Fund USD 192,114,854 - - (194,603,410) - -
Jupiter Emerging Market Debt Fund USD 16,170,404 4,707,461 - (16,220,557) (4,654,040) -
Jupiter Local Currency Emerging Market Debt Fund USD 80,498,064 33,236,160 - (78,876,033) (32,879,619) -
Jupiter UK Alpha Fund (IRL) GBP 373,832 - - (384,739) - -
Jupiter UK Dynamic Equity Fund GBP 9,046,062 - - (9,201,668) - -
Jupiter Merian Global Equity Absolute Return Fund USD 2,049,122,924 - - (2,038,504,157) - -
Jupiter Strategic Absolute Return Bond Fund USD 184,244,379 - - (182,954,790) - -
Jupiter Europe (ex UK) Smaller Companies Fund EUR 763,442 - - (766,234) - -
Jupiter Gold & Silver Fund USD 88,721 - - (87,928) - -
Jupiter UK Specialist Equity Fund GBP 56,370,625 - - (57,917,437) - -
Jupiter Financials Contingent Capital Fund USD 135,969,847 - - (136,993,182) - -

Jupiter Asset Management Series Plc Annual Report and Audited Financial Statements for the financial year ended 31 December 2020
Notes to the Financial Statements for the financial year ended 31 December 2020 (continued)
307
11. Financial Instruments and Associated Risks (continued)
(b) Liquidity risk (continued) 31 December 2019
Sub-Fund
Sub-Fund CCY 1-3 Months 3 Months - 1 Year >1 Year
Merian World Equity Fund USD (10,636) - -
Merian Pacific Equity Fund USD (608) - -
Merian European Equity Fund EUR (2,255) - -
Merian US Equity Income Fund USD (5,685) - -
Merian Global Dynamic Bond Fund USD (479,546) - (2,380,964)
Merian Local Currency Emerging Market Debt Fund USD - - (210,687)
Merian UK Dynamic Equity Fund GBP - - (26,850)
Merian Global Equity Absolute Return Fund USD - - (92,249,633)
Merian Strategic Absolute Return Bond Fund USD (48,803) (54,525) (2,498,505)
Merian Global Equity Income Fund (IRL) USD (3,855) - -
Merian UK Specialist Equity Fund GBP - - (5,420,597)
Merian Financials Contingent Capital Fund USD - - (2,056,131)

Jupiter Asset Management Series Plc Annual Report and Audited Financial Statements for the financial year ended 31 December 2020
Notes to the Financial Statements for the financial year ended 31 December 2020 (continued)
308
11. Financial Instruments and Associated Risks (continued)
(b) Liquidity risk (continued)
Currency Exchange Contracts 31 December 2019 Inflows Outflows
Sub-Fund Sub-Fund CCY <1 Month 1-3 Months
3 Months - 1 Year <1 Month 1-3 Months
3 Months - 1 Year
Merian China Equity Fund USD 663,922 - - (664,067) - -
Merian World Equity Fund USD 2,810,487 - - (2,791,513) - -
Merian European Equity Fund EUR 215,567 - - (217,092) - -
Merian US Equity Income Fund USD 9,105,138 - - (9,084,546) - -
Merian North American Equity Fund USD 96,413,544 - - (96,462,803) - -
Merian Global Dynamic Bond Fund USD 165,134,764 - - (165,584,599) - -
Merian Emerging Market Debt Fund USD 21,759,867 - - (21,627,128) - -
Merian Local Currency Emerging Market Debt Fund USD 242,447,298 186,843,554 2,468,560 (238,878,465) (186,583,445) (2,270,312)
Merian UK Alpha Fund (IRL) GBP 995,124 - - (995,816) - - Merian UK Dynamic Equity Fund GBP 8,782,218 - - (8,730,842) - - Merian Global Equity Absolute Return Fund USD 5,817,551,216 1,467,572,590 - (5,819,358,995) (1,475,419,837) - Merian Strategic Absolute Return Bond Fund USD 356,266,579 - - (356,503,511) - - Merian Europe (ex UK) Smaller Companies Fund EUR 2,233,330 - - (2,247,258) - - Merian Gold & Silver Fund USD 511,598 - - (512,796) - - Merian UK Specialist Equity Fund GBP 68,695,883 - - (68,544,765) - - Merian Financials Contingent Capital Fund USD 499,896,050 - - (498,913,937) - -

Jupiter Asset Management Series Plc Annual Report and Audited Financial Statements for the financial year ended 31 December 2020
Notes to the Financial Statements for the financial year ended 31 December 2020 (continued)
309
11. Financial Instruments and Associated Risks (continued)
(c) Credit Risk
Credit risk is the risk that a counterparty to a financial instrument will fail to discharge an obligation or commitment that it has entered into with the Sub-Fund. Credit risk is monitored in accordance with the UCITS Regulations.
This risk exists in relation to the transactions the Company enters into with brokers, banks and other third parties. However investments in equities are not exposed to credit risk except for exposure to the Depositary which is periodically monitored by the Company.
Credit risk arises from receivables from investee funds relating to redemptions or transactions awaiting settlement. Risk relating to unsettled receivables is considered small due to the short settlement period involved and the due diligence permitted on the investee funds. The maximum exposure related to unsettled is included in other assets and other liabilities in the Statement of Financial Position.
The Manager ensures that the ratings and limits for counterparties are adhered to.
Risk exposure may be reduced where the counterparty will provide the Sub-Fund with collateral, subject to certain conditions. The Manager is responsible for ensuring this collateral meets the relevant criteria set out in UCITS Regulations. Details of collateral pledged and received as at 31 December 2020 is disclosed in Note 7. Cash due from/to broker balances held with counterparties at 31 December 2020 are disclosed in Note 7. This amount is the minimum required by the brokers and counterparties for collateral requirements.
Credit default swaps will be used to isolate and transfer the exposure to or transfer the credit risk associated with a reference asset or index of reference assets. Credit default swaps provide a measure of protection against defaults of debt issuers. The Sub-Funds’ use of credit default swaps does not assure their use will be effective or will have the desired result. If a Sub-Fund is the buyer of a credit default swap, it would be entitled to receive the agreed-upon value (or par) of a referenced debt obligation from the counterparty to the swap on the occurrence of certain credit events in relation to the relevant reference entity. In circumstances in which a Sub-Fund does not own the debt securities that are deliverable under a credit default swap, the Sub-Fund is exposed to the risk that deliverable securities will not be available in the market. The Sub-Fund may not be able to realise the full value of the credit default swap upon a default by the reference entity. As a seller of credit default swaps, a Sub-Fund incurs exposure to the credit of the reference entity and is subject to many of the same risks it would incur if it were holding debt securities issued by the reference entity. The notional amounts and counterparties for purchased and sold protection are disclosed in the Portfolio of Statements. The credit rating of the counterparties can be found below.
The Company minimises concentration of credit risk by undertaking transactions with a large number of customers and counterparties on recognised and reputable exchanges.
The table below shows the S&P long term credit ratings of the derivative counterparties and the financial institutions with whom deposits are invested:
Rating
Counterparty Name 2020 2019
Australia and New Zealand Bank AA- AA-
Bank of America Merrill Lynch A- A+
Barclays BBB BBB
BNP Paribas A+ A+
Canadian Imperial Bank of Commerce BBB+ A+
Citibank A+ A+
Credit Suisse BBB+ BBB+
Danske Bank A A
Deutsche Bank BBB+ BBB+
Goldman Sachs BBB+ A+
HSBC A+ A

Jupiter Asset Management Series Plc Annual Report and Audited Financial Statements for the financial year ended 31 December 2020
Notes to the Financial Statements for the financial year ended 31 December 2020 (continued)
310
11. Financial Instruments and Associated Risks (continued)
(c) Credit Risk (continued) The table below shows the S&P long term credit ratings of the derivative counterparties and the financial institutions with whom deposits credit institutions are invested (continued):
Rating
Counterparty Name 2020 2019
ING A- A+
JP Morgan A+ A+
Lloyds Bank A+ BBB+
Morgan Stanley BBB+ A+
Natwest BBB -
Nomura BBB+ BBB+
Royal Bank of Scotland A BBB
Societe Generale A A
State Street A A
Toronto Dominion Bank AA- AA-
UBS A- A-
The long term credit rating of the parent Company of the Depositary and Sub-Custodian, Citibank N.A. is A+ (2019: A+).

Jupiter Asset Management Series Plc Annual Report and Audited Financial Statements for the financial year ended 31 December 2020
Notes to the Financial Statements for the financial year ended 31 December 2020 (continued)
311
11. Financial Instruments and Associated Risks (continued)
(c) Credit Risk (continued)
The Sub-Funds are also exposed to the credit risk inherent in bond instruments to which they invest. The following table sets out the credit risk at 31 December 2020:
31 December 2020 CCY Investment grade % of debt
securities Non-investment grade % of
debt securities Not rated % of debt
securities Total % of debt
securities
Merian Global Dynamic Bond Fund USD 25.35% 9.16% 65.49% 100.00% Jupiter Emerging Market Debt Fund USD 26.86% 44.27% 28.87% 100.00% Jupiter Local Currency Emerging Market Debt Fund USD 34.91% 18.35% 46.74% 100.00% Jupiter Merian Global Equity Absolute Return Fund USD - - 100.00% 100.00% Jupiter Strategic Absolute Return Bond Fund USD 13.65% 8.67% 77.68% 100.00% Jupiter UK Specialist Equity Fund GBP - - 100.00% 100.00% Jupiter Financials Contingent Capital Fund USD 4.73% 53.28% 41.99% 100.00%
The following table sets out the credit risk at 31 December 2019:
31 December 2019 CCY Investment grade % of debt
securities Non-investment grade % of
debt securities Not rated % of debt
securities Total % of debt
securities
Merian Global Dynamic Bond Fund USD 38.25% 11.90% 49.85% 100.00% Merian Emerging Market Debt Fund USD 18.51% 49.97% 31.52% 100.00% Merian Local Currency Emerging Market Debt Fund USD 24.28% 24.95% 50.77% 100.00% Merian UK Dynamic Equity Fund GBP - - 100.00% 100.00% Merian Global Equity Absolute Return Fund USD - - 100.00% 100.00% Merian Strategic Absolute Return Bond Fund USD 12.62% 10.71% 76.67% 100.00% Merian UK Specialist Equity Fund GBP - - 100.00% 100.00% Merian Financials Contingent Capital Fund USD 3.72% 40.90% 55.39% 100.00%

Jupiter Asset Management Series Plc Annual Report and Audited Financial Statements for the financial year ended 31 December 2020
Notes to the Financial Statements for the financial year ended 31 December 2020 (continued)
312
11. Financial Instruments and Associated Risks (continued) (d) Interest Rate Risk Interest rate risk is the risk that the value of the Sub-Funds’ investments will fluctuate as a result of changes in interest rates. The Company’s interest-bearing financial assets and liabilities expose it to risks associated with the effects of fluctuations in the prevailing levels of market interest rates on its financial position and cash flows. Details of interest rates applicable at 31 December 2020 are outlined in the Portfolio of Investments. Interest receivable on bank deposits and payable on bank overdrafts will be affected by fluctuations in interest rates, as will Floating Rate Bonds. All other assets and liabilities of the Sub-Funds are non-interest bearing. The interest rate profile of each Sub-Fund’s financial assets as at 31 December 2020 was as follows:
Merian Global Dynamic Bond Fund
Weighted Average Interest Rate Weighted Average Period To Maturity Currency (In Years)
Canadian Dollar 1.25% 4.17 Chinese Yuan 2.20% 4.57 Euro 0.86% 6.22 Indonesian Rupiah 7.63% 11.32 Japanese Yen 0.17% 8.86 Mexican Peso 8.50% 14.77 Pound Sterling 2.56% 8.34 Russian Ruble 7.65% 9.28 South African Rand 9.83% 11.74 US Dollar 1.79% 3.56
Jupiter Emerging Market Debt Fund
Weighted Average Interest Rate Weighted Average Period To Maturity Currency (In Years)
Euro 5.15% 11.92 US Dollar 6.13% 15.38
Jupiter Local Currency Emerging Market Debt Fund
Weighted Average Interest Rate Weighted Average Period To Maturity Currency (In Years)
Brazilian Real 10.00% 4.00 Chilean Peso 3.51% 13.22 Chinese Yuan 3.07% 4.68 Colombian Peso 7.68% 7.58 Czech Koruna 2.34% 5.91 Egyptian Pound 14.19% 2.52 Hong Kong delivered Chinese Yuan 2.20% 4.57 Hungarian Forint 3.73% 7.03 Indonesian Rupiah 7.48% 7.91 Kazakhstan Tenge 8.95% 2.34 Malaysian Ringgit 3.85% 8.70 Mexican Peso 7.84% 10.10 Peruvian Nuevo Sol 6.52% 8.48 Polish Zloty 2.59% 6.71 Romanian Leu 4.82% 6.41 Russian Ruble 7.67% 7.98 South African Rand 8.57% 12.12

Jupiter Asset Management Series Plc Annual Report and Audited Financial Statements for the financial year ended 31 December 2020
Notes to the Financial Statements for the financial year ended 31 December 2020 (continued)
313
11. Financial Instruments and Associated Risks (continued)
(d) Interest Rate Risk (continued)
Jupiter Local Currency Emerging Market Debt Fund (continued)
Weighted Average Interest Rate Weighted Average Period To Maturity Currency (In Years)
Thai Baht 3.37% 16.13 Turkish Lira 10.31% 3.00 US Dollar 6.88% 4.79 Uruguayan Peso 3.88% 19.52 Uzbekistani Som 14.49% 2.90 Zambian Kwacha 11.00% 0.66
Jupiter Strategic Absolute Return Bond Fund
Weighted Average Interest Rate Weighted Average Period To Maturity Currency (In Years)
Chinese Yuan 2.20% 4.57 Euro 0.91% 7.60 Indian Rupee 6.20% 5.77 Indonesian Rupiah 7.32% 10.54 Japanese Yen 0.14% 7.56 Mexican Peso 8.50% 15.18 Pound Sterling 2.58% 9.01 Russian Ruble 7.65% 9.28 South African Rand 9.74% 12.63 Uruguayan Peso 9.88% 1.47 US Dollar 1.47% 2.30
The interest rate profile of each Sub-Fund’s financial assets as at 31 December 2019 was as follows:
Merian Global Dynamic Bond Fund
Weighted Average Interest Rate Weighted Average Period To Maturity Currency (In Years)
Brazilian Real 10.01% 7.01 Canadian Dollar 1.16% 3.32 Euro 1.73% 10.74 Indonesian Rupiah 7.04% 13.58 Japanese Yen 0.10% 3.56 Mexican Peso 8.50% 9.42 Russian Ruble 6.90% 9.40 South African Rand 8.75% 28.18 US Dollar 2.38% 5.67
Merian Emerging Market Debt Fund
Weighted Average Interest Rate Weighted Average Period To Maturity Currency (In Years)
Egyptian Pound 15.70% 7.86 Euro 5.98% 12.91 Ukrainian Hryvna 13.45% 2.43 US Dollar 6.79% 14.96

Jupiter Asset Management Series Plc Annual Report and Audited Financial Statements for the financial year ended 31 December 2020
Notes to the Financial Statements for the financial year ended 31 December 2020 (continued)
314
11. Financial Instruments and Associated Risks (continued)
(d) Interest Rate Risk
Merian Local Currency Emerging Market Debt Fund
Weighted Average Interest Rate Weighted Average Period To Maturity Currency (In Years)
Brazilian Real 10.00% 5.46 Chilean Peso 4.74% 10.66 Colombian Peso 7.63% 8.43 Dominican Republic Peso 10.96% 7.98 Egyptian Pound 16.07% 7.38 Hungarian Forint 7.50% 0.87 Indian Rupee 6.12% 5.42 Indonesian Rupiah 7.65% 9.33 Kazakhstan Tenge 9.50% 0.96 Kenyan Shilling 11.75% 15.78 Malaysian Ringgit 3.83% 5.93 Mexican Peso 7.99% 13.07 New Ghana Cedi 19.00% 6.84 Nigerian Naira 16.25% 17.31 Peruvian Nuevo Sol 6.16% 12.62 Polish Zloty 2.75% 8.32 Romanian Leu 5.00% 9.13 Russian Ruble 7.56% 9.41 South African Rand 8.90% 14.66 Thai Baht 3.83% 15.28 Turkish Lira 12.94% 3.12 Ukrainian Hryvna 16.41% 3.79 US Dollar 5.88% 8.04 Zambian Kwacha 11.00% 1.66
Merian Strategic Absolute Return Bond Fund
Weighted Average Interest Rate Weighted Average Period To Maturity Currency (In Years)
Brazilian Real 10.00% 7.01 Canadian Dollar 1.17% 3.34 Euro 1.18% 5.90 Indian Rupee 6.20% 6.77 Indonesian Rupiah 7.05% 13.58 Japanese Yen 0.10% 3.32 Mexican Peso 8.50% 9.42 Pound Sterling 2.48% 5.46 Russian Ruble 6.90% 9.40 South African Rand 8.75% 28.18 Uruguayan Peso 9.88% 2.47 US Dollar 1.53% 5.08

Jupiter Asset Management Series Plc Annual Report and Audited Financial Statements for the financial year ended 31 December 2020
Notes to the Financial Statements for the financial year ended 31 December 2020 (continued)
315
11. Financial Instruments and Associated Risks (continued) (d) Interest Rate Risk (continued) Sub-funds not included in the table below have been omitted as the maximum exposure to interest rate is only applicable on the cash and cash equivalents with all other assets and liabilities being non-interest bearing. The majority of the financial assets held by these Sub-Funds are equity shares which neither pay interest nor have a maturity date.
31 December 2020 Fund CCY
Less than 1 month 1 to 3 months
3 months to 1 year 1 to 5 years
More than 5 years
Non-Interest Bearing Total
Merian Global Dynamic Bond Fund USD 17,995,510 450,527 42,735,723 51,288,605 110,810,339 30,749,210 254,029,914
Jupiter Emerging Market Debt Fund USD 4,343,073 - 716,056 15,114,184 76,325,820 382,929 96,882,062
Jupiter Local Currency Emerging Market Debt Fund USD 4,459,244 1,421,136 5,895,703 36,219,340 104,168,518 4,474,925 156,638,866
Jupiter Merian Global Equity Absolute Return Fund USD 227,612,455 - 79,972,864 - - 1,186,825,086 1,494,410,405
Jupiter Strategic Absolute Return Bond Fund USD 2,651,055 - 37,092,798 19,957,372 50,819,551 16,403,843 126,924,619
Jupiter UK Specialist Equity Fund GBP 23,208,248 - 25,006,400 - - 459,012,620 507,227,268
Jupiter Financials Contingent Capital Fund USD 4,928,306 - 6,788,152 10,508,210 108,123,027 3,777,685 134,125,380
31 December 2019 Fund CCY
Less than 1 month 1 to 3 months
3 months to 1 year 1 to 5 years
More than 5 years
Non-Interest Bearing Total
Merian Global Dynamic Bond Fund USD 4,989,854 8,972,624 5,689,340 57,560,307 66,361,918 16,486,784 160,060,827
Merian Emerging Market Debt Fund USD 5,965,432 3,548,002 2,619,136 13,195,459 99,637,162 446,099 125,411,290
Merian Local Currency Emerging Market Debt Fund USD 32,816,765 11,115,256 19,541,881 84,335,111 331,451,422 14,329,536 493,589,971
Merian UK Dynamic Equity Fund GBP 9,510,682 17,984,140 - - - 483,250,510 510,745,332
Merian Global Equity Absolute Return Fund USD 1,155,739,462 149,590,905 - - - 2,864,541,093 4,169,871,460
Merian Strategic Absolute Return Bond Fund USD 11,729,292 19,626,779 9,476,280 64,694,311 70,867,389 16,895,704 193,289,755
Merian UK Specialist Equity Fund GBP 19,809,793 39,972,680 - - - 386,731,913 446,514,386
Merian Financials Contingent Capital Fund USD 2,031,829 - - 17,994,413 359,499,744 10,392,485 389,918,471

Jupiter Asset Management Series Plc Annual Report and Audited Financial Statements for the financial year ended 31 December 2020
Notes to the Financial Statements for the financial year ended 31 December 2020 (continued)
316
11. Financial Instruments and Associated Risks (continued) (e) Concentration Risk
The investments of certain Sub-Funds may be concentrated in a single market or country. A Sub-Fund which pursues a concentrated investment strategy may be subject to a greater degree of volatility and risk than a Sub-Fund following a more diversified strategy. The applicable investment concentrations within the portfolio for each Sub-Fund at 31 December 2020 are disclosed in the Portfolio of Investments. The following table shows the Sub-Funds having more than 10% concentration in the countries at 31 December 2020:
Fund Name Country % of Net Assets
Jupiter China Equity Fund China 84.21%
Jupiter China Equity Fund Hong Kong 13.82%
Jupiter Merian World Equity Fund United States 65.09%
Jupiter Pacific Equity Fund Australia 12.01%
Jupiter Pacific Equity Fund China 34.73%
Jupiter Pacific Equity Fund South Korea 12.12%
Jupiter Pacific Equity Fund Taiwan 12.69%
Merian European Equity Fund United Kingdom 16.25%
Merian European Equity Fund France 14.72%
Merian European Equity Fund Germany 14.16%
Merian European Equity Fund Netherlands 10.00%
Merian European Equity Fund Switzerland 17.35%
Jupiter Merian US Equity Income Fund United States 93.29%
Jupiter Merian North American Equity Fund (IRL) United States 91.83%
Merian Global Dynamic Bond Fund Italy 12.26%
Merian Global Dynamic Bond Fund United States 28.65%
Jupiter Global Emerging Markets Focus Fund Brazil 10.34%
Jupiter Global Emerging Markets Focus Fund China 26.34%
Jupiter Global Emerging Markets Focus Fund India 15.04%
Jupiter Global Emerging Markets Focus Fund Taiwan 15.31%
Merian Asian Equity Income Fund Australia 12.24%
Merian Asian Equity Income Fund China 32.95%
Merian Asian Equity Income Fund South Korea 10.85%
Merian Asian Equity Income Fund Taiwan 12.32%
Jupiter Local Currency Emerging Market Debt Fund Mexico 12.01%
Jupiter UK Alpha Fund (IRL) United Kingdom 80.09%
Jupiter UK Smaller Companies Focus Fund United Kingdom 90.48%
Jupiter UK Dynamic Equity Fund United Kingdom 95.50%
Jupiter Merian Global Equity Absolute Return Fund United States 40.27%
Jupiter Strategic Absolute Return Bond Fund United States 43.82%
Jupiter Europe (ex UK) Smaller Companies Fund France 16.99%
Jupiter Europe (ex UK) Smaller Companies Fund Germany 14.07%
Jupiter Europe (ex UK) Smaller Companies Fund Italy 19.75%
Jupiter Europe (ex UK) Smaller Companies Fund Sweden 12.97%
Jupiter Europe (ex UK) Smaller Companies Fund Switzerland 11.66%
Jupiter Merian Global Equity Income Fund (IRL) United States 53.91%
Jupiter Gold & Silver Fund Australia 17.24%
Jupiter Gold & Silver Fund Canada 67.45%
Jupiter UK Specialist Equity Fund United Kingdom 90.15%
Jupiter Financials Contingent Capital Fund United Kingdom 39.94%
Jupiter Financials Contingent Capital Fund Italy 12.84%
Jupiter Financials Contingent Capital Fund Spain 10.03%

Jupiter Asset Management Series Plc Annual Report and Audited Financial Statements for the financial year ended 31 December 2020
Notes to the Financial Statements for the financial year ended 31 December 2020 (continued)
317
11. Financial Instruments and Associated Risks (continued) (e) Concentration Risk (continued)
The following table shows the Sub-Funds having more than 10% concentration in the countries at 31 December 2019:
Fund Name Country % of Net Assets
Merian China Equity Fund China 70.07%
Merian China Equity Fund Hong Kong 28.25%
Merian World Equity Fund United States 59.28%
Merian Pacific Equity Fund Australia 13.71%
Merian Pacific Equity Fund China 33.77%
Merian Pacific Equity Fund South Korea 12.57%
Merian Pacific Equity Fund Taiwan 10.01%
Merian European Equity Fund United Kingdom 19.12%
Merian European Equity Fund France 16.90%
Merian European Equity Fund Germany 12.07%
Merian European Equity Fund Switzerland 15.73%
Merian US Equity Income Fund United States 99.09%
Merian North American Equity Fund United States 91.54%
Merian Global Dynamic Bond Fund Japan 14.05%
Merian Global Dynamic Bond Fund United States 27.40%
Merian Global Emerging Markets Fund Brazil 14.36%
Merian Global Emerging Markets Fund China 27.05%
Merian Global Emerging Markets Fund India 10.12%
Merian Global Emerging Markets Fund Taiwan 11.75%
Merian Asian Equity Income Fund Australia 13.78%
Merian Asian Equity Income Fund China 34.04%
Merian Asian Equity Income Fund South Korea 11.30%
Merian Asian Equity Income Fund Taiwan 11.48%
Merian Local Currency Emerging Market Debt Fund Brazil 10.02%
Merian Local Currency Emerging Market Debt Fund South Africa 12.73%
Merian UK Alpha Fund (IRL) United Kingdom 76.82%
Merian UK Smaller Companies Focus Fund United Kingdom 93.58%
Merian UK Dynamic Equity Fund United Kingdom 82.34%
Merian Global Equity Absolute Return Fund China 14.08%
Merian Global Equity Absolute Return Fund United States 42.81%
Merian Strategic Absolute Return Bond Fund France 11.56% Merian Strategic Absolute Return Bond Fund Japan 14.28% Merian Strategic Absolute Return Bond Fund United States 31.22%
Merian Europe (ex UK) Smaller Companies Fund France 16.99%
Merian Europe (ex UK) Smaller Companies Fund Germany 16.99%
Merian Europe (ex UK) Smaller Companies Fund Netherlands 10.33%
Merian Global Equity Income Fund (IRL) United States 51.85%
Merian Gold & Silver Fund Australia 10.72%
Merian Gold & Silver Fund Canada 73.82%
Merian UK Specialist Equity Fund United Kingdom 83.43%
Merian Financials Contingent Capital Fund United Kingdom 31.38%
Merian Financials Contingent Capital Fund Spain 10.17%
Merian Financials Contingent Capital Fund Switzerland 15.60%

Jupiter Asset Management Series Plc Annual Report and Audited Financial Statements for the financial year ended 31 December 2020
Notes to the Financial Statements for the financial year ended 31 December 2020 (continued)
318
11. Financial Instruments and Associated Risks (continued) (f) Currency Risk
Currency risk is the risk that the value of a financial instrument will fluctuate due to changes in foreign exchange rates. The Company invests in securities and other investments that are denominated in currencies other than the Sub-Funds functional currency. Accordingly, the value of the Company’s assets may be affected favourably or unfavourably by fluctuations in currency rates and therefore the Company will necessarily be subject to foreign exchange risks. Equally movements in exchange rates can impact income received by the Sub-Funds and can impact shareholders whose shares are denominated in currencies other than the operating currency of the Sub-Fund. The Sub-Funds may use foreign currency economic hedging activities to protect against the volatility described above. The Company primarily utilises currency exchange contracts to hedge foreign-currency-denominated financial instruments. Increases or decreases in the fair values of the Company’s foreign-currency-denominated financial assets and financial liabilities are partially offset by gains and losses on the economic hedging instruments. Foreign exchange hedging is utilised for the benefit of hedged share classes, transactions will be clearly attributable to that class and the cost and related liabilities and/or benefits shall be for the account of that class only. Accordingly, such costs and related liabilities and/or benefits will be reflected in the net asset value per share for shares of any such class.

Jupiter Asset Management Series Plc Annual Report and Audited Financial Statements for the financial year ended 31 December 2020
Notes to the Financial Statements for the financial year ended 31 December 2020 (continued)
319
11. Financial Instruments and Associated Risks (continued) (f) Currency Risk (continued) The currency risk exposures of the Sub-Funds at 31 December 2020 were as follows: Jupiter China Equity Fund
Monetary Assets
Net Other Monetary Assets and Liabilities
Share Class Exposure
Currency Exchange
Hedging
Currency Exchange
Non-Hedging Total
Exposure Sensitivity Analysis
(5% movement)
USD USD USD USD USD USD USD
Chinese Yuan - (640,768) - - - (640,768) 30,513 Hong Kong delivered Chinese Yuan - 644,196 - - - 644,196 (30,676)
Hong Kong Dollar - 652,436 - - (652,456) (20) 1
Pound Sterling - 5,593 2,266,657 - - 2,272,250 (108,202)
Jupiter Merian World Equity Fund
Monetary Assets
Net Other Monetary Assets and Liabilities
Share Class Exposure
Currency Exchange
Hedging
Currency Exchange
Non-Hedging Total
Exposure Sensitivity Analysis
(5% movement)
USD USD USD USD USD USD USD
Australian Dollar - 28,814 - - - 28,814 (1,372)
Canadian Dollar - 32,393 - - - 32,393 (1,543)
Danish Krone - 40,036 - - - 40,036 (1,906)
Euro - 106,114 17,077,057 994,703 - 18,177,874 (865,613)
Hong Kong Dollar - 16,801 - - - 16,801 (800)
Israeli Shekel - 8,971 - - - 8,971 (427)
Japanese Yen - 144,322 - - - 144,322 (6,872)
New Zealand Dollar - 12,108 - - - 12,108 (577)
Norwegian Krone - 27,684 - - - 27,684 (1,318)
Pound Sterling - 81,415 4,697,372 - - 4,778,787 (227,561)
Singapore Dollar - 3,446 - - - 3,446 (164)
Swedish Krona - 66,008 - - - 66,008 (3,143)
Swiss Franc - 52,829 - - - 52,829 (2,516)

Jupiter Asset Management Series Plc Annual Report and Audited Financial Statements for the financial year ended 31 December 2020
Notes to the Financial Statements for the financial year ended 31 December 2020 (continued)
320
11. Financial Instruments and Associated Risks (continued)
(f) Currency Risk (continued) Jupiter Pacific Equity Fund
Monetary Assets
Net Other Monetary Assets and Liabilities
Share Class Exposure
Currency Exchange
Hedging
Currency Exchange
Non-Hedging Total
Exposure Sensitivity Analysis
(5% movement)
USD USD USD USD USD USD USD
Australian Dollar - 160,972 - - - 160,972 (7,665)
Chinese Yuan - 4,740 - - - 4,740 (226)
Euro - 2,777 2,473,036 - - 2,475,813 (117,896)
Hong Kong Dollar - 544,662 - - - 544,662 (25,936)
Indian Rupee - (113,934) - - - (113,934) 5,425
Indonesian Rupiah - 2 - - - 2 -
New Zealand Dollar - 53,868 - - - 53,868 (2,565)
Pakistani Rupee - 40 - - - 40 (2)
Philippine Peso - 19 - - - 19 (1)
Pound Sterling - 2,807 1,427,931 - - 1,430,738 (68,130)
Singapore Dollar - 3,765 - - - 3,765 (179)
South Korean Won - 123,257 - - - 123,257 (5,869)
Taiwanese Dollar - 48,792 - - - 48,792 (2,323)
Merian European Equity Fund
Monetary Assets
Net Other Monetary Assets and Liabilities
Share Class Exposure
Currency Exchange
Hedging
Currency Exchange
Non-Hedging Total
Exposure Sensitivity Analysis
(5% movement)
EUR EUR EUR EUR EUR EUR EUR
Danish Krone - 8,915 - - - 8,915 (425)
Norwegian Krone - 4,836 - - - 4,836 (230)
Pound Sterling - 61,287 1,645,692 - - 1,706,979 (81,285)
Swedish Krona - 12,763 - - - 12,763 (608)
Swiss Franc - 32,374 - - - 32,374 (1,542)
US Dollar - 17,548 5,394,973 - - 5,412,521 (257,739)

Jupiter Asset Management Series Plc Annual Report and Audited Financial Statements for the financial year ended 31 December 2020
Notes to the Financial Statements for the financial year ended 31 December 2020 (continued)
321
11. Financial Instruments and Associated Risks (continued)
(f) Currency Risk (continued)
Jupiter Merian US Equity Income Fund
Monetary
Assets Net Other Monetary Assets and Liabilities
Share Class Exposure
Currency Exchange
Hedging
Currency Exchange
Non-Hedging Total
Exposure Sensitivity Analysis
(5% movement)
USD USD USD USD USD USD USD
Euro - (1,013,341) 3,240,632 4,146,698 - 6,373,989 (303,523)
Pound Sterling - 22,764 49,977,626 - - 50,000,390 (2,380,971)
Jupiter Merian North American Equity Fund (IRL)
Monetary Assets
Net Other Monetary Assets and Liabilities
Share Class Exposure
Currency Exchange
Hedging
Currency Exchange
Non-Hedging Total
Exposure Sensitivity Analysis
(5% movement)
USD USD USD USD USD USD USD
Canadian Dollar - 210,099 - - - 210,099 (10,005)
Euro - 25,852 19,441,724 9,191,867 - 28,659,443 (1,364,735)
Pound Sterling - 202,298 45,983,947 29,469,193 - 75,655,438 (3,602,640)
Swedish Krona - 384 - - - 384 (18)
Merian Global Dynamic Bond Fund
Monetary Assets
Net Other Monetary Assets and Liabilities
Share Class Exposure
Currency Exchange
Hedging
Currency Exchange
Non-Hedging Total
Exposure Sensitivity Analysis
(5% movement)
USD USD USD USD USD USD USD
Australian Dollar - 433,761 2,462,384 2,461,108 4,331,526 9,688,779 (461,370)
Brazilian Real - - - - 2,857,897 2,857,897 (136,090)
Canadian Dollar 4,416,262 45,537 - - (4,495,545) (33,746) 1,607
Chinese Yuan 4,545,545 - - - - 4,545,545 (216,455)
Euro 68,023,906 1,555,750 12,476,111 12,511,375 (71,605,771) 22,961,371 (1,093,399)
Hungarian Forint - - - - 96,728 96,728 (4,606)
Indian Rupee - - - - 3,754,025 3,754,025 (178,763)
Indonesian Rupiah 6,695,809 - - - (1,338,286) 5,357,523 (255,120)
Japanese Yen 17,186,903 (73,856) - - (12,540,654) 4,572,393 (217,733)
Mexican Peso 7,571,867 (3,568) - - (4,011,515) 3,556,784 (169,371)
Norwegian Krone - - - - 3,653,021 3,653,021 (173,953)
Pound Sterling 6,939,463 1,302,785 1,897,372 - (3,495,829) 6,643,791 (316,371)
Russian Ruble 4,528,027 290,396 - - (1,093,320) 3,725,103 (177,386)

Jupiter Asset Management Series Plc Annual Report and Audited Financial Statements for the financial year ended 31 December 2020
Notes to the Financial Statements for the financial year ended 31 December 2020 (continued)
322
11. Financial Instruments and Associated Risks (continued)
(f) Currency Risk (continued) Merian Global Dynamic Bond Fund (continued)
Monetary
Assets Net Other Monetary Assets and Liabilities
Share Class Exposure
Currency Exchange
Hedging
Currency Exchange
Non-Hedging Total
Exposure Sensitivity Analysis
(5% movement)
USD USD USD USD USD USD USD
South African Rand 10,418,795 (55) 3,069,204 3,037,539 (8,134,716) 8,390,767 (399,560)
Swedish Krona - (37) - - (3,771,998) (3,772,035) 179,621
Swiss Franc - 11 - - (268,983) (268,972) 12,808
Jupiter Emerging Market Debt Fund
Monetary Assets
Net Other Monetary Assets and Liabilities
Share Class Exposure
Currency Exchange
Hedging
Currency Exchange
Non-Hedging Total
Exposure Sensitivity Analysis
(5% movement)
USD USD USD USD USD USD USD
Brazilian Real - - - - 480,773 480,773 (22,894)
Chilean Peso - - - - 492,450 492,450 (23,450)
Egyptian Pound 1,012,832 - - - - 1,012,832 (48,230)
Euro 5,409,962 42,129 7,901,192 6,993,823 (4,785,691) 15,561,415 (741,020)
Hong Kong Dollar - - - - (1,032,025) (1,032,025) 49,144
Indian Rupee - - - - 925,616 925,616 (44,077)
Indonesian Rupiah - - - - 501,410 501,410 (23,877)
Mexican Peso - - - - (15) (15) 1
Pound Sterling - 1,365 1,984,323 - - 1,985,688 (94,557)
Russian Ruble - 2,006 - - 101 2,107 (100)
Singapore Dollar - (110) 196,068 195,978 - 391,936 (18,664)
South African Rand - (9) 457,653 456,093 - 913,737 (43,511)
Swedish Krona - 7 225,852 225,307 - 451,166 (21,484)
Jupiter Global Emerging Markets Focus Fund
Monetary Assets
Net Other Monetary Assets and Liabilities
Share Class Exposure
Currency Exchange
Hedging
Currency Exchange
Non-Hedging Total
Exposure Sensitivity Analysis
(5% movement)
USD USD USD USD USD USD USD
Brazilian Real - 16,625 - - - 16,625 (792)
Chilean Peso - 22 - - - 22 (1)
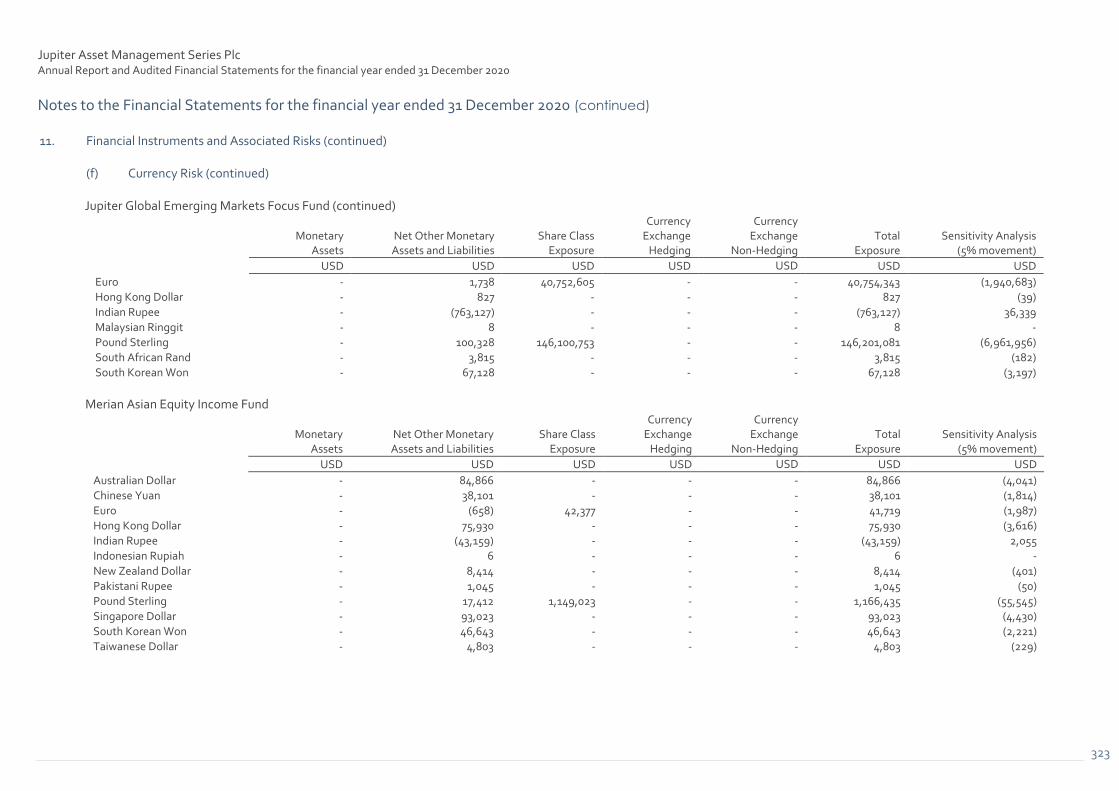
Jupiter Asset Management Series Plc Annual Report and Audited Financial Statements for the financial year ended 31 December 2020
Notes to the Financial Statements for the financial year ended 31 December 2020 (continued)
323
11. Financial Instruments and Associated Risks (continued)
(f) Currency Risk (continued) Jupiter Global Emerging Markets Focus Fund (continued)
Monetary Assets
Net Other Monetary Assets and Liabilities
Share Class Exposure
Currency Exchange
Hedging
Currency Exchange
Non-Hedging Total
Exposure Sensitivity Analysis
(5% movement)
USD USD USD USD USD USD USD
Euro - 1,738 40,752,605 - - 40,754,343 (1,940,683)
Hong Kong Dollar - 827 - - - 827 (39)
Indian Rupee - (763,127) - - - (763,127) 36,339
Malaysian Ringgit - 8 - - - 8 -
Pound Sterling - 100,328 146,100,753 - - 146,201,081 (6,961,956)
South African Rand - 3,815 - - - 3,815 (182)
South Korean Won - 67,128 - - - 67,128 (3,197)
Merian Asian Equity Income Fund
Monetary Assets
Net Other Monetary Assets and Liabilities
Share Class Exposure
Currency Exchange
Hedging
Currency Exchange
Non-Hedging Total
Exposure Sensitivity Analysis
(5% movement)
USD USD USD USD USD USD USD
Australian Dollar - 84,866 - - - 84,866 (4,041)
Chinese Yuan - 38,101 - - - 38,101 (1,814)
Euro - (658) 42,377 - - 41,719 (1,987)
Hong Kong Dollar - 75,930 - - - 75,930 (3,616)
Indian Rupee - (43,159) - - - (43,159) 2,055
Indonesian Rupiah - 6 - - - 6 -
New Zealand Dollar - 8,414 - - - 8,414 (401)
Pakistani Rupee - 1,045 - - - 1,045 (50)
Pound Sterling - 17,412 1,149,023 - - 1,166,435 (55,545)
Singapore Dollar - 93,023 - - - 93,023 (4,430)
South Korean Won - 46,643 - - - 46,643 (2,221)
Taiwanese Dollar - 4,803 - - - 4,803 (229)

Jupiter Asset Management Series Plc Annual Report and Audited Financial Statements for the financial year ended 31 December 2020
Notes to the Financial Statements for the financial year ended 31 December 2020 (continued)
324
11. Financial Instruments and Associated Risks (continued)
(f) Currency Risk (continued) Jupiter Local Currency Emerging Market Debt Fund
Monetary Assets
Net Other Monetary Assets and Liabilities
Share Class Exposure
Currency Exchange
Hedging
Currency Exchange
Non-Hedging Total
Exposure Sensitivity Analysis
(5% movement)
USD USD USD USD USD USD USD
Australian Dollar - (3,411) 10,657,835 10,621,962 - 21,276,386 (1,013,161)
Brazilian Real 13,503,170 26,072 - - 749,559 14,278,801 (679,943)
Chilean Peso 2,412,762 - - - 2,517,143 4,929,905 (234,757)
Chinese Yuan 5,869,468 (186,319) - - 9,083,417 14,766,566 (703,170)
Colombian Peso 9,538,266 - - - 1,137,699 10,675,965 (508,379)
Czech Koruna 4,104,045 7 - - 2,133,394 6,237,446 (297,021)
Egyptian Pound 3,819,729 - - - - 3,819,729 (181,892)
Euro - 8,652 923,162 - (1,263,826) (332,012) 15,810 Hong Kong delivered Chinese Yuan 1,675,616 - - - - 1,675,616 (79,791)
Hong Kong Dollar - - - - (1,548,036) (1,548,036) 73,716
Hungarian Forint 5,913,274 (32) - - 1,453,223 7,366,465 (350,784)
Indian Rupee - - - - 3,018,257 3,018,257 (143,727)
Indonesian Rupiah 20,497,225 - - - (4,176,614) 16,320,611 (777,172)
Israeli Shekel - 1 - - - 1 -
Kazakhstan Tenge 669,879 - - - - 669,879 (31,899)
Malaysian Ringgit 8,458,289 - - - 2,110,856 10,569,145 (503,293)
Mexican Peso 17,371,975 (3,125) - - (1,736,975) 15,631,875 (744,375)
New Ghana Cedi - 2 - - - 2 -
Peruvian Nuevo Sol 5,856,530 - - - (1,290,545) 4,565,985 (217,428)
Philippine Peso - - - - 306,658 306,658 (14,603)
Polish Zloty 2,333,407 98,534 - - 11,311,948 13,743,889 (654,471)
Pound Sterling - (14,412) 1,251,602 - - 1,237,190 (58,914)
Romanian Leu 5,073,830 30,976 - - (232,504) 4,872,302 (232,014)
Russian Ruble 14,682,288 1,327 - - (3,249,491) 11,434,124 (544,482)

Jupiter Asset Management Series Plc Annual Report and Audited Financial Statements for the financial year ended 31 December 2020
Notes to the Financial Statements for the financial year ended 31 December 2020 (continued)
325
11. Financial Instruments and Associated Risks (continued)
(f) Currency Risk (continued) Jupiter Local Currency Emerging Market Debt Fund (continued)
Monetary
Assets Net Other Monetary Assets and Liabilities
Share Class Exposure
Currency Exchange
Hedging
Currency Exchange
Non-Hedging Total
Exposure Sensitivity Analysis
(5% movement)
USD USD USD USD USD USD USD
South African Rand 14,435,615 (17,157) 34,307,384 34,132,946 (1,083,311) 81,775,477 (3,894,070)
Thai Baht 2,912,549 921,882 - - 9,359,705 13,194,136 (628,292)
Turkish Lira 4,035,231 - - - 706,485 4,741,716 (225,796)
Uruguayan Peso 1,650,187 - - - - 1,650,187 (78,580)
Uzbekistani Som 485,259 - - - - 485,259 (23,108)
Zambian Kwacha 197,234 - - - - 197,234 (9,392)
Jupiter UK Alpha Fund (IRL)
Monetary Assets
Net Other Monetary Assets and Liabilities
Share Class Exposure
Currency Exchange
Hedging
Currency Exchange
Non-Hedging Total
Exposure Sensitivity Analysis
(5% movement)
GBP GBP GBP GBP GBP GBP GBP
Euro - 16,515 62,838 - - 79,353 (3,779)
US Dollar - (35,132) 2,558,128 321,911 - 2,844,907 (135,472)
Jupiter UK Smaller Companies Focus Fund
Monetary
Assets Net Other Monetary Assets and Liabilities
Share Class Exposure
Currency Exchange
Hedging
Currency Exchange
Non-Hedging Total
Exposure Sensitivity Analysis
(5% movement)
GBP GBP GBP GBP GBP GBP GBP
Euro - 3,376 - - - 3,376 (161)
US Dollar - 454 - - - 454 (22)

Jupiter Asset Management Series Plc Annual Report and Audited Financial Statements for the financial year ended 31 December 2020
Notes to the Financial Statements for the financial year ended 31 December 2020 (continued)
326
11. Financial Instruments and Associated Risks (continued)
(f) Currency Risk (continued)
Jupiter UK Dynamic Equity Fund
Monetary
Assets Net Other Monetary Assets and Liabilities
Share Class Exposure
Currency Exchange
Hedging
Currency Exchange
Non-Hedging Total
Exposure Sensitivity Analysis
(5% movement)
GBP GBP GBP GBP GBP GBP GBP
Euro - 1,012 7,188,088 7,295,133 - 14,484,233 (689,725)
US Dollar - 579 - - - 579 (28)
Jupiter Merian Global Equity Absolute Return Fund
Monetary
Assets Net Other Monetary Assets and Liabilities
Share Class Exposure
Currency Exchange
Hedging
Currency Exchange
Non-Hedging Total
Exposure Sensitivity Analysis
(5% movement)
USD USD USD USD USD USD USD
Australian Dollar - 3,273,525 - - (70,869,396) (67,595,871) 3,218,851
Brazilian Real - (401,905) - - - (401,905) 19,138
Canadian Dollar - 4,723,847 - - (18,483,865) (13,760,018) 655,239
Chinese Renminbi - - 36,325 - - 36,325 (1,730)
Danish Krone - 3,986,737 - - (25,585,153) (21,598,416) 1,028,496
Euro - (151,301) 582,334,845 580,515,596 (140,311,620) 1,022,387,520 (48,685,120) Hong Kong delivered Chinese Yuan - - - 36,025 - 36,025 (1,715)
Hong Kong Dollar - (27,039) - - (170,011,039) (170,038,078) 8,097,051
Japanese Yen - 2,383,089 - - (123,694,251) (121,311,162) 5,776,722
New Zealand Dollar - 617,864 - - (9,509,013) (8,891,149) 423,388
Norwegian Krone - (1,623,671) - - (5,612,947) (7,236,618) 344,601
Pound Sterling - 3,375,403 603,264,045 599,884,111 (4,015,920) 1,202,507,639 (57,262,269)
Singapore Dollar - 834,546 1,001,541 995,248 (41,075,126) (38,243,791) 1,821,133
South African Rand - 420,112 - - - 420,112 (20,005)
South Korean Won - 604,668 - - - 604,668 (28,794)
Swedish Krona - (617,738) 257,284 256,014 (71,751,214) (71,855,654) 3,421,698
Swiss Franc - (213,385) 6,677,825 6,655,096 (42,456,125) (29,336,589) 1,396,980
Taiwanese Dollar - 260,571 - - - 260,571 (12,408)
Turkish Lira - 361,448 - - - 361,448 (17,212)
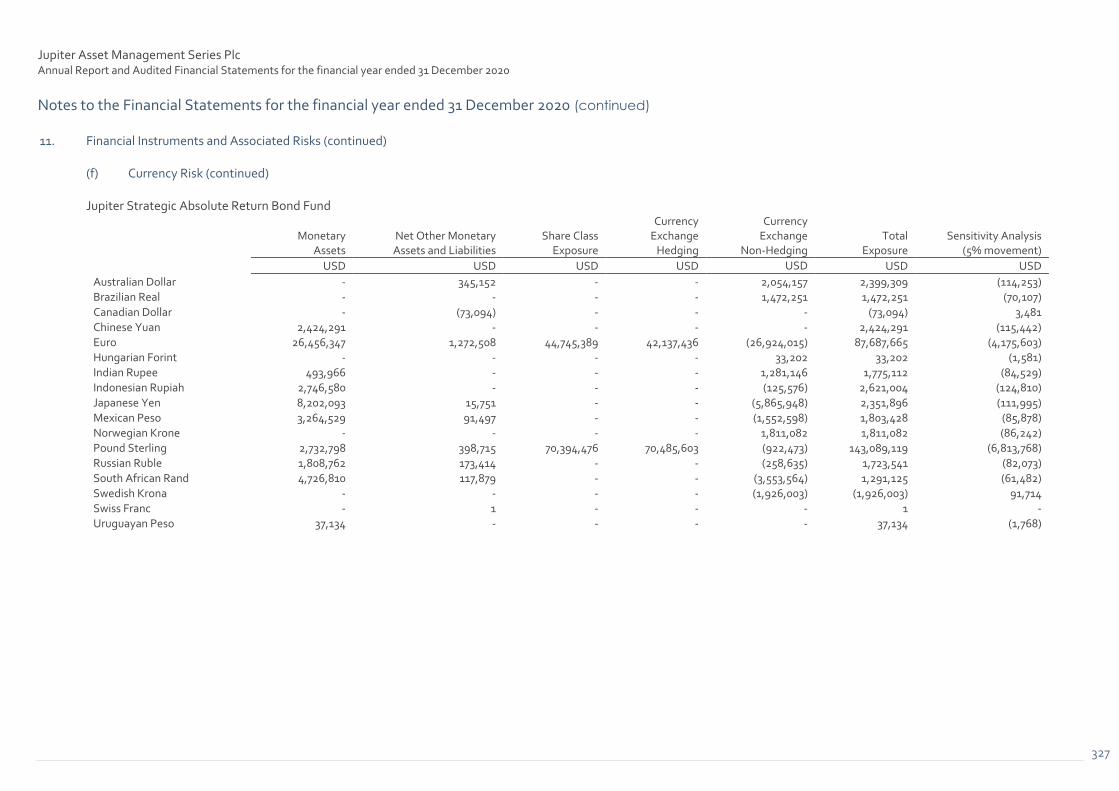
Jupiter Asset Management Series Plc Annual Report and Audited Financial Statements for the financial year ended 31 December 2020
Notes to the Financial Statements for the financial year ended 31 December 2020 (continued)
327
11. Financial Instruments and Associated Risks (continued)
(f) Currency Risk (continued) Jupiter Strategic Absolute Return Bond Fund
Monetary
Assets Net Other Monetary Assets and Liabilities
Share Class Exposure
Currency Exchange
Hedging
Currency Exchange
Non-Hedging Total
Exposure Sensitivity Analysis
(5% movement)
USD USD USD USD USD USD USD
Australian Dollar - 345,152 - - 2,054,157 2,399,309 (114,253)
Brazilian Real - - - - 1,472,251 1,472,251 (70,107)
Canadian Dollar - (73,094) - - - (73,094) 3,481
Chinese Yuan 2,424,291 - - - - 2,424,291 (115,442)
Euro 26,456,347 1,272,508 44,745,389 42,137,436 (26,924,015) 87,687,665 (4,175,603)
Hungarian Forint - - - - 33,202 33,202 (1,581)
Indian Rupee 493,966 - - - 1,281,146 1,775,112 (84,529)
Indonesian Rupiah 2,746,580 - - - (125,576) 2,621,004 (124,810)
Japanese Yen 8,202,093 15,751 - - (5,865,948) 2,351,896 (111,995)
Mexican Peso 3,264,529 91,497 - - (1,552,598) 1,803,428 (85,878)
Norwegian Krone - - - - 1,811,082 1,811,082 (86,242)
Pound Sterling 2,732,798 398,715 70,394,476 70,485,603 (922,473) 143,089,119 (6,813,768)
Russian Ruble 1,808,762 173,414 - - (258,635) 1,723,541 (82,073)
South African Rand 4,726,810 117,879 - - (3,553,564) 1,291,125 (61,482)
Swedish Krona - - - - (1,926,003) (1,926,003) 91,714
Swiss Franc - 1 - - - 1 -
Uruguayan Peso 37,134 - - - - 37,134 (1,768)
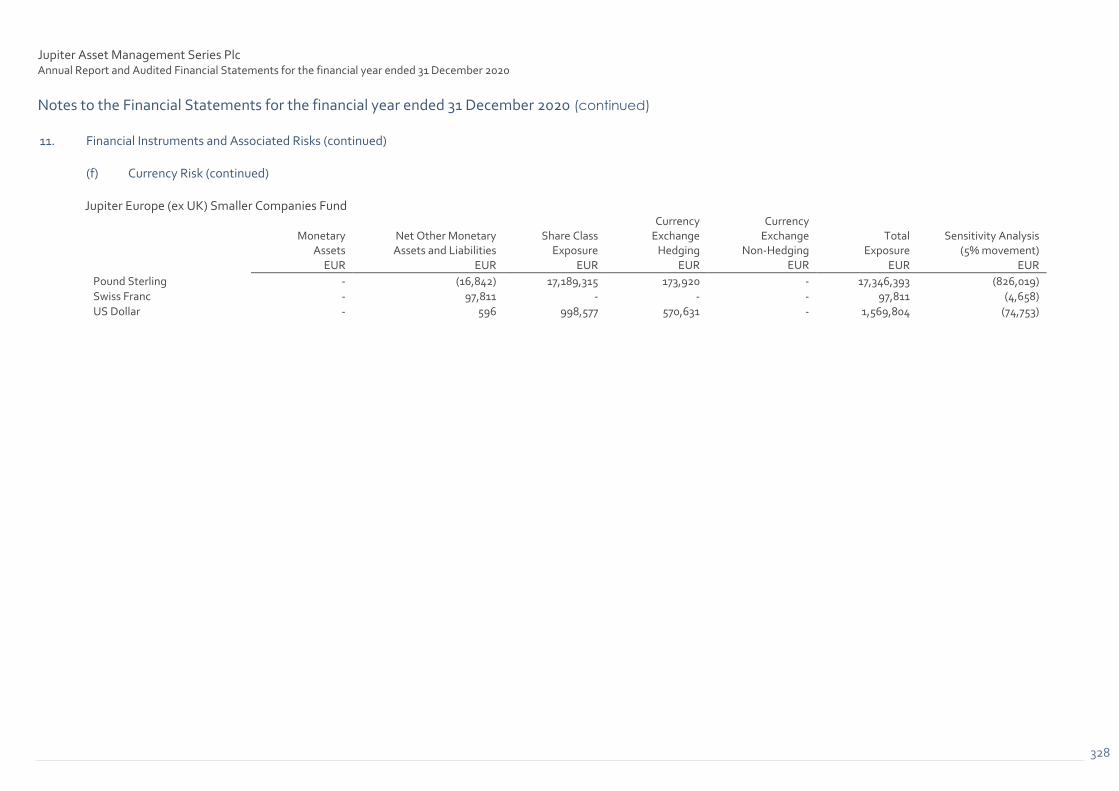
Jupiter Asset Management Series Plc Annual Report and Audited Financial Statements for the financial year ended 31 December 2020
Notes to the Financial Statements for the financial year ended 31 December 2020 (continued)
328
11. Financial Instruments and Associated Risks (continued)
(f) Currency Risk (continued)
Jupiter Europe (ex UK) Smaller Companies Fund
Monetary
Assets Net Other Monetary
Assets and Liabilities Share Class
Exposure
Currency Exchange
Hedging
Currency Exchange
Non-Hedging Total
Exposure Sensitivity Analysis
(5% movement) EUR EUR EUR EUR EUR EUR EUR
Pound Sterling - (16,842) 17,189,315 173,920 - 17,346,393 (826,019)
Swiss Franc - 97,811 - - - 97,811 (4,658)
US Dollar - 596 998,577 570,631 - 1,569,804 (74,753)

Jupiter Asset Management Series Plc Annual Report and Audited Financial Statements for the financial year ended 31 December 2020
Notes to the Financial Statements for the financial year ended 31 December 2020 (continued)
329
11. Financial Instruments and Associated Risks (continued)
(f) Currency Risk (continued) Jupiter Merian Global Equity Income Fund (IRL)
Monetary
Assets Net Other Monetary Assets and Liabilities
Share Class Exposure
Currency Exchange
Hedging
Currency Exchange
Non-Hedging Total
Exposure Sensitivity Analysis
(5% movement)
USD USD USD USD USD USD USD
Australian Dollar - 39,214 - - - 39,214 (1,867) Brazilian Real - 2,731 - - - 2,731 (130) Canadian Dollar - 59,895 - - - 59,895 (2,852) Chilean Peso - 3,790 - - - 3,790 (180) Chinese Yuan - 41 - - - 41 (2) Czech Koruna - 23,572 - - - 23,572 (1,122) Danish Krone - 42,574 - - - 42,574 (2,027) Euro - 611,708 5,789,135 - - 6,400,843 (304,802) Hong Kong Dollar - 17,355 - - - 17,355 (826) Hungarian Forint - 23,483 - - - 23,483 (1,118) Indian Rupee - (5,339) - - - (5,339) 254 Israeli Shekel - 21,518 - - - 21,518 (1,025) Japanese Yen - 87,394 - - - 87,394 (4,162) Mexican Peso - 43,911 - - - 43,911 (2,091) New Zealand Dollar - 22,893 - - - 22,893 (1,090) Norwegian Krone - 16,892 - - - 16,892 (804) Pakistani Rupee - 559 - - - 559 (27) Polish Zloty - 78,153 - - - 78,153 (3,722) Pound Sterling - 36,046 70,402,781 - - 70,438,827 (3,354,230) Russian Ruble - 26,596 - - - 26,596 (1,266) Singapore Dollar - 21,640 - - - 21,640 (1,030) South African Rand - 10,534 - - - 10,534 (502) South Korean Won - 9,273 - - - 9,273 (442) Swedish Krona - 45,794 - - - 45,794 (2,181) Swiss Franc - 39,512 - - - 39,512 (1,882) Taiwanese Dollar - 3,738 - - - 3,738 (178) Turkish Lira - 62,773 - - - 62,773 (2,989)

Jupiter Asset Management Series Plc Annual Report and Audited Financial Statements for the financial year ended 31 December 2020
Notes to the Financial Statements for the financial year ended 31 December 2020 (continued)
330
11. Financial Instruments and Associated Risks (continued)
(f) Currency Risk (continued)
Jupiter Gold & Silver Fund
Monetary
Assets Net Other Monetary Assets and Liabilities
Share Class Exposure
Currency Exchange
Hedging
Currency Exchange
Non-Hedging Total
Exposure Sensitivity Analysis
(5% movement)
USD USD USD USD USD USD USD
Australian Dollar - 247,226 - - - 247,226 (11,773) Euro - 20,414 64,797,748 - - 64,818,162 (3,086,579) Pound Sterling - 620,401 615,786,915 - - 616,407,316 (29,352,729) Singapore Dollar - - 74,175 72,272 - 146,447 (6,974)
Jupiter UK Specialist Equity Fund
Monetary
Assets Net Other Monetary Assets and Liabilities
Share Class Exposure
Currency Exchange
Hedging
Currency Exchange
Non-Hedging Total
Exposure Sensitivity Analysis
(5% movement)
GBP GBP GBP GBP GBP GBP GBP
Euro - 1,641 28,742,831 28,563,439 - 57,307,911 (2,728,948) US Dollar - 2,173 25,960,679 25,771,389 - 51,734,241 (2,463,535)
Jupiter Financials Contingent Capital Fund
Monetary
Assets Net Other Monetary Assets and Liabilities
Share Class Exposure
Currency Exchange
Hedging
Currency Exchange
Non-Hedging Total
Exposure Sensitivity Analysis
(5% movement)
USD USD USD USD USD USD USD
Euro 41,863,810 322,857 22,612,733 22,534,112 (46,168,304) 41,165,208 (1,960,248) Pound Sterling 39,803,448 172,863 25,396,583 25,300,955 (37,863,664) 52,810,185 (2,514,771) Swiss Franc - 431 12,248 12,162 - 24,841 (1,183)

Jupiter Asset Management Series Plc Annual Report and Audited Financial Statements for the financial year ended 31 December 2020
Notes to the Financial Statements for the financial year ended 31 December 2020 (continued)
331
11. Financial Instruments and Associated Risks (continued) (f) Currency Risk (continued) The currency risk exposures of the Sub-Funds at 31 December 2019 were as follows: Merian China Equity Fund
Monetary Assets
Net Other Monetary Assets and Liabilities
Share Class Exposure
Currency Exchange
Hedging
Currency Exchange
Non-Hedging Total
Exposure Sensitivity Analysis
(5% movement)
USD USD USD USD USD USD USD
Chinese Yuan - (601,591) - - - (601,591) 28,647 Hong Kong delivered Chinese Yuan - 601,910 - - - 601,910 (28,662)
Hong Kong Dollar - 165,472 - - (170,213) (4,741) 226
Pound Sterling - 2,534 1,594,014 - - 1,596,548 (76,026)
Merian World Equity Fund
Monetary Assets
Net Other Monetary Assets and Liabilities
Share Class Exposure
Currency Exchange
Hedging
Currency Exchange
Non-Hedging Total
Exposure Sensitivity Analysis
(5% movement)
USD USD USD USD USD USD USD
Australian Dollar - 323,784 - - - 323,784 (15,418)
Canadian Dollar - 337,203 - - - 337,203 (16,057)
Danish Krone - 40,200 - - - 40,200 (1,914)
Euro - 763,131 79,703,166 2,732,811 - 83,199,108 (3,961,862)
Hong Kong Dollar - 347,282 - - - 347,282 (16,537)
Israeli Shekel - 8,345 - - - 8,345 (397)
Japanese Yen - 921,485 - - - 921,485 (43,880)
New Zealand Dollar - 137,196 - - - 137,196 (6,533)
Norwegian Krone - 314,706 - - - 314,706 (14,986)
Pound Sterling - 921,768 5,973,033 - - 6,894,801 (328,324)
Singapore Dollar - 318,884 - - - 318,884 (15,185)
Swedish Krona - 57,932 - - - 57,932 (2,759)
Swiss Franc - 60,415 - - - 60,415 (2,877)

Jupiter Asset Management Series Plc Annual Report and Audited Financial Statements for the financial year ended 31 December 2020
Notes to the Financial Statements for the financial year ended 31 December 2020 (continued)
332
11. Financial Instruments and Associated Risks (continued)
(f) Currency Risk (continued) Merian Pacific Equity Fund
Monetary Assets
Net Other Monetary Assets and Liabilities
Share Class Exposure
Currency Exchange
Hedging
Currency Exchange
Non-Hedging Total
Exposure Sensitivity Analysis
(5% movement)
USD USD USD USD USD USD USD
Australian Dollar - 254,866 - - - 254,866 (12,136)
Chinese Yuan - 4,450 - - - 4,450 (212)
Euro - 3,439 2,709,721 - - 2,713,160 (129,198)
Hong Kong Dollar - 384,602 - - - 384,602 (18,314)
Indian Rupee - (15,925) - - - (15,925) 758
Indonesian Rupiah - 2 - - - 2 -
New Zealand Dollar - 90,893 - - - 90,893 (4,328)
Pakistani Rupee - 20,953 - - - 20,953 (998)
Philippine Peso - (80,125) - - - (80,125) 3,815
Pound Sterling - 24,668 1,554,460 - - 1,579,128 (75,197)
Singapore Dollar - 43,204 - - - 43,204 (2,057)
South Korean Won - 129,229 - - - 129,229 (6,154)
Taiwanese Dollar - 49,159 - - - 49,159 (2,341)
Thai Baht - 76,342 - - - 76,342 (3,635)
Merian European Equity Fund
Monetary Assets
Net Other Monetary Assets and Liabilities
Share Class Exposure
Currency Exchange
Hedging
Currency Exchange
Non-Hedging Total
Exposure Sensitivity Analysis
(5% movement)
EUR EUR EUR EUR EUR EUR EUR
Danish Krone - 122,153 - - - 122,153 (5,817)
Norwegian Krone - 10,498 - - - 10,498 (500)
Pound Sterling - 178,173 2,169,791 - - 2,347,964 (111,808)
Swedish Krona - 1,521 - - - 1,521 (72)
Swiss Franc - 69,508 - - - 69,508 (3,310)
US Dollar - (20,777) 7,806,165 215,567 - 8,000,955 (380,998)

Jupiter Asset Management Series Plc Annual Report and Audited Financial Statements for the financial year ended 31 December 2020
Notes to the Financial Statements for the financial year ended 31 December 2020 (continued)
333
11. Financial Instruments and Associated Risks (continued)
(f) Currency Risk (continued)
Merian US Equity Income Fund
Monetary
Assets Net Other Monetary Assets and Liabilities
Share Class Exposure
Currency Exchange
Hedging
Currency Exchange
Non-Hedging Total
Exposure Sensitivity Analysis
(5% movement)
USD USD USD USD USD USD USD
Euro - 1,442 3,072,048 2,858,859 - 5,932,349 (282,493)
Pound Sterling - 119,288 139,292,639 - - 139,411,927 (6,638,663)
Merian North American Equity Fund
Monetary Assets
Net Other Monetary Assets and Liabilities
Share Class Exposure
Currency Exchange
Hedging
Currency Exchange
Non-Hedging Total
Exposure Sensitivity Analysis
(5% movement)
USD USD USD USD USD USD USD
Canadian Dollar - 465,435 - - - 465,435 (22,164)
Euro - 23,829 43,896,149 - - 43,919,978 (2,091,428)
Pound Sterling - 112,470 341,113,112 75,641,410 - 416,866,992 (19,850,809)
Swedish Krona - 337 - - - 337 (16)
Merian Global Dynamic Bond Fund
Monetary Assets
Net Other Monetary Assets and Liabilities
Share Class Exposure
Currency Exchange
Hedging
Currency Exchange
Non-Hedging Total
Exposure Sensitivity Analysis
(5% movement)
USD USD USD USD USD USD USD
Australian Dollar - (260,575) 1,385,218 1,396,724 1,620,850 4,142,217 (197,248)
Brazilian Real 2,528,139 - - - (662,236) 1,865,903 (88,853)
Canadian Dollar 14,596,307 230,066 - - (19,194,552) (4,368,179) 208,009
Chilean Peso - - - - (43) (43) 2
Euro 27,947,429 (229,614) 3,442,923 3,451,194 (25,145,562) 9,466,370 (450,780)
Hungarian Forint - 10,188 - - - 10,188 (485)
Indonesian Rupiah 4,422,444 - - - (459,510) 3,962,934 (188,711)
Japanese Yen 20,895,317 (219,683) - - (21,673,438) (997,804) 47,514
Mexican Peso 2,185,107 685 - - 2,569,679 4,755,471 (226,451)
New Zealand Dollar - 365 - - - 365 (17)
Norwegian Krone - 2,765 - - 3,328,267 3,331,032 (158,621)
Pound Sterling - 187,122 291,945 - 3,773,324 4,252,391 (202,495)
Russian Ruble 2,464,634 12 - - (6,501) 2,458,145 (117,055)

Jupiter Asset Management Series Plc Annual Report and Audited Financial Statements for the financial year ended 31 December 2020
Notes to the Financial Statements for the financial year ended 31 December 2020 (continued)
334
11. Financial Instruments and Associated Risks (continued)
(f) Currency Risk (continued) Merian Global Dynamic Bond Fund (continued)
Monetary
Assets Net Other Monetary Assets and Liabilities
Share Class Exposure
Currency Exchange
Hedging
Currency Exchange
Non-Hedging Total
Exposure Sensitivity Analysis
(5% movement)
USD USD USD USD USD USD USD
Singapore Dollar - 2,857 - - - 2,857 (136)
South African Rand 2,355,255 64,134 2,054,967 2,040,451 (36,454) 6,478,353 (308,493)
South Korean Won - - - - 2,425,871 2,425,871 (115,518)
Swedish Krona - (134,450) - - 60,253 (74,197) 3,533
Swiss Franc - 20,242 - - 1,107,972 1,128,214 (53,724)
Turkish Lira - 5,882 - - - 5,882 (280)
Merian Emerging Market Debt Fund
Monetary Assets
Net Other Monetary Assets and Liabilities
Share Class Exposure
Currency Exchange
Hedging
Currency Exchange
Non-Hedging Total
Exposure Sensitivity Analysis
(5% movement)
USD USD USD USD USD USD USD
Egyptian Pound 3,593,777 - - - - 3,593,777 (171,132)
Euro 3,182,374 (4) 18,736,213 16,942,216 (3,147,707) 35,713,092 (1,700,623)
Nigerian Naira 3,548,002 - - - - 3,548,002 (168,952)
Pound Sterling - (2,403) 3,656,215 - - 3,653,812 (173,991)
Singapore Dollar - - 394,279 393,835 - 788,114 (37,529)
South African Rand - (5,153) 728,796 730,413 - 1,454,056 (69,241)
Swedish Krona - 5 289,632 287,555 - 577,192 (27,485)
Ukrainian Hryvna 2,471,726 - - - - 2,471,726 (117,701)
Merian Global Emerging Markets Fund
Monetary Assets
Net Other Monetary Assets and Liabilities
Share Class Exposure
Currency Exchange
Hedging
Currency Exchange
Non-Hedging Total
Exposure Sensitivity Analysis
(5% movement)
USD USD USD USD USD USD USD
Brazilian Real - 26,628 - - - 26,628 (1,268)
Euro - 2,255 46,045,465 - - 46,047,720 (2,192,749)

Jupiter Asset Management Series Plc Annual Report and Audited Financial Statements for the financial year ended 31 December 2020
Notes to the Financial Statements for the financial year ended 31 December 2020 (continued)
335
11. Financial Instruments and Associated Risks (continued)
(f) Currency Risk (continued) Merian Global Emerging Markets Fund (continued)
Monetary Assets
Net Other Monetary Assets and Liabilities
Share Class Exposure
Currency Exchange
Hedging
Currency Exchange
Non-Hedging Total
Exposure Sensitivity Analysis
(5% movement)
USD USD USD USD USD USD USD
Hong Kong Dollar - 823 - - - 823 (39)
Malaysian Ringgit - 5,834 - - - 5,834 (278)
Philippine Peso - 5,005 - - - 5,005 (238)
Pound Sterling - 11,939 79,239,882 - - 79,251,821 (3,773,896)
South African Rand - 3,987 - - - 3,987 (190)
South Korean Won - 62,153 - - - 62,153 (2,960)
Merian Asian Equity Income Fund
Monetary Assets
Net Other Monetary Assets and Liabilities
Share Class Exposure
Currency Exchange
Hedging
Currency Exchange
Non-Hedging Total
Exposure Sensitivity Analysis
(5% movement)
USD USD USD USD USD USD USD
Australian Dollar - 117,798 - - - 117,798 (5,609)
Chinese Yuan - 36,310 - - - 36,310 (1,729)
Euro - (601) 3,903,016 - - 3,902,415 (185,829)
Hong Kong Dollar - 962,352 - - - 962,352 (45,826)
Indian Rupee - (45,133) - - - (45,133) 2,149
Indonesian Rupiah - 6 - - - 6 -
New Zealand Dollar - 30,459 - - - 30,459 (1,450)
Pakistani Rupee - 27,005 - - - 27,005 (1,286)
Philippine Peso - (53,945) - - - (53,945) 2,569
Pound Sterling - 16,252 115,863,644 - - 115,879,896 (5,518,090)
Singapore Dollar - 54,214 - - - 54,214 (2,582)
South Korean Won - 281,591 - - - 281,591 (13,409)
Taiwanese Dollar - 235,652 - - - 235,652 (11,222)
Thai Baht - 24,806 - - - 24,806 (1,181)

Jupiter Asset Management Series Plc Annual Report and Audited Financial Statements for the financial year ended 31 December 2020
Notes to the Financial Statements for the financial year ended 31 December 2020 (continued)
336
11. Financial Instruments and Associated Risks (continued)
(f) Currency Risk (continued) Merian Local Currency Emerging Market Debt Fund
Monetary Assets
Net Other Monetary Assets and Liabilities
Share Class Exposure
Currency Exchange
Hedging
Currency Exchange
Non-Hedging Total
Exposure Sensitivity Analysis
(5% movement)
USD USD USD USD USD USD USD
Argentina Peso - - - - 32,210 32,210 (1,534)
Australian Dollar - 11,743 13,317,274 13,298,967 - 26,627,984 (1,267,999)
Brazilian Real 48,072,091 1,588 - - 5,870,578 53,944,257 (2,568,774)
Chilean Peso 2,595,878 133,885 - - 17,882,355 20,612,118 (981,529)
Chinese Yuan - - - - (4,345) (4,345) 207
Colombian Peso 35,848,181 - - - 1,255,255 37,103,436 (1,766,830)
Czech Koruna - - - - 17,831,595 17,831,595 (849,124)
Dominican Republic Peso 3,216,301 - - - - 3,216,301 (153,157)
Egyptian Pound 22,260,088 - - - - 22,260,088 (1,060,004)
Euro - (1,131) 985,341 - - 984,210 (46,867)
Hungarian Forint 4,414 (23) - - 19,548,825 19,553,216 (931,106)
Indian Rupee 10,883,049 - - - (9,003,098) 1,879,951 (89,521)
Indonesian Rupiah 48,040,038 - - - (832,766) 47,207,272 (2,247,965)
Israeli Shekel - 1 - - - 1 -
Kazakhstan Tenge 1,377,870 - - - - 1,377,870 (65,613)
Kenyan Shilling 2,142,222 - - - - 2,142,222 (102,011)
Malaysian Ringgit 29,651,344 - - - - 29,651,344 (1,411,969)
Mexican Peso 37,833,245 145,935 - - 10,092,126 48,071,306 (2,289,110)
New Ghana Cedi 3,478,184 1 - - - 3,478,185 (165,628)
Nigerian Naira 13,126,684 3,294,000 - - - 16,420,684 (781,937)
Pakistani Rupee 4,489,753 (4,489,753) - - - - -
Peruvian Nuevo Sol 21,944,844 994 - - 1,423,426 23,369,264 (1,112,822)
Philippine Peso - - - - 1,525,318 1,525,318 (72,634)
Polish Zloty 2,253,879 (208,900) - - 40,578,743 42,623,722 (2,029,701)
Pound Sterling - 40,765 280,162,972 - - 280,203,737 (13,343,035)
Romanian Leu 5,443,380 - - - 5,996,869 11,440,249 (544,774)
Russian Ruble 35,118,050 (2) - - 14,804,898 49,922,946 (2,377,283)

Jupiter Asset Management Series Plc Annual Report and Audited Financial Statements for the financial year ended 31 December 2020
Notes to the Financial Statements for the financial year ended 31 December 2020 (continued)
337
11. Financial Instruments and Associated Risks (continued)
(f) Currency Risk (continued) Merian Local Currency Emerging Market Debt Fund (continued)
Monetary
Assets Net Other Monetary Assets and Liabilities
Share Class Exposure
Currency Exchange
Hedging
Currency Exchange
Non-Hedging Total
Exposure Sensitivity Analysis
(5% movement)
USD USD USD USD USD USD USD
South African Rand 61,122,274 (122,245) 46,792,920 46,776,346 (10,851,872) 143,717,423 (6,843,687)
South Korean Won - - - - 225 225 (11)
Taiwanese Dollar - - - - 7,623,341 7,623,341 (363,016)
Thai Baht 14,648,644 665,607 - - 28,666,969 43,981,220 (2,094,344)
Turkish Lira 25,514,406 410 - - (12,917,320) 12,597,496 (599,881)
Ukrainian Hryvna 17,463,027 - - - - 17,463,027 (831,573)
Zambian Kwacha 259,430 - - - - 259,430 (12,354)
Merian UK Alpha Fund (IRL)
Monetary Assets
Net Other Monetary Assets and Liabilities
Share Class Exposure
Currency Exchange
Hedging
Currency Exchange
Non-Hedging Total
Exposure Sensitivity Analysis
(5% movement)
GBP GBP GBP GBP GBP GBP GBP
Euro - 41,454 74,950 - - 116,404 (5,543)
US Dollar - 271,700 4,152,534 993,091 - 5,417,325 (257,968)
Merian UK Smaller Companies Focus Fund
Monetary
Assets Net Other Monetary Assets and Liabilities
Share Class Exposure
Currency Exchange
Hedging
Currency Exchange
Non-Hedging Total
Exposure Sensitivity Analysis
(5% movement)
GBP GBP GBP GBP GBP GBP GBP
Euro - 3,219 - - - 3,219 (153)
US Dollar - 460 - - - 460 (22)

Jupiter Asset Management Series Plc Annual Report and Audited Financial Statements for the financial year ended 31 December 2020
Notes to the Financial Statements for the financial year ended 31 December 2020 (continued)
338
11. Financial Instruments and Associated Risks (continued)
(f) Currency Risk (continued)
Merian UK Dynamic Equity Fund
Monetary
Assets Net Other Monetary Assets and Liabilities
Share Class Exposure
Currency Exchange
Hedging
Currency Exchange
Non-Hedging Total
Exposure Sensitivity Analysis
(5% movement)
GBP GBP GBP GBP GBP GBP GBP
Euro - 426 8,617,726 8,646,293 - 17,264,445 (822,116)
US Dollar - 588 - - - 588 (28)
Merian Global Equity Absolute Return Fund
Monetary
Assets Net Other Monetary
Assets and Liabilities Share Class
Exposure
Currency Exchange
Hedging
Currency Exchange
Non-Hedging Total
Exposure Sensitivity Analysis
(5% movement)
USD USD USD USD USD USD USD
Australian Dollar - (2,997,368) - - (248,587,211) (251,584,579) 11,980,218
Brazilian Real - (8,941,798) - - - (8,941,798) 425,800
Canadian Dollar - 1,541,851 - - (25,718,773) (24,176,922) 1,151,282
Chinese Yuan - (269,341) - - - (269,341) 12,826
Danish Krone - (406,417) - - (59,679,171) (60,085,588) 2,861,218
Euro - (21,057,775) 1,622,308,430 1,638,517,543 (475,251,245) 2,764,516,953 (131,643,664) Hong Kong delivered Chinese Yuan - - 42,863 43,047 - 85,910 (4,091)
Hong Kong Dollar - (4,486,349) - - (470,361,690) (474,848,039) 22,611,811
Japanese Yen - (33,688,573) - - (213,757,511) (247,446,084) 11,783,147
New Zealand Dollar - 2,652,917 - - (14,242,123) (11,589,206) 551,867
Norwegian Krone - 1,929,690 - - (15,409,288) (13,479,598) 641,886
Pound Sterling - (3,082,680) 1,258,282,380 1,264,712,653 (3,520,704) 2,516,391,649 (119,828,174)
Singapore Dollar - (3,469,594) 3,399,978 3,417,342 (33,887,976) (30,540,250) 1,454,298
South African Rand - 1,735,441 - - 4,029,732 5,765,173 (274,532)
South Korean Won - (359,827) - - - (359,827) 17,135
Swedish Krona - 1,008,136 33,724,186 33,716,740 (156,890,302) (88,441,240) 4,211,488
Swiss Franc - 2,839,237 14,868,962 14,967,189 (159,184,420) (126,509,032) 6,024,240
Taiwanese Dollar - (2,487) - - - (2,487) 118
Turkish Lira - 2,776,667 - - - 2,776,667 (132,222)

Jupiter Asset Management Series Plc Annual Report and Audited Financial Statements for the financial year ended 31 December 2020
Notes to the Financial Statements for the financial year ended 31 December 2020 (continued)
339
11. Financial Instruments and Associated Risks (continued)
(f) Currency Risk (continued) Merian Strategic Absolute Return Bond Fund
Monetary
Assets Net Other Monetary Assets and Liabilities
Share Class Exposure
Currency Exchange
Hedging
Currency Exchange
Non-Hedging Total
Exposure Sensitivity Analysis
(5% movement)
USD USD USD USD USD USD USD
Australian Dollar - (192,318) - - 1,920,490 1,728,172 (82,294)
Brazilian Real 2,740,439 - - - (879,638) 1,860,801 (88,610)
Canadian Dollar 14,217,692 268,755 - - (18,737,115) (4,250,668) 202,413
Chilean Peso - - - - (43) (43) 2
Czech Koruna - 125 - - - 125 (6)
Euro 53,935,820 (489,876) 41,657,700 41,611,894 (50,469,130) 86,246,408 (4,106,972)
Hungarian Forint - 10,189 - - - 10,189 (485)
Indian Rupee 484,453 - - - - 484,453 (23,069)
Indonesian Rupiah 4,355,018 - - - (96,396) 4,258,622 (202,792)
Japanese Yen 26,695,763 164,506 - - (27,913,977) (1,053,708) 50,177
Mexican Peso 1,663,096 4,435 - - 3,791,503 5,459,034 (259,954)
New Zealand Dollar - 1,017 - - - 1,017 (48)
Norwegian Krone - 2,587 - - 3,439,093 3,441,680 (163,890)
Polish Zloty - 34,944 - - - 34,944 (1,664)
Pound Sterling 1,775,947 206,461 128,257,368 128,214,932 2,451,568 260,906,276 (12,424,108)
Russian Ruble 2,634,608 100 - - (85) 2,634,623 (125,458)
Singapore Dollar - 27,040 - - - 27,040 (1,288)
South African Rand 2,871,474 30,706 - - (19,026) 2,883,154 (137,293)
South Korean Won - - - - 2,729,096 2,729,096 (129,957)
Swedish Krona - (112,562) - - 140,941 28,379 (1,351)
Swiss Franc - 25,155 - - 1,170,101 1,195,256 (56,917)
Turkish Lira - 6,346 - - - 6,346 (302)
Uruguayan Peso 39,428 - - - - 39,428 (1,878)

Jupiter Asset Management Series Plc Annual Report and Audited Financial Statements for the financial year ended 31 December 2020
Notes to the Financial Statements for the financial year ended 31 December 2020 (continued)
340
11. Financial Instruments and Associated Risks (continued)
(f) Currency Risk (continued)
Merian Europe (ex UK) Smaller Companies Fund
Monetary
Assets Net Other Monetary
Assets and Liabilities Share Class
Exposure
Currency Exchange
Hedging
Currency Exchange
Non-Hedging Total
Exposure Sensitivity Analysis
(5% movement)
EUR EUR EUR EUR EUR EUR EUR
Pound Sterling - 27,903 160,630,941 1,584,002 - 162,242,846 (7,725,850)
Swiss Franc - 97,418 - - - 97,418 (4,639)
US Dollar - 199 2,791,367 649,328 - 3,440,894 (163,852)
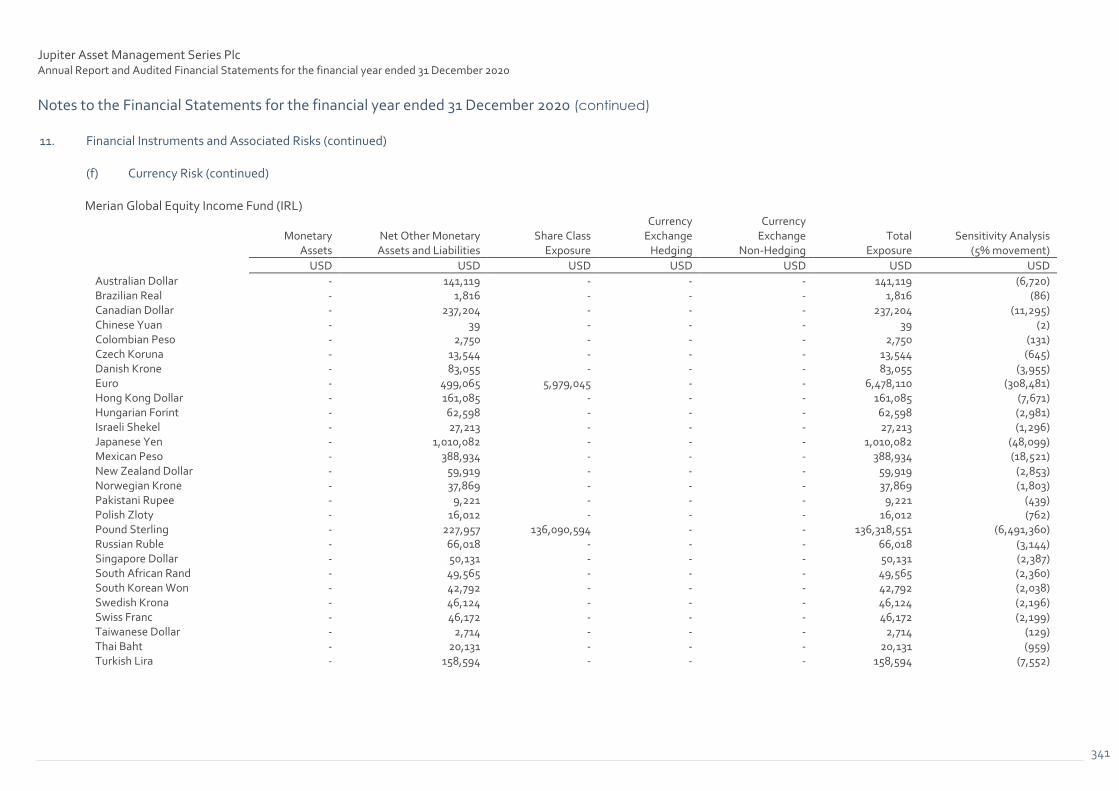
Jupiter Asset Management Series Plc Annual Report and Audited Financial Statements for the financial year ended 31 December 2020
Notes to the Financial Statements for the financial year ended 31 December 2020 (continued)
341
11. Financial Instruments and Associated Risks (continued)
(f) Currency Risk (continued) Merian Global Equity Income Fund (IRL)
Monetary
Assets Net Other Monetary Assets and Liabilities
Share Class Exposure
Currency Exchange
Hedging
Currency Exchange
Non-Hedging Total
Exposure Sensitivity Analysis
(5% movement)
USD USD USD USD USD USD USD
Australian Dollar - 141,119 - - - 141,119 (6,720) Brazilian Real - 1,816 - - - 1,816 (86) Canadian Dollar - 237,204 - - - 237,204 (11,295) Chinese Yuan - 39 - - - 39 (2) Colombian Peso - 2,750 - - - 2,750 (131) Czech Koruna - 13,544 - - - 13,544 (645) Danish Krone - 83,055 - - - 83,055 (3,955) Euro - 499,065 5,979,045 - - 6,478,110 (308,481) Hong Kong Dollar - 161,085 - - - 161,085 (7,671) Hungarian Forint - 62,598 - - - 62,598 (2,981) Israeli Shekel - 27,213 - - - 27,213 (1,296) Japanese Yen - 1,010,082 - - - 1,010,082 (48,099) Mexican Peso - 388,934 - - - 388,934 (18,521) New Zealand Dollar - 59,919 - - - 59,919 (2,853) Norwegian Krone - 37,869 - - - 37,869 (1,803) Pakistani Rupee - 9,221 - - - 9,221 (439) Polish Zloty - 16,012 - - - 16,012 (762) Pound Sterling - 227,957 136,090,594 - - 136,318,551 (6,491,360) Russian Ruble - 66,018 - - - 66,018 (3,144) Singapore Dollar - 50,131 - - - 50,131 (2,387) South African Rand - 49,565 - - - 49,565 (2,360) South Korean Won - 42,792 - - - 42,792 (2,038) Swedish Krona - 46,124 - - - 46,124 (2,196) Swiss Franc - 46,172 - - - 46,172 (2,199) Taiwanese Dollar - 2,714 - - - 2,714 (129) Thai Baht - 20,131 - - - 20,131 (959) Turkish Lira - 158,594 - - - 158,594 (7,552)

Jupiter Asset Management Series Plc Annual Report and Audited Financial Statements for the financial year ended 31 December 2020
Notes to the Financial Statements for the financial year ended 31 December 2020 (continued)
342
11. Financial Instruments and Associated Risks (continued)
(f) Currency Risk (continued)
Merian Gold & Silver Fund
Monetary
Assets Net Other Monetary Assets and Liabilities
Share Class Exposure
Currency Exchange
Hedging
Currency Exchange
Non-Hedging Total
Exposure Sensitivity Analysis
(5% movement)
USD USD USD USD USD USD USD
Australian Dollar - 512,745 - - (512,796) (51) 2 Canadian Dollar - (1,539,685) - - - (1,539,685) 73,318 Euro - 1 4,964,701 - - 4,964,702 (236,414) Pound Sterling - 496,001 457,383,645 - - 457,879,646 (21,803,793)
Merian UK Specialist Equity Fund
Monetary
Assets Net Other Monetary Assets and Liabilities
Share Class Exposure
Currency Exchange
Hedging
Currency Exchange
Non-Hedging Total
Exposure Sensitivity Analysis
(5% movement)
GBP GBP GBP GBP GBP GBP GBP
Euro - 47 27,882,265 27,659,119 - 55,541,431 (2,644,830) US Dollar - 400 33,587,218 33,381,044 - 66,968,662 (3,188,984)
Merian Financials Contingent Capital Fund
Monetary
Assets Net Other Monetary Assets and Liabilities
Share Class Exposure
Currency Exchange
Hedging
Currency Exchange
Non-Hedging Total
Exposure Sensitivity Analysis
(5% movement)
USD USD USD USD USD USD USD
Euro 144,096,025 590,368 16,765,087 16,636,360 (144,586,699) 33,501,141 (1,595,292) Pound Sterling 140,754,970 333,326 192,947,002 191,212,033 (141,117,466) 384,129,865 (18,291,898) Swiss Franc - - 191 191 - 382 (18)
n

Jupiter Asset Management Series Plc Annual Report and Audited Financial Statements for the financial year ended 31 December 2020
Notes to the Financial Statements for the financial year ended 31 December 2020 (continued)
343
11. Financial Instruments and Associated Risks (continued)
(f) Currency Risk (continued)
If the exchange rates of the foreign currencies to which the Sub-Funds had exposure at year end had increased or decreased by 5% with all other variables held constant, this would have increased or decreased profit or loss for the financial year as follows:
31 December 2020 31 December 2019
+5% -5% +5% -5%
Jupiter China Equity Fund (108,364) 119,771 (75,815) 83,795 Jupiter Merian World Equity Fund (1,113,812) 1,231,055 (4,426,729) 4,892,701 Jupiter Pacific Equity Fund (225,367) 249,089 (249,997) 276,313 Merian European Equity Fund (341,829) 377,811 (502,505) 555,400 Jupiter Merian US Equity Income Fund (2,684,494) 2,967,072 (6,921,156) 7,649,699 Jupiter Merian North American Equity Fund (IRL) (4,977,398) 5,501,335 (21,964,417) 24,276,461 Jupiter Global Emerging Markets Focus Fund (8,870,511) 9,804,248 (5,971,618) 6,600,207 Merian Asian Equity Income Fund (72,279) 79,885 (5,783,495) 6,392,286 Jupiter UK Alpha Fund (IRL) (139,251) 153,908 (263,511) 291,249 Jupiter UK Smaller Companies Focus Fund (183) 202 (175) 193 Jupiter Europe (ex UK) Smaller Companies Fund (905,430) 1,000,737 (7,894,341) 8,725,324 Jupiter Merian Global Equity Income Fund (IRL) (3,692,293) 4,080,956 (6,930,064) 7,659,546 Jupiter Gold & Silver Fund (32,458,055) 35,874,692 (21,966,887) 24,279,190
In practice, the actual trading results may differ from the above sensitivity analysis and the difference could be significant. The currency risk of other Sub-Funds is disclosed by way of VaR analysis on pages 346 to 348.
(g) Fair Value of Financial Assets and Financial Liabilities
Fair Value Estimation
The Company is required to classify fair value measurements using a fair value hierarchy that reflects the significant of the inputs used in making the measurements. The standard requires an entity to provide a quantitative and qualitative analysis of those instruments recognised at fair value based on a three-level measurement hierarchy. The fair value hierarchy has the following levels:
Level 1 – Quoted prices (unadjusted) in active markets for identical assets or liabilities. Level 2 – Inputs other than quoted prices included within Level 1 that are observable for the asset or liability, either directly (that is, as prices) or indirectly (that is, derived from prices). Level 3 – Inputs for the asset or liability that are not based on observable market data (that is, unobservable inputs).
Furthermore, for those instruments which have significant unobservable inputs (Level 3), the amendment requires disclosures on the transfers into and out of Level 3, a reconciliation of the opening and closing balances, total gains and losses for the period, purchases, sales issues and settlements. The level in the fair value hierarchy within which the fair value measurement is categorised in its entirety is determined on the basis of the lowest level input that is significant to the fair value measurement in its entirety. For this purpose, the significance of an input is assessed against the fair value measurement in its entirety. If a fair value measurement uses observable inputs that require significant adjustment based on unobservable inputs, that measurement is a Level 3 measurement. Assessing the significance of a particular input to the fair value measurement in its entirety requires judgement, considering factors specific to the asset or liability.
The determination of what constitutes ‘observable’ requires significant judgement by the Sub-Funds. The Sub-Funds consider observable data to be that market data that is readily available, regularly distributed or updated, reliable and verifiable, not proprietary, and provided by independent sources that are actively involved in the relevant market.

Jupiter Asset Management Series Plc Annual Report and Audited Financial Statements for the financial year ended 31 December 2020
Notes to the Financial Statements for the financial year ended 31 December 2020 (continued)
344
11. Financial Instruments and Associated Risks (continued)
(g) Fair Value of Financial Assets and Financial Liabilities (continued) The inputs or methodology used for valuing securities are not necessarily an indication of the risk associated with investing in those securities. The table below provides a summary within the fair value hierarchy of the Sub-Funds’ financial assets and financial liabilities measured at last traded prices at 31 December 2020.
The financial instruments at 31 December 2020 and 31 December 2019 are classified as follows: Investment Type Level
Equities 1 Future Contracts 1 Rights 1 Government Bonds* 2 Corporate Bonds* 2 Convertible Securities 2 Municipal Bonds 2 Asset Backed Securities 2 Mortgage Backed Securities 2 Investment Funds 2 Contract for Difference 2 Credit Default Swaps 2 Interest Rate Swaps 2 Total Return Swaps 2 Open Currency Exchange Contracts 2 Options Purchased 2 Options Written 2 Warrants 2
* Please note included within government and corporate bonds are some bonds which meet the criteria to be classified as Level 1. There is no Level 3 security as at 31 December 2020. Reconciliation of Level 3 fair value measurements of financial assets for the year 2020.
Jupiter UK Smaller Companies Focus Fund
Jupiter UK Dynamic Equity Fund
Jupiter UK Specialist Equity Fund
GBP GBP GBP
Opening Balance 11,646,409 17,664,500 15,194,829
Purchases - - -
Sales (18,575,315) (32,763,408) (25,464,013)
Transfers out of level 3 - - -
Net gain/(loss) on financial assets at fair value through profit or loss
6,928,906 15,098,908 10,269,184
Closing Balance - - -

Jupiter Asset Management Series Plc Annual Report and Audited Financial Statements for the financial year ended 31 December 2020
Notes to the Financial Statements for the financial year ended 31 December 2020 (continued)
345
11. Financial Instruments and Associated Risks (continued)
(g) Fair Value of Financial Assets and Financial Liabilities (continued) Reconciliation of Level 3 fair value measurements of financial assets for the year 2019.
Merian UK
Smaller Companies Focus Fund
Merian UK Dynamic Equity Fund
Merian UK Specialist Equity Fund
GBP GBP GBP
Opening Balance 20,091,130 32,818,813 28,183,959
Purchases - - -
Sales (13,947,624) (24,072,111) (20,648,873)
Transfers out of level 3 - - -
Net gain/(loss) on financial assets at fair value through profit or loss
5,502,903 8,917,798 7,659,743
Closing Balance 11,646,409 17,664,500 15,194,829
Transfers between levels are deemed to have occurred when the pricing source for a particular security has changed, which triggers a change in levels. There were no transfers between levels of the fair value hierarchy during the financial year ended 31 December 2020. Assets and liabilities not carried at fair value are carried at amortised cost; their carrying values are a reasonable approximation of fair value.
Sensitivity to changes in inputs Although the Investment Manager believes that its estimates of fair value are appropriate, the use of different methodologies or assumptions could lead to different measurements of fair value. For fair value measurements in Level 3, in changing one or more of the assumptions used to reasonably possible alternative assumptions by decreasing or increasing by 5% with all other variables held constant, the impact on valuation is shown in the table below:
Fair value as at 31 December 2020 Sensitivity Change in valuation
USD - 5% -
Fair value as at 31 December 2019 Sensitivity Change in valuation
USD 58,961,202 5% 2,948,060
Level 3 Valuation Techniques The following table shows the valuation techniques used for Level 3 fair values, as well as the significant unobservable inputs used for Level 3 items.
Valuation technique Significant unobservable inputs Inputs used
Comparable Company Multiples
EV/Revenue, Last 12 months revenue multiples, Discounts for illiquidity
Unaudited Accounts (Statement of Operations / Statement of Financial Position), Comparable Company data (enterprise value, market cap, LTM revenue, LTM EBITDA, LTM EBITDA, LTM revenue growth), Recent market transactions, Relevant post IPO valuations for similar companies
Last transacted value The fair value of the Company’s last transaction is considered to be un-observable
Recently executed purchase price

Jupiter Asset Management Series Plc Annual Report and Audited Financial Statements for the financial year ended 31 December 2020
Notes to the Financial Statements for the financial year ended 31 December 2020 (continued)
346
11. Financial Instruments and Associated Risks (continued)
(h) Leverage Many derivative instruments have a leverage component, adverse changes in the value or level of the underlying asset, rate or index can result in a loss substantially greater than the amount invested in the derivative itself. Certain derivative instruments have the potential for unlimited loss regardless of the size of the initial investment. (i) Global Derivative Exposure Sensitivity Analysis for Sub-Funds through Commitment Approach The risk is managed through the commitment approach to quantitatively measure the Sub-Funds’ global exposure through the use of financial derivative instruments in line with UCITS Directives and Central Bank regulations for Sub-Funds listed in the tables below. At the date of this Prospectus, derivatives or instruments and techniques for the purposes of efficient portfolio management are not currently used for the Jupiter UK Smaller Companies Focus Fund. If this policy changes, prior approval of the Shareholders and the Central Bank will be sought and a risk management process will be cleared in advance by the Central Bank in accordance with the requirements of the Central Bank. The following Sub-Funds will not be leveraged in excess of 10% of their Net Asset Value: Jupiter China Equity Fund Jupiter Pacific Equity Fund Merian European Equity Fund Jupiter Merian US Equity Income Fund Jupiter Global Emerging Markets Focus Fund The following Sub-Funds will not be leveraged in excess of 100% of their Net Asset Value: Jupiter Merian World Equity Fund Jupiter Merian North American Equity Fund (IRL) Jupiter Emerging Market Debt Fund Merian Asian Equity Income Fund Jupiter UK Alpha Fund (IRL) Jupiter UK Smaller Companies Focus Fund Jupiter Europe (ex UK) Smaller Companies Fund Jupiter Merian Global Equity Income Fund (IRL) Jupiter Gold & Silver Fund (j) Value at Risk (“VaR”) Method
In the case of the Sub-Funds listed below the Manager uses the VaR method. The relevant Sub-Funds use appropriate Relative and Absolute VaR analysis as outlined in the following table:
Merian Global Dynamic Bond Fund Absolute n/a Jupiter Emerging Market Debt Fund Relative JP Morgan EMBI Global Index Jupiter Local Currency Emerging Market Debt Fund Relative JPMorgan GBI-EM Global Diversified Index Jupiter UK Dynamic Equity Fund Relative FTSE 250 Index Excluding Investments Trusts Jupiter Merian Global Equity Absolute Return Fund Absolute n/a Jupiter Strategic Absolute Return Bond Fund Absolute n/a Jupiter UK Specialist Equity Fund Absolute n/a
Jupiter Financials Contingent Capital Fund Relative Bloomberg Barclays Contingent Capital Western Europe Index
The daily VaR limit for Sub-Funds using Absolute VaR limit is 4.47% (2019: 4.47%).

Jupiter Asset Management Series Plc Annual Report and Audited Financial Statements for the financial year ended 31 December 2020
Notes to the Financial Statements for the financial year ended 31 December 2020 (continued)
347
11. Financial Instruments and Associated Risks (continued)
(j) Value at Risk (“VaR”) Method (continued) VaR is a statistically based estimate of the potential loss on the current portfolio from adverse market movements. The VaR measure captures both “general” and “idiosyncratic” market risks. General market risk factors are variables which are driven by macroeconomic, geopolitical and other market-wide considerations, independent of any instrument or single name. They include movements in interest rates, widening or tightening of general spread levels and directional movements in equity market indices, exchange rates, and energy, metal and commodity prices. Changes in associated volatilities and correlations between these risk factors – some of which may be unobservable or only indirectly observable – are also general market risks. Idiosyncratic components are those that cannot be explained by general market movements – broadly, changes in the prices of debt and equity instruments and derivatives linked to them, resulting from factors and events specific to individual names.
VaR expresses potential loss, but only to a certain level of confidence and holding period of 1 and 20 days depending on the Sub-Fund, and there is therefore a specified statistical probability (1%) that actual loss could be greater than the VaR estimate. A Sub-Fund must ensure that its global exposure relating to FDI does not exceed its total Net Asset Value. A Sub-Fund using the commitment approach to measure its positions in FDI may not therefore be exposed in excess of 100% of its Net Asset Value. Global exposure is calculated by the Administrator by extracting information from the Sub-Fund accounting system relating to the full exposure on FDIs. This information is passed to the Compliance Monitoring Services Division (CMS) for the purposes of calculating the global exposure and comparing the results against the overall value of the Sub-Fund. In 2020, FDI global exposure was calculated under the commitment approach as described, while the market risk is calculated utilising the VaR methodology described.
31 December 2020 Confidence
Level Holding
Period Maximum
VaR Minimum
VaR Average
VaR Average
Leverage
VaR as
at 31/12/20
Total VaR Market Value
(GBP/USD/EUR/JPY)
Merian Global Dynamic Bond Fund 99.00% 1 day 1.80% 0.23% 1.17% 183.00% 0.82% 1,975,964
Jupiter Emerging Market Debt Fund 99.00% 1day 4.53% 0.55% 2.88% 20.00% 1.90% 1,813,350
Jupiter Local Currency Emerging Market Debt Fund 99.00% 1day 3.52% 0.95% 2.68% 161.00% 2.71% 4,119,725
Jupiter UK Dynamic Equity Fund 99.00% 1day 9.00% 1.76% 6.52% 2.00% 4.58% 18,924,246
Jupiter Merian Global Equity Absolute Return Fund 99.00% 1day 1.09% 0.41% 0.56% 220.00% 0.66% 8,904,013
Jupiter Strategic Absolute Return Bond Fund 99.00% 1day 1.77% 0.14% 0.92% 229.00% 0.68% 820,760
Jupiter UK Specialist Equity Fund 99.00% 1day 2.76% 0.51% 1.68% 96.00% 1.54% 7,311,038
Jupiter Financials Contingent Capital Fund 99.00% 1day 2.54% 0.20% 1.25% 92.00% 1.34% 1,728,717

Jupiter Asset Management Series Plc Annual Report and Audited Financial Statements for the financial year ended 31 December 2020
Notes to the Financial Statements for the financial year ended 31 December 2020 (continued)
348
11. Financial Instruments and Associated Risks (continued) (j) Value at Risk (“VaR”) Method (continued) The Sub-Funds do employ leverage, calculated as sum of notionals, to achieve the Sub-Funds objective and to reduce risk, and this has not exceeded the expected level as disclosed in the Sub-Fund’s Prospectus.
31 December 2019 Confidence
Level Holding
Period Maximum
VaR Minimum
VaR Average
VaR Average
Leverage
VaR as
at 31/12/19
Total VaR Market Value
(GBP/USD/EUR/JPY)
Merian Global Dynamic Bond Fund** 99.00% 1 day 0.70% 0.31% 0.47% 236.00% 0.42% 655,633
Merian Emerging Market Debt Fund 99.00% 1day 1.14% 0.51% 0.83% 7.00% 0.58% 704,498
Merian Local Currency Emerging Market Debt Fund 99.00% 1day 2.07% 1.07% 1.61% 126.00% 1.21% 5,721,662
Merian UK Dynamic Equity Fund 99.00% 1day 2.87% 1.87% 2.55% 6.00% 1.87% 9,520,319
Merian Global Equity Absolute Return Fund 99.00% 1day 0.88% 0.45% 0.64% 190.00% 0.58% 22,559,826
Merian Strategic Absolute Return Bond Fund 99.00% 1day 0.92% 0.14% 0.44% 255.00% 0.31% 587,631
Merian UK Specialist Equity Fund 99.00% 1day 1.00% 0.59% 0.80% 99.00% 0.66% 2,906,838
Merian Financials Contingent Capital Fund 99.00% 1day 1.14% 0.51% 0.83% 67.00% 0.58% 704,498
(k) Custody and Title Risk Statement The Depositary is under a duty to hold in custody all financial instruments that may be registered in a financial instruments account opened in the depositary’s books and all financial instruments that can be physically delivered to the depositary. The Depositary is required to ensure that all financial instruments that can be registered in a financial instruments account opened in the depositary’s books are registered in the depositary’s books within segregated accounts. For other assets, the Depositary shall verify the Company’s ownership of such assets. The Depositary will maintain a record of the financial instruments entrusted to it and those assets for which it is satisfied that the Company holds the ownership. When the Depositary employs a sub-custodian the Depositary retains responsibility for the assets of the Sub-Fund. However, it should be noted that not all jurisdictions have the same rules and regulations as Ireland regarding the custody of assets and the recognition of the interests of a beneficial owner such as a Sub-Fund. Therefore, in such jurisdictions, there is a risk that if a sub-custodian becomes bankrupt or insolvent, the Sub-Fund’s beneficial ownership of the assets held by such sub-custodian may not be recognised and consequently the creditors of the sub-custodian may seek to have recourse to the assets of the Sub-Fund. In those jurisdictions where the Sub-Fund’s beneficial ownership of its assets is ultimately recognised, the Sub-Fund may suffer delay and cost in recovering those assets. The Sub-Funds may invest in markets where custodial and/or settlement systems are not fully developed, such as Russia and Argentina, therefore the assets of a Sub-Fund which are traded in such markets and which have been entrusted to sub-custodians, in circumstances where the use of such sub-custodians is necessary, may be exposed to risk. The Depositary shall maintain an appropriate level of supervision over the sub-custodian and make appropriate enquiries from time to time to confirm that the obligations of the agent continue to be competently discharged.

Jupiter Asset Management Series Plc Annual Report and Audited Financial Statements for the financial year ended 31 December 2020
Notes to the Financial Statements for the financial year ended 31 December 2020 (continued)
349
12. CRS Data Protection Information Notice
The Company hereby provides the following data protection information notice to all Shareholders in the Sub-Funds either as at 31 December 2015 or at any point of time since this date. For the avoidance of doubt, this notice applies equally to any Shareholders that have ceased to hold shares in the Sub-Funds since January 1, 2016. Furthermore, it should be noted that this notice may be applicable to Controlling Persons of certain Shareholders. The Company hereby confirms that it intends to take such steps as may be required to satisfy any obligations imposed by (i) the OECD’s Standard for Automatic Exchange of Financial Account Information in Tax Matters (“the Standard”), which therein contains the Common Reporting Standard (“CRS”), as applied in Ireland by means of the relevant international legal framework and Irish tax legislation and (ii) EU Council Directive 2014/107/EU, amending Directive 2011/16/EU as regards mandatory automatic exchange information in the field of taxation (“DAC2”), as applied in Ireland by means of the relevant Irish tax legislation, so as to ensure compliance or deemed compliance (as the case may be) with the Standard/CRS and the DAC2 from 1 January 2016. In this regard, the Company is obliged under Section 891F and Section 891G of the Irish Taxes Consolidation Act, 1997 (as amended) and regulations made pursuant to those sections to collect certain information about each Shareholder’s tax arrangements (and also collect information in relation to relevant Controlling Persons of specific Shareholders). In certain circumstances, the Company may be legally obliged to share this information and other financial information with respect to a Shareholder’s interests in the Sub-Funds with the Irish Revenue Commissioners (and, in particular situations, also share information in relation to relevant Controlling Persons of specific Shareholders). In turn, and to the extent the account has been identified as a Reportable Account, the Irish Revenue Commissioners will exchange this information with the country of residence of the Reportable Person(s) in respect of that Reportable Account. In particular, information that may be reported in respect of a Shareholder (and relevant Controlling Persons, if applicable) includes name, address, date of birth, place of birth, account number, account balance or value at year end (or, if the account was closed during such year, the balance or value at the date of closure of the account), any payments (including redemption and dividend/interest payments) made with respect to the account during the calendar year, tax residency(ies) and tax identification number(s).
13. Charges Against the Assets of the Sub-Funds
A number of counterparties used by the Company hold a number of charges granting first priority security interest in relation to collateral and principal broker securities relating to the relevant Sub-Funds’ account.
14. Post Statement of Financial Position Events Share Class Launch The following Share Class launched
Date Sub-Fund name Share Class name
11 January 2021 Jupiter Strategic Absolute Return Bond Fund Class C (USD)
Name change of Manager and Distributor On 15 February 2021 the Manager and Distributor changed name from Merian Global Investors (Europe) Limited to Jupiter Asset Management (Europe) Limited. Name change of Investment Manager On 15 February 2021 the Investment Manager changed name from Merian Global Investors (UK) Limited to Jupiter Investment Management Limited. There have been no other material events affecting the Sub-Funds subsequent to 31 December 2020, which require amendment to or disclosure in, these financial statements.

Jupiter Asset Management Series Plc Annual Report and Audited Financial Statements for the financial year ended 31 December 2020
Notes to the Financial Statements for the financial year ended 31 December 2020 (continued)
350
14. Post Statement of Financial Position Events (continued)
The Company’s prospectus was updated to reflect the changes to the SFDR disclosures approved by the Board of Directors on 26 February 2021. The Company’s prospectus was updated to reflect the change in performance fee methodologies and Prospectus disclosures for Jupiter Merian North American Equity Fund (IRL), Jupiter Global Emerging Markets Focus Fund, Jupiter UK Dynamic Equity Fund, Jupiter Merian Global Equity Absolute Return Fund, Jupiter Strategic Absolute Return Bond Fund and Jupiter Gold and Silver Fund. The following Sub-Funds were revoked with the Central Bank of Ireland on 21 April 2021: Merian Global Strategic Bond Fund (IRL) Merian Style Premia Absolute Return Fund Merian Investment Grade Corporate Bond Fund Merian Compass Portfolio 2 Merian Compass Portfolio 3 Merian Compass Portfolio 4 Merian Compass Portfolio 5 Merian European Best Ideas Fund Merian Monthly Income High Yield Bond Fund Merian Japanese Equity Fund Merian Pan African Fund
15. Financial Statements
These financial statements were approved by the Board of Directors on 26 April 2021.
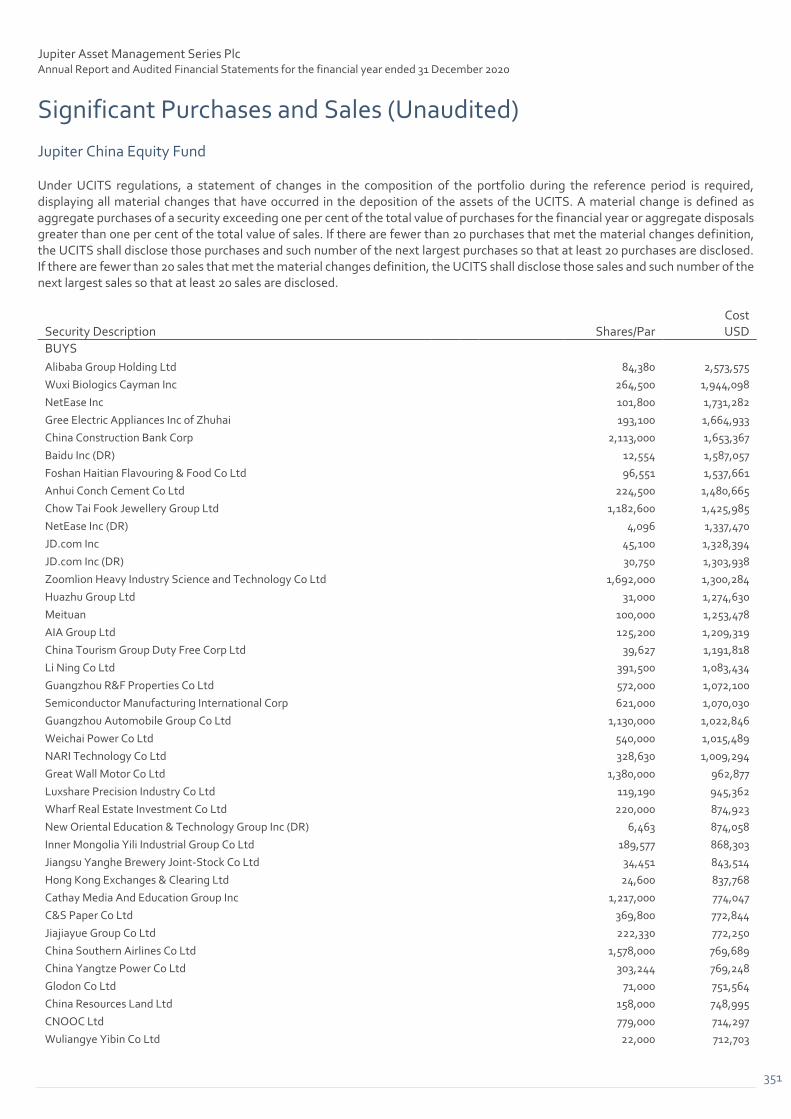
Jupiter Asset Management Series Plc Annual Report and Audited Financial Statements for the financial year ended 31 December 2020
Significant Purchases and Sales (Unaudited)
Jupiter China Equity Fund
351
Under UCITS regulations, a statement of changes in the composition of the portfolio during the reference period is required, displaying all material changes that have occurred in the deposition of the assets of the UCITS. A material change is defined as aggregate purchases of a security exceeding one per cent of the total value of purchases for the financial year or aggregate disposals greater than one per cent of the total value of sales. If there are fewer than 20 purchases that met the material changes definition, the UCITS shall disclose those purchases and such number of the next largest purchases so that at least 20 purchases are disclosed. If there are fewer than 20 sales that met the material changes definition, the UCITS shall disclose those sales and such number of the next largest sales so that at least 20 sales are disclosed.
Security Description Shares/Par Cost USD
BUYS
Alibaba Group Holding Ltd 84,380 2,573,575
Wuxi Biologics Cayman Inc 264,500 1,944,098
NetEase Inc 101,800 1,731,282
Gree Electric Appliances Inc of Zhuhai 193,100 1,664,933
China Construction Bank Corp 2,113,000 1,653,367
Baidu Inc (DR) 12,554 1,587,057
Foshan Haitian Flavouring & Food Co Ltd 96,551 1,537,661
Anhui Conch Cement Co Ltd 224,500 1,480,665
Chow Tai Fook Jewellery Group Ltd 1,182,600 1,425,985
NetEase Inc (DR) 4,096 1,337,470
JD.com Inc 45,100 1,328,394
JD.com Inc (DR) 30,750 1,303,938
Zoomlion Heavy Industry Science and Technology Co Ltd 1,692,000 1,300,284
Huazhu Group Ltd 31,000 1,274,630
Meituan 100,000 1,253,478
AIA Group Ltd 125,200 1,209,319
China Tourism Group Duty Free Corp Ltd 39,627 1,191,818
Li Ning Co Ltd 391,500 1,083,434
Guangzhou R&F Properties Co Ltd 572,000 1,072,100
Semiconductor Manufacturing International Corp 621,000 1,070,030
Guangzhou Automobile Group Co Ltd 1,130,000 1,022,846
Weichai Power Co Ltd 540,000 1,015,489
NARI Technology Co Ltd 328,630 1,009,294
Great Wall Motor Co Ltd 1,380,000 962,877
Luxshare Precision Industry Co Ltd 119,190 945,362
Wharf Real Estate Investment Co Ltd 220,000 874,923
New Oriental Education & Technology Group Inc (DR) 6,463 874,058
Inner Mongolia Yili Industrial Group Co Ltd 189,577 868,303
Jiangsu Yanghe Brewery Joint-Stock Co Ltd 34,451 843,514
Hong Kong Exchanges & Clearing Ltd 24,600 837,768
Cathay Media And Education Group Inc 1,217,000 774,047
C&S Paper Co Ltd 369,800 772,844
Jiajiayue Group Co Ltd 222,330 772,250
China Southern Airlines Co Ltd 1,578,000 769,689
China Yangtze Power Co Ltd 303,244 769,248
Glodon Co Ltd 71,000 751,564
China Resources Land Ltd 158,000 748,995
CNOOC Ltd 779,000 714,297
Wuliangye Yibin Co Ltd 22,000 712,703

Jupiter Asset Management Series Plc Annual Report and Audited Financial Statements for the financial year ended 31 December 2020
Significant Purchases and Sales (Unaudited) (continued)
Jupiter China Equity Fund (continued)
352
Security Description Shares/Par Cost USD
BUYS (continued)
North Huajin Chemical Industries Co Ltd 983,172 692,768
Anhui Kouzi Distillery Co Ltd 85,500 669,618
Kingdee International Software Group Co Ltd 240,000 559,713
Ping An Insurance Group Co of China Ltd 48,500 547,753
Hangzhou Hikvision Digital Technology Co Ltd 91,900 540,288

Jupiter Asset Management Series Plc Annual Report and Audited Financial Statements for the financial year ended 31 December 2020
Significant Purchases and Sales (Unaudited) (continued)
Jupiter China Equity Fund (continued)
353
Security Description Shares/Par Proceeds
USD
SELLS New Oriental Education & Technology Group Inc (DR) 21,614 2,935,681 Alibaba Group Holding Ltd (DR) 13,501 2,908,043 AIA Group Ltd 268,800 2,587,312 Tencent Holdings Ltd 44,700 2,485,937 Link REIT 215,000 2,185,457 Tingyi Cayman Islands Holding Corp 1,064,000 1,901,942 JD.com Inc (DR) 30,750 1,858,020 NetEase Inc 101,800 1,789,792 Meituan 127,600 1,728,834 NetEase Inc (DR) 4,096 1,691,921 Hong Kong Exchanges & Clearing Ltd 36,300 1,661,618 China Construction Bank Corp 2,019,000 1,636,013 Shenzhou International Group Holdings Ltd 139,700 1,584,155 PetroChina Co Ltd 3,586,000 1,494,296 Wuxi Biologics Cayman Inc 155,000 1,457,747 China Resources Cement Holdings Ltd 1,124,000 1,457,584 Great Wall Motor Co Ltd 1,380,000 1,442,744 Foshan Haitian Flavouring & Food Co Ltd 96,551 1,438,114 Guangzhou Automobile Group Co Ltd 1,156,000 1,396,869 Jiajiayue Group Co Ltd 222,330 1,395,441 Ping An Insurance Group Co of China Ltd 131,500 1,373,133 Jonjee Hi-Tech Industrial And Commercial Holding Co Ltd 223,300 1,351,829 China Railway Construction Corp Ltd 1,365,000 1,301,706 Li Ning Co Ltd 391,500 1,290,469 China Overseas Land & Investment Ltd 444,000 1,222,180 Sands China Ltd 224,000 1,184,105 HKBN Ltd 688,000 1,177,049 Weichai Power Co Ltd 540,000 1,170,933 C&S Paper Co Ltd 369,800 1,162,989 Alibaba Group Holding Ltd 35,500 1,158,866 Midea Group Co Ltd 145,000 1,107,428 Inner Mongolia Yili Industrial Group Co Ltd 189,577 1,106,372 Industrial & Commercial Bank of China Ltd 1,607,000 1,096,578 Semiconductor Manufacturing International Corp 326,000 1,047,914 Chow Tai Fook Jewellery Group Ltd 1,402,400 1,042,641 Sunac China Holdings Ltd 173,000 1,041,617 Henderson Land Development Co Ltd 205,800 935,452 CNOOC Ltd 779,000 916,821 China Southern Airlines Co Ltd 1,578,000 882,705 Wharf Real Estate Investment Co Ltd 220,000 863,975 Kingdee International Software Group Co Ltd 240,000 825,033 Cafe de Coral Holdings Ltd 438,000 784,658 Zoomlion Heavy Industry Science and Technology Co Ltd 681,800 765,641 North Huajin Chemical Industries Co Ltd 983,172 751,589 China Resources Land Ltd 158,000 732,584

Jupiter Asset Management Series Plc Annual Report and Audited Financial Statements for the financial year ended 31 December 2020
Significant Purchases and Sales (Unaudited) (continued)
Jupiter Merian World Equity Fund
354
Security Description Shares/Par Cost USD
BUYS Verizon Communications Inc 82,577 4,880,702 Pfizer Inc 98,382 3,636,182 Oracle Corp 61,482 3,400,042 SAP SE 23,105 3,276,076 Walmart Inc 26,763 3,159,652 Chevron Corp 30,408 3,124,249 BHP Group Ltd 115,335 2,999,529 Hong Kong Exchanges & Clearing Ltd 72,500 2,720,382 Microsoft Corp 14,055 2,570,579 Wells Fargo & Co 99,636 2,544,765 L'Oreal SA 8,618 2,463,852 Mastercard Inc 9,046 2,390,586 Intel Corp 46,014 2,341,574 Procter & Gamble Co 18,483 2,307,494 Vivendi SA 78,708 2,248,405 AstraZeneca PLC 22,553 2,236,436 NVIDIA Corp 5,973 2,220,722 Sandvik AB 114,685 2,187,225 Howmet Aerospace Inc 82,903 2,174,436 AT&T Inc 60,810 2,161,440

Jupiter Asset Management Series Plc Annual Report and Audited Financial Statements for the financial year ended 31 December 2020
Significant Purchases and Sales (Unaudited) (continued)
Jupiter Merian World Equity Fund (continued)
355
Security Description Shares/Par Proceeds
USD
SELLS Apple Inc 19,981 4,716,384 Pfizer Inc 111,549 4,176,240 Oracle Corp 80,381 4,137,389 Microsoft Corp 21,704 4,060,267 Novartis AG 41,762 3,946,440 Deutsche Bank AG 423,702 3,750,066 Facebook Inc 16,848 3,739,347 Home Depot Inc 14,305 3,603,195 Novo Nordisk A/S 54,431 3,603,028 Walmart Inc 26,763 3,228,115 Texas Instruments Inc 24,206 3,101,003 SAP SE 26,975 3,046,193 Johnson & Johnson 20,218 3,028,141 Verizon Communications Inc 52,505 3,027,085 L'Oreal SA 8,618 2,884,452 Allianz SE 12,465 2,882,139 Merck & Co Inc 35,467 2,855,443 Lockheed Martin Corp 6,988 2,846,711 Genmab A/S 8,102 2,830,303 Wolters Kluwer NV 35,720 2,735,742

Jupiter Asset Management Series Plc Annual Report and Audited Financial Statements for the financial year ended 31 December 2020
Significant Purchases and Sales (Unaudited) (continued)
Jupiter Pacific Equity Fund
356
Security Description Shares/Par Cost USD
BUYS BHP Group Ltd 79,190 2,092,976 Alibaba Group Holding Ltd (DR) 7,900 1,605,954 Wesfarmers Ltd 44,728 1,573,022 Wuhu Sanqi Interactive Entertainment Network Technology Group Co Ltd 300,200 1,564,993 Hong Kong Exchanges & Clearing Ltd 44,500 1,544,767 MediaTek Inc 86,000 1,502,808 JD.com Inc (DR) 29,300 1,268,410 Tencent Holdings Ltd 20,500 1,170,988 Fortescue Metals Group Ltd 116,931 1,162,635 Rio Tinto Ltd 15,553 1,141,815 DBS Group Holdings Ltd 59,600 1,133,413 Yum China Holdings Inc 22,500 1,123,321 Meituan 37,100 1,114,703 Australia & New Zealand Banking Group Ltd 79,069 1,112,653 Public Bank Bhd 286,600 1,047,954 Sands China Ltd 222,800 1,027,628 QBE Insurance Group Ltd 146,353 967,675 KB Financial Group Inc 27,553 953,994 Oversea-Chinese Banking Corp Ltd 148,600 948,174 BlueScope Steel Ltd 102,298 929,183

Jupiter Asset Management Series Plc Annual Report and Audited Financial Statements for the financial year ended 31 December 2020
Significant Purchases and Sales (Unaudited) (continued)
Jupiter Pacific Equity Fund (continued)
357
Security Description Shares/Par Proceeds
USD
SELLS Samsung Electronics Co Ltd 64,310 2,899,702 Wesfarmers Ltd 64,955 2,216,340 Alibaba Group Holding Ltd (DR) 8,400 2,124,727 NetEase Inc (DR) 7,300 1,777,901 Tencent Holdings Ltd 25,900 1,746,149 Ping An Insurance Group Co of China Ltd 144,000 1,738,983 Wuhu Sanqi Interactive Entertainment Network Technology Group Co Ltd 300,200 1,613,238 BHP Group Ltd 80,077 1,612,160 Anhui Conch Cement Co Ltd 216,000 1,514,400 Woolworths Group Ltd 58,043 1,418,937 Shenzhen Mindray Bio-Medical Electronics Co Ltd 34,876 1,393,742 JD.com Inc (DR) 29,300 1,391,100 QBE Insurance Group Ltd 181,692 1,389,143 China Pacific Insurance Group Co Ltd 410,200 1,387,341 Li Ning Co Ltd 469,000 1,371,242 CNOOC Ltd 1,508,000 1,354,115 DBS Group Holdings Ltd 72,400 1,321,949 Fortescue Metals Group Ltd 115,750 1,260,549 Magellan Financial Group Ltd 30,815 1,206,028 MediaTek Inc 82,000 1,172,511

Jupiter Asset Management Series Plc Annual Report and Audited Financial Statements for the financial year ended 31 December 2020
Significant Purchases and Sales (Unaudited) (continued)
Merian European Equity Fund
358
Security Description Shares/Par Cost EUR
BUYS SAP SE 10,618 1,388,987 Vodafone Group PLC 888,778 1,240,986 AstraZeneca PLC 13,200 1,170,852 HSBC Holdings PLC 267,423 1,146,483 Sanofi 13,597 1,127,757 Essity AB 37,142 1,017,409 Royal Dutch Shell PLC 55,828 800,488 Genmab A/S 3,418 775,101 Geberit AG 1,569 756,840 Rio Tinto PLC 13,627 715,823 TOTAL SE 21,356 701,054 Associated British Foods PLC 27,733 664,046 Banco Bilbao Vizcaya Argentaria SA 227,350 650,175 Carrefour SA 47,499 645,860 Daimler AG 12,200 641,627 Sandvik AB 36,590 634,144 Galapagos NV 3,613 608,074 Pearson PLC 109,270 596,058 ASML Holding NV 1,804 589,389 Adecco Group AG 13,520 587,825

Jupiter Asset Management Series Plc Annual Report and Audited Financial Statements for the financial year ended 31 December 2020
Significant Purchases and Sales (Unaudited) (continued)
Merian European Equity Fund (continued)
359
Security Description Shares/Par Proceeds
EUR
SELLS Rio Tinto PLC 30,770 1,518,288 Allianz SE 5,974 1,225,461 SAP SE 11,232 1,187,517 Wolters Kluwer NV 16,847 1,178,297 Deutsche Bank AG 142,925 1,170,279 AstraZeneca PLC 12,110 1,032,404 L'Oreal SA 3,377 1,028,067 Novartis AG 13,717 1,019,398 HSBC Holdings PLC 221,776 991,619 Ubisoft Entertainment SA 12,842 917,739 Iberdrola SA 89,777 890,762 Covestro AG 24,231 887,934 LVMH Moet Hennessy Louis Vuitton SE 2,414 884,231 TOTAL SE 24,993 859,905 Essity AB 27,895 801,976 ASML Holding NV 2,546 779,248 Genmab A/S 2,790 775,559 Geberit AG 1,569 768,858 Prosus NV 10,090 748,406 Alstom SA 16,045 746,698

Jupiter Asset Management Series Plc Annual Report and Audited Financial Statements for the financial year ended 31 December 2020
Significant Purchases and Sales (Unaudited) (continued)
Jupiter Merian US Equity Income Fund
360
Security Description Shares/Par Cost USD
BUYS Verizon Communications Inc 135,376 7,954,674 Microsoft Corp 30,369 5,930,449 Mastercard Inc 19,075 5,767,698 Oracle Corp 89,335 4,933,070 Intel Corp 89,239 4,768,354 Facebook Inc 18,577 4,420,957 Morgan Stanley 77,519 4,212,294 Pfizer Inc 112,797 4,207,298 Western Union Co 162,015 3,963,194 Amazon.com Inc 1,254 3,832,413 Walmart Inc 32,907 3,815,805 NVIDIA Corp 8,965 3,630,820 Cerner Corp 50,394 3,542,255 Coca-Cola Co 72,872 3,427,772 PACCAR Inc 42,420 3,380,551 Seagate Technology PLC 66,316 3,367,084 Apple Inc 68,227 3,311,703 State Street Corp 47,016 3,256,197 Activision Blizzard Inc 40,855 3,148,370 Alphabet Inc 2,117 3,137,698

Jupiter Asset Management Series Plc Annual Report and Audited Financial Statements for the financial year ended 31 December 2020
Significant Purchases and Sales (Unaudited) (continued)
Jupiter Merian US Equity Income Fund (continued)
361
Security Description Shares/Par Proceeds
USD
SELLS Apple Inc 49,267 10,998,794 Microsoft Corp 60,675 10,929,044 Facebook Inc 28,272 6,384,210 Pfizer Inc 171,071 6,208,991 Oracle Corp 116,635 6,030,180 Intel Corp 105,370 5,978,497 Home Depot Inc 23,166 5,906,840 Mastercard Inc 18,104 5,843,031 Verizon Communications Inc 99,596 5,729,021 Amazon.com Inc 1,844 5,394,661 Procter & Gamble Co 38,346 4,983,083 Alphabet Inc 3,228 4,663,117 Johnson & Johnson 30,117 4,538,170 Texas Instruments Inc 33,041 4,416,558 Merck & Co Inc 54,671 4,364,831 International Business Machines Corp 30,047 4,309,824 Seagate Technology PLC 82,053 4,239,596 Lockheed Martin Corp 10,209 4,164,050 Exxon Mobil Corp 92,205 4,139,816 Visa Inc 20,749 4,132,674

Jupiter Asset Management Series Plc Annual Report and Audited Financial Statements for the financial year ended 31 December 2020
Significant Purchases and Sales (Unaudited) (continued)
Jupiter Merian North American Equity Fund (IRL)
362
Security Description Shares/Par Cost USD
BUYS Verizon Communications Inc 473,909 27,904,937 Oracle Corp 423,318 23,427,219 Intel Corp 419,002 22,498,980 Mastercard Inc 74,412 20,880,534 Walmart Inc 173,794 20,738,050 Pfizer Inc 546,197 20,191,760 Microsoft Corp 98,200 18,144,386 Wells Fargo & Co 699,830 17,851,289 Bank of America Corp 657,804 16,571,578 Monster Beverage Corp 236,963 16,158,166 NVIDIA Corp 39,395 15,425,076 Texas Instruments Inc 125,677 14,950,667 Facebook Inc 69,236 14,562,952 Alphabet Inc 9,754 14,509,837 Activision Blizzard Inc 185,829 14,013,488 AT&T Inc 388,363 12,997,699 Howmet Aerospace Inc 491,055 12,995,028 Amazon.com Inc 4,330 12,708,719 Bank of New York Mellon Corp 318,965 12,622,488 Goldman Sachs Group Inc 52,176 12,379,464

Jupiter Asset Management Series Plc Annual Report and Audited Financial Statements for the financial year ended 31 December 2020
Significant Purchases and Sales (Unaudited) (continued)
Jupiter Merian North American Equity Fund (IRL) (continued)
363
Security Description Shares/Par Proceeds
USD
SELLS Apple Inc 292,610 53,123,572 Microsoft Corp 251,507 45,900,545 Oracle Corp 604,540 31,207,287 Facebook Inc 131,699 29,882,512 Alphabet Inc 19,322 29,425,636 Intel Corp 509,891 28,624,941 Amazon.com Inc 9,136 26,623,877 Pfizer Inc 723,248 26,512,595 Texas Instruments Inc 197,079 25,200,671 Procter & Gamble Co 186,488 24,903,976 Johnson & Johnson 151,660 22,792,247 Mastercard Inc 70,851 22,476,972 Merck & Co Inc 266,691 21,321,515 Walmart Inc 173,794 20,520,386 AbbVie Inc 215,184 20,329,576 Bank of America Corp 741,974 20,152,540 Verizon Communications Inc 336,147 19,553,318 Visa Inc 102,333 19,492,054 Public Storage 93,583 19,219,037 eBay Inc 478,616 18,676,070

Jupiter Asset Management Series Plc Annual Report and Audited Financial Statements for the financial year ended 31 December 2020
Significant Purchases and Sales (Unaudited) (continued)
Merian Global Dynamic Bond Fund
364
Security Description Coupon Rate %
Maturity Date Shares/Par
Cost USD
BUYS United States Treasury Note/Bond 1.63 31/12/2021 25,450,000 25,700,524 United States Treasury Note/Bond 2.13 15/08/2021 14,000,000 14,269,377 United States Treasury Note/Bond 1.50 31/10/2021 13,850,000 14,031,519 United States Treasury Inflation Indexed Bonds 0.25 15/07/2029 12,600,000 13,292,846 United States Treasury Note/Bond 1.13 28/02/2021 13,000,000 13,105,669 United States Treasury Note/Bond 1.38 31/01/2022 12,600,000 12,630,558 Mexican Bonos 8.50 31/05/2029 2,040,000 11,893,295 United States Treasury Inflation Indexed Bonds 0.13 15/10/2024 11,000,000 11,279,181 Mexican Bonos 8.50 18/11/2038 2,114,800 10,995,949 United States Treasury Inflation Indexed Bonds 0.13 15/01/2030 9,750,000 10,137,948 French Republic Government Bond OAT 0.10 01/03/2026 8,200,000 9,971,800 United States Treasury Inflation Indexed Bonds 0.13 15/04/2025 9,600,000 9,872,938 United States Treasury Note/Bond 1.75 15/11/2020 8,000,000 8,058,777 Italy Buoni Poliennali Del Tesoro 0.40 15/05/2030 7,230,000 7,988,213 Republic of South Africa Government Bond 1 10.50 21/12/2026 109,000,000 7,362,158 Republic of South Africa Government Bond 9.00 31/01/2040 141,700,000 7,106,311 New Zealand Government Bond 3.00 20/04/2029 9,550,000 7,024,757 United States Treasury Note/Bond 3.50 15/05/2020 6,900,000 6,934,921 Jupiter Asset Management Series Plc - Jupiter Local Currency Emerging Market Debt Fund (UCITS) 682,603 6,547,173 Italy Buoni Ordinari del Tesoro BOT 0.00 14/07/2021 5,500,000 6,499,109 Hellenic Republic Government Bond 1.50 18/06/2030 5,488,000 6,406,557 United Kingdom Gilt 0.63 07/06/2025 5,300,000 6,248,371 Italy Buoni Poliennali Del Tesoro 1.00 15/07/2022 5,150,000 5,867,490 French Republic Government Bond OAT 1.50 25/05/2050 4,350,000 5,861,571 Deutsche Bundesrepublik Inflation Linked Bond 0.50 15/04/2030 4,100,000 5,755,533 United States Treasury Note/Bond 2.63 15/11/2020 5,500,000 5,565,546 Jupiter Asset Management Series Plc - Jupiter Emerging Market Debt Fund (UCITS) 461,125 5,204,116 Italy Buoni Poliennali Del Tesoro 0.65 15/10/2023 4,672,000 4,936,401 Cyprus Government International Bond 1.50 16/04/2027 4,500,000 4,876,284 Russian Federal Bond - OFZ 7.65 10/04/2030 295,900,000 4,690,035 Indonesia Treasury Bond 7.00 15/09/2030 76,800,000,000 4,622,790 Italy Buoni Poliennali Del Tesoro 2.55 15/09/2041 2,885,000 4,598,651 Hungary Government Bond 3.00 21/08/2030 1,250,000,000 4,534,344 China Government Bond 2.20 27/07/2025 30,000,000 4,518,226 United States Treasury Inflation Indexed Bonds 0.13 15/07/2030 4,000,000 4,506,341

Jupiter Asset Management Series Plc Annual Report and Audited Financial Statements for the financial year ended 31 December 2020
Significant Purchases and Sales (Unaudited) (continued)
Merian Global Dynamic Bond Fund (continued)
365
Security Description Coupon Rate %
Maturity Date Shares/Par
Proceeds USD
SELLS United States Treasury Inflation Indexed Bonds 0.13 15/10/2024 14,800,000 15,234,193 United States Treasury Note/Bond 1.63 31/12/2021 14,287,300 14,666,031 United States Treasury Note/Bond 1.13 28/02/2021 13,000,000 13,113,111 United States Treasury Note/Bond 1.38 31/01/2022 12,600,000 12,847,340 United States Treasury Note/Bond 2.13 15/08/2021 11,500,000 11,731,980 Mexican Bonos 8.50 31/05/2029 2,009,200 10,859,550 United States Treasury Inflation Indexed Bonds 0.25 15/07/2029 10,200,000 10,806,194 United States Treasury Inflation Indexed Bonds 0.13 15/01/2030 9,750,000 10,391,573 Canadian Government Bond 1.00 01/09/2022 13,000,000 9,722,258 Italy Buoni Poliennali Del Tesoro 0.40 15/05/2030 7,830,000 8,838,331 United States Treasury Note/Bond 1.75 15/11/2020 8,000,000 8,063,791 Japan Government Five Year Bond 0.10 20/03/2020 850,000,000 7,723,058 United States Treasury Note/Bond 1.50 30/11/2021 7,400,000 7,486,758 Mexican Bonos 8.50 18/11/2038 1,300,400 7,466,551 United States Treasury Note/Bond 3.50 15/05/2020 6,900,000 7,001,467 New Zealand Government Bond 3.00 20/04/2029 9,550,000 6,897,158 Jupiter Asset Management Series Plc - Jupiter Financials Contingent Capital Fund (UCITS) 633,472 6,803,246 United Kingdom Gilt 0.63 07/06/2025 5,300,000 6,358,892 French Republic Government Bond OAT 1.50 25/05/2050 4,350,000 5,989,315 United States Treasury Inflation Indexed Bonds 0.88 15/01/2029 5,400,000 5,955,957 United States Treasury Note/Bond 2.63 15/11/2020 5,500,000 5,518,748 United States Treasury Inflation Indexed Bonds 0.38 15/07/2027 5,000,000 5,470,108 Brazil Notas do Tesouro Nacional Serie F 1 0.00 01/01/2027 21,129 5,220,920 Russian Federal Bond - OFZ 6.90 23/05/2029 337,000,000 5,174,241 Italy Buoni Poliennali Del Tesoro 3.85 01/09/2049 3,335,000 5,139,253 United States Treasury Inflation Indexed Bonds 0.13 15/04/2025 4,500,000 4,797,912 French Republic Government Bond OAT 1.25 25/05/2034 3,750,000 4,797,581 French Republic Government Bond OAT 0.70 25/07/2030 3,400,000 4,765,821 Canadian Government Bond 1.50 01/09/2024 6,200,000 4,708,288 Hungary Government Bond 3.00 21/08/2030 1,250,000,000 4,595,131 Spain Government Bond 0.80 30/07/2027 4,120,000 4,545,257 Italy Buoni Ordinari del Tesoro BOT 0.00 31/01/2020 4,000,000 4,468,895 Republic of South Africa Government Bond 9.00 31/01/2040 78,150,000 4,433,609 Australia Government Bond 1.00 21/12/2030 6,500,000 4,402,275 Italy Buoni Poliennali Del Tesoro 2.45 01/09/2050 3,700,000 4,277,452 Italy Buoni Poliennali Del Tesoro 1.65 01/12/2030 3,760,000 4,262,239 Hellenic Republic Government Bond 2.00 22/04/2027 3,275,000 4,127,655 Sweden Government Bond 0.75 12/11/2029 35,500,000 4,110,304

Jupiter Asset Management Series Plc Annual Report and Audited Financial Statements for the financial year ended 31 December 2020
Significant Purchases and Sales (Unaudited) (continued)
Jupiter Emerging Market Debt Fund
366
Security Description Coupon Rate %
Maturity Date Shares/Par
Cost USD
BUYS Nigeria Government International Bond 9.25 21/01/2049 5,600,000 5,677,960 KazMunayGas National Co JSC 5.75 19/04/2047 3,600,000 4,086,198 Angolan Government International Bond 9.38 08/05/2048 5,700,000 3,790,950 Egypt Government International Bond 8.70 01/03/2049 3,600,000 3,608,455 Ecuador Government International Bond 0.50 31/07/2040 4,566,350 3,556,780 Oman Government International Bond 6.75 17/01/2048 4,000,000 3,510,216 Corp Nacional del Cobre de Chile 3.70 30/01/2050 3,550,000 3,487,940 Russian Foreign Bond - Eurobond 5.25 23/06/2047 2,400,000 3,084,812 Ghana Government International Bond 8.95 26/03/2051 3,200,000 2,930,285 Turkey Government International Bond 5.75 11/05/2047 3,200,000 2,855,374 Petroleos Mexicanos 6.95 28/01/2060 2,872,891 2,811,318 Kenya Government International Bond 8.25 28/02/2048 2,450,000 2,674,150 Angolan Government International Bond 8.25 09/05/2028 3,200,000 2,655,500 Nigeria Government International Bond 7.63 28/11/2047 3,610,000 2,578,500 Petroleos Mexicanos 5.63 23/01/2046 2,800,000 2,545,060 Nigeria Government International Bond 7.70 23/02/2038 3,200,000 2,510,705 Romanian Government International Bond 3.38 28/01/2050 2,200,000 2,510,150 Ukraine Government International Bond 7.38 25/09/2032 2,550,000 2,464,700 Corp Nacional del Cobre de Chile 4.50 01/08/2047 2,000,000 2,302,824 Egypt Government International Bond 7.90 21/02/2048 2,400,000 2,288,250

Jupiter Asset Management Series Plc Annual Report and Audited Financial Statements for the financial year ended 31 December 2020
Significant Purchases and Sales (Unaudited) (continued)
Jupiter Emerging Market Debt Fund (continued)
367
Security Description Coupon Rate %
Maturity Date Shares/Par
Proceeds USD
SELLS Nigeria Government International Bond 9.25 21/01/2049 5,600,000 5,939,017 Ecuador Government International Bond 0.50 31/07/2040 7,716,350 5,250,306 KazMunayGas National Co JSC 5.75 19/04/2047 4,300,000 5,126,916 Angolan Government International Bond 9.38 08/05/2048 6,350,000 5,061,559 Nigeria Government International Bond 7.63 28/11/2047 5,575,000 5,053,290 Turkey Government International Bond 7.63 26/04/2029 4,200,000 4,323,291 Turkey Government International Bond 5.75 11/05/2047 4,775,000 3,910,921 Nigeria Treasury Bill 0.00 27/02/2020 1,300,000,000 3,554,200 Petroleos Mexicanos 5.63 23/01/2046 3,884,000 3,542,801 Russian Foreign Bond - Eurobond 5.25 23/06/2047 2,600,000 3,537,362 Corp Nacional del Cobre de Chile 3.70 30/01/2050 3,550,000 3,258,309 Ghana Government International Bond 8.63 16/06/2049 3,300,000 3,133,231 Argentine Republic Government International Bond 5.88 11/01/2028 7,400,000 3,062,052 Petroleos Mexicanos 6.50 13/03/2027 3,000,000 2,961,932 Ghana Government International Bond 8.95 26/03/2051 3,200,000 2,903,651 Uruguay Government International Bond 5.10 18/06/2050 2,300,000 2,880,202 Ukraine Government International Bond 7.38 25/09/2032 2,900,000 2,846,611 Oman Government International Bond 6.75 17/01/2048 3,200,000 2,735,441 Egypt Government International Bond 8.70 01/03/2049 2,700,000 2,670,259 Provincia de Buenos Aires/Government Bonds 7.88 15/06/2027 5,200,000 2,650,700

Jupiter Asset Management Series Plc Annual Report and Audited Financial Statements for the financial year ended 31 December 2020
Significant Purchases and Sales (Unaudited) (continued)
Jupiter Global Emerging Markets Focus Fund
368
Security Description Shares/Par Cost USD
BUYS YDUQS Participacoes SA 1,333,062 8,615,461 Alibaba Group Holding Ltd (DR) 37,483 8,452,655 Tencent Holdings Ltd 134,100 7,035,887 Ping An Insurance Group Co of China Ltd 579,500 6,793,673 Samsung Electronics Co Ltd 120,166 6,341,459 Localiza Rent a Car SA 671,575 6,309,191 Bank Central Asia Tbk PT 2,726,200 5,730,240 HDFC Bank Ltd (DR) 102,931 5,689,006 Infosys Ltd (DR) 500,478 5,597,222 Taiwan Semiconductor Manufacturing Co Ltd (DR) 88,981 5,489,746 Odontoprev SA 1,583,290 5,217,757 Techtronic Industries Co Ltd 505,500 5,000,219 Petroleo Brasileiro SA (DR) 580,500 4,937,906 Network International Holdings PLC 769,543 4,835,442 Transaction Capital Ltd 3,779,757 4,738,465 Bank of Georgia Group PLC 269,419 4,226,620 ANTA Sports Products Ltd 432,000 3,993,483 MercadoLibre Inc 6,720 3,808,915 Kweichow Moutai Co Ltd 22,800 3,773,532 Credicorp Ltd 19,200 3,317,716 Arca Continental SAB de CV 564,522 3,194,562 Asian Paints Ltd 131,832 3,135,307 Bajaj Finance Ltd 88,227 3,037,516 Advantech Co Ltd 350,937 3,030,051 Banco do Brasil SA 256,766 3,022,103 Sberbank of Russia PJSC 658,170 2,823,975 LG Household & Health Care Ltd 2,316 2,638,625 TOA Paint Thailand PCL 2,160,100 2,447,027 Ace Hardware Indonesia Tbk PT 21,705,300 2,373,614 JNBY Design Ltd 2,058,000 2,139,209 My EG Services Bhd 7,326,200 2,138,124 NMC Health PLC 104,962 2,082,279 Sinbon Electronics Co Ltd 470,000 2,028,569 Globant SA 10,559 1,951,304 Parade Technologies Ltd 49,000 1,858,616 China Overseas Land & Investment Ltd 456,000 1,593,367

Jupiter Asset Management Series Plc Annual Report and Audited Financial Statements for the financial year ended 31 December 2020
Significant Purchases and Sales (Unaudited) (continued)
Jupiter Global Emerging Markets Focus Fund (continued)
369
Security Description Shares/Par Proceeds
USD
SELLS Tencent Holdings Ltd 163,100 10,307,734 Alibaba Group Holding Ltd (DR) 41,681 9,894,791 Taiwan Semiconductor Manufacturing Co Ltd (DR) 120,027 7,747,076 Samsung Electronics Co Ltd 138,348 6,180,029 Bank Central Asia Tbk PT 2,916,400 5,917,183 Ping An Insurance Group Co of China Ltd 546,000 5,864,330 Arca Continental SAB de CV 1,186,350 5,092,736 Petroleo Brasileiro SA (DR) 829,200 5,038,563 Kweichow Moutai Co Ltd 20,912 4,858,002 Sberbank of Russia PJSC 1,815,553 4,820,016 Banco do Brasil SA 613,066 4,814,951 HDFC Bank Ltd (DR) 87,749 4,705,571 China Overseas Land & Investment Ltd 1,366,411 4,635,135 Advantech Co Ltd 421,000 4,316,044 Telkom Indonesia Persero Tbk PT 15,730,402 4,264,532 ANTA Sports Products Ltd 414,000 4,198,993 Localiza Rent a Car SA 448,388 3,697,981 YDUQS Participacoes SA 610,484 3,520,416 My EG Services Bhd 10,933,800 3,353,689 Network International Holdings PLC 769,543 2,738,754 LG Household & Health Care Ltd 2,152 2,560,211 Credicorp Ltd 17,584 2,517,486 MercadoLibre Inc 2,137 2,488,170 Godrej Consumer Products Ltd 278,936 2,221,515 Infosys Ltd (DR) 173,355 1,977,529 TOA Paint Thailand PCL 1,578,600 1,855,553 Eicher Motors Ltd 7,624 1,753,236 Mr Price Group Ltd 274,035 1,746,002 Medytox Inc 8,209 1,622,881 Bank of Georgia Group PLC 109,803 1,585,160 Odontoprev SA 540,645 1,551,033 Transaction Capital Ltd 1,231,723 1,541,569 L&T Technology Services Ltd 79,696 1,524,350 Sinbon Electronics Co Ltd 256,000 1,462,485

Jupiter Asset Management Series Plc Annual Report and Audited Financial Statements for the financial year ended 31 December 2020
Significant Purchases and Sales (Unaudited) (continued)
Merian Asian Equity Income Fund
370
Security Description Shares/Par Cost USD
BUYS Hong Kong Exchanges & Clearing Ltd 74,200 2,555,656 Sands China Ltd 380,400 1,869,869 Woolworths Group Ltd 60,945 1,683,016 Taiwan Semiconductor Manufacturing Co Ltd 152,000 1,587,658 KB Financial Group Inc 42,381 1,510,830 Genting Singapore Ltd 2,228,500 1,455,163 AGL Energy Ltd 105,339 1,393,518 Alibaba Group Holding Ltd (DR) 6,700 1,387,721 QBE Insurance Group Ltd 204,568 1,298,941 AAC Technologies Holdings Inc 180,000 1,168,511 Wuhu Sanqi Interactive Entertainment Network Technology Group Co Ltd 241,316 1,148,756 Hon Hai Precision Industry Co Ltd 340,000 988,395 Fortescue Metals Group Ltd 117,578 987,201 JD.com Inc (DR) 22,600 971,443 Coway Co Ltd 12,372 924,694 Carabao Group PCL 327,600 902,124 GD Power Development Co Ltd 3,083,400 897,157 Yuanta Financial Holding Co Ltd 1,384,000 896,016 Electricity Generating PCL 97,700 887,557 MediaTek Inc 56,000 877,058

Jupiter Asset Management Series Plc Annual Report and Audited Financial Statements for the financial year ended 31 December 2020
Significant Purchases and Sales (Unaudited) (continued)
Merian Asian Equity Income Fund (continued)
371
Security Description Shares/Par Proceeds
USD
SELLS Alibaba Group Holding Ltd (DR) 28,600 5,645,809 Samsung Electronics Co Ltd 144,561 5,640,585 Taiwan Semiconductor Manufacturing Co Ltd 502,000 4,700,767 Tencent Holdings Ltd 89,500 4,572,576 Ping An Insurance Group Co of China Ltd 218,500 2,626,987 Hong Kong Exchanges & Clearing Ltd 67,964 2,214,263 BHP Group Ltd 118,210 2,157,516 China Pacific Insurance Group Co Ltd 606,800 2,155,318 NetEase Inc (DR) 7,000 2,070,422 DBS Group Holdings Ltd 113,000 2,068,255 QBE Insurance Group Ltd 296,089 2,039,597 Postal Savings Bank of China Co Ltd 3,213,000 1,935,576 Woolworths Group Ltd 78,060 1,908,116 Anhui Conch Cement Co Ltd 261,500 1,887,700 China Life Insurance Co Ltd 850,000 1,829,443 Link REIT 190,200 1,710,997 Shenzhen Mindray Bio-Medical Electronics Co Ltd 47,986 1,690,232 CNOOC Ltd 1,739,000 1,632,646 Centre Testing International Group Co Ltd 654,987 1,583,882 Ascendas Real Estate Investment Trust 668,700 1,555,142

Jupiter Asset Management Series Plc Annual Report and Audited Financial Statements for the financial year ended 31 December 2020
Significant Purchases and Sales (Unaudited) (continued)
Jupiter Local Currency Emerging Market Debt Fund
372
Security Description Coupon Rate %
Maturity Date Shares/Par
Cost USD
BUYS Republic of Poland Government Bond 2.75 25/10/2029 91,000,000 24,918,166 Republic of South Africa Government Bond 9.00 31/01/2040 331,000,000 17,575,906 Republic of South Africa Government Bond 8.75 31/01/2044 337,000,000 17,110,447 Mexican Bonos 8.50 18/11/2038 2,840,000 15,032,569 Brazil Notas do Tesouro Nacional Serie F 10.00 01/01/2029 52,000 13,064,333 Republic of South Africa Government Bond 8.00 31/01/2030 246,100,000 11,982,647 Mexican Bonos 8.50 31/05/2029 2,130,000 10,783,959 Brazil Notas do Tesouro Nacional Serie F 10.00 01/01/2027 47,000 10,095,603 Indonesia Treasury Bond 8.38 15/03/2034 131,000,000,000 10,009,867 Romania Government Bond 5.00 12/02/2029 39,700,000 9,919,501 Pakistan Treasury Bill 0.00 05/03/2020 1,554,000,000 9,774,646 Republic of South Africa Government Bond 8.88 28/02/2035 196,000,000 9,474,178 Philippine Government Bond 6.88 10/01/2029 407,800,000 9,330,278 Thailand Government Bond 3.30 17/06/2038 232,000,000 9,291,438 Russian Federal Bond - OFZ 7.70 16/03/2039 479,000,000 8,265,805 Nigeria Government Bond 14.80 26/04/2049 2,500,000,000 8,159,771 Russian Federal Bond - OFZ 7.10 16/10/2024 600,000,000 8,108,399 Hungary Government Bond 3.00 27/10/2038 2,278,000,000 7,285,559 Hungary Government Bond 3.00 21/08/2030 2,146,000,000 7,059,996 Indonesia Treasury Bond 8.38 15/04/2039 96,000,000,000 6,995,030 Turkey Government Bond 12.40 08/03/2028 42,000,000 6,832,144 Russian Federal Bond - OFZ 7.65 10/04/2030 432,000,000 6,721,459 Russian Federal Bond - OFZ 7.25 10/05/2034 350,000,000 5,943,959 Republic of South Africa Government Bond 10.50 21/12/2026 88,000,000 5,759,553 Russian Federal Bond - OFZ 8.15 03/02/2027 332,000,000 5,723,623 Bonos de la Tesoreria de la Republica en pesos 5.00 01/03/2035 3,600,000,000 5,475,979 Republic of Poland Government Bond 2.75 25/04/2028 20,000,000 5,423,983 Turkey Government Bond 11.00 24/02/2027 33,000,000 5,154,709 Mexican Bonos 7.75 13/11/2042 1,050,000 4,959,928 Turkey Government Bond 10.50 11/08/2027 34,000,000 4,672,465

Jupiter Asset Management Series Plc Annual Report and Audited Financial Statements for the financial year ended 31 December 2020
Significant Purchases and Sales (Unaudited) (continued)
Jupiter Local Currency Emerging Market Debt Fund (continued)
373
Security Description Coupon Rate %
Maturity Date Shares/Par
Proceeds USD
SELLS Republic of South Africa Government Bond 9.00 31/01/2040 465,000,000 25,290,209 Republic of Poland Government Bond 2.75 25/10/2029 88,300,000 24,743,824 Mexican Bonos 8.50 18/11/2038 3,873,620 20,485,909 Republic of South Africa Government Bond 8.00 31/01/2030 358,500,000 19,253,937 Brazil Notas do Tesouro Nacional Serie F 10.00 01/01/2029 76,000 18,934,611 Republic of South Africa Government Bond 10.50 21/12/2026 276,500,000 17,610,235 Republic of South Africa Government Bond 8.75 31/01/2044 356,000,000 15,929,102 Mexican Bonos 8.50 31/05/2029 3,043,000 14,658,670 Brazil Notas do Tesouro Nacional Serie F 10.00 01/01/2027 55,800 12,920,682 Republic of South Africa Government Bond 8.75 28/02/2048 231,575,657 12,120,353 Indonesia Treasury Bond 8.38 15/03/2034 157,510,000,000 12,002,987 Egypt Government Bond 15.70 07/11/2027 169,553,000 11,703,689 Romania Government Bond 5.00 12/02/2029 50,000,000 11,579,366 Russian Federal Bond - OFZ 7.10 16/10/2024 722,000,000 11,545,672 Malaysia Government Bond 3.73 15/06/2028 44,000,000 11,008,028 Colombian TES 7.75 18/09/2030 32,100,000,000 10,652,066 Russian Federal Bond - OFZ 7.25 10/05/2034 627,000,000 10,380,259 Brazil Notas do Tesouro Nacional Serie F 10.00 01/01/2023 41,888 10,060,593 Philippine Government Bond 6.88 10/01/2029 407,800,000 9,932,650 Pakistan Treasury Bill 0.00 05/03/2020 1,554,000,000 9,454,451 Indonesia Treasury Bond 8.38 15/04/2039 131,000,000,000 9,388,833 Peru Government Bond 6.90 12/08/2037 26,000 8,971,035 Egypt Treasury Bills 0.00 07/04/2020 140,000,000 8,724,166 Republic of South Africa Government Bond 8.88 28/02/2035 182,000,000 8,670,806 Nigeria Government Bond 14.80 26/04/2049 2,500,000,000 8,515,837 Thailand Government Bond 3.30 17/06/2038 209,000,000 8,452,702 Ukraine Government Bond 15.84 26/02/2025 190,680,000 8,221,260 Colombian TES 7.50 26/08/2026 25,700,000,000 8,015,874 Republic of Poland Government Bond 2.75 25/04/2028 28,000,000 7,864,315 Russian Federal Bond - OFZ 7.70 16/03/2039 479,000,000 7,850,923 Brazil Letras do Tesouro Nacional 0.00 01/07/2022 39,000 7,680,838 Brazil Notas do Tesouro Nacional Serie F 10.00 01/01/2025 32,000 7,461,593 Hungary Government Bond 3.00 27/10/2038 2,278,000,000 7,384,306 Russian Federal Bond - OFZ 8.15 03/02/2027 439,000,000 7,281,061

Jupiter Asset Management Series Plc Annual Report and Audited Financial Statements for the financial year ended 31 December 2020
Significant Purchases and Sales (Unaudited) (continued)
Jupiter UK Alpha Fund (IRL)
374
Security Description Shares/Par Cost GBP
BUYS Taylor Wimpey PLC 801,435 1,208,415 Whitbread PLC 38,158 1,071,159 Whitbread PLC - Rights 42,254 767,199 Micro Focus International PLC 94,594 706,761 THG Holdings PLC* 107,752 549,759 Barclays PLC 488,047 460,086 Lloyds Banking Group PLC 1,450,871 453,108 SSE PLC 33,305 445,985 Drax Group PLC 151,761 308,911 International Consolidated Airlines Group SA - Rights 197,655 290,681 SSP Group PLC 80,695 217,749 Weir Group PLC 19,303 197,257 International Consolidated Airlines Group SA 44,256 150,378 GlaxoSmithKline PLC 8,118 127,944 AstraZeneca PLC 1,519 126,626 Tesco PLC 43,104 101,532 Rio Tinto PLC 2,345 97,977 Experian PLC 3,700 95,891 Sage Group PLC 14,592 92,680 St James's Place PLC 9,224 84,415
* Includes pre- and post-IPO conversion transactions.

Jupiter Asset Management Series Plc Annual Report and Audited Financial Statements for the financial year ended 31 December 2020
Significant Purchases and Sales (Unaudited) (continued)
Jupiter UK Alpha Fund (IRL) (continued)
375
Security Description Shares/Par Proceeds
GBP
SELLS HSBC Holdings PLC 396,530 1,670,978 Tesco PLC 632,704 1,435,900 Fidelity National Information Services Inc 12,409 1,307,276 Entain PLC 155,499 1,197,048 Aviva PLC 421,302 1,018,353 Rio Tinto PLC 22,224 959,374 Pets at Home Group PLC 327,101 943,614 GlaxoSmithKline PLC 57,152 876,668 AstraZeneca PLC 11,036 874,993 Smith & Nephew PLC 54,339 815,024 Experian PLC 30,243 812,544 Whitbread PLC - Rights 42,254 767,199 CRH PLC 25,266 711,880 St James's Place PLC 66,498 612,694 Sage Group PLC 88,086 596,048 BP PLC 194,001 570,965 Next PLC 11,641 564,850 Barclays PLC 473,356 536,877 Whitbread PLC 11,910 532,963 Vodafone Group PLC 438,287 525,449 Prudential PLC 39,916 453,811 Glencore PLC 259,277 421,632 DS Smith PLC 144,833 414,788 Weir Group PLC 33,603 403,823 International Consolidated Airlines Group SA 52,459 398,062 Lloyds Banking Group PLC 1,218,758 381,431 Tate & Lyle PLC 53,823 346,702 Royal Dutch Shell PLC 27,292 328,464 Drax Group PLC 122,550 298,941 Burberry Group PLC 18,718 265,708 Melrose Industries PLC 229,162 252,053

Jupiter Asset Management Series Plc Annual Report and Audited Financial Statements for the financial year ended 31 December 2020
Significant Purchases and Sales (Unaudited) (continued)
Jupiter UK Smaller Companies Focus Fund
376
Security Description Shares/Par Cost GBP
BUYS THG Holdings PLC* 4,236,712 21,183,560 OSB Group PLC 5,249,999 15,481,908 Chemring Group PLC 3,814,000 10,195,128 JET2 PLC 1,032,907 9,445,890 ASOS PLC 343,900 7,444,285 Hyve Group PLC 4,162,569 6,467,986 Morgan Sindall Group PLC 335,000 5,876,658 Blue Prism Group plc 392,183 5,654,453 Breedon Group PLC 5,252,000 4,741,687 boohoo Group PLC 1,681,109 4,714,895 Bellway PLC 174,073 4,685,245 XP Power Ltd 107,000 4,639,834 Electrocomponents PLC 639,596 4,530,468 Premier Foods PLC 7,397,373 4,213,082 Ergomed PLC 498,134 3,694,686 Future PLC 226,616 3,312,397 Team17 Group PLC 618,513 3,231,166 Blancco Technology Group PLC 1,416,379 3,095,756 Pets at Home Group PLC 802,000 3,064,605 Avon Rubber PLC 102,666 3,019,677 DFS Furniture PLC 1,623,883 3,016,346 Centamin PLC 1,400,366 2,929,786 Alpha FX Group PLC 280,652 2,583,021 Merian Chrysalis Investment Co Ltd 1,658,000 2,453,840 Ascential PLC 958,049 2,443,003 Ocean Outdoor Ltd 420,000 2,390,331 Bytes Technology Group PLC 878,719 2,386,795 Accrol Group Holdings PLC 5,376,278 2,365,562 Vesuvius PLC 499,249 2,167,148 OneSavings Bank PLC 703,320 2,095,968 DX Group PLC 12,000,000 2,041,021 Savills PLC 189,339 2,034,452
* Includes pre- and post-IPO conversion transactions.

Jupiter Asset Management Series Plc Annual Report and Audited Financial Statements for the financial year ended 31 December 2020
Significant Purchases and Sales (Unaudited) (continued)
Jupiter UK Smaller Companies Focus Fund (continued)
377
Security Description Shares/Par Proceeds
GBP
SELLS OneSavings Bank PLC 6,693,257 21,267,676 The Hut Group* 18,997 17,617,438 Clinigen Group PLC 1,544,929 10,466,627 ASOS PLC 179,386 8,321,343 THG Holdings PLC 1,181,070 7,875,226 boohoo Group PLC 2,364,312 7,720,822 Draper Esprit PLC 1,386,097 7,272,142 JET2 PLC 803,328 7,017,168 S4 Capital PLC 1,717,656 6,807,849 Premier Foods PLC 7,397,373 6,555,544 Blue Prism Group plc 427,597 6,479,482 Huntsworth Ltd 6,202,084 5,979,021 Lancashire Holdings Ltd 774,655 5,731,094 OSB Group PLC 1,284,823 5,175,858 IntegraFin Holdings PLC 1,065,256 5,099,379 Knights Group Holdings PLC 1,269,700 5,031,718 Brooks Macdonald Group PLC 295,000 4,990,468 Learning Technologies Group PLC 3,317,561 4,687,160 Chemring Group PLC 1,835,050 4,437,489 Liontrust Asset Management PLC 327,645 4,315,376 Robert Walters PLC 1,090,623 4,313,505 Helical PLC 949,642 4,029,447 Bellway PLC 128,751 4,001,845 Gamma Communications PLC 279,934 3,978,980 Electrocomponents PLC 535,572 3,908,871 Alpha FX Group PLC 323,833 3,855,774 Bodycote PLC 647,438 3,820,651 Mind Gym Ltd 4,054,983 3,746,540 Crest Nicholson Holdings PLC 877,214 3,715,671 Dunelm Group PLC 311,497 3,685,730 Workspace Group PLC 472,167 3,305,982 Ascential PLC 882,151 3,056,118 Future PLC 182,476 2,949,239 Hyve Group PLC 4,577,719 2,947,263 Synthomer PLC 849,966 2,866,271 Centamin PLC 1,400,366 2,828,246 Aptitude Software Group PLC 573,999 2,798,762
* Includes pre- and post-IPO conversion transactions.

Jupiter Asset Management Series Plc Annual Report and Audited Financial Statements for the financial year ended 31 December 2020
Significant Purchases and Sales (Unaudited) (continued)
Jupiter UK Dynamic Equity Fund
378
Security Description
Coupon Rate %
Maturity Date
Shares/Par
Cost GBP
BUYS THG Holdings PLC* 6,552,691 32,763,455 Barratt Developments PLC 2,574,232 17,403,388 Wizz Air Holdings PLC 421,981 16,212,614 JET2 PLC 1,691,562 15,376,209 OSB Group PLC 5,671,606 15,179,881 Chemring Group PLC 5,199,000 13,658,111 Intermediate Capital Group 778,000 13,255,728 Derwent London PLC 313,000 12,699,388 ASOS PLC 549,002 11,653,437 Serco Group PLC 8,071,954 10,404,889 Electrocomponents PLC 1,317,431 9,570,485 UNITE Group PLC 984,530 8,134,669 Alpha FX Group PLC 776,903 7,872,500 Pets at Home Group PLC 2,957,249 7,711,262 WH Smith PLC 385,882 6,521,001 Rentokil Initial PLC 1,892,000 6,391,875 Liontrust Asset Management PLC 494,259 6,183,493 Lancashire Holdings Ltd 996,750 6,149,088 United Kingdom Treasury Bill 0.00 06/07/2020 6,000,000 5,987,392 Knights Group Holdings PLC 1,378,565 5,829,717 DFS Furniture PLC 2,674,797 5,490,817 Persimmon PLC 196,435 5,387,193 Greggs PLC 323,000 4,970,019 Vesuvius PLC 1,081,000 4,903,650 Centrica PLC 9,488,866 4,766,298 Games Workshop Group PLC 47,062 4,667,581 Team17 Group PLC 756,694 4,128,541 Marshalls PLC 625,999 4,099,372 Ergomed PLC 544,058 4,041,629 Computacenter PLC 162,157 3,800,849 Future PLC 261,595 3,679,958 boohoo Group PLC 1,471,723 3,597,747 Bytes Technology Group PLC 1,258,837 3,419,279
* Includes pre- and post-IPO conversion transactions.

Jupiter Asset Management Series Plc Annual Report and Audited Financial Statements for the financial year ended 31 December 2020
Significant Purchases and Sales (Unaudited) (continued)
Jupiter UK Dynamic Equity Fund (continued)
379
Security Description Coupon Rate %
Maturity Date Shares/Par
Proceeds GBP
SELLS The Hut Group* 35,329 32,763,408 boohoo Group PLC 7,225,599 23,511,996 OneSavings Bank PLC 7,589,064 21,954,015 DCC PLC 303,267 19,130,212 ASOS PLC 394,101 18,468,372 Lancashire Holdings Ltd 2,322,750 16,348,223 THG Holdings PLC* 2,501,917 15,955,341 Smart Metering Systems PLC 2,582,535 14,580,054 Entain PLC 2,458,770 13,492,782 St James's Place PLC 1,154,000 13,039,978 S4 Capital PLC 3,803,199 11,288,169 HomeServe PLC 860,236 10,407,129 Rentokil Initial PLC 1,892,000 9,899,379 JET2 PLC 811,221 8,825,106 Wizz Air Holdings PLC 226,738 8,816,032 Derwent London PLC 313,000 8,468,028 Serco Group PLC 6,195,706 7,513,977 Workspace Group PLC 1,163,000 7,243,333 Clinigen Group PLC 856,411 6,829,060 Avast PLC 1,547,000 6,245,223 United Kingdom Treasury Bill 0.00 17/02/2020 6,000,000 6,000,000 United Kingdom Treasury Bill 0.00 02/03/2020 6,000,000 6,000,000 United Kingdom Treasury Bill 0.00 06/07/2020 6,000,000 5,997,681 United Kingdom Treasury Bill 0.00 10/02/2020 6,000,000 5,997,043 Synthomer PLC 1,691,910 5,813,912 SSP Group PLC 2,095,417 5,659,836 JTC PLC 1,287,000 5,428,482 Dunelm Group PLC 639,653 5,260,910 Travis Perkins PLC 622,000 5,012,203 Pagegroup PLC 995,011 4,689,123 Aptitude Software Group PLC 1,042,936 4,494,027 Barratt Developments PLC 969,726 4,491,119
* Includes pre- and post-IPO conversion transactions.

Jupiter Asset Management Series Plc Annual Report and Audited Financial Statements for the financial year ended 31 December 2020
Significant Purchases and Sales (Unaudited) (continued)
Jupiter Merian Global Equity Absolute Return Fund
380
Security Description Coupon Rate %
Maturity Date Shares/Par
Cost USD
BUYS United States Treasury Bill 0.00 18/06/2020 445,000,000 443,533,623 United States Treasury Bill 0.00 23/07/2020 390,000,000 389,949,150 United States Treasury Bill 0.00 16/07/2020 335,000,000 334,876,399 United States Treasury Bill 0.00 25/06/2020 315,000,000 314,965,593 United States Treasury Bill 0.00 03/12/2020 301,000,000 300,963,570 United States Treasury Bill 0.00 16/04/2020 300,000,000 298,837,854 United States Treasury Bill 0.00 23/04/2020 250,000,000 249,067,547 United States Treasury Bill 0.00 20/09/2020 245,000,000 244,958,978 United States Treasury Bill 0.00 07/01/2021 205,000,000 204,987,072 United States Treasury Bill 0.00 05/11/2020 185,000,000 184,981,006 United States Treasury Bill 0.00 09/07/2020 100,000,000 99,997,708 United States Treasury Bill 0.00 05/03/2020 100,000,000 99,770,400 United States Treasury Bill 0.00 27/05/2021 80,000,000 79,968,423 United States Treasury Bill 0.00 30/04/2020 40,000,000 39,854,278 SAP SE 294,526 39,007,991 JD.com Inc (DR) 750,400 33,441,292 Hong Kong Exchanges & Clearing Ltd 857,700 30,999,742 BHP Group Ltd 1,148,931 30,186,521 Merck & Co Inc 321,902 27,835,327 Morgan Stanley 514,674 27,541,695

Jupiter Asset Management Series Plc Annual Report and Audited Financial Statements for the financial year ended 31 December 2020
Significant Purchases and Sales (Unaudited) (continued)
Jupiter Merian Global Equity Absolute Return Fund (continued)
381
Security Description Coupon Rate %
Maturity Date Shares/Par
Proceeds USD
SELLS United States Treasury Bill 0.00 18/06/2020 445,000,000 444,643,623 United States Treasury Bill 0.00 16/01/2020 400,000,000 400,000,000 United States Treasury Bill 0.00 23/07/2020 390,000,000 389,974,828 United States Treasury Bill 0.00 16/07/2020 335,000,000 334,935,263 United States Treasury Bill 0.00 25/06/2020 315,000,000 314,968,242 United States Treasury Bill 0.00 03/12/2020 301,000,000 300,993,717 United States Treasury Bill 0.00 16/04/2020 300,000,000 300,000,000 United States Treasury Bill 0.00 23/01/2020 300,000,000 299,996,138 United States Treasury Bill 0.00 30/01/2020 250,000,000 250,000,000 United States Treasury Bill 0.00 05/03/2020 250,000,000 249,739,714 United States Treasury Bill 0.00 23/04/2020 250,000,000 249,477,842 United States Treasury Bill 0.00 20/09/2020 245,000,000 244,994,086 United States Treasury Bill 0.00 05/11/2020 185,000,000 184,991,332 United States Treasury Bill 0.00 09/01/2020 115,000,000 115,000,000 United States Treasury Bill 0.00 09/07/2020 100,000,000 99,999,646 Deutsche Bank AG 7,684,683 70,127,904 JD.com Inc (DR) 1,413,100 65,672,432 Anhui Conch Cement Co Ltd 7,163,000 51,537,118 NetEase Inc (DR) 136,000 49,656,405 Vipshop Holdings Ltd (DR) 2,787,399 46,536,426

Jupiter Asset Management Series Plc Annual Report and Audited Financial Statements for the financial year ended 31 December 2020
Significant Purchases and Sales (Unaudited) (continued)
Jupiter Strategic Absolute Return Bond Fund
382
Security Description Coupon Rate %
Maturity Date Shares/Par
Cost USD
BUYS United States Treasury Note/Bond 0.38 31/03/2022 14,350,000 14,395,464 United States Treasury Note/Bond 2.13 15/08/2021 13,500,000 13,750,156 United States Treasury Note/Bond 1.38 31/01/2022 13,500,000 13,532,741 United States Treasury Note/Bond 1.75 31/07/2021 11,500,000 11,667,601 United States Treasury Inflation Indexed Bonds 0.25 15/07/2029 11,070,000 11,565,434 United States Treasury Inflation Indexed Bonds 0.13 15/10/2024 11,000,000 11,279,181 Mexican Bonos 8.50 31/05/2029 1,890,000 11,020,668 United States Treasury Inflation Indexed Bonds 0.13 15/01/2030 10,100,000 10,497,087 United States Treasury Bill 0.00 23/04/2020 10,000,000 9,965,209 United States Treasury Note/Bond 1.63 31/12/2021 9,300,000 9,449,563 New Zealand Government Bond 3.00 20/04/2029 10,300,000 7,579,579 Jupiter Asset Management Series Plc - Jupiter Local Currency Emerging Market Debt Fund (UCITS) 778,051 7,542,007 United States Treasury Note/Bond 3.50 15/05/2020 7,400,000 7,437,774 Mexican Bonos 8.50 18/11/2038 1,412,000 7,339,235 United States Treasury Note/Bond 1.50 31/10/2021 7,050,000 7,142,520 United Kingdom Gilt 0.63 07/06/2025 5,400,000 6,366,265 French Republic Government Bond OAT 1.50 25/05/2050 4,650,000 6,273,228 United States Treasury Note/Bond 2.63 15/11/2020 6,000,000 6,062,598 United States Treasury Note/Bond 1.13 28/02/2021 6,000,000 6,042,208 French Republic Government Bond OAT 0.10 01/03/2026 4,650,000 5,668,409 United States Treasury Inflation Indexed Bonds 0.13 15/04/2025 5,500,000 5,656,371 Jupiter Asset Management Series Plc - Jupiter Emerging Market Debt Fund (UCITS) 518,217 5,603,316 Republic of South Africa Government Bond 9.00 31/01/2040 104,050,000 5,405,313 United States Treasury Bill 0.00 30/04/2020 5,000,000 4,983,161 Indonesia Treasury Bond 7.00 15/09/2030 77,500,000,000 4,797,502 Sweden Government Bond 0.75 12/11/2029 38,800,000 4,271,971 Cyprus Government International Bond 1.50 16/04/2027 3,800,000 4,117,751 United States Treasury Inflation Indexed Bonds 0.88 15/01/2029 3,750,000 4,083,662 Italy Buoni Poliennali Del Tesoro 0.65 15/10/2023 3,805,000 4,020,335 Deutsche Bundesrepublik Inflation Linked Bond 0.50 15/04/2030 2,850,000 3,981,811 Spain Government Bond 0.80 30/07/2027 3,552,000 3,847,963 United States Treasury Note/Bond 1.75 15/11/2029 3,800,000 3,835,937 Italy Buoni Poliennali Del Tesoro 0.40 15/05/2030 3,610,000 3,743,293 Japan Government Twenty Year Bond 2.50 20/03/2020 405,000,000 3,699,169 Republic of South Africa Government Bond 0.50 21/12/2026 55,950,000 3,648,188

Jupiter Asset Management Series Plc Annual Report and Audited Financial Statements for the financial year ended 31 December 2020
Significant Purchases and Sales (Unaudited) (continued)
Jupiter Strategic Absolute Return Bond Fund (continued)
383
Security Description Coupon Rate %
Maturity Date Shares/Par
Proceeds USD
SELLS United States Treasury Note/Bond 1.50 30/11/2021 25,000,000 25,514,599 United States Treasury Inflation Indexed Bonds 0.13 15/10/2024 20,200,000 20,764,193 United States Treasury Note/Bond 1.38 31/01/2022 13,500,000 13,757,421 United States Treasury Inflation Indexed Bonds 0.25 15/07/2029 12,970,000 13,668,643 French Republic Government Bond OAT 0.00 25/02/2020 10,000,000 11,030,939 Mexican Bonos 8.50 31/05/2029 2,021,000 10,964,954 United States Treasury Inflation Indexed Bonds 0.13 15/01/2030 10,100,000 10,736,036 United States Treasury Bill 0.00 23/04/2020 10,000,000 9,999,871 Canadian Government Bond 1.00 01/09/2022 12,500,000 9,348,325 Japan Government Five Year Bond 0.10 20/03/2020 910,000,000 8,268,215 United States Treasury Note/Bond 2.50 15/02/2022 7,300,000 7,609,984 United States Treasury Note/Bond 3.50 15/05/2020 7,400,000 7,514,730 New Zealand Government Bond 3.00 20/04/2029 10,300,000 7,423,142 Jupiter Asset Management Series Plc - Jupiter Financials Contingent Capital Fund (UCITS) 658,891 7,012,775 Italy Buoni Poliennali Del Tesoro 0.40 15/05/2030 6,160,000 6,753,015 United Kingdom Gilt 0.63 07/06/2025 5,400,000 6,478,871 French Republic Government Bond OAT 1.50 25/05/2050 4,650,000 6,428,362 United States Treasury Inflation Indexed Bonds 0.75 15/07/2028 5,658,000 6,246,910 United States Treasury Note/Bond 2.63 15/11/2020 6,000,000 6,075,747 United States Treasury Note/Bond 1.13 28/02/2021 6,000,000 6,061,134 Mexican Bonos 8.50 18/11/2038 1,038,800 5,867,035 Japanese Government CPI Linked Bond 0.10 10/03/2026 600,000,000 5,719,771 Japan Government Two Year Bond 0.10 01/11/2020 595,000,000 5,589,297 Italy Buoni Ordinari del Tesoro BOT 0.00 31/01/2020 5,000,000 5,573,530 French Republic Government Bond OAT 0.70 25/07/2030 3,850,000 5,396,347 Jupiter Asset Management Series Plc - Jupiter Local Currency Emerging Market Debt Fund (UCITS) 578,998 5,323,031 United States Treasury Note/Bond 1.75 15/11/2029 5,000,000 5,292,288 Russian Federal Bond - OFZ 6.90 23/05/2029 340,000,000 5,217,090 United States Treasury Note/Bond 2.13 15/08/2021 5,000,000 5,101,206 United States Treasury Note/Bond 0.38 31/03/2022 5,000,000 5,023,917 United States Treasury Bill 0.00 30/04/2020 5,000,000 4,995,743 French Republic Government Bond OAT 1.25 25/05/2034 3,900,000 4,991,461 Italy Buoni Poliennali Del Tesoro 3.85 01/09/2049 3,215,000 4,875,417 Canadian Government Bond 1.50 01/09/2024 6,200,000 4,708,288 Italy Buoni Poliennali Del Tesoro 0.65 15/10/2023 3,805,000 4,573,660 Sweden Government Bond 0.75 12/11/2029 38,800,000 4,492,389

Jupiter Asset Management Series Plc Annual Report and Audited Financial Statements for the financial year ended 31 December 2020
Significant Purchases and Sales (Unaudited) (continued)
Jupiter Europe (ex UK) Smaller Companies Fund
384
Security Description Shares/Par Cost EUR
BUYS Indra Sistemas SA 247,501 2,637,906 Kaufman & Broad SA 67,746 2,422,254 Imerys SA 33,500 1,374,689 Aalberts NV 55,089 1,177,939 Inwido AB 155,726 1,109,962 doValue SpA 131,966 1,097,564 NOS SGPS SA 251,699 877,505 Vidrala SA 9,756 782,532 Salmar ASA 22,434 742,259 IMCD NV 7,878 670,278 FinecoBank Banca Fineco SpA 52,808 653,448 Eurofins Scientific SE 1,131 632,577 Sanoma OYJ 82,210 622,932 Marel HF 133,641 603,604 Fluidra SA 44,077 558,823 Davide Campari-Mil 69,448 543,836 Davide Campari-Milano NV 69,448 543,836 SPIE SA 61,294 539,516 Gerresheimer AG 6,122 531,225 Solutions 30 SE 39,098 510,204 Barco NV 4,141 501,600 Ubisoft Entertainment SA 6,527 497,581 D'ieteren SA/NV 9,114 492,218 Somfy SA 5,343 488,084 Remy Cointreau SA 3,948 487,248 DiaSorin SpA 2,807 479,103 Avanza Bank Holding AB 34,674 454,428 Van Lanschot Kempen NV (DR) 24,549 451,259 SimCorp A/S 4,634 450,484 Kinepolis Group NV 8,500 448,446 VZ Holding AG 6,492 443,264 Belimo Holding AG 69 441,731 HelloFresh SE 11,544 435,347 Karnov Group AB 78,198 419,020 Nexity SA 14,035 412,520 Tecan Group AG 1,269 412,268 Kingspan Group PLC 6,697 402,603 Thule Group AB 17,536 398,844

Jupiter Asset Management Series Plc Annual Report and Audited Financial Statements for the financial year ended 31 December 2020
Significant Purchases and Sales (Unaudited) (continued)
Jupiter Europe (ex UK) Smaller Companies Fund (continued)
385
Security Description Shares/Par Proceeds
EUR
SELLS Corbion NV 173,763 5,194,743 TOMRA Systems ASA 174,347 4,988,230 Barco NV 26,141 4,730,954 VIB Vermoegen AG 168,415 4,642,173 TAG Immobilien AG 212,100 4,616,831 Nexity SA 102,958 4,550,873 Dermapharm Holding SE 113,577 4,450,823 SBM Offshore NV 300,753 4,412,031 NOS SGPS SA 1,112,699 4,342,737 Rubis SCA 88,945 4,327,501 Sopra Steria Group 32,732 4,187,554 Cerved Group SpA 562,100 4,163,119 Intertrust NV 252,865 4,152,097 Hibernia REIT PLC 3,397,112 4,090,671 De' Longhi SpA 220,624 4,078,843 Befesa SA 123,200 4,021,667 Sbanken ASA 630,960 4,014,015 Sixt SE 54,722 3,899,685 SPIE SA 274,204 3,867,963 Alten SA 41,932 3,766,030 Subsea 7 SA 417,400 3,573,758 BAWAG Group AG 111,782 3,560,040 IMA Industria Macchine Automatiche SpA 58,300 3,399,003 EFG International AG 686,132 3,328,631 Banca Generali SpA 129,360 3,273,801 Stillfront Group AB 75,100 3,258,147 Lagardere SCA 193,400 3,145,606 Akasol AG 82,700 3,129,344 Dalata Hotel Group PLC 899,284 3,100,844 Stroeer SE & Co KGaA 48,122 3,049,703 Melia Hotels International SA 427,600 2,964,839 Valmet OYJ 140,558 2,883,043 Trigano SA 42,076 2,830,482 BioArctic AB 389,087 2,793,961 Raisio OYJ 799,936 2,677,020 PIERER Mobility AG 64,200 2,566,854 Vaisala OYJ 73,148 2,390,284 Wienerberger AG 116,329 2,343,900 Van Lanschot Kempen NV (DR) 150,182 2,331,896 va-Q-tec AG 172,610 2,137,380 Kaufman & Broad SA 67,746 2,011,246 Indra Sistemas SA 247,501 1,974,299 Euronext NV 24,200 1,923,808 Cia de Distribucion Integral Logista Holdings SA 108,421 1,858,444

Jupiter Asset Management Series Plc Annual Report and Audited Financial Statements for the financial year ended 31 December 2020
Significant Purchases and Sales (Unaudited) (continued)
Jupiter Merian Global Equity Income Fund (IRL)
386
Security Description Shares/Par Cost USD
BUYS Alibaba Group Holding Ltd (DR) 7,100 1,713,021 Chevron Corp 16,698 1,706,803 Mastercard Inc 4,435 1,224,422 Verizon Communications Inc 19,702 1,155,432 Oracle Corp 19,956 1,107,880 LVMH Moet Hennessy Louis Vuitton SE 2,251 1,056,577 L'Oreal SA 3,573 1,049,612 Wuhu Sanqi Interactive Entertainment Network Technology Group Co Ltd 183,200 968,660 Goldman Sachs Group Inc 3,987 929,141 PACCAR Inc 11,750 928,481 SAP SE 6,765 920,663 Morgan Stanley 17,046 916,551 Western Union Co 34,921 889,107 Vodafone Group PLC 572,592 884,450 BHP Group Ltd 33,592 883,064 Standard Chartered PLC 109,894 872,368 Starwood Property Trust Inc 39,664 866,536 NVIDIA Corp 2,220 837,428 Microsoft Corp 4,290 792,558 Sandvik AB 42,974 784,514

Jupiter Asset Management Series Plc Annual Report and Audited Financial Statements for the financial year ended 31 December 2020
Significant Purchases and Sales (Unaudited) (continued)
Jupiter Merian Global Equity Income Fund (IRL) (continued)
387
Security Description Shares/Par Proceeds
USD
SELLS Apple Inc 9,632 2,343,270 Microsoft Corp 12,492 2,316,528 Allianz SE 8,202 1,952,651 Chevron Corp 21,003 1,785,861 PepsiCo Inc 11,446 1,659,723 Novartis AG 18,347 1,657,689 Cisco Systems Inc 29,529 1,427,706 Pfizer Inc 38,579 1,423,979 Alibaba Group Holding Ltd (DR) 5,100 1,319,130 Rio Tinto PLC 24,054 1,302,573 Mastercard Inc 3,937 1,288,272 Exxon Mobil Corp 30,438 1,281,076 Home Depot Inc 4,832 1,258,452 Hennes & Mauritz AB 72,940 1,257,441 Johnson & Johnson 8,114 1,230,739 Intuit Inc 4,044 1,190,065 Facebook Inc 5,626 1,183,321 Lockheed Martin Corp 2,819 1,181,538 L'Oreal SA 3,573 1,180,856 Infosys Ltd (DR) 94,800 1,120,214

Jupiter Asset Management Series Plc Annual Report and Audited Financial Statements for the financial year ended 31 December 2020
Significant Purchases and Sales (Unaudited) (continued)
Jupiter Gold & Silver Fund
388
Security Description Shares/Par Cost USD
BUYS Sprott Physical Gold and Silver Trust 2,598,822 43,263,666 Wheaton Precious Metals Corp 1,002,594 36,887,835 Sprott Physical Gold Trust 2,092,000 30,359,302 Coeur Mining Inc 4,715,000 28,706,566 Fresnillo PLC 2,794,394 26,819,964 De Grey Mining Ltd 62,614,285 26,775,323 First Majestic Silver Corp 2,633,000 26,121,228 Hochschild Mining PLC 8,611,421 25,116,195 Pretium Resources Inc 3,038,000 23,852,810 Sprott Physical Silver Trust 3,300,949 23,345,572 MAG Silver Corp 1,599,000 22,721,534 Saracen Mineral Holdings Ltd 5,100,000 20,303,118 Hecla Mining Co 5,344,000 19,986,018 Novagold Resources Inc 2,010,000 18,327,200 Evolution Mining Ltd 4,208,000 14,933,654 Seabridge Gold Inc 892,000 14,765,619 Osisko Mining Inc 4,753,900 12,749,887 Pan American Silver Corp 512,000 12,712,036 DGO Gold Ltd 5,033,333 11,968,500 Quadriga Investors - Igneo Fund 72,000 11,815,920 Kirkland Lake Gold Ltd 268,000 10,748,839 Discovery Metals Corp 25,850,000 10,452,928 Northern Star Resources Ltd 930,000 9,559,632 Agnico Eagle Mines Ltd 166,000 9,354,302 SSR Mining Inc 623,000 9,250,217 Alexco Resource Corp 3,800,000 7,669,268 Lundin Gold Inc 886,000 7,018,704 Gold Road Resources Ltd 5,700,000 6,833,005 Fortuna Silver Mines Inc 1,700,000 6,065,313
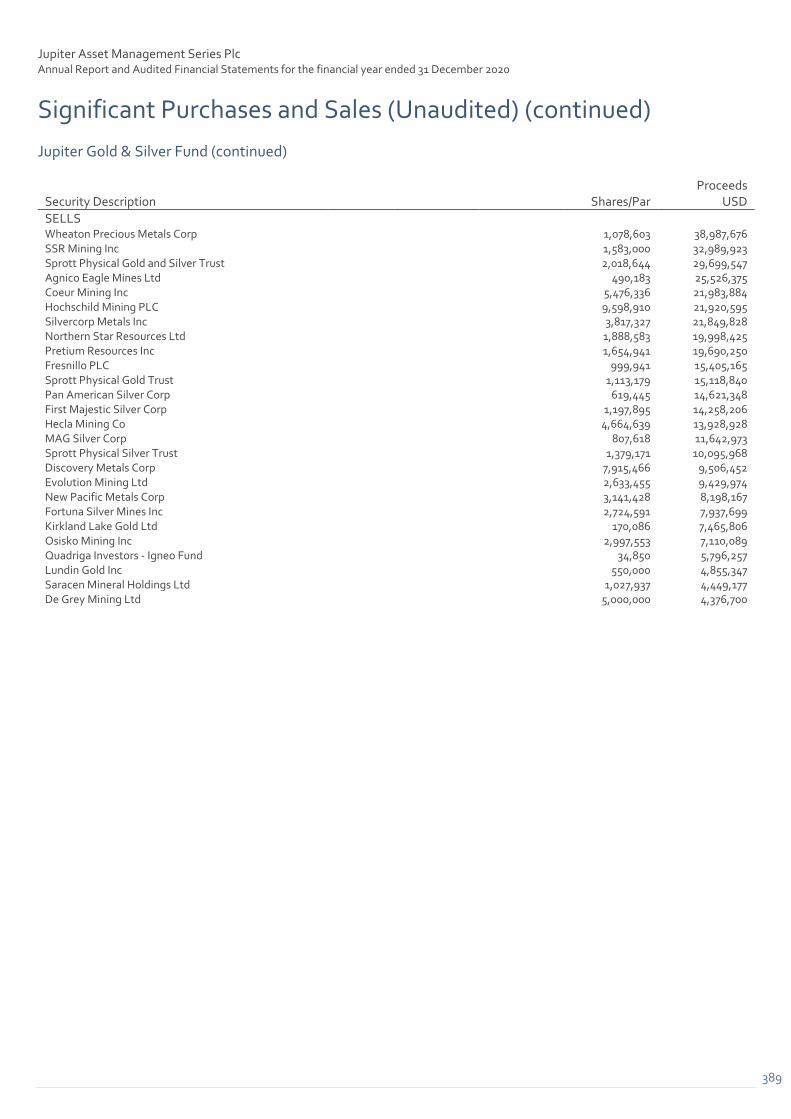
Jupiter Asset Management Series Plc Annual Report and Audited Financial Statements for the financial year ended 31 December 2020
Significant Purchases and Sales (Unaudited) (continued)
Jupiter Gold & Silver Fund (continued)
389
Security Description Shares/Par Proceeds
USD
SELLS Wheaton Precious Metals Corp 1,078,603 38,987,676 SSR Mining Inc 1,583,000 32,989,923 Sprott Physical Gold and Silver Trust 2,018,644 29,699,547 Agnico Eagle Mines Ltd 490,183 25,526,375 Coeur Mining Inc 5,476,336 21,983,884 Hochschild Mining PLC 9,598,910 21,920,595 Silvercorp Metals Inc 3,817,327 21,849,828 Northern Star Resources Ltd 1,888,583 19,998,425 Pretium Resources Inc 1,654,941 19,690,250 Fresnillo PLC 999,941 15,405,165 Sprott Physical Gold Trust 1,113,179 15,118,840 Pan American Silver Corp 619,445 14,621,348 First Majestic Silver Corp 1,197,895 14,258,206 Hecla Mining Co 4,664,639 13,928,928 MAG Silver Corp 807,618 11,642,973 Sprott Physical Silver Trust 1,379,171 10,095,968 Discovery Metals Corp 7,915,466 9,506,452 Evolution Mining Ltd 2,633,455 9,429,974 New Pacific Metals Corp 3,141,428 8,198,167 Fortuna Silver Mines Inc 2,724,591 7,937,699 Kirkland Lake Gold Ltd 170,086 7,465,806 Osisko Mining Inc 2,997,553 7,110,089 Quadriga Investors - Igneo Fund 34,850 5,796,257 Lundin Gold Inc 550,000 4,855,347 Saracen Mineral Holdings Ltd 1,027,937 4,449,177 De Grey Mining Ltd 5,000,000 4,376,700

Jupiter Asset Management Series Plc Annual Report and Audited Financial Statements for the financial year ended 31 December 2020
Significant Purchases and Sales (Unaudited) (continued)
Jupiter UK Specialist Equity Fund
390
Security Description Coupon Rate
% Maturity
Date Shares/Par Cost GBP
BUYS United Kingdom Treasury Bill 0.00 07/12/2020 35,000,000 35,000,585 United Kingdom Treasury Bill 0.00 05/10/2020 35,000,000 34,999,985 United Kingdom Treasury Bill 0.00 20/07/2020 27,000,000 26,919,463 United Kingdom Treasury Bill 0.00 01/06/2021 25,000,000 25,016,285 United Kingdom Treasury Bill 0.00 22/06/2020 25,000,000 24,989,641 United Kingdom Treasury Bill 0.00 21/09/2020 25,000,000 24,981,521 THG Holdings PLC* 4,920,685 24,603,425 United Kingdom Treasury Bill 0.00 14/04/2020 24,000,000 23,998,159 United Kingdom Treasury Bill 0.00 01/06/2020 20,000,000 19,994,453 OSB Group PLC 4,721,037 13,847,834 United Kingdom Treasury Bill 0.00 26/05/2020 12,000,000 11,967,869 Chemring Group PLC 4,224,306 10,794,278 Hyve Group PLC 7,033,997 10,726,277 UNITE Group PLC 1,219,084 9,537,895 ASOS PLC 457,566 9,470,177 JET2 PLC 1,023,708 9,317,358 Wizz Air Holdings PLC 226,223 8,962,441 Alpha FX Group PLC 857,548 8,459,474 Electrocomponents PLC 1,013,471 7,866,667 Lancashire Holdings Ltd 1,153,241 7,222,988 Pets at Home Group PLC 2,219,764 6,628,020 JD Sports Fashion PLC 1,336,602 6,425,996 Serco Group PLC 4,103,590 6,385,300 DFS Furniture PLC 3,069,178 6,236,126 Rentokil Initial PLC 1,734,385 5,859,393 WH Smith PLC 383,993 5,611,396 Games Workshop Group PLC 55,599 5,519,193
* Includes pre- and post-IPO conversion transactions.

Jupiter Asset Management Series Plc Annual Report and Audited Financial Statements for the financial year ended 31 December 2020
Significant Purchases and Sales (Unaudited) (continued)
Jupiter UK Specialist Equity Fund (continued)
391
Security Description Coupon Rate
% Maturity
Date Shares/Par Proceeds
GBP
SELLS United Kingdom Treasury Bill 0.00 07/12/2020 35,000,000 35,000,100 United Kingdom Treasury Bill 0.00 05/10/2020 35,000,000 35,000,000 United Kingdom Treasury Bill 0.00 03/02/2020 27,000,000 27,000,000 United Kingdom Treasury Bill 0.00 20/07/2020 27,000,000 26,984,286 United Kingdom Treasury Bill 0.00 22/06/2020 25,000,000 24,998,771 United Kingdom Treasury Bill 0.00 21/09/2020 25,000,000 24,997,810 The Hut Group* 26,530 24,603,391 United Kingdom Treasury Bill 0.00 14/04/2020 24,000,000 23,999,735 United Kingdom Treasury Bill 0.00 01/06/2020 20,000,000 19,998,703 OneSavings Bank PLC 5,633,620 17,658,503 DCC PLC 213,565 14,267,944 United Kingdom Treasury Bill 0.00 02/03/2020 13,000,000 13,000,000 THG Holdings PLC* 1,925,828 12,495,698 United Kingdom Treasury Bill 0.00 06/01/2020 12,000,000 12,000,000 United Kingdom Treasury Bill 0.00 26/05/2020 12,000,000 11,996,319 boohoo Group PLC 3,906,416 11,049,503 JD Sports Fashion PLC 1,336,602 10,478,216 Rentokil Initial PLC 1,734,385 9,344,943 Workspace Group PLC 1,564,403 9,313,476 S4 Capital PLC 2,216,546 8,941,672 Avast PLC 1,681,791 8,906,149 Clinigen Group PLC 1,093,864 8,757,030 Huntsworth Ltd 9,156,371 8,411,336 Lancashire Holdings Ltd 1,153,241 7,776,788 HomeServe PLC 572,020 7,330,559 Smart Metering Systems PLC 1,206,049 7,042,183 St James's Place PLC 559,697 6,324,460 SSP Group PLC 2,259,912 6,172,111 Entain PLC 1,071,438 5,975,732 ASOS PLC 115,634 5,744,065
* Includes pre- and post-IPO conversion transactions.

Jupiter Asset Management Series Plc Annual Report and Audited Financial Statements for the financial year ended 31 December 2020
Significant Purchases and Sales (Unaudited) (continued)
Jupiter Financials Contingent Capital Fund
392
Security Description Coupon Rate
% Maturity
Date Shares/Par Cost USD
BUYS United States Treasury Bill 0.00 25/06/2020 40,000,000 39,999,607 Banco Santander SA 22,400,000 25,199,853 Nationwide Building Society 5,568,701 19,205,349 OP Corporate Bank PLC 1.63 09/06/2030 9,580,000 10,652,608 Commerzbank AG 9,200,000 10,396,920 Natwest Group PLC 9,900,000 10,287,185 Arion Banki HF 10,200,000 10,200,000 UniCredit SpA 7,980,000 8,752,448 HSBC Holdings PLC 8,600,000 8,582,475 Virgin Money UK PLC 6,935,000 8,452,035 UBS Group AG 8,050,000 8,311,260 Unione di Banche Italiane SpA 7,160,000 8,089,797 Intesa Sanpaolo SpA 8,000,000 7,683,800 Intesa Sanpaolo SpA 5,500,000 6,145,925 Credit Suisse Group AG 5,250,000 5,620,350 Rothesay Life PLC 3,700,000 5,525,161 ABN AMRO Bank NV 4,600,000 5,198,460 Stichting AK Rabobank Certificaten 3,400,000 5,045,118 QBE Insurance Group Ltd 4,800,000 4,800,000 AIB Group PLC 4,200,000 4,719,750 Credit Agricole SA 3,900,000 4,302,470 Standard Chartered PLC 2.50 09/09/2030 3,840,000 4,288,045 Bank of Ireland Group PLC 3,830,000 4,231,924 HSBC Holdings PLC 4,000,000 4,230,624 Banco Bilbao Vizcaya Argentaria SA 3,600,000 3,902,400 Phoenix Group Holdings PLC 3,620,000 3,620,000 Barclays PLC 2,800,000 3,546,627 HSBC Holdings PLC 2,600,000 3,322,521 Pension Insurance Corp PLC 2,664,000 3,252,078 Direct Line Insurance Group PLC 4.00 05/06/2032 2,400,000 2,955,370

Jupiter Asset Management Series Plc Annual Report and Audited Financial Statements for the financial year ended 31 December 2020
Significant Purchases and Sales (Unaudited) (continued)
Jupiter Financials Contingent Capital Fund (continued)
393
Security Description Coupon Rate %
Maturity Date Shares/Par
Proceeds USD
SELLS Banco Santander SA 36,000,000 40,340,352 United States Treasury Bill 0.00 25/06/2020 40,000,000 40,000,000 Credit Suisse Group AG 29,000,000 30,881,411 UBS Group AG 27,092,000 30,230,498 Nationwide Building Society 5,313,701 30,183,888 Intesa Sanpaolo SpA 15,200,000 18,576,614 Credit Agricole SA 12,400,000 17,987,438 Pension Insurance Corp PLC 12,220,000 16,859,031 Barclays PLC 12,900,000 15,323,801 Skandinaviska Enskilda Banken AB 13,400,000 13,221,760 Rothesay Life PLC 9,400,000 12,075,700 Virgin Money UK PLC 8,935,000 11,138,434 Phoenix Group Holdings PLC 9,000,000 11,066,624 OP Corporate Bank PLC 1.63 09/06/2030 9,580,000 10,704,690 Commerzbank AG 9,200,000 10,291,938 Coventry Building Society 7,165,000 9,285,796 Intesa Sanpaolo SpA 9,000,000 9,221,869 Cooperatieve Rabobank UA 8,600,000 8,672,953 ING Groep NV 8,200,000 8,351,808 ABN AMRO Bank NV 7,400,000 8,289,006 BAWAG Group AG 7,600,000 8,161,164 Arion Banki HF 9,200,000 8,026,684 Banco Comercial Portugues SA 6,800,000 7,469,286 Erste Group Bank AG 6,400,000 7,315,000 OneSavings Bank PLC 6,000,000 7,067,931 Abanca Corp Bancaria SA 6,600,000 6,959,669 UniCredit SpA 5,480,000 6,525,444 CaixaBank SA 6,000,000 6,518,331 AIB Group PLC 5,800,000 6,486,606 Landesbank Baden-Wuerttemberg 5,800,000 6,326,584 Danske Bank A/S 5,800,000 6,078,966 HSBC Holdings PLC 5,800,000 6,018,006 KBC Group NV 4,800,000 5,716,982 Banque Internationale a Luxembourg SA 5,400,000 5,675,241 Natwest Group PLC 5,200,000 5,515,304

Jupiter Asset Management Series Plc Annual Report and Audited Financial Statements for the financial year ended 31 December 2020
Sub-Fund Price Record Hong Kong Investors Section (unaudited)
394
The additional information in this section is for the Sub-Funds which are authorised by the Hong Kong Securities and Futures Commission (“SFC”) as at 31 December 2020 to meet the disclosure requirements in Hong Kong. Note: SFC authorization is not a recommendation or endorsement of a product nor does it guarantee the commercial merits of a product or its performance. It does not mean the product is suitable for all investors nor is it an endorsement of its suitability for any particular investor or class of investors. The details of ten years highest and lowest Net Asset Value per share are outlined below:
Jupiter Merian World Equity Fund 2011 2012 2013 2014 2015 2016 2017 2018 2019 2020
Share Class
High A (USD) 1.005 0.929 1.130 1.217 1.306 1.340 1.657 1.784 1.768 2.031 A (EUR) Hedged - - - - 10.124 10.579 12.710 16.922 14.219 17.524 I (USD) - 10.560 11.490 12.460 13.423 13.945 17.380 18.731 18.835 21.794 A (GBP) Hedged Income - - - - - - - - - - A (USD) Income - - - - - - - - - - I (USD) Income - - - - - - - - - -
Low A (USD) 0.721 0.803 0.919 1.071 1.142 1.059 1.328 1.418 1.439 1.170 A (EUR) Hedged - - - - 9.689 8.490 10.444 11.988 12.163 8.927 I (USD) - 9.143 10.000 10.899 11.776 10.945 13.826 14.989 15.212 12.480 A (GBP) Hedged Income - - - - - - - - - - A (USD) Income - - - - - - - - - - I (USD) Income - - - - - - - - - -
Jupiter Pacific Equity Fund 2011 2012 2013 2014 2015 2016 2017 2018 2019 2020 Share Class
High A (USD) 3.191 3.309 3.445 3.589 4.017 3.490 4.524 4.922 3.969 4.986 A (EUR) 25.430 27.733 28.950 31.449 41.277 35.555 41.339 53.655 43.256 54.339 A (EUR) Hedged - - - - - - - - - - A (AUD) Hedged - - - - - - - - - - I (USD) 10.947 11.467 11.974 12.599 14.169 11.220 14.697 15.998 13.068 16.538
Low A (USD) 2.498 2.636 2.938 2.955 2.843 2.559 3.355 3.327 3.312 2.786 A (EUR) 20.568 22.914 24.463 23.857 27.234 24.755 35.135 36.267 36.095 30.352 A (EUR) Hedged - - - - - - - - - - A (AUD) Hedged - - - - - - - - - - I (USD) 8.582 9.101 10.222 10.329 9.289 8.185 10.815 10.862 10.825 9.186

Jupiter Asset Management Series Plc Annual Report and Audited Financial Statements for the financial year ended 31 December 2020
Sub-Fund Price Record (continued) Hong Kong Investors Section (unaudited) (continued)
395
Merian European Equity Fund 2011 2012 2013 2014 2015 2016 2017 2018 2019 2020 Share Class
High A (USD) 17.730 16.389 20.614 21.671 21.186 18.034 20.642 17.770 17.298 17.950 A (EUR) 0.659 0.667 0.809 0.879 1.035 0.898 0.958 0.968 0.944 0.980 I (EUR) - - - - - - - - 11.043 11.474
A (GBP) - - - - - - - - 12.151 12.608 A (USD) Hedged - - - - - - - - 10.020 10.704 Low A (USD) 12.016 12.843 16.211 17.747 17.917 14.963 16.828 13.776 13.814 11.211
A (EUR) 0.476 0.555 0.668 0.754 0.837 0.737 0.869 0.752 0.754 0.612 I (EUR) - - - - - - - - 9.929 7.168
A (GBP) - - - - - - - - 10.944 7.872 A (USD) Hedged - - - - - - - - 9.046 6.446
Jupiter Merian North American Equity Fund (IRL) 2011 2012 2013 2014 2015 2016 2017 2018 2019 2020 Share Class
High A (USD) 14.775 15.379 18.471 21.359 22.173 24.401 29.398 31.828 32.672 37.991 Low A (USD) 11.309 12.856 14.422 17.415 19.574 18.508 24.049 25.444 25.901 21.895
Merian Global Dynamic Bond Fund 2011 2012 2013 2014 2015 2016 2017 2018 2019 2020 Share Class
High A (USD) 17.120 18.436 18.640 18.928 19.350 20.193 20.538 20.284 22.101 24.709 A (USD) Income 11.459 11.786 11.805 11.445 11.584 11.348 10.800 10.459 10.564 11.530 A (EUR) - - - - - 10.722 10.782 11.562 - - A (EUR) Hedged 10.263 11.012 11.110 11.214 11.453 11.804 11.737 14.127 13.223 15.886 A (AUD) Hedged - 10.087 10.223 10.548 10.852 11.482 11.669 9.217 8.550 10.553 A (AUD) Hedged Income - - - - - - - - 7.416 8.704 I (USD) - - - - - 10.036 10.260 10.149 11.164 12.552
Low A (USD) 16.415 16.822 17.543 18.038 18.694 18.902 19.525 19.029 19.945 21.631
A (USD) Income 10.893 11.047 10.990 11.197 10.870 10.558 10.468 9.441 9.764 10.255
A (EUR) - - - - - 9.801 9.652 10.846 - -
A (EUR) Hedged 9.840 10.087 10.437 10.716 11.018 11.124 11.290 11.951 12.328 12.322
A (AUD) Hedged - 10.000 9.605 9.916 10.514 10.686 11.097 7.625 7.864 6.890
A (AUD) Hedged Income - - - - - - - - 6.867 5.847
I (USD) - - - - - 9.610 9.747 9.560 10.035 10.947

Jupiter Asset Management Series Plc Annual Report and Audited Financial Statements for the financial year ended 31 December 2020
Sub-Fund Price Record (continued) Hong Kong Investors Section (unaudited) (continued)
396
Jupiter Emerging Market Debt Fund 2011 2012 2013 2014 2015 2016 2017 2018 2019 2020
Share Class
High A (USD) 19.480 21.945 22.187 21.704 21.180 22.928 24.287 24.407 25.919 27.332 A (USD) Income 11.044 11.513 11.464 10.351 9.737 9.581 9.333 9.282 8.735 8.861 A (EUR) 14.691 17.088 17.008 16.914 19.826 20.941 21.558 24.234 25.689 27.071 A (EUR) Hedged 13.763 15.390 15.530 15.110 14.658 15.624 16.133 20.063 18.175 20.545 A (AUD) Hedged - 10.202 10.342 10.191 10.067 11.006 11.128 - - - A (AUD) Hedged Income - - - - - - - - - - I (USD) 10.596 12.063 12.227 12.074 11.851 12.948 13.372 10.408 11.222 11.925
Low A (USD) 17.846 19.011 19.276 19.153 19.354 18.898 21.925 21.783 22.254 20.412 A (USD) Income 10.012 10.482 9.675 8.920 8.708 8.352 8.917 7.843 7.916 6.717 A (EUR) 12.534 14.552 14.328 14.352 16.584 16.886 19.531 21.624 22.077 20.23 A (EUR) Hedged 12.590 13.429 13.465 13.316 13.357 13.023 14.847 15.866 16.257 13.595 A (AUD) Hedged - 9.965 8.984 9.066 9.220 9.043 10.515 - - - A (AUD) Hedged Income - - - - - - - - - - I (USD) 9.692 10.374 10.651 10.686 10.863 10.632 9.967 9.355 9.567 8.853
Merian Asian Equity Income Fund 2011 2012 2013 2014 2015 2016 2017 2018 2019 2020
Share Class
High A (USD) 10.683 9.252 9.714 9.521 10.195 8.854 11.461 12.595 10.347 11.900 A (USD) Income - - - 10.665 12.013 9.987 12.502 13.716 10.804 11.651 A (AUD) Hedged Income - - - - 10.312 9.797 - - - -
A (USD) Income (F) - - - - - - - - 10.018 10.590
Low A (USD) 7.247 7.791 7.745 8.011 7.252 6.475 8.548 8.778 8.758 7.109 A (USD) Income - - - 9.925 8.416 7.515 9.592 9.331 9.239 7.179 A (AUD) Hedged Income - - - - 9.628 8.406 - - - -
A (USD) Income (F) - - - - - - - - 8.638 6.623

Jupiter Asset Management Series Plc Annual Report and Audited Financial Statements for the financial year ended 31 December 2020
Sub-Fund Price Record (continued) Hong Kong Investors Section (unaudited) (continued)
397
Jupiter UK Alpha Fund (IRL) 2011 2012 2013 2014 2015 2016 2017 2018 2019 2020
Share Class
High A (USD) - - 10.302 10.665 10.671 8.964 10.258 7.919 8.210 8.208 A (USD) Income - - - - 10.008 8.369 9.038 6.874 6.422 - A (USD) Hedged - - - 10.709 11.449 11.432 12.955 10.392 11.205 11.063 A (USD) Hedged Income - - - - - - - - - - A (EUR) Hedged - - - - - - 10.382 9.465 8.917 - A (EUR) Hedged Income - - - - - - - - - - A (GBP) - - - 10.126 10.832 10.721 12.093 12.613 13.082 13.080 A (GBP) Income - - - - 10.564 9.831 10.714 11.011 10.723 10.658 A (SGD) Hedged - - - 10.707 11.469 10.196 - - - - A (AUD) Hedged - - - - - - - - - - I (USD) - - - 10.539 10.598 8.974 10.400 8.052 8.439 8.440 I (USD) Income - - - - - - - - - - I (USD) Hedged - - - 10.206 11.119 11.251 12.892 10.392 11.292 11.192 I (USD) Hedged Income - - - - 10.102 11.717 12.561 - - -
Low A (USD) - - 10.000 8.988 8.533 7.068 8.321 6.598 6.619 4.875 A (USD) Income - - - - 8.178 6.599 7.554 5.589 5.573 - A (USD) Hedged - - - 9.954 9.425 8.704 11.451 8.487 9.054 7.298 A (USD) Hedged Income - - - - - - - - - - A (EUR) Hedged - - - - - - 10.000 8.019 8.034 - A (EUR) Hedged Income - - - - - - - - - - A (GBP) - - - 8.951 8.943 8.263 10.731 10.511 10.545 7.768 A (GBP) Income - - - - 8.605 7.820 9.743 8.982 8.956 6.330 A (SGD) Hedged - - - 9.952 9.442 8.753 - - - - A (AUD) Hedged - - - - - - - - - - I (USD) - - - 8.900 8.496 7.077 8.364 6.737 6.760 5.020 I (USD) Income - - - - - - - - - - I (USD) Hedged - - - 9.627 9.178 8.500 11.284 8.461 9.084 7.394 I (USD) Hedged Income - - - - 9.711 9.381 11.645 - - -
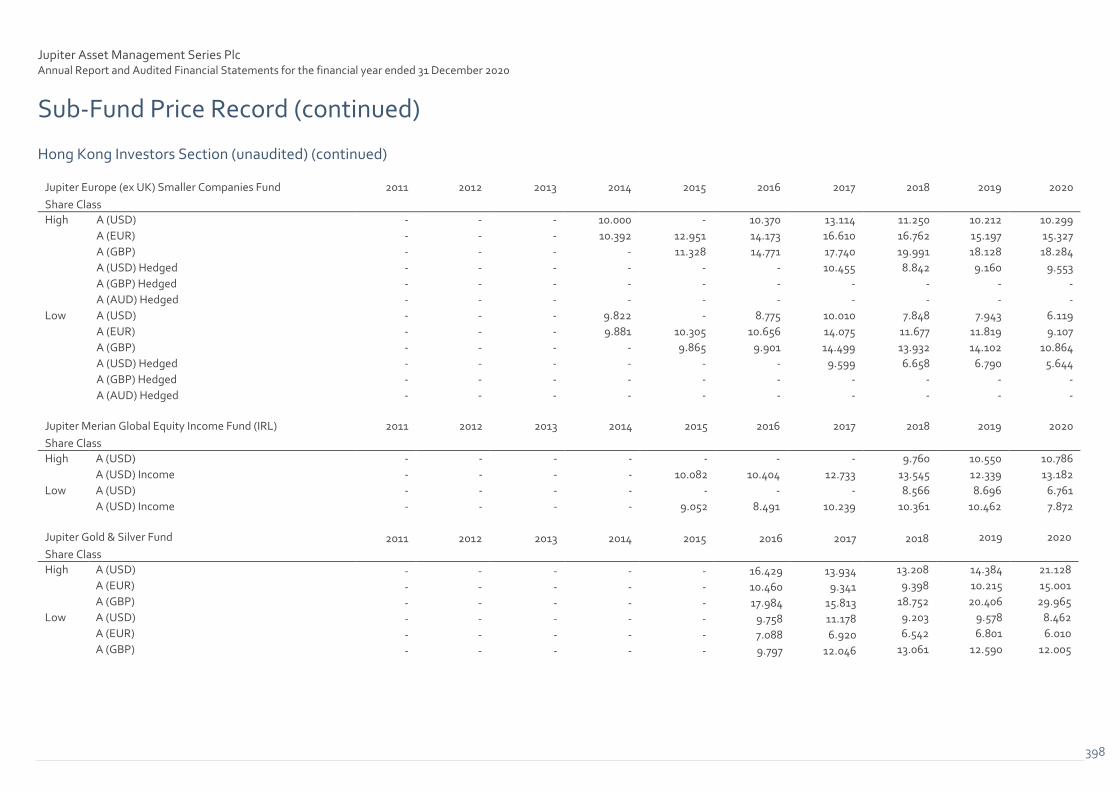
Jupiter Asset Management Series Plc Annual Report and Audited Financial Statements for the financial year ended 31 December 2020
Sub-Fund Price Record (continued) Hong Kong Investors Section (unaudited) (continued)
398
Jupiter Europe (ex UK) Smaller Companies Fund 2011 2012 2013 2014 2015 2016 2017 2018 2019 2020
Share Class
High A (USD) - - - 10.000 - 10.370 13.114 11.250 10.212 10.299 A (EUR) - - - 10.392 12.951 14.173 16.610 16.762 15.197 15.327 A (GBP) - - - - 11.328 14.771 17.740 19.991 18.128 18.284 A (USD) Hedged - - - - - - 10.455 8.842 9.160 9.553 A (GBP) Hedged - - - - - - - - - - A (AUD) Hedged - - - - - - - - - -
Low A (USD) - - - 9.822 - 8.775 10.010 7.848 7.943 6.119 A (EUR) - - - 9.881 10.305 10.656 14.075 11.677 11.819 9.107 A (GBP) - - - - 9.865 9.901 14.499 13.932 14.102 10.864 A (USD) Hedged - - - - - - 9.599 6.658 6.790 5.644 A (GBP) Hedged - - - - - - - - - - A (AUD) Hedged - - - - - - - - - -
Jupiter Merian Global Equity Income Fund (IRL) 2011 2012 2013 2014 2015 2016 2017 2018 2019 2020
Share Class
High A (USD) - - - - - - - 9.760 10.550 10.786 A (USD) Income - - - - 10.082 10.404 12.733 13.545 12.339 13.182
Low A (USD) - - - - - - - 8.566 8.696 6.761 A (USD) Income - - - - 9.052 8.491 10.239 10.361 10.462 7.872
Jupiter Gold & Silver Fund 2011 2012 2013 2014 2015 2016 2017 2018 2019 2020
Share Class
High A (USD) - - - - - 16.429 13.934 13.208 14.384 21.128 A (EUR) - - - - - 10.460 9.341 9.398 10.215 15.001 A (GBP) - - - - - 17.984 15.813 18.752 20.406 29.965
Low A (USD) - - - - - 9.758 11.178 9.203 9.578 8.462 A (EUR) - - - - - 7.088 6.920 6.542 6.801 6.010 A (GBP) - - - - - 9.797 12.046 13.061 12.590 12.005

Jupiter Asset Management Series Plc Annual Report and Audited Financial Statements for the financial year ended 31 December 2020
Total Expense Ratios
Swiss Investors Section (unaudited) This Section is for Swiss Investors
399
The Total Expense Ratio measures the total costs associated with managing and operating each Sub-Fund. These costs consist primarily of Investment Management Fees and additional expenses such as legal fees, auditor fees and other operational expenses. This disclosure is a requirement for Sub-Funds approved for public distribution in Switzerland.
The total expense ratios of the Sub-Funds for the financial year from 1 January 2020 to 31 December 2020 are as follows:
Excluding Performance
Fees
Including Performance
Fees Sub-Fund Share Class TER TER
Jupiter China Equity Fund Class A (USD) 1.94% 1.94% Class B (USD) 3.03% 3.03% Class C (USD) 3.47% 3.47% Class C2 (USD) 3.00% 3.00% Class I (USD) 1.09% 1.09% Class S (GBP) 1.43% 1.43% Class U1 (GBP) 1.13% 1.15% Jupiter Merian World Equity Fund Class A (EUR) 1.68% 1.68% Class A (EUR) Hedged 1.75% 1.75% Class A (USD) 1.71% 1.71% Class B (USD) 2.82% 2.82% Class C (USD) 3.22% 3.22% Class C2 (USD) 2.79% 2.79% Class I (EUR) 0.92% 0.92% Class I (USD) 0.95% 0.95% Class S (GBP) 1.20% 1.20% Class U1 (GBP) 0.91% 0.91% Jupiter Pacific Equity Fund Class A (EUR) 1.93% 1.93% Class A (USD) 1.93% 1.93% Class B (USD) 3.10% 3.10% Class C (USD) 3.51% 3.51% Class C2 (USD) 3.23% 3.23% Class I (USD) 1.17% 1.17% Class R (GBP) 1.18% 1.18% Class S (GBP) 1.43% 1.43% Class U1 (GBP) 1.11% 1.11% Merian European Equity Fund Class A (EUR) 1.95% 1.96% Class A (GBP) 1.95% 2.06% Class A (USD) 1.95% 1.96% Class A (USD) Hedged* 2.01% 2.08% Class B (USD) 3.07% 3.07% Class C (USD) 3.75% 3.95% Class I (EUR) 1.20% 1.38% Class R (GBP) Accumulation Share 1.20% 1.25% Class S (GBP) 1.45% 1.47% Class U1 (GBP) 1.13% 1.14% Class U2 (GBP)* 1.05% 1.31% Jupiter Merian US Equity Income Fund Class A (EUR) 1.80% 1.80% Class A (EUR) Hedged 1.93% 1.93% Class A (GBP) 1.89% 1.89%
Class A (USD) 1.86% 1.86% Class A (USD) Income 1.86% 1.86%

Jupiter Asset Management Series Plc Annual Report and Audited Financial Statements for the financial year ended 31 December 2020
Total Expense Ratios (continued)
Swiss Investors Section (unaudited) (continued) This Section is for Swiss Investors
400
Excluding Performance
Fees
Including Performance
Fees Sub-Fund Share Class TER TER
Jupiter Merian US Equity Income Fund (continued) Class A (USD) Income (F) 1.87% 1.87% Class B (USD) 3.04% 3.04% Class B (USD) Income 3.00% 3.00% Class C (USD) 3.40% 3.40% Class C (USD) Income 3.53% 3.53% Class C2 (USD) Income 2.98% 2.98% Class C2 (USD) Income (F) 2.91% 2.91% Class I (USD) 1.10% 1.10% Class I (USD) Income 1.10% 1.10% Class N (USD) 2.99% 2.99% Class R (GBP) 1.20% 1.20% Class R (GBP) Income 1.10% 1.10% Class S (GBP) 1.37% 1.37% Class U1 (GBP) 1.13% 1.13% Class U1 (GBP) Income 1.02% 1.02% Class U2 (GBP) 1.05% 1.06% Class U2 (GBP) Income 0.90% 0.90% Jupiter Merian North American Equity Fund (IRL) Class A (EUR) 1.64% 1.64% Class A (USD) 1.65% 1.65% Class B (USD) 2.79% 2.79% Class C (USD) 3.17% 3.17% Class C2 (USD) 2.82% 2.82% Class I (EUR) 0.87% 0.87% Class I (EUR) Hedged 0.92% 1.13% Class I (USD) 0.87% 0.87% Class N (USD) 2.76% 2.76% Class P2 (GBP) Income 0.25% 0.25% Class P2 (USD) 0.27% 0.27% Class P2 (USD) Income* 0.23% 0.23% Class R (GBP) 0.96% 0.96% Class R (GBP) Hedged 0.98% 0.98% Class S (GBP) 1.12% 1.12% Class U1 (GBP) 0.84% 0.84% Class U1 (GBP) Hedged 0.86% 0.86% Class U2 (GBP) 0.77% 0.77% Merian Global Dynamic Bond Fund Class A (AUD) Hedged 1.39% 1.39% Class A (AUD) Hedged Income (F) 1.39% 1.39% Class A (EUR) Hedged 1.36% 1.36% Class A (GBP) Income 1.30% 1.30% Class A (USD) 1.30% 1.30% Class A (USD) Income 1.31% 1.31% Class A (USD) Income (F) 1.29% 1.29% Class A (ZAR) Hedged Income (F) 1.41% 1.41% Class B (USD) 2.37% 2.37% Class B (USD) Income 2.34% 2.34% Class C (USD) 2.81% 2.81% Class C (USD) Income 2.86% 2.86% Class C2 (AUD) Hedged Income (F) 2.47% 2.47% Class C2 (USD) Income (F) 2.36% 2.36% Class C2 (ZAR) Hedged Income (F) 2.61% 2.61% Class I (USD) 0.81% 0.81%

Jupiter Asset Management Series Plc Annual Report and Audited Financial Statements for the financial year ended 31 December 2020
Total Expense Ratios (continued)
Swiss Investors Section (unaudited) (continued) This Section is for Swiss Investors
401
Excluding Performance
Fees
Including Performance
Fees Sub-Fund Share Class TER TER
Jupiter Emerging Market Debt Fund Class A (EUR) 1.93% 1.93% Class A (EUR) Hedged 1.88% 1.88% Class A (SEK) Hedged 1.95% 1.95% Class A (SGD) Hedged Income 1.96% 1.96% Class A (USD) 1.87% 1.87% Class A (USD) Income 1.86% 1.86% Class A (USD) Income (F) 1.90% 1.90% Class A (ZAR) Hedged Income (F) 2.31% 2.79% Class B (USD) 3.03% 3.03% Class B (USD) Income 2.92% 2.92% Class C (USD) 3.39% 3.39% Class C (USD) Income 3.51% 3.51% Class C2 (USD) Income (F) 3.25% 3.32% Class C2 (ZAR) Hedged Income (F) 3.04% 3.04% Class I (USD) 1.10% 1.10% Class S (GBP) Income 1.49% 1.49% Class U1 (GBP) Income 1.10% 1.10% Jupiter Global Emerging Markets Focus Fund Class A (EUR) 1.70% 1.70% Class A (GBP) 1.71% 1.71% Class A (USD) 1.83% 1.83% Class B (USD) 2.85% 2.85% Class C (USD) 3.75% 3.80% Class C2 (USD) 2.83% 2.83% Class I (USD) 0.96% 0.96% Class R (GBP) 1.01% 1.01% Class S (GBP) 1.24% 1.24% Class U1 (GBP) 1.00% 1.00% Class U2 (GBP) 0.81% 0.81% Merian Asian Equity Income Fund Class A (EUR) 1.95% 1.95%
Class A (GBP) 1.84% 1.84% Class A (USD) 1.95% 1.98% Class A (USD) Income 1.87% 1.87% Class A (USD) Income (F) 2.25% 2.40% Class B (USD) 3.25% 3.39% Class C (USD) 3.75% 4.22% Class C2 (USD) Income (F) 3.25% 3.29% Class I (EUR) 1.20% 1.22% Class I (USD) 1.20% 1.23% Class R (GBP) 1.20% 1.23% Class U1 (GBP) 1.13% 1.16% Class U1 (GBP) Income 1.13% 1.16% Class U2 (GBP) Income 1.05% 1.08%

Jupiter Asset Management Series Plc Annual Report and Audited Financial Statements for the financial year ended 31 December 2020
Total Expense Ratios (continued)
Swiss Investors Section (unaudited) (continued) This Section is for Swiss Investors
402
Excluding Performance
Fees
Including Performance
Fees Sub-Fund Share Class TER TER
Jupiter Local Currency Emerging Market Debt Fund Class A (AUD) Hedged Income (F) 2.30% 2.30% Class A (EUR) 2.20% 2.21% Class A (GBP) Income 2.20% 2.20% Class A (USD) 2.19% 2.19% Class A (USD) Income 2.18% 2.18% Class A (USD) Income (F) 2.21% 2.21% Class A (ZAR) Hedged Income (F) 2.28% 2.28% Class B (AUD) Hedged Income (F) 3.37% 3.37% Class B (USD) Income 3.26% 3.26% Class B (ZAR) Hedged Income (F) 3.34% 3.34% Class C (USD) 3.51% 3.51% Class C (USD) Income 3.70% 3.70% Class C2 (AUD) Hedged Income (F) 3.56% 3.71% Class C2 (USD) Income (F) 3.35% 3.35% Class C2 (ZAR) Hedged Income (F) 3.56% 3.76% Class I (USD) 1.24% 1.24% Class U1 (GBP) Income 1.24% 1.24% Class U2 (GBP) 1.15% 1.19% Class U2 (GBP) Income 0.89% 0.86% Jupiter UK Alpha Fund (IRL) Class A (EUR) 1.95% 1.95% Class A (GBP) 1.95% 1.95% Class A (GBP) Income 1.92% 1.92% Class A (USD) 1.95% 1.95% Class A (USD) Hedged 2.01% 2.01% Class I (EUR) 1.20% 1.20% Class I (USD) 1.20% 1.21% Class I (USD) Hedged 1.20% 1.20% Class R (GBP) 1.20% 1.21% Class R (GBP) Income 1.18% 1.18% Class U1 (GBP) 1.12% 1.12% Class U1 (GBP) Income 1.10% 1.10% Class U1 (USD) 1.11% 1.11% Class U2 (GBP) 1.04% 1.04% Class U2 (GBP) Income 1.02% 1.02% Class U2 (USD) 1.01% 1.01% Jupiter UK Smaller Companies Focus Fund Class A (GBP) Income 1.61% 2.60% Class R (GBP) Income 0.86% 2.26% Class U1 (GBP) Income 0.79% 2.21% Jupiter UK Dynamic Equity Fund Class A (GBP) Income 1.59% 4.86% Class I (EUR) Hedged 1.15% 4.63% Class R (GBP) Income 1.09% 4.92% Jupiter Merian Global Equity Absolute Return Fund Class A (CHF) Hedged 1.72% 1.72% Class A (EUR) Hedged 1.72% 1.72% Class A (GBP) Hedged 1.72% 1.72% Class A (RMB) Hedged 1.72% 1.72% Class A (SGD) Hedged 1.72% 1.72%

Jupiter Asset Management Series Plc Annual Report and Audited Financial Statements for the financial year ended 31 December 2020
Total Expense Ratios (continued)
Swiss Investors Section (unaudited) (continued) This Section is for Swiss Investors
403
Excluding Performance
Fees
Including Performance
Fees Sub-Fund Share Class TER TER
Jupiter Merian Global Equity Absolute Return Fund Class A (USD) 1.65% 1.65% (continued) Class A2 (CHF) Hedged 1.71% 1.71% Class C (USD) 3.15% 3.15% Class I (CHF) Hedged 0.96% 0.96% Class I (EUR) Hedged 0.96% 0.96% Class I (SEK) Hedged 0.95% 0.95% Class I (USD) 0.90% 0.90% Class R (GBP) Hedged 0.96% 0.96% Class U1 (GBP) Hedged 0.82% 0.89% Class U2 (GBP) Hedged 0.89% 0.82% Jupiter Strategic Absolute Return Bond Fund Class A (EUR) Hedged 1.18% 2.00% Class A (GBP) Hedged 1.18% 2.09% Class A (USD) 1.11% 2.04% Class F2 (GBP) Hedged 0.86% 0.86% Class F2 (GBP) Hedged Income 0.88% 0.88% Class I (EUR) Hedged 0.79% 1.62% Class I (USD) 0.69% 2.05% Class R (GBP) Hedged 0.79% 1.76% Class U1 (GBP) Hedged 0.74% 1.66% Class U3 (EUR) Hedged 0.62% 1.58% Class U3 (GBP) Hedged 0.64% 1.63% Class U3 (USD) 0.57% 1.62% Jupiter Europe (ex UK) Smaller Companies Fund Class A (EUR) 1.95% 1.95% Class A (GBP) 1.95% 1.96% Class A (USD) 1.95% 1.96% Class A (USD) Hedged 2.01% 2.02% Class C (USD) Hedged 3.81% 3.83% Class I (EUR) 1.20% 1.20% Class I (USD) 1.20% 1.21% Class I (USD) Hedged 1.26% 1.31% Class R (GBP) 1.20% 1.21% Class R (GBP) Hedged 1.17% 1.17% Class R (GBP) Income 1.20% 1.21% Class U1 (EUR) Income 1.13% 1.14% Class U1 (GBP) 1.13% 1.15% Class U1 (GBP) Hedged 1.19% 1.19% Class U1 (GBP) Income 1.13% 1.13% Class U2 (GBP) 0.86% 0.86% Jupiter Merian Global Equity Income Fund (IRL) Class A (GBP) Income 1.89% 1.89% Class A (USD)* 1.76% 1.82% Class A (USD) Income 1.92% 1.92% Class I (EUR) 1.13% 1.13% Class I (EUR) Income 1.13% 1.13% Class I (USD) Income 1.14% 1.14% Class R (GBP) 1.20% 1.20% Class R (GBP) Income 1.10% 1.10% Class S (GBP) 1.38% 1.38% Class U1 (GBP) 1.13% 1.13% Class U1 (GBP) Income 1.13% 1.13%

Jupiter Asset Management Series Plc Annual Report and Audited Financial Statements for the financial year ended 31 December 2020
Total Expense Ratios (continued)
Swiss Investors Section (unaudited) (continued) This Section is for Swiss Investors
404
Excluding Performance
Fees
Including Performance
Fees Sub-Fund Share Class TER TER
Jupiter Gold & Silver Fund Class A (EUR) 1.62% 1.62% Class A (GBP) 1.62% 1.62% Class A (SGD) Hedged 1.69% 1.77% Class A (USD) 1.61% 1.61% Class C (USD) 3.13% 3.13% Class I (EUR) 0.85% 0.85% Class I (USD) 0.85% 0.85% Class R (GBP) 0.87% 0.87% Class U1 (GBP) 0.78% 0.78% Class U2 (GBP) 0.70% 0.70% Class U3 (GBP) 0.26% 3.39% Jupiter UK Specialist Equity Fund Class A (EUR) Hedged 1.63% 3.98% Class A (GBP) 1.59% 4.34% Class A (USD) Hedged 1.64% 4.80% Class F (EUR) Hedged 0.88% 3.57% Class F (GBP) 0.82% 4.03% Class F (USD) Hedged 0.91% 3.89% Class I (EUR) Hedged 1.13% 3.63% Class I (USD) Hedged 1.15% 4.40% Class R (GBP) 1.08% 4.26% Class X (GBP) 0.08% 0.08% Jupiter Financials Contingent Capital Fund Class A (EUR) Hedged* 1.77% 1.77% Class A (EUR) Hedged Income* 1.76% 1.76% Class A (USD) 1.74% 1.74% Class A (USD) Income 1.71% 1.71% Class C (USD) 3.22% 3.22% Class F (EUR) Hedged Income 0.67% 0.67% Class F (GBP) Hedged Income 0.61% 0.61% Class F (USD) Income 0.56% 0.56% Class I (CHF) Hedged 1.07% 1.07% Class I (EUR) Hedged 1.02% 1.02% Class I (EUR) Hedged Income 1.03% 1.03% Class I (USD) 1.00% 1.00% Class I (USD) Income 0.97% 0.97% Class R (GBP) Hedged 1.14% 1.14%
*Estimated TER for class that launched during the financial year ended 31 December 2020.

Jupiter Asset Management Series Plc Annual Report and Audited Financial Statements for the financial year ended 31 December 2020
Sub-Fund Performance Swiss Investors Section (unaudited) (continued) This Section is for Swiss Investors
405
The information above has been derived from sources believed to be accurate as of 31 December 2020. It contains general information only on investment matters and should not be considered as a comprehensive statement on any matter and should not be relied upon as such. Past performance is no indication of current or future performance. These performance data do not take account of the commissions and costs incurred on the issue and redemption of Shares.
Share Class
Base Currency 2020 2019 2018
3 Financial Years
2018 - 31 December
2020
A USD Acc Jupiter China Equity Fund USD 31.40% 19.25% (14.56%) 10.21%
MSCI Zhong Hua 10/40 Index 25.90% 20.18% (15.92%) 8.35%
A USD Acc Jupiter Merian World Equity Fund USD 15.19% 21.24% (12.23%) 7.02%
MSCI World Index 15.90% 27.67% (8.71%) 5.00%
A USD Acc Jupiter Pacific Equity Fund USD 26.41% 16.13% (24.92%) 3.29%
MSCI AC Asia Pacific ex Japan Index 22.44% 19.16% (13.92%) 7.89%
A EUR Acc Merian European Equity Fund EUR (1.08%) 23.45% (19.04%) (0.38%)
MSCI Europe Index (3.32%) 26.05% (10.57%) 2.91%
A USD Acc Jupiter Merian North American Equity Fund (IRL) USD 16.82% 23.73% (10.43%) 8.99%
MSCI North America Index 19.94% 30.70% (5.73%) 13.90%
A USD Acc Merian Global Dynamic Bond Fund USD 13.00% 10.03% (2.14%) 6.76%
Bloomberg Barclays Global Aggregate (USD Hedged) 5.58% 8.10% 0.01% 4.51%
A USD Acc Jupiter Emerging Market Debt Fund USD 5.45% 16.47% (8.37%) 4.01%
EMD Custom Index 5.26% 15.04% (4.72%) 4.88%
A USD Acc Jupiter Global Emerging Markets Focus Fund USD 22.17% 21.25% (20.81%) 5.46%
MSCI EM (Emerging Markets) Index 18.31% 18.42% (14.58%) 6.17%
A USD Acc Merian Asian Equity Income Fund USD 15.61% 14.34% (21.45%) 1.26%
MSCI AC Asia Pacific ex Japan Index 22.44% 19.16% (13.92%) 7.89%
A USD Acc Jupiter Local Currency Emerging Market Debt Fund USD 1.05% 13.48% (10.19%) 0.99%
J.P. Morgan GBI-EM Global Diversified Index
2.69% 13.47% (6.21%) 3.01%
R GBP Acc Jupiter UK Alpha Fund (IRL) Fund GBP (8.43%) 22.87% (11.58%) (0.17%)
FTSE All-Share Index (9.82%) 19.17% (9.47%) (0.91%) R GBP Inc Jupiter UK Smaller Companies Focus Fund GBP 11.55% 28.84% (17.38%) 5.89% Numis Smaller Companies Index excluding Investment
Companies
(4.29%) 25.17% (15.35%) 0.47% A EUR Acc Jupiter Europe (ex UK) Smaller Companies Fund EUR o.86% 27.07% (25.93%) (1.72%) EMIX Smaller European Companies ex-UK Index 12.55% 27.77% (13.64%) 7.49% R GBP Inc Jupiter UK Dynamic Equity Fund GBP 6.99% 32.69% (19.40%) 4.59% FTSE 250 ex Investment Trust Index (8.48%) 30.79% (15.15%) 0.52%
I USD Acc Jupiter Merian Global Equity Absolute Return Fund USD (1.78%) (11.56%) (1.14%) (4.95%) US Federal Reserve Overnight Rate 0.39% 2.17% 1.83% 1.47%
I USD Acc Jupiter Strategic Absolute Return Bond Fund USD 9.61% 7.96% (1.31%) 5.30%
Strategic Absolute Bond Custom Index 0.39% 2.17% 1.83% 1.46%
A USD Inc Jupiter Merian Global Equity Income Fund (IRL) Fund USD 9.92% 19.95% (14.26%) 4.17%
MSCI ACWI Index 16.25% 26.60% (9.42%) 10.06%
I USD Inc Merian Financial Contingent Capital Fund USD 7.59% 22.54% (5.17%) 7.73%
Bloomberg Barclays Contingent Capital Western Europe (USD Hedged) Index 7.85% 20.07% (3.09%) 7.86%
I USD Acc Jupiter Gold & Silver Fund USD 41.53% 42.91% (19.81%) 17.49%
Gold & Silver Custom Index 26.41% 30.20% 0.96% 18.44%
A USD Acc Jupiter Merian US Equity Income Fund USD 13.20% 21.96% (9.41%) 7.74%
US Equity Income Custom Index 20.73% 30.88% (5.04%) 14.48%
R GBP Acc Jupiter UK Specialist Equity Fund (UCITS) GBP 13.94% 7.50% (7.17%) 4.37%
Sterling Overnight Interbank Average Rate 0.19% 0.71% 0.56% 0.49%

Jupiter Asset Management Series Plc Annual Report and Audited Financial Statements for the financial year ended 31 December 2020
Events During the Financial Year (unaudited)
406
On 21 May 2020, Jupiter Asset Management's shareholders approved the firm's proposed acquisition of the Merian Global Investors Group. The proposed acquisition, which was originally announced on 17 February 2020, was subject to regulatory and Jupiter shareholder approval. Following shareholder and regulatory approvals, on 1 July 2020 Jupiter Asset Management completed the acquisition of the Merian Global Investors Group. The entire issued share capital of Merian Global Investors Limited was acquired by Jupiter Fund Management plc. As a result, the Merian Group is now a wholly-owned subsidiary of Jupiter. Merian is being fully integrated into the business, which will operate under the Jupiter brand. Jupiter has a clear and well-designed integration plan, overseen by its executive committee. In early 2020, health officials became aware of the existence of a new coronavirus, which subsequently became known as COVID-19. First detected in China, COVID-19 rapidly spread throughout a large number of countries worldwide. In order to stem, or at least to slow, the spread of the virus, many governments advised citizens to remain at home or reduce travel.
Given the inherent uncertainties and complexities, it is not practical at this stage to provide a Sub-Fund by Sub-Fund analysis of the investment impact of COVID-19. However, it is clear that the global economy has suffered a sharp, exogenous shock. Many national economies are expected to slow, though the depth and duration of that slowing is currently unclear. Expectations of a substantial economic slowdown have been reflected in a fall in the prices of equities worldwide, as well as of emerging market currencies and higher-yielding bonds. The US dollar, in contrast, has rallied as investors sought a historically perceived ‘safe haven’. It should also be noted that the response of central banks and governments to mitigate the knock-on economic effects of COVID-19 has already been significant, and there could be more support to come. In addition, multiple vaccines have already been developed and approved by medicine regulatory bodies of various jurisdictions and vaccination programmes have commenced in many countries. The managers of all the Sub-Funds of the Company have thoroughly reviewed their portfolios in the light of the coronavirus outbreak. They have taken the measures they consider prudent to protect long-term risk-adjusted returns and to ensure diversification. They continue to monitor the situation closely and to work with the risk departments to ensure that all Sub-Funds are managed within their investment and risk parameters. With regard to any outflows, the Company does not believe that they have had any material effect on the investment performance of the Sub-Funds. In the last few months, there has not been a significant change to the impact of COVID-19 on the Company to that disclosed in the annual financial statements. Since the commencement of the “lockdowns” in the UK and Ireland in March 2020, the Company and its Manager have proved operationally efficient, with all systems, functions and personnel able to operate as anticipated. Both the Company and its Manager have continued to monitor the situation and relevant government guidance, and in conjunction with the new parent company, Jupiter Fund Management plc, have developed a return-to-office plan that will enable all employees to work in a covid-safe environment. The Company and Manager are both well prepared for potential “further waves” of the virus and are confident of the continued ability to manage all operations remotely. As with any market event, the Company has robust procedures to support fund management teams in their ongoing investment activities. The Company is confident of its continued ability to meet our business and regulatory commitments during this period and envisage no disruption to fund management operations. Portfolio management teams have remote access to all systems and there is no change to our dealing, compliance and risk monitoring processes. The following amendments were made to the Prospectus dated 27 May 2020. Changes to Performance Fee Periods In accordance with new CBI requirements imposed in respect of Performance Fees, all of the Company’s performance fees are
changing to annual crystallisation (as opposed to semi-annually). This is effective 1 January 2020. Other updates also included revised
performance fee disclosures for clarification purposes. Sub-Funds impacted as follows:
- Jupiter Merian Global Equity Absolute Return Fund
- Jupiter UK Specialist Equity Fund
- Jupiter Strategic Absolute Return Bond Fund
- Jupiter UK Smaller Companies Focus Fund

Jupiter Asset Management Series Plc Annual Report and Audited Financial Statements for the financial year ended 31 December 2020
Events During the Financial Year (unaudited) (continued)
407
Changes to Performance Fee Periods (continued) Sub-Funds impacted as follows (continued):
- Jupiter UK Dynamic Equity Fund
- Jupiter Merian North American Equity Fund (IRL)
- Jupiter Gold and Silver Fund
REITS limit changes
The permitted exposure of the Jupiter Merian North American Equity Fund (IRL) + and the Jupiter Merian World Equity Fund to REITS
increased from 5% to 15%.
China Bond Connect
Exposure to the China Interbank Bond Market including via Bond Connect is now permitted for the Sub-Funds below:
- Jupiter Emerging Market Debt Fund
- Jupiter Local Currency Emerging Market Debt Fund
- Merian Global Dynamic Bond Fund
- Jupiter Strategic Absolute Return Bond Fund
HK Stock Connect limits
The permitted exposure of the Jupiter Global Emerging Markets Focus Fund, Merian Asian Equity Income Fund, Jupiter Pacific Equity
Fund and Jupiter China Equity Fund to China-A Shares via the Shanghai-Hong Kong Stock Connect and the Shenzhen-Hong Kong
Stock Connect has increased from 10% to 20%.
Global Dynamic Bond Fund
Change to the approach used for calculating global exposure – The Sub-Fund changed the manner in which it measured global
exposure from the relative VaR approach to the absolute VaR approach with a limit of 10%. The Sub-Fund’s investment objective
and investment strategy remains unchanged.
Addition of an ‘Investment Approach’ Section to the Fund Supplements In 2019 the Central Bank undertook a thematic review of Irish authorised UCITS on the subject of closet indexing. Upon completion of this thematic review the Central Bank made certain Prospectus disclosure recommendations to ensure investors were provided with sufficient information about the UCITS investment strategy. These recommendations include disclosing whether the Sub-Fund is being managed with a performance target. In accordance with the recommendations, each of the Sub-Fund Supplements was updated on 22 July, 2020 to incorporate an additional section entitled ‘Investment Approach’ which aims to provide clearer information on the investment approach of the Sub-Funds. There was no change to the investment objective, investment policy or strategy of the Sub-Funds or the manner in which the Sub-Funds are managed. The risk profile of each of the Sub-Funds also remains the same. Jupiter Merian Global Equity Absolute Return Fund – change to performance fee wording With effect from 22 July, 2020, a non-material change has been made in the “Performance Fee” section of the Fund Supplement to the Performance Fee hurdle rate names. The change has been made in order to better reflect the current generally accepted industry standard terms used to describe the existing hurdle rate. The revised names are intended only to provide greater clarity; the new names in no way impact on the performance methodology or the level of performance fees that will be charged, as the existing hurdle rates themselves are not changing. Risk Factor relating to the Impact of Natural or Man-Made Disasters and Disease Epidemics With effect from 22 July, 2020, a new risk factor has been added to the Prospectus disclosing the potential impacts of natural or man-made disasters and disease epidemics.

Jupiter Asset Management Series Plc Annual Report and Audited Financial Statements for the financial year ended 31 December 2020
Events During the Financial Year (unaudited) (continued)
408
Share Class Launches and Deactivations
The following Share Classes were launched during the financial year:
Date Sub-Fund name Share Class name
11 July 2020 Jupiter Merian North American Equity Fund (IRL) Class I (EUR) Hedged
4 December 2020 Jupiter Gold & Silver Fund Class A (SGD) Hedged
The following Share Classes were fully redeemed during the financial year:
Date Sub-Fund name Share Class name
29 June 2020 Jupiter Local Currency Emerging Market Debt Fund Class U2 (GBP) Income
1 September 2020 Jupiter Merian Global Equity Income Fund (IRL) Class A (USD)
5 October 2020 Jupiter UK Specialist Equity Fund Class A (EUR) Hedged
30 October 2020 Jupiter Merian North American Equity Fund (IRL) Class P2 (USD) Income
28 October 2020 Merian European Equity Fund Class A (USD) Hedged
Director Resignation and Appointment On 26 November 2020 Nicola Stronach resigned as Director. Jasveer Singh was appointed to the Board of Directors with effect from 2 November 2020.

Jupiter Asset Management Series Plc Annual Report and Audited Financial Statements for the financial year ended 31 December 2020
Supplementary Information (unaudited) Cybersecurity Risk
409
Cybersecurity breaches may occur allowing an unauthorized party to gain access to assets of the Sub-Funds, Shareholder data, or proprietary information, or may cause the Company, the Manager, the Investment Manager, the Distributor, the Administrator or the Depositary to suffer data corruption or lose operational functionality.
The Sub-Funds may be affected by intentional cybersecurity breaches which include unauthorized access to systems, networks, or devices (such as through “hacking” activity); infection from computer viruses or other malicious software code; and attacks that shut down, disable, slow, or otherwise disrupt operations, business processes, or website access or functionality. In addition, unintentional incidents can occur, such as the inadvertent release of confidential information (possibly resulting in the violation of applicable privacy laws).
Notwithstanding the existence of policies and procedures designed to detect and prevent such breaches and ensure the security, integrity and confidentiality of such information as well as the existence of business continuity and disaster recovery measures designed to mitigate any such breach or disruption at the level of the Company and its delegates, such a cybersecurity breach could result in the loss or theft of Shareholder data or Sub-Funds, the inability to access electronic systems, loss or theft of proprietary information or corporate data, physical damage to a computer or network system, or costs associated with system repairs.
Such incidents could cause the Company, the Manager, the Investment Manager/the Distributor, the Administrator, the Depositary, or other service providers to incur regulatory penalties, reputational damage, additional compliance costs, or financial loss. Consequently, Shareholders may lose some or all of their invested capital. In addition, such incidents could affect issuers in which a Sub-Fund invests, and thereby cause a Sub-Fund’s investments to lose value, as a result of which investors, including the relevant Sub-Fund and its Shareholders, could potentially lose all or a portion of their investment with that issuer. Soft Commission Arrangements
There were no soft commission arrangements (including commission-sharing arrangements) on behalf of the Company for the financial years ended 31 December 2020 and 31 December 2019.

Jupiter Asset Management Series Plc Annual Report and Audited Financial Statements for the financial year ended 31 December 2020
Supplementary Information (unaudited) (continued) Exchange Rates
410
The USD exchange rates used in this report are as follows:
As at As at
31 December 2020 31 December 2019
Argentina Peso 84.0689 59.8731
Australian Dollar 1.2959 1.4226
Botswanan Pula 10.7991 10.5764
Brazilian Real 5.1942 4.0227
Canadian Dollar 1.2740 1.2967
CFA Franc BCEAO 536.1097 584.3716
Chilean Peso 710.7321 751.8797
Chinese Renminbi 6.5398 6.9657
Colombian Peso 3,424.6575 3,278.6885
Czech Koruna 21.4638 22.6403
Danish Krone 6.0835 6.6570
Dominican Republic Peso 58.1463 53.3589
Egyptian Pound 15.7299 16.0501
Euro 0.8173 0.8909
Hong Kong delivered Chinese Yuan 6.4967 6.9651
Hong Kong Dollar 7.7539 7.7918
Hungarian Forint 296.4201 294.6194
Indian Rupee 73.0674 71.3776
Indonesian Rupiah 14,050.8641 13,883.1043
Israeli Shekel 3.2108 3.4540
Japanese Yen 103.2450 108.6750
Kazakhstan Tenge 421.1395 382.9246
Kenyan Shilling 109.1941 101.3479
Malaysian Ringgit 4.0225 4.0905
Mauritian Rupee 39.6999 36.3504
Mexican Peso 19.9255 18.8840
Moroccan Dirham 8.9042 9.5600
New Ghana Cedi 5.8650 5.7000
Turkish Lira 7.4325 5.9510
New Zealand Dollar 1.3889 1.4823
Nigerian Naira 394.7888 362.9764
Norwegian Krone 8.5619 8.7873
Pakistani Rupee 159.7955 154.8707
Peruvian Nuevo Sol 3.6173 3.3111
Philippine Peso 48.0238 50.6457
Polish Zloty 3.7260 3.7873
Pound Sterling 0.7316 0.7549
Romanian Leu 3.9782 4.2638
Russian Ruble 73.9645 62.1118
Serbian Dinar 96.0800 104.7449
Singapore Dollar 1.3216 1.3446
South African Rand 14.6888 13.9835
South Korean Won 1,086.2953 1,156.4437
Sri Lankan Rupee 185.2538 181.3894
Swedish Krona 8.2125 9.3610
Swiss Franc 0.8839 0.9683
Taiwanese Dollar 28.0978 29.9769
Thai Baht 29.9599 29.9536
Tunisian Dinar 2.6887 2.7744
Ugandan Shilling 3,652.9680 3,669.9941

Jupiter Asset Management Series Plc Annual Report and Audited Financial Statements for the financial year ended 31 December 2020
Supplementary Information (unaudited) (continued) Exchange Rates (continued)
411
The USD exchange rates used in this report are as follows (continued):
As at As at
31 December 2020 31 December 2019
Ukrainian Hryvna 28.3350 23.8078
United Arab Emirates Dirham 3.6731 3.6731
Uruguayan Peso 42.4755 37.4251
Uzbekistani Som 10,526.3158 -
Vietnamese Dong 23,084.0259 23,174.9710
Zambian Kwacha 21.1650 14.0850
The EUR exchange rates used in this report are as follows:
As at As at 31 December 2020 31 December 2019
Australian Dollar 1.5856 1.5968 Danish Krone 7.4435 7.4725 Norwegian Krone 10.4760 9.8637 Pound Sterling 0.8951 0.8473 Swedish Krona 10.0485 10.5077 Swiss Franc 1.0816 1.0870 United States Dollar 1.2236 1.1225
The GBP exchange rates used in this report are as follows:
As at As at 31 December 2020 31 December 2019
Euro 1.1172 1.1802 United States Dollar 1.3670 1.3248

Jupiter Asset Management Series Plc Annual Report and Audited Financial Statements for the financial year ended 31 December 2020
Supplementary Information (unaudited) (continued)
412
Directed Brokerage Expenses
The amounts paid under Brokerages arrangements/services are:
Sub-Fund CCY
Expense year ended
31 December 2020
Expense year ended
31 December 2019
Jupiter China Equity Fund USD - - Merian Global Strategic Bond Fund (IRL)* USD - 622 Jupiter Merian World Equity Fund USD 8,854 15,489 Jupiter Pacific Equity Fund USD 1,568 1,433 Merian European Equity Fund EUR 909 837 Jupiter Merian US Equity Income Fund USD 17,351 14,481 Jupiter Merian North American Equity Fund (IRL) USD 36,997 30,740 Merian Global Dynamic Bond Fund USD 26,072 45,432 Jupiter Emerging Market Debt Fund USD 98 396 Merian Investment Grade Corporate Bond Fund*** USD - 322 Merian Asian Equity Income Fund USD 4,243 7,975 Jupiter Local Currency Emerging Market Debt Fund USD 270 345 Jupiter Merian Global Equity Absolute Return Fund USD - 21 Jupiter Strategic Absolute Return Bond Fund USD 19,104 46,919 Jupiter Europe (ex UK) Smaller Companies Fund EUR - - Jupiter Merian Global Equity Income Fund (IRL) USD 3,597 2,913 Jupiter Gold & Silver Fund USD - - Merian Compass Portfolio 2^ USD - - Merian Compass Portfolio 3^ USD - 4,878 Merian Compass Portfolio 4^ USD - 3,330 Merian Compass Portfolio 5^ USD - 541 Jupiter Financials Contingent Capital Fund USD 81 83
Company Level USD 119,277 176,856
Net Asset Value Reconciliation
Quoted financial assets at fair value through profit or loss are valued at bid price at close of business on the last trading date rather than mid-market price which is taken at 2pm for European markets and at previous day close for U.S. markets for the purposes of the dealing NAV. A reconciliation between the dealing NAV and reporting NAV is required for the Sub-Funds outlined below.
Jupiter Gold & Silver Fund
USD Dealing NAV 1,000,666,964
Last traded price adjustment (128,646)
Reporting NAV 1,000,538,318
Net Asset Value per Share Reconciliation
The NAV per share impact of the dealing NAV and reporting NAV for the largest share class is outlined below:
Jupiter Gold & Silver Fund
Class U1 (GBP) Dealing NAV per share for the largest share class 21.910
Last traded price adjustment (0.115)
Reporting NAV per share for the largest share class 21.795

Jupiter Asset Management Series Plc Annual Report and Audited Financial Statements for the financial year ended 31 December 2020
Supplementary Information (unaudited) (continued)
413
Net Asset Value per Share
Share Class Net Assets per Share
as at 31 December 2020 Net Assets per Share
as at 31 December 2019 Net Assets per Share
as at 31 December 2018
Jupiter China Equity Fund Class A (USD) USD 75.478 USD 57.439 USD 48.651
Class B (USD) USD 35.701 USD 27.468 USD 23.505
Class C (USD) USD 32.440 USD 25.061 USD 21.543
Class C2 (USD) USD 18.226 USD 14.051 USD 12.028
Class I (USD) USD 15.199 USD 11.475 USD 9.637
Class S (GBP) GBP 28.242 GBP 22.093 GBP 19.259
Class U1 (GBP) GBP 20.821 GBP 16.245 GBP 14.136
Merian Global Strategic Bond Fund (IRL)* Class A (EUR) Hedged EUR - EUR - EUR 10.098
Class A (GBP) Income GBP - GBP - GBP 9.452
Class A (USD) USD - USD - USD 1.797
Class A (USD) Income USD - USD - USD 7.544
Class B (USD) USD - USD - USD 12.501
Class B (USD) Income USD - USD - USD 7.314
Class C (USD) USD - USD - USD 12.714
Class S (GBP) Income GBP - GBP - GBP 9.825
Class U1 (GBP) Income GBP - GBP - GBP 10.827
Jupiter Merian World Equity Fund Class A (EUR) EUR 15.417 EUR 14.628 EUR 11.905
Class A (EUR) Hedged EUR 14.277 EUR 12.663 EUR 10.845
Class A (USD) USD 2.031 USD 1.763 USD 1.463
Class B (USD) USD 28.155 USD 24.717 USD 20.768
Class C (USD) USD 27.070 USD 23.860 USD 20.111
Class C2 (USD) USD 14.562 USD 12.783 USD 10.737
Class I (EUR) EUR 16.750 EUR 15.774 EUR 12.741
Class I (USD) USD 21.793 USD 18.775 USD 15.469
Class N (USD) USD - USD - USD 9.014
Class S (GBP) GBP 29.506 GBP 26.335 GBP 22.506
Class U1 (GBP) GBP 19.518 GBP 17.368 GBP 14.800
Jupiter Pacific Equity Fund Class A (EUR) EUR 44.273 EUR 38.285 EUR 32.323
Class A (USD) USD 4.986 USD 3.945 USD 3.397
Class B (USD) USD 49.350 USD 39.497 USD 34.403
Class C (USD) USD 47.208 USD 37.937 USD 33.177
Class C2 (USD) USD 14.056 USD 11.337 USD 9.872
Class I (USD) USD 16.538 USD 12.986 USD 11.099
Class R (GBP) GBP 19.638 GBP 15.931 GBP 14.086
Class S (GBP) GBP 23.841 GBP 19.390 GBP 17.190
Class U1 (GBP) GBP 16.547 GBP 13.413 GBP 11.851
Merian European Equity Fund
Class A (EUR) EUR 0.928 EUR 0.938 EUR 0.760
Class A (GBP) GBP 10.727 GBP 10.260 GBP -
Class A (USD) USD 20.863 USD 19.294 USD 15.939
Class A (USD) Hedged USD - USD 11.035 USD -
Class B (USD) USD 17.137 USD 16.027 USD 13.431
Class C (USD) USD 16.471 USD 15.534 USD 13.054
Class I (EUR) EUR 10.928 EUR 10.972 EUR -

Jupiter Asset Management Series Plc Annual Report and Audited Financial Statements for the financial year ended 31 December 2020
Supplementary Information (unaudited) (continued)
414
Net Asset Value per Share (continued)
Share Class Net Assets per Share
as at 31 December 2020 Net Assets per Share
as at 31 December 2019 Net Assets per Share
as at 31 December 2018
Merian European Equity Fund (continued)
Class R (GBP) GBP 10.972 GBP 10.410 GBP -
Class S (GBP) GBP 18.971 GBP 18.038 GBP 15.342
Class U1 (GBP) GBP 13.034 GBP 12.353 GBP 10.473
Class U2 (GBP) GBP 10.839 GBP 10.291 GBP -
Jupiter Merian US Equity Income Fund
Class A (EUR) EUR 23.699 EUR 22.906 EUR 18.578
Class A (EUR) Hedged EUR 18.086 EUR 16.385 EUR 14.003
Class A (GBP) GBP 19.490 GBP 17.831 GBP 15.270
Class A (USD) USD 36.160 USD 31.942 USD 26.427
Class A (USD) Income USD 15.380 USD 13.823 USD 11.667
Class A (USD) Income (F) USD 10.994 USD 10.194 USD -
Class B (USD) USD 25.898 USD 23.205 USD 19.471
Class B (USD) Income USD 13.646 USD 12.411 USD 10.600
Class C (USD) USD 26.874 USD 24.110 USD 20.263
Class C (USD) Income USD 13.547 USD 12.377 USD 10.621
Class C2 (USD) Income USD 12.006 USD 10.921 USD 9.348
Class C2 (USD) Income (F) USD 10.798 USD 10.114 USD -
Class I (USD) USD 29.142 USD 25.549 USD 21.003
Class I (USD) Income USD 13.798 USD 12.303 USD 10.305
Class N (USD) USD 12.225 USD 10.928 USD 9.156
Class R (GBP) GBP 17.645 GBP 16.001 GBP 13.615
Class R (GBP) Income GBP 18.306 GBP 16.872 GBP 14.618
Class S (GBP) GBP 22.338 GBP 20.287 GBP 17.271
Class U1 (GBP) GBP 17.469 GBP 15.828 GBP 13.457
Class U1 (GBP) Income GBP 12.378 GBP 11.396 GBP 9.874
Class U2 (GBP) GBP 20.976 GBP 18.994 GBP 16.135
Class U2 (GBP) Income GBP 15.297 GBP 14.072 GBP 12.171
Jupiter Merian North American Equity Fund (IRL)
Class A (EUR) EUR 23.761 EUR 22.236 EUR 17.797
Class A (USD) USD 37.991 USD 32.522 USD 26.551
Class B (USD) USD 27.581 USD 23.893 USD 19.757
Class C (USD) USD 28.307 USD 24.605 USD 20.395
Class C2 (USD) USD 14.861 USD 12.888 USD 10.647
Class I (EUR) EUR 13.365 EUR 12.414 EUR 9.861
Class I (EUR) Hedged EUR 11.661 EUR - EUR -
Class I (USD) USD 21.229 USD 18.034 USD 14.609
Class N (USD) USD 12.243 USD 10.599 USD 8.752
Class P2 (GBP) Income GBP 13.106 GBP 11.543 GBP 9.691
Class P2 (USD) USD 13.784 USD 11.639 USD 9.374
Class P2 (USD) Income USD - USD 11.441 USD 9.352
Class R (GBP) GBP 25.093 GBP 22.044 GBP 18.492
Class R (GBP) Hedged GBP 15.897 GBP 13.878 GBP 11.464
Class S (GBP) GBP 26.281 GBP 23.142 GBP 19.457
Class U1 (GBP) GBP 20.933 GBP 18.367 GBP 15.388
Class U1 (GBP) Hedged GBP 12.564 GBP 10.950 GBP -
Class U2 (GBP) GBP 20.587 GBP 18.047 GBP 15.113

Jupiter Asset Management Series Plc Annual Report and Audited Financial Statements for the financial year ended 31 December 2020
Supplementary Information (unaudited) (continued)
415
Net Asset Value per Share (continued)
Share Class Net Assets per Share
as at 31 December 2020 Net Assets per Share
as at 31 December 2019 Net Assets per Share
as at 31 December 2018
Merian Global Dynamic Bond Fund
Class A (AUD) Hedged AUD 13.633 AUD 12.190 AUD 11.203
Class A (AUD) Hedged Income (F) AUD 11.244 AUD 10.443 AUD -
Class A (EUR) Hedged EUR 12.943 EUR 11.662 EUR 10.938
Class A (GBP) Income GBP 11.423 GBP 10.675 GBP 10.412
Class A (USD) USD 24.701 USD 21.859 USD 19.866
Class A (USD) Income USD 11.526 USD 10.417 USD 9.783
Class A (USD) Income (F) USD 11.428 USD 10.575 USD 10.049
Class A (ZAR) Hedged Income (F) ZAR 10.181 ZAR 9.391 ZAR 9.008
Class B (USD) USD 18.706 USD 16.730 USD 15.380
Class B (USD) Income USD 10.107 USD 9.230 USD 8.760
Class C (USD) USD 18.641 USD 16.748 USD 15.455
Class C (USD) Income USD 9.606 USD 8.817 USD 8.410
Class C2 (AUD) Hedged Income (F) AUD 9.879 AUD 9.298 AUD 8.999
Class C2 (USD) Income (F) USD 10.129 USD 9.477 USD 9.131
Class C2 (ZAR) Hedged Income (F) ZAR 9.942 ZAR 9.320 ZAR 8.980
Class I (USD) USD 12.550 USD 11.051 USD 9.992
Jupiter Emerging Market Debt Fund
Class A (EUR) EUR 22.056 EUR 22.880 EUR 19.280
Class A (EUR) Hedged EUR 16.739 EUR 16.188 EUR 14.331
Class A (GBP) Hedged GBP - GBP - GBP 11.315
Class A (SEK) Hedged SEK 14.433 SEK 13.960 SEK 12.354
Class A (SGD) Hedged Income SGD 7.764 SGD 7.852 SGD 7.274
Class A (USD) USD 27.332 USD 25.919 USD 22.255
Class A (USD) Income USD 8.639 USD 8.674 USD 7.965
Class A (USD) Income (F) USD 9.515 USD 9.688 USD 8.956
Class A (ZAR) Hedged Income (F) ZAR 9.250 ZAR 9.561 ZAR 8.901
Class B (USD) USD 21.000 USD 20.148 USD 17.534
Class B (USD) Income USD 8.771 USD 8.901 USD 8.263
Class C (USD) USD 20.722 USD 19.951 USD 17.420
Class C (USD) Income USD 8.973 USD 9.159 USD 8.555
Class C2 (USD) Income (F) USD 9.198 USD 9.506 USD 8.893
Class C2 (ZAR) Hedged Income (F) ZAR 9.068 ZAR 9.398 ZAR 8.793
Class I (USD) USD 11.925 USD 11.222 USD 9.567
Class S (GBP) Income GBP 9.819 GBP 10.202 GBP 9.661
Class U1 (GBP) Income GBP 10.903 GBP 11.282 GBP 10.646
Merian European Best Ideas Fund^^
Class A (EUR) GBP - EUR - EUR 15.311
Class A (GBP) GBP - GBP - GBP 16.602
Class A (GBP) Income USD - GBP - GBP -
Class A (USD) USD - USD - USD 10.865
Class A (USD) Hedged USD - USD - USD 9.180
Class C (USD) USD - USD - USD 12.336
Class C2 (USD) Hedged EUR - USD - USD 9.523
Class I (EUR) EUR - EUR - EUR 13.540

Jupiter Asset Management Series Plc Annual Report and Audited Financial Statements for the financial year ended 31 December 2020
Supplementary Information (unaudited) (continued)
416
Net Asset Value per Share (continued)
Share Class Net Assets per Share
as at 31 December 2020 Net Assets per Share
as at 31 December 2019 Net Assets per Share
as at 31 December 2018
Merian European Best Ideas Fund^^ (continued)
Class U1 (GBP) GBP - GBP - GBP 11.908
Class U2 (GBP) GBP - GBP - GBP 12.184
Class U2 (GBP) Income GBP - GBP - GBP -
Merian Investment Grade Corporate Bond Fund***
Class A (GBP) Hedged Income GBP - GBP - GBP 8.984
Class A (SEK) Hedged SEK - SEK - SEK 12.723
Class A (USD) USD - USD - USD 12.451
Class A (USD) Income USD - USD - USD 9.518
Class C (USD) USD - USD - USD 11.137
Class I (USD) USD - USD - USD 9.801
Class S (GBP) Hedged Income GBP - GBP - GBP 9.647
Class U1 (GBP) Hedged Income GBP - GBP - GBP 8.981
Class U2 (GBP) Hedged GBP - GBP - GBP 10.860
Jupiter Global Emerging Markets Focus Fund
Class A (EUR) EUR 18.585 EUR 16.603 EUR 13.405
Class A (GBP) GBP 17.271 GBP 14.585 GBP 12.423
Class A (USD) USD 16.831 USD 13.777 USD 11.363
Class B (USD) USD 14.664 USD 12.128 USD 10.108
Class C (USD) USD 12.360 USD 10.318 USD 8.662
Class C2 (USD) USD 15.636 USD 12.933 USD 10.776
Class I (USD) USD 15.925 USD 12.918 USD 10.560
Class R (GBP) GBP 18.344 GBP 15.384 GBP 13.018
Class S (GBP) GBP 18.963 GBP 15.939 GBP 13.515
Class U1 (GBP) GBP 17.087 GBP 14.327 GBP 12.121
Class U2 (GBP) GBP 20.774 GBP 17.386 GBP 14.679
Merian Asian Equity Income Fund
Class A (EUR) EUR 13.596 EUR 12.888 EUR 11.061
Class A (GBP) GBP 14.119 GBP 12.725 GBP 11.511
Class A (GBP) Income GBP - GBP - GBP 10.648
Class A (USD) USD 11.900 USD 10.293 USD 9.002
Class A (USD) Income USD 11.651 USD 10.500 USD 9.541
Class A (USD) Income (F) USD 10.590 USD 9.729 USD -
Class B (USD) USD 12.465 USD 10.944 USD 9.685
Class C (USD) USD 10.961 USD 9.699 USD 8.643
Class C2 (USD) Income (F) USD 10.669 USD 9.900 USD 9.355
Class I (EUR) EUR 11.676 EUR 10.955 EUR 9.332
Class I (USD) USD 14.251 USD 12.234 USD 10.620
Class R (GBP) GBP 13.855 GBP 12.290 GBP 11.049
Class U1 (GBP) GBP 15.390 GBP 13.641 GBP 12.256
Class U1 (GBP) Income GBP 12.701 GBP 11.616 GBP 10.813
Class U2 (GBP) Income GBP 12.280 GBP 11.239 GBP 10.442
Jupiter Local Currency Emerging Market Debt Fund
Class A (AUD) Hedged Income (F) AUD 7.910 AUD 8.570 AUD 8.242
Class A (EUR) EUR 10.704 EUR 11.576 EUR 9.988
Class A (GBP) Income GBP 6.032 GBP 6.585 GBP 6.510
Class A (USD) USD 9.420 USD 9.323 USD 8.215

Jupiter Asset Management Series Plc Annual Report and Audited Financial Statements for the financial year ended 31 December 2020
Supplementary Information (unaudited) (continued)
417
Net Asset Value per Share (continued)
Share Class Net Assets per Share
as at 31 December 2020 Net Assets per Share
as at 31 December 2019 Net Assets per Share
as at 31 December 2018
Jupiter Local Currency Emerging Market Debt Fund (continued)
Class A (USD) Income USD 5.432 USD 5.708 USD 5.447
Class A (USD) Income (F) USD 8.239 USD 8.818 USD 8.418
Class A (ZAR) Hedged Income (F) ZAR 7.778 ZAR 8.443 ZAR 8.134
Class B (AUD) Hedged Income (F) AUD 7.672 AUD 8.396 AUD 8.141
Class B (USD) Income USD 5.278 USD 5.605 USD 5.405
Class B (ZAR) Hedged Income (F) ZAR 7.553 ZAR 8.288 ZAR 8.065
Class C (USD) USD 8.535 USD 8.569 USD 7.649
Class C (USD) Income USD 4.298 USD 4.587 USD 4.445
Class C2 (AUD) Hedged Income (F) AUD 7.597 AUD 8.393 AUD 8.146
Class C2 (USD) Income (F) USD 8.377 USD 9.074 USD 8.752
Class C2 (ZAR) Hedged Income (F) ZAR 7.461 ZAR 8.251 ZAR 8.036
Class I (USD) USD 10.481 USD 10.269 USD 8.951
Class U1 (GBP) Income GBP 8.341 GBP 9.020 GBP 8.846
Class U2 (GBP) GBP 13.042 GBP 13.190 GBP 11.893
Class U2 (GBP) Income GBP - GBP 9.241 GBP 9.033
Jupiter UK Alpha Fund (IRL)
Class A (EUR) EUR 10.467 EUR 12.187 EUR 9.473
Class A (GBP) GBP 11.763 GBP 12.944 GBP 10.614
Class A (GBP) Income GBP 9.392 GBP 10.610 GBP 9.071
Class A (USD) USD 10.074 USD 10.730 USD 8.507
Class A (USD) Hedged USD 13.237 USD 14.295 USD 11.536
Class I (EUR) EUR 9.116 EUR 10.533 EUR 8.135
Class I (USD) USD 10.438 USD 11.032 USD 8.688
Class I (USD) Hedged USD 13.478 USD 14.459 USD 11.575
Class R (GBP) GBP 13.157 GBP 14.368 GBP 11.693
Class R (GBP) Income GBP 10.291 GBP 11.538 GBP 9.790
Class U1 (GBP) GBP 13.021 GBP 14.209 GBP 11.555
Class U1 (GBP) Income GBP 10.396 GBP 11.647 GBP 9.875
Class U1 (USD) USD 10.762 USD 11.365 USD 8.932
Class U2 (GBP) GBP 12.955 GBP 14.125 GBP 11.478
Class U2 (GBP) Income GBP 10.954 GBP 12.264 GBP 10.391
Class U2 (USD) USD 10.708 USD 11.300 USD 8.875
Jupiter UK Smaller Companies Focus Fund
Class A (GBP) Income GBP 20.280 GBP 18.312 GBP 14.320
Class R (GBP) Income GBP 3.505 GBP 3.169 GBP 2.459
Class U1 (GBP) Income GBP 23.461 GBP 21.229 GBP 16.464
Jupiter UK Dynamic Equity Fund
Class A (GBP) Income GBP 5.596 GBP 5.260 GBP 3.988
Class I (EUR) Hedged EUR 5.627 EUR 5.196 EUR 3.965
Class R (GBP) Income GBP 5.766 GBP 5.440 GBP 4.129
Jupiter Merian Global Equity Absolute Return Fund
Class A (CHF) Hedged CHF 8.393 CHF 8.760 CHF 10.336
Class A (EUR) Hedged EUR 1.091 EUR 1.137 EUR 1.336
Class A (GBP) Hedged GBP 1.293 GBP 1.338 GBP 1.552
Class A (RMB) Hedged RMB 12.108 RMB 12.233 RMB 13.881

Jupiter Asset Management Series Plc Annual Report and Audited Financial Statements for the financial year ended 31 December 2020
Supplementary Information (unaudited) (continued)
418
Net Asset Value per Share (continued)
Share Class Net Assets per Share
as at 31 December 2020 Net Assets per Share
as at 31 December 2019 Net Assets per Share
as at 31 December 2018
Jupiter Merian Global Equity Absolute Return Fund (continued)
Class A (SGD) Hedged SGD 9.829 SGD 10.122 SGD 11.612
Class A (USD) USD 1.080 USD 1.108 USD 1.262
Class A2 (CHF) Hedged CHF 8.038 CHF 8.398 CHF 9.913
Class C (USD) USD 9.020 USD 9.392 USD 10.862
Class I (CHF) Hedged CHF 8.542 CHF 8.850 CHF 10.371
Class I (EUR) Hedged EUR 1.331 EUR 1.376 EUR 1.606
Class I (SEK) Hedged SEK 9.741 SEK 9.771 SEK 11.371
Class I (USD) USD 1.481 USD 1.508 USD 1.705
Class R (GBP) Hedged GBP 1.413 GBP 1.451 GBP 1.671
Class U1 (GBP) Hedged GBP 0.983 GBP 1.009 GBP 1.161
Class U2 (GBP) Hedged GBP 1.012 GBP 1.038 GBP 1.192
Jupiter Strategic Absolute Return Bond Fund
Class A (EUR) Hedged EUR 10.739 EUR 9.967 EUR 9.530
Class A (GBP) Hedged GBP 11.193 GBP 10.337 GBP 9.788
Class A (USD) USD 11.600 USD 10.605 USD 9.867
Class F1 (USD) USD - USD - USD 1.058
Class F2 (GBP) Hedged GBP 1.188 GBP 1.084 GBP 1.021
Class F2 (GBP) Hedged Income GBP 1.028 GBP 0.950 GBP 0.914
Class I (EUR) Hedged EUR 10.960 EUR 10.210 EUR 9.747
Class I (USD) USD 11.591 USD 10.575 USD 9.795
Class R (GBP) Hedged GBP 11.120 GBP 10.268 GBP 9.675
Class U1 (GBP) Hedged GBP 11.134 GBP 10.249 GBP 9.664
Class U3 (EUR) Hedged EUR 11.050 EUR 10.222 EUR 9.749
Class U3 (GBP) Hedged GBP 11.297 GBP 10.398 GBP 9.808
Class U3 (USD) USD 11.737 USD 10.683 USD 9.892
Jupiter Europe (ex UK) Smaller Companies Fund
Class A (EUR) EUR 15.265 EUR 15.134 EUR 11.910
Class A (GBP) GBP 16.376 GBP 15.345 GBP 12.744
Class A (USD) USD 12.592 USD 11.418 USD 9.165
Class A (USD) Hedged USD 10.387 USD 10.153 USD 7.758
Class C (USD) Hedged USD 10.083 USD 10.036 USD 7.786
Class I (EUR) EUR 16.062 EUR 15.847 EUR 12.364
Class I (USD) USD 10.182 USD 9.177 USD 7.306
Class I (USD) Hedged USD 10.628 USD 10.314 USD 7.804
Class R (GBP) GBP 18.381 GBP 17.094 GBP 14.094
Class R (GBP) Hedged GBP 15.693 GBP 15.505 GBP 11.983
Class R (GBP) Income GBP 15.995 GBP 15.197 GBP 12.866
Class U1 (EUR) Income EUR 11.572 EUR 11.631 EUR 9.310
Class U1 (GBP) GBP 18.410 GBP 17.195 GBP 14.148
Class U1 (GBP) Hedged GBP 16.321 GBP 16.146 GBP 12.471
Class U1 (GBP) Income GBP 16.337 GBP 15.510 GBP 13.080
Class U2 (GBP) GBP 18.575 GBP 17.377 GBP 14.283
Jupiter Merian Global Equity Income Fund (IRL)
Class A (GBP) GBP - GBP - GBP 14.234
Class A (GBP) Income GBP 15.110 GBP 14.563 GBP 13.039
Class A (USD) USD - USD 10.519 USD 8.808

Jupiter Asset Management Series Plc Annual Report and Audited Financial Statements for the financial year ended 31 December 2020
Supplementary Information (unaudited) (continued)
419
Net Asset Value per Share (continued)
Share Class Net Assets per Share
as at 31 December 2020 Net Assets per Share
as at 31 December 2019 Net Assets per Share
as at 31 December 2018
Jupiter Merian Global Equity Income Fund (IRL) (continued)
Class A (USD) Income USD 13.182 USD 12.303 USD 10.653
Class I (EUR) EUR 12.402 EUR 12.234 EUR 9.968
Class I (EUR) Income EUR 10.433 EUR 10.558 EUR 8.869
Class I (USD) Income USD 12.470 USD 11.545 USD 9.918
Class R (GBP) GBP 18.175 GBP 16.961 GBP 14.597
Class R (GBP) Income GBP 15.772 GBP 15.086 GBP 13.405
Class S (GBP) GBP 18.063 GBP 16.884 GBP 14.551
Class U1 (GBP) GBP 18.250 GBP 17.017 GBP 14.638
Class U1 (GBP) Income GBP 15.697 GBP 15.016 GBP 13.343
Jupiter Gold & Silver Fund
Class A (EUR) EUR 11.627 EUR 9.099 EUR 6.337
Class A (GBP) GBP 20.887 GBP 15.449 GBP 11.359
Class A (SGD) Hedged SGD 10.771 SGD - SGD -
Class A (USD) USD 20.100 USD 14.384 USD 10.218
Class C (USD) USD 14.040 USD 10.202 USD 7.360
Class I (EUR) EUR 18.650 EUR 14.484 EUR 10.015
Class I (USD) USD 20.869 USD 14.820 USD 10.448
Class R (GBP) GBP 21.693 GBP 15.923 GBP 11.617
Class U1 (GBP) GBP 21.795 GBP 15.983 GBP 11.650
Class U2 (GBP) GBP 21.888 GBP 16.038 GBP 11.680
Class U3 (GBP) GBP 19.728 GBP 14.731 GBP 10.908
Merian Compass Portfolio 2^
Class A (AUD) Hedged AUD - AUD - AUD 9.968
Class A (EUR) Hedged EUR - EUR - EUR 9.382
Class A (GBP) Hedged GBP - GBP - GBP 9.625
Class A (SGD) Hedged SGD - SGD - SGD 9.845
Class A (USD) USD - USD - USD 10.015
Merian Compass Portfolio 3^
Class A (AUD) Hedged AUD - AUD - AUD 10.156
Class A (EUR) Hedged EUR - EUR - EUR 9.595
Class A (GBP) Hedged GBP - GBP - GBP 9.824
Class A (SGD) Hedged SGD - SGD - SGD 10.075
Class A (USD) USD - USD - USD 10.256
Class N (GBP) Hedged GBP - GBP - GBP 9.280
Class N (SGD) Hedged SGD - SGD - SGD 9.414
Class N (USD) USD - USD - USD 9.208
Merian Compass Portfolio 4^
Class A (AUD) Hedged AUD - AUD - AUD 10.365
Class A (EUR) Hedged EUR - EUR - EUR 9.829
Class A (GBP) Hedged GBP - GBP - GBP 10.032
Class A (SGD) Hedged SGD - SGD - SGD 10.313
Class A (USD) USD - USD - USD 10.526
Class N (GBP) Hedged GBP - GBP - GBP 9.191
Class N (SGD) Hedged SGD - SGD - SGD 9.338
Class N (USD) USD - USD - USD 8.922

Jupiter Asset Management Series Plc Annual Report and Audited Financial Statements for the financial year ended 31 December 2020
Supplementary Information (unaudited) (continued)
420
Net Asset Value per Share (continued)
Share Class Net Assets per Share
as at 31 December 2020 Net Assets per Share
as at 31 December 2019 Net Assets per Share
as at 31 December 2018
Merian Compass Portfolio 5^
Class A (AUD) Hedged AUD - AUD - AUD 10.680
Class A (EUR) Hedged EUR - EUR - EUR 10.128
Class A (GBP) Hedged GBP - GBP - GBP 10.317
Class A (SGD) Hedged SGD - SGD - SGD 10.593
Class A (USD) USD - USD - USD 10.853
Jupiter UK Specialist Equity Fund
Class A (EUR) Hedged EUR - EUR 11.444 EUR 10.863
Class A (GBP) GBP 14.054 GBP 12.350 GBP 11.548
Class A (USD) Hedged USD 14.795 USD 12.945 USD 11.937
Class F (EUR) Hedged EUR 13.928 EUR 12.189 EUR 11.481
Class F (GBP) GBP 14.542 GBP 12.729 GBP 11.811
Class F (USD) Hedged USD 15.027 USD 13.015 USD 11.931
Class I (EUR) Hedged EUR 13.478 EUR 11.821 EUR 11.160
Class I (USD) Hedged USD 14.533 USD 12.674 USD 11.640
Class R (GBP) GBP 14.347 GBP 12.591 GBP 11.713
Class X (GBP) GBP 16.488 GBP 13.884 GBP 12.788
Merian Style Premia Absolute Return Fund**
Class F (GBP) Hedged GBP - GBP - GBP 9.471
Class F (USD) USD - USD - USD 9.779
Class F2 (GBP) Hedged GBP - GBP - GBP 9.475
Class F2 (USD) USD - USD - USD 9.763
Class I (USD) USD - USD - USD 9.607
Class X (GBP) Hedged GBP - GBP - GBP 9.547
Jupiter Financials Contingent Capital Fund
Class A (EUR) Hedged EUR 10.850 EUR 10.380 EUR -
Class A (EUR) Hedged Income EUR 10.162 EUR 10.315 EUR -
Class A (USD) USD 12.774 USD 11.962 USD 9.836
Class A (USD) Income USD 10.347 USD 10.281 USD 8.973
Class C (USD) USD 12.118 USD 11.521 USD 9.619
Class F (EUR) Hedged Income EUR 10.451 EUR 10.489 EUR -
Class F (GBP) Hedged Income GBP 10.232 GBP 10.306 GBP 9.064
Class F (USD) Income USD 10.935 USD 10.747 USD 9.276
Class I (CHF) Hedged CHF 10.789 CHF 10.256 CHF -
Class I (EUR) Hedged EUR 12.586 EUR 11.961 EUR -
Class I (EUR) Hedged Income EUR 10.411 EUR 10.485 EUR -
Class I (USD) USD 12.763 USD 11.862 USD 9.682
Class I (USD) Income USD 10.829 USD 10.681 USD 9.252
Class R (GBP) Hedged GBP 12.194 GBP 11.641 GBP 9.693

Jupiter Asset Management Series Plc Annual Report and Audited Financial Statements for the financial year ended 31 December 2020
Supplementary Information (unaudited) (continued)
421
Investments in Investment Funds Jurisdiction Management Performance Subscription Redemption
Underlying Sub-Funds of Sub-Funds Manager Fee % Fee % Fee % Fee %
Jupiter Asset Management Series PLC - Jupiter Emerging Market Debt Fund (UCITS) Ireland Merian Global Investors UK Ltd 0.75% N.A. - - Jupiter Asset Management Series PLC - Jupiter Financials Contingent Capital Fund (UCITS) Ireland Merian Global Investors UK Ltd 0.40% N.A. N.A. N.A. Jupiter Asset Management Series PLC - Jupiter Local Currency Emerging Market Debt Fund (UCITS) Ireland Merian Global Investors UK Ltd 0.85% N.A. - -
Quadriga Investors - Igneo Fund (UCITS) Luxembourg Quadriga Asset Managers Sgiic SA 1.50% N.A. - -
Sprott Physical Gold and Silver Trust (AIF) Canada Sprott Asset Management LP N.A. N.A. N.A. N.A. Sprott Physical Gold Trust (AIF) Canada Sprott Asset Management LP 0.35% N.A. - - Sprott Physical Silver Trust (AIF) Canada Sprott Asset Management LP 0.00% N.A. - -

Jupiter Asset Management Series Plc Annual Report and Audited Financial Statements for the financial year ended 31 December 2020
Supplementary Information (unaudited) (continued) Remuneration Policy
422
The Company Jupiter Asset Management Series Plc (the “Company”) is authorised by the Central Bank of Ireland (the "Central Bank") as an Undertaking for Collective Investment in Transferable Securities (“UCITS”) pursuant to the European Communities (Undertakings for Collective Investment in Transferable Securities) amended, consolidated or substituted from time to time (the “UCITS Regulations”). The Company is managed by Jupiter Asset Management (Europe) Limited (the “Manager”). The Manager is authorised and regulated as both an UCITS Management Company and as Alternative Investment Fund Manager (“AIFM”), effective 29 November 2018. The Manager’s affairs are supervised by its Board of Directors. The Company’s affairs are supervised by its Board of Directors. For details on each of the Directors please refer to the Prospectus of the Company. 1. The Policy
The Manager has established a remuneration policy in accordance with the requirements of the Directive (Directive
2009/65/EC), as amended (the “UCITS Directive”) to the extent that is appropriate to its size, internal organisation and the
nature, scope and complexity of its activities.
The remuneration policy applies to certain identified staff whose professional activities have a material impact on the risk
profile of the relevant entity.
It is the Manager’s policy to maintain remuneration arrangements that (i) are consistent with and promote sound and
effective risk management, (ii) do not encourage risk-taking that is inconsistent with the risk profile of the Manager, (iii) do
not impair compliance with the Manager’s duty to act in the best interests of its shareholders and (iv) are consistent with
the principles outlined in the remuneration policy. The Manager’s remuneration policy is designed to ensure that any
relevant conflicts of interest can be managed appropriately at all times.
The remuneration policy of the Manager is adopted by the non-executive members of the Board of Directors in their
supervisory function, who have expertise in risk management and remuneration and any revisions to the remuneration
policy require approval of such members. As at 31 December 2020 the Company did not have any employees and the
Manager’s remuneration policy applies only to the members of the Company’s management body (i.e. Board of Directors).
The remuneration policy of the Manager is reviewed on an annual basis by the members of the Board of Directors in their
supervisory function, who have expertise in risk management and remuneration. Following the review of the remuneration
policy of the Manager, no material changes were identified.
As at 31 December 2020, the Manager had 12 employees (including the Board of Directors) and the Manager’s remuneration
policy applies only to members of the Manager’s management body (i.e. Board of Directors) and staff whose professional
activities have a material impact on the risk profile of the Manager (together “Identified Staff”).
The remuneration policy is subjected to central and independent review at least annually to ensure compliance with and adherence to the policy. The remuneration policy of the Manager was put in place to coincide with the Manager’s authorisation as a UCITS management company pursuant to the UCITS Regulations on 29 November 2018.

Jupiter Asset Management Series Plc Annual Report and Audited Financial Statements for the financial year ended 31 December 2020
Supplementary Information (unaudited) (continued) Remuneration Policy (continued)
423
2. Persons subject to the Policy
The Manager will apply the provisions of the policy for its ‘Identified Staff’ being “those categories of staff, including senior management, risk takers, control functions and any employee receiving total remuneration that falls within the remuneration bracket of senior management and risk takers whose professional activities have a material impact on the risk profiles of the management company or of the UCITS that they manage”. The Manager has determined that the following staff members would fall within the definition of “Identified staff”, as applicable: - Members of the Board of Directors of the Company - Designated Persons responsible for the monitoring of certain management functions. Pursuant to the ESMA Guidelines, the UCITS remuneration principles are not required to be applied to delegates performing investment management functions when such delegates are subject to regulatory requirements on remuneration that are "equally as effective" as the UCITS remuneration principles. It is noted that the ESMA Guidelines provide that entities that are subject to the remuneration rules under AIFMD or MiFID/CRD IV (Directive 2013/36/EU) can be considered to meet this condition. Based on prior guidance issued by the Central Bank on the corresponding and identical requirement in the context of the AIFMD remuneration principles and in the absence of further specific guidance or legal clarification from the European Commission, ESMA or the Central Bank in the context of the UCITS remuneration requirements, the Fund considers that the following categories of delegate entities also meet this condition: (i) CRD/MiFID firms (including firms still subject to CRD III and which have availed of the CRD IV exemptions); and
(ii) non-EU firms which are subject to group remuneration policies that are equally as effective as MiFID or CRD. This approach will be reviewed and reassessed, as necessary for subsequent financial periods following the issuance of any further regulatory guidance or legal clarification that conflicts with this current position.
3. Remuneration of Identified Staff
With the exception of those Company Directors who are employed by Jupiter Asset Management Limited (the “Investment Manager”), Jupiter Asset Management (the sub-distributor) and Jupiter Asset Management (Europe) Limited (the Manager and Distributer) or any other group company, the Company’s Directors accept a fee in accordance with the Company’s Articles of Association and as outlined in the ‘Directors’ Fees’ section of the Prospectus. This is a fixed fee with no variable component. Any remaining Director, who is employed by the Investment Manager or the Manager or any other group company, will waive this fee. The Directors of the Company receive a fixed fee only and do not receive performance-based remuneration, thereby avoiding a potential conflict of interest. The basic fee of a Board member is set at a level that is on par with the rest of the market and reflects the qualifications and contribution required in view of the Company’s complexity, the extent of the responsibilities and the number of board meetings. No pension contributions are payable on Board members’ fees for the year ending 31 December 2020.

Jupiter Asset Management Series Plc Annual Report and Audited Financial Statements for the financial year ended 31 December 2020
Supplementary Information (unaudited) (continued) Remuneration Policy (continued)
424
3. Remuneration of Identified Staff (continued)
Designated Persons
Jupiter Asset Management (Europe) Limited as Manager and Distributor of the Company has six Identified Staff. Directors who are employees of the Manager or any other group company are not paid any fees for their services as Directors.
4. Proportionality Principle
As noted above, the Manager must comply with the UCITS Directive remuneration principles in a way and to the extent that is appropriate to their size, their internal organisation and the nature scope and complexity of their activities. The Company does not pay any variable remuneration to any of its Identified Staff. Accordingly, the principles in respect of variable remuneration as outlined in the UCITS Directive are not applicable for the Company. The Manager’s variable remuneration policy is linked to the achievement of business objectives, to deliver performance in the best interests of clients and in line with all regulatory requirements as well as individual performance as measured in employees’ annual appraisal. The variable remuneration scheme allows the Manager to pay no variable remuneration if it is believed that the employee has taken excessive risks. With respect to the remuneration committee, the Board of the Company and the Board of the Manager has determined the remuneration committee requirement does not apply taking into account the below factors: (a) all of the above proportionality criteria (i.e. the size, internal organisation nature, the scope and complexity of its
activities); and (b) Article 14b(4) of UCITS V outlines a remuneration committee will be, where appropriate, set up in accordance with the
ESMA. As detailed in the Manager’s remuneration policy, the Manager has dis-applied the Pay-out Process Rules in relation to its UCITS business on grounds of proportionality.
5. Disclosure
The general principles of the Manager’s remuneration policy and the specific provisions for Identified Staff are disclosed internally and documented in the remuneration policy.
Total remuneration for identified staff for provision of services to the Company for the period from 1 January 2020 to 31 December 2020: Fixed remuneration* USD 535,664 Variable remuneration* USD 99,969 Number of beneficiaries 11 *Excludes VAT where applicable

Jupiter Asset Management Series Plc Annual Report and Audited Financial Statements for the financial year ended 31 December 2020
Supplementary Information (unaudited) (continued) Securities Financing Transactions Regulations
425
The following disclosure follows the requirements of EU Securities Financing Transactions Regulation (“SFTR”) which came into effect on 12 January 2016. A Securities Financing Transaction (“SFT”) is defined as per Article 3(11) of the SFTR as:
a repurchase transaction;
securities or commodities lending and securities or commodities borrowing;
a buy-sell back transaction or sell-buy back transaction; or
a margin lending transaction. There were no securities and commodities on loan as a proportion of total lendable assets (excluding cash and cash equivalents) as at 31 December 2020. In addition, no SFTs were held by any of the Sub-Funds as at 31 December 2020.