just add water! quick wins on energy efficiency in wastewater treatment ... · industrial...
TRANSCRIPT

Click To Edit Master Title Style
Just Add Water! Quick Wins on Energy Efficiency in Wastewater Treatment Plants
May 16, 2017 11:15 am – 12:30 pm

Panelists
John Smegal (Moderator), U.S. DOE, Advanced Manufacturing Office
Jim Newton, Kent County Delaware, Public Works Department
Glenn Cunningham, Tennessee Tech University Industrial Assessment Center
2

John Smegal, Moderator U.S. Department of Energy, Advanced Manufacturing Office

Industrial Assessment Centers Energy Efficiency in Wastewater Treatment Plants
John Smegal, Advanced Manufacturing Office May 16, 2017

5
IAC Program Overview • The IAC program focuses on generating energy savings, productivity improvements, and water
use and wastewater reductions at small and medium-sized manufacturers • The program also provides significant workforce development benefits
Approach • Center Directors are typically tenured engineering faculty interested in practical applications
– Mentor and evaluate student performance on assessments
• Assessments are a teaching tool and the backbone of the real-world IAC experience – Normally consists of a one day site visit at an industrial plant
• Assessment reports (60 days) and implementation follow-up (9 – 12 months)
Results • Average identified savings opportunities are
approximately $140,000 annually • IAC clients typically saves more than $47,000 per year • Costs to DOE are less than one-fourth of energy savings
− Savings do not account for persistence
− Savings do not account for activities associated with IAC graduates

6
IAC Assessments
• IACs typically focus on serving small and medium-sized manufacturers – More than 17,500 assessments conducted – More than 133,000 energy savings recommendations made
• Each year, IACs have conducted a limited number (1-2 per center, per year) of “non-traditional” assessments, including water supply and wastewater treatment facilities – These facilities include many industrial-type systems (e.g., motors,
pumps, fans, compressed air)
• The most recent group of IACs (FY 12 - 16) placed an increased emphasis on serving water and wastewater facilities
• Going forward, this increased emphasis will continue or grow
7
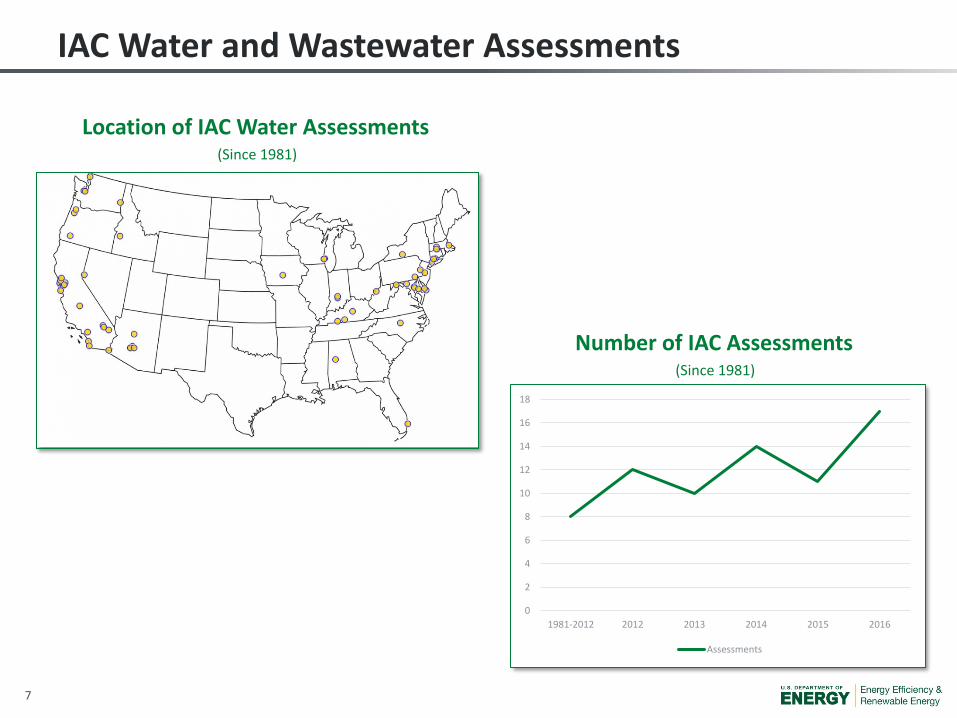
IAC Water and Wastewater Assessments
Location of IAC Water Assessments (Since 1981)
0
2
4
6
8
10
12
14
16
18
1981-2012 2012 2013 2014 2015 2016
Assessments
Number of IAC Assessments (Since 1981)

8
IAC Assessment Results: Water/Wastewater
State Assessments Recommendations Recommended Savings
AK 1 6 $111,304 AL 1 3 $245,530 AZ 6 33 $2,435,148 CA 21 150 $4,372,429 CT 4 27 $139,041 DE 2 9 $246,025 FL 1 7 $130,626 HI 2 23 $4,088,330 IA 1 6 $11,338 ID 1 6 $101,786 IN 3 23 $144,697 KY 3 13 $297,916 MA 5 21 $165,021 MD 7 51 $2,143,911 NC 1 8 $63,618 NE 1 4 $25,821 NV 1 6 $31,291 NY 1 5 $8,469 OR 3 11 $128,839 PA 4 26 $904,147 VA 2 13 112,314 WA 4 25 $732,862 WI 3 22 $293,051 WV 1 8 $80,947
TOTAL 79 506 $17,014,461

9
IAC Assessment Results: Recommendations
• Typical recommendations include: – Install equipment to use waste fuel
– Install high-efficiency lamps and ballasts
– Reduce space conditioning during off-peak hours
– Balance use of high efficiency equipment at peak times and lower efficiency equipment at off-peak times
– Install occupancy sensors
– Upgrade compressor controls
– Optimize motor and pump size
– Turn off equipment when not in use

10
IAC Assessments: Emerging Priorities
• Beginning in FY 17, newly selected IACs (28 primary, plus 6 satellites) have been specifically tasked to engage in more water/wastewater treatment assessments
– Targeting 1-2 facilities per center, per year
• DOE and the individual IACs have been actively engaging with EPA Regions and state water authorities to identify potential opportunities to conduct assessments
• IAC Field Manager, in collaboration with more experienced centers and key stakeholders will be providing training and sharing lessons learned with new centers in conducting such assessments


Jim Newton Kent County Public Works Department – Milford, DE

Jim Newton, P.E., BCEE, ENV SP Kent County Public Works
Milford, DE

Understand Where You’re At Determine Significant Energy Sources
Electricity (grid supplied, onsite generated) Natural Gas Diesel
Determine Energy Uses
Pumping Aeration Drying
Determine Baseline Energy Consumption
Total energy in from all sources Add in onsite renewables Estimate all consumption
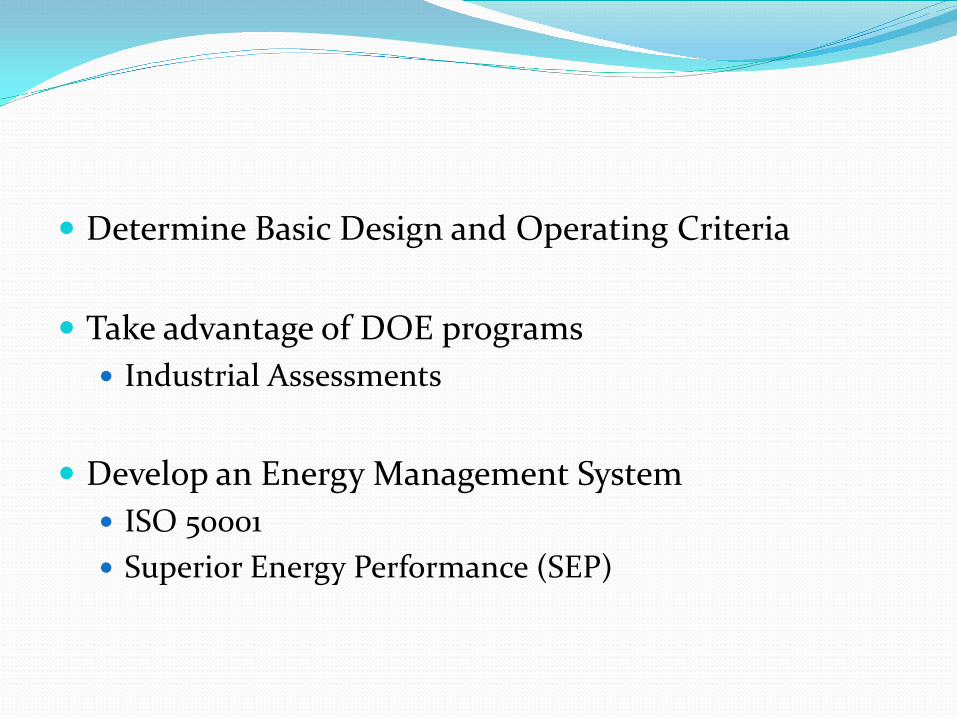
Determine Basic Design and Operating Criteria
Take advantage of DOE programs Industrial Assessments
Develop an Energy Management System
ISO 50001 Superior Energy Performance (SEP)

Begin by Making A Plan
Look at establishing an ISO 50001 Energy Management System (EnMS)
Look at incorporating DOE’s Superior Energy Performance (SEP) program
Submeter where necessary

Monitor Energy Consumption

Kent County Energy Balance

Where Can Efficiency Come From? Pumping Emergency generators Water/Wastewater
Aeration Disinfection
Biosolids Thickeners Dryers Digestion
Plant Support Systems HVAC Lighting

Pumping Variable frequency drives Operating more efficiently
Mechanical efficiency Electrical efficiency
Reducing pumping head Reducing friction losses Improving piping systems

Electric Generation Distributed generators Use digester gas

Aeration Systems Improve Oxygen Transfer
Diffusers Fine bubble diffusers
Blowers Multi-Stage Centrifugal Single-Stage Centrifugal Turbo Positive Displacement Automatic Contol
Measuring DO or N in basin

Disinfection Look at chlorination requirements
Gas, Liquid, Solid Look at dechlorination methods
Gas, Liquid, Solid UV Ozone

Biosolids Thickening Polymer addition Reduce the volume for subsequent treatment Pre-conditioning examples
Thermal hydrolysis Ozonation Ultrasound homogenization Shear milling Enzymatic hydrolysis

Biosolids Digestion Anaerobic digestion
Control temperatures Generate digester gas Add other materials
FOG Food waste Yard waste
Aerobic digestion DO controls Reducing solids concentrations

Biosolids Drying Incineration
Heat recovery CHP
Thermal drying
Drying technique Heat recovery CHP

HVAC Geothermal/Thermal energy in water

Lighting Switch to LED lights

Reference Water Environment Federation:
Energy Conservation in Water and Wastewater Facilities

Dr. Glenn Cunningham Tennessee Tech University Industrial Assessment Center

31
Better Buildings Summit Wastewater Energy Efficiency
Washington DC
May 15 – 17, 2017
Glenn T. Cunningham, PhD, P.E. IAC Director
Mechanical Engineering Department Tennessee Tech University
32
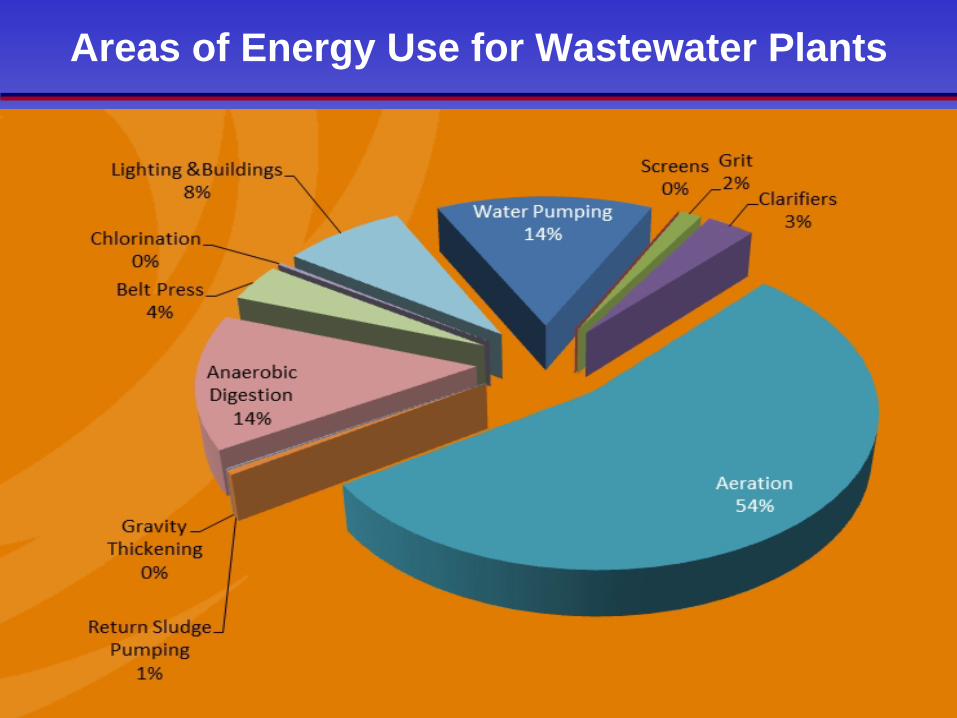
Areas of Energy Use for Wastewater Plants
33
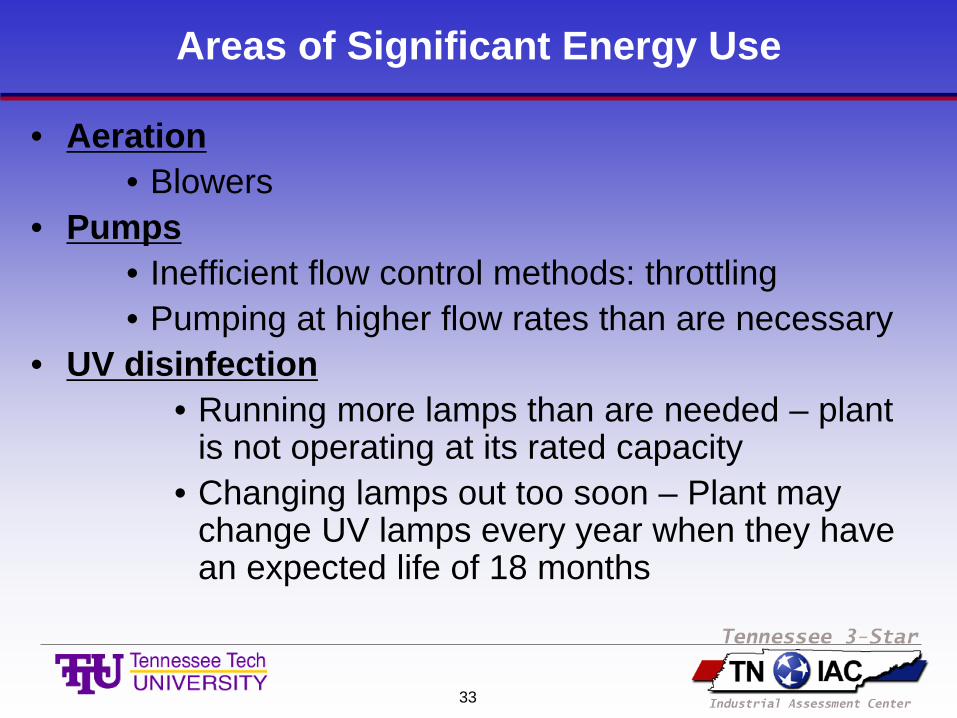
Areas of Significant Energy Use
• Aeration • Blowers
• Pumps • Inefficient flow control methods: throttling • Pumping at higher flow rates than are necessary
• UV disinfection • Running more lamps than are needed – plant
is not operating at its rated capacity • Changing lamps out too soon – Plant may
change UV lamps every year when they have an expected life of 18 months

34
Areas of Significant Energy Use
• Lighting • Turn off when not needed • Consider occupancy sensors to shut off lights when no
one is around • Convert to more efficient fixtures
• LEDs are becoming much cheaper and dependable • Combined Heat and Power
• Use biogas to generate electricity and recover heat for digestion and space heat
• HVAC • Set-back thermostats • Avoid electric resistance heat • Perform proper maintenance • Replace units when their useful life is over

35
Blowers

36
Blowers Types
• Two types of positive displacement and two types of dynamic blowers considered
• Rotary lobe blowers (PD) • Low-pressure dry screw compressor (PD) • High speed single-stage centrifugal blowers
• Inlet guide vanes • Outlet diffuser vanes • Can operate with a VFD
• High speed single-stage turbo blowers • Need a wide turndown range in blower capacity
• 4:1 to 10:1 are typical

37
Blower Control Scheme
• Operating Principles • Run the least number of blowers possible • Run the largest number of blowers in their
most efficient range • Avoid idle operation and any bleeding off of
air • Sequence the operation with longevity and
maintenance intervals in mind • Blower capacity control method is important
for efficient operation

38
Fans/Blowers
• Plants often operate at less that design loads • Determine actual BOD and operate only as
much aeration equipment as is needed • Turn off unneeded blowers • If VFDs are installed reduce blower capacity to
supply only the required air • Example: Newnan Utilities installed one VFD on
one of three 125 HP blowers serving the WWTP and saved a reported $24,000/year in electrical cost

39
Fan Laws

40
Fan Laws

41
Pumping

42
The system operating point is at the intersection of the pump and system head -capacity curves
Operating point
Flow rate
Hea
d

43
Estimating the Static Head

44
5000 4000 3000 2000 1000 0 Flow rate, gpm
30 40 50 70 60
75 80.5 (BEP)
200
150
100
50
0
Hea
d, ft
75

45
5000 4000 3000 2000 1000 0 Flow rate, gpm
30 40 50 70 60
75 80.5 (BEP)
200
150
100
50
0
Hea
d, ft
75

46
0.0
10.0
20.0
30.0
40.0
50.0
60.0
70.0
80.0
90.0
100.0
110.0
120.0
130.0
140.0
150.0
160.0
0 100 200 300 400 500 600 700 800 900 1,000 1,100 1,200 1,300 1,400 1,500 1,600 1,700 1,800 1,900 2,000 2,100 2,200 2,300 2,400 2,500
Feet
of H
ead
Flow (gpm)
Variable Speed Pumping
90% Speed
80% Speed
70% Speed
System with Valve Throttled
System with Valve Open
Operating Point Throttling Control
Operating Point VSD Control
Actual Pump Study for VSD Operation
47
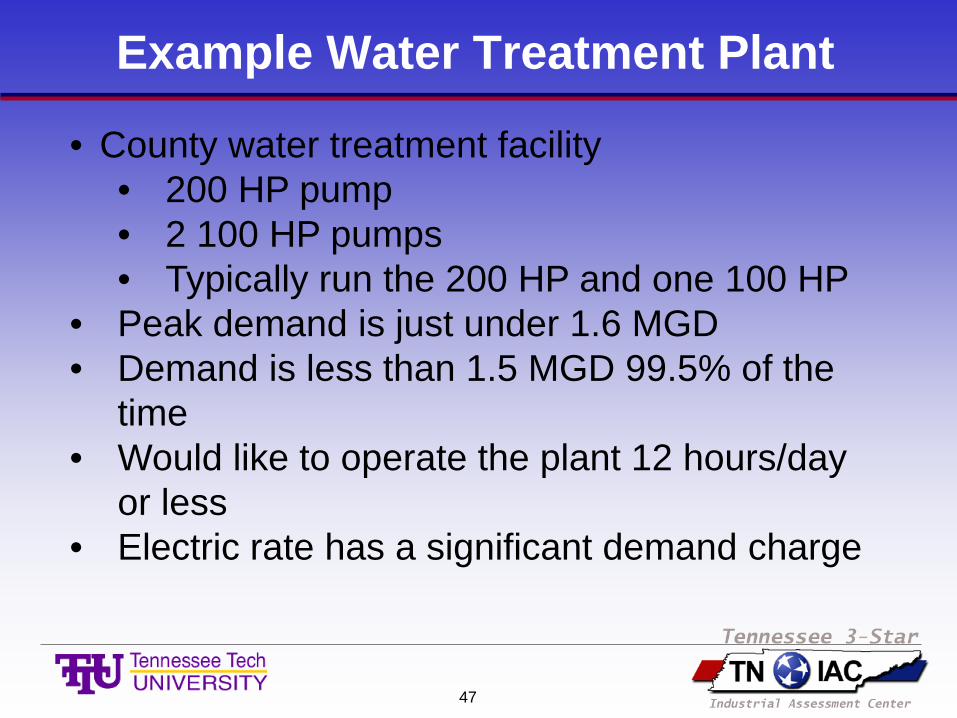
Example Water Treatment Plant
• County water treatment facility • 200 HP pump • 2 100 HP pumps • Typically run the 200 HP and one 100 HP
• Peak demand is just under 1.6 MGD • Demand is less than 1.5 MGD 99.5% of the
time • Would like to operate the plant 12 hours/day
or less • Electric rate has a significant demand charge

48 48
City Water System

49
Lighting

50
Lighting
• Most lighting changes today are centered around replacing old fixtures with LED lamps
• In the last couple of years the cost of LED fixtures has decreased dramatically
• The long lamp life reduces maintenance costs significantly
51
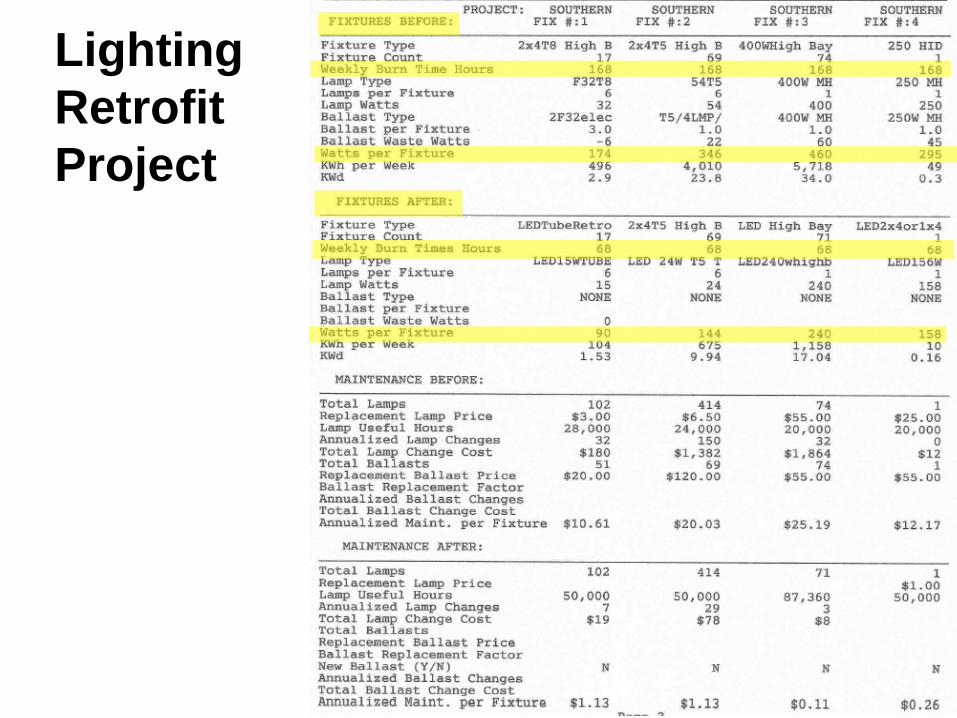
Lighting Retrofit Project

52
Lighting Retrofit Project

53
Lighting – Retrofit Project

54

55
Combined Heat & Power

56
Opportunities for Combined Heat and Power

57
Opportunities for Combined Heat and Power
• Biogas from the digester can be used as fuel to generate electricity and produce useful heat for the digester or space heating
• Natural gas costs about $4.00 to $6.00 per MMBtu, depending on where you live and how much you purchase
• At $0.08/kWh, electricity costs $23.44 per MMBtu • By burning biogas in an engine/turbine/boiler and
producing electricity first the waste heat from the power generation can be used in the digester or as space heat producing overall efficiencies in the 65% to 80% range

58
Opportunities for Combined Heat and Power
• CHP systems can use a variety of prime movers • Reciprocating engines • Microturbines • Fuel cells
• A typical WWTP processes 100 gal/day of wastewater for every person served
• About 1 ft3 of digester gas can be produced by an anaerobic digester per person per day
• Anaerobic digester gas from WWTP’s is usually 60 to 70% methane with the rest primarily CO2
• HHV is 610 – 715 Btu/ft3 and LHV is 550 – 650 Btu/ft3 • For natural gas the HHV is ~1024 Btu/ft3

59
Opportunities for Combined Heat and Power • CHP systems can use a variety of prime movers
• Reciprocating engines • Microturbines • Fuel cells
• A typical WWTP processes 100 gal/day of wastewater for every person served
• About 1 ft3 of digester gas can be produced by an anaerobic digester per person per day
• Anaerobic digester gas from WWTP’s is usually 60 to 70% methane with the rest primarily CO2
• HHV is 610 – 715 Btu/ft3 and LHV is 550 – 650 Btu/ft3 • For natural gas the HHV is ~1024 Btu/ft3

60
Opportunities for Combined Heat and Power • CHP systems can use a variety of prime movers
• Reciprocating engines • Microturbines • Fuel cells
• A typical WWTP processes 100 gal/day of wastewater for every person served
• About 1 ft3 of digester gas can be produced by an anaerobic digester per person per day
• Anaerobic digester gas from WWTP’s is usually 60 to 70% methane with the rest primarily CO2
• HHV is 610 – 715 Btu/ft3 and LHV is 550 – 650 Btu/ft3 • For natural gas the HHV is ~1024 Btu/ft3

61
Opportunities for Combined Heat and Power • CHP systems can use a variety of prime movers
• Reciprocating engines • Microturbines • Fuel cells
• A typical WWTP processes 100 gal/day of wastewater for every person served
• About 1 ft3 of digester gas can be produced by an anaerobic digester per person per day
• Anaerobic digester gas from WWTP’s is usually 60 to 70% methane with the rest primarily CO2
• HHV is 610 – 715 Btu/ft3 and LHV is 550 – 650 Btu/ft3 • For natural gas the HHV is ~1024 Btu/ft3

62
Opportunities for Combined Heat and Power • CHP systems can use a variety of prime movers
• Reciprocating engines • Microturbines • Fuel cells
• A typical WWTP processes 100 gal/day of wastewater for every person served
• About 1 ft3 of digester gas can be produced by an anaerobic digester per person per day
• Anaerobic digester gas from WWTP’s is usually 60 to 70% methane with the rest primarily CO2
• HHV is 610 – 715 Btu/ft3 and LHV is 550 – 650 Btu/ft3 • For natural gas the HHV is ~1024 Btu/ft3

63
Opportunities for Combined Heat and Power • CHP systems can use a variety of prime movers
• Reciprocating engines • Microturbines • Fuel cells
• A typical WWTP processes 100 gal/day of wastewater for every person served
• About 1 ft3 of digester gas can be produced by an anaerobic digester per person per day
• Anaerobic digester gas from WWTP’s is usually 60 to 70% methane with the rest primarily CO2
• HHV is 610 – 715 Btu/ft3 and LHV is 550 – 650 Btu/ft3 • For natural gas the HHV is ~1024 Btu/ft3

64
HVAC

65
Energy Management Techniques
1. Preventive Maintenance 2. Minimizing ventilation air 3. Free Cooling – air side economizer 4. Premium efficiency motors 5. Use of VFDs for capacity of pumps & fans 6. Replace V-belts with cog belts 7. Replace old HVAC equipment with more
efficient new units

66
Belt Drive Losses

67
Comparison of Belt Drive Costs Assume a 75 HP fan drive is converted to Synchronous Belts from conventional V-Belts
• Approximate cost of a system with V-Belts • One four-groove B13.6 inch sheave $ 102 • One four-groove B18.1 inch sheave $ 130 • Four B 136 V-Belts $ 108 • Total Cost $ 340
• Approximate cost of a system with Synchronous Belts • One P52-14M-85 sprocket $ 220 • One P72-14M-85 sprocket $ 320 • One 3150-14M-14M-85 belt $ 478 • Total Cost $1,018
• Assuming 5% belt slip for V-Belts and an energy cost of $0.08/kWh and the fan operates continuously, predicted savings for the Synchronous Belt over the V-Belts is $2,152/year
• Estimated total conversion cost is $1,500 and the simple payback is 8.4 months

68
Questions ????

Thank You
Provide feedback on this session in the new Summit App! Download the app to your mobile device or go to bbsummit.pathable.com
69