wastewater treatment plant energy efficiency
TRANSCRIPT

Wastewater Treatment Plant Energy Efficiency
MnTAP Intern Project Report City of Rogers, MN
David Buck
2011
The Minnesota Technical Assistance Program (MnTAP), University of Minnesota, provided a student
intern and staff assistance free of charge to identify useful changes that reduce waste, emissions, and/or
hazards, to increase efficiency at the company. However, the company decides whether to implement
suggestions based, among other things, on its own evaluations of the project, including its own evaluation
of the work performed by the intern under the company‟s supervision. THE COMPANY ACCEPTED
THE SERVICES “AS IS” AND WITHOUT WARRANTY, INCLUDING EXPRESSLY WITHOUT
WARRANT OF MERCHANTABILITY OR WARRANTY OF FITNESS FOR A PARTICULAR
PURPOSE.
-NOT FOR DISTRIBTION-

City of Rogers - MnTAP Intern Report - 2011
Page 2
Preface
The work described in this report is a service of the Minnesota Technical Assistance Program (MnTAP),
University of Minnesota, School of Public Health, Division of Environmental Health Sciences. MnTAP is
funded primarily by the Minnesota Pollution Control Agency's Prevention and Assistance division.
MnTAP helps Minnesota businesses implement industry-tailored solutions that maximize resource
efficiency, increase energy efficiency, prevent pollution, and reduce costs to improve public health and
the environment.
As outlined in the MnTAP Intern Project Agreement, MnTAP staff will contact key facility personnel for
up to two years following completion of the intern's work to collect information on which, if any, of the
recommendations have been implemented.
Company contact: John Seifert
Phone: 763.428.8580 ext. 203
Fax: 763.428.9261
Email: [email protected]
Website: http://www.cityofrogers.org/
Address: 22350 S Diamond Lake Rd
Rogers, MN 55374
Please contact MnTAP if you have any questions or comments related to this report.
A.J. Van den Berghe
MnTAP project advisor
612.624.4653, [email protected]
Krysta Larson
MnTAP intern program coordinator
612.624.4697, [email protected]
Laura Babcock
MnTAP director
612.624.4678, [email protected]
Minnesota Technical Assistance Program
University of Minnesota
200 Oak St SE, Suite 350
Minneapolis, MN 55455-2008
612.624.1300 or 800.247.0015
www.mntap.umn.edu
MnTAP has a variety of technical assistance services available to help Minnesota businesses implement
industry-tailored solutions that maximize resource efficiency, prevent pollution and reduce costs. Our
information resources are available online <mntap.umn.edu>. Or, call MnTAP at 612.624.1300 or
800.247.0015 from greater Minnesota for personal assistance.
Contact information for environmental, health and safety regulations can be found on MnTAP's Web site
<mntap.umn.edu/resources/regresources.htm>.
City of Rogers - MnTAP Intern Report - 2011
Page 2
Table of Contents Preface .......................................................................................................................................................... 2 Table of Contents ........................................................................................................................................ 2 Executive Proposal ...................................................................................................................................... 3
City of Rogers Wastewater Treatment Plant Energy Efficiency ............................................................ 3 Key Staff ................................................................................................................................................. 4
Background ................................................................................................................................................. 7 Company Description ............................................................................................................................ 7 Incentives for Change ............................................................................................................................ 7 Process Description ............................................................................................................................... 7
Waste Issue 1: Energy Use in the Oxidation Ditch Aeration Process .................................................... 9 Quantity of Waste .................................................................................................................................. 9 Management Method ............................................................................................................................. 9 Reasons for Researching Options .......................................................................................................... 9
REDUCTION OPTION 1.1: PROCESS OPTIMIZATION WITHOUT ADDITIONAL CAPITAL............................. 10 REDUCTION OPTION 1.2: PROCESS OPTIMIZATION WITH SUBMERSIBLE MIXERS .................................. 11 REDUCTION OPTION 1.3: NEMA PREMIUM MOTOR REPLACEMENT ...................................................... 12 REDUCTION OPTION 1.4: VARIABLE FREQUENCY DRIVES WITH IN-SITU DISSOLVED OXYGEN
MONITORING AND CONTROL ................................................................................................................... 14 REDUCTION OPTION 1.5: BIOLOGICAL NITROGEN REMOVAL FOR ENERGY REDUCTION ....................... 16
Waste Issue 2: Energy use in Floating Pond Aerators ........................................................................... 18 Quantity of Waste ................................................................................................................................ 18 Management Method ........................................................................................................................... 18 Reasons for Researching Options ........................................................................................................ 18
REDUCTION OPTION 2.1: EXCHANGE MOTOR FOR SUPER PREMIUM EFFICIENCY MOTOR ..................... 19 Waste Issue 3: Ferric Chloride for Phosphorus Removal ..................................................................... 20
Quantity of Waste ................................................................................................................................ 20 Management Method ........................................................................................................................... 20 Reasons for Researching Options ........................................................................................................ 20
REDUCTION OPTION 3.1: ANAEROBIC SELECTORS FOR BIOLOGICAL PHOSPHORUS REMOVAL ............. 21 Appendices ................................................................................................................................................. 23
APPENDIX A: RECOGNITION AND REFERENCES ...................................................................................... 23 Special thanks to the following people for their input to this project: ................................................. 23 Sources ................................................................................................................................................. 24
APPENDIX B: SAMPLE CALCULATIONS AND METHODOLOGY................................................................. 25 Rotor Power Consumption Calculations ............................................................................................. 25 Power Savings Cost Calculations ........................................................................................................ 27 Motor/Mixer Cost Calculations ........................................................................................................... 28 System Optimization Calculations ....................................................................................................... 29 VFD Calculations ................................................................................................................................ 31 Modified Ludzack-Ettinger Process Calculations ............................................................................... 35 Biological Phosphorus Removal Calculations .................................................................................... 36

City of Rogers - MnTAP Intern Report - 2011
Page 3
Executive Proposal
City of Rogers Wastewater Treatment Plant Energy Efficiency
8/30/2011
The purpose of this project was to investigate electric energy and chemical reduction opportunities at the
City of Rogers Wastewater Treatment Facility. Currently, the City utilizes approximately 860,000 kWh
per year operating its wastewater treatment facility, approximately half of which are used to drive
mechanical rotors within the oxidation ditch aeration process. Despite large energy use, this system had
not been optimized prior to this project; therefore, the oxidation ditches provide a good opportunity for
energy reduction due to technological advances that allow for greater process control. In addition, the
City uses two floating pond aerators to stabilize the wastewater sludge in the storage pond. These aerators
currently use approximately 240,000 kWh annually, have been in service for 15 years, and are drive by
inefficient motors compared to modern standards. Since installation, these floating pond aerators have
been in various states of disrepair, and the City wishes to install replacement aerators that offer reduced
maintenance and enhanced energy efficiency. Finally, the City uses 300,000 lbs. of aqueous ferric
chloride per year for phosphorus treatment. Ferric chloride is a corrosive and toxic chemical; biological
phosphorus treatment is an alternative process that would require significantly less chemical input.
I propose the City of Rogers make four changes to the aeration systems at the wastewater treatment
facility. First, the City should install an automated aeration control system on the oxidation ditch rotors
consisting of variable frequency drives (VFDs) tied to in-situ real-time dissolved oxygen sensors. With
this system, all six motors should be operated simultaneously to achieve maximum energy efficiency and
cost savings. Second, the City should install new single-speed NEMA premium efficient motors for the
oxidation ditch process for use with the proposed automated aeration control system. The energy savings
due to improved motor efficiency alone offer a relatively weak payback period, therefore, it is
recommended that this option should only be implemented with the VFDs. Third, until the
aforementioned projects are implemented, the City should operate each ditch with one rotor on high speed
at an immersion depth of 12.6 inches to achieve energy reduction while still maintaining sufficient water
treatment. This configuration will provide optimal energy efficiency while requiring no added capital
investment. This will save 13,000 kWh for $800 per year or 2.5%. Finally, the City should install
replacement floating pond aerators equipped with NEMA super premium efficient motors to replace
current equipment.
The VFDs require a capital cost of approximately $75,000 with energy savings of 240,000 kWh and a
cost savings of $15,000 per year, equivalent to a 46% savings on the cost to operate the oxidation ditches.
The payback period is five years. This project not only saves money but also provides the operators with
enhanced process control and monitoring capabilities. In addition, most new facilities are built with VFDs
for energy savings; retrofitting the oxidation ditches with the proposed automated control would
modernize the facility. With this system in place, the six current two-speed motors driving the oxidation
ditch aerators should be replaced. Although the current motors will function with the VFDs for some
undeterminable amount of time, it would be better practice to replace the motors to prevent premature
burnout.
The current floating pond aerators are highly inefficient compared to modern equipment. Two aerators
exist, but new equipment is needed before they break to prevent a lapse in sludge stabilization.
Replacement of two aerators requires a capital cost of $13,340 and will save 28,000 kWh per year for a
total savings of $1,700 per year or 12%. This results in a 7.8 year payback period, which is not ideal, but a
necessary measure. I compared two top-of-the-line products on the market in various configurations and
with varying power levels. Two 15 horsepower (hp) floating pond aerators from Aeration Industries

City of Rogers - MnTAP Intern Report - 2011
Page 4
International Inc. are the most economical option and will save the most energy. Finally, according to
current product owners, this specific aerator is the best overall option on the market today due to reduced
maintenance requirements.
Key Staff
David Buck, Minnesota Technical Assistance Program, University of Minnesota, summer intern 2011
John Seifert, Public Works Director, 763.428.8580 ext. 203
Dan Janish, Public Utilities Supervisor, 763.428.8580 ext. 205

City of Rogers - MnTAP Intern Report - 2011 Page 5
Table 1. Summary of Waste Reduction Options
Waste reduction option Change Type Waste reduced
(per year)
Implementation
cost
Cost savings
(per year)
Payback
period
(years)
Status
Process Optimization without
Additional Capital Procedure 13,000 kWh $0 $800 Immediate Recommended
Process Optimization with
Submersible Mixers Equipment/Procedure NA $64,000 NA NA Not Recommended
Variable Frequency Drives with In-
Situ Dissolved Oxygen Monitoring
and Control and NEMA Premium
Motor Replacement (combination of
[a] and [b] from below)
Equipment 240,000 kWh $75,000 $15,000 5.0 Recommended
[a] Variable Frequency Drives with
In-Situ Dissolved Oxygen
Monitoring and Control
Equipment 230,000 kWh $65,000 $14,500 4.5 Recommended,
combined with [b]
[b] NEMA Premium Motor
Replacement Equipment 20,000 kWh $8,592 $1,200 7.2
Recommended,
combined with [a]
Biological Nitrogen Removal Equipment/Procedure 53,000 kWh $53,000 $3,400 15.6 Not Recommended
Floating Pond Aerator Equipment 28,000 kWh $13,340 $1,766 7.6 Implementation
Scheduled for Sep „11
Biological Phosphorus Removal Equipment/Procedure 250,000 lbs. $750,000 $40,000 18.8 Not Recommended
The economic benefits of each waste reduction option are listed above are for each change individually. Because the savings are not necessarily additive
the overall savings may be less if multiple waste reduction options are implemented.


City of Rogers - MnTAP Intern Report - 2011
Page 7
Background
Company Description
Address: 22350 S Diamond Lake Rd
Rogers, MN 55374
Telephone: 763.428.8580
Fax: 763.428.9261
Principal Products: Publicly Owned Treatment Works (POTW); Municipal Wastewater Treatment
No. Employees: 50
SIC code: 4952
NAICS code: 221320
The City of Rogers, Minnesota is a fast growing town about 25 miles northwest of downtown
Minneapolis. The City has grown from approximately 700 people in 1990 to over 8,500 today. As a
response to this growth, in 1992 and 1996 the City implemented two upgrades to their wastewater
collection pond to create a full treatment facility equipped to treat 1.6 million gallons of wastewater per
day versus the previous 640,000 gallons per day. Since the upgrades, the City of Rogers has won four
awards from the Minnesota Pollution Control Agency (MPCA) for consistently meeting effluent quality
standards. The quality of this discharge water has left the receiving waters unharmed. When the treated
water leaves the plant it enters a transportation ditch, which carries it through a set of natural wetlands.
These wetlands further treat it before discharging it into the Crow River, a tributary of the Mississippi
River.
Incentives for Change
Despite operating an award-winning municipal wastewater treatment plant the City of Rogers chose to
undertake this project to improve electric energy efficiency, reduce costs related to wastewater aeration,
and to research opportunities to reduce the use of phosphorus-treating chemicals and their costs. The City
determined these goals for the additional purpose of optimizing the use of taxpayer dollars. The activated
sludge oxidation ditches have not been optimized for energy efficiency and have operated in the same
manner since installation in 1996. Activated sludge processes, on average, utilize 25-60% of the total
energy for wastewater treatment plant operation. The emergence of new technologies has led to energy
efficient alternatives for operators. By not utilizing these new methods, the oxidation ditch process does
not respond to daily changes in load. That is, the plant operates in a nearly identical manner whether or
not the influent characteristics change. These characteristics fluctuate significantly, which suggests
opportunity for process improvement. Also, the City aims to continue its record of quality discharge while
pursuing future growth.
Currently, the City spends between $30,000 and $35,000 in electric costs per year on the operation of the
oxidation ditch motors. The preexisting floating pond aerators are near the end of the product life and use
standard efficiency motors, wasting energy. Finally, the City of Rogers spends approximately $50,000 per
year on 300,000 lbs. of ferric chloride for chemical phosphorus removal while certain process changes
exist that could dramatically reduce the amount of chemicals required.
Process Description
The process discussed in this report is designed for the treatment of typical municipal wastewater. The
plant has a maximum design capacity of 1.6 million gallons of domestic wastewater per day. A basic
process flow diagram is provided in Figure 1. The wastewater enters the plant and passes through primary
treatment, which includes a bar screen and mechanical grinding equipment. This unit operation removes
large solids such as rags, grit, and chunks of food. The second unit operation is the oxidation ditches. In
this process the wastewater mixes in a large tank where it is heavily aerated. This creates a good

City of Rogers - MnTAP Intern Report - 2011
Page 8
environment for microbes to grow and consume organic material and other pollutants. The oxidation
ditches provide oxygen through the use of up to six surface brush style rotor aerators. Each rotor is driven
by a single two-speed motor, running at either 50 or 72 RPMs, consuming 26.7 or 40 brake horsepower,
respectively. The combination of wastewater, microbes, and remaining pollutants (known as mixed
liquor) is then pumped up to the clarifiers. Before reaching this process, a small pump operating with a
variable frequency drive (VFD) controlled by process flow adds ferric chloride to remove phosphorus via
chemical precipitation. The clarifiers then slow the flow separating solids from the treated water. Some of
this solid material (known as sludge or biosolids) is returned to the oxidation ditch to continue treatment,
while the remaining is sent to the oxidation pond for storage. This pond was the full treatment plant at one
point, but is now used for sludge storage and emergency storage. The floating aerators add oxygen to the
pond for supplemental waste treatment and stabilization. Finally, the water passes through an ultraviolet
light disinfection process that kills remaining pathogens before discharge.
Figure 1. Process Schematic
Return Activated Sludge
Oxidation
Ditch 1
Oxidation
Ditch 2
Waste Sludge to
Storage Pond
Primary
Clarifier
Secondary
Clarifier
UV
Disinfection
To
Outfall Lift
Pump
Fe(III)Cl3
Chemical
Pump
Primary
Treatment
Incoming
Wastewater

City of Rogers - MnTAP Intern Report - 2011
Page 9
Waste Issue 1: Energy Use in the Oxidation Ditch Aeration Process
Quantity of Waste
The City of Rogers currently consumes approximately 450,000 kWh/yr operating the oxidation ditch
surface rotor aeration process. The average monthly demand is approximately 55 kW for the ditch process
as it currently runs. To calculate these values I took voltage readings and logged current data over time
for the four operating motors and calculated the resulting consumption and demand. These values were
verified with an economic analysis and the monthly bills from Xcel energy. Detailed calculations for the
energy consumption and economic analysis are given in the Rotor Power Consumption Calculations and
Power Savings Cost Calculations sections of Appendix B, respectively. To determine whether or not the
City was over-aerating, and therefore wasting energy, I logged dissolved oxygen (DO) concentration
present in the oxidation ditch effluent over the course of two full days. The DO concentration within the
oxidation ditches should be kept between 0.5 mg/L and 2.0 mg/L at all times to promote a healthy
microorganism population. Over the course of the logging period, the DO levels regularly exceeded 3.0
mg/L, which indicates over aeration.
Management Method
The two oxidation ditches each contain three surface rotor aerators, which churn the water to add oxygen
and mix the liquid. The rotors are driven by two-speed motors at 50 RPM and 72 RPM while consuming
either 26.7 or 40 brake horsepower, respectively. Currently, two rotors in each ditch are run constantly on
the low setting. The operator rotates the four rotors approximately every other week to ensure equal
distribution of wear and tear. The speed of the rotors is currently left unchanged, despite varying levels of
DO, total nitrogen (TN) and biochemical oxygen demand (BOD) in the wastewater influent.
Reasons for Researching Options
Since the City installed the oxidation ditches, new technology has been developed and refined to save
energy in aeration processes. These management methods have not yet been employed at the City of
Rogers‟ plant. The oxidation ditches were chosen for an energy reduction study, because between 25%
and 60% of power at a typical wastewater treatment facility is used in the secondary treatment aeration
process. Also, the Public Works Superintendent, Utilities Supervisor, and Operator had found out
anecdotally that energy savings could be achieved through various means and wanted analyses of each.
The recommendations were ordered to allow for ease of process understanding and does not relate to
importance. The variable frequency drives project is the most beneficial and should be considered first.
City of Rogers - MnTAP Intern Report - 2011
Page 10
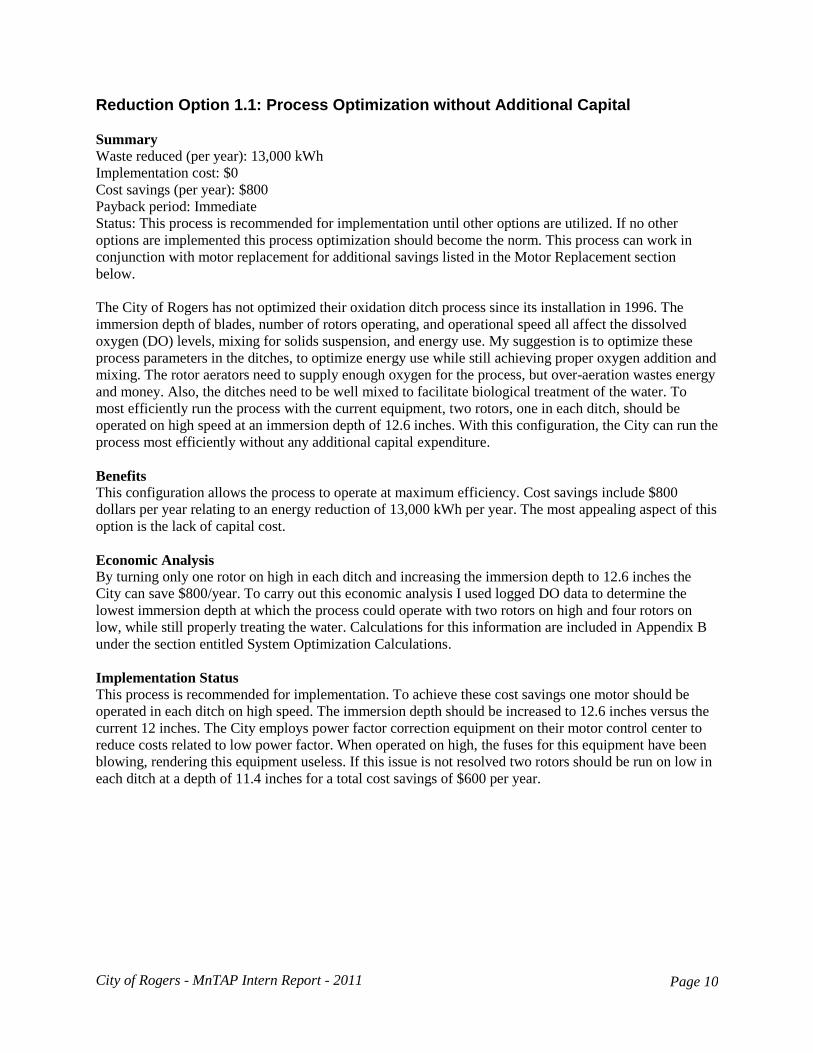
Reduction Option 1.1: Process Optimization without Additional Capital
Summary
Waste reduced (per year): 13,000 kWh
Implementation cost: $0
Cost savings (per year): $800
Payback period: Immediate
Status: This process is recommended for implementation until other options are utilized. If no other
options are implemented this process optimization should become the norm. This process can work in
conjunction with motor replacement for additional savings listed in the Motor Replacement section
below.
The City of Rogers has not optimized their oxidation ditch process since its installation in 1996. The
immersion depth of blades, number of rotors operating, and operational speed all affect the dissolved
oxygen (DO) levels, mixing for solids suspension, and energy use. My suggestion is to optimize these
process parameters in the ditches, to optimize energy use while still achieving proper oxygen addition and
mixing. The rotor aerators need to supply enough oxygen for the process, but over-aeration wastes energy
and money. Also, the ditches need to be well mixed to facilitate biological treatment of the water. To
most efficiently run the process with the current equipment, two rotors, one in each ditch, should be
operated on high speed at an immersion depth of 12.6 inches. With this configuration, the City can run the
process most efficiently without any additional capital expenditure.
Benefits
This configuration allows the process to operate at maximum efficiency. Cost savings include $800
dollars per year relating to an energy reduction of 13,000 kWh per year. The most appealing aspect of this
option is the lack of capital cost.
Economic Analysis
By turning only one rotor on high in each ditch and increasing the immersion depth to 12.6 inches the
City can save $800/year. To carry out this economic analysis I used logged DO data to determine the
lowest immersion depth at which the process could operate with two rotors on high and four rotors on
low, while still properly treating the water. Calculations for this information are included in Appendix B
under the section entitled System Optimization Calculations.
Implementation Status
This process is recommended for implementation. To achieve these cost savings one motor should be
operated in each ditch on high speed. The immersion depth should be increased to 12.6 inches versus the
current 12 inches. The City employs power factor correction equipment on their motor control center to
reduce costs related to low power factor. When operated on high, the fuses for this equipment have been
blowing, rendering this equipment useless. If this issue is not resolved two rotors should be run on low in
each ditch at a depth of 11.4 inches for a total cost savings of $600 per year.

City of Rogers - MnTAP Intern Report - 2011
Page 11
Reduction Option 1.2: Process Optimization with Submersible Mixers
Summary
Waste reduced (per year): NA
Implementation cost: $64,800
Cost savings (per year): NA
Payback period: NA
Status: This option is not recommended for implementation, because there are no associated energy or
cost savings. Additional mixers are not needed to achieve the required mixing velocity that ensures
adequate suspension of solids and microbes.
The brush style mechanical surface rotor aerators churn the activated sludge to provide both DO to
stimulate microbial growth and impart a flow within the racetrack style oxidation ditch tanks to prevent
solids settling that would hinder biological treatment of the wastewater. These microbes treat the
wastewater biologically to remove organic matter. In order for the microbes to treat the entire ditch
volume the contents require mixing to prevent solids separation. According to the Recommended
Standards for Wastewater Treatment 1990 edition, also known as the Ten State Standards, a minimum
liquid average velocity of one foot per second within oxidation ditch should be maintained at all times. I
studied the possibility of supplementing the mixing should the operation of motors be insufficient. This
option is not recommended, because additional mixing with submersible mixers is not needed and would
not save energy.
Benefits
Although this option does not provide energy or cost savings, the operators at the City of Rogers are now
better aware of mixing requirements within the oxidation ditch process. The intended benefit was to
supplement the mixing in the ditch, but this is not necessary.
Economic Analysis
I calculated the cost of running various low speed and medium speed mixers. The methodology for these
calculations is shown in Appendix B under Motor/Mixer Cost Calculations at the end of the report. I
compared mixers from various companies with different horsepower and speed. The most energy efficient
motor products were investigated, but these mixers required more energy than could be saved from
process optimization. In addition, the capital cost of additional mixing was much higher than originally
anticipated by city officials before the intern project began.
Implementation Status
This option is not recommended for implementation, because it does not provide energy savings. I
originally investigated this option to provide supplemental mixing if necessary while maintaining other
process equipment as is. I discovered that more energy is required to provide the necessary oxygen than
mixing. That is, the mixing is not the limiting factor for energy input.
The cost for the equipment needed for this process change is listed in Table 2
.
Table 2. Mixer Equipment Costs
Part description Supplier Part number Quantity Price Total
Price
6.17 hp low speed mixer Flygt/Electric Pump 4430.010 2 32,400 64,800

City of Rogers - MnTAP Intern Report - 2011
Page 12
Reduction Option 1.3: NEMA Premium Motor Replacement
Summary
Waste reduced (per year): 20,000 kWh
Implementation cost: $8,592
Cost savings (per year): $1,200
Payback period: 7.2 years
Status: This option is recommended for implementation if Variable Frequency Drives (VFDs) are
incorporated. The payback period is large, but the motors will need replacement in the near future,
because the VFDs will eventually cause burnout of the current older motors which were not designed for
variable frequency control. If the VFDs are not incorporated this option is not recommended until new
motors are needed.
The existing motors have been in operation since the expansion of the facility in 1996. These motors were
considered premium efficient when implemented, but more efficient motors have since reached the
market. Motor efficiencies have been increasing in the past two decades due to Congressional changes in
energy policy and competition between vendors to provide cost savings opportunities. My suggestion is to
replace the current motors with those meeting the National Electrical Manufacturers Association (NEMA)
premium efficient motors standard for an increased incremental efficiency of 1.7%. Motors manufactured
after December, 2010 are required by law to meet or exceed these efficiency standards. Because the
process runs 24 hours a day, 7 days a week small changes in efficiency can greatly reduce costs. This
suggestion may be incorporated with the Setup Optimization, VFDs, or Biological Nitrogen Removal
options. If VFDs are implemented, this option is strongly recommended. The old motors can function
with VFDs, but will burn out eventually. It cannot be predicted when this will occur; therefore,
replacement is suggested.
Benefits
This recommendation, as a standalone project, would reduce energy consumption by 20,000 kWh per
year for a cost savings of $1,200 per year. The largest benefit to this option is it allows for the successful
implementation of the VFDs. Although the proposed VFDs could be used with the current motors, the
motors will burn out in the near future. Also, at least one motor may not be working properly evidenced
by frequent screeching sounds produced by the motor. I observed based on the quantity of bubbles after
the rotor that while this sound is produced aeration rate is reduced. In addition, after collecting current
data I observed that motor six draws current even when turned off. These problems may be remedied with
the implementation of a new motor, although this needs further investigation.
Economic Analysis
The implementation cost for this project is $8,592, which applies to the cost of the proposed replacement
motors. This does not include installation costs, but these should be minimal, because the electrical wiring
and footings are already in place. $1,200 will be saved per year by implementing this option for a payback
period of 7.2 years. Although this payback period is longer than desired, the motors will eventually need
replacement with the installation of VFDs. The initial capital cost of these motors is $2,632 per motor, but
Xcel Energy offers a $1,200 rebate per NEMA premium efficient motor of this size. These rebates are for
upgraded motors, which are better than those for new equipment. The rebates reduce the total capital cost
for six motors from $15,792 to $8,592 which is a savings of 46%.
Implementation Status
The status of this option is recommended if VFDs are used. Neither option has been implemented.
The cost for the equipment needed for this process change is listed in the Table 3.

City of Rogers - MnTAP Intern Report - 2011
Page 13
Table 3. Motor Replacement Equipment Costs
Part description Supplier Quantity Price Total
Price
40 hp Single Speed NEMA
Premium Efficient Motor
Baldor 6 $1,432 $8,592

City of Rogers - MnTAP Intern Report - 2011
Page 14
Reduction Option 1.4: Variable Frequency Drives with In-Situ Dissolved Oxygen Monitoring and Control
Summary
Waste reduced (per year): 240,000 kWh
Implementation cost: $75,000
Cost savings (per year): $15,000
Payback period: 5 years
Status: This option is recommended but not yet implemented. Prior to implementation the City must
decide on a vendor for VFDs and dV/dt filters. These filters provide protection for the motor while
operating with a VFD.
The City does not currently utilize VFD motor speed controllers on the oxidation ditch process, which
consumes approximately 60% of the total electrical energy for the onsite plant. The magnitude of aeration
input is constant despite varying daily and seasonal influent loads, which over aerates and wastes energy.
Based on DO readings taken over a 48 hour period it is evident that the wastewater treatment facility is
wasting energy, particularly at night, by over aerating. DO concentrations for an oxidation ditch process
should be maintained between 0.5 and 2.0 mg/L, whereas I recorded frequent intervals where DO
readings were above 3.0 mg/L. My suggestion is to place VFDs on all six rotor aerators and replace the
current two speed motors with single speed NEMA premium efficient motors. This will allow the aerators
to change speeds based on the necessary amount of DO. In-situ DO sensors, variable frequency drives and
a logic controller comprise the proposed automated control system.
Benefits
Because the aerators will only input as much oxygen as is necessary at any given time, this proposed
configuration will save 240,000 kWh per year for a total cost savings of $15,000 per year. These savings
will be realized primarily at night, when little water is being used throughout the City. In addition, the
City will have better control of their oxidation ditch process, and can monitor more easily for possible
upsets. In addition, this project gives more reason to replace the inefficient motors. Replacement of the
motors themselves is not an economically justifiable project, but when combined with the VFD project it
becomes a much more viable option.
Economic Analysis
The capital cost of this project is $94,000, which includes controls equipment for DO sensing, six VFDs,
six dV/dt filters to correct for voltage variation, and electrical wiring. Additional costs include installation
and wiring as well as development of a programmable logic controller (PLC) for system regulation. Two
rebates are possible with this project. First, prescriptive motor rebates for the upgrade of six 40 hp motors
totals $7,200 which is nearly half the cost of the motors. In addition, this project qualifies for an extensive
custom efficiency rebate, because it reduces the average power demand by approximately 32 kW. The
custom efficiency rebate allows a maximum incentive of $400/kW of reduced demand, resulting in a
custom rebate total of $12,800. This does not include the prescriptive motor rebates which provide an
additional $7,200 discount. The City will save $15,000 per year in energy costs with this configuration
and reclaim the capital expenditure within 5.0 years. This payback period is not ideal, but with the
additional benefit of increased control, this payback period is acceptable.
Implementation Status
This option is recommended but has not yet been implemented. Prior to implementation the City needs to
finalize its decision on which specific VFD to purchase, and move forward with Preferred Controls, who
will be designing the process controls. Also, additional quotes for dV/dt filters are recommended to
ensure the best price. This project will need to move quickly in order to be installed before this winter.

City of Rogers - MnTAP Intern Report - 2011
Page 15
The purchase costs for the equipment needed for this process change are listed in Table 4. These numbers
include the prescriptive motor rebates but not the custom rebates.
Table 4. VFD and DO Control Equipment Costs
Part description Supplier Part number Quantity Price Total
Dissolved Oxygen Probe Hach 5790000 2 $1,612 $3224
SC200 Controller Hach LXV404.00.00
552 2 $1,620 $3,240
Variable Frequency Drive ABB ACH550 6 $4,400 $26,400
dV/dT filters Preferred Controls 6 $450 $2,700
System
Integration/Programming
Preferred Controls N/A 1 $16,000 $16,000
Electrical Installation/Wiring Electric Resource
Contractors
N/A 1 $26,746 $26,746
40 hp single speed motors Baldor 6 $1,432 $8592

City of Rogers - MnTAP Intern Report - 2011
Page 16
Reduction Option 1.5: Biological Nitrogen Removal for Energy Reduction
Summary
Waste reduced (per year): 62,000 kWh
Implementation cost: $53,000
Cost savings (per year): $3,400
Payback period: 15.6 years
Status: This project is not recommended for implementation. The cost of the project far outweighs the
energy savings. Also, because the City is not currently permitted for nitrogen removal the added benefit
of nitrogen removal beyond the energy savings is irrelevant.
Currently, the City wastewater treatment facility does not alter the operation of its aeration process based
on incoming loads. This wastes energy, evidenced by high DO readings. One way to acquire energy
savings is by using a biological nitrogen removal process, which also accomplishes energy savings. The
Modified Ludzack-Ettinger (MLE) process is one method for biological nitrogen removal, which allows
for decreased aeration in the first oxidation ditch. This first ditch will operate under anoxic conditions,
which means there are greatly reduced levels of oxygen. Also, the microbes in the first ditch will utilize
nitrate oxygen further reducing the necessary oxygen input. This suggestion requires the addition of all
equipment suggested in the VFDs section of this report as well as a propeller pump with a VFD attached
to recirculate mixed liquor from the second oxidation ditch to the first. Additionally, I considered phased
isolation, another biological nitrogen removal process, but quickly ruled it out due to operator time
requirements and capital costs.
Benefits
This option would remove nitrogen using a biological process, and would reduce energy costs too. The
energy savings are minimal compared to the cost of the equipment, but if the City is permitted for
nitrogen in the future this would be a more attractive alternative. The total amount of waste reduced
would be 53,000 kWh per year. In addition, this process increases the settle ability of solids in the ditch
and prevents the growth of undesired filamentous bacteria, which hinder the aeration process.
Economic Analysis
This economic analysis addresses only the capital and savings beyond that of the VFDs. The total capital
cost to implement the MLE biological nitrogen removal process would be approximately $53,000 which
takes in to consideration an approximately $2,000 custom efficiency rebate through Xcel Energy. The
construction cost refers to the labor required to drill a hole into the oxidation ditch tank wall to allow for
mixed liquor recirculation. This economic analysis and does not include the cost of running the
submersible impeller pump, because this is assumed to be small with a VFD attached. This process can
save approximately $3,400 per year beyond the savings associated with the VFDs and DO monitoring.
This results in a 15.6 year payback period. These calculations can be found in the section entitled
Modified Ludzack-Ettinger Process Calculations of Appendix B.
Implementation Status
This option is not recommended for implementation. The cost savings, and 15.6 year payback, do not
justify the large capital cost. If the City is permitted for Nitrogen in the future this option should be
considered for nitrogen removal.
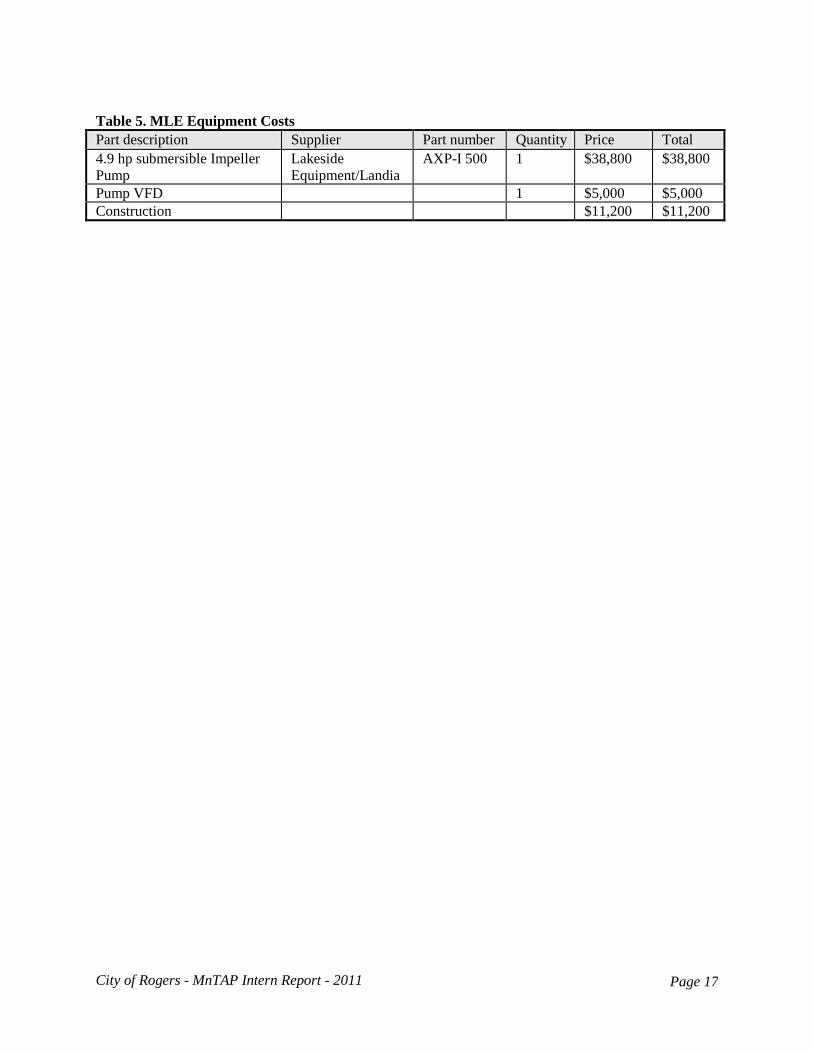
The costs for the equipment needed for this process change are listed in Table 5.
City of Rogers - MnTAP Intern Report - 2011
Page 17
Table 5. MLE Equipment Costs
Part description Supplier Part number Quantity Price Total
4.9 hp submersible Impeller
Pump
Lakeside
Equipment/Landia
AXP-I 500 1 $38,800 $38,800
Pump VFD 1 $5,000 $5,000
Construction $11,200 $11,200

City of Rogers - MnTAP Intern Report - 2011
Page 18
Waste Issue 2: Energy use in Floating Pond Aerators
Quantity of Waste
The two preexisting floating pond aerators are run 24 hours a day 7 days a week and consume 240,000
kWh per year. I determined this value with name plate horsepower and motor efficiency. The aerators are
used to mix and oxygenate the secondary treatment and sludge storage pond. This pond stores the excess
sludge from the oxidation ditch process. Without aeration this sludge would not be treated, deplete the
oxygen in the pond, and emit bad smelling odors.
Management Method
Currently, there are two aerators running continuously with standard efficiency motors. Aside from
typical mechanical maintenance, there is very little to be managed, because the aerators are turned on and
left running for continual oxygenation of the holding pond. The only notable management occurs when
aerators break down. The City originally operated six floating pond aerators, which have been slowly
breaking in the last few years. The City workers have been scrapping the broken ones to maintain parts
for the remaining aerators. At this point only one aerator is in working order with another close to
working order. The motors for both aerators function without a problem. The nearly inoperable aerator
has a broken shaft. New equipment is needed before the old equipment stops working entirely.
Reasons for Researching Options
At one time the City of Rogers had six floating pond aerators in the 7.0 acre secondary treatment and
sludge storage pond. Currently, the City has only two aerators, because the others have broken down.
These aerators are 15 years old and utilize standard 82.5% efficient motors. Modern super premium
motors achieve 93.6% efficiency, which has the potential for large energy cost savings. One floating
aerator is currently in operation while one is in need of repair, although both motors are functioning
properly. In working with the operation staff it has been identified that two new floating aerators are
needed in the oxidation pond of the wastewater treatment plant.

City of Rogers - MnTAP Intern Report - 2011
Page 19
Reduction Option 2.1: Exchange Motor for Super Premium Efficiency Motor
Summary
Waste reduced (per year): 28,000 kWh
Implementation cost: $13,340
Cost savings (per year): $1,766
Payback period: 7.6 years
Status: The project is currently scheduled for implementation in mid-September of 2011. The super-
premium efficient motors are being shipped in from out of the country, and require additional time to
arrive. The payback period is greater than the desired 2 years, but is a necessary addition.
Benefits
This option will provide the City with functioning, long lasting aerators with increased energy efficiency.
The increase in motor efficiency of 11.1% yields a total energy consumption reduction of approximately
28,000 kWh per year and cost savings of $1,700 per year. In addition, there is evidence to suggest that
there will be fewer maintenance issues with this aerator compared to the previous ones. This information
is based on the testimonies of current product owners.
Economic Analysis
The total capital cost of the project is $13,340, which includes a $1,560 rebate from Xcel Energy for
upgrading existing motors. The City must apply for this rebate once the equipment has arrived. The cost
savings are derived from lowering the demand and energy consumption. The total cost savings per year
are $1,700, which was determined using the nameplate information on the new motors compared to the
old ones. Table 6 below displays an outline of the economic analysis comparing two different products,
different numbers of aerators, different size motors, and different levels of efficiency. The option with the
best payback was the Super Premium efficiency aerator from Aeration Industries International.
Table 6. Floating Pond Aerator Economic Analysis
Company Aeration Industries International Aeromix
Efficiency Premium Super Premium Super Premium
Number of Aerators 3 3 2 2 2
Nameplate Power (Hp) 10 10 15 15 15
Total Capital Cost (before rebate) $22,200 $23,700 $14,600 $14,900 $16,210
Total Capital Cost (after rebate) $21,150 $22,590 $13,100 $13,340 $14,710
Total Cost Savings per year $1,494 $1,638 $1,595 $1,766 $1,595
Payback Period (after rebate) 14.2 13.8 8.2 7.6 9.2
Implementation Status
This recommendation is currently planned for implementation. Delivery of equipment is scheduled for
mid-September 2011. The City must apply for the rebates upon equipment arrival. The equipment
summary and costs for this recommendation can be seen in Table 7
Table 7. Floating Pond Aerator Equipment Costs
Part description Supplier Quantity Price Total
15 hp Aire-O2® Aspirating
Aerator/Mixer
Aeration Industries
International, Inc.
2 $7450 $14,900

City of Rogers - MnTAP Intern Report - 2011
Page 20
Waste Issue 3: Ferric Chloride for Phosphorus Removal
Quantity of Waste
The City of Rogers currently uses approximately 300,000 pounds of ferric chloride each year for chemical
removal of phosphorus according to billing invoices from 2010. This chemical is an acidic and toxic
chemical, which can cause acute and chronic health effects including death.
Management Method
The chemical is currently added with a small chemical pump attached to a variable frequency drive
(VFD), which adds ferric chloride proportional to the flow.
Reasons for Researching Options
The City spends approximately $50,000 on ferric chloride each year. A biological phosphorus removal
process would greatly decrease this cost, and reduce pollution. The cost of ferric chloride is $0.1577/lb. If
the cost of this chemical increases significantly, this option should be re-evaluated for economic
feasibility.

City of Rogers - MnTAP Intern Report - 2011
Page 21
Reduction Option 3.1: Anaerobic Selectors for Biological Phosphorus Removal
Summary
Waste reduced (per year): 250,000 lb. of Ferric Chloride
Implementation cost: $750,000
Cost savings (per year): $40,000
Payback period: 18.7 years
Status: This option is not recommended for implementation for two main reasons. First, the project is not
cost effective with an 18.7 year payback period. Second, biological phosphorus removal is not a viable
option for the City due to their method of sludge management.
This option includes the installation of two anaerobic selectors in the treatment process prior to the
oxidation ditches. This would remove phosphorus biologically as opposed to chemically, reducing, but
not eliminating, the need for chemical treatment of phosphorus. This process change would require the
addition of two large tanks immediately before the oxidation ditches and piping to transport mixed liquor
from the oxidation ditch into the first anaerobic selector.
Benefits
The benefits of this project include cost reductions, pollution reduction, and safer process procedures.
Cost savings of $40,000 per year are expected at the City due to decreased chemical needs. Also, ferric
chloride is a corrosive toxic chemical which is harmful to the environment if released, and can be
dangerous for handling. By switching to biological phosphorus removal these pollution and safety
hazards would be greatly reduced.
Economic Analysis
I determined the capital cost for this project with the help of both Warren Kersten and John Seifert.
Warren verified my determination of tank sizes and supply information regarding necessary major capital
expenditures. These expenditures include two tanks, piping, mixers and gates as shown in Table 8. I
utilized an estimated quote from Gridor Construction that the tanks would cost $500/yd3 including
concrete, form work, rebar, and construction. I used rough estimates from John Seifert for gates, piping,
and excavation due to his extensive experience with construction projects. The capital cost includes a
10% contingency factor and 20% for engineering costs both based on the initial materials/construction
costs. These are rough estimates for the capital cost.
To determine the annual cost savings from biological phosphorus removal I assumed similar reductions as
seen at the Princeton, Minnesota wastewater treatment facility. I applied these reductions to the chemical
consumption at the City of Rogers based on chemical bills from 2010. The methodology for these
calculations is presented in the Biological Phosphorus Removal Calculations section of Appendix B at the
end of the report. The total cost savings are approximately $40,000 per year. The unit cost of ferric
chloride is approximately $0.1577/lb. although it fluctuates periodically.
Implementation Status
This process is not recommended at this time due to the nature of sludge storage currently utilized at the
plant. In the removal process, phosphorus is released into the oxidation ditch and taken up by various
microbes. The phosphorus is then removed from the water via sludge settling in the clarifiers. The sludge
not returned to the process is stored in the secondary oxidation pond. In many facilities this sludge is
removed from the process entirely, but at the City of Rogers plant the sludge is stored in the secondary
treatment and emergency storage pond. When the pond reaches high water levels decanting is required.
The supernatant liquid from this pond, which contains all the phosphorus, is passed through the oxidation
ditches prior to discharge from the plant. This would re-introduce the same phosphorus into the ditches
and create a cycle, because phosphorus is not removed from the system. The City of Rogers should

City of Rogers - MnTAP Intern Report - 2011
Page 22
implement biological phosphorus removal only if a different method of sludge treatment is utilized. In
addition, the savings do not justify the large capital cost.
The costs for the equipment needed for this process change are listed in Table 8. The total cost includes
an addition 10% contingency and 20% engineering costs based on this capital cost listed below.
Table 8. Equipment Costs
Part description Supplier Quantity Price Total
Tank/Construction Gridor Construction 2 $110,000 $220,000
Submersible Mixer Lakeside
Equipment /Landia
2 $24,000 $48,000
Gates Gridor Construction 5 $2,000 $10,000
Piping $50,000 $50,000
Excavation/Backfilling $250,000

City of Rogers - MnTAP Intern Report - 2011
Page 23
Appendices
Appendix A: Recognition and References
Special thanks to the following people for their input to this project:
MnTAP
A.J. Van den Berghe, Associate Engineer, 612.624.4653, [email protected]
Krysta Larson, Intern program coordinator, 612.624.4697, [email protected]
Sarah Haas, Interim intern program coordinator, 612.624.5119, [email protected]
City of Rogers
John Seifert, Public Works Superintendent, 763.428.8580, [email protected]
Dan Janish, Public Utilities Supervisor, 763.428.8580, [email protected]
Vendors and Consultants
Art Kearney, Field Environmental Instruments Inc. Branch Manager, 952.922.0023,
Doug Ranallo, Electric Resource Contractors, 612.522.6511
Todd A. Martin, Aeration Industries Regional Sales Support, 952.448.6789,
Warren Kersten, Lakeside Equipment Corporation P.E., Vice President & Regional Sales
Manager, 630.837.5640, [email protected]
Keith Koehler, City of Princeton Public Works Supervisor 763.390.2040,
Larry Guenther, Xcel Energy Account Manager, 612.630.4337, [email protected]
Harold Desautel, Preferred Controls President/Controls Engineer 320.845.6772,
Rob Hans, Total Energy Concepts Area Director, 763.441.2152, [email protected]
Terry Schiro, Vessco Inc. Manager Chemical Feed Systems, 952.314.0636, [email protected]
Travis Schlangen, Electric Pump Sales Representative, 952.758.6600, [email protected]
Mike Savelli, Hach Company, Regional Sales Manager, 800.227.4224 Ext. 2021
Mark Stommel, Electric Motor Repair, Inc. Sales Manager, 612.588.4693

City of Rogers - MnTAP Intern Report - 2011
Page 24
Sources
Beaty, H. W. Electric Motor Handbook. Ed. James L. Kirtley. New York: New York: McGraw-
Hill, 1998.
Berk, W.L. Things You Should Know About the Lakeside Oxidation Ditch. Lakeside Equipment
Corporation, 1984.
Biological Wastewater Treatment: Principles, Modelling and Design. Ed. M. Henze. London:
London: IWA Pub, 2008.
Energy Conservation in Water and Wastewater Treatment Facilities. Ed. Water Environment
Federation. Energy Conservation in Water and Wastewater Treatment Facilities Task
Force. Alexandria, VA: New York: Alexandria, VA: WEF Press, Water Environment
Federation; New York: McGraw-Hill, 2010.
McCoy, G.A. and J.G. Douglass. Energy Management for Motor Driven Systems. U.S.
Department of Energy Office of Industrial Technologies, Olympia: 2000.
Recommended Standards for Wastewater Facilities. 1990 ed. Health Education Services, Albany:
1990.

City of Rogers - MnTAP Intern Report - 2011
Page 25
Appendix B: Sample Calculations and Methodology
Rotor Power Consumption Calculations
The following equations were used to calculate the motor power output and motor load from the
measured current and voltage values along with motor nameplate information for the oxidation ditch
aerator motors. Only one phase was logged due to the number of rotors being measured; therefore, current
values are assumed to be approximately equal to the average of three phases despite representing only one
phase. The phase that was measured to have the middle value of line voltage was logged in each situation.
I also corrected for line overvoltage using a voltage variation chart (Figure 2) taken from the Office of
Industrial Technologies reference Energy Management for Motor Driven Systems.
√
Where:
P = Power [kW]
V = Voltage [V]
I = Current [A]
PF = Power Factor [%]
Figure 2. Effect of Voltage Variaton on Induction Motor Performance Characteristics

City of Rogers - MnTAP Intern Report - 2011
Page 26
The power factor was not listed on the nameplate information, and the company that supplied the motor
no longer had this information. The power factor was back calculated using other name plate information:
The load was calculated for each motor as follows.
Where:
P = Power [kW]
V = Voltage [V]
I = Current [A]
PF = Power Factor [%]
η = Motor Efficiency [%]
np = Subscript used to denote nameplate values

City of Rogers - MnTAP Intern Report - 2011
Page 27
Power Savings Cost Calculations
The energy cost calculations were determined using the sum of power consumption and demand charges
from Xcel Energy‟s Rates and Schedules Handbook. The environmental improvement factor (EIF) and
fuel cost charge (FCC) were found using an average of the past 12 months of billing data. I chose this
method, because the EIF and FCC are not constant values over time. The EIF values for demand and
consumption were also different from each other. I applied these calculations to the mixers, floating pond
aerators, and oxidation ditch rotors, systems that are all located on meters which reflect the same rate
schedule.
[
] [
] [
]
[
] (( ) ( ) )
( )
Where:
[ ]
[
]
[ ]
[
]
[
]
[
]
[
]
[
]
[
]
[
]

City of Rogers - MnTAP Intern Report - 2011
Page 28
Motor/Mixer Cost Calculations
This methodology was used to calculate demand and consumption for mixers and floating pond aerators.
Where:
[ ] [ ] [ ]
[
]
[
]
[
]

City of Rogers - MnTAP Intern Report - 2011
Page 29
System Optimization Calculations
I used the following equation from the Lakeside Equipment Co. oxidation ditch information manual.
(
) ( ( ))
Where:
[
]
[
]
[
]
[ ]
[
]
To determine the optimum ditch operation I measured DO numbers in the oxidation ditch every ten
minutes for 48 hours. I used these concentration values for CL, recommended values for all other
constants, and found AOTR values at every given concentration. The AOTR value represents the oxygen
required to handle the incoming load. I assumed the process needed to be operated at a level where the
lowest concentration measured would remain above the minimum desired concentration of 0.5 mg/L. This
smallest concentration was 0.86 mg/L. I used this information to determine a needed SOTR value of
5,119
as shown in the equation below.
(
) ( ( ))
I then created a chart of immersion depths versus SOTR values and fit an equation to the data based on
the lakeside SOTR numbers. This chart is shown in Figure 3.

City of Rogers - MnTAP Intern Report - 2011
Page 30
Figure 3. Oxygenation Capacity vs. Rotor Immersion Depth under Standard Conditions
Using this equation I found the immersion depth at which the given SOTR of 5,119 lb./day could be
utilized. This calculation resulted in an immersion depth of 12.6”. I used linear interpolation with data I
had taken of power consumption at varying depths to find the power consumption at 12.6”. I then
followed the procedures in the Mixer/Cost Calculations and Power Consumption Calculations sections to
determine energy use and cost savings. I also evaluated the effects of temperature on the operation of the
oxidation ditch rotors, because water is easier to aerate when cold due to the increased saturation value of
oxygen at lower temperatures. The difference realized at these temperatures was minimal and therefore
not included.
y = -19.804x2 + 790.11x - 1703.3 R² = 0.9979
0
1000
2000
3000
4000
5000
6000
0 2 4 6 8 10 12 14 16
y =
SOTR
Oxy
gen
atio
n C
apac
ity
(lb
/day
)
x = Immersion Depth (in)
High Speed
Poly. (High Speed)

City of Rogers - MnTAP Intern Report - 2011
Page 31
VFD Calculations
For these calculations I collected DO concentration readings in the secondary oxidation ditch effluent
weir every 10 minutes for 48 hours. I then used this data, the motor power consumption values calculated
in the Motor Power Calculations section above, and the aeration equation from the System Optimization
Calculations Section to determine energy savings with VFDs. To start, I found the SOTR (lb./day) for the
current operation using Figure 4 and the current feet of rotors. Variables are defined at the end of this
section.
Figure 4. Oxygenation Capacity vs. Rotor Immersion Depth under Standard Conditions
Next, I found the needed AOTR values for the different DO concentrations using the equation below:
(
) ( ( ))
City of Rogers - MnTAP Intern Report - 2011
Page 32
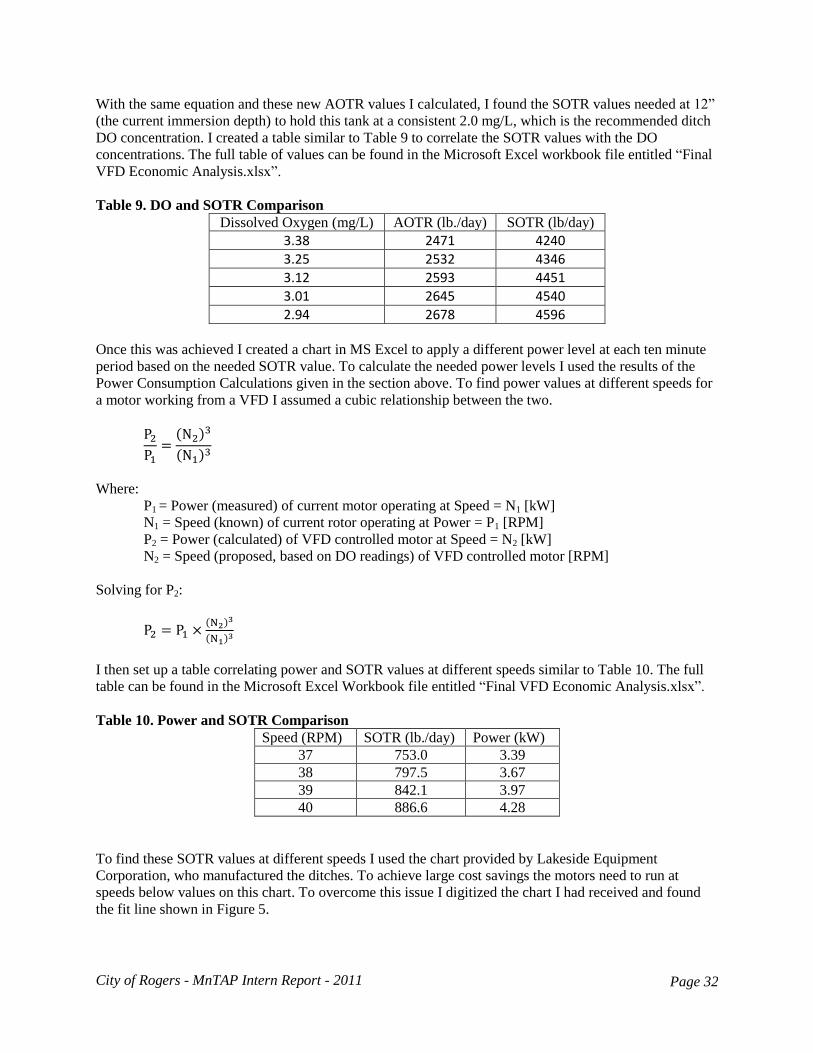
With the same equation and these new AOTR values I calculated, I found the SOTR values needed at 12”
(the current immersion depth) to hold this tank at a consistent 2.0 mg/L, which is the recommended ditch
DO concentration. I created a table similar to Table 9 to correlate the SOTR values with the DO
concentrations. The full table of values can be found in the Microsoft Excel workbook file entitled “Final
VFD Economic Analysis.xlsx”.
Table 9. DO and SOTR Comparison
Dissolved Oxygen (mg/L) AOTR (lb./day) SOTR (lb/day)
3.38 2471 4240
3.25 2532 4346
3.12 2593 4451
3.01 2645 4540
2.94 2678 4596
Once this was achieved I created a chart in MS Excel to apply a different power level at each ten minute
period based on the needed SOTR value. To calculate the needed power levels I used the results of the
Power Consumption Calculations given in the section above. To find power values at different speeds for
a motor working from a VFD I assumed a cubic relationship between the two.
( )
( )
Where:
P1 = Power (measured) of current motor operating at Speed = N1 [kW]
N1 = Speed (known) of current rotor operating at Power = P1 [RPM]
P2 = Power (calculated) of VFD controlled motor at Speed = N2 [kW]
N2 = Speed (proposed, based on DO readings) of VFD controlled motor [RPM]
Solving for P2:
( )
( )
I then set up a table correlating power and SOTR values at different speeds similar to Table 10. The full
table can be found in the Microsoft Excel Workbook file entitled “Final VFD Economic Analysis.xlsx”.
Table 10. Power and SOTR Comparison
Speed (RPM) SOTR (lb./day) Power (kW)
37 753.0 3.39
38 797.5 3.67
39 842.1 3.97
40 886.6 4.28
To find these SOTR values at different speeds I used the chart provided by Lakeside Equipment
Corporation, who manufactured the ditches. To achieve large cost savings the motors need to run at
speeds below values on this chart. To overcome this issue I digitized the chart I had received and found
the fit line shown in Figure 5.

City of Rogers - MnTAP Intern Report - 2011
Page 33
Figure 5: Oxygenation Capacity to Water
To extrapolate values beyond those given I assumed a linear relationship beyond the bounds of this
equation with a slope equal to the value at the lowest or highest value in the chart. That is, for values
above and below those given in the chart I used a slope equal to the slope at 72 RPMs and 50 RPMs
respectively. I tried numerous fit equations but decided this method to be the best, because it is based on
data and gives a conservative estimate. This calculation is shown below:
( ) ( ) ( )
Using a known value from the Lakeside Chart Figure 4 (point on a line), the slope, and simple algebra I
then found the desired equation to be:
( )
I followed the same process to find values above the chart as well, which creates the following piecewise
function:
for N<50 for 50≤N≤72 for N>72
For each DO value in Table 9 I looked up the corresponding SOTR value (or the closest possible number)
in Table 10 and read across to determine the corresponding power numbers. I used this method to assign a
power value for each DO concentration in a ten minute period. I then calculated the number of kWh used
in each ten minute period. I summed these to get total energy consumption in the 48 hour period. I used
y = -0.0986x3 + 17.675x2 - 990.96x + 19017 R² = 0.9989
0
500
1000
1500
2000
2500
3000
48 50 52 54 56 58 60 62 64 66 68 70 72 74
y =
Po
un
ds
O2
Pe
r D
ay a
t In
dic
ate
d L
en
gth
of
Ro
tor
x = Rotor Speed - RPM
Oxygenation Capacity to WATER (42" dia., zero D.O., 20°C, 760 mmHg)
5 8 10 12 15 Poly. (12)

City of Rogers - MnTAP Intern Report - 2011
Page 34
the maximum demand as a basis for monthly demand charges and summed the total kWh found in the 48
hours for the cost estimate calculations. This methodology is given in the Power Savings and Cost
Calculations section above. I assumed the same DO and power values would apply throughout the year.
Because more oxygenation is required in warmer temperatures I assumed a value of 20 °C for a
conservative estimate following the methodology of Lakeside Equipment.
VFD variable definitions
[
]
[
]
[
]
[ ]
[
]
[ ] [ )] [ ] ( ) [ ]

City of Rogers - MnTAP Intern Report - 2011
Page 35
Modified Ludzack-Ettinger Process Calculations
These calculations are very similar to the Variable Frequency Drives Calculations in the section above
with a few additions. First, one ditch is operated at 0.25 mg/L and the other at 2.0 mg/L. Because of this,
each ditch is calculated individually. The first ditch is operated under anoxic conditions to remove
nitrogen biologically. This also allows for an oxygen denitrificaiton credit. This occurs because organisms
can use oxygen from the nitrate nitrogen in addition to free oxygen. The process to calculate this
denitrification credit is given below. First, I calculated the amount of total nitrogen that exists as nitrate
nitrogen in typical municipal wastewater. Variables are defined at the end of this section.
The next step was to calculate the total Kjeldahl nitrogen (TKN) in lbs./day at the Rogers facility. TKN is
the sum of ammonia and ammonium nitrogen only, whereas TN also includes the nitrate and nitrite
nitrogen. This is typically done using observed TKN data. Because I did not have readily available data
for TKN, I used the AOTR values calculated from the DO as shown in the VFD calculations. I used the
average AOTR value given from these calculations and averaged BOD data from the previous seven
years. The following equation displays the relationship between AOTR and the oxygen required to
breakdown BOD and TKN. Using this equation and the average daily flow rate based on past data I found
an approximation for the quantity of TKN in the daily wastewater influent.
The oxygen recovery is then calculated below. The 0.63 is the typical value used for the maximum
percent oxygen recovery and the 0.8 is the percent denitrification as calculated above.
This value was subtracted from the AOTR values calculated from the DO data, which were calculated the
same as in the VFD section. Finally, the MLE calculations require calculations of two ditches rather than
just one. The percentage of AOTR applying to each ditch is not a direct 50:50 proportion. The
denitrification reactor (0.25mg/L DO) receives 56.56% of the AOTR and the Nitrification reactor receives
43.44%. The rest of the calculations are identical to the VFD calculations given above.
[
] [
]
[
]
[
]
[
] [
]
[
]
[
]

City of Rogers - MnTAP Intern Report - 2011
Page 36
Biological Phosphorus Removal Calculations
To determine the cost savings for the biological phosphorus removal (BioP) process I assumed the City of
Rogers would see the same percent reduction in chemical usage as the City of Princeton, because it is a
similar facility in size and operation to the City of Rogers‟ facility. The Public Works Supervisor at the
City of Princeton stated that their chemical reductions were 90% in winter and 66% in summer. I used
past bills to determine the current chemical consumption and cost, and applied these reductions to the
billing information. This assumes the chemical use is consistent throughout the year. This calculation is
shown below. Variables are defined at the end of this section
( )
(
)
The same calculation was applied to the chemical usage numbers to determine the total chemicals saved.
To determine the capital cost I first needed to calculate the size of the two anaerobic selectors. For this I
assumed a hydraulic retention time of two hours, which was suggested by Warren Kersten of Lakeside
Equipment, and the design flow rate for the facility of 1.602 million gallons per day (MGD). I calculated
the corresponding volume as follows
To determine dimensions for the tank I used a depth and width similar to that of the oxidation ditches and
calculated a length from the volume and these assumed dimensions. This is shown below:
This means that two tanks with dimensions 10 ft x 20ft x 44.5 ft will be required. With these dimensions
determined I calculated the volume of concrete required for such a tank size assuming a 2 foot thick floor
and 1 foot wide side walls, because these are similar to the oxidation ditch as well. This yielded 439 cubic
yards. I then assumed the construction, formwork, and rebar for this tank would be $500/yd3 per Gridor
Construction‟s recommendation. The total capital cost assumes a 10% contingency and 20% engineering
costs on the base materials/construction costs.
Where:
[ ]
[
]
[ ] [ ] [ ] [ ]