jvops 6 workshop report flemingco · pdf filehydraulic flow curve for the test pump in...
TRANSCRIPT

JVOPS 6 Workshop Report flemingCo environmental
125
7.0 EVALUATION OF TEST RESULTS Analysis of the JVOPS Workshop test results has been based on the Data Collection Sheets in section 6.5 and on the graphs developed from electronically recorded data. The graphs have been inserted in context with the analysis text for each test. It is recommended to consult both the data sheets and the graphs. The data in the Data Collection Sheets have been extracted from raw data in the following way:
1. Pump pressure (P(pump)), hydraulic flow (Q(hydr)), and hydraulic differential pressure ∆P(hydr) are expressions for performance and corresponding relative power consumption at the individual “Mark Data” point at the end of each test run. Ideally these data should be extracted as they are exactly at the mark point, but due to pulsations from the test pumps they have been averaged over the last 10 seconds leading up to the mark point. Q(hydr) has been used for the conversion to apparent pump capacity (Q(pump)) at the time of the mark point (Q(WL in) has been subtracted).
2. The discharge oil temperature (T(oil/disch)) (manual) is at the mark point.
3. WL flows (Q(WL in) and Q(WL out)), WL temperatures (T(WL in) and T(WL out)), and the oil
temperatures (T(oil/bulk) and T(oil/inlet) have been extracted as averages over the test run.
Please note that backup data have not consistently been filled in. They are used only where they become important due to failure of an electronic recording or where electronic and manual backup deviate significantly. Measuring Performance Improvement A Performance Improvement Factor (PIF) has been defined to facilitate comparison between the performance with different water lubrication combinations/settings and the performance without lube water (baseline). PIF = (Pressure drop(no lube) / Pressure drop(with lube)) x (Capacity(with lube) / Capacity(no lube)) A special variant of the PIF is used where in-flow to the pump, and not pressure, is the limiting factor in baseline testing without water lubrication. See section 7.9. Another variant is used where the baseline test was with a shorter test hose than in the test run in question. In these cases the calculated PIF has been multiplied with the actual test hose length divided by the hose length of the baseline test. See sections 7.5 and 7.9.

JVOPS 6 Workshop Report flemingCo environmental
126
Static Lift At the USCG test line the point of discharge from the test hoses was 7 ft above ground level. The oil level in the USCG test tank was – when full – close to 10 ft above ground. The test pumps sucked from 1 to 2 ft above ground. Since the USCG test oil was not pumped back to the test tank, the oil level would gradually drop during a test, typically not lower than to 3 to 4 ft above ground. Therefore the test pumps are supported by a negative static lift of 1 psi early in the test, decreasing to 0 psi at 7 ft oil level. Below 7 ft oil level a positive static lift increases to 1 psi when the oil level is down to 4 ft above ground. In the analysis of the pre-tests, with very low pump pressures, the static lift (positive or negative) has been considered. In tests over longer distances (Tests 2 and 3) the static lift has not been considered due to the less significance on the overall results. At the CCG test line the hose discharge end was placed 5 ft above the oil level in the test tank. The oil was via the oil/water separating skimmer delivered back to the test tank during testing, so the oil level remained at the same throughout a test. Therefore a static lift of 2 psi must be deducted from the recorded pump pressures when determining the real hose pressure drops. 7.1 General Test Procedure In the test results analysis context it may be convenient to be familiar with the following general test procedure: 7.1.1 Pump deployment and pump start A test pump equipped with the AWIFs relevant for the test in question and connected to the riser and test hoses would be submerged in the oil while outlet lube water would be injected in order to pressure balance the oil outside the riser hose and to prime the test hose. A volume of approx. 20 gallons would be injected. If inlet side AWI would be applied in the test in question, hot inlet lube water would be injected for about 30 seconds prior to starting the pump. This volume would also be of approx. 20 gallons. The hot inlet side lube water would provide heat to the pump intake and to the oil adjacent to the pump intake, thus facilitating the initial inflow of viscous oil. 7.1.2 Run-In Period Once the pump was started, the RPM (Q(hydr)) would be gradually increased to the maximum for the pump (analog hydraulic flow meter at tank top) while observing that the maximum permissible discharge pressure would not be exceeded (analog pump pressure gauge at tank top). The run-in period would use the WL gpm settings that would apply for the first run.

JVOPS 6 Workshop Report flemingCo environmental
127
7.1.3 Test Runs Once the core annular flow had stabilized (if possible) (analog pump pressure gauge at tank top) at max. possible RPM, the WL settings on the WLCS would be adjusted to those of Run 1. Run 1 would start and go on for the amount of seconds required to establish the same settings throughout the test hose. The Apparent Pump Capacity vs. Hydraulic Flow curve for the test pump in question and the Hose fill Time vs. Apparent Pump Capacity curves would be used to determine the required length of time. A safety margin of 10 to 20 seconds was added and the Technical Support Engineer would notify the Lead Engineer, who over the radio would announce to all data stations “Mark Data”. Immediately after the Lead Engineer would then announce: “Make drum fill”. After completion of the drum fill the lube water would be adjusted to the settings of the next run and the procedures would be repeated until all runs had been completed. The order of WL flow rates were always the expectedly best settings and combinations first (Run 1), then the next best (Run2), etc. until finally the baseline test without lube water (if applicable). The priority of the pre-determined WL settings and combinations were based on the experience from previous extreme viscosity pump testing in Canada (2 million cSt) and Denmark (3 million cSt). See also section 6.1.1. 7.1.4 Drum Fill Pump Capacity Verification Section 6.3.11.5 describes the drum fill test method that was used to verify the apparent pump capacity (based on the hydraulic flow). The accuracy of this method is expected to be about +/- 4% at 100 USgpm and about +/- 10 % at 280 USgpm but it provides valuable information on possible significant inflow slippage at the test pump intake. If there, within the expected 10% accuracy, is correlation with the calculated apparent oil flow, the drum fill capacity will not be used. The drum fill capacity will otherwise be used where the electronic recording of hydraulic flow failed, thus making it impossible to calculate the apparent pump capacity. 7.2 Tests 0/1 and 0/2 (Please see the Data Collection Sheets for Tests 0/1 and 0/2 in section 6.5 and Graphs 0/1 and 0/2 below). The first JVOPS Workshop oil test, consisting of two test sections (Test 0/1 and 0/2), had two purposes:
1. To evaluate the standard USCG/US Navy discharge side AWIF against a revised design discharge side AWIF with a claimed more uniform distribution of the lube water around the oil core. The result would determine which flange model to use for all the remaining tests. See section 7.2.1 and 7.2.2 below.

JVOPS 6 Workshop Report flemingCo environmental
128
2. To verify whether cold or tempered water would be better for discharge side water lubrication. The result would determine which water type to use for all the remaining tests or if it matters at all whether cold or tempered water is applied. See section 7.2.2 below.
Oil at approximately 25,000 cSt (test oil heated to 107 F / 42 C) was at the USCG test line pumped through 107.5 ft of 6” hose with two different DOP-250 pumps that in the water pre test had proved to perform equally well. One pump was equipped with the standard discharge AWIF from the USCG VOPS inventory (Test 0/1) and the other with the revised flemingCo design (Test 0/2). Clean pumps, riser hoses, and test hoses were used in both test sections. The two pumps can be seen in Figure 46. Other notes:
• No “drum fill” measurements were carried out in this test since previous VOPS testing had verified that the DOP-250 pump at this relatively low viscosity can drag in the oil without slippage. In other words, it drags in a volume per revolution that is the same as its theoretical displacement per revolution.
• This was the only test at the JVOPS Workshop where heat was not applied at the
pump intake. Therefore the temperature of the oil that the pump dragged in in Tests 0/1 and 0/2 has been used for viscosity determination. In all other tests the viscosity has been based on the readings of the bulk oil temperature sensors.
Figure 46 US Navy DOP-250 with ”new” flemingCo discharge side AWIF (left) USCG DOP-250 with ”old” USN/USCG/FRAMO type discharge side AWIF (right)
AWIF
AWIF

Tes
t Oil
Visc
osity
vs.
Tem
pera
ture
A
naly
sis
per
form
ed o
n B
roo
kfie
ld D
VII
+ R
ota
ry V
isco
met
erw
/Sm
all
Sam
ple
Ad
apto
r sp
ind
le #
27
@ S
hear
Rat
e o
f .0
7 se
c^(-
1)
y =
4E+1
6x-6
,09
R2 =
0,9
982
2000
7000
1200
017
000
2200
027
000
3200
037
000
4200
047
000
5200
057
000
6200
067
000
7200
077
000
8200
087
000
9200
097
000
1020
0010
7000
1120
0011
7000
1220
0012
7000
1320
0013
7000
1420
0014
7000
1520
0015
7000
1620
0016
7000
1720
0017
7000
1820
0018
7000
1920
0019
7000
2020
0020
7000
2120
0021
7000
2220
0022
7000
2320
0023
7000
2420
0024
7000
2520
0025
7000
2620
0026
7000
2720
0027
7000
2820
0028
7000
2920
0029
7000
3020
0030
7000
6668
7072
7476
7880
8284
8688
9092
9496
9810
010
210
410
610
811
011
211
411
611
812
012
212
4
Tem
erat
ure
Deg
ree
F
Viscosity cSt
< M
easu
red
From
Ave
rage
of O
il Sa
mpl
e Vi
scos
ities
Dur
ing
JVO
PS T
estin
g D
ec 0
3
Figu
re 4
7 V
isco
sity
vs.
Tem
pera
ture
Cur
ve o
n th
e JV
OPS
Tes
t Oil
(hig
h te
mpe
ratu
re se
ctio
n), P
repa
red
by G
PC
JVOPS 6 Workshop Report flemingCo environmental
129

JVOPS 6 Workshop Report flemingCo environmental
130
7.2.1 Test 0/1 USCG DOP-250 w. Std. VOPS Discharge Side AWIF Test Date 10 December, 2003 Test Line USCG Test Pump DESMI DOP-250 PDAS Pump from USCG VOPS System Pump Motor Sauer-Danfoss OMTS 315 High Torque Motor Inlet AWIF N/A Outlet AWIF Standard USCG/USN VOPS Discharge side AWIF Test Hose 107.5 ft 6” lay flat type including riser hose arrangement Test Oil JCOS Bitumen Crude Oil Target Viscosity 25,000 to 50,000 cSt Measured Viscosity 21,000 cSt @ 106 F (Dec. 03 Temp-Viscosity Curve, Fig. 47) Three test runs were carried out with respectively 8.8, 5, and 3.3 % discharge side lube water that was expected to be tempered (same or slightly higher temperature than that of the oil). However, especially the data logger (DL) and less significantly the manual backup logged temperatures lower than the target temperature of 100 to 110 F, even though the tempered lube water tank was 95 F. Three similar runs using cold lube water (significantly colder than the oil) had been planned but were cancelled due to a malfunction in the WL system. The three completed runs all show a hose pressure drop in the 4.4 psi range at an average apparent pump capacity of 293 USgpm, and provide no initial information on which WL % setting is the best. There is a slight downwards trend in relative power consumption (∆ P(hydr)) from run 1 to 3, even though the pump capacity increases slightly, which could indicate a slightly increasing WL performance from run 1 to 3. However, this could in part be due to a gradually increasing hydraulic oil temperature (decreasing viscosity) causing less power loss in the hydraulic hoses. At the same time it should be considered that the oil level over the pump is gradually decreasing as the test goes on, thus assisting the pump less and less. During the three runs the pump transferred oil for about 6 minutes at an average rate of 293 USgpm, or in total 40 bbl. The test tank is 9 ft x 10 ft over the tapered section. This means that the oil level sank about 2.7 ft from start to end, equivalent to a reduction of 1 psi in the static pressure that would assist the pump at the end of run 3. The above considerations indicate that the water lubrication became more and more efficient as the test went on, even though the WL % was reduced from nominally 10 to 4%. This corresponds well with the results from some of the later tests, where the same phenomenon was observed. The three runs with cold lube water that could not be completed were not considered essential since the tempered vs. cold water lube water comparison would also be part of Test 0/2. Therefore it was decided not to set up for a new Test 0/1. The WL system was fixed and preparations were made for Test 0/2.
JVOPS 6 Workshop Report flemingCo environmental
131
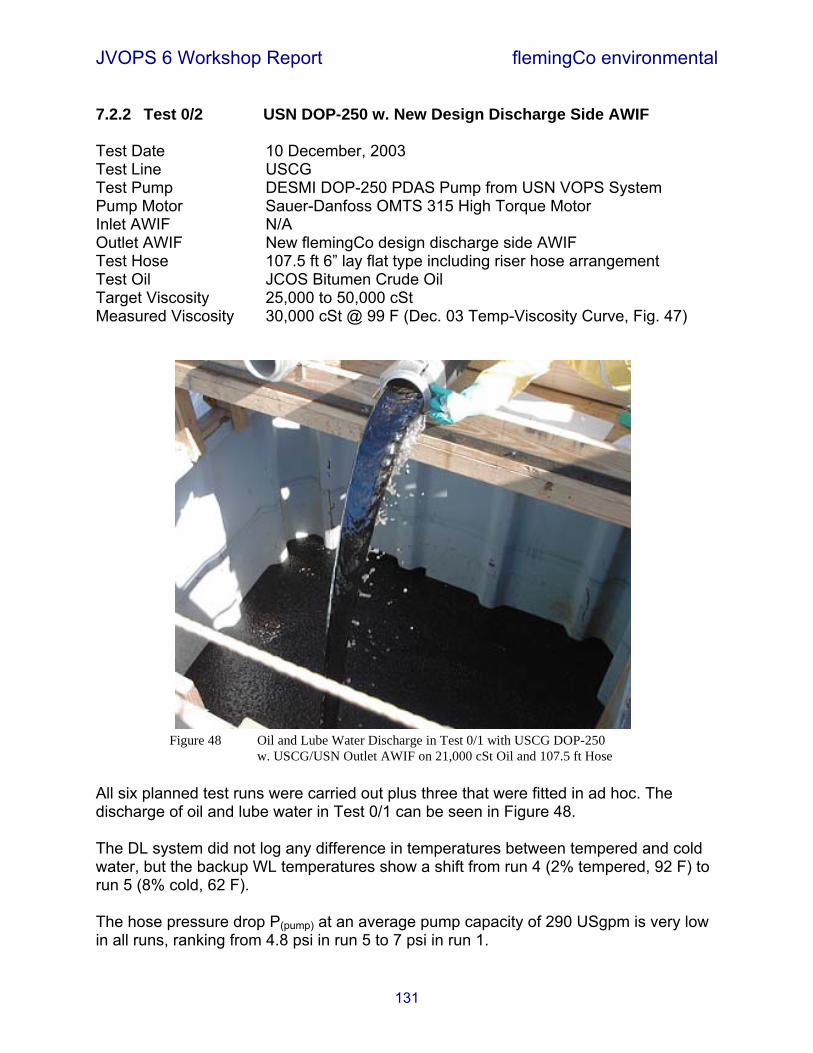
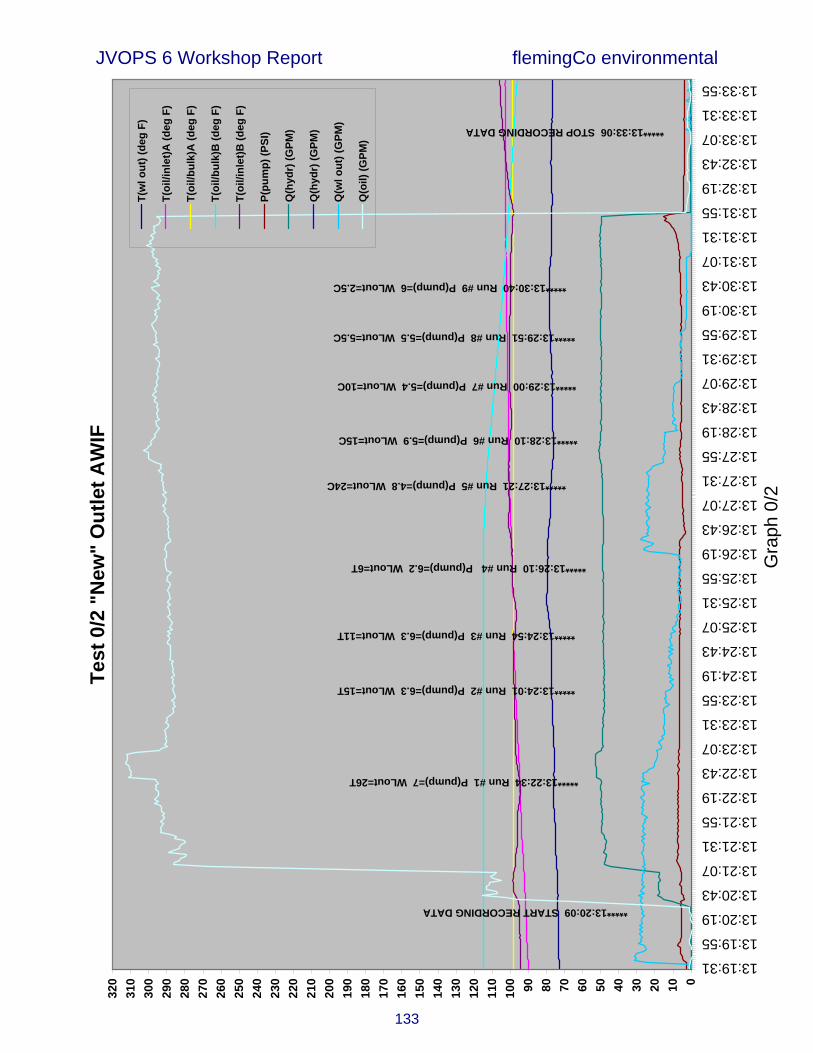
7.2.2 Test 0/2 USN DOP-250 w. New Design Discharge Side AWIF Test Date 10 December, 2003 Test Line USCG Test Pump DESMI DOP-250 PDAS Pump from USN VOPS System Pump Motor Sauer-Danfoss OMTS 315 High Torque Motor Inlet AWIF N/A Outlet AWIF New flemingCo design discharge side AWIF Test Hose 107.5 ft 6” lay flat type including riser hose arrangement Test Oil JCOS Bitumen Crude Oil Target Viscosity 25,000 to 50,000 cSt Measured Viscosity 30,000 cSt @ 99 F (Dec. 03 Temp-Viscosity Curve, Fig. 47) All six planned test runs were carried out plus three that were fitted in ad hoc. The discharge of oil and lube water in Test 0/1 can be seen in Figure 48. The DL system did not log any difference in temperatures between tempered and cold water, but the backup WL temperatures show a shift from run 4 (2% tempered, 92 F) to run 5 (8% cold, 62 F). The hose pressure drop P(pump) at an average pump capacity of 290 USgpm is very low in all runs, ranking from 4.8 psi in run 5 to 7 psi in run 1.
Figure 48 Oil and Lube Water Discharge in Test 0/1 with USCG DOP-250 w. USCG/USN Outlet AWIF on 21,000 cSt Oil and 107.5 ft Hose

JVOPS 6 Workshop Report flemingCo environmental
132
Gra
ph 0
/1
Test
0/1
"O
ld"
Out
let A
WIF
0102030405060708090100
110
120
130
140
150
160
170
180
190
200
210
220
230
240
250
260
270
280
290
300
310
320
11:33:35
11:33:53
11:34:11
11:34:29
11:34:47
11:35:05
11:35:23
11:35:41
11:35:59
11:36:17
11:36:35
11:36:53
11:37:11
11:37:29
11:37:47
11:38:05
11:38:23
11:38:41
11:38:59
11:39:17
11:39:35
11:39:53
11:40:11
11:40:29
11:40:47
11:41:05
11:41:23
11:41:41
11:41:59
11:42:17
11:42:35
11:42:53
T(w
l out
) (de
g F)
T(oi
l/inl
et)A
(deg
F)
T(oi
l/bul
k)A
(deg
F)
T(oi
l/bul
k)B
(deg
F)
T(oi
l/inl
et)B
(deg
F)
P(pu
mp)
(PSI
)Q
(hyd
r) (G
PM)
Q(w
l out
) (G
PM)
Q(o
il) (G
PM)
*****11:33:35 START RECORDING DATA
*****11:35:48 Start Pump
*****11:38:30 Run #1 P(pump)=4,4 WLout=25T
*****11:39:50 Run #2 P(pump)=4.4 WLout=15T
*****11:40:54 Run #3 P(pump)=4.3 WLout=10T
*****11:42:57 STOP RECORDING DATA
JVOPS 6 Workshop Report flemingCo environmental
133
Gra
ph 0
/2
Test
0/2
"N
ew"
Out
let A
WIF
0102030405060708090100
110
120
130
140
150
160
170
180
190
200
210
220
230
240
250
260
270
280
290
300
310
320
13:19:31
13:19:55
13:20:19
13:20:43
13:21:07
13:21:31
13:21:55
13:22:19
13:22:43
13:23:07
13:23:31
13:23:55
13:24:19
13:24:43
13:25:07
13:25:31
13:25:55
13:26:19
13:26:43
13:27:07
13:27:31
13:27:55
13:28:19
13:28:43
13:29:07
13:29:31
13:29:55
13:30:19
13:30:43
13:31:07
13:31:31
13:31:55
13:32:19
13:32:43
13:33:07
13:33:31
13:33:55
T(w
l out
) (de
g F)
T(oi
l/inl
et)A
(deg
F)
T(oi
l/bul
k)A
(deg
F)
T(oi
l/bul
k)B
(deg
F)
T(oi
l/inl
et)B
(deg
F)
P(pu
mp)
(PSI
)
Q(h
ydr)
(GPM
)
Q(h
ydr)
(GPM
)
Q(w
l out
) (G
PM)
Q(o
il) (G
PM)
*****13:22:34 Run #1 P(pump)=7 WLout=26T
*****13:24:01 Run #2 P(pump)=6.3 WLout=15T
*****13:24:54 Run #3 P(pump)=6.3 WLout=11T
*****13:26:10 Run #4 P(pump)=6.2 WLout=6T
*****13:27:21 Run #5 P(pump)=4.8 WLout=24C
*****13:28:10 Run #6 P(pump)=5.9 WLout=15C
*****13:29:00 Run #7 P(pump)=5.4 WLout=10C
*****13:29:51 Run #8 P(pump)=5.5 WLout=5.5C
*****13:30:40 Run #9 P(pump)=6 WLout=2.5C
*****13:33:06 STOP RECORDING DATA
*****13:20:09 START RECORDING DATA

JVOPS 6 Workshop Report flemingCo environmental
134
In runs 1 to 3, the pressure drops are close to the same, but slightly higher when comparing with the similar runs 1 to 3 in Test 0/1, while relative power consumption remains almost the same. This should speak in favour of the “old” USCG VOPS AWIF. However, the higher viscosity of the oil in the test with the “new” AWIF may be part the reason for the slightly higher pressure drop (the test oil bulk temperature had apparently kept stable according to the two bulk oil temperature sensors, but the oil that in Test 0/2 was dragged into the pump was colder than in Test 0/1). To this should be added the impact of the reduction in static oil pressure on pump inlet of 1 psi from Test 0/1 to Test 0/2, as mentioned in the previous section. The small variations in actual lube water flow from Test 0/1 to Test 0/2 are not considered to have any impact on the average difference in the pressure drop between runs 1 to 3 in the two test sections. Both tests demonstrate very little sensitivity to even large variations in lube water percentage. Runs 1 to 4 are with “tempered” lube water while runs 5 to 9 are with “cold”. Unfortunately the registered temperature difference between tempered and cold is smaller than planned, even though the WL tanks were on or close to targets. However, there seems to be a slight decrease in hose pressure drop after switching to “cold” and the further reduced static pressure on the pump intake from the gradually decreasing column of oil over the pump further amplifies the impression that the colder water lubricates better than the more tempered. Against this works the previously mentioned observation that the water lubrication in several tests typically became more and more efficient as the test went on. Not so much because of more efficient lube water settings but rather as a result of a continuously improving WL effect. Test 0/2 included three ad hoc runs. Run 4 and 8 were with 2% tempered and 2% cold lube water respectively. Run 9 was with only 1% cold discharge side lube water. Going from 4 to 2 % had, with both tempered and cold water, almost no impact. Going from 2 to 1 % cold lube water caused a minimal pressure increase of 0.5 psi. 7.2.3 Conclusions on Tests 0/1 and 0/2 Both AWIFs lubricated the oil so well that the pressure losses in the test hoses were extremely low but the “old” version apparently performed marginally better. It is difficult to draw conclusions based on the retrieved data because the test oil for the new AWIF had a higher viscosity and the oil layer over the pump was reduced in this test. The accuracy of the pressure transducers that were used to log the pressure drops is in the +/- 1.5 psi range dependent on type in question. The small variations in injected water from the old to the new AWIF are as mentioned above not considered to have had any influence. However, since the new flange apparently did not perform better than the old, it was decided to continue using the old USCG VOPS discharge side AWIF for all other tests with the USCG DOP-250 pump. The temperature difference between the two lube water types was too small for a real comparison. The colder water (62 F) apparently provided marginally better lubrication

JVOPS 6 Workshop Report flemingCo environmental
135
than the more tempered water (92 F), so the results indicate – at least for relatively low viscosity oil – that colder water will lubricate as well or better than water with almost the same temperature as the oil. The remaining tests should as per the Test Plan involve hot and colder water (best of tempered and cold). Due to the lack of significance in performance it was for “cold” lube water decided to use ambient temperature water – typically about 65 F – for the remaining tests. This would mean that the cold water in the remaining tests in fact was close to be tempered, since the target oil temperatures were 70 F (USCG 200,000 cSt) and 60 F (CCG 500,000 cSt). The use of ambient temperature “cold” lube water would further free resources that would otherwise have been allocated to chilling the cold lube water tank, and all chilling power could be used for control of the viscosities of the test oil at the two test lines. Both tests revealed that the core annular flow with this test oil at 20 – 30,000 cSt can be established and maintained through 107.5 ft of test hose at a very low pressure drop of down to 4 psi even at full pump capacity. The pressure drops were so low and the performance differences between different WL settings so minimal that only testing with much longer test hoses could have provided significant insight. The tests also brought the first indications on how the core annular flow may get closer to ideal over time. However, since the test oil had been of relatively low viscosity, and because a sufficient amount of test hoses and test oil would be unavailable, it was not considered to increase the pumping distances for the pre tests with the 200,000 and 500,000 cSt oil, nor was it considered to extend the time of each test run.

JVOPS 6 Workshop Report flemingCo environmental
136
7.3 Tests 1/1 and 1/2 Pre Tests at the USCG Test Line (Please see Data Collection Sheets for Tests 1/1 and 1/2 in section 6.5 and Graphs 1/1 and 1/2 below). The purposes of these pre tests were
1. Test 1/1: To find the best WL type of inlet only, outlet only, and inlet plus outlet, and provide information on best lube water type, hot or cold or combination.
2. Test 1/2: To optimize the WL percentages for the best combinations of
Test 1/1.
3. As per the December on-site revision of the Test Plan a simulated unintended pump stop and an attempt to restart the pumping process, first without lube water and then fully hot water lubricated, would be a part of Test 1/2. The test would start up with the contaminated test pump and the oil/lube water filled test hose that had been left untouched for minimum 15 minutes after Test 1/1.
The test oil in the USCG backup tank had been thoroughly mixed by the submerged DOP-250 mix and transfer pump, and an unexpected heat increase from this activity was detected too late. While the average oil temperature had been below but close to target, it had been observed that the temperatures close to the tank bottom near the transfer pump were too low. This initiated the decision on excessive mixing prior to Tests 1/1 and 1/2. After transfer to the USCG test tank (which further would add about 5 F to the test oil) the test oil was at about 150,000 cSt where the target had been 200,000 cSt. Fortunately, for the main purposes of the two pre tests this was not considered a serious problem, but it caused intensified attention on both mixing and chilling for the remaining tests. The Data Logger sensor for outlet lube water temperature failed in these tests, so backup data has been used. However, the backup readings of both inlet and outlet lube water temperatures seem too low for hot water and too high for cold water. The two lube water tanks (hot and cold (ambient)) were on target temperatures and were each mixed by circulation via the WLCS. The backup lube water temperatures tend to follow changes in WL temperature settings with a significant delay. The lube water temperatures used for analysis of the results will therefore mainly rely on the electronic recordings for inlet lube water and on the pre-determined settings (hot or cold) for the outlet lube water. The USCG DOP-250 Test Pump with its AWIFs can be seen in Figure 49 below.

JVOPS 6 Workshop Report flemingCo environmental
137
Outlet AWIF Inlet AWIF
Figure 49 USCG DESMI DOP-250 PDAS Pump w. Inlet and Outlet AWIFs
cS
t
Deg
r. F
Test
Oil
Visc
osity
vs.
Tem
pera
ture
A
naly
sis
perf
orm
ed o
n B
roo
kfie
ld D
VII+
Ro
tary
Vis
com
eter
w/S
mal
l Sam
ple
Ada
pto
r sp
indl
e #
27 @
She
ar R
ate
of
.07
sec
(̂-1)
2000
030
000
4000
050
000
6000
070
000
8000
090
000
1000
0011
0000
1200
0013
0000
1400
0015
0000
1600
0017
0000
1800
0019
0000
2000
0021
0000
2200
0023
0000
2400
0025
0000
2600
0027
0000
2800
0029
0000
3000
0031
0000
3200
0033
0000
3400
0035
0000
3600
0037
0000
3800
0039
0000
4000
0041
0000
4200
0043
0000
4400
0045
0000
4600
0047
0000
4800
0049
0000
5000
0051
0000
5200
0053
0000
5400
0055
0000
5600
0057
0000
5800
0059
0000
6000
00
5658
6062
6466
6870
7274
7678
8082
8486
8890
9294
96
< M
easu
red
Dur
ing
JVO
PS T
estin
g D
ec 0
3
Figu
re 5
0 JV
OPS
Tes
t Oil
Vis
cosi
ty v
s. Te
mpe
ratu
re (l
ow te
mpe
ratu
re se
ctio
n), P
repa
red
by G
PC
JVOPS 6 Workshop Report flemingCo environmental
138

JVOPS 6 Workshop Report flemingCo environmental
139
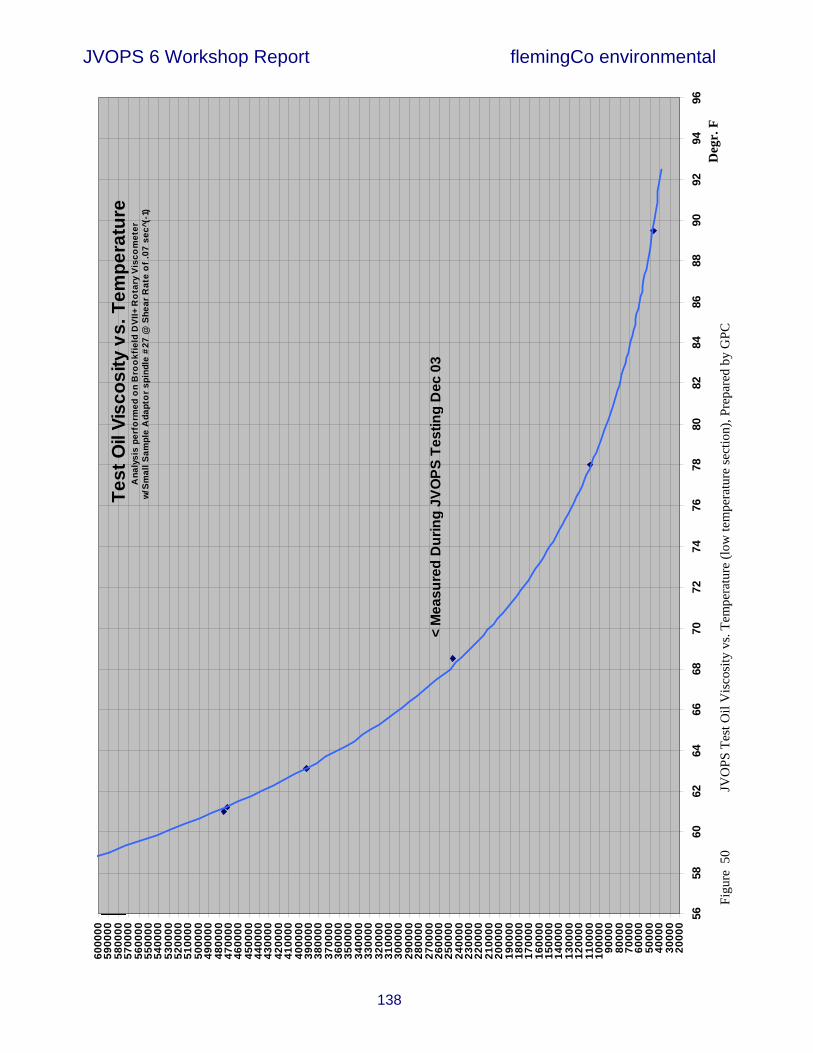
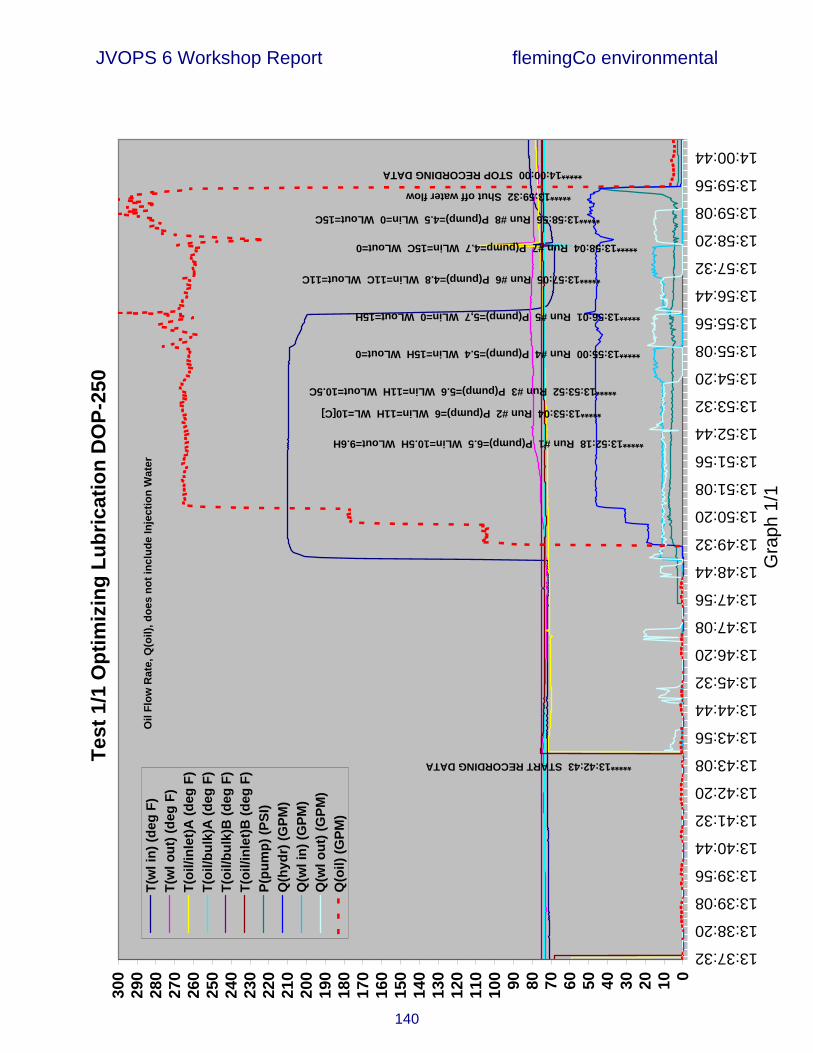
7.3.1 Test 1/1 107.5 ft Pre Test w. USCG DOP-250 and 150,000 cSt Oil. Test Date 11 December, 2003 Test Line USCG Test Pump DESMI DOP-250 PDAS Pump from USCG VOPS System Pump Motor Sauer-Danfoss OMTS 315 High Torque Motor Inlet AWIF flemingCo type inlet side AWIF Outlet AWIF USCG/USN standard VOPS discharge side AWIF Test Hose 107.5 ft 6” lay flat type including riser hose arrangement Test Oil JCOS Bitumen Crude Oil Target Viscosity 200,000 cSt Measured Viscosity 150,000 cSt @ 74 F (Dec. 03 Temp-Viscosity Curve, Fig. 50) This test aimed to find the best WL type of inlet only, outlet only, and inlet plus outlet, and provide information on best lube water type, hot or cold, or combination. Seven planned test runs and one ad hoc run were completed with various combinations of lube water temperature, inlet and outlet side injection, inlet only, and outlet only. The hose pressure drop P(pump) was in all runs within the 4.5 to 6.5 psi range, which is surprisingly close to the pressure drops in Tests 0/1 and 0/2 on oil at less than 20% of the 150,000 cSt in this test. The same phenomenon as observed in Tests 0/1 and 0/2, where it merely was the duration of the test than the actual WL settings and combinations that determined the performance, was also observed in this test. With a pressure transducer accuracy of +/- 1.5 psi the logged pressures at the rather uniform product flow provide limited information on which WL settings and combinations were the better. The performance was nevertheless impressive. If compared with the performance in run 1 of Test 1/2 (restart and pumping without lube water injection) the average hose pressure drop has been reduced from 165 to 5.4 psi or by a factor of 31, while the average capacity at the same time increased from 80 to 263 USgpm or by a factor of 3.3. This provides an average PIF (Performance Improvement Factor) value of 102! The small reduction in viscosity from 150,000 cSt in Test 1/1 to 140 k cSt in Test 1/2 is not considered to have any measurable influence on the PIF calculation, and if it had, it would be in favour of an even higher PIF value. Power Consumption A closer review of the recorded data reveals an increase in relative power consumption (∆P(hydr)) in runs 5 and 8, which are the runs without inlet side WL. Run 5 has 6% hot water on the outlet only. Run 8, with 6% cold water on the outlet only, is clearly the largest consumer of power.
JVOPS 6 Workshop Report flemingCo environmental
140
Gra
ph 1
/1
Test
1/1
Opt
imiz
ing
Lubr
icat
ion
DO
P-25
0
0102030405060708090100
110
120
130
140
150
160
170
180
190
200
210
220
230
240
250
260
270
280
290
300
13:37:32
13:38:20
13:39:08
13:39:56
13:40:44
13:41:32
13:42:20
13:43:08
13:43:56
13:44:44
13:45:32
13:46:20
13:47:08
13:47:56
13:48:44
13:49:32
13:50:20
13:51:08
13:51:56
13:52:44
13:53:32
13:54:20
13:55:08
13:55:56
13:56:44
13:57:32
13:58:20
13:59:08
13:59:56
14:00:44
T(w
l in)
(deg
F)
T(w
l out
) (de
g F)
T(oi
l/inl
et)A
(deg
F)
T(oi
l/bul
k)A
(deg
F)
T(oi
l/bul
k)B
(deg
F)
T(oi
l/inl
et)B
(deg
F)
P(pu
mp)
(PSI
)Q
(hyd
r) (G
PM)
Q(w
l in)
(GPM
)Q
(wl o
ut) (
GPM
)Q
(oil)
(GPM
)
*****13:42:43 START RECORDING DATA
*****13:52:18 Run #1 P(pump)=6.5 WLin=10.5H WLout=9.6H
*****13:53:04 Run #2 P(pump)=6 WLin=11H WL=10[C]
*****13:53:52 Run #3 P(pump)=5.6 WLin=11H WLout=10.5C
*****13:55:00 Run #4 P(pump)=5.4 WLin=15H WLout=0
*****13:56:01 Run #5 P(pump)=5,7 WLin=0 WLout=15H
*****13:57:05 Run #6 P(pump)=4.8 WLin=11C WLout=11C
*****13:58:04 Run #7 P(pump=4.7 WLin=15C WLout=0
*****13:58:56 Run #8 P(pump)=4.5 WLin=0 WLout=15C
*****13:59:32 Shut off water flow
*****14:00:00 STOP RECORDING DATA
Oil
Flow
Rat
e, Q
(oil)
, doe
s no
t inc
lude
Inje
ctio
n W
ater
JVOPS 6 Workshop Report flemingCo environmental
141
Run 7, with 6% cold water on the inlet only, caused a power increase from the previous setting, which had 4% cold in and 4% cold-to-warm out. If compared with run 4, with 6% hot water on the inlet only, the higher power consumption of run 7, is likewise worth noticing. These observations point at inlet + outlet lubrication being better than outlet lubrication only. They further point at hot inlet water being better than cold inlet water. Conclusion It can therefore be concluded that the best working WL combination of this test is inlet + outlet lubrication and that the inlet lube water must be hot. The test does not provide data that can verify whether the outlet lube water must be hot or cold.

JVOPS 6 Workshop Report flemingCo environmental
142
7.3.2 Test 1/2 107.5 ft Pre Test w. USCG DOP-250 and 140 k cSt Oil. Test Date 11 December, 2003 Test Line USCG Test Pump DESMI DOP-250 PDAS Pump from USCG VOPS System Pump Motor Sauer-Danfoss OMTS 315 High Torque Motor Inlet AWIF flemingCo type inlet side AWIF Outlet AWIF USCG/USN standard VOPS discharge side AWIF Test Hose 107.5 ft 6” lay flat type including riser hose arrangement Test Oil JCOS Bitumen Crude Oil Target Viscosity 200,000 cSt Measured Viscosity 140,000 cSt @ 75 F (Dec. 03 Temp-Viscosity Curve, Fig. 50) This test would start with an attempt to restart the pumping process after a simulated unintended pump stop (after Test 1/1). First without lube water (Run 1) and then water lubricated (Run 1A) with minimal use of hot inlet and outlet lube water. Once core annular flow had been re-established, the test would aim to optimize the WL percentages for the best combinations of Test 1/1 (Hot inlet water and cold or hot outlet water). The contaminated test pump was started after a 25 minutes break where the oil and cold lube water from Test 1/1 had been left in the test hose to simulate an unintended pump stop. It is expected that the water ring around the oil at that time had degraded in part or completely and that test oil had direct contact with the hose inner wall. Run 1 data shows that the pump was able to restart and to push the 140 k cSt test oil through the test hose at a rate of 80 USgpm without aid from water lubrication. The logged pressure drop at the 14.28.08 mark point was 165 psi. At 14.28.52 (Run 1A) hot water was applied at the inlet and outlet AWIFs at a rate of only 1% (of the expected full pump capacity). This brought the pump back up to full capacity in 30 seconds! At the 14.20.20 mark point the pressure drop was at a relatively high 13 psi, but the effect of the small amounts of injected hot lube water was still incredible. Runs 2 to 7 were carried out as planned in an attempt to optimize the WL percentages and the outlet lube water temperature. The slightly higher level of the logged pressure drops when compared with Test 1/1 indicates that the core annular flow has been fully re-established, although at an average of 6.7 psi, which is 1.3 psi higher than Test 1/1 average. The slightly higher pressure must be considered influence from some test oil sticking to the inner wall of the test hose. The pressure drops in runs 2 to 7, ranging from 5.7 to 7.7 psi at 268 USgpm average product flow, does not follow a decreasing trend as observed in Test 1/1. This is probably due to the slightly more difficult conditions with the contaminated test hose.

JVOPS 6 Workshop Report flemingCo environmental
143
Gra
ph 1
/2
Test
1/2
Res
tart
and
Opt
imiz
ing
Lubr
icat
ion
DO
P-25
0
0102030405060708090100
110
120
130
140
150
160
170
180
190
200
210
220
230
240
250
260
270
280
290
14:21:28
14:21:58
14:22:28
14:22:58
14:23:28
14:23:58
14:24:28
14:24:58
14:25:28
14:25:58
14:26:28
14:26:58
14:27:28
14:27:58
14:28:28
14:28:58
14:29:28
14:29:58
14:30:28
14:30:58
14:31:28
14:31:58
14:32:28
14:32:58
14:33:28
14:33:58
14:34:28
14:34:58
14:35:28
14:35:58
14:36:28
14:36:58
14:37:28
14:37:58
T(w
l in)
(deg
F)
T(w
l out
) (de
g F)
T(oi
l/inl
et)A
(deg
F)
T(oi
l/bul
k)A
(deg
F)
T(oi
l/bul
k)B
(deg
F)
T(oi
l/inl
et)B
(deg
F)
P(pu
mp)
(PSI
)
Q(h
ydr)
(GPM
)
Q(w
l in)
(GPM
)
Q(w
l out
) (G
PM)
Q(o
il) (G
PM)
*****14:25:36 START RECORDING DATA
*****14:28:08 Run #1 P(pump)=165 WLin=0 WLout=0
*****14:31:30 Run #2 P(pump)=6.5 WLin=10H WLout=10H
*****14:32:41 Run #3 P(pump)=7.3 WLin=10H OutWL=10.5[C]
*****14:33:46 Run #4 P(pump)=5.7 WLin=5H WLout=9[C]
*****14:34:54 Run #5 P(pump)=6.3 WLin=5H WLout=5[C]
*****14:35:54 Run #6 P(pump)=7.7 WLin=5H WLout=0
*****14:37:21 Run #7 P(pump)=6.7 WLin=10.5H WLout=10[C]
*****14:37:48 STOP RECORDING DATA
Oil
Flow
Rat
e, Q
(oil)
, doe
s no
t in
clud
e Lu
bric
atio
n W
ater
JVOPS 6 Workshop Report flemingCo environmental
144
Run 2 that was carried out with 4% hot in / 4% hot out was the first run after the re-establishment of the core annular flow, and was subject to a too low setting of the inlet lube water (2%) in the first half of the run. At the start of the run the pressure was at 12 psi, indicating that the core annular flow was still negatively affected by the contaminated hose. It should also be noted that the relative power consumption (∆Phydr) at the mark point still is 200 psi higher than in run 3. It is therefore worth noting that this run logged a lower pressure drop than the following run 3 with 4% hot in and 4% cold out. It could from this seem that 4 hot in/4 hot out was more efficient than 4 hot in/4 cold out. But if the WL out backup temperature for the two runs can be trusted (see the introduction in section 7.3) it appears that run 3 actually operated with a higher outlet lube water temperature than run 2. The following runs also suffer from confusion as to the outlet lube water temperatures. It is a problem for the proper analysis of this test that the electronic sensor failure was not fixed in the 25 minutes break before this test. Runs 4 and 5 are with lower lube water inputs at both in and outlet and it could seem as if the 2%/2% combination, after two runs with lower water injection rates, starts developing a higher pressure drop. Run 4 pressure drop was lower than in run 3, though, but lube water “left over” in the test hose from run 3 could maybe explain this. In run 6 the lube water is further reduced to 2% hot water on the inlet only, and the upwards pressure trend from run 4 to 5 seems to continue. This run supports the observations made in Test 1/1: In and outlet lube water combinations are better than injection at one AWIF only. In run 7 with 4 hot in and 4 “cold” out it could finally seem as if the outlet lube water backup temperature had come down to a level that cannot be considered hot. The drastic drop in discharge oil temperature from 106 F in run 6, with 2% hot in only, to 98 F in run 7 supports that cold water actually was injected to the outlet AWIF in run 7. This run brings the pressure drop back down to the average for test runs 2 to 7: 6.7 psi.

JVOPS 6 Workshop Report flemingCo environmental
145
Conclusion The increasing pressure trend over runs 4 to 6 indicates that a total of only 2 to 4 % lube water might be too little for extended pumping time (as little as 1% hot in / 1 % hot out had been able to re-establish core annular flow after the pump stop, but it is unknown whether these small amounts of hot lube water could have reduced the pressure further from the logged 13 psi and maintained the core annular flow). The pressure increase was low from run 4 to 6, however, but the test engineers had to decide on the lube water patterns for the remaining tests. 4% hot in / 4% cold out had proved very efficient once the efficient core annular flow had been established. However, the fact that 4% hot in / 4% hot out was effective in efficiently starting up the core annular flow and maintaining it favored this combination. 7.3.3 Conclusions after Tests 1/1 and 1/2, and Test 5 Based on the conclusions from Tests 1/1 and 1/2 it was decided to start the USCG Master Test (Test 2) and the Manufacturers’ tests (Tests 4/3 and 4/4) with 4% hot in and 4% hot out. Run 2 in each test would be with 4% hot/4% cold and finally run 3 would be with 4% cold/4% cold before carrying out baseline testing without lube water. From an operational “in the field” point of view it would be preferable if the consumption of hot lube water could be reduced as much as possible without risk of loosing the core annular flow. It was therefore also decided to primarily focus on the 4% hot in / 4% cold out combination for the USCG long distance test (Test 3) if the settings seemed to have merit during the 300 ft Master Test. If the availability of test oil and time permitted, one optional ad hoc WL setting would also be tested. For the CCG Master Test (Test 6) and long distance test (Test 7) it was decided to maintain the pre workshop decision on primarily testing with hot water on both inlet and outlet side of the GT-185 pump. The decided percentages (4/4) for the continued testing at the USCG 200,000 cSt test line would also be applied to these tests. This was further based on observations from the CCG 530 k cSt pre test where the 4% hot / 4% hot combination had worked with a safe performance, although it apparently was not the best. Where it could seem that some other WL settings involving slightly less lube water would be as efficient as the decided settings, it must be considered that it was the responsibility of the test management to ensure that especially the long distance tests did not fail due to too little lube water in the early stages. If this would happen, the test hoses might be contaminated or even clog with viscous oil and there might not be time, hoses, and oil available for repeated testing with higher lube water percentages.

JVOPS 6 Workshop Report flemingCo environmental
146
7.4 Test 2 311 ft Master Test w. USCG DOP-250 and 210 k cSt Oil. Test Date 12 December, 2003 Test Line USCG Test Pump DESMI DOP-250 PDAS Pump from USCG VOPS System Pump Motor Sauer-Danfoss OMTS 315 High Torque Motor Inlet AWIF flemingCo type inlet side AWIF Outlet AWIF USCG/USN standard VOPS discharge side AWIF Test Hose 311 ft 6” lay flat type including riser hose and SHAS Test Oil JCOS Bitumen Crude Oil Target Viscosity 200,000 cSt Measured Viscosity 210,000 cSt @ 70 F (Dec. 03 Temp-Viscosity Curve, Fig. 50) The purpose of this test was to test – on the nominal USCG Master Test pumping distance of 300 ft – the WL settings that in the pre tests were found to have the highest potential or to be the most feasible from an operational stand point. The tests would also provide an impression on whether additional lube water would be required for longer pumping distances and whether there could be expected proportionality between pump pressure and hose length. After completion of the planned test runs, including baseline without lube water, it was decided to try to re-establish the core annular flow using 4% hot inlet / 4% hot outlet lube water and carry out a run with these settings. Then a run with 4% hot inlet / 4% cold outlet lube water would be carried out, pending satisfactory performance in run 2, followed by the addition of an additional hose length of 1200 ft using the SHAS. The 4 hot/4 cold WL settings would be maintained. This would instantaneously start up the first run of Test 3 (long distance testing), see section 7.5. Please consult the Data Collection Sheet for Test 2 in section 6.5 and Graph 2+3 below for information on retrieved data. The first three runs (4% hot/4% hot, 4% hot/4% cold, and 4% cold/4% cold) were completed from 16.51 to 16.58 as planned and the lube water injection was stopped at 16.58.15. After 15 seconds at almost full pump capacity without lube water the pump pressure rose rapidly to 100 psi and hydraulic flow was simultaneously adjusted to avoid over pressurizing the pump. At a hydraulic flow rate of about 10 USgpm (60 USgpm product flow) and an average pressure of 120 psi the oil and lube water from run 3 was pumped out of the hose until 17.02.50. The pump was stopped for 15 minutes to be sure that the oil in the test hose would settle and any possible remaining lube water ring would break down. At 17.17.54 the pump was re-started for baseline testing. In a matter of 30 seconds the pump pressure rose to 256 psi even though the hydraulic flow already had been decreased significantly from the initial setting. Now followed a challenging task where the Lead Engineer would work closely with the hydraulic RC operator while observing both the analog pressure and hydraulic flow gauges at the

JVOPS 6 Workshop Report flemingCo environmental
147
tank top. The responders that were recording backup pump pressure and hydraulic flow provided excellent support in this task of keeping the pump at its absolute maximum pressure without causing damage by sudden increases of hydraulic flow. The baseline test was stable at an average pump pressure of 181 psi and 4.3 USgpm hydraulic flow (26 USgpm product flow) from 17.19.40 to 17.21.10 at which point data has been recorded. While the pump was still operating after the baseline test, an attempt to re-establish the core annular flow using 4% cold in / 4% cold out was initiated at 17.21.20. This had an adverse effect with increased power consumption despite no increased pumping rate, so at 17.23.30, hot water on the outlet only was applied. This technique resulted in the same discharge pressure and pump rate as without lube water (no positive or negative effect). At 17.26, Hot in and hot out was applied and after only 40 seconds the pump pressure started dropping. After 35 more seconds (17.27.14), the pump was operating at max RPM. At 17.28.18, when a full run 5, with 4 % hot in and 4 % hot out, had been completed the discharge pressure had dropped to 11 psi and full water lubricated flow had been re-established. At 17.28.56 the WL flows were set to 4% hot in and 4% cold out as planned and run 6 was carried out with these settings. The pump pressure gradually increased through run 6 to 17 psi at the 17.30.44 mark point and remained stable with the same WL settings for two minutes until the additional 1200 ft of hose were added on using the SHAS in preparation for Test 3. This completed Test 2. This was the first test at the USCG 200,000 cSt test line with a real world operational pumping distance of 311 ft or 94.8 m. The results of the in and outlet lube water test runs are impressive when compared with the baseline test with no lube water: The tested lube water combinations and settings caused up to 25 times pressure reductions while at the same time increasing the pump capacity up to 10 times. The Performance Improvement Factors (PIF) for each test run are inserted in Table 3 below. Table 3 Test 2 Performance Overview, 311 ft of hose, 210,000 cSt oil Run # WL in WL out Pump capacity
USgpm Pump pressure
psi PIF
see section 7.0 1 4% hot water 4% hot water 262 7.1 255 2 4% hot water 4% cold water 267 7.0 264 3 4% cold water 4% cold water 262 7.8 233 4 baseline 0 0 26 181 n/a 5 dirty hose 4% hot water 4% hot water 259 12 149 6 dirty hose 4% hot water 4% cold water 259 17 105 Runs 5 and 6 that were carried out with the test hose contaminated after the baseline test developed slightly higher pressure drops, thus resulting in reduced PIF values. However, from an operational point of view these pressure drops must still be considered very low.
JVOPS 6 Workshop Report flemingCo environmental
148
If runs 1 and 2 are compared with runs 5 and 6 it becomes obvious that while the hot in/hot out combination is not superior to the hot in/cold out combination with clean test hoses, the same is not the case with contaminated hoses. The same pattern could barely be noticed in Test 1/2 on the 107.5 ft hose length. But on the three times longer distance of this test, and after a more complete removal of lube water and old test oil from the hose before the baseline test run, the difference is significant and stable. Hot in/hot out WL combinations do not only re-establish the core annular flow very well; they also work better on already contaminated hoses. These are very important observations that relate well to real world conditions where clean hoses only can be expected the very first time they are used in a response situation, and where unintended pump stops can be expected frequently. Proportionality This 311 ft test with 210,000 cSt oil should be compared with Test 1/1 with only 107.5 ft of test hose and a viscosity of 150,000 cSt. The average pressure drop of runs 1 to 3 in Test 2 is 7.3 psi. Due to the apparent problems with the control of the lube water temperatures in Test 1/1 there is in this test not a similar set of runs to compare with. But even if the average pressure drop of all tests is used (5.4 psi) so that the very low pressure drops after extended testing and optimized core annular flow are included, there cannot be observed proportionality between the two tests. Test 2 should have produced an average pressure drop for runs 1 to 3 of about 5.4 x 311/107.5 = 15.6 psi, but only an average of 7.3 psi was recorded. The lack of proportionality is even more significant if the lower viscosity of Test 1/1 is considered. Requirement for additional lube water Based on the proportionality considerations above, nothing indicates that there is a requirement for increased amounts of lube water for increased pumping distances. Conclusion This test was very successful with a more than 250 times performance improvement in the test runs with 4% hot in/4% hot out, and 4% hot in/4% cold out combinations (when compared with the baseline test run). Almost as important is the finding that the pumping process can be re-started on more than 300 ft of hose after an unintended pump stop, and the core annular flow can be efficiently re-established using the 4% hot in / 4% hot out WL combination.

JVOPS 6 Workshop Report flemingCo environmental
149
7.5 Test 3 1514.5 ft Long Distance Test on 185 k cSt Oil. Test Date 12 December, 2003 Test Line USCG Test Pump DESMI DOP-250 PDAS Pump from USCG VOPS System Pump Motor Sauer-Danfoss OMTS 315 High Torque Motor Inlet AWIF flemingCo type inlet side AWIF Outlet AWIF USCG/USN standard VOPS discharge side AWIF Test Hose 1514.5 ft 6” lay flat type including riser hose and 2xSHAS Test Oil JCOS Bitumen Crude Oil Target Viscosity 200,000 cSt Measured Viscosity 185,000 cSt @ 71.5 F, Dec. 03 Temp-Viscosity Curve Fig. 50 The purpose of this test was to meet the main USCG JVOPS Workshop goal of long distance pumping of 200,000 cSt oil up to minimum 1500 ft by applying the most optimal lube water combinations and settings derived from the pre tests. The test should provide further information on the degree of proportionality between hose pressure drop and hose length. The test would also be used for an estimation of the maximum possible pumping distance for a 200,000 cSt oil when applying the most optimal lube water combination. A possible requirement for additional lube water for increased pumping distance would be investigated.
Figure 51 Oil and Lube Water Discharge in Test 3 with USCG DOP-250 w. flemingCo Inlet AWIF and USCG/USN Outlet AWIF on 185,000 cSt Oil with 1507.5 ft Hose. Note the oily lube water.
Figure 51 Oil and lube water discharge in Test 3 with USCG DOP-250 pump, with flemingCo Inlet AWIF and USCG/USN Outlet AWIF, 185,000 cSt test oil through 1514.5 ft. hose. Note the oily lube water.

JVOPS 6 Workshop Report flemingCo environmental
150
Gra
ph 2
+3
Test
2+3
USC
G M
aste
r Tes
t and
Lon
g D
ista
nce
Test
DO
P-25
0
0102030405060708090100
110
120
130
140
150
160
170
180
190
200
210
220
230
240
250
260
270
280
16:50:12
16:51:58
16:53:4416:55:30
16:57:16
16:59:0217:00:48
17:02:34
17:04:2017:06:06
17:07:5217:09:38
17:11:24
17:13:1017:14:56
17:16:42
17:18:2817:20:14
17:22:00
17:23:4617:25:32
17:27:1817:29:04
17:30:50
17:32:3617:34:22
17:36:08
17:37:5417:39:40
17:41:26
17:43:1217:44:58
17:46:4417:48:30
17:50:16
Tim
e
T(w
l in)
(deg
F)
T(w
l out
) (de
g F)
T(oi
l/inl
et)A
(deg
F)
T(oi
l/bul
k)A
(deg
F)
T(oi
l/bul
k)B
(deg
F)
T(oi
l/inl
et)B
(deg
F)
P(pu
mp)
(PSI
)
Q(h
ydr)
(GPM
)
Q(w
l in)
(GPM
)
Q(w
l out
) (G
PM)
Q(o
il) (G
PM)
*****16:50:11 START RECORDING DATA
*****16:53:47 Run #1 P(pump)=7.1 WLin=10H WLout=9.8H
*****16:55:58 Run #2 P(pump)=7 WLin=10.5H WLout=9.4C
*****16:57:53 Run #3 P(pump)=7.8 WLin=9.9C WLout=10C
*****17:03:13 STOP RECORDING DATA
*****17:17:41 START RECORDING DATA - Attempt Cold WL Start
*****17:21:20 Start cold in/cold out WL
*****17:28:18 Run #5 P(pump)=12 WLin=10.3H WLout=11.6H
*****17:30:44 Run #6 P(pump)=17 WLin=8.9H WLout=8.2C
*****17:21:10 Run #4 P(pump)=181 WLin=0 WLout=0
*****17:40:49 Run #1 P(pump)=59 WLin=9.7H WLout=10.2C
*****17:39:45 Oil Exits 1500 Ft Hose
*****17:49:20 Run #2 P(pump)=43 WLin=15C WLout=0*****17:49:52 STOP RECORDING DATA
17.2
6.00
Sta
rt h
ot in
/hot
out
WL
Run
# 4
(Bas
elin
e)
17.2
1.10
:P(
pum
p)=1
81 Q
(hy)
=4.6
Q(o
il)=2
6 W
Lin=
0 W
Lout
=0
17.3
2.44
Add
-on
1200
FT
and
STA
RT
Test
3

JVOPS 6 Workshop Report flemingCo environmental
151
Test 3 was started immediately at the end of Test 2, using the SHAS to add 1200 ft of hose without stopping the pumping process. The water lubricated oil discharge from the SHAS after pump transfer through1514.5 ft hose can be seen in Figure 51. Please consult the Data Collection Sheet for Test 3 in section 6.5 and Graph 2+3 above for information on retrieved data. The new section of hose had been primed with about 30 gallons of water in the hook-on end prior to being connected to the SHAS. The 1200 ft hose (plus one SHAS length of 3.5 ft) was added on to the 311 ft Master Test hose at 17.32.42. Product flow at the transition between Tests was 258 USgpm with the 4% hot WL in and 4% cold WL out. Product flow remained stable during the first run of Test 3, while pressure fluctuations with peaks up to 105 psi, were observed. Pressure exhibited a downward trend up to the mark point at 17.40.49 where the pressure drop P(pump) was recorded at 59 psi. Pump pressure continued the significant downward trend and at 17.41.40 reached its lowest point of 45 psi @ 250 USgpm product flow with the 4% hot/4% cold WL settings. At this time, run 2 was started and the WL settings were changed to 6% cold water on the inlet AWIF only. The data from run 1 could indicate that the run time should have been extended to provide a more comprehensive impression on the effect of the applied lube water settings. Although the results are remarkable, it seems from the collected data that the core annular flow in the added 1200 ft hose length had not yet reached its optimal efficiency when the WL settings were changed for run 2. By the introduction of 6% cold water to the inlet AWIF only, the rapidly dropping pump pressure leveled out to a more moderate decline. In the middle of run 2, at 17.45.08 the pressure had dropped to 37 psi @ 248 USgpm product flow. However, after the introduction of the cold water to the inlet AWIF the relative power consumption had increased slightly. At 17.44.08 some pulsations in pump pressure starts and remains for the duration of the run, although somewhat dampened towards the end. These pulsations could indicate that the effect of the previous WL settings were fading out around 17.44.08. The upwards pressure jump up at 17.47.22 was caused by a sudden upwards adjustment of the hydraulic flow, which may have been imposed in an attempt to compensate for the slight decline in the hydraulic flow (pump RPM) that can be observed from the start of run 2. This decline corresponds well with the slight increase in relative power consumption (∆P(hydr)) over the same period. Data for run 2 were recorded at 17.49.20, and at that time the pump pressure was 43 psi @ 270 USgpm product flow. Shortly after the pump was stopped. Proportionality If runs 1 and 2 of Test 3 are compared with runs 5 and 6 of Test 2, that were with a contaminated hose after the baseline test, there is a lack of proportionality between pump pressure and hose length. The approx. 5 times longer hose length of Test 3 resulted in a pressure drop increase from an average of 14 psi (311 ft) to an average of

JVOPS 6 Workshop Report flemingCo environmental
152
44 psi (45 psi at 17.41.40 for run 1 has been used, not the 59 psi at the Mark Point, see above). This is a three times higher pressure drop only. However the 1514.5 ft test hose had only the first 311 ft contaminated by the Test 2 baseline test. If instead it is assumed that the core annular flow through the first 311 feet of hose gradually has stabilized close to that with a clean hose, runs 1 and 2 of Test 3 should be compared with runs 1 to 3 in Test 2. Here the average pressure drop is 7.3 psi at an average product flow of 263 USgpm. The long distance test (runs 1 and 2) had an average pressure drop of 44 psi at 260 USgpm average product flow. This is a 6 times increase in pressure drop. The truth may be somewhere between a factor 3 and 6 pressure increase for a 5 times increase of the pumping distance. The fact that the first 20% of the 1514.5 ft test hose had been contaminated during the baseline test of Test 2 makes it difficult to believe that the factor would be higher than 5 with all clean hoses. It is uncertain whether the factor would be lower, but there nevertheless seems to be a reasonable degree of proportionality when pumping this oil in the 200,000 cSt range. Requirement for additional lube water Based on the proportionality considerations above, there is nothing to indicate a requirement for increased amount of lube water for increased pumping distance. At least not for hose lengths up to the 1514.5 ft used in this test. Performance Improvement After Test 3, the pump was stopped for a period of time and an attempt was made to re-start. It was not possible to re-start the flow, even at a minimal rate. If a PIF value should be calculated for the long distance performance of the USCG DOP-250 with the selected inlet and outlet water injection combinations, when compared to performance without lube water, it would therefore be infinite. Instead comparisons have been made with the baseline run in Test 2 and can be found in Table 4. Please note that the PIF values have been multiplied with the hose length factor, 1514.5/311, in order to compensate for the longer hose length in Test 3 vs. the Test 2 baseline hose length. The difference in viscosity has not been considered, and the stabilized pump pressure (45 psi) that in run 1 was registered by the data logger shortly after the mark point has been used. Table 4 Test 3 Performance Overview, 1514.5 ft of hose, 185,000 cSt oil Run # WL in WL out Pump capacity
USgpm Pump pressure
psi PIF
see section 7.0 1 4% hot water 4% cold water 250 45 189 2 6% cold water 0 270 43 213 Baseline Test 2, 311 ft
0 0 26 180 n/a
The PIF value for run 2 is higher than for run 1, but as noted above, run 1 data retrieved from the graphs indicate (with the steep downward pressure trend when the settings

JVOPS 6 Workshop Report flemingCo environmental
153
were changed for run 2) that this run should have been extended since it was the first run after the 1200 ft of hose had been added on. In general it must be considered that the time allowed for each run as per the Hose-fill Time vs. Pump Capacity chart should have been extended. This was already observed in the analysis of the pre-tests and the Master Test but in this test, with a much longer pumping distance, it is more clearly evident. However, as previously mentioned, this was not an option due to limited availability of test oil. The achieved results are nevertheless extremely satisfactory and provide valuable guidance to the oil spill response community. The consequence of lube water that is “left over” from a previous test run would be a non-uniform friction coefficient for the core annular flow relative to the hose inner wall at the mark point time of the actual run (where it otherwise would be expected that only the new WL settings are in force). This would be expressed by a pump pressure curve that has not stabilized at the mark point. If the curve trend is upward the previous settings were better than the actual settings. If the curve trend is downward the new settings are better. However, a WL setting’s apparent ability to enhance the core annular flow over time makes it very difficult to verify influence from the WL settings of the previous run. It may even have a major impact. In the case of better new settings the “over time enhancement” will amplify the downward pressure trend at the mark point. If the previous settings were better, the “over time enhancement” will tend to reduce the upward pump pressure trend at the mark point. At the transition from run 1 to run 2 in Test 3 the core annular flow of run 1 seems not yet to have stabilized (Graph 2+3). For more than a minute leading up to the start of run 2 (at 17.40.49) the pressure drops significantly. But with the new settings with 5% cold inlet lube water only, the pressure curve immediately stops its strong downward trend. The pressure drops very little throughout run 2. (The pressure increase at 17.47.18 is due to an adjustment of the hydraulic flow to the pump). It is unknown at which (lower) pressure run 1 had ended if had been extended. Therefore it is also unknown at which pressure run 2 would have started after an extended run 1. Consequently there are no data available that for certain can verify whether run1 or run 2 reflect the best WL combination. However, the strong downward trend of the pump pressure curve in the last minute before the start of run 2 and the sudden interruption at that point indicate that run 2 most likely would have started at a much lower pressure if run 1 had been longer. This would in turn mean that the pressure curve development during run 2 is a result of significant influence from the WL settings of run 1. Had run 2 started at the lower pressure the curve might have had an upward trend, indicating that the 5% cold inlet lube water (as expected) would not lubricate as well as the 4% hot in/4% cold out WL combination applied in run 1. Power consumption There is a remarkable small increase in relative power consumption when comparing Test 2, run 2 (4% hot/4% cold) with the five times longer pumping distance of run 1 in Test 3 (same lube water settings). Even though the product flow is slightly lower in the

JVOPS 6 Workshop Report flemingCo environmental
154
latter and the viscosity has dropped slightly from Test 2 to Test 3. The ∆P(hydr) increases from 2330 to 2625 psi, or by only 13%. This can probably be explained by a huge friction inside the test pump caused by the test oil. A significant amount of the supplied power is used to overcome this friction, and only very limited additional power is required to pump the oil through the test hoses when the core annular flow has been established. By checking the relative power consumption in the pre-tests this becomes quite obvious: In Test 1/2 with only 107.5 ft of hose the average ∆P(hydr) for runs 2 to 7 is 2212 psi, or 95% of run 2 in Test 2, which has a 3 times longer pumping distance. Test 1/2 was even with a lower viscosity oil (140 k cSt). The relation between the relative power consumptions of Test 1/2 and Test 3 is 2212 vs. 2625, or an increase of only 19% when going from 107.5 ft to 1514.5 ft pumping distance, that was even with a higher viscosity oil. These power consumption observations will be an important part of the estimation of the maximum possible pumping distances in section 7.12.1. Other observations The lube water that was discharged with the test oil from the end of the hose was not crystal clear as had been observed in the previous Test 2 on 311 ft of hose and that had also been observed in the CCG Tests 6 and 7 with about 500,000 cSt oil through 100 and 500 ft of hose. The lube water was dark or muddy as if some oil had been dissolved in the water. This could mean that for even longer pumping distances the lube water would be even more contaminated and eventually – at some unknown distance – reach a level of contamination that would degrade the lubricating effect. The SHAS proved to work well. The pressure pulsations, observed after the 1200 ft of hose were added on, do not differ much from the pattern observed in the previous tests when a new hose section was being filled with oil for the first time (see for instance Graph 2+3 , 16.51.10 to 16.52.10 for the initial start of Test 2). Conclusion The USCG first priority JVOPS Workshop target of pumping oil in the 200,000 cSt range through up to 1500 ft of hose at an operational rate was achieved with a safe margin. The results were achieved at pumping rates over 250 USgpm, which should be compared with the USCG minimum requirement for an operational pumping rate of 100 USgpm (defined by the USCG Project Officers). There is no doubt that the pumping distance could have been longer while still maintaining nearly maximum pump capacity. This will be studied in further detail in section 7.12.1.
JVOPS 6 Workshop Report flemingCo environmental
155
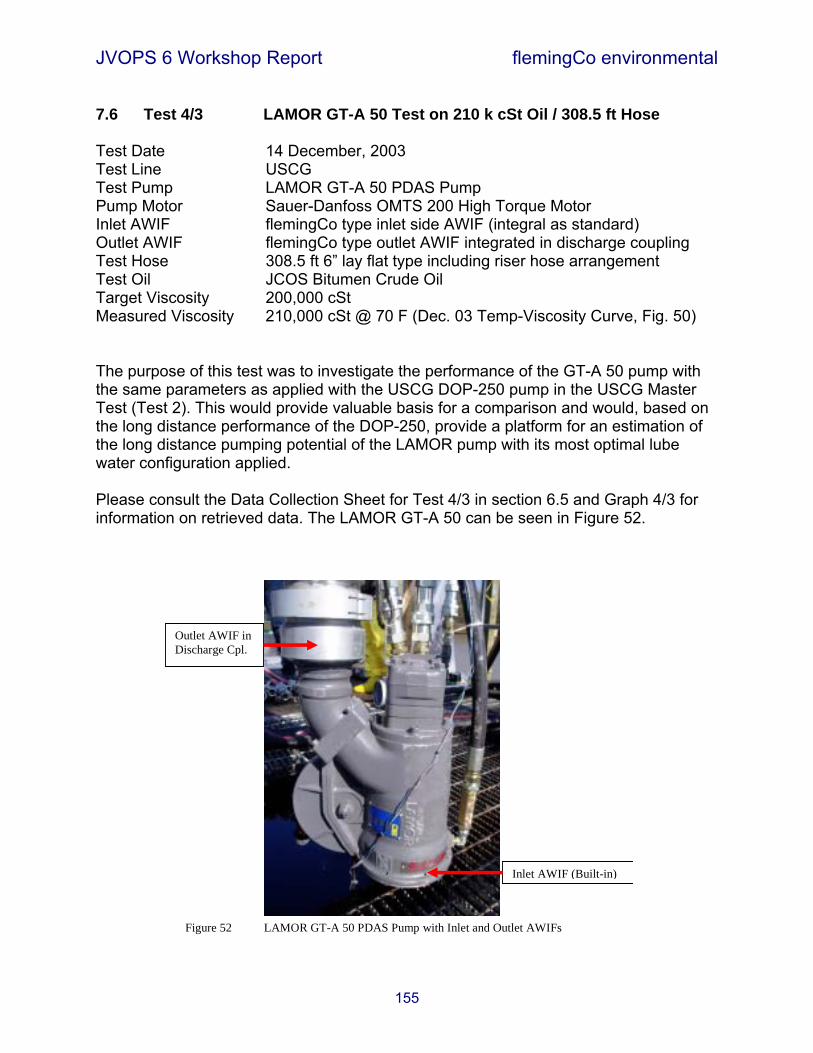
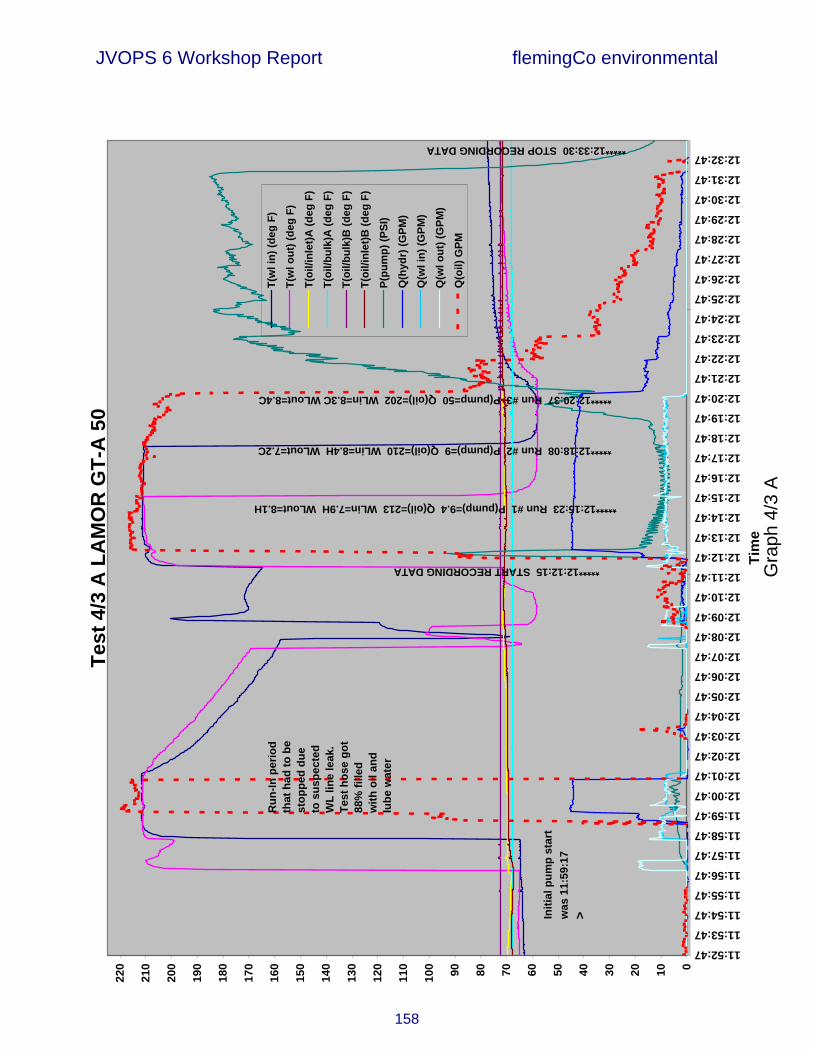
7.6 Test 4/3 LAMOR GT-A 50 Test on 210 k cSt Oil / 308.5 ft Hose Test Date 14 December, 2003 Test Line USCG Test Pump LAMOR GT-A 50 PDAS Pump Pump Motor Sauer-Danfoss OMTS 200 High Torque Motor Inlet AWIF flemingCo type inlet side AWIF (integral as standard) Outlet AWIF flemingCo type outlet AWIF integrated in discharge coupling Test Hose 308.5 ft 6” lay flat type including riser hose arrangement Test Oil JCOS Bitumen Crude Oil Target Viscosity 200,000 cSt Measured Viscosity 210,000 cSt @ 70 F (Dec. 03 Temp-Viscosity Curve, Fig. 50) The purpose of this test was to investigate the performance of the GT-A 50 pump with the same parameters as applied with the USCG DOP-250 pump in the USCG Master Test (Test 2). This would provide valuable basis for a comparison and would, based on the long distance performance of the DOP-250, provide a platform for an estimation of the long distance pumping potential of the LAMOR pump with its most optimal lube water configuration applied. Please consult the Data Collection Sheet for Test 4/3 in section 6.5 and Graph 4/3 for information on retrieved data. The LAMOR GT-A 50 can be seen in Figure 52.
Inlet AWIF (Built-in)
Outlet AWIF in Discharge Cpl.
Figure 52 LAMOR GT-A 50 PDAS Pump with Inlet and Outlet AWIFs

JVOPS 6 Workshop Report flemingCo environmental
156
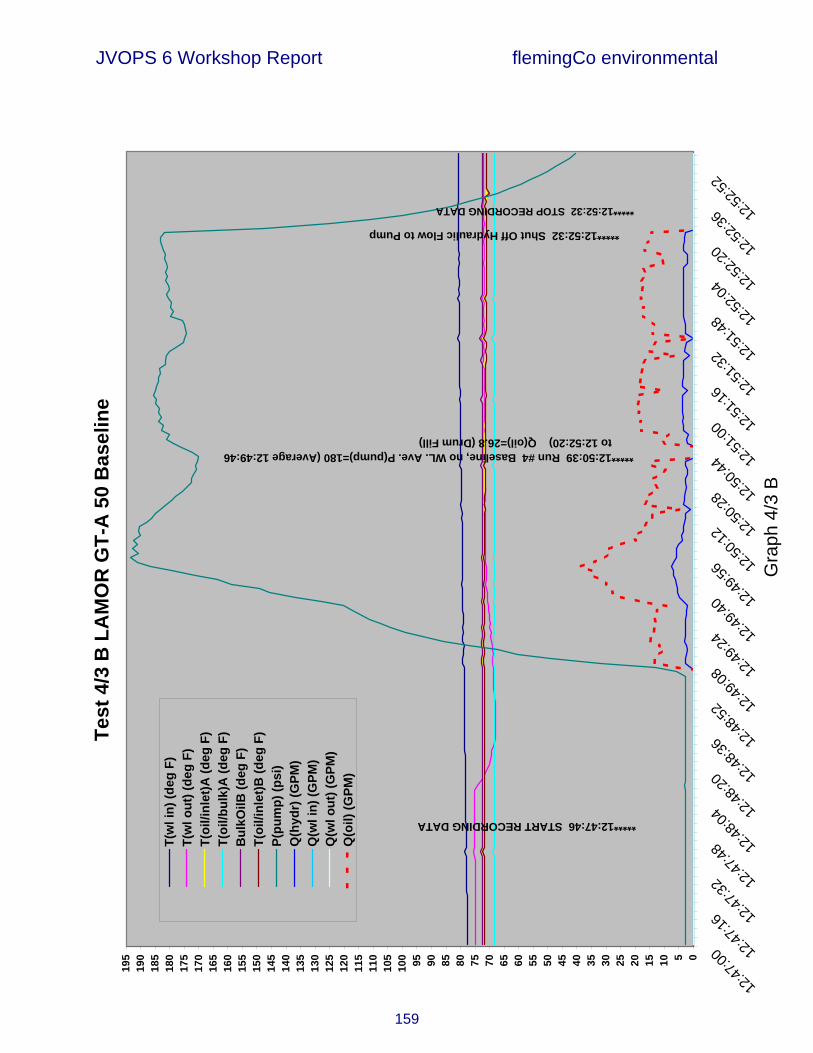
The pump was started at 11.59.30 and at 12.00 was at full capacity with an average pump pressure of 4.5 psi. This remained stable until 12.01.31 when the pump was stopped as per Lead Engineer request. Lube water had surfaced in the test tank and it was a concern that a lube water hose might have been disconnected or was leaking. The pump was lifted out of the oil for inspection, but no leak was detected. The phenomenon, which had not been observed in other tests, was apparently a result of the high temperature lube water, which was injected at the inlet side prior to pump start, penetrating the oil over the pump and floating to the top of the oil. The fact that the pump already had been pumping for two minutes (at full RPM for 1.5 minute) meant that the 308.5 ft test hose had been almost filled with oil and lube water. Therefore, Test 4.3 was not carried out on a clean test hose (even though the 2 minutes of pumping, as indicated by the low average pump pressure of 4.5 psi, had been fully water lubricated, the 10 minutes break afterwards would have degraded the water ring and allowed for contact between test oil and hose wall). This was underlined by a pressure peak to over 90 psi lasting for 20 seconds immediately after the pump had been restarted at 12.12.40. This type of pressure peak had not been observed in the tests with clean hoses. The three planned test runs with lube water (4% hot in / 4% hot out, 4% hot in / 4% cold out, and 4% cold in / 4% cold out) were completed at 12.21. All lube water was stopped and oil and lube water from run 3 was carefully pumped out at low capacity until 12.32 in preparation for baseline testing with no lube water. After a 17 minute break the pump was at 12.49 restarted for baseline testing at low RPM and was kept close to maximum pump pressure until the test was finished at 12.52. The three lube water runs disclosed a non typical performance for testing with clean test hoses, which can be seen in Figure 53, which focuses on the time interval from the start of run 1 at 12.13.21 to the end of run 3 at 12.20.24. The hydraulic flow was initially at 44 USgpm, gradually decreasing to 42 USgpm at the end of run 3, so the three runs were carried out at an average product flow of 208 USgpm. Through run 1 with 4% hot in/4% hot out the pump pressure decreases slightly and is 9.4 psi at the 12.15.23 mark point. The decline in pressure continues half way through run 2 (4% hot in /4% cold out) until pressure is at a low of 8 psi, at 12.16.25. Then a slight incline can be seen up to the mark point at 12.18.08 where 9 psi was logged. Run 3 started with 4% cold in/4% cold out from 12.18.23 and data were marked at 12.20.24. Pump pressure gradually increased during Run 3 to 14 psi at 12.19.29, and then increased more rapidly to a maximum of 55 psi at 12.20.25 before dropping back down to 41 psi at 12.20.51. What would have happened thereafter is unknown since all lube water at that time was shut down in preparation for the baseline test run. The pattern of the first two runs resembles what was observed in Test 2, runs 5 and 6. The core annular flow was re-established with the contaminated test hose using the 4% hot in/4% hot out WL combination (run 5) followed by run 6 with 4% hot in/4% cold out. The hot/hot combination worked well to re-establish the core annular flow and worked better than the hot/cold combination maintaining the lubricated flow with a contaminated

PUM
PDIS
HAHY
DOIL
FLO
INLE
TWL
OUT
LETW
L
MAS
-300
0 - O
UTL
ETW
L (G
PM
WAT
OU)
OUTLETWL (GPMWATOU)55 50 45 40 35 30 25 20 15 10 5 0 -5
12:1
4:00
12/1
4/20
0312
:15:
0012
:16:
0012
:17:
0012
:18:
0012
:19:
0012
:20:
00
Com
pany
Plot
Fold
erR
ecor
ding
Cha
nC
h. L
abel
Type
Rec
ordi
ng s
tart
Rec
ordi
ng s
ize
Rem
ark
Ope
rato
r
N
EW F
OLD
ERU
ntitl
ed 2
11
PUM
PD
ISH
AP
SIG
14 D
ec 2
003
(11:
52:4
3 am
)12
29 s
ampl
es a
t 2
Sec
s
N
EW F
OLD
ERU
ntitl
ed 2
12
HY
DO
ILF
LOG
PM
OIL
14 D
ec 2
003
(11:
52:4
3 am
)12
29 s
ampl
es a
t 2
Sec
s
N
EW F
OLD
ERU
ntitl
ed 2
13
INLE
TWL
GP
MW
ATIN
14 D
ec 2
003
(11:
52:4
3 am
)12
29 s
ampl
es a
t 2
Sec
s
N
EW F
OLD
ERU
ntitl
ed 2
14
OU
TLET
WL
GP
MW
ATO
U14
Dec
200
3 (1
1:52
:43
am)
1229
sam
ples
at
2 S
ecs
Run
1
Run
2R
un 3
P pum
p
Figu
re 5
3 LA
MO
R G
T-A
50
Zoom
in o
n th
e Th
ree
Test
Run
s with
Con
tam
inat
ed T
est H
oses
JVOPS 6 Workshop Report flemingCo environmental
157
JVOPS 6 Workshop Report flemingCo environmental
158
Gra
ph 4
/3 A
Test
4/3
A L
AM
OR
GT-
A 5
0
0102030405060708090100
110
120
130
140
150
160
170
180
190
200
210
220
11:52:47
11:53:47
11:54:47
11:55:47
11:56:47
11:57:47
11:58:47
11:59:47
12:00:47
12:01:47
12:02:47
12:03:47
12:04:47
12:05:47
12:06:47
12:07:47
12:08:47
12:09:47
12:10:47
12:11:47
12:12:47
12:13:47
12:14:47
12:15:47
12:16:47
12:17:47
12:18:47
12:19:47
12:20:47
12:21:47
12:22:47
12:23:47
12:24:47
12:25:47
12:26:47
12:27:47
12:28:47
12:29:47
12:30:47
12:31:47
12:32:47
Tim
e
T(w
l in)
(deg
F)
T(w
l out
) (de
g F)
T(oi
l/inl
et)A
(deg
F)
T(oi
l/bul
k)A
(deg
F)
T(oi
l/bul
k)B
(deg
F)
T(oi
l/inl
et)B
(deg
F)
P(pu
mp)
(PSI
)
Q(h
ydr)
(GPM
)
Q(w
l in)
(GPM
)
Q(w
l out
) (G
PM)
Q(o
il) G
PM
*****12:12:15 START RECORDING DATA
*****12:15:23 Run #1 P(pump)=9.4 Q(oil)=213 WLin=7.9H WLout=8.1H
*****12:18:08 Run #2 P(pump)=9 Q(oil)=210 WLin=8.4H WLout=7.2C
*****12:20:37 Run #3 P(pump=50 Q(oil)=202 WLin=8.3C WLout=8.4C
*****12:33:30 STOP RECORDING DATA
Run
-In p
erio
d th
at h
ad to
be
stop
ped
due
to s
uspe
cted
W
L lin
e le
ak.
Test
hos
e go
t 88
% fi
lled
with
oil
and
lube
wat
er
Initi
al p
ump
star
t w
as 1
1:59
:17
>
JVOPS 6 Workshop Report flemingCo environmental
159
Gra
ph 4
/3 B
Test
4/3
B L
AM
OR
GT-
A 5
0 B
asel
ine
05101520253035404550556065707580859095100
105
110
115
120
125
130
135
140
145
150
155
160
165
170
175
180
185
190
195
12:47
:0012
:47:16
12:47
:3212
:47:48
12:48
:0412
:48:20
12:48
:3612
:48:52
12:49
:0812
:49:24
12:49
:4012
:49:56
12:50
:1212
:50:28
12:50
:4412
:51:00
12:51
:1612
:51:32
12:51
:4812
:52:04
12:52
:2012
:52:36
12:52
:52T(
wl i
n) (d
eg F
)T(
wl o
ut) (
deg
F)T(
oil/i
nlet
)A (d
eg F
)T(
oil/b
ulk)
A (d
eg F
)B
ulkO
ilB (d
eg F
)T(
oil/i
nlet
)B (d
eg F
)P(
pum
p) (p
si)
Q(h
ydr)
(GPM
)Q
(wl i
n) (G
PM)
Q(w
l out
) (G
PM)
Q(o
il) (G
PM)
*****12:47:46 START RECORDING DATA
*****12:50:39 Run #4 Baseline, no WL. Ave. P(pump)=180 (Average 12:49:46 to 12:52:20) Q(oil)=26.8 (Drum Fill)
*****12:52:32 Shut Off Hydraulic Flow to Pump
*****12:52:32 STOP RECORDING DATA

JVOPS 6 Workshop Report flemingCo environmental
160
test hose. Once the hot/cold combination had been on for some time the pressure started rising. When the pump pressure curve is studied more closely, this is also what we see in runs 1 and 2 of this test. It is therefore reasonable to consider that runs 1 to 3 of this test were carried out as test runs on a contaminated test hose. To get an impression on how the pressure would have developed with a clean test hose, it is necessary to go back to the initial start of the pump at 11.59.30. For the first 20 seconds, the pump worked at 19 USgpm hydraulic flow (97 USgpm oil and inlet lube water plus 8.2 USgpm outlet lube water). The next 1 min. 35 sec. the pump worked at an average 44 USgpm hydraulic flow (213 USgpm oil and inlet lube water plus 8.1 USgpm outlet lube water). In total 385 gallons of test oil and lube water had in this way been pumped into the hose when the pump was stopped. Each ft of test hose contains 1.42 gal, which means that 385/1.42 ft = 270 ft out of the 308.5 ft test hose, 88%, had already been filled with oil and lube water. The average pump pressure in the active initial pumping period is 4.5 psi and apparently with no increasing trend towards the end. With only 12 % of the full hose length left there is no reason to expect that the pressure drop on the full hose length would have increased to more than 5 psi with 4% hot in/4% hot out WL, if pumping had been continued. For the purpose of this test report, a 10% margin is added and the resulting estimate of the performance of the GT-A 50 pump on a clean test hose is reported as maximum 5.5 psi pressure drop @ 205 USgpm product on 210 k cSt oil through 308.5 ft hose with the 4% hot in/4% hot out water lubrication combination. Based on the results from all other tests with clean hoses, where the 4% hot/4% cold lube water combination was applied after the hot/hot combination, there is reason to expect that the pump would have performed at a similar pressure drop of maximum 5.5 psi with 4% hot inlet water and 4% cold outlet water. The performance with 4% cold/ 4% cold lube water would probably have showed results in the same pressure drop range, but, as noted in the analysis of the earlier tests, this lube water combination probably always benefited from the previous (more heat intensive) lube water combination. The test runs were too short to ensure that lube water from the settings of the previous run would not have influence on the next. Baseline test run The baseline run was carried out after a 17 minutes break (from 12.32 to 12.49). See Graph 4/3B. The hydraulic flow readings are negative before the run and in some periods from 12.49 to the mark point at 12.50.39, and have therefore been disregarded. But a drum fill control was carried out at 12.50.39, and the result of this has been inserted with a pump performance of 26 USgpm. The average pump pressure from 12.40.46 to 12.52.20 was 180 psi. The 26 USgpm corresponds with the pump capacity that was recorded for the DOP-250 pump in the similar Master Test baseline run. A pressure of 180 to 181 psi on an oil of a certain viscosity will through the same hose

JVOPS 6 Workshop Report flemingCo environmental
161
length deliver a specific amount of oil. This is not pump dependent, but pressure dependent only. Both pumps further operated at the same relative power supply, ∆Phydr. Table 5 provides a performance overview for the tested GT-A 50 pump. The “runs” 0 and 00 are estimated phantom runs based on the initial pumping period with a clean test hose until the pump was stopped due to a suspected WL leak. Runs 1 to 3 are runs with a contaminated test hose. Table 5 Test 4.3 Performance Overview, 308.5 ft of hose, 210,000 cSt oil Run # WL in WL out Pump capacity
Q(oil) USgpm Pump pressure
psi PIF
see section 7.0 0 clean hose estimation
4% hot water 4% hot water 205 5.5 255
00 clean hose estimation
4% hot water 4% cold water 205 5.5 255
1 dirty hose 4% hot water 4% hot water 205 9.4 149 2 dirty hose 4% hot water 4% cold water 205 9 156 3 dirty hose 4% cold water 4% cold water 202 50 28 4 baseline 0 0 26 (drum fill) 180 n/a Conclusion The pump stop ordered by the Lead Engineer at the end of the initial run-in period with the pump was most unfortunate, but necessary. Fortunately pumping had been going on for enough time to provide data for an estimation of the performance with clean hoses. The runs that were carried out after the stop were on a contaminated test hose. The pump and its AWIFs proved to work efficiently under these more real world conditions. Without water lubrication, the pump was able to move the test oil through the 308.5 ft hose at a rate 26 USgpm, which, according to the similar test with the DOP-250 pump, would be enough flow to re-establish core annular flow with a hot in/hot out lube water combination applied.

JVOPS 6 Workshop Report flemingCo environmental
162
7.7 Test 4/4 FRAMO TK-125 Test on 190 k cSt Oil / 307 ft Hose Test Date 14 December, 2003 Test Line USCG Test Pump FRAMO TK-125 Double Screw Pump Pump Motor Standard A2FM80 (not special high torque) Inlet AWIF None, instead was fitted a 3/8” inlet injection tube Outlet AWIF FRAMO type outlet AWIF Test Hose 307 ft 6” lay flat type including riser hose arrangement Test Oil JCOS Bitumen Crude Oil Target Viscosity 200,000 cSt Measured Viscosity 190,000 cSt @ 71 F (Dec. 03 Temp-Viscosity Curve, Fig. 50) The purpose of this test was to investigate the performance of the TK-125 pump with the same parameters as applied with the USCG DOP-250 pump in the USCG Master Test (Test 2). This would provide valuable basis for a comparison and would, based on the long distance performance of the DOP-250 pump, provide a platform for an estimation of the long distance pumping potential of the FRAMO pump with its most optimal lube water configuration applied. Please consult the Data Collection Sheet for Test 4/4 in section 6.5 and Graph 4.4 for information on retrieved data. The FRAMO TK-125 pump can be seen in Figure 54.
Inlet Injection Tube
Outlet AWIF
Figure 54 FRAMO TK-125 Double Screw Pump with Inlet Injection Tube and Outlet AWIF

JVOPS 6 Workshop Report flemingCo environmental
163
Gra
ph 4
/4
Test
4/4
FR
AM
O T
K-1
25
05101520253035404550556065707580859095100
105
110
115
120
125
130
135
140
145
150
155
160
165
170
175
180
185
190
195
200
205
210
215
15:55:0115:56:5515:58:4916:00:4316:02:3716:04:3116:06:2516:08:1916:10:1316:12:0716:14:0116:15:5516:17:4916:19:4316:21:3716:23:3116:25:2516:27:1916:29:1316:31:0716:33:0116:34:5516:36:4916:38:4316:40:3716:42:3116:44:2516:46:1916:48:1316:50:0716:52:0116:53:55
T(w
l in)
(deg
F)
T(w
l out
) (de
g F)
T(oi
l/inl
et)A
(deg
F)
T(oi
l/bul
k)A
(deg
F)
T(oi
l/bul
k)B
(deg
F)
T(oi
l/inl
et)B
(deg
F)
P(pu
mp)
(PSI
)Q
(hyd
r) (G
PM)
Q(w
l in)
(GPM
)Q
(wl o
ut) (
GPM
)
*****15:55:15 START RECORDING DATA
*****16:11:37 Run #1 P(pump)=9.4 Q(oil)=47 WLin=4.5H WLout=4H
*****16:21:28 Run #2 P(pump)=10 Q(oil)=54 WLin=4H WLout=4C
*****16:31:42 Run #3 P(pump)=5.5 Q(oil)=54 WLin=4H WLout=4.5H
*****16:54:20 STOP RECORDING DATA
NO
TE: O
il Fl
ow R
ate
Rec
orde
d fr
om D
rum
Fill
Vol
umet
ric C
ontr
ol
(The
re is
no
corr
elat
ion
in th
is te
st b
etw
een
hydr
aulic
flow
rate
and
oil
flow
ra
te) A
ttem
ptin
g to
mak
e pu
mp
drag
in o
il by
app
lyin
g di
ffere
nt W
L se
tting
s
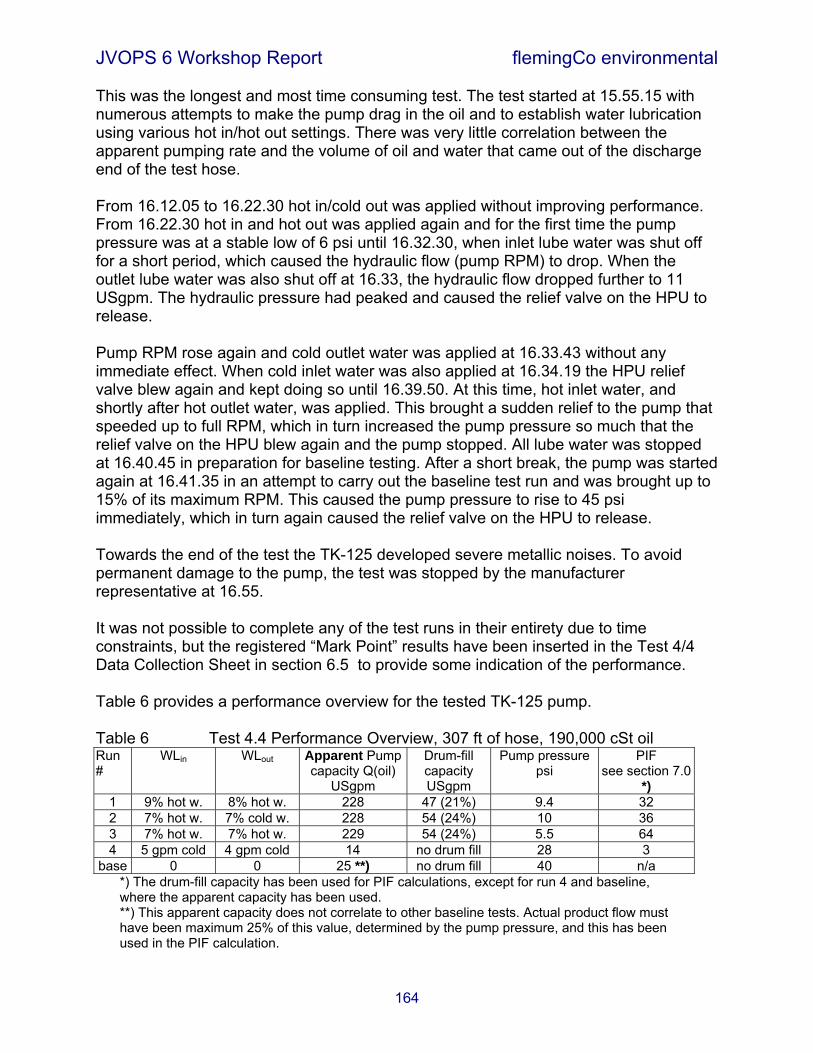
JVOPS 6 Workshop Report flemingCo environmental
164
This was the longest and most time consuming test. The test started at 15.55.15 with numerous attempts to make the pump drag in the oil and to establish water lubrication using various hot in/hot out settings. There was very little correlation between the apparent pumping rate and the volume of oil and water that came out of the discharge end of the test hose. From 16.12.05 to 16.22.30 hot in/cold out was applied without improving performance. From 16.22.30 hot in and hot out was applied again and for the first time the pump pressure was at a stable low of 6 psi until 16.32.30, when inlet lube water was shut off for a short period, which caused the hydraulic flow (pump RPM) to drop. When the outlet lube water was also shut off at 16.33, the hydraulic flow dropped further to 11 USgpm. The hydraulic pressure had peaked and caused the relief valve on the HPU to release. Pump RPM rose again and cold outlet water was applied at 16.33.43 without any immediate effect. When cold inlet water was also applied at 16.34.19 the HPU relief valve blew again and kept doing so until 16.39.50. At this time, hot inlet water, and shortly after hot outlet water, was applied. This brought a sudden relief to the pump that speeded up to full RPM, which in turn increased the pump pressure so much that the relief valve on the HPU blew again and the pump stopped. All lube water was stopped at 16.40.45 in preparation for baseline testing. After a short break, the pump was started again at 16.41.35 in an attempt to carry out the baseline test run and was brought up to 15% of its maximum RPM. This caused the pump pressure to rise to 45 psi immediately, which in turn again caused the relief valve on the HPU to release. Towards the end of the test the TK-125 developed severe metallic noises. To avoid permanent damage to the pump, the test was stopped by the manufacturer representative at 16.55. It was not possible to complete any of the test runs in their entirety due to time constraints, but the registered “Mark Point” results have been inserted in the Test 4/4 Data Collection Sheet in section 6.5 to provide some indication of the performance. Table 6 provides a performance overview for the tested TK-125 pump. Table 6 Test 4.4 Performance Overview, 307 ft of hose, 190,000 cSt oil Run #
WLin WLout Apparent Pump capacity Q(oil)
USgpm
Drum-fill capacity USgpm
Pump pressure psi
PIF see section 7.0
*) 1 9% hot w. 8% hot w. 228 47 (21%) 9.4 32 2 7% hot w. 7% cold w. 228 54 (24%) 10 36 3 7% hot w. 7% hot w. 229 54 (24%) 5.5 64 4 5 gpm cold 4 gpm cold 14 no drum fill 28 3
base 0 0 25 **) no drum fill 40 n/a *) The drum-fill capacity has been used for PIF calculations, except for run 4 and baseline, where the apparent capacity has been used. **) This apparent capacity does not correlate to other baseline tests. Actual product flow must have been maximum 25% of this value, determined by the pump pressure, and this has been used in the PIF calculation.

JVOPS 6 Workshop Report flemingCo environmental
165
The results indicate that even though the pump never delivered more than 24% of the apparent capacity based on the hydraulic flow, this is, with the pressure reduction and capacity increases incorporated when using lube water combinations with hot water on the inlet, nevertheless 32 to 64 times better than in the baseline test without water injection. It has been assumed that the baseline run actually delivered only 25% of the stated 25 USgpm, based on the delivered pressure and comparison with baseline runs in Tests 2 and 4/3. Run 4 shows the limited effect of cold water injection at the inlet of the pump. The fact that the pump (and thereby its hydraulic motor) was able to blow the relief valve on the HPU at a relatively low pump performance indicates that the hydraulic motor has too little torque for this type of oil. The pump would probably have performed somewhat better if a high torque motor had been used The inlet opening of the TK-125 seems to be too small for this type of oil (Figure 55). In addition, the cavities inside the pump are relatively small, and the screws rotate tightly against each other. This develops very high friction with this type of oil, unless the oil is accompanied by hot water. Unfortunately this type of pump is for design reasons not suitable for water pumping and with inlet water injection it cannot be avoided that the pump sometimes must pump pure water. Conclusion Even though hot water injection on the inlet side of the TK-125 pump could improve performance significantly, an operational pumping rate was never achieved. The small inlet opening and the small cavities inside the pump do not support pumping of the test oil at 190,000 cSt viscosity. The TK-125 double screw pump with its water injection devices, as tested, must therefore be considered less suitable for oil at these high viscosities than the PDAS pump types. The pump may have potential on lower viscosity oil, and on high viscosity oil when applied in conjunction with local bulk heating.
Figure 55 FRAMO TK-125 Intake Opening of max. 5 sq. inch. The intake opening of a DOP-250 is 16 times larger.
3/8” Inlet Injection Tube
Pump Intake

JVOPS 6 Workshop Report flemingCo environmental
166
7.8 Test 5 CCG Pre Test on 530 k cSt Oil / 68.5 ft Hose Test Date 10 December, 2003 Test Line CCG Test Pump CCG GT-185 Modified PDAS Pump (high pressure/high temperature plate wheel) Pump Motor Ross Series ME 15 High Torque Hydraulic Motor Inlet AWIF flemingCo inlet injection device Outlet AWIF flemingCo outlet AWIF Test Hose 68.5 ft 6” lay flat type including riser hose arrangement Test Oil JCOS Bitumen Crude Oil Target Viscosity 500,000 cSt Measured Viscosity 530,000 cSt @ 60 F (Dec. 03 Temp-Viscosity Curve, Fig. 50) The purpose of this test was to find the best combination of hot inlet and outlet lube water. As per pre test decision by the Canadian Coast Guard, this pump would, based on previous extreme viscosity testing in Canada, only be tested with hot lube water. Please consult the Data Collection Sheet for Test 5 in section 6.5 and Graph 5 for information on retrieved data. The CCG GT-185 pump can be seen in Figure 56. The hot lube water for this test could only be heated to 180 F due to a temporary problem with the USN boiler system. It was decided to carry out the test with lube water of this temperature even though the target had been 200 to 210 F. This would provide
Inlet lube device
Outlet AWIF
Inlet lube device
Outlet AWIF
Figure 56 CCG GT-185 PDAS Pump with Inlet and Outlet AWI Devices

JVOPS 6 Workshop Report flemingCo environmental
167
Gra
ph 5
Test
5 O
ptim
izin
g Lu
bric
atio
n G
T-18
5
05101520253035404550556065707580859095100
105
110
115
120
125
130
135
140
145
150
155
160
165
170
175
180
18:07:0318:07:3718:08:1118:08:4518:09:1918:09:5318:10:2718:11:0118:11:3518:12:0918:12:4318:13:1718:13:5118:14:2518:14:5918:15:3318:16:0718:16:4118:17:1518:17:4918:18:2318:18:5718:19:3118:20:0518:20:3918:21:1318:21:4718:22:2118:22:5518:23:2918:24:0318:24:37
T(w
l in)
(deg
F)
T(w
l out
) (de
g F)
T(oi
l/inl
et)A
(deg
F)
T(oi
l/bul
k)A
(deg
F)
T(oi
l/bul
k)B
(deg
F)
T(oi
l/inl
et)B
(deg
F)
P(pu
mp)
(PSI
)
Q(w
l in)
(GPM
)
Q(w
l out
) (G
PM)
*****18:07:49 START RECORDING DATA
*****18:11:08 Run #1 P(pump)=4.6 Q(oil)=96 WLin=8.5H WLout=7H
*****18:14:47 Run #3 P(pump)=6.1 Q(oil)=110 WLin=3.5H WLout=8.1H
*****18:16:08 Run #4 P(pump)=5.5 Q(oil)=113 WLin=6.5H WLout=5.2H
*****18:12:57 Run #2 P(pump)=5.6 Q(oil)=98 WLin=6.1H WLout=6.2H
*****18:17:28 Run #5 P(pump)=5.9 Q(oil)=118 WLin=4.8H WLout=4.9H
*****18:20:10 WL Shut Down
*****18:21:20 Run #6 P(pump)=5.5 Q(oil)=107 WLin=0 WLout=0 NOT BASELINE DUE TO LUBE WATER AND INCREASED OIL TEMP
*****18:24:25 STOP RECORDING DATA
NO
TE: S
igna
l Fro
m D
L H
ydra
ulic
Flo
w M
eter
Not
Rec
eive
d (O
il Fl
ow R
ates
are
Fro
m Q
(hyd
r) B
acku
p)
*****18:18:40 Run #6 P(pump)=5.6 Q(oil)=120 WLin=3.4H WLout=4.9H
*****18:20:05 Run #7 P(pump)=5.5 Q(oil)=121 WLin=2.1H WLout=2H

JVOPS 6 Workshop Report flemingCo environmental
168
results that might be closer to real world conditions where almost boiling water may not be available. The pump was initially started at 18.00 but a necessary check of the WLCS delayed the start to 18.08 where WL settings were made for the first run with 7% hot in/7% hot out. The pump was gradually brought up to full speed at 21 USgpm hydraulic flow (electronic recording of hydraulic flow failed in this test so the backup data have been used). At the Mark Point after the first run an astounding low discharge pressure of 4.6 psi was recorded and the pressure never exceeded 6.1 psi in the following six runs with various combinations of hot lube water. After the last run at 18.20.05 the lube water was shut off and the pump worked without lube water until it was stopped at 18.22.20. During this “dry” period the pressure pulsated significantly but the average remained at the same 5.5 psi that was recorded at the end of run 7 with hot lube water, 1.7% in/1.7% out. A pressure increase from 4.6 to 5.6 psi can be observed from run 1 to 2 where the lube water was slightly reduced, and the increase continued over run 3 (with 3% hot in/7% hot out) to 6.1 psi. When the hot inlet lube water again was increased in run 4 (to 6%) the pressure started dropping, even though the outlet water had been reduced to 4.5%, and was 5.5 psi at the Mark Point. A further reduction of lube water to 4% in/4% out (run 5) caused the pressure to increase slightly to 5.9 psi, but in run 6 the trend was downwards even with less inlet lube water (3% in/4% out) and 5.6 psi was recorded at 18.18.40. The lube water was further reduced to 1.7% in/1.7% out in run 7 but the pressure remained nearly constant and 5.5 psi was logged at 18.20.05. After run 7 the lube water was shut down and it can be observed that this causes a pulsating pressure but no increase in the average pressure up to 18.22.20 when the pump was stopped. The recorded pressures were impressively low throughout the test. Over the first 5 runs there seems to be logic in what happens to the pressure: More hot water seems better than less hot water, especially at the inlet side. But from run 4 to 7 this pattern changes. It does not seem to matter which settings are used. Even no lube water keeps the average pressure low, although the power consumption (∆Phydr) increases significantly. The hydraulic flow to the test pump was slightly increasing throughout the test, starting at 21 USgpm and ending at 25 USgpm in Run 7. It only came back down to 22 USgpm when the lube water was shut off. These findings correlate with the findings in Tests 1/1, 1/2, and 2. It seems as if the core annular flow further optimizes over time and that the individual test runs are too short to get the “old” WL settings (or conditions) replaced with the “new”. Possible re-use of already pumped oil From 18.09.40 to 18.20.05 the pump operated at an average hydraulic flow of 23.4 USgpm or a pump flow rate of 116 USgpm including inlet lube water. If an average of 4.5 USgpm inlet lube water are deducted, the pump worked at 111.5 USgpm for 10 minutes and 25 seconds and removed a total of 1170 gallons or about 27 bbl from the main section of the test tank. However, about 3.2 bbl (0.92x1.42 gal/ft) of this would still be in the test hose together with about 8% lube water, so about 24 bbl of oil had been returned to the tank. The CCG test tank contained a total of 60 bbl of test oil and could

JVOPS 6 Workshop Report flemingCo environmental
169
in its baffle region contain one third of this, or about 20 bbl. This means that towards the end of the test, some limited amount of used oil may have entered the 40 bbl main tank and may have been mixed with the unused and colder oil. Simultaneously some slightly warmer oil from the upper levels in the test tank may, towards the end of the test, have replaced the lower and slightly colder oil layer that had been removed by the pump. The two bulk oil temperature sensors in the main tank section did not log any increase in temperature, so if warmer oil had entered the pumping area, it must have followed a “path” that would not allow for contact with these sensors. Therefore the inlet oil and discharge oil temperatures (Toil/inlet and Toil/disch) should be studied:
• Toil/inlet increases only slightly during runs 1 to 5 from 60 to 62 F (the 76 F after run 3 must be caused by a some oil that was heated by surfacing hot lube water at the test start or from back flushed inlet lube water from the pump). But through runs 5, 6, and 7 a steep increase from 62 to 74 can be observed. After run 8 the temperature was down to 68 F. It must, however, be noted that especially for the GT-185, which has poor sealing characteristics with water (Ref 2), the inlet oil temperature may always be influenced by hot inlet lube water flowing backward from the pump screw.
• Toil/disch is more unclear. But close to the end, in runs 7 and 8, a steep increase
from 79 to 87 can be observed. The increase of these two temperature readings towards the end of the test does not correlate well with the fact that a decreasing amount of heat was applied to the pumped oil. There is therefore reason to believe that towards the end of the test (probably in runs 6 and 7, and surely in run 8) some of the already used and heated test oil may have mixed with the colder oil, thus facilitating the pumping process. Or, as mentioned above, slightly warmer oil from the top of the tank may have reached the pump. The drop in inlet temperature at the end of run 8 could indicate that this was not a constantly developing process but rather something that happened some of the time towards the end. The fact that the average pressure during and after run 8 did not increase after the lube water was shut off supports this theory. The relatively high average inlet oil and discharge oil temperatures in run 8 indicate a significant viscosity reduction from 530 k cSt to somewhere between 250,000 cSt (68 F) and 150 cSt (74 F) for some of the oil that was pumped. The observed pressure pulsations probably relate to the lack of some dampening effect by the inlet lube water on the PDAS pump’s normal operating pulsations. The observed power increase is probably because of much higher friction inside the pump caused by the non lubricated oil. “Baseline test”
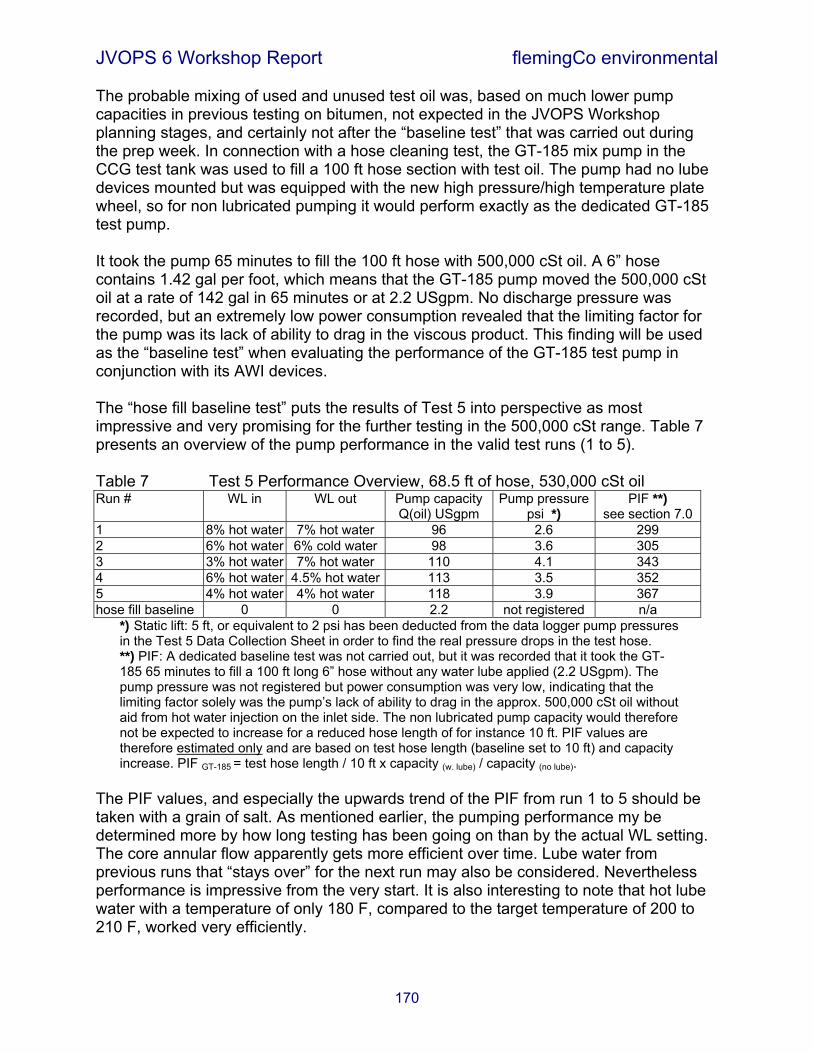
JVOPS 6 Workshop Report flemingCo environmental
170
The probable mixing of used and unused test oil was, based on much lower pump capacities in previous testing on bitumen, not expected in the JVOPS Workshop planning stages, and certainly not after the “baseline test” that was carried out during the prep week. In connection with a hose cleaning test, the GT-185 mix pump in the CCG test tank was used to fill a 100 ft hose section with test oil. The pump had no lube devices mounted but was equipped with the new high pressure/high temperature plate wheel, so for non lubricated pumping it would perform exactly as the dedicated GT-185 test pump. It took the pump 65 minutes to fill the 100 ft hose with 500,000 cSt oil. A 6” hose contains 1.42 gal per foot, which means that the GT-185 pump moved the 500,000 cSt oil at a rate of 142 gal in 65 minutes or at 2.2 USgpm. No discharge pressure was recorded, but an extremely low power consumption revealed that the limiting factor for the pump was its lack of ability to drag in the viscous product. This finding will be used as the “baseline test” when evaluating the performance of the GT-185 test pump in conjunction with its AWI devices. The “hose fill baseline test” puts the results of Test 5 into perspective as most impressive and very promising for the further testing in the 500,000 cSt range. Table 7 presents an overview of the pump performance in the valid test runs (1 to 5). Table 7 Test 5 Performance Overview, 68.5 ft of hose, 530,000 cSt oil Run # WL in WL out Pump capacity
Q(oil) USgpm Pump pressure
psi *) PIF **)
see section 7.0 1 8% hot water 7% hot water 96 2.6 299 2 6% hot water 6% cold water 98 3.6 305 3 3% hot water 7% hot water 110 4.1 343 4 6% hot water 4.5% hot water 113 3.5 352 5 4% hot water 4% hot water 118 3.9 367 hose fill baseline 0 0 2.2 not registered n/a
*) Static lift: 5 ft, or equivalent to 2 psi has been deducted from the data logger pump pressures in the Test 5 Data Collection Sheet in order to find the real pressure drops in the test hose. **) PIF: A dedicated baseline test was not carried out, but it was recorded that it took the GT-185 65 minutes to fill a 100 ft long 6” hose without any water lube applied (2.2 USgpm). The pump pressure was not registered but power consumption was very low, indicating that the limiting factor solely was the pump’s lack of ability to drag in the approx. 500,000 cSt oil without aid from hot water injection on the inlet side. The non lubricated pump capacity would therefore not be expected to increase for a reduced hose length of for instance 10 ft. PIF values are therefore estimated only and are based on test hose length (baseline set to 10 ft) and capacity increase. PIF GT-185 = test hose length / 10 ft x capacity (w. lube) / capacity (no lube).
The PIF values, and especially the upwards trend of the PIF from run 1 to 5 should be taken with a grain of salt. As mentioned earlier, the pumping performance my be determined more by how long testing has been going on than by the actual WL setting. The core annular flow apparently gets more efficient over time. Lube water from previous runs that “stays over” for the next run may also be considered. Nevertheless performance is impressive from the very start. It is also interesting to note that hot lube water with a temperature of only 180 F, compared to the target temperature of 200 to 210 F, worked very efficiently.

JVOPS 6 Workshop Report flemingCo environmental
171
Conclusion Test 5 demonstrated how easily the GT-185 pump can drag in and pump the extremely sticky 530 k cSt test oil when hot water at 180 F is injected at both the inlet and outlet AWI devices. The test did not provide reliable information as to which WL settings are the most optimal, but the test vaguely indicates that higher inlet WL percentages seem better than lower.

JVOPS 6 Workshop Report flemingCo environmental
172
7.9 Test 6+7 CCG Master Test (111.5 ft) / Long Distance Test (515 ft) Test Date 12 December, 2003 Test Line CCG Test Pump CCG GT-185 Modified PDAS Pump (high pressure/high temperature plate wheel) Pump Motor Ross Series ME 15 High Torque Hydraulic Motor Inlet AWIF flemingCo inlet AWI device Outlet AWIF flemingCo outlet AWIF Test Hose 111.5/515 ft 6” lay flat type including riser hose and SHAS Test Oil JCOS Bitumen Crude Oil Target Viscosity 500,000 cSt Measured Viscosity 480,000 cSt @ 61 F (Dec. 03 Temp-Viscosity Curve, Fig. 50) The first purpose of this test was to test, on the nominal CCG Master Test pumping distance of 100 ft, the WL settings that were found in the pre tests to have the highest potential or to be the most feasible from an operational stand point. After Tests 1/1, 1/2, and 5 (see section 7.3.2, Conclusions) it was decided that the CCG Master Test (Test 6) would be conducted primarily with hot water on both inlet and outlet side of the GT-185 pump as originally planned. However, the positive findings on the hot in/cold out WL combination in Tests 1/1 and 1/2 led to the decision to also test the GT-185 pump with hot in/cold out after the hot in/hot out combination. The decided percentages (4/4) for the continued testing at the USCG 200,000 cSt test line would also be applied in this test. This was partly based on observations from the CCG 530 k cSt pre test (Test 5) where the 4% hot / 4% hot combination had given satisfactory performance, although apparently not optimal. After completing the planned test runs in the Master Test section, an additional test would be conducted by adding on an additional 400 ft length of hose using the SHAS and without stopping the pumping process. If the 4 hot/4 cold WL settings had proved to have merit in the Master Test, these settings would be maintained. This would instantaneously start up the first run of Test 7 (long distance testing). The purpose of the long distance section of Test 6+7 was to meet the main CCG JVOPS Workshop goal of long distance pumping of 500,000 cSt oil up to minimum 500 ft by applying the most optimal lube water combinations and settings derived from the pre tests and Master Test. The test should provide further information on the degree of proportionality between hose pressure drop and hose length. The test would also be used for an estimation of the maximum possible pumping distance for a 500,000 cSt oil when applying the most optimal lube water combination. A possible requirement for additional lube water for increased pumping distance would be investigated. Please consult the Data Collection Sheet for Test 6+7 in section 6.5 and Graph 6+7 for information on retrieved data. The CCG GT-185 pump can be seen in Figure 56.
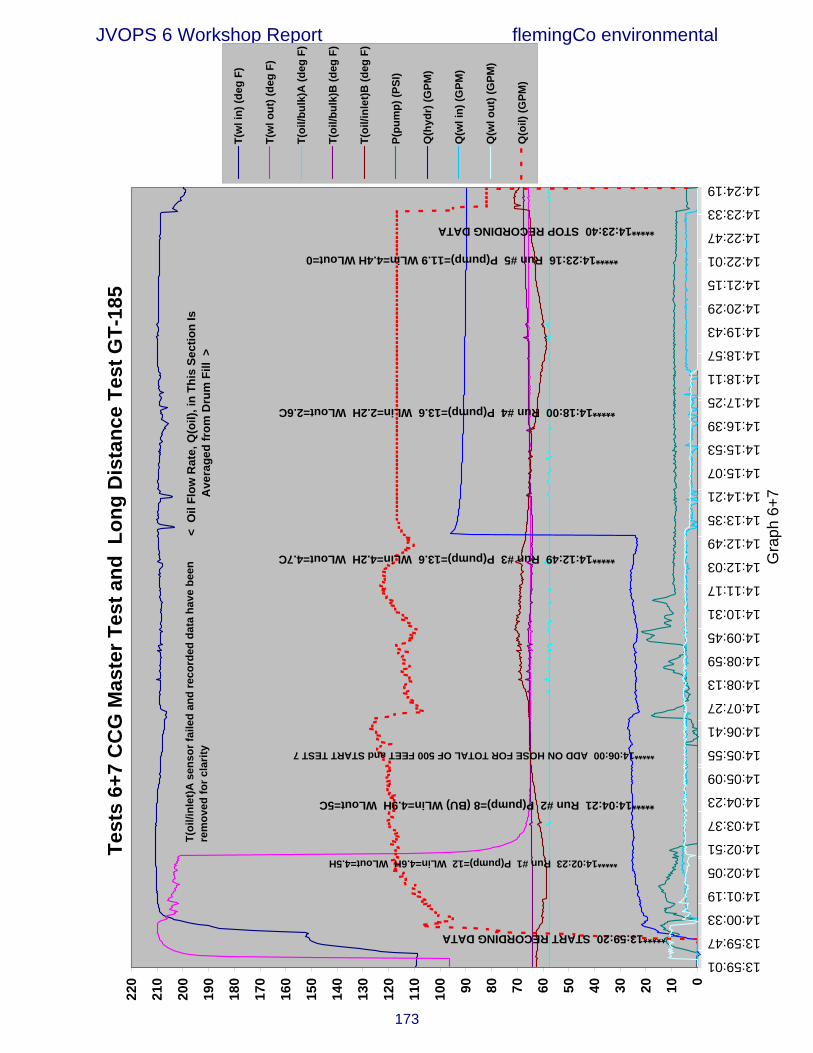
JVOPS 6 Workshop Report flemingCo environmental
173
Gra
ph 6
+7
Test
s 6+
7 C
CG
Mas
ter T
est a
nd L
ong
Dis
tanc
e Te
st G
T-18
5
0102030405060708090100
110
120
130
140
150
160
170
180
190
200
210
220
13:59:01
13:59:47
14:00:33
14:01:19
14:02:05
14:02:51
14:03:37
14:04:23
14:05:09
14:05:55
14:06:41
14:07:27
14:08:13
14:08:59
14:09:45
14:10:31
14:11:17
14:12:03
14:12:49
14:13:35
14:14:21
14:15:07
14:15:53
14:16:39
14:17:25
14:18:11
14:18:57
14:19:43
14:20:29
14:21:15
14:22:01
14:22:47
14:23:33
14:24:19
T(w
l in)
(deg
F)
T(w
l out
) (de
g F)
T(oi
l/bul
k)A
(deg
F)
T(oi
l/bul
k)B
(deg
F)
T(oi
l/inl
et)B
(deg
F)
P(pu
mp)
(PSI
)
Q(h
ydr)
(GPM
)
Q(w
l in)
(GPM
)
Q(w
l out
) (G
PM)
Q(o
il) (G
PM)
*****13:59:20 START RECORDING DATA
*****14:02:23 Run #1 P(pump)=12 WLin=4.6H WLout=4.5H
*****14:04:21 Run #2 P(pump)=8 (BU) WLin=4.9H WLout=5C
*****14:12:49 Run #3 P(pump)=13.6 WLin=4.2H WLout=4.7C
< O
il Fl
ow R
ate,
Q(o
il), i
n Th
is S
ectio
n Is
A
vera
ged
from
Dru
m F
ill >
*****14:18:00 Run #4 P(pump)=13.6 WLin=2.2H WLout=2.6C
*****14:23:16 Run #5 P(pump)=11.9 WLin=4.4H WLout=0
*****14:23:40 STOP RECORDING DATA
*****14:06:00 ADD ON HOSE FOR TOTAL OF 500 FEET and START TEST 7
T(oi
l/inl
et)A
sen
sor f
aile
d an
d re
cord
ed d
ata
have
bee
n re
mov
ed fo
r cla
rity

JVOPS 6 Workshop Report flemingCo environmental
174
Master Test The Master Test section on 111.5 ft hose was initially started at 13.15, but the GT-185 would not rotate despite full hydraulic power. The test was therefore stopped at 13.20 for an investigation of the problem. It appeared that one of the hydraulic hoses had disconnected at the pump (see section 6.4.4 for more on this). The problem was solved and at 13.59.54 the pump was started with the hot in and outlet lube water already applied (the QWLin graph shows no inlet flow until 14.00.24, but the curve for TWLin shows that the inlet lube water actually started at 15.59.19). Two runs (4% hot in/4% hot out and 4% hot in/4% cold out) were completed as scheduled. Run 1 had at the 14.02.23 Mark Point an unexpected high pump pressure of 12 psi. Probably the core annular flow had not yet had enough time to stabilize. The data logger pressure sensor seems not to have been reliable after run 1. A sudden peak at 14.02.48, followed by a drop to negative pressure, can be observed, and these are not reflected in the manual backup data. The backup data has therefore been used for run 2. With the settings changed at 14.02.39 to 4% hot in/4% cold out for run 2, the backup pressure was at the 14.04.21 Mark Point stable at 8 psi. Long distance test Test 7 started at 14.06.00, when the additional 400 ft of hose was added using the SHAS (without stopping the pumping process). The add-on procedure worked very well and seemed not to disturb pumping and core annular flow. Three long distance test runs were carried out with 3.5% hot in/4% cold out, 2% hot in/2% cold out, and finally 3.5% hot in only. The WL settings were still aimed at 4% hot in/4% cold out but were actually through run 3 at 3.5% hot in/4% cold out. The pump pressure (backup) increased slightly to 10 psi where it (apart from one peak to 20 psi at 14.10.35) remained stable through run 3 that was completed at 14.12.49. The data logger pressure sensor started working properly again from 14.11.10 and shows an almost steady pressure up to the Mark Point where 13.6 psi was logged. This is a remarkable small hose pressure drop increase, considering that the pressure only increased from 8 to 10 psi (DL: 13.6 psi) when increasing the pumping distance from 111.5 to 515 ft. The water lubricated oil discharge from the SHAS after pump transfer through 515 ft hose can be seen in Figure 57. The data logger sensing of hydraulic flow failed from 14.13.04, and backup data has been used from there on. It shows that the hydraulic flow remained stable at 25 USgpm throughout the test (117 to 119 USgpm product flow, dependent on inlet lube water setting).

JVOPS 6 Workshop Report flemingCo environmental
175
Run 4 was carried out with the lube water reduced to 2% hot in/2% cold out. Despite problems controlling the small flow of inlet lube water (shuts off now and then) the pump pressure remained stable and was still 13.6 psi (DL) at the 14.18.00 Mark Point. The last run (run 5) was ad hoc added in and conducted with 3.5% hot inlet lube water only. The pump pressure decreased slightly over the run and was 11.9 psi at the 14.23.16 Mark Point. Possible re-use of already pumped oil Like in the Test 5 pre test it is necessary to investigate whether warmer oil had been transferred by the pump towards the end of the test. This could have been caused by one or both of the following:
• Slightly warmer oil from the top of the tank that after some time had reached the pump, thus replacing slightly colder oil from the lower tank section that had been removed by the pump.
• Some used oil may have passed through the 20 bbl baffle section after it already
had been pumped once and have entered the 40 bbl main tank. It may there have been mixed with the unused and colder oil before being pumped once again.
From 14.00.30 to 14.12.50 (the end of the first long distance run (run 3)) the pump operated at an average hydraulic flow of 25 USgpm or at 123 USgpm including inlet lube water. If the average of 4 USgpm inlet lube water are deducted, the pump operated at 119 USgpm product flow for 12 minutes and 20 seconds and transferred a total of
Figure 57 Oil and Lube Water Discharge in 508 ft Test with CCG GT-185 Figure 57 Oil and lube water discharge in 515 ft test with CCG GT-185 pump.

JVOPS 6 Workshop Report flemingCo environmental
176
1468 gallons or about 33 bbl. However, due to the length of the discharge hose, it is necessary to consider the oil that at 14.12.50 still was in the 515 ft test hose, besides the 8% lube water. This amounts to 664 gallons (0.92x1.42 gal/ft) or 15 bbl. This means that 33 bbl had been pumped, but only 18 bbl had been returned to the 20 bbl baffle section in the test tank at the end of run 3. It should therefore not be expected that the first long distance test run could have been influenced by oil that had been pumped once. The bulk oil temperature (Toil/bulk) supports this by being at a stable 61 F from run 1 through run 3. Through run 4 it increases to 62 F and is 63 F at the end of the last test run. The temperature of the oil that is dragged into the pump (Toil/inlet) should also be considered. The main inlet oil temperature sensor at the pump intake never worked in this test and the backup sensor provided some unexpected readings and fluctuations that may be due to partly failure. The sensor logged 58.5 F at 14.01.31 (mid run 1), 71 F at 14.10.00 (last third of run 3), and 58.5 F at 14.19.13 (beginning of run 5), and it will be beyond reason to try to draw conclusions based on this temperature development. Based on the considerations three paragraphs above, it must be expected that already during the second long distance run (Run 4) some oil that had already been pumped once may have re-entered the pump, mixed with colder and not yet pumped oil. A significant amount of already used oil must have been pumped in Run 5 since more oil than the total volume in the test tank was pumped during this run. Run 4 must have been carried out with oil of a gradually increasing temperature and therefore decreasing viscosity. This is supported by the slightly increased bulk oil temperature, but more important by the calculations on consumed oil. The temperature of the discharged oil (Toil/disch), which during the most heat intensive tests (runs 1 to 3) were 5 to 10 F above the bulk oil temperature, is in run 4, with only 50% heat injection, 11 F above the bulk oil reading. This indicates vaguely that the temperature may have increased about 5 F. There is not enough reliable data to determine the exact viscosity during this run, but it would probably not be higher than 300,000 cSt (for a temperature guess of 66 F). The test result of this run is still impressive but will not be used for estimations on expected performance on the test oil at 500,000 cSt. Run 5 has a slightly lower average inlet oil temperature than run 4, but for reasons explained above these readings do not seem reliable. A viscosity lower than 300 k cSt, but above 200,000 cSt, is a best guess based on the temperatures. Runs 1 to 3 must therefore be used for an evaluation of the GT-185 performance on oil in the 500,000 cSt range when applying the tested inlet and outlet lube water settings. The probable mixing of used and unused test oil was, based on previous testing on bitumen, not expected in the JVOPS Workshop planning stages. Significantly lower pump capacities had been expected.

JVOPS 6 Workshop Report flemingCo environmental
177
An overview of the test results that are considered to be with 480 k cSt oil are presented in Table 8. Table 8 Test 6+7 Performance Overview, 111.5/515 ft of hose, 480,000 cSt oil Run # WL in WL out Pump capacity
Q(oil) USgpm Pump pressure
psi *) PIF **)
see section 7.0 1 111.5 ft 4% hot water 4% hot water 117 10 (PDL-2) 577 2 111.5 ft 4% hot water 4% cold water 118 9 (Pbackup +1) 582 3 515 ft 3.5% hot water 4% cold water 117 11.6 (PDL-2) 2700 hose fill baseline 0 0 2.2 not registered n/a
*) Static lift: 5 ft, or equivalent to 2 psi has been deducted from the data logger pump pressures in the Test 6+7 Data Collection Sheet in order to find the real pressure drops in the test hose. Where backup pressure has been used, (3 -2) psi = 1 psi is added due to the position of the manual gauge 7 ft above the DL transducer. An additional static lift of approximately 0.6 psi, caused by the reduced oil level in the test tank due to the oil content in the 515 ft test hose, has been neglected. **) PIF: A dedicated baseline test was not carried out, but it was recorded that it took the GT-185 65 minutes to fill a 100 ft long 6” hose without any water lube applied (2.2 USgpm). The pump pressure was not registered but power consumption was very low, indicating that the limiting factor solely was the pump’s lack of ability to drag in the approx. 500,000 cSt oil without aid from hot water injection on the inlet side. The non lubricated pump capacity would therefore not be expected to increase for a reduced hose length of for instance 10 ft. PIF values are therefore estimated only and are based on test hose length (baseline set to 10 ft) and capacity increase. PIF GT-185 = (test hose length / 10 ft) x (capacity (w. lube) / capacity (no lube)).
The slightly higher pressure drop in run 1 than in run 2 is probably more related to a further optimizing core annular flow over time than to a better performance of the hot/cold WL combination in run 2. This correlates well with the findings in the other tests. The extremely low pressure increase from runs 1 and 2 with 111.5 ft hose (average 9.5 psi) to run 3 with 515 ft hose (11.6 psi) indicates that the core annular flow not only becomes increasingly efficient over time but also that it becomes increasingly efficient throughout the test hose for extended hose lengths. This is also expressed by the simplified PIF estimation. There is no indication of proportionality between hose pressure drop and pumping distance. This does not correlate well with the proportionality findings between Test 2 and 3 on about 200,000 cSt oil at the USCG test line. A reasonable degree of proportionality was found here. A reasonable degree of proportionality also exists between Test 5 (68.5 ft, run 5) and Test 6 (111.5 ft, runs 1 and 2), assuming that run 1 of Test 6 for extended pumping would have developed the lower run 2 pump pressure of 8 psi. It could therefore seem as if the core annular flow could be optimized better with this oil at about 500,000 cSt than at about 200,000 cSt. Alternative suggestions would be a more optimal water lubrication at the GT-185 pump than at the DOP-250 pump, or that the core annular flow works better at the lower pumping rate of the GT-185 pump. It remains a question whether these suggestions have relevance. However, see section 7.11 for further analysis on this.

JVOPS 6 Workshop Report flemingCo environmental
178
Power consumption There is no increase in relative power consumption (∆Phydr) from 111.5 to 515 ft of hose. The power remains stable at the same level before and after the 400 ft hose section is added on. As previously mentioned, the extended pumping will gradually increase the temperature of the hydraulic oil, thus reducing power loss in the hydraulic hoses, so the figures may hide a slight increase in power to the pump after run 2. But the finding of a possible minimal power increase is quite remarkable, and may only be explained by an extremely optimized core annular flow, so that almost all the power is used to overcome internal pump friction. Conclusion For an evaluation of the performance of the GT-185 with its AWI devices on oil in the 500,000 cSt range, only runs 1 to 3 should be considered. The old (and no more produced) but modified pump performed extremely well in these tests with both 4% hot inlet WL / 4% hot outlet WL and 4% hot inlet WL / 4% cold outlet WL, especially considering its almost total lack of performance without lube water on oil of this viscosity. There was not observed any reasonable degree of proportionality between pumping distance and hose pressure drop. Consequently there was definitively no requirement for additional lube water for increased pumping distance. The CCG first priority JVOPS Workshop target of pumping oil in the 500,000 cSt range through up to 500 ft of hose at an operational rate was achieved with a safe margin. There is no doubt that the pumping distance could have been longer while still maintaining nearly maximum pump capacity. This will be studied in further detail in section 7.12.2. The results were achieved at a pumping rate of 117 USgpm, which should be compared with the CCG minimum requirement for an operational pumping rate of 44 to 53 USgpm (defined by the CCG Project Officer).

JVOPS 6 Workshop Report flemingCo environmental
179
7.10 Test 9+10 CCG/USCG Local Bulk Heating Test, 108 ft / 250,000 cSt Test Date 15 December, 2003 Test Line USCG Test Pump CCG GT-185 Modified PDAS Pump (high pressure/high temperature plate wheel) Pump Motor Ross Series ME 15 High Torque Hydraulic Motor Inlet AWIF flemingCo inlet AWI device Outlet AWIF flemingCo outlet AWIF Steam Coils USN Steam Coils for DOP-250 placed around GT-185 Pump Test Hose 108 ft 6” lay flat type including riser hose arrangement Test Oil JCOS Bitumen Crude Oil Target Viscosity 500,000 cSt Measured Viscosity 250,000 cSt @ 68 F (Dec. 03 Temp-Viscosity Curve, Fig. 50) The purpose of this test was to investigate the effect of local bulk heating (see section 3.1.2) applied at the test pump. Comparison would be made between local bulk heating alone and in conjunction with the inlet and outlet lube water combinations that in the earlier JVOPS Workshop tests had merit and that had been used in long distance testing. The test was, as per the on-site JVOPS Workgroup decisions on modifications to the Test Plan, supposed to be with 500 ft of hose and to be carried out at the CCG test line. However, because too much oil had been lost to the water receiving tank in Test 6+7 (see section 6.4.7) the test had to be moved “last minute” to the USCG test tank. In order to allow comparison with the pressure drop vs. viscosity verification test later in the day, the test would be conducted with 108 ft of hose. Please consult the Data Collection Sheet for Test 9+10 in section 6.5 and Graph 9+10 for information on retrieved data. The CCG GT-185 pump with the US Navy steam coils and riser hose can be seen hanging ready for deployment into the USCG Test Tank in Figure 58.
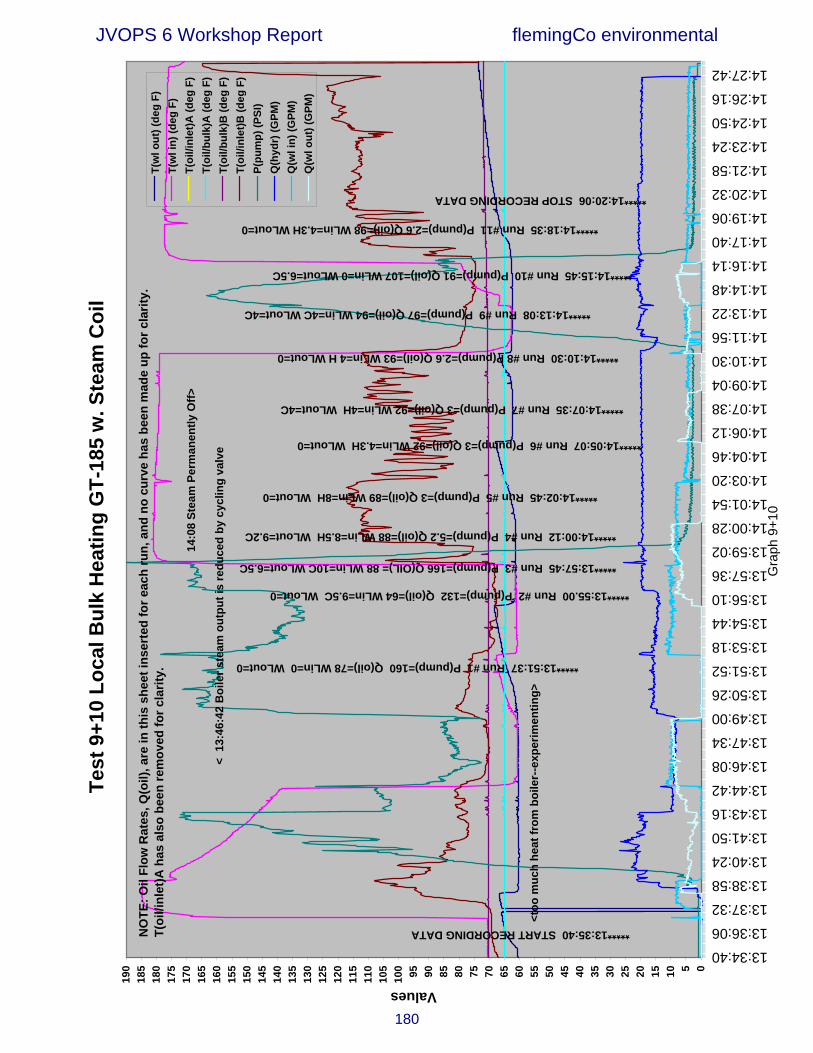
JVOPS 6 Workshop Report flemingCo environmental
180
Gra
ph 9
+10
T
est 9
+10
Loca
l Bul
k H
eatin
g G
T-18
5 w
. Ste
am C
oil
05101520253035404550556065707580859095100
105
110
115
120
125
130
135
140
145
150
155
160
165
170
175
180
185
190
13:34:40
13:36:06
13:37:32
13:38:58
13:40:24
13:41:50
13:43:16
13:44:42
13:46:08
13:47:34
13:49:00
13:50:26
13:51:52
13:53:18
13:54:44
13:56:10
13:57:36
13:59:02
14:00:28
14:01:54
14:03:20
14:04:46
14:06:12
14:07:38
14:09:04
14:10:30
14:11:56
14:13:22
14:14:48
14:16:14
14:17:40
14:19:06
14:20:32
14:21:58
14:23:24
14:24:50
14:26:16
14:27:42
Values
T(w
l out
) (de
g F)
T(w
l in)
(deg
F)
T(oi
l/inl
et)A
(deg
F)
T(oi
l/bul
k)A
(deg
F)
T(oi
l/bul
k)B
(deg
F)
T(oi
l/inl
et)B
(deg
F)
P(pu
mp)
(PSI
)Q
(hyd
r) (G
PM)
Q(w
l in)
(GPM
)Q
(wl o
ut) (
GPM
)
*****13:35:40 START RECORDING DATA
*****14:20:06 STOP RECORDING DATA
*****13:51:37 Run #1 P(pump)=160 Q(oil)=78 WLin=0 WLout=0
<too
muc
h he
at fr
om b
oile
r--e
xper
imen
ting>
14:
08 S
team
Per
man
ently
Off>
< 1
3:46
:42
Boi
ler s
team
out
put i
s re
duce
d by
cyc
ling
valv
e
*****13:55.00 Run #2 P(pump)=132 Q(oil)=64 WLin=9.5C WLout=0
*****13:57:45 Run #3 P(pump)=166 Q(OIL)= 88 WLin=10C WLout=6.5C
*****14:00:12 Run #4 P(pump)=5.2 Q(oil)=88 WLin=8.5H WLout=9.2C
*****14:02:45 Run #5 P(pump)=3 Q(oil)=89 WLin=8H WLout=0
*****14:05:07 Run #6 P(pump)=3 Q(oil)=92 WLin=4.3H WLout=0
*****14:07:35 Run #7 P(pump)=3 Q(oil)=92 WLin=4H WLout=4C
*****14:10:30 Run #8 P(pump)=2.6 Q(oil)=93 WLin=4 H WLout=0
*****14:13:08 Run #9 P(pump)=97 Q(oil)=94 WLin=4C WLout=4C
*****14:15:45 Run #10 P(pump)=91 Q(oil)=107 WLin=0 WLout=6.5C
*****14:18:35 Run #11 P(pump)=2.6 Q(oil)=98 WLin=4.3H WLout=0
NO
TE: O
il Fl
ow R
ates
, Q(o
il), a
re in
this
she
et in
sert
ed fo
r eac
h ru
n, a
nd n
o cu
rve
has
been
mad
e up
for c
larit
y.T(
oil/i
nlet
)A h
as a
lso
been
rem
oved
for c
larit
y.
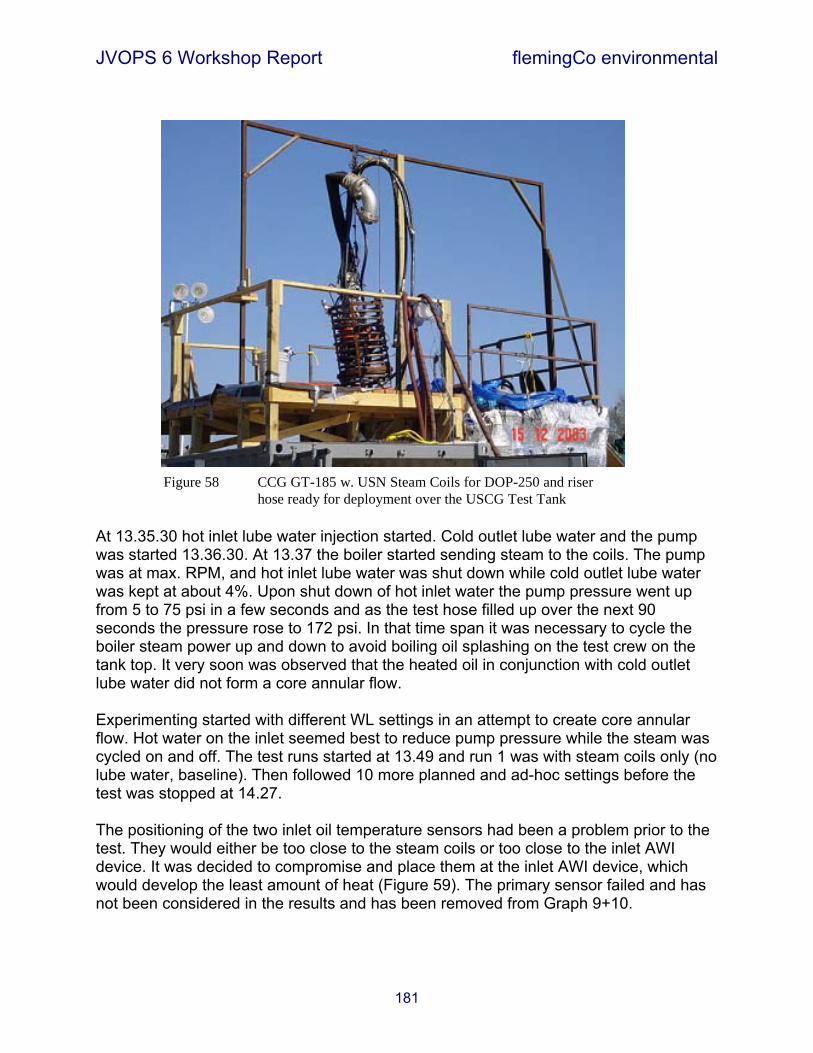
JVOPS 6 Workshop Report flemingCo environmental
181
At 13.35.30 hot inlet lube water injection started. Cold outlet lube water and the pump was started 13.36.30. At 13.37 the boiler started sending steam to the coils. The pump was at max. RPM, and hot inlet lube water was shut down while cold outlet lube water was kept at about 4%. Upon shut down of hot inlet water the pump pressure went up from 5 to 75 psi in a few seconds and as the test hose filled up over the next 90 seconds the pressure rose to 172 psi. In that time span it was necessary to cycle the boiler steam power up and down to avoid boiling oil splashing on the test crew on the tank top. It very soon was observed that the heated oil in conjunction with cold outlet lube water did not form a core annular flow. Experimenting started with different WL settings in an attempt to create core annular flow. Hot water on the inlet seemed best to reduce pump pressure while the steam was cycled on and off. The test runs started at 13.49 and run 1 was with steam coils only (no lube water, baseline). Then followed 10 more planned and ad-hoc settings before the test was stopped at 14.27. The positioning of the two inlet oil temperature sensors had been a problem prior to the test. They would either be too close to the steam coils or too close to the inlet AWI device. It was decided to compromise and place them at the inlet AWI device, which would develop the least amount of heat (Figure 59). The primary sensor failed and has not been considered in the results and has been removed from Graph 9+10.
Figure 58 CCG GT-185 w. USN Steam Coils for DOP-250 and riser hose ready for deployment over the USCG Test Tank

JVOPS 6 Workshop Report flemingCo environmental
182
A brief skimming of the Test 9+10 Data Collection Sheet in section 6.5 discloses that pumping with the steam coils without lube water did not work very well (run 1). Neither did the steam coils in conjunction with cold inlet lube water (runs 2 and 3). Only in conjunction with hot inlet lube water there could be produced results that resembled the performance in the earlier tests. The steam was shut permanently off at 14.02.48 and runs 8 to 11 are with WL only.
Figure 59 Positions of the Inlet Oil Temperature Sensors on the Inlet AWI Device of the CCG GT-185 Pump in Test 9+10.
Inlet Oil Temperature Sensors Inlet AWI Device

JVOPS 6 Workshop Report flemingCo environmental
183
Steam heat to coils The fact that it was necessary to switch the steam on and off throughout the runs with steam makes it very difficult to quantify the heat delivered to the coils, based on boiler output. There exists no reliable recording of the timing when the boiler was on and off. It is therefore necessary to look into the various oil temperatures that were recorded. The bulk oil temperature (Toil/bulk) remained stable at 68 F throughout the test. The inlet oil temperature (Toil/inlet) is interesting in run 1, since it provides an inlet oil temperature while the sensor is not influenced by the inlet lube water. At 77 F it is 11 F over the temperature of the bulk of the oil. This is an indication on how much (or rather how little) heat was applied by the coils and the test pump combined. In the remaining tests the inlet oil temperature (Toil/inlet) follows the application of inlet lube water more than anything else. Toil/inlet is high in runs with hot inlet lube water and lower with cold inlet lube water. Apart from run 1, the recorded oil inlet temperatures do not provide information on the temperature of the oil that entered the pump. The discharge oil temperature (Toil/disch) may be of some limited value when estimating the amount of heat applied with the steam coils. It is stable around 80 F in run 1 (steam only) and through runs 2 and 3 (steam and cold WL), even though the relative power consumption (∆Phydr) is high, in the 2500 to 2900 psi range. In run 4, with steam and hot WL in only, Toil/disch stays at 80 F but at a significantly reduced power consumption. As hot inlet water injection continues, Toil/disch increases to 86 F in run 5 and to 96 in run 6. Then it drops slightly after run 7 (95 F) with hot in/cold out. The decline continues to 89 F in run 8 with hot WL in only (before this run the steam was shut permanently down). In runs 9 and 10, only cold lube water is applied and the temperature drops first to 87 F (run 9) and then to 80 (run 10). Run 11, with hot inlet lube water, would then be expected to show a higher Toil/disch, but it does not. It is therefore relevant again to look at the relative power consumption. In run 10, when the pump pressure is high at 91 psi, the power consumption is 2930 psi. In run 11, with a pump discharge pressure that is 35 times lower, the power consumption is only 1430 psi. This means that steam alone and high power consumption (run 1) develops the same discharge oil temperature as steam plus cold water and high power consumption (runs 2 and 3). When steam is applied together with hot water in/cold water out in run 4, causing power consumption to drop 50% (reducing heat injection to the oil from pump and hydraulic hoses to 50%) the temperature still remains stable around 80 F. This could weakly indicate that the heat induced to the oil by the hydraulic system while on heavy load is in the same order of magnitude as the heat induced to the oil by the hot/cold water combination. Only when the cold water has been shut off in runs 5 and 6 (steam and hot inlet water) the discharge oil temperature starts rising significantly. In run 7, cold water is injected together with hot water and steam and the temperature remains as in run 6. Then the steam is shut off in the remaining runs. In run 8 with hot water only the temperature drops back to 89 F, and cold water injection only in runs 9 and 10 doubles power

JVOPS 6 Workshop Report flemingCo environmental
184
consumption but brings the temperature back down to 80 F. In run 11 it only drops slightly to 79 F with hot water injection and power on 50%. These temperature and relative power consumption data show that the hydraulic power delivered to the pump and the hot lube water injection each influence the discharge oil temperature more than the heat from the coils. With a probable efficiency of the boiler/coil system (including losses in the steam hoses etc.) of 25%, the 2,008,500 Btu/h boiler should be able to deliver a minimum heat input to the test oil of about 500,000 Btu/h. This should be compared with an approximate power input to the test pump, and thereby to the test oil, based on hydraulic flow and ∆Phydr of about 20 kW or 68,300 Btu/h. The heat input from the coils must therefore be less than 14% ((68,300/500,000) x 100%), of the total potential of the boiler/coils system. This is a rough and rather imprecise estimation, but it provides enough information to determine that this test did not offer an opportunity to verify the local bulk heating potential of the boiler/steam coil system on 250,000 cSt oil. The splashing of boiling oil was a surprise to the test management since it was the expectation that the pump would rapidly drag in and remove the coil heated oil. However, the coils had been made up for the DOP-250 pump, which in these tests would have about 2.5 times the capacity of the GT-185 pump. Furthermore the coils were wrapped around the GT pump, where they would be placed in front of the pump intake when applied with the DOP-250. The GT pump could therefore seem not be able to create a consistent flow of oil past all of the coils that would result in an efficient heat transfer and continous removal of heated oil. Performance Improvement The PIF factor cannot be calculated for the effect of the coils when compared with no coils and no lube water since no true baseline run was carried out in this test. The PIF factor can be calculated for the relation between “baseline” with coils and the best run of runs 2 to 7, where both lube water and the limited amount of steam to the coils were applied. For runs 6 and 7 with hot inlet lube water compared to run 1, the PIF factor is 63 and the relative power consumption is only 50% of run 1. Run 11 indicates that 4% hot in only (no coils) is 77 times better than coils only (run 1), and it is interesting that hot inlet lube water works better without steam applied than with (the limited steam to coils considered). Other Observations The test was valuable in that it better than the other tests visualized the importance of hot lube water when pumping high viscosity oil through a contaminated hose. Runs 8, 9,

JVOPS 6 Workshop Report flemingCo environmental
185
10, and 11 clearly show the dramatic increase in pressure and power consumption when switching from hot WL in to cold WL in/cold WL out (8 and 9). Equally dramatic pressure and power drops are seen when switching from cold WL out to hot WL in (runs 10 and 11). It was at the discharge end of the test hose observed that the effect of the steam coils caused difficulties for the creation of the core annular flow. Oil and water tended to get mixed together, especially when cold water was applied. The picture of crystal clear lube water coming out of the test hose was never observed in this test. Conclusion This test did not provide the conditions for a fair evaluation of the local bulk heating technique applied alone or in conjunction with the water lubrication techniques. However, there is no doubt as to the importance of powerful heat induction at or close to the pump when transferring very viscous oil. Under arctic conditions the oil may be so viscous that the limited heating zone at the pump intake, offered by hot water or steam injection to the inlet AWI device, may be insufficient for a proper oil in-flow and may call for additional heat to be provided by steam coils. It is therefore strongly recommended that additional testing of the local bulk heating technique is carried out as soon as possible. The test demonstrated well the importance of hot water injection to the inlet AWI device on the pump when pumping this 250,000 cSt oil through a contaminated hose.

JVOPS 6 Workshop Report flemingCo environmental
186
7.11 Test 11 CCG/USCG Pressure Drop vs. Viscosity Verification Test
108 ft / 260,000 cSt Test Date 15 December, 2003 Test Line USCG Test Pump CCG GT-185 Modified PDAS Pump (high pressure/high temperature plate wheel) Pump Motor Ross Series ME 15 High Torque Hydraulic Motor Inlet AWIF flemingCo inlet AWI device Outlet AWIF flemingCo outlet AWIF Test Hose 108 ft 6” lay flat type including riser hose arrangement Test Oil JCOS Bitumen Crude Oil Target Viscosity 200,000 cSt Measured Viscosity 260,000 [email protected] F, Dec. 03 Temp-Viscosity Curve, Fig. 50 The purpose of this test was to investigate the hose pressure drop vs. viscosity dependency when pumping viscous oil with aid from AWI techniques. The test results would be compared with the test results from Test 6, with all parameters other than oil viscosity being close to the same. The test was carried out as a result of the on-site JVOPS Workgroup decisions on modifications to the Test Plan. Please consult the Data Collection Sheet for Test 11 in section 6.5 and Graph 11 for information on retrieved data. The test should ideally have been carried out with the test oil at 200,000 cSt, but severe and cold weather the day before this test had chilled the oil in the USCG backup tank. The oil was close to 50% of the viscosity in Test 6, which would be convenient for the comparison purpose, so no effort was deemed necessary to adjust the viscosity. Three planned test runs, run 1 (4% hot in/4% hot out), run 2 (4% hot in/4% cold out), and run 3 (4% cold in/4% cold out) were carried out and three more ad hoc runs were completed. Run 4 (4% cold in/4% cold out) was a repetition of run 3 to investigate these WL settings for extended pumping. Run 5 applied 4% cold lube water at the outlet only, and run 6 applied 2% lube water at the outlet only. After run 6, at 16.32.26 the lube water was shut off and the pump was used to remove some of the oil and lube water from the test hose. 75 seconds after lube water shut down the pump pressure was at 162 psi. The pump was stopped at 16.33.46, and after a short break it was started again at 16.36.00. The break was too short to provide ideal conditions for baseline testing in run 7, but time was of essence at this time close to the end of the JVOPS testing. In run 7 at the 16.41.38 Mark Point, a product flow of 85 USgpm developed a pump pressure of 166 psi, which further increased to 184 psi. At 16.40.36 hot inlet lube water was applied at a rate equivalent to 4% at full pump capacity and in 40 seconds, at 16.42.16, the pump pressure had dropped to 6 psi.

JVOPS 6 Workshop Report flemingCo environmental
187
Gra
ph 1
1
Test
11
Hos
e Pr
essu
re D
rop
vs. V
isco
sity
Ver
ifica
tion
GT-
185
with
Re-
star
t
0102030405060708090100
110
120
130
140
150
160
170
180
190
200
210
16:15:2716:16:23
16:17:1916:18:1516:19:11
16:20:0716:21:03
16:21:5916:22:55
16:23:5116:24:4716:25:43
16:26:3916:27:35
16:28:3116:29:27
16:30:2316:31:1916:32:15
16:33:1116:34:07
16:35:0316:35:59
16:36:5516:37:5116:38:47
16:39:4316:40:39
16:41:3516:42:31
16:43:27
TIM
E
T(w
l out
) (de
g F)
T(w
l in)
(deg
F)
T(oi
l/inl
et)A
(deg
F)
T(oi
l/bul
k)A
(deg
F)
T(oi
l/bul
k)B
(deg
F)
T(oi
l/inl
et)B
(deg
F)
P(pu
mp)
(PSI
)Q
(hyd
r) (G
PM)
Q(w
l in)
(GPM
)Q
(wl o
ut) (
GPM
)Q
(oil)
(GPM
)
*****16:17:15 START RECORDING DATA
*****16:21:23 Run #1 P(pump)=4.6 Q(hy)=23 WLin=4.5H WLout=4.5H
*****16:23:45 Run #2 P(pump)=4.1 Q(hy)=23 WLin=4.3H WLout=4.6C
*****16:25:50 Run #3 P(pump)=6.5 Q(hy)=23 WLin=4.3C WLout=4.6C
*****16:27:35 Run #4 P(pump)=7.2 Q(hy)=24 InWL=4.2C WLout=4.5C
*****16:29:33 Run #5 P(pump)=5.5 Q(hy)=25 WLin=0 WLout=4.6C
*****16:31:45 Run #6 P(pump)=4.5 Q(hy)=23 WLin=0 WLout=2.5C
*****16:32:40 ALL LUBE SHUT OFF
< T
EST
PAU
SE
>
*****16:41:38 Run #7 P(pump)=166 Q(hy)=17 WLin=0 WLout=0
*****16:45:00 STOP RECORDING DATA
From
16:
27:1
5: Q
(hyd
r) a
nd Q
(oil)
(cal
cula
ted)
Are
Rec
orde
d fr
om M
anua
l Dat
adu
e to
Hyd
r. Fl
ow M
eter
Ele
ctro
nic
Sign
al L
oss

JVOPS 6 Workshop Report flemingCo environmental
188
The data logger readings of hydraulic flow failed from 16.26.54, so hydraulic flow backup data have been used in runs 4 to 7. The test lacks recording of relative power consumption (∆Phydr). The recordings were either not made or the data sheet was lost. Comparison with Test 6 The 4% hot in/4% hot out WL in Test 6+7, run 1, provided a discharge pressure of 10 psi (see Table 8 in section 7.9). Run 2 with 4% hot in/4% cold out WL provided a discharge pressure of 9 psi (The Data Collection Sheet pressure data have been corrected for static lift). This was on 480 k cSt oil. The similar test runs in Test 11 provided respectively discharge pressures of 4.6 and 4.1 psi. This was on 260 k cSt oil. The electronically logged pump pressures in the Data Collection Sheet for Test 11 should not be reduced with 2 psi to correct for static lift, since the test was carried out at the USCG test line. On the contrary, a limited support to the pump is in the early stages of pumping provided by the oil layer over the pump that is higher than the point of discharge from the test hose. This was in section 7.0 estimated to contribute with about 1 psi in the beginning of the test. So 1 psi should actually be added to the logged pressure in run 1 and slightly less be added to the logged pressure in run 2. This will add to the impression that for this oil type there seems to be proportionality between viscosity and pressure drop when hot in/hot out and hot in/cold out water lubricated with the applied settings. The product flow in Test 11 was approx. 10 USgpm lower than in Test 6, but this has not been considered. Likewise small variations in the lube water temperatures have not been considered in this rough estimation that can be seen in Table 9. Table 9 Pressure Drop vs. Viscosity with GT-185 Test Pump / 108 ft Hose Test and Run # Inlet WL
(USgpm)
Outlet WL
(USgpm)
Pump Pressure(Data Sheets)
(psi)
Pump Pressure (Compensated)
(psi)
Ratio Test 6/Test 11
Test 6 Run 1 4% hot inlet water
4% hot outlet water
12
10 (Table 8)
Test 11 Run 1 4% hot inlet water
4% hot outlet water
4.6 4.6+1= 5.6
1.78
Test 6 Run 2 4% hot inlet water
4% cold outlet water
8 9 (Table 8)
Test 11 Run 2 4% hot inlet water
4% cold outlet water
4,1 4.1+1= 5.1
1.76
Viscosity ratio Test 6/Test 11 = 480/260 = 1.85 The information in Table 9 can only be considered finger point indications on how hose pressure drop may depend on the viscosity of this test oil and with the GT-185 test pump with its AWI devices applied. For this pump and this oil there seem to be a reasonable degree of proportionality.

JVOPS 6 Workshop Report flemingCo environmental
189
Comparison with Test 1/1 Test 1/1 was carried out with same hose length (less 1 ft) as in this test. The pump was the DOP-250 with its AWI devices applied, the same test line and setup were used, and the viscosity was only 150,000 cSt. The DOP 250 pumped at a 2.4 times higher capacity, while the GT pump operated with a 73% higher viscosity. The performance can therefore not be compared directly, but the GT-185 reaches the low discharge pressures, that indicate an efficient core annular flow, almost at once, where it takes a few runs for the DOP-250 to do this. The GT pump seems able to more rapidly establish an efficient core annular flow than the DOP-250, or the core annular flow is more rapidly established at the 2.4 times lower pumping rate. This was also briefly discussed in section 7.9. Comparison with Test 1/1 and Tests 0/1 and 0/2 (USCG test line, DOP-250 pump) The motivation for the Test 11 viscosity comparison test had been the lack of proportionality between viscosity and pump pressure when comparing Tests 0/1 and 0/2 (up to 30,000 cSt) and Test 1/1 (150,000 cSt), all with same test hose length. The hose pressure drop, P(pump), in all Test 1/1 runs was between 4.5 and 6.5 psi, which is surprisingly close to the pressure drops in Tests 0/1 and 0/2 considering the difference in viscosity. However, Tests 0/1 and 0/2 only involved outlet side WL while Test 1/1 involved inlet side WL, which could be the reason for almost no pressure increase from 30,000 to 150,000 cSt oil. Another explanation could be that WL may be relatively more efficient on higher viscosity oils than on lower viscosity oils. This corresponds with the very high JVOPS PIF values on >150,000 cSt (PIF values > 200 in some tests) compared with those of the previous VOPS Workshops on <50,000 cSt oils (PIF values up to 12). Run 7 Information Run 7 does not serve as a baseline test since all old oil and lube water had not been pumped out of the hose, and the pump stop break was too short to break down the lube water ring and to let the oil in the hose settle. But the continued pumping after run 6 ensured that all possible lube water had been removed from the oil adjacent to the pump intake. Run 7 therefore provided evidence that the GT-185 can drag in 260 k cSt oil at a rate of 85 USgpm (drum fill: 69 USgpm) without aid from hot inlet lube water. On 500,000 cSt oil the pump could only drag in 2.2 USgpm, which is not enough for a re-establishment of the core annular flow once hot inlet water is applied. The pump will, due to its poor water sealing characteristics, just backflow the water, which will further complicate pumping. But at 260 k cSt a genuine inflow was established, which could be enough to re-establish the core annular flow after a real world unintended pump stop. Run 7 did not prove that the GT-185 can perform as per the data recorded in this non lubricated test. This is due to the presence of remaining lube water in the test hose and because the oil in the hose was not left for 15 minutes to settle.
JVOPS 6 Workshop Report flemingCo environmental
190
Power Consumption The lack of data on relative power consumption (∆Phydr) in this test makes it impossible to compare consumed power at the two viscosities, 260 k cSt and 480 k cSt. This is most unfortunate, since this could have provided useful information on required additional power for increased viscosities, which was one of the Top Level Requirements to the JVOPS Workshop. Conclusions For the GT-185 with its AWI devices applied, there seems to be a reasonable degree of proportionality between hose pressure drop and viscosity on this type of oil and at the pumped rate. The GT-185 can drag in and initiate pumping at 260 k cSt oil and can with its AWI devices applied re-establish core annular flow. This is not possible for this pump at an oil viscosity of 500,000 cSt.

JVOPS 6 Workshop Report flemingCo environmental
191
7.12 Evaluation of Pump Systems Tested Based on the test results analysis in the previous sections of this chapter, the brief evaluation of the pump systems that were tested is that the three PDAS pumps, DOP-250, GT-185, and GT-A 50, in general performed very well with their respective annular water injection devices applied. The TK-125 double screw pump, with its annular water injection devices applied, seemed not to be suitable for the task with this oil at 200,000 cSt. None of the pumps that were tested could pump 200,000 cSt oil or 500,000 cSt oil over any operational distance and at any operational rate without the aid from annular water injection. Even though the collected data have been recorded with the best possible accuracy, considering the available equipment and time, there are variations in the quality of data that can make direct comparison between tests, equipment, and processes difficult. Some tests had sensors that failed or lacked some manual data, but fortunately backup data could be substitute in most cases. The tests that formed basis for comparisons between processes and equipment were aimed to be with all important parameters as close to the same as possible. But, as an example, the viscosity was very difficult to control and was the biggest challenge during testing. With a product in the 200,000 cSt range that would increase 10 k cSt for a temperature decrease of 0.5 F, it was an extreme challenge to control the 440 barrels of oil in the USCG backup tank. The CCG test tank had only 60 barrels of oil in the 500,000 cSt range, but a variation of only 0.5 F would change the viscosity by more than 20,000 cSt! Despite the difficulties it must be noted that the viscosities in the most important tests were very close to the targets. The lube water temperatures differed slightly from test to test and the amounts of lube water applied to the AWI devices could not be controlled well enough to ensure that the relative injection rates were exact and on target. Probably the most important factors, when describing the difficulties comparing pumping systems, are the recording of power consumption and the fact that the cross viscosity tests had to be cancelled due to time constraints and an expected lack of clean test hoses. It had originally been planned to test the GT-185 at the USCG test line with 300 ft of hose, like it had been planned to test the DOP-250 at the CCG test line with 100 ft of hose. The manufacturers’ pumps had been planned for testing at both test lines. All these tests would have been carried out as the respective Master Tests. The way the recording of relative power consumption had been set up makes it very difficult to compare power consumption between the two test lines. At the CCG test line the differential hydraulic pressure, ∆Phydr, was recorded at the HPU, which was connected directly to the test pump. At the USCG test line the differential pressure was recorded in the same way, but a remote control stand was placed in-line between the HPU and the test pump. The RC would return to the HPU any of the available oil flow
JVOPS 6 Workshop Report flemingCo environmental
192
that was not sent to the test pump. Therefore it is only possible to compare power consumption, using the relative power consumption, ∆Phydr, within the test line where it has been recorded. The following will nevertheless aim to provide an evaluation of the three tested PDAS pumping systems. The TK-125 pump will not be further evaluated (please see section 7.7). 7.12.1 DESMI DOP-250 w. flemingCo inlet AWIF and USCG/USN VOPS AWIF The USCG VOPS DOP-250 PDAS pump, with OMTS 315 motor and with its inlet and outlet AWIFs applied, worked very well under the different test conditions that it was subject to during the JVOPS Workshop. Baseline Results The DOP-250 pump system could transfer oil in the 200,000 cSt range without aid from its AWI devices. The pumping rate through 311 ft of 6” hose was 26 USgpm, which is not considered an operational rate, but this rate was enough to re-establish the core annular flow once hot water was injected at the inlet and outlet AWIFs. Master Test and Re-start Results The Master Test with the DOP-250 system was first carried out with 311 ft of clean test hoses and was on 210 k cSt oil. The pump system was, with 4% hot inlet and 4% hot outlet lube water, able to improve performance by a PIF factor of 255 compared to the baseline test. With 4% hot inlet and 4% cold outlet lube water the performance was in the same range. After the baseline test the pump system re-established the core annular flow. In less than a minute the pressure dropped from 180 to 12 psi, while the capacity simultaneously increased from 26 to 259 US gpm. With the test hose contaminated with oil the pump system was, with the 4% hot in / 4% hot out WL combination, able to improve performance by a PIF factor of 149 when compared to baseline. The PIF factor was 105 on contaminated hoses with the 4% hot in / 4% cold out WL combination. In Test 1/1 on 140 k cSt oil and with 107.5 ft hose the DOP-250 system managed to re-start after a 25 minutes pump stop by the injection of 1% hot inlet and 1% hot outlet lube water. In about 30 seconds the pump was at full capacity with core annular flow in full effect. DOP-250 on 500,000 cSt Oil The DOP-250 was not tested on 500,000 cSt oil but at some occasions the mix and transfer pump in the USCG backup tank (DOP-250 without AWIFs) was subject to oil at this viscosity when the temperature at the bottom of the tank had dropped too much, and mixing therefore was required. The pump would not be allowed to receive more

JVOPS 6 Workshop Report flemingCo environmental
193
than 10 USgpm hydraulic flow and 2000 to 2500 psi hydraulic pressure to avoid too high hose pressures, but it managed to mix oil at this high viscosity by transfer through a 40 ft 6” hose. This means that the DOP-250 pump is able to efficiently drag in and build up a significant pressure on 500,000 cSt oil without aid from lube water. This was not the case with the GT-185 pump. The DOP-250 is an end-suction PDAS pump (or vertical PDAS) where the oil is scraped into the pump by the end of the pump screw. This geometry tends to improve flow of viscous oil into the pump and reduces the tendency for viscous oil to “bridge” across the inlet. Long Distance Test Results With the 4% hot in / 4% cold out WL combination the DOP-250 system pumped 185 k cSt oil through 1514.5 ft of test hose at a rate of 250 USgpm @ 45 psi. The relative power consumption was 2625 psi, which is a ∆P(hydr) increase from 2330 to 2625 psi, or only 13%, when compared with the Master Test with 311 ft hose. This is another expression for how efficient the core annular flow was. Most of the consumed power was used to rotate the pump in the sticky and viscous oil (the pump apparently worked equally well with 5% cold inlet water only, but as some of the tests demonstrated, it would only be a matter of time before the hose pressure drop would increase). With the relatively low discharge pressure of 45 psi (logged at the start of Run 2) over the long distance of 1514.5 ft it could seem as if the pump could pump the oil through a minimum 3 times longer hose at full capacity, before it would be at its maximum. But this is not the case. The pump was already reasonably close to its maximum power consumption with a hydraulic flow of 45.3 USgpm at a ∆P(hydr) of 2625 psi. The ∆P(hydr) was measured at the HPU and does not consider the losses in the hydraulic hose set to the pump. The hose set consisted of two 112 ft long 1” hoses (pressure and return). The pressure drop in 112 ft of 1" hydraulic hose is about 80 psi at a flow of 45.3 USgpm, or 160 psi for both pressure and return line. Hydraulic quick disconnects and RC stand may count for additionally 40 psi, which brings the total hose/fittings/RC loss up to about 200 psi. This means that the pump motor worked at a ∆P(hydr) of 2425 psi @ 45.3 USgpm, or that it absorbed about 65 HP. It should be noted that this is already slightly over-speeding the motor, which for response purposes (not continuous use) should be limited to maximum 43 USgpm (500 RPM). Hydraulic motors are designed to be used for thousands of hours. For oil spill response preparedness, the motors work rarely only, and when they finally do work, it is typically for some hours each day for some days or maximum a few weeks. A lot of the time the motor will not work at full load. Therefore the maximum permissible flow and pressure, that the motor may be subject to, can be exceeded to some extend in response situations, knowing that this may reduce motor lifetime. However, the cost of a new hydraulic motor is infinitely low compared with the environmental and cost benefits of powerful pump performance in a response situation.

JVOPS 6 Workshop Report flemingCo environmental
194
It is therefore expected that the maximum “response” limits for the OMTS 315 hydraulic motor is 43 USgpm @ 2900 psi, or that it – for a variable load pattern – at peak can be allowed to absorb maximum 73 HP. On 1514.5 ft of hose the pump already absorbed 65 HP, so 12% more power could, if absolutely necessary, be absorbed for shorter periods of time. This means that it could seem as if about 1000 feet could be added, bringing maximum pumping distance with this 185 k cSt oil up to a total of 2500 ft. The hose pressure drop should not be expected to exceed 75 psi and the pump capacity would be 236 USgpm oil @ 43 USgpm hydraulic flow. However, this is with all clean hoses. If the majority of the hoses are not quite clean, the maximum pumping distance may be reduced. The pump pressure (hose pressure drop) will according to the results in Test 2 probably be about two times higher with already used hoses where the oil just has been pumped out. The higher pressure will affect power consumption, but no data is available to quantify this. In this context it must be mentioned that the DOP-250 pumping system could not re-start on this 185 k cSt test oil when hooked up to 1500 ft of hose, full of oil and lube water. This was verified after the completion of Test 3. However, please see section 7.13.3 for a further discussion on this subject. The pump could re-start and re-establish core annular flow with 311 ft of hose, but this may be the maximum. If an unintended pump stop occurs while pumping through 1500 ft, it will probably be necessary to disconnect 1200 ft and pig clean the hoses (or replace with cleaned hoses) before pumping can restart, and core annular flow be re-established. Another aspect, which must be considered, is the stability of the core annular flow. In the USCG/DOP-250 long distance test it was observed that the lube water at the outlet was oily, while it in Test 2, after 300 ft, was crystal clear. This means that a gradual contamination and possible damage to the lubricating effect is in progress. It is, however, unknown at which length of hose the contamination will be detrimental to performance. Conclusion on Long Distance Testing Based on the retrieved data, and accepting short term over-loading the hydraulic motor, the following maximum pumping distances with this 185 k cSt test oil should be expected for the DOP-250/AWI system:
• Clean test hoses: 2500 ft • Used hoses, partially cleaned: 1500 ft
The DOP-250 pumping system may not be able to re-start on this 185 k cSt test oil when hooked up to 1500 ft of hose full of oil and lube water. Probably all hoses in excess of the first 300 ft must be removed and pigged (or be replaced with clean hoses) before pumping can restart.

JVOPS 6 Workshop Report flemingCo environmental
195
Performance when Subject to Heat, Friction, and Pressure The DOP-250 pump was in the JVOPS Workshop successfully tested with the high friction, high temperatures, and high pressures that eventually will be characteristic of modern extreme viscosity pumping. The pump has as standard, all sealing parts made in polyethylene PE-HD, which is heat resistant up to only 165 deg. F / 75 deg. C. The manufacturer offered to the Workshop a recently developed set of heat resistant sealing parts, but the offer was declined by the USCG Project Officer, since the target for the USCG was to tests a standard VOPS pump. Instead the hot water was very carefully applied, especially when the pump was stopped and at low oil flow rates. In this way the average temperature inside the pump would not exceed the allowed maximum for the standard sealing parts. The pump is not rated for the JVOPS maximum system pressure of 174 psi. The manufacturer specifies a maximum pressure of 145 psi. Nevertheless the JVOPS Workgroup had decided to allow the pump to deliver at pressures up to the Test Plan maximum of 174 psi. The pump worked well at this pressure and even peaks up to 240 psi were recorded and caused no harm to the pump. Overall Evaluation The USCG VOPS DOP-250 PDAS pump, with OMTS 315 motor and with its inlet and outlet AWIFs applied is an excellent high capacity pumping system with a wide viscosity range and a high potential for long distance pumping. The pump can withstand the high pressure, the friction, and the heat that must be faced in connection with modern extreme viscosity pumping. However, heat must be applied with caution if the pump is fitted with standard sealing parts. High temperature sealing parts are available. The DOP-250/AWI pump system is relatively big and heavy for some response scenarios and also includes several lube water hoses and extruding fittings that can conflict with structures in for instance a tank that must be unloaded. The discharge AWIF is rather big and is not placed on the pump, close to the pump screw. The AWIF could be reduced in size and be placed closer to the pump. This would reduce overall dimensions and probably provide even better water lubrication. With a slightly more streamlined design of the overall concept this PDAS pump / AWI system can offer excellent performance and handling, where high capacity on extremely viscous oil is a must. 7.12.2 GT-185 w. flemingCo inlet and outlet AWI devices The CCG GT-185 PDAS pump, with Ross ME 15 motor, high pressure/high temperature plate wheel, and its inlet and outlet AWI devices applied, worked very well

JVOPS 6 Workshop Report flemingCo environmental
196
under most of the different test conditions that it was subject to during the JVOPS Workshop. Baseline Results The GT-185 pump system could basically not transfer oil in the 500,000 cSt range without aid from its AWI devices. The pumping rate through 100 ft of 6” hose was very low at about 2.2 USgpm without lube water. This is not considered an operational rate, and will most probably not be enough to re-establish core annular flow with water lubrication after an unintended pump stop. The GT-185 is a side-suction (or horizontal) pump. This means that the oil must enter the rotating screw windings of the feeding screw from the side to get inside the pump and further on to the pumping section. The rotating screw windings are an obstruction for the entering oil, especially at very high viscosities. The phenomenon is called “bridging”, and is probably the reason for the lack of ability to drag in the 500,000 cSt oil. Master Test and Re-start Results The Master Test with the GT-185 system was carried out with 111.5 ft of clean test hose and was on 480 k cSt oil. The pump system was, with 4% hot inlet and 4% hot outlet lube water, able to improve performance by a PIF factor over 500 when compared with the baseline test. With 4% hot inlet and 4% cold outlet lube water the performance was in the same range. The CCG Master Test did not include a baseline test, since this had already been carried out during the prep week. Therefore Test 6 did not include a re-start test. But re-starting was successfully carried out in connection with Test 11. It was observed that the pump system, with 4% hot inlet water only, can re-start and re-establish efficient core annular flow through 108 ft hose and oil at a viscosity of 260 k cSt. GT-185 on 200,000 cSt Oil The GT-185/AWI system was not tested on 200,000 cSt oil, but in Test 11 it was tested under CCG Master Test conditions on 260 k cSt oil. Test 11 revealed an excellent and rapid lubrication capability on this “lower” viscosity oil. The GT pump seems able to more rapidly establish an efficient core annular flow than the DOP-250, or the core annular flow is more rapidly established at the 2.4 times lower pumping rate. Long Distance Test Results With the 3.5% hot in / 4% cold out WL combination the GT-185 system pumped 480 k cSt oil through 515 ft of test hose at a rate of 118 USgpm and pressure of 13.6 psi. The relative power consumption was 1880 psi, which is the same ∆P(hydr) that was recorded in the same test with 111.5 ft hose. This is a remarkable expression for an extremely efficient core annular flow. Almost all of the consumed power was used to rotate the pump in the sticky and viscous oil. There

JVOPS 6 Workshop Report flemingCo environmental
197
must have been a small power increase, but due to an increasing hydraulic oil temperature during testing, the increase was apparently balanced by the reduced pressure drop in the hydraulic lines. With the extremely low discharge pressure of only about 14 psi over the long distance of 515 ft, it could seem as if the pump could pump the oil through a minimum 10 times longer hose at full capacity before reaching its maximum. But this is not the case. The pump was already reasonably close to its maximum power consumption with a hydraulic flow of 23.6 USgpm at a ∆P(hydr) of 1880 psi. The ∆P(hydr) was measured at the HPU and does not consider the losses in the hydraulic hose set to the pump. The hose set consisted of two 62 ft long 1” hoses (pressure and return). The pressure drop in 62 ft of 1" hydraulic hose is about 26 psi at a flow of 23.6 USgpm, or 52 psi for both pressure and return line. Hydraulic quick disconnects may count for additionally 10 psi, which brings the total hose/fittings loss up to about 62 psi. This means that the pump motor worked at a ∆P(hydr) of about 1820 psi @ 23.6 USgpm, or that it absorbed about 25 HP. A hydraulic flow of 23.6 USgpm is already slightly over-speeding the motor, which for response purposes (not continued used) should be limited to maximum 22.6 USgpm (360 RPM). Hydraulic motors are designed to be used for thousands of hours. For oil spill response preparedness, the motors work rarely only, and when they finally do work, it is typically for some hours each day for some days or maximum a few weeks. A lot of the time the motor will not work at full load. Therefore the maximum permissible flow and pressure, that the motor may be subject to, can be exceeded to some extend in response situations, knowing that this may reduce motor lifetime. However, the cost of a new hydraulic motor is infinitely low compared with the environmental and cost benefits of powerful pump performance in a response situation. It is therefore expected that the maximum “response” limits for the Ross ME 15 hydraulic motor is 22.6 USgpm @ 3050 psi, or for a variable load pattern, it can at peak be allowed to absorb maximum 40 HP. On 515 ft of hose the pump motor absorbed 25 HP, so minimum 50 % more power could, if absolutely necessary, be absorbed for short periods of time. However, since no apparent pressure increase was observed between pumping through 111.5 ft and pumping through 515 ft, the power calculation cannot be used for the maximum pumping distance estimation. What it does indicate, is, that the motor in itself most probably will not be the limiting factor. Considering the surprisingly good and rapid creation of the core annular flow, there seems to be no reason why the GT-185 pump/AWI system should not be able to pump transfer this test oil in the 500,000 cSt range as far as 5 times the tested distance, or up to 2500 ft.
JVOPS 6 Workshop Report flemingCo environmental
198
The hose pressure drop should not be expected to exceed more than 70 psi and the pump capacity would be 106 USgpm oil @ 22.6 USgpm hydraulic flow. With contaminated hoses the distance would probably be half of that, but there is no data to support this for 500,000 cSt oil. The pump pressure (hose pressure drop) will probably be about two times higher with already used hoses where the oil just has been pumped out. The higher pressure will affect power consumption, but no data is available to quantify this. In this context it must be mentioned that the GT-185 pumping system most probably cannot re-start on this 500,000 cSt test oil when hooked up to a 515 ft hose, that is full of oil and lube water. It has not been verified, but the weak baseline performance indicates that there may not be enough base flow without hot lube water to drag in the oil to provide seal against back flowing lube water, once it is applied. The pump could re-start and re-establish core annular flow with 108 ft of hose on 260 k cSt oil but this may not be case for 500,000 cSt. If an unintended pump stop occurs while pumping 500,000 cSt oil through 500 ft of hose, it will probably be necessary to disconnect all 500 ft and pig clean the hoses (or replace with cleaned hoses) before pumping can restart, fully water lubricated. Another aspect, which must be considered, is the stability of the core annular flow. In the CCG 480 k cSt long distance test it was observed that the lube water at the outlet was crystal clear, both after 100 and 500 ft pumping distance. This means that contamination and possible damage to the lubricating effect is not in progress. It is, however, unknown at which length of hose the contamination of the lube water will start, but it could very well be that the higher viscosity (and colder) oil better than lower viscosity oil withstands mixing with lube water. Conclusion on Long Distance Testing Based on the retrieved data and accepting short term over-loading the hydraulic motor, the following maximum pumping distance with this test oil should be expected:
• Clean test hoses: Up to 2500 ft • Used hoses, partially cleaned: 1200 ft
The GT-185 pumping system cannot re-start on this 480 k cSt test oil when hooked up to 500 ft or more of hose full of oil and lube water. All hoses must probably be removed and pigged (or be replaced with clean) before pumping can restart. Performance when Subject to Heat, Friction, and Pressure During the successful 2 million cSt bitumen testing with the CCG GT-185/AWI pump system in Ottawa in December 2001 (Ref 11), the standard rubber/fiber glass sandwich type plate wheel degraded. At that time the pump was only tested up to a pressure of 102 psi. A new stainless steel and fiber glass reinforced Teflon sandwich construction plate wheel was therefore designed (flemingCo) and tested. Fitted with this plate wheel the GT-185 was in the JVOPS Workshop tested with the high friction, high

JVOPS 6 Workshop Report flemingCo environmental
199
temperatures, and high pressures that eventually will be parts of modern extreme viscosity pumping. Even though the maximum pump pressure for the Workshop was limited to 174 psi, pressure peaks up to 186 psi (Test 11) and 190 psi (Test 9+10) were recorded. No harm to the pump was observed. Overall Evaluation The CCG GT-185 PDAS pump, with Ross ME 15 motor, upgraded high pressure/high temperature plate wheel, and its inlet and outlet AWI devices applied, is an excellent pumping system with a wide viscosity range and a high potential for long distance pumping. The pump has its discharge side AWIF placed right at the pump screw, before the discharge coupling. This may be part of the reason why the GT-185 /AWI pump system so rapidly can establish core annular flow and maintain it at a very low pressure. With the new high pressure/high temperature plate wheel design the pump can withstand the high pressure, the friction, and the heat that must be faced in connection with modern extreme viscosity pumping. The pump system is relatively big and heavy for some response scenarios, especially when compared with its capacity. The AWI system include several lube water hoses and extruding fittings that can conflict with structures in for instance a tank that must be unloaded. With a slightly more streamlined design of the feed line system for the AWI devices, the old (but upgraded) pump will offer its owners excellent performance within a very wide oil viscosity range.

JVOPS 6 Workshop Report flemingCo environmental
200
7.12.3 LAMOR GT-A 50 w. Integrated flemingCo inlet and outlet AWIFs The LAMOR GT-A 50 PDAS pump, with OMTS 200 motor, and its integrated inlet and outlet AWIFs applied, worked very well under the test conditions that it was subject to during the JVOPS Workshop. Baseline Results The GT-A 50 pump system could transfer 210 k cSt oil without aid from its AWIFs. The pumping rate through 308.5 ft of 6” hose was about 26 USgpm without lube water. This is not considered an operational rate, but will most probably be enough to re-establish core annular flow with water lubrication after an unintended pump stop. The GT-A 50 is an end-suction PDAS pump (or vertical PDAS) where the oil is scraped into the pump by the end of the pump screw. This geometry tends to improve flow of viscous oil into the pump and reduces the tendency for viscous oil to “bridge” across the inlet. Master Test The GT-A 50/AWI system was tested at USCG Master Test conditions with 308.5 ft of test hose on 210 k cSt oil. Unfortunately the pump had to be stopped during run-in for the first run when the hose had been filled 88% with oil and lube water. The three runs that were carried out were therefore with a contaminated test hose. However, there is enough information from the initial run-in period to estimate how performance would have been with clean hoses. This clean hose estimation concludes that the pump system would be able to improve performance with a PIF factor 255 with 4% hot inlet and 4% hot outlet lube water, when compared with the baseline test. With 4% hot inlet and 4% cold outlet lube water the performance would be in the same range. On a contaminated test hose the GT-A 50/AWI system was able to improve performance with a PIF value of 149 with 4% hot inlet and 4% hot outlet lube water, when compared with baseline. With 4% hot inlet and 4% cold outlet lube water the PIF was 156. A re-start test run had not been planned for this pump system. It was considered that the pump, being of same design principle as the DOP-250, would perform similar to this pump. The baseline performance was the same as for the DOP-250 pump. It is therefore expected that GT-A 50/AWI system will re-start and re-establish core annular flow in the same way. GT-A 50 on 500,000 cSt Oil The GT-A 50/AWI system was not tested on 500,000 cSt oil. Due to the similar design concept it is expected to perform in proportion to its physical size, to about 80% of the DOP-250 capacity.

JVOPS 6 Workshop Report flemingCo environmental
201
Long Distance Pumping Potential The GT-A 50/AWI system was not tested on long distance. As per the Test Plan the test results with Master Test parameters will, in conjunction with the results for the DOP-250/AWI system in Master and long distance testing, be used to calculate long distance performance. With both the hot in/hot out and the hot in/cold out lube water combinations, the GT-A 50 transferred the 210 k cSt oil through 308.5 ft of contaminated hose at a rate of about 210 USgpm at a pressure of about 9 psi. The relative power consumption, ∆Phydr, was 2280 psi. The similar runs with the DOP-250 on a contaminated test hose was at an oil capacity of 259 USgpm at pressures of 12 psi (hot in/hot out) and 17 psi (hot in/cold out). The GT-A 50 transfers about 80% of the DOP-250 capacity but at a pressure that is slightly less than 80% of the DOP-250 pressure, averaged for the two test run WL settings. Relative power consumption was 2120 psi for the DOP-250 and 2280 psi for the GT-A 50. These readings were for the GT-A 50 taken at an early stage in the test, where they were taken after excessive testing, and with lower hydraulic hose loss, for the DOP-250. It should therefore be expected that the GT-A 50 power consumption would not be higher than for the DOP-250, rather slightly less, provided the same hydraulic oil temperature. The GT-A 50 power consumption is in the same range as for the DOP-250. The GT-A 50 hydraulic motor, OMTS 200, can absorb exactly the same amount of power as the OMTS 315 on the DOP-250 pump. Therefore the long distance pumping potential for the GT-A 50/AWI system must be in the same range as for the DOP-250/AWI system. This has been estimated to be 1500 ft (used, partially cleaned hoses). With clean test hoses the same considerations apply. The “clean hose” results for the GT-A 50 have been estimated with a safe margin as to expected pressure drop. The ratios between pump pressure and pump capacity for the two pumps are in the same range as in the tests on contaminated hoses. This actually supports the validity of the clean hose estimations for the GT-A 50. It indicates that the GT-A 50/AWI pumping system should be capable of pumping this test oil at 200,000 cSt for a distance of about 2500 ft. Conclusion on Long Distance Potential Based on the retrieved data, cross calculations with DOP-250 testing, clean hose estimations, and accepting short term over-loading the hydraulic motor, the following maximum pumping distance with this 185 k cSt test oil should be expected for the GT-A 50/AWI system:
• Clean test hoses: 2500 ft • Used hoses, partially cleaned: 1500 ft
JVOPS 6 Workshop Report flemingCo environmental
202
The DOP-250 pumping system could in this test not re-start on this 185 k cSt test oil when hooked up to 1500 ft of hose full of oil and lube water. The same would apply for the GT-A 50 system under the same re-start conditions (see section 7.13.3). Probably all hoses in excess of the first 300 ft must be removed and pigged (or be replaced with clean hoses) before pumping can restart. Performance when Subject to Heat, Friction, and Pressure The GT-A 50 pump was in the JVOPS Workshop successfully tested with the high friction, high temperatures, and high pressures that eventually will be characteristic of modern extreme viscosity pumping. The test pump had all sealing parts made up in heat resistant materials, which are standard from the manufacturer. The pump is the only PDAS pump that as standard is rated for the JVOPS maximum system pressure of 174 psi. The highest pressure that was recorded with the GT-A 50 was 193 psi. Overall Evaluation The LAMOR GT-A 50 PDAS pump, with OMTS 200 motor, and with its integrated inlet and outlet AWIFs applied, is an excellent pumping system that is easy to handle. It has a wide viscosity range and a high potential for long distance pumping. The pump can with high pressure/high temperature sealing parts withstand the high pressure, the friction, and the heat that must be faced in connection with modern extreme viscosity pumping. This model LAMOR pump has small dimensions compared to the delivered capacity. The pump is about half the size of a DOP-250, with regards to its geometry and its nominal standard capacity. However, with a hydraulic motor that can absorb the same amount of power as the DOP-250 motor, it was able to deliver about 80% of the DOP-250 capacity during this test. It should be expected that the GT-A 50 relatively will require slightly more power than the DOP-250. This is due to the smaller cavities inside this smaller pump, which eventually will cause higher friction on very viscous oil. This will in turn require that the inlet AWIF lubricates the inner parts of the pump very well. The larger GT-A 115 pump would be expected to have reduced inner friction and will provide the higher capacity option on viscous oil. The GT-A pump series is the latest development within the types of PDAS pumps. The manufacturer has therefore had the opportunity to incorporate the most lately developed water lubrication techniques in the design. The inlet AWIF has been built into the pump body. The discharge AWIF is integrated in the discharge coupling, close to the pump screw. This approach have led to a more compact and streamlined design of the combined pump/AWI system, with minimal hoses and no extruding fittings that can conflict with structures in a tank that must be unloaded.

JVOPS 6 Workshop Report flemingCo environmental
203
7.13 Evaluation of the Tested Flow Enhancing Techniques The following section is a brief summary conclusion on the efficiencies of the various flow enhancing techniques that were applied during the JVOPS Workshop testing. The section will not dig further into Local Bulk Heating (see section 7.10). The test results will be used to discuss possible performance on other oil types and will conclude in a recommended approach for a real world scenario. 7.13.1 Clean Test Hoses Clean test hoses were a must in the planning of the JVOPS Workshop since they would offer exactly the same basic hose friction, thus making test results comparable. In a real world response scenario the discharge hoses will rarely be clean, but to carry out all tests with contaminated hoses would cause a high degree of uncertainty as to whether the contamination of the test hoses would be the same from test to test. The data retrieved in the tests with clean hoses would primarily have importance when comparing the different water lubrication combinations and settings that were applied with the tested pump/AWI systems. However, the unexpected low hose pressure drops during these tests, when core annular flow had been established, and the apparent lack of sensitivity to new settings once core annular flow had been established, provided only marginal indications of the performance differences between the various applied WL combinations, temperatures, and percentage settings. The following could nevertheless be extracted from the tests with the JVOPS Test Oil with clean hoses:
• No significant performance difference between cold and tempered outlet lube water on 20 to 30 k cSt test oil (Test 0). It is unknown whether this also applies to the test oil in the 200 to 500,000 cSt range, but previous testing on 3 million cSt bitumen have indicated that cold lube water may have an adverse effect on the core annular flow (Ref 12).
• Hot inlet lube water in conjunction with hot or cold outlet lube water works best
(Test 1) and 4% on the inlet and 4% on the outlet seemed to be the “safe” WL settings although lower percentages also had merit.
• The clean hose tests could indicate that the hot in/cold out combination worked
better than the hot in/hot out combination, but in most cases the hot/cold combination followed a hot/hot combination and probably could benefit from an extended effect of this combination. Considering the unmatched performance of hot in/hot out for re-start and re-establishment of core annular flow after a pump stop, the hot in/hot out combination is therefore recommended over the hot in/cold out combination. But it should be possible to switch from hot to cold outlet lube water once the core annular flow has been established in order to reduce
JVOPS 6 Workshop Report flemingCo environmental
204
the consumption of hot water. See more in the “Contaminated Test Hoses” section below.
• No additional lube water is required for extended pumping distances, however, within the distances applied during the JVOPS Workshop.
7.13.2 Contaminated Test Hoses What the tests with clean hoses lacked in hose length and test run time to provide significant performance differences between different WL combinations and settings, the tests with contaminated hoses provided in the form of increased hose friction. Therefore these tests and test runs provide more data that can be transferred to real life response situations. The following can be concluded from data retrieved from tests with contaminated test hoses:
• The hot in/hot out combination worked best. This was the case in all tests where runs were carried out with contaminated hoses. Also here the 4% in/4% out settings seemed to be safe settings that could re-establish the core annular flow after a pump stop and maintain it for extended pumping. Lower WL percentages may have merit but should be applied only after core annular flow has been established with the higher settings.
• The hot in/cold out combination developed about 50% higher pressure drops but
this option must nevertheless be considered most relevant. It will always be the actual logistics and the oil type in question that determine whether a reduced consumption of hot lube water is preferred at the cost of an increased hose pressure drop.
7.13.3 Re-start and Re-establishing Core Annular Flow From a real world response perspective, the ability to re-start the pumping process after a pump stop may be the single most important parameter for a successful operation. All of the JVOPS PDAS test pumps had been fitted with higher torque motors than standard in order to ensure that they would have sufficient low speed power for successful base line oil pumping tests and re-start. The Inlet side and outlet side AWI Flanges allowed the pump operators to adjust the lubrication technique to suit the conditions. The DOP-250 could re-start and re-establish core annular flow on 140 k cSt oil with 107.5 ft hose by applying a little as 1% hot lube water at both the inlet and outlet AWIF (Test 1/2). On 210 k cSt oil with 311 ft hose the same pump could re-start and re-establish core annular flow with the 4% hot in/4% hot out WL combination (Test 2). The LAMOR GT-A 50 is expected to have the same capability due to equally good baseline test performance and due to its similar design concept. The GT-185 was able to re-start and re-establish core annular flow on 260 k cSt oil with 108 ft hose by applying 4% hot lube water at the inlet only (Test 11).

JVOPS 6 Workshop Report flemingCo environmental
205
In Test 2 with the DOP-250, 210 k cSt oil, and 311 ft hose, attempts to re-start the pumping operation with cold in/cold out and then hot out only, failed. Only the hot in/hot out combination worked. These findings indicate that inlet side injection with hot water is essential for continued successful performance during a response transfer operation with a PDAS pump on very viscous oil. It was not verified where the upper hose length limit is (beyond the successfully tested 311 ft/210 k cSt re-start) to re-start and re-establish core annular flow. The USCG Long Distance Test (Test 3) incorporated an attempt to re-start with 185 k cSt oil in a 1514.5 ft hose. The test pump was rotated at low RPM while simultaneously injecting hot lube water at both the inlet and outlet AWIFs. This approach had been inspired by the previous extreme viscosity tests in Denmark (Ref 12) where a similar technique worked well on 3 million cSt bitumen and a hose length of 60 ft. However, with 1514.5 ft. hose and this test oil at 185,000 cSt, the technique was not successful. The most probable reason was that the inlet side lube water, when entering the pump, could not provide sufficient seal of the internal leaks in the pump. The hot lube water probably slipped backward past the turning screw. Either much less or no inlet lube water should have been applied in the initial stage of the re-start attempt. This would probably have enabled the pump to seal very well on the viscous oil that would be slowly dragged into the pump (while rotating at very low RPM). Hot water on the discharge side only at a high pressure and in conjunction with the gradually developing pump pressure might have been able to initiate the re-start process and gradually push out the majority of oil. Once the flow was initiated, hot inlet side lube water could be applied in a gradually increasing percentage until the core annular flow process was re-established. This technique was used two days later with high pressure water and then compressed air and pigs (see 6.4.6) to clear the long test hose. If the pumping process had started, the pump would easily have built up a pressure of 174 psi, which is almost 50% more than the 120 psi compressed air that eventually managed to push the oil out of the 1514.5 ft long test hose in about 90 minutes. It should also be considered that the viscosity of the oil in the test hose was in the 200,000 cSt range during the re-start attempt, and that it was estimated to be minimum in the 500,000 cSt range at the time of pigging with compressed air. This could indicate that re-start and reestablishing core annular flow could have happened in less time than the 90 minutes used for pigging, provided that the pump could drag in the necessary oil to build up pressure. Only additional re-start testing with hose lengths over 311 ft will make it possible to verify where the upper hose length limit is and whether removing some of the down stream hose lengths is more feasible from an operational re-start perspective.

JVOPS 6 Workshop Report flemingCo environmental
206
7.13.4 How to Relate the JVOPS Test Results to Other Oil Types and
Water-in-Oil Emulsions It may in some cases be possible to apply the Annular Water Injection (AWI) techniques and settings that tested successful in the JVOPS Workshop and expect similar results as to low hose pressure drop and long pumping distance. In other cases it may not be possible to the same extend due to an oil or an emulsion with significantly different properties than these of the JVOPS Test Oil. It should be expected that some oils will require the application of more lube water and heat, and likewise other oil types may require less. Only the actual oil will determine what is possible. There are, after several AWI tests on oils of various properties and viscosities, information available on how core annular flow can be established and maintained with the different AWI techniques. However, these tests are all oil specific and there are not enough data available to create a definitive pattern of how other oils will behave when subject to AWI. Nomograms that could tell responders which WL settings and temperatures to apply dependent on oil type, oil temperature (viscosity), hose size, and hose length cannot be made up based on the data that presently are available. It is important at this place to refer to the post test analysis of the JVOPS Test Oil. The analysis report, which can be found in Appendix G, was received at a time when the present report was almost ready for printing. Therefore specifics from the analysis that could have some influence on the analysis of the retrieved data in some tests have not been considered. However, the general findings in the post test analysis report indicate that any deviation from the expected viscosity (December 2003 Viscosity vs. Temperature Curve, Figure 50) and water content (was expected to be close to zero) make the test conditions slightly worse. Thus, the test results, with data from the test oil analysis incorporated, would have been slightly more impressive. The post test analysis of oil samples taken prior to the initiation of each test confirms the findings of the original pre-test analysis of the test oil behavior:
1. The JVOPS Test Oil has normal pseudo plastic characteristics (its viscosity decreases proportionally to an increase in shear rate)
2. The JVOPS Test Oil does not display any thixotropic characteristics (it does not
decrease viscosity at constant shear rate)
3. The JVOPS Test Oil shows only marginal rheopectic characteristics (it increases viscosity marginally over time when subjected to constant shear rate and constant temperature)
As would be expected for most oils, the oil thinned as shear rate increased and then stabilized at the new shear rate. Or in other words: As one increases the speed of the pump the oil will reduce in viscosity to a slightly lower level but will then maintain that viscosity so long as the pump RPM is constant.
JVOPS 6 Workshop Report flemingCo environmental
207
The post test analysis concludes that the JVOPS Test Oil behaves like a conventional residual oil in that it was pseudo plastic (viscosity was inversely proportional to shear rate) but that the viscosity would increase slightly under constant RPM conditions. Therefore the test findings probably can be used on a large number of conventional oils, and some guidelines can be provided that in most cases will enable responders to optimize AWI assisted pumping with PDAS pumps. These will be presented in the following section. 7.13.5 How to Use the Test Results in a Real World High Viscosity Scenario Below has been listed some simple practical guidelines that have been developed from observations during primarily the JVOPS Testing, from the JVOPS Test results, and from previous testing of AWI assisted pumping with extreme viscosity bitumen. The most efficient lube water temperatures and percentages in the JVOPS Testing overall (4% hot in/4% hot out) may be used as guidelines, but it is the actual oil that determines the most optimal settings, temperatures, and even the WL application procedure. Hose Priming To facilitate establishing and maintaining the core annular flow, all test hoses were via the outlet AWIF primed with 20 to 30 gal of water prior to any oil transfer. The water would be pushed in front of the oil through the hose to ensure wetting of the inner hose wall. This pre-pumping lubrication procedure is important for responders to observe and is a process that has also proved very successful in previous workshops (Ref 6). Please note that the procedure also should be applied whenever an additional hose section is added. Pump Deployment Discharge lube water, preferably hot, should be injected to the discharge hose via the outlet AWIF simultaneously with submerging the pump in the oil. The amount of water should be sufficient to fill the part of the discharge hose that is submerged. This water will counter balance the pressure from the oil, thus preventing oil from entering the pump prior to start and will keep the (lay flat) hose “open” inside. The same water will handle hose priming (above). However, see special note on poor sealing PDAS pumps below. Make sure that the discharge hose is free of twist and kinks. Pump Start and Operation Immediately prior to starting a PDAS pump with inlet and outlet AWIFs, a small amount of hot lube water (5 to 10 gal) should be injected at the pump intake via the inlet AWIF (use for 20 seconds the gpm equivalent to 4% lube water at max. pump capacity). This

JVOPS 6 Workshop Report flemingCo environmental
208
water will provide heat to the pump intake and to some of the oil closest to the pump intake, thus facilitating inflow to the pump when started. It is imminent that the lube water supply hoses are hot and that all cold water has been released prior to this action. The lube water hoses between pump and WLCS should be shortest possible. Start the pump immediately after the 20 seconds have expired and open lube water supply to the discharge AWIF, for instance at gpm equivalent to 4% of max. pump capacity. Gradually increase pump speed to maximum while closely monitoring a pump pressure gauge connected to the pump outlet or to a point just above the oil (for instance to a 90 degr. elbow). Observe that the pump and hose maximum pressures are not exceeded. Core Annular Flow Established If the pump pressure after some possible fluctuations remains low when oil starts discharging from the delivery end of the hose, indications are that core annular flow has been established. Dependent on the properties of the oil, it may now be possible to carefully decrease the amount of injected lube water. Try first the outlet lube water. It may be that this is not required at all. Then try to reduce the inlet lube water, but only little by little. All the time the pump pressure gauge must be observed since it will provide indication on the effect of the adjustments. Still high Pressure If the pump pressure is high from the beginning with no down trend, increase the hot inlet lube water to 5 or 6% and await pump pressure development. If it remains high, try increasing the hot outlet lube water to 5 or 6%. This should in most cases be sufficient to bring down the pressure by creating the core annular flow. Once pressure is at a stable low, follow the instructions in the paragraph just above. If the pressure still remains high at increased WL flow, reduce pump RPM and try establishing the core annular flow at a lower pump rate. No Oil Enters the Pump If the pump does not drag in the oil (pump pressure very low or zero and no discharge from hose end other than possibly water) it may be for one or both of the two reasons:
1. The pump has poor sealing characteristics and keeps on back flushing inlet lube water, thus preventing the oil from entering the pump.
2. The oil is extremely viscous and close to solid.
Try first reducing all lube water or even shut it down. Then reduce pump RPM significantly (below half speed) and follow the pressure on the gauge. If no pressure, reduce pump RPM further and observe for some time. If this does not help, stop the pump in an attempt to get the lube water away from the intake zone. If necessary (and possible) the pump must be lifted 3 to 4 ft or be moved sideways to get it away from the

JVOPS 6 Workshop Report flemingCo environmental
209
water. Then try to re-start the pump slowly without any lube water. As soon as pressure starts rising, start all lube water at a low rate (1 to 2%) and follow the pressure gauge. Gradually increase pump RPM and also lube water in step with falling pressure, but observe that the pump pressure is not dropping back to zero (pump starts slipping). If none of the above procedures can make the pump drag in the oil, the oil viscosity may be too high and some additional heat must be added at the pump intake by means of a steam lance or similar. Alternatively the pump could be equipped with steam coils in front of its intake and be connected to a steam generator or a standard high pressure steam cleaner (Local bulk heating). Poor Sealing PDAS Pumps The back flushing inlet lube water can for the GT-185 and GT-260 (horizontal pumps) and for the vertical PDAS pumps (DESMI and LAMOR) with worn sealing parts, be avoided by first trying a start without or with very little hot lube water applied at the inlet. It may for such pumps even be of advantage to avoid priming the discharge line with more than 5 to 10 gal. But as soon as the pump starts “grabbing” the oil (pump pressure rises) the lube water to the inlet and outlet AWIFs must immediately be started and gradually increased. Fine Tuning Once the core annular flow has been established, follow the directions above, “Core Annular Flow Established”. It is a matter of caution and experience to find the best WL settings, but it should always be attempted to maintain the core annular flow at the least consumption of lube water and heat. In many cases it will be enough to inject hot water just to get the lubricated pumping process started. Then switch first to cold water on the outlet, and if the pump pressure is still low at high pump capacity after some time (use Hose-fill Time vs. Capacity curve), then try to reduce the hot inlet lube water, or try switching to cold water. Re-starting the Pumping Process The re-start procedure (after a planned or an unintended pump stop) follows in principle the normal pump start procedure above, but it must be noted that using less lube water may be an advantage in the initial pump start phase, especially for poor sealing pumps. However, it is a question of establishing a balance between the desired amount of hot inlet water to facilitate oil inflow and an amount of water so small that the pump will not be pumping water only at start-up. For tight pumps that can pump water at high pressure, the inlet lube water should not be a problem.

JVOPS 6 Workshop Report flemingCo environmental
210
Hot water to both AWIFs should always be used for re-start on very viscous oil. Once core annular flow has been re-established, the adjustment and fine tuning procedures are the same as for “clean start” pumping.