k-12 demographics and cost drivers - wa
TRANSCRIPT

K-12 Demographics and
Cost Drivers
Washington State Joint Task Force on Education Funding
August 28, 2012

K-12 Enrollment and Forecast Student FTEs
860,000
880,000
900,000
920,000
940,000
960,000
980,000
1,000,000
1,020,000
1,040,000
1,060,000
1,080,000
Historical period
Avg. annual growth = 0.4%
One Student Full-Time Equivalent (FTE) student is one enrolled four hours per day for Grades 1–3 and five
hours per day for Grades 4–12. Average annual growth over entire period = 0.5%
Forecast period
Avg. annual growth = 0.7%

Student enrollment ranges from 10 to
over 44,000 per district State of Washington K-12 School Districts
School Year 2010-11 FTE Enrollment
FTE Enrollment
10 - 99
100 - 999
1,000 - 4,999
5,000 - 9,999
FTE Enrollment displayed here excludes State Institutions, Pre-K Special Ed, and Skills Center Summer School. 10,000 +
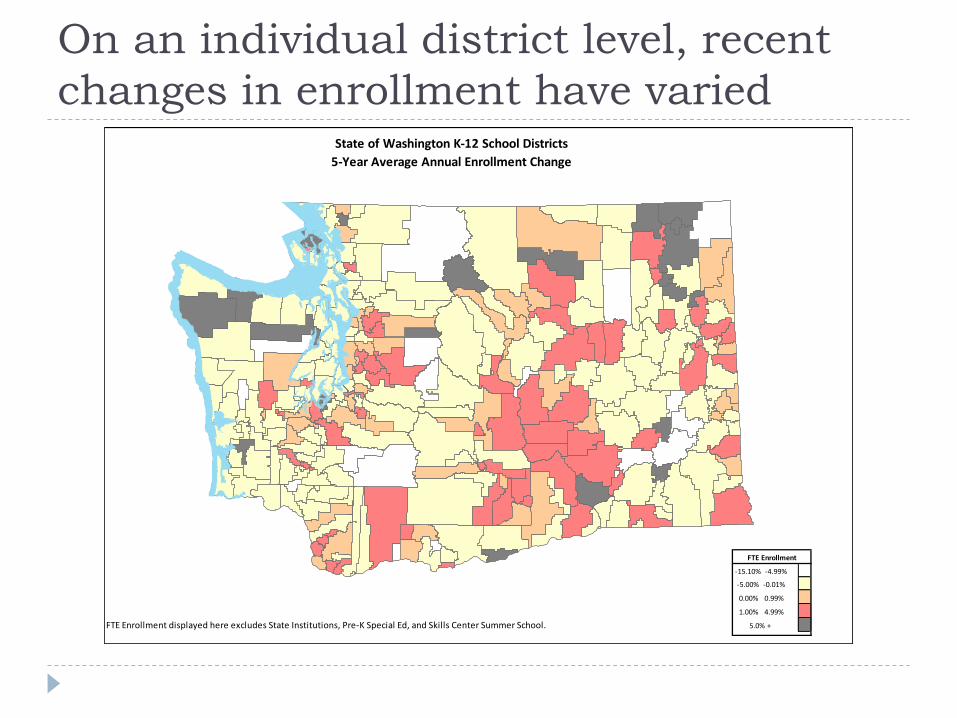
On an individual district level, recent
changes in enrollment have varied State of Washington K-12 School Districts
5-Year Average Annual Enrollment Change
FTE Enrollment
-15.10% -4.99%
-5.00% -0.01%
0.00% 0.99%
1.00% 4.99%
FTE Enrollment displayed here excludes State Institutions, Pre-K Special Ed, and Skills Center Summer School. 5.0% +

Special Education Enrollment
112,308
142,756
0
20,000
40,000
60,000
80,000
100,000
120,000
140,000
160,000
Headcount, age birth to 21
Average annual growth over entire period = 1.3%.
The allocation for students with disabilities age kindergarten-21 is indexed at
12.7% of the resident district K-12 full-time enrollment with additional safety net
funding for eligible high-cost students or community needs. The allocation for
students with disabilities aged birth to 5 and not yet enrolled in kindergarten does
not count against the 12.7% index.
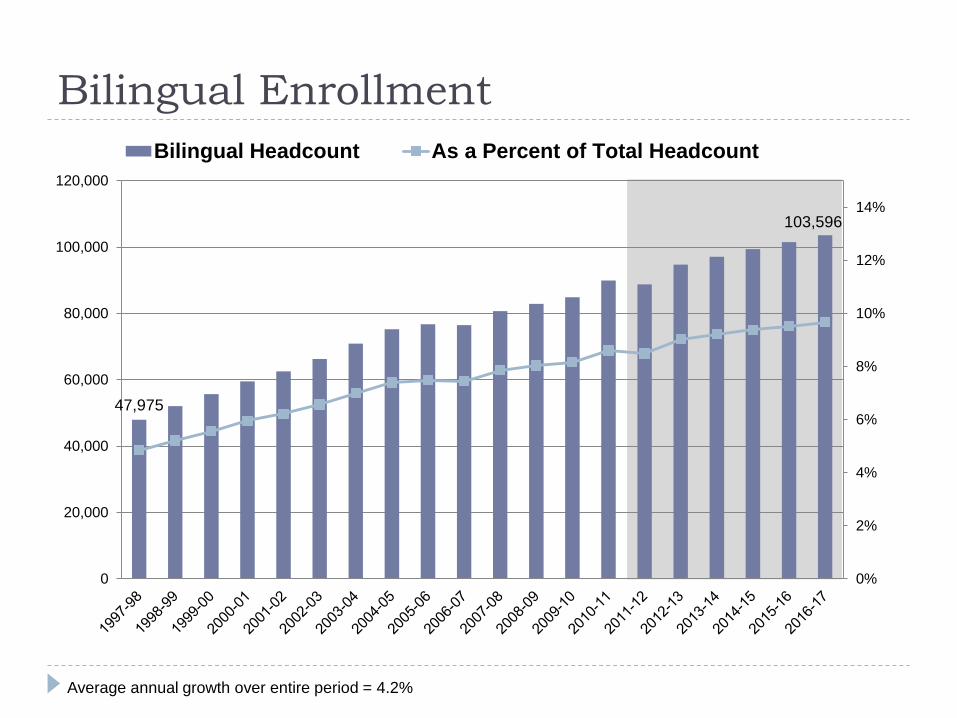
Bilingual Enrollment
47,975
103,596
0%
2%
4%
6%
8%
10%
12%
14%
0
20,000
40,000
60,000
80,000
100,000
120,000
Bilingual Headcount As a Percent of Total Headcount
Average annual growth over entire period = 4.2%
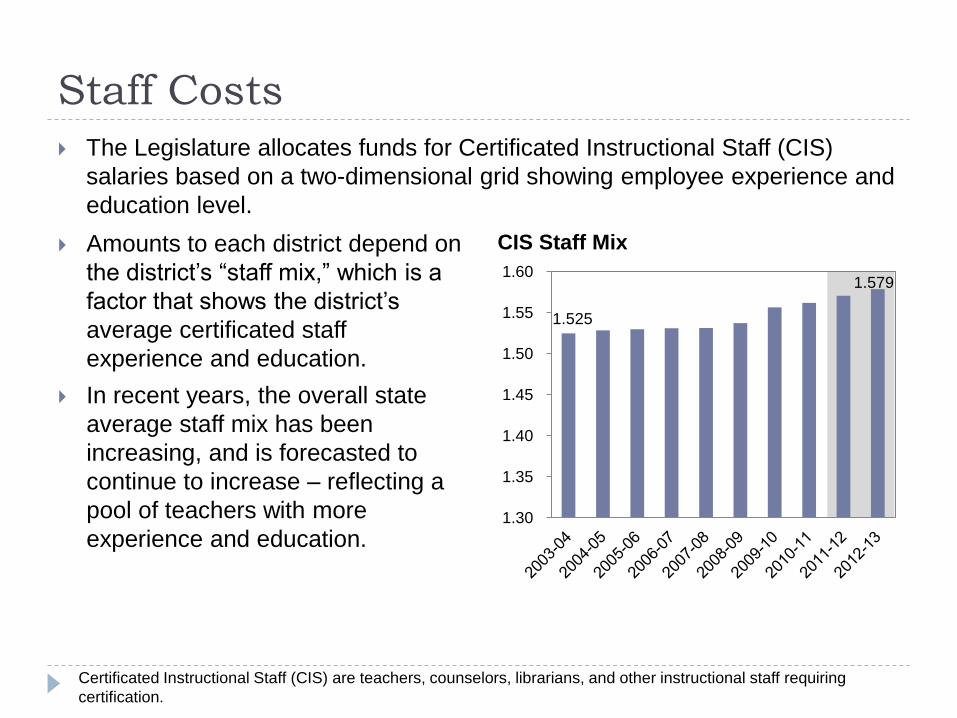
Staff Costs
1.525
1.579
1.30
1.35
1.40
1.45
1.50
1.55
1.60
CIS Staff Mix
Certificated Instructional Staff (CIS) are teachers, counselors, librarians, and other instructional staff requiring
certification.
The Legislature allocates funds for Certificated Instructional Staff (CIS)
salaries based on a two-dimensional grid showing employee experience and
education level.
Amounts to each district depend on
the district’s “staff mix,” which is a
factor that shows the district’s
average certificated staff
experience and education.
In recent years, the overall state
average staff mix has been
increasing, and is forecasted to
continue to increase – reflecting a
pool of teachers with more
experience and education.
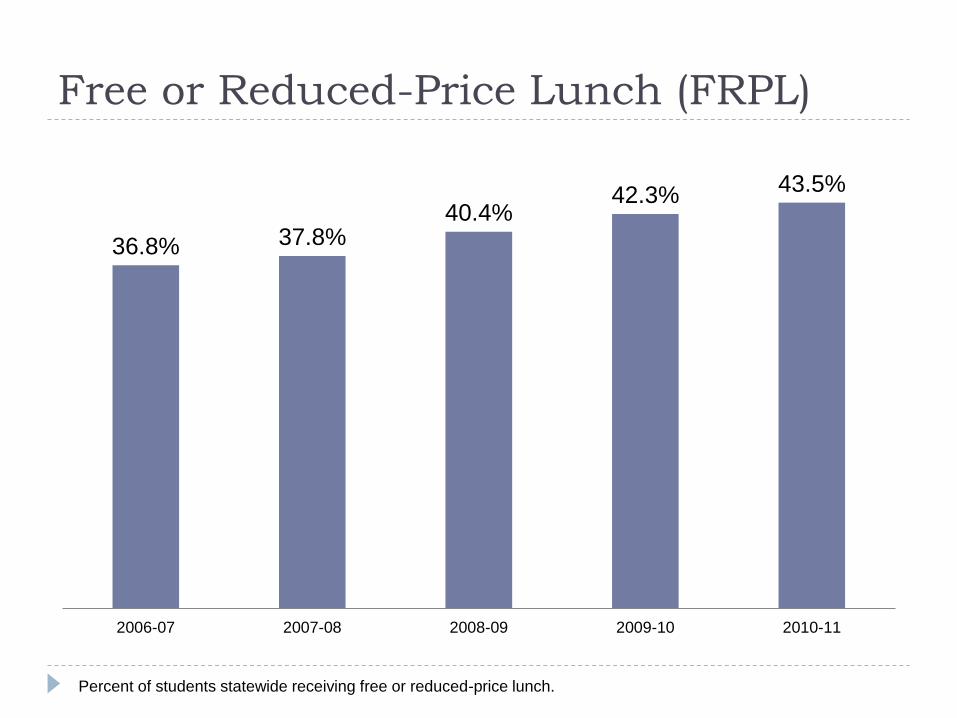
Free or Reduced-Price Lunch (FRPL)
36.8% 37.8% 40.4%
42.3% 43.5%
2006-07 2007-08 2008-09 2009-10 2010-11
Percent of students statewide receiving free or reduced-price lunch.

FRPL rates also vary widely by district State of Washington K-12 School Districts
FRPL Rate
FTE Enrollment
0.00% 19.99%
20.00% 39.99%
40.00% 59.99%
60.00% 79.99%
80.0% + 1
Percent of students receiving free or reduced-price lunch in school year 2010-11.
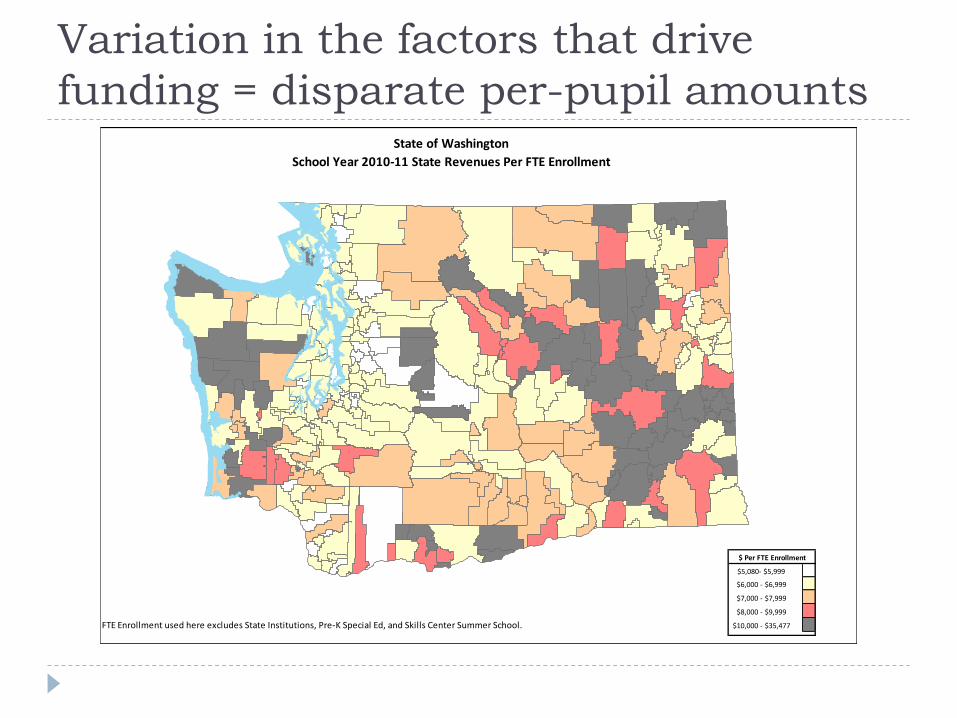
Variation in the factors that drive
funding = disparate per-pupil amounts State of Washington
School Year 2010-11 State Revenues Per FTE Enrollment
$ Per FTE Enrollment
$5,080- $5,999
$6,000 - $6,999
$7,000 - $7,999
$8,000 - $9,999
FTE Enrollment used here excludes State Institutions, Pre-K Special Ed, and Skills Center Summer School. $10,000 - $35,477