kahului commercial harbor 2030 master plan and eis chapters 2
TRANSCRIPT
ChApTER 2 Existing Commercial Harbor Facilities and Operations


CHAPTER 2 EXISTING COMMERCIAL HARBOR FACILITIES AND OPERATIONS
1
2
3
4
5 6 7 8 9
10
11 12 13 14 15 16 17 18 19 20 21 22 23 24 25 26 27 28 29
2.1 EXISTING HARBOR FACILITIES
Kahului Commercial Harbor consists of two distinct operational areas: the east side serves as the main commercial operational area, while the west side’s importance for commercial use is only as a breakwater, helping to protect the harbor from swells. Commercial operations are currently limited to approximately 50 acres on the east side of the harbor, where there are three major berthing facilities (Piers 1, 2, and 3) with storage areas, warehouses, harbor offices, and tenant buildings (Figure 2-1).
Pier 1 was constructed in stages in 1921, 1928, and 1955, and was extended (Pier 1C) another 300 feet in 2003.1 A single mooring dolphin (see sidebar) and catwalk improve-ment were added to Pier 1C and completed in 2005.2 This dolphin system provides an additional bollard located 225 feet off from Pier 1C and is used to secure large vessels that extend beyond Pier 1C. Pier 1 itself consists of a reinforced concrete deck partially supported on concrete piles and partially supported on fill, with an apron width of 31 feet. The design load of Pier 1 is 500 pounds per square foot (psf). The total berthing space of the pier is 1,658 feet, and the mooring dolphin is located 225 feet off its seaward end. The nominal water depth at Pier 1 is 35 feet. Behind the pier is a shed approxi-mately 374 feet long by 132 feet wide with a footprint of 1.1 acres. The shed is used as a passenger terminal and for equipment storage. Pier 1 includes approximately 17.6 acres of paved areas for cargo operations, circulation, and parking. Additional facilities on Pier 1 include transmission pipelines for gasoline, kerosene, diesel, fuel oil, and molasses, and a conveyor for sugar. In July 2007, the overseas container operator completed the installation of a 150-foot-tall mobile crane.
mooring dolphin: an isolated cluster of piles used as support of mooring devices such as a bollard.
nominal water depth: a rounded average of how deep the water is for a given area.
1 The 300-foot extension to Pier 1C was originally intended to allow multiple cruise ships to berth simultaneously.
Design for the extension began in 2000. State of Hawai‘i, Department of Transportation. 2003. Report to the Governor 2003.
2 Funding for the dolphin was provided by the Matson Navigation Company under Hawai‘i Revised Statutes (HRS) Section 266-19.5 Private Financing of Harbor Improvements. An Environmental Assessment (EA) for the mooring dolphin was completed in 2004.
2-1

CHAPTER 2 KAHULUI COMMERCIAL HARBOR 2030 MASTER PLAN EXISTING COMMERCIAL HARBOR FACILITIES AND OPERATIONS DRAFT ENVIRONMENTAL IMPACT STATEMENT
Pier 2 was constructed in stages in 1926, 1928, and 1963. The length along the northeast face of Pier 2 is 894 feet, and the width along the northwest face is 290 feet, for a total available berthing space of 1,184 feet. The southwest side of Pier 2 is not used for berthing vessels. A portion of the pier (42 percent) consists of a reinforced concrete deck supported on concrete piles, and the remainder of the pier (58 percent) is on fill. The original design load of Pier 2 was 500 psf. However, a 300-foot portion of the pier was strengthened to 1,000 psf to support heavy-lift cargo operations. The nominal water depth along the pier varies from 27 to 32 feet. Various sheds were constructed on Pier 2 in 1927, 1970, and 1973, but all have since been demolished. Backlands for Piers 2 and 3 are combined and total about 20.9 acres of paved surface for cargo operations, ferry operations, circulation, and cement storage. Additional facilities on Pier 2 include transmission pipelines for cement and propane. Cement is stored in privately owned silos located landside near the corner of Piers 2 and 3.
1 2 3 4 5 6 7 8 9
10 11 12 13 14
15 16 17 18 19 20 21
22 23 24 25
26 27 28 29 30 31
32 33 34 35
36
Pier 3 is situated between and perpendicular to Piers 1 and 2. Constructed in 1979, it consists of a reinforced concrete deck supported partially on concrete piles and partially on fill, with an apron width that varies from 36 feet to 44 feet. The pier is 500 feet long and has a design load of 1,000 psf. The nominal water depth at Pier 3 is only 18 feet, which limits its ability to berth larger or fully-loaded vessels. Additional facilities on Pier 3 include transmission pipelines for gasoline, jet fuel, fuel oil, and ethanol.
Tugboats ranging in length from 80 feet to 135 feet frequent Kahului Commercial Harbor. Tugboats operating on daily runs generally berth at available locations on Piers 1, 2, or 3. Two assist tugs stationed at the harbor generally moor at the tugboat pier located adjacent to Pier 3.
Other facilities in the harbor include the administration area (2.1 acres), an auto storage yard (3.9 acres), privately owned vehicle (POV) parking (0.4 acres), and other unspecified areas (0.6 acres). Supporting facilities at the port, adjacent to facilities owned by the State of Hawai‘i, Department of Transportation (DOT), Harbors Division (DOT Harbors), include storage tanks for fuel, cement, and molasses, as well as sugar processing and storage warehouses.
The major streets in the vicinity of the harbor are Ka‘ahumanu Avenue, Pu‘unēnē Avenue, Hobron Avenue, and Hāna Highway. Other surface streets include Wharf Street and Ala Luina Street.3 Hāna Highway and Ka‘ahumanu Avenue function as the major roadways in the area, serving both regional and local vehicular traffic.
3 Ala Luina Street is a limited-access roadway within the harbor. Since February 2007, it has been closed to general traffic.
2-2


KAHULUI COMMERCIAL HARBOR 2030 MASTER PLAN CHAPTER 2 DRAFT ENVIRONMENTAL IMPACT STATEMENT EXISTING COMMERCIAL HARBOR FACILITIES AND OPERATIONS
Alexander & Baldwin Properties 1
2 3 4 5 6 7 8 9
10
11
12 13 14 15 16 17 18 19 20 21 22 23 24 25 26
In July 2006, DOT Harbors completed an Environmental Assessment (EA) for acquiring two parcels from Alexander and Baldwin Properties (A&B Properties). Acquisition was finalized in December 2007. These properties are described as Tax Map Key (TMK) 3-7-10: Parcels 1 and 36. Parcel 1 is approximately 1.8 acres, and Parcel 36 is approximately 2.16 acres, totaling 3.96 acres. Parcel 36 has three detached single-story retail/office structures. The structure facing Ka‘ahumanu Avenue is the Kahului Railroad Building. The other two structures are wings extending seawards behind it. Parcel 1 has a two-story retail/office structure commonly known as the “Old Kahului Store.”
Navigation Improvements
Kahului Commercial Harbor is a man-made port, dredged from naturally occurring Kahului Bay. The harbor has a long history of development, including construction of breakwaters and harbor dredging dating back to the early 1900s. The harbor basin has been widened and deepened at various times to reduce navigational hazards due to increased traffic within the harbor and to accommodate larger vessels. Presently, the harbor basin is 2,050 feet wide by 2,400 feet long and has a project depth of 35 feet. The harbor is protected by two large breakwaters with an opening to the north. The entrance channel between the breakwaters is 660 feet wide and 40 feet deep (Figure 2-2). The breakwaters are armored with concrete tetrapods weighing up to 35 tons on the trunk and 50 tons on the head.
tetrapod: a bank protection element, precast of concrete, consisting of four legs joined at a central block, each leg making an angle of 109.5 degrees with the other three, like rays from the center of a tetrahedron to the center of each face. 4
4 International Erosion Control Association Resource website. 2007.
www.ieca.org/Resources/Reference/DefinitionsTZ.asp. Accessed September 14, 2007.
2-5

CHAPTER 2 KAHULUI COMMERCIAL HARBOR 2030 MASTER PLAN EXISTING COMMERCIAL HARBOR FACILITIES AND OPERATIONS DRAFT ENVIRONMENTAL IMPACT STATEMENT
2.2 EXISTING HARBOR OPERATIONS 1
2 3 4
5
Table 2-1 summarizes the cargo and passenger throughput5 for fiscal year 2005 (FY05). Cargo categories are explained in Section 2.2.1. Cargo and passenger throughput is further analyzed in Chapter 3.
Table 2-1. Summary of FY05 Cargo and Passenger Throughput
Category Cargo Units Import Export Total
Containers TEU 71,360 55,240 126,600 Vehicles tons 96,645 60,314 156,959 Break-Bulk Lumber tons 6,473 411 6,884 Produce tons 12,752 7,405 20,157 Livestock tons 137 69 206 Other Break-Bulk tons 195,928 64,886 260,814 TOTAL Break-Bulk tons 288,061 Dry-Bulk Sugar tons 190,192 190,192 Cement tons 57,570 57,570 Scrap Metal tons 6,525 6,525 Sand/Gravel tons 5,862 377,218 383,080 Coal tons 69,130 69,130 TOTAL Dry-Bulk tons 706,497 Liquid-Bulk Jet Fuel tons 200,445 200,445 Gasoline tons 252,349 252,349 Diesel tons 288,211 676 288,887 Liquefied Petroleum Gas
(LPG) tons 15,403 420 15,823
Fuel Oil tons 95,291 95,291 Total Petroleum tons 851,699 1,096 852,795 Molasses tons 70,189 70,189 Chemicals tons 3,948 3,948 TOTAL Liquid-Bulk tons 926,932 Cruise Passengers
each 147,450
TEU = Twenty-foot equivalent unit. 6 7
5 Throughput is defined as the amount of cargo, vehicles, and passengers that is handled/processed by commercial harbor
operations.
2-6


KAHULUI COMMERCIAL HARBOR 2030 MASTER PLAN CHAPTER 2 DRAFT ENVIRONMENTAL IMPACT STATEMENT EXISTING COMMERCIAL HARBOR FACILITIES AND OPERATIONS
2.2.1 Cargo Operations 1
2 3 4 5 6 7 8
9
10 11 12 13 14 15 16 17 18 19 20 21 22 23 24 25 26
27 28 29 30 31 32 33 34 35
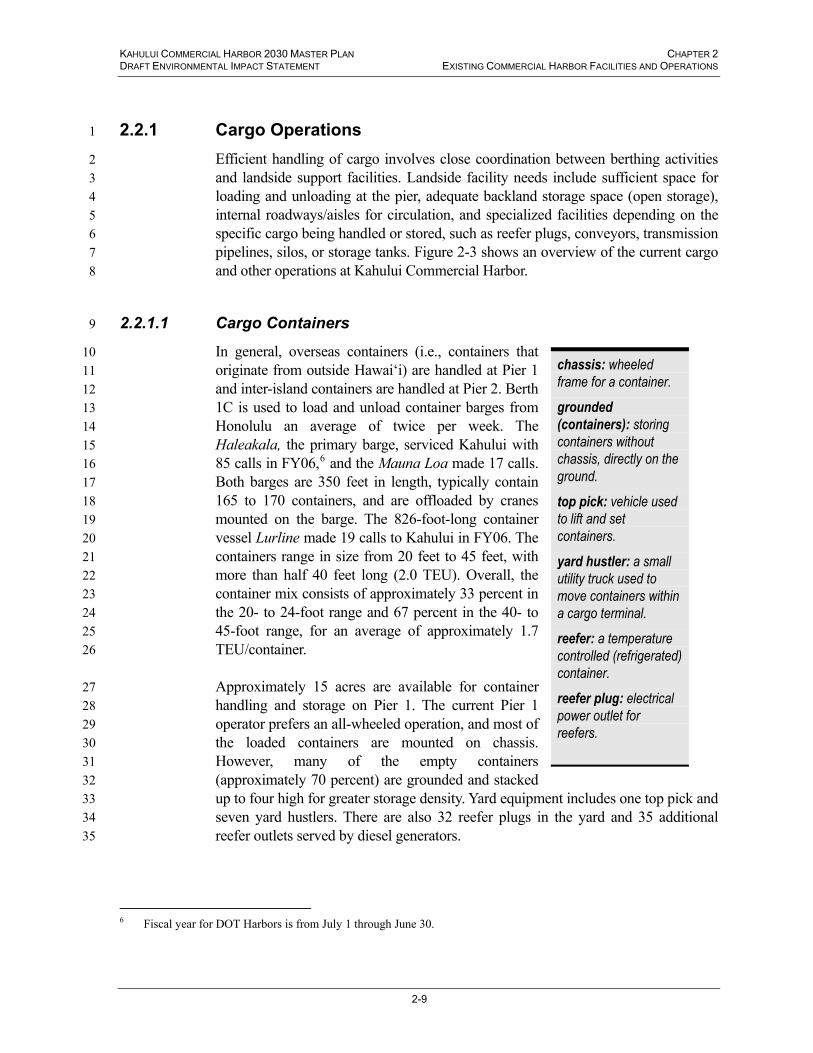
Efficient handling of cargo involves close coordination between berthing activities and landside support facilities. Landside facility needs include sufficient space for loading and unloading at the pier, adequate backland storage space (open storage), internal roadways/aisles for circulation, and specialized facilities depending on the specific cargo being handled or stored, such as reefer plugs, conveyors, transmission pipelines, silos, or storage tanks. Figure 2-3 shows an overview of the current cargo and other operations at Kahului Commercial Harbor.
2.2.1.1 Cargo Containers
In general, overseas containers (i.e., containers that originate from outside Hawai‘i) are handled at Pier 1 and inter-island containers are handled at Pier 2. Berth 1C is used to load and unload container barges from Honolulu an average of twice per week. The Haleakala, the primary barge, serviced Kahului with 85 calls in FY06,6 and the Mauna Loa made 17 calls. Both barges are 350 feet in length, typically contain 165 to 170 containers, and are offloaded by cranes mounted on the barge. The 826-foot-long container vessel Lurline made 19 calls to Kahului in FY06. The containers range in size from 20 feet to 45 feet, with more than half 40 feet long (2.0 TEU). Overall, the container mix consists of approximately 33 percent in the 20- to 24-foot range and 67 percent in the 40- to 45-foot range, for an average of approximately 1.7 TEU/container.
Approximately 15 acres are available for container handling and storage on Pier 1. The current Pier 1 operator prefers an all-wheeled operation, and most of the loaded containers are mounted on chassis. However, many of the empty containers (approximately 70 percent) are grounded and stacked up to four high for greater storage density. Yard equipment includes one top pick and seven yard hustlers. There are also 32 reefer plugs in the yard and 35 additional reefer outlets served by diesel generators.
chassis: wheeled frame for a container.
grounded (containers): storing containers without chassis, directly on the ground.
top pick: vehicle used to lift and set containers.
yard hustler: a small utility truck used to move containers within a cargo terminal.
reefer: a temperature controlled (refrigerated) container.
reefer plug: electrical power outlet for reefers.
6 Fiscal year for DOT Harbors is from July 1 through June 30.
2-9

CHAPTER 2 KAHULUI COMMERCIAL HARBOR 2030 MASTER PLAN EXISTING COMMERCIAL HARBOR FACILITIES AND OPERATIONS DRAFT ENVIRONMENTAL IMPACT STATEMENT
Berth 2A is used to load and unload containers from barges up to six times per week. The terminal operator employs a number of different barges. The Kukahi is the primary barge with 148 calls in FY06, and the Timberjack made 57 calls in FY06. Typical barge loads consist of 170 containers, with 80 in the 40-foot range and 90 in the 20-foot range, for an average of 1.5 TEU/container. Reefers account for approxi-mately 25 percent of the total container count.
1 2 3 4 5 6
7 8 9
10
11 12 13 14 15
16
17 18 19 20 21 22 23
24 25
7
A combined storage area serves both Piers 2 and 3. The total area is approximately 15.3 acres with sufficient space for 153 chassis parking spots, 112 grounded 20-foot containers, and 92 grounded 40-foot containers. The Pier 2/3 area includes 40 reefer plugs.
The total container throughput in FY05 was 126,600 TEU, which represents an increase of approximately nine percent compared to FY04. Of the loaded containers, imports account for 81 percent of the total and exports account for 19 percent. Imported empty containers account for only four percent of the total empties; exported empties account for 96 percent.
2.2.1.2 Vehicles
Roll-on/roll-off (RO/RO) barges are used at Berth 1C for unloading vehicles, which are taken directly to a remote storage lot. The Waialeale had 44 calls in FY06, and the Great Land made 19 calls, for an average of 1.2 calls per week. Berth 1C is also used by the Jean Anne for unloading vehicles, which are also taken to a remote lot. The Jean Anne made 26 calls in FY06, for an average of 0.5 calls per week. Berth 2B is also used by RO/RO barges to unload vehicles. The Pier 2/3 area contains storage space for 36 vehicles.
The total throughput for vehicles in FY05 was 156,959 tons, including 95,645 tons imported (62 percent) and 60,314 tons exported (38 percent).
7 Young Brothers, the current Pier 2 cargo operator, will be introducing four new, larger barges (the first having arrived
in November 2007), to handle increasing cargo demand.
2-10


KAHULUI COMMERCIAL HARBOR 2030 MASTER PLAN CHAPTER 2 DRAFT ENVIRONMENTAL IMPACT STATEMENT EXISTING COMMERCIAL HARBOR FACILITIES AND OPERATIONS
2.2.1.3 Break-Bulk 1
2 3 4 5 6 7 8 9
10
11 12
13
14
15
16
17
18 19 20
21 22 23
24 25 26
27 28 29 30 31 32
LCL shipments are shipments that do not completely fill a container. These shipments are typically placed on pallets (racks that can be moved by a fork lift) and may be combined with goods from multiple shippers in the same container.
Break-bulk cargo at Kahului Commercial Harbor includes lumber, produce, livestock, and other unspecified cargo. These cargoes are distinguished from containers, RO/RO, and bulk cargo by the manner in which they are handled and stored. Break-bulk cargo is typically shipped in units, on pallets, or in bags, and often requires special handling or protection from the elements. The “other” category consists primarily of general merchandise. It is typically handled as less than container load (LCL) cargo.
The total throughput for break-bulk cargo in FY05 was as follows:
• Lumber—6,884 tons total, 6,473 tons import
• Produce—20,157 tons total, 12,752 tons import
• Livestock—206 tons total, 137 tons import
• Other—260,814 tons total, 195,928 tons import
2.2.1.4 Dry-Bulk
Dry-bulk cargo includes sugar, cement, scrap metal, sand, and coal. Sugar is loaded at Berth 1A due to the location of the ship loader system. A total of 190,192 tons of sugar were exported in FY05.
Cement is handled at Berth 2A and is loaded into silos in the Pier 2/3 yard area. The Punapau made 49 calls in FY06, for an average of nearly once per week. The total quantity of cement imported in FY05 was 57,570 tons.
Scrap metal is exported primarily at Berth 3B and occasionally at Berth 1C. The Nohi made six calls in FY06 for an average of one every other month. The total amount exported in FY05 was 6,525 tons.
Sand and gravel are exported primarily at Berth 3B, with Berth 1C being an alternate berth. The material is trucked in and loaded out by barge, so there is no on-site storage required. The Ka‘ala made 92 calls in FY06 or approximately 1.8 calls per week. The total quantity exported in FY05 was 377,218 tons. DOT records also indicate that a total of 5,862 tons of sand were imported in FY05. The imported sand (premium sand) is used primarily for golf courses.
2-13

CHAPTER 2 KAHULUI COMMERCIAL HARBOR 2030 MASTER PLAN EXISTING COMMERCIAL HARBOR FACILITIES AND OPERATIONS DRAFT ENVIRONMENTAL IMPACT STATEMENT
Coal is imported at Berth 1C and is taken off-site, therefore requiring no on-site storage. The total quantity of coal imported in FY05 was 69,130 tons.
1 2
3
4 5 6 7 8 9
10
11
12
13
14
15
16
17
18 19 20 21 22 23
24 25 26 27
28
29 30
2.2.1.5 Liquid-Bulk
Liquid-bulk cargo includes jet fuel, gasoline, diesel, fuel oil, ethanol, liquefied petroleum gas (LPG), chemicals, and molasses. With the exception of molasses, liquid-bulk products are exclusively imports. Berth 1C is the only location for loading molasses, and a total of 70,189 tons were exported in FY05. LPG is unloaded at Berth 2A, which has a propane hatch. A total of 15,403 tons were imported in FY05. The remaining liquid-bulk operations are serviced at Berth 3B or Berth 1A. The total import quantities for FY05 were:
• Jet fuel—200,445 tons
• Gasoline—252,349 tons
• Diesel—288,211 tons
• Fuel Oil—95,291 tons
• Chemicals—3,948 tons
2.2.2 Passenger Operations
2.2.2.1 Cruise Ships
Cruise vessels currently berth at Berth 1A/1B. Approximately 50 percent of the existing Pier 1 shed is used for processing passengers, and the parking lot immediately east of the shed is used for buses, taxis, and rental cars. This area encompasses approximately 1.1 acres. In FY05, there were 24 foreign and 51 domestic cruise ship calls, for a total of 75 calls, and a total of 147,450 passengers, or approximately 1,966 passengers per cruise ship.
Call durations vary. Norwegian Cruise Line (NCL) America cruises, which begin and end in Hawai‘i, typically arrive in the morning, stay overnight, and leave the next evening. Ships from other cruise lines, which typically include Hawai‘i cruises on the way to or from cruising in Alaska, usually stay for a day.
2.2.2.2 Inter-Island Ferry
Regular ferry operations subject to Act 2 commenced in December 2007 at the end of Pier 2 (Berths 2B and 2C). Dedicated facilities are provided for access, parking,
2-14

KAHULUI COMMERCIAL HARBOR 2030 MASTER PLAN CHAPTER 2 DRAFT ENVIRONMENTAL IMPACT STATEMENT EXISTING COMMERCIAL HARBOR FACILITIES AND OPERATIONS
and queuing of passengers and vehicles on the pier and areas fronting Ka‘ahumanu Avenue. An enlarged view of the ferry terminal at Pier 2 is shown in
1 2 3 4 5 6
7
8 9
10 11 12
13
14 15 16
17
18
Figure 2-4. Ferry operations at Pier 2 happen once per day, seven days per week—the vessel arrives from Honolulu Harbor, then returns to Honolulu Harbor.8 Ferry operations are expected to increase to two visits per day starting in 2009 with the addition of a second ferry ship.
2.2.3 Summary of Pier Operations and Utilization The following are descriptions of operations at each pier. In general, berthing within the State’s commercial harbors is not permanently assigned. Vessels requesting to use the port are assigned berth space according to the availability of berths and required shoreside facilities. The following identifies primary cargoes generally assigned to each pier.
2.2.3.1 Pier 1
Pier 1 is a multi-use pier with three berths designated as 1A, 1B, and 1C. Pier 1 is the main pier used by large container vessels and cruise ships and can accommodate two large ships simultaneously.
Table 2-2 summarizes the cargo types, uses, and storage locations for Pier 1.
Table 2-2. Pier 1 Operations
Berth Cargo Type/Use Storage Location Remarks
1A Fuel Offsite See Note 1 1A/1B Sugar Export Conveyor from off-site warehouse Cruise passengers Terminal 1C Containers Yard Autos/RO/RO Auto lot Sand/Gravel Export Berth 3B is primary location Coal Offsite Berth 1C is primary and only discharge berth Livestock Yard Molasses Export Scrap Metal Export OL/OW Yard Over length/over width
Note 1: Berth 1A is used by double-hulled, fully-loaded fuel barges. While Berth 3B is the primary fuel berth, its use is limited by a water depth of 18 feet.
19 20
8 Hawaii Superferry. 2007. Routes and Schedules. www.hawaiisuperferry.com/main/faresroute/rtssched/default.aspx.
Accessed November 6, 2007. The schedule is subject to approval by the Public Utilities Commission.
2-15

PIE
R 3PIER 2
Wharf S
t.
Ka‘ahumanu Ave.
KAHULUIHARBORFACILITY
MAUI
Area ofDetail
PassengerTerminal
Exit Only
PassengerPick Up/Drop OffArea
VehicleStagingArea 3
VehicleStagingArea 1
VehicleStagingArea 2
General Vehicles,Passenger Busesand Limo Entry
Barge
Ramp
Gangway
Covered PassengerWaiting Area
HawaiiSuperferry
Hawaii Superferry, Inc.
RestroomFacilities
Shuttle Pick-Upand Drop-Off
CommercialVehicle Entry/Exit
VehicleCheck-InStation
RestroomFacilities
Bus/LimoDrop-Off
Maui Mall
Ramp
Figure 2-4INTER-ISLAND FERRY TERMINAL
Kahului Commercial Harbor 2030 Master PlanDraft Environmental Impact Statement
December 2007NORTH
0 150 300
APPROXIMATE SCALE IN FEET
©2007 Belt Collins H
awaii Ltd. 2006.70.0401/010-1 d11.21.07 4
Source: Hawaii Superferry. Kahului Ferry Terminal. www.hawaiisuperferry.com/travel-information/port-information/default.html<�le://www.hawaiisuperferry.com/travel-information/port-information/default.html>. Accessed July 30, 2007.
Inter-Island Ferry

KAHULUI COMMERCIAL HARBOR 2030 MASTER PLAN CHAPTER 2 DRAFT ENVIRONMENTAL IMPACT STATEMENT EXISTING COMMERCIAL HARBOR FACILITIES AND OPERATIONS
2.2.3.2 Pier 2 1
2 3 4 5 6 7
8
9
Pier 2 has three berths designated as 2A, 2B, and 2C. Berth 2A, the nearshore berth, is used for inter-island containers, RO/RO, LCL cargo, propane, cement, and livestock transport operations. Inter-island ferry vessels utilize Berth 2B, with occasional use by tugs or other vessels awaiting berths when not occupied by the ferry. Berth 2C is for inter-island ferry operations only, since the ramp barge used to access the ferry is moored there.
Table 2-3 summarizes the cargo types/uses and storage locations for Pier 2.
Table 2-3. Pier 2 Operations
Berth Cargo Type Storage Location Remarks
2A Containers, RO/RO, LCL Yard LPG (propane) Offsite Cement Yard (silos) To be relocated Livestock Yard 2B Containers, RO/RO, LCL Yard Inter-Island Ferry Yard See Note 1 Lay Berth Not applicable Various barges awaiting berths General Berthing Not applicable Assist tugs, barge tugs 2C Inter-island Ferry Ramp Barge Terminal See Notes 1 and 2
10 11 12 13
14
15 16 17 18 19
20
Note 1: Berth 2B is designated for inter-island ferry berthing. Barges may be restricted from all use. Tugs will be restricted to periods when not occupied by the ferry.
Note 2: Berth 2C is designated for inter-island ferry use exclusively.
2.2.3.3 Pier 3
Adjacent and perpendicular to Pier 2, Pier 3 is 500 feet long. The water depth at Pier 3 is only 18 feet, which limits the type of vessels using this pier. Pier 3 has only one berth, designated as berth 3B. Berth 3A is not used since it intersects with Berth 2A, which is the predominant berth. Berth 3B is used for unloading fuel, ethanol, containers, RO/RO, and exporting sand, gravel, and scrap metal.
Table 2-4 summarizes the cargo types and storage locations for Pier 3.
2-17
CHAPTER 2 KAHULUI COMMERCIAL HARBOR 2030 MASTER PLAN EXISTING COMMERCIAL HARBOR FACILITIES AND OPERATIONS DRAFT ENVIRONMENTAL IMPACT STATEMENT
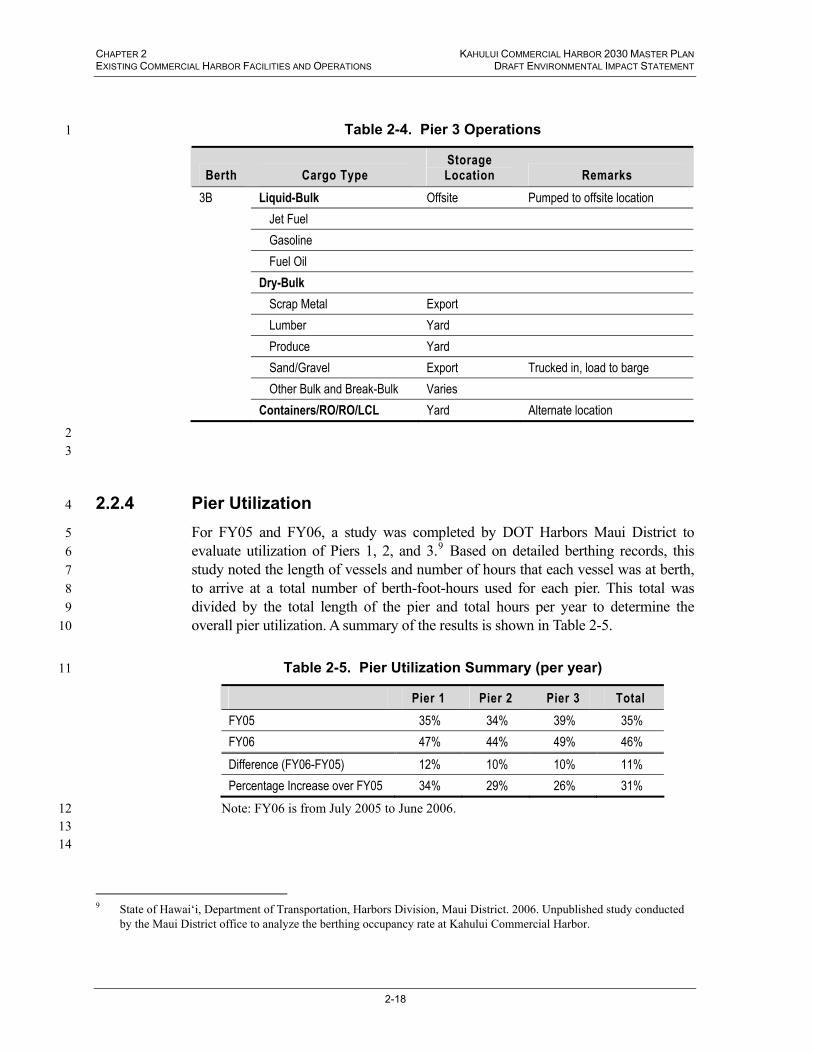
Table 2-4. Pier 3 Operations 1
Berth Cargo Type Storage Location Remarks
3B Liquid-Bulk Offsite Pumped to offsite location Jet Fuel Gasoline Fuel Oil Dry-Bulk Scrap Metal Export Lumber Yard Produce Yard Sand/Gravel Export Trucked in, load to barge Other Bulk and Break-Bulk Varies Containers/RO/RO/LCL Yard Alternate location
2 3
4
5 6 7 8 9
10
11
2.2.4 Pier Utilization For FY05 and FY06, a study was completed by DOT Harbors Maui District to evaluate utilization of Piers 1, 2, and 3.9 Based on detailed berthing records, this study noted the length of vessels and number of hours that each vessel was at berth, to arrive at a total number of berth-foot-hours used for each pier. This total was divided by the total length of the pier and total hours per year to determine the overall pier utilization. A summary of the results is shown in Table 2-5.
Table 2-5. Pier Utilization Summary (per year)
Pier 1 Pier 2 Pier 3 Total FY05 35% 34% 39% 35% FY06 47% 44% 49% 46% Difference (FY06-FY05) 12% 10% 10% 11% Percentage Increase over FY05 34% 29% 26% 31%
Note: FY06 is from July 2005 to June 2006. 12 13 14
9 State of Hawai‘i, Department of Transportation, Harbors Division, Maui District. 2006. Unpublished study conducted
by the Maui District office to analyze the berthing occupancy rate at Kahului Commercial Harbor.
2-18
KAHULUI COMMERCIAL HARBOR 2030 MASTER PLAN CHAPTER 2 DRAFT ENVIRONMENTAL IMPACT STATEMENT EXISTING COMMERCIAL HARBOR FACILITIES AND OPERATIONS
In order to achieve 100 percent utilization, all piers would need to serve the largest vessels they could 24 hours a day. The calculated rates are clearly high for a harbor that normally operates during daylight hours only.
1 2 3
4 5 6 7 8 9
10 11 12
13
14 15 16 17 18 19
20
21 22 23 24 25 26 27
28 29 30 31 32
For a similar comparison, the Hawai‘i Harbor Users Group’s report10 determined that Pier 1 (Berths 1A and 1B) had a berthing occupancy rate of 52 percent (approximately 12.5 hours per day) over a two-week sampling period. One result of a high occupancy rate is that scheduling berths for ships becomes more difficult and introduces inefficiencies. For example, incoming ships may have to wait for an available berth, additional time and labor may be needed to load and unload a vessel, already-berthed ships may have to leave the berth to make room for a higher-priority cargo, or the berthing space assigned may not be the most appropriate or efficient to handle the ship’s cargo.
2.3 EXISTING MANAGEMENT MEASURES
Standard management practices are in place for DOT Harbors’ properties which may be affected by the activities proposed as part of the Kahului Commercial Harbor 2030 Master Plan (2030 Master Plan). These management practices, which may be based on federal, state, or local laws, or on DOT Harbors’ policies, place constraints on activities for the purpose of protecting the natural environment, public safety, or other resources.
2.3.1 In-water Construction Management Constraints There are several possible methods that may be considered for dredging activities proposed under the 2030 Master Plan alternatives; these are described further in Chapter 4. For each dredging method, management measures will be implemented as part of the activity to minimize potential impacts on the environment. Management measures for noise and air quality would be similar to those for on-shore construction and are discussed in Section 2.3.2 below. Measures specific to in-water work would include but not be limited to:
WATER QUALITY. Dredge and fill (breakwater construction) activities contribute to resuspension of bottom sediments. Sediments suspended in the water column and associated turbidity (opaqueness of the water) are considered water quality pollutants. In addition, metals, nutrients, and other pollutants which may be present in bottom sediments could be introduced to the water column. Best Management
10 Mercator Transport Group. December 2005. Hawaii Harbor Users Group Report on Port Facilities and Development
Priorities. The methodology of the two studies differed slightly, so the difference between the rates cited in the two studies point to differences in approach, rather than in utilization levels.
2-19

CHAPTER 2 KAHULUI COMMERCIAL HARBOR 2030 MASTER PLAN EXISTING COMMERCIAL HARBOR FACILITIES AND OPERATIONS DRAFT ENVIRONMENTAL IMPACT STATEMENT
Practices (BMPs), such as installation of silt curtains, will be implemented to contain the suspended material in the immediate area of dredge and fill activities until sediments re-settle. Federal and State permits required for work in waters of the United States and State waters require that BMPs be designed and programmed to the satisfaction of the regulatory agencies.
1 2 3 4 5
6
7 8 9
10 11
12 13 14 15 16 17 18 19 20
21 22 23 24 25 26 27 28 29 30
31 32 33 34
35 36 37
2.3.2 On-shore Construction Management Constraints On-shore construction management constraints include BMPs to control erosion, runoff, traffic congestion, noise, dust, emissions, and release of hazardous substances. Management constraints would be implemented as part of the proposed action to avoid or minimize potential impacts on the environment during construction. Measures would include but not be limited to:
EROSION/RUNOFF. Construction activities may contribute to discharge of eroded soil particles, petroleum, and other pollutants which have the potential to affect surface water quality. BMPs such as structural controls (i.e., installation of silt fence) and engineering controls (i.e., construction phasing) are currently implemented to comply with federal (Clean Water Act [CWA] Section 402 National Pollutant Discharge Elimination System [NPDES]) and State (Hawai‘i Revised Statutes [HRS] Chapter 342D, Water Pollution Control; Title 11 Chapter 54 of the Hawai‘i Administrative Rules [HAR], Water Quality Standards; HAR 11-55 NPDES General Permits) regulations addressing stormwater runoff.
Surface runoff from placement of dredged material would be addressed either through engineering controls to contain potential runoff or through dewatering BMPs and compliance with NPDES requirements. If space is not available within the harbor property for dewatering and drying, DOT may haul dredged material to an off-site dewatering area. Hauling trucks would be lined to minimize spillage of dredged material and excess water. Sediment unloaded from the trucks would be spread onto bermed dewatering cells to allow percolation and evaporation. A dewatering site would be chosen to minimize impacts on groundwater resources. The bermed cells would be designed with sufficient freeboard to contain a 25-year, 24-hour storm event plus one foot to prevent surface discharge from the site.
TRAFFIC. Measures to minimize construction-related traffic impacts may include following a traffic management plan that limits certain activities to non-peak hours and provides for traffic control measures when needed to assure safety and minimize congestion.
NOISE. Noise-generating activities include large truck movements, heavy equipment operations, ship loading and unloading using cranes, lifts, and other mechanical equipment, and ship and tugboat engines. Management constraints exist to comply
2-20

KAHULUI COMMERCIAL HARBOR 2030 MASTER PLAN CHAPTER 2 DRAFT ENVIRONMENTAL IMPACT STATEMENT EXISTING COMMERCIAL HARBOR FACILITIES AND OPERATIONS
with both federal and State noise guidelines. Federal guidance dealing with noise control can be found in the Code of Federal Regulations (CFR) Title 23 Highways, Title 40 Part 204 Noise Emission Standards for Construction Equipment, and Title 42 Chapter 65 Noise Control. State regulations are in HAR 11-46 Community Noise Control and are under the jurisdiction of the Hawai‘i Department of Health Noise Radiation and Indoor Air Quality Branch Noise Section. These regulations define maximum permissible sound levels and are intended to control and/or abate noise pollution from construction equipment. Measures to minimize noise impacts may include:
1 2 3 4 5 6 7 8 9
10
11
12
13 14
15 16 17
18 19 20 21 22 23 24 25 26 27 28 29 30 31
32
• limiting work to daytime hours,
• reducing truck/equipment idling when not in use,
• using manually adjustable or self-adjusting backup alarms, and
• fitting generators and equipment with manufacturer-approved exhaust mufflers.
Based on evaluating federal and State standards for Activity Category C,11 state standards are the more stringent and will be used as the basis of evaluation for this EIS.
AIR QUALITY (FUGITIVE DUST/EMISSIONS). The U.S. Environmental Protection Agency’s (EPA) transportation conformity rule requires that federal transportation agencies demonstrate conformity with Clean Air Act air quality goals. Transportation conformity is a way to ensure that federal funding and approval are given to those transportation activities that are consistent with air quality goals. It ensures that these transportation activities do not worsen air quality or interfere with the purpose of a state implementation plan, which is to meet the National Ambient Air Quality Standards (NAAQS). Meeting the NAAQS often requires emissions reductions from mobile sources.12 The conformity rule applies in nonattainment and maintenance areas for transportation-related criteria pollutants for which the area is designated nonattainment or has a maintenance plan. As the state of Hawai‘i is in attainment of NAAQS, conformity determinations do not apply. However, there are several measures that can be taken to minimize construction-related air quality impacts. These may include:
• minimization of the amount of dust-generating materials and activities;
11 Activity Category C is a type of land use or activity which may be affected by noise from construction. Federal Code of
Regulations Title 23 Part 771 Procedures for Abatement of Highway Traffic Noise and Construction Noise. 12 Federal Highways Administration website.
www.fhwa.dot.gov/environment/conformity/ref_guid/sectiona.htm#whatconf. Accessed November 21, 2007.
2-21

CHAPTER 2 KAHULUI COMMERCIAL HARBOR 2030 MASTER PLAN EXISTING COMMERCIAL HARBOR FACILITIES AND OPERATIONS DRAFT ENVIRONMENTAL IMPACT STATEMENT
• centralization of material transfer points and onsite vehicle traffic routes; 1
2
3
4 5
6 7
8
9
10
11
12 13
14
15 16
17 18 19
20 21
22
23 24
25 26
27
28
• location of potentially dusty equipment in areas of the least impact;
• provision of adequate water for dust control from the start of construction;
• implementation of dust control at shoulders, project entrances, and access roads;
• provision of dust control after hours, on weekends, and prior to daily construction activities;
• use of a frequent watering program on bare-dirt surfaces;
• limitation of the disturbance area at any given time;
• application of chemical soil stabilizers or mulching;
• construction of wind screens;
• covering of open-bodied trucks when transporting dirt or dust-producing material;
• cleaning of vehicle tires prior to exiting the site; and/or
• stabilization of the site through paving or landscaping where appropriate as early as possible.
HAZARDOUS MATERIALS. Hazardous materials may be used in construction and operation of harbor facilities. The potential for release of hazardous substances into the environment will be minimized by:
• where possible, minimizing the use of hazardous materials or substituting equivalent non-hazardous materials;
• using hazardous materials according to labeled instructions;
• storing hazardous materials in appropriate labeled containers, inspected periodically;
• keeping hazardous materials in appropriate containment areas, where they will not be exposed to storm water or other incompatible materials;
• keeping appropriate spill control and clean-up materials on site; and
• training employees in the proper use and handling of materials.
2-22

KAHULUI COMMERCIAL HARBOR 2030 MASTER PLAN CHAPTER 2 DRAFT ENVIRONMENTAL IMPACT STATEMENT EXISTING COMMERCIAL HARBOR FACILITIES AND OPERATIONS
2.3.3 Security/Access Management Constraints 1
2 3 4 5 6 7 8 9
10 11 12 13
14 15 16 17 18 19 20 21 22 23 24
25 26 27 28 29 30 31 32 33 34
Security and access management constraints include procedures developed and implemented by DOT Harbors, U.S. Coast Guard (USCG), and the Department of Homeland Security (DHS) to limit access to harbor facilities from land and sea to authorized persons only. CFR Title 33 Navigation and Navigable Waters contains regulations for protection and security of vessels, harbors, and waterfront facilities. Section 165.140813 establishes a moving security zone that extends 100 yards (300 feet) in all directions from each large passenger vessel. This moving security zone is activated when the vessel is within three nautical miles of Kahului Commercial Harbor and remains in effect while the vessel is transiting, anchored, position-keeping, or moored in Kahului Commercial Harbor. In addition to Title 33, USCG also provides regulations for navigating on inland waters in their guidance for Prevention of Collisions at Sea.14
In addition to establishing security zones, USCG has developed a system of Maritime Security (MARSEC) levels15 that corresponds to DHS’s Homeland Security Advisory System (HSAS). MARSEC levels “advise the maritime community and the public of the level of risk to the maritime elements of the national transportation system.” MARSEC Level 1, the minimum security level that is maintained at all times, corresponds to HSAS Threat Conditions Green, Blue or Yellow. MARSEC Level 2 involves heightened security under conditions of additional risk of a transportation security incident. This level corresponds to Threat Condition Orange. MARSEC Level 3 involves even greater security restrictions for a limited period when a security incident is imminent or has occurred. It corresponds to Threat Condition Red.
On November 27, 2007, USCG announced a temporary fixed security zone for visits of the Hawaii Superferry (HSF) vessel Alakai to Kahului Commercial Harbor. The fixed security zone becomes active one hour before the Alakai’s arrival until ten minutes after its departure.16 During that period, no person or vessel may enter or remain in the fixed security zone without the express permission of the Captain of the Port, Honolulu. The security zone covers all of the waters of Kahului Commercial Harbor except the area between Hoaloha Beach Park and buoys 10, 11, and 12, approximately 750 feet from shore. While that zone is in effect, recreational activities such as surfing, paddling, and small boat voyages are prohibited in the above described area. This security zone is in effect from December 1, 2007 through
13 Code of Federal Regulations. Title 33 §165.1408, Revised July 1, 2006. Security Zones; Maui, HI. 14 U.S. Department of Transportation and U.S. Coast Guard. October 1995. Navigation Rules International—Inland. This
manual contains the International Regulations for Prevention of Collisions at Sea, 1972 (72 COLREGS) and the inland Navigation Rules.
15 Code of Federal Regulations. Title 33, §101.200. MARSEC Levels. 16 Federal Register. November 28, 2007. “Security Zone; Kahului Harbor, Maui, HI.” Volume 72, Number 228.
2-23

CHAPTER 2 KAHULUI COMMERCIAL HARBOR 2030 MASTER PLAN EXISTING COMMERCIAL HARBOR FACILITIES AND OPERATIONS DRAFT ENVIRONMENTAL IMPACT STATEMENT
January 31, 2008. A USCG spokesman has indicated that the security zone could be made smaller if there is no clear threat to safety and security.
1 2
3 4 5
6 7 8 9
10 11
12
13 14 15 16 17 18 19 20 21 22 23 24 25 26
27 28 29 30 31 32
17
The temporary security zone for the Alakai was created in response to protests during the first visits of the Alakai in September 2007 to Nāwiliwili Commercial Harbor, Kaua‘i.
Analysis of the potential impacts of the master plan improvements is based on the assumption that MARSEC Level 1 is in effect without any special security zones established by USCG, so both commercial and recreational activities can proceed normally. Under greater security restrictions, recreational activities could be excluded from Kahului Commercial Harbor, whether for hours, as specified in the November 27, 2007 announcement, or longer periods.
2.3.4 Invasive Species Transshipment Management Constraints Harbors and port facilities have the potential to introduce both terrestrial and aquatic invasive species to Hawai‘i’s environment. Large overseas vessels, barges, and passenger vessels in Kahului Commercial Harbor have the potential to bring potentially harmful terrestrial and aquatic alien plant, animal, and microorganism species to the island of Maui and the state of Hawai‘i through introduction of cargo and passengers from outside of the island and state. Harmful alien pest species, or “invasive” species, are defined by the National Invasive Species Information Center (NISIC)18 as species that are: (1) nonindigenous to the ecosystem under consider-ation, and (2) whose introduction causes or is likely to cause economic or environ-mental harm and/or harm to human health.19 These species may threaten the local economy and natural environment by damaging native forests, competing with and causing the extinction of native flora and fauna, carrying diseases that may affect native species, agricultural crops and humans, and interrupting the shipment of local produce.
Primary mechanisms of potential invasive species introductions into Hawai‘i’s environment include international and domestic shipping and passenger vessels, recreational boating, fisheries activities, aquaculture, and the water garden and aquarium industries. Research and stocking activities have also historically been mechanisms for invasive species introductions. Introduction and dispersal pathways of terrestrial invasive species can include unintentional transport and escape of
17 Lieutenant John Titchen, quoted in C. Hamilton, “Harbor Shutdown an Interim Measure.” Maui News, November 29,
2007, available at www.mauinews.com/news/2007/11/29/03hars1129.html 18 The NISIC was established in 2005 at the National Agricultural Library to meet the information needs of users
including the National Invasive Species Council. www.invasivespeciesinfo.gov/about.shtml. Accessed September 14, 2007. Executive Order 13112 was signed on February 3, 1999, establishing the National Invasive Species Council.
19 NISIC website. www.invasivespeciesinfo.gov/whatis.shtml. Accessed September 14, 2007.
2-24

KAHULUI COMMERCIAL HARBOR 2030 MASTER PLAN CHAPTER 2 DRAFT ENVIRONMENTAL IMPACT STATEMENT EXISTING COMMERCIAL HARBOR FACILITIES AND OPERATIONS
organisms in cargo; unauthorized, intentional release of organisms; or accidental release of target organisms from growing facilities.
1 2
3 4 5 6 7 8
9 10
11 12
13 14
15
16 17
18 19
20 21
22 23
24
25
26
27
28
29 30
Invasive marine species can include types of marine algae, marine fish, and marine invertebrates. A discussion of existing marine invasive species relevant to Kahului Commercial Harbor is included in Section 5.4.3. Examples of primary introduction and dispersal pathways of marine invasive species are listed below.
Commercial Ships, Passenger Vessels, Fishing Boats, Recreational Boating
• Release of organisms in ballast water and sediments
water garden: landscape features such as aquatic gardens, backyard ponds and garden ponds
fouling organisms: aquatic organisms with a sessile adult stage that attach to and foul underwater structures of ships
seachest: small underwater compart-ment within the shell plating through which sea water is drawn in or discharged; the sea water may be used for cooling the machinery systems.
• Fouling organisms on vessel hulls, seachests, pipe systems, and other structures
• Live holding and bait wells
• Fisheries gear and debris (fouling organisms on nets and floats)
Aquaculture, Aquarium, Water Garden, and Other Industries
• Accidental release of target organisms from culture or grow-out facilities
• Accidental release of non-target organisms such as epiphytic or pathogenic organisms
• Unauthorized, intentional release of organisms
Private Sector
• Live seafood shipments
• Aquarium release
• Release for cultural practices
• Illegal or accidental imports in cargo, on passenger vessels, through the mail, or on private aircraft and vessels
2-25

CHAPTER 2 KAHULUI COMMERCIAL HARBOR 2030 MASTER PLAN EXISTING COMMERCIAL HARBOR FACILITIES AND OPERATIONS DRAFT ENVIRONMENTAL IMPACT STATEMENT
Marine Debris 1
2
3 4 5 6
7
8 9
10 11 12 13 14 15 16 17 18 19
20 21 22 23 24 25 26 27 28 29 30 31 32 33
34 35 36 37
• Fouling organisms on abandoned nets and floats.
Marine invasive species introduction mechanisms which may be associated with Kahului Commercial Harbor operation include the presence of organisms in transported cargo, the release of organisms during ballast water discharges, or attachment of fouling organisms to ship hulls or other structures.
Cargo
Currently, the prevention of the introduction of alien species to Maui via transported cargo is under the jurisdiction of the Hawai‘i State Department of Agriculture (DOA), State Department of Land and Natural Resources (DLNR) Division of Aquatic Resources (DAR), U.S. Department of Homeland Security (formerly U.S. Customs and U.S. Department of Agriculture), and the State Department of Health (DOH). These agencies monitor, inspect, quarantine, and certify cargo from foreign ports and interstate/intrastate cargo. In addition, DOT Harbors and DOT participate in committees, such as (but not limited to) the Coordinating Group on Alien Pest Species (CGAPS) and task forces to monitor and resolve the potential introduction of alien pest species. DOT Harbors will continue to work with agencies which have jurisdiction and authority to prevent and control alien pest species within commercial harbors.
The DOA has designated Kahului Commercial Harbor as a limited port-of-entry for overseas agricultural commodities; therefore, only plants and plant products such as produce and cut flowers are allowed entry. Live animals (except live seafood for consumption) and microorganisms from foreign and domestic origins are not allowed entry through Kahului Commercial Harbor unless inspected by DOA in Honolulu prior to transport to Kahului. Pursuant to HRS Section 150A-5, any person transporting any agricultural commodity to Hawai‘i shall notify the DOA and hold the commodity at the dock, pier, wharf, airport, or air terminal where they are first received or discharged until inspection can be made by the Plant Quarantine Inspector. Because of space shortage at the piers, transportation companies have been requesting that inspections be done at sites other than the dock or at the dock but before or after regular work hours. For the maritime operations, shippers reimburse the state for the inspector’s cost to inspect the containers during overtime hours.
Propagative (e.g., roots, root stock) agricultural commodities may not move between islands without DOA inspection. Non-propagative plant parts transported by inter-island barge, such as cut flowers, fruit, vegetables, and produce, need not be inspected provided they are subject to random DOA inspections. HSF will allow
2-26
KAHULUI COMMERCIAL HARBOR 2030 MASTER PLAN CHAPTER 2 DRAFT ENVIRONMENTAL IMPACT STATEMENT EXISTING COMMERCIAL HARBOR FACILITIES AND OPERATIONS
transport of plant and propagative plant parts after inspection by the DOA Plant Quarantine Office and if accompanied by a signed DOA certificate of inspection. Cut or harvested flowers, foliage, fruits, vegetable, and other non-propagative plant parts need not be inspected prior to being transported, but shall be subject to random DOA inspections at either the port of departure or port of entry.
1 2 3 4 5
6 7 8 9
10 11
12 13
14 15 16
17 18
19
20
21 22
23
24
25 26 27 28 29 30 31
20
Executive Order (EO) No. 07-10, issued pursuant to Act 2 of the 2007 Special Session, sets out detailed conditions affecting HSF operations until an EIS examining those operations has been accepted.21 It includes the following conditions affecting vehicles and cargo:
• All vehicles will be screened for agricultural products, and vehicles containing prohibited items will not be allowed to board.
• All vehicles will be screened for dirt or mud, and vehicles that are “excessively dirty” or have caked-on mud will not be permitted to board.
• While domestic cats, dogs, pigeons and rabbits may be carried without a DOA certificate, domestic livestock may be carried if accompanied by a certificate. No pigs may be carried.
• No rocks, soil, sand, dirt, or dead coral may be carried, except for soil in potted plants that have been cleared by DOA.
• No iwi (human bones) may be carried.
• No crustaceans may be carried.
• Live or dead fish or live coral may be transported with a valid commercial marine license. Recreational fishers may transport fish.
• No logs, trees, or tree limbs may be transported.
Ballast Water
Ship operators use ballast water to adjust the ship’s draft in the water. Ballast water is increased when ships have little or no cargo in order to ride lower in the water, which increases manageability and safety and allows for maximum stability and sailing efficiency. Ballasts may be loaded or discharged to adjust a ship’s trim (balance), improve maneuverability, increase propulsion efficiency, reduce hull stress, raise the ship to pass over shallow areas, or lower the ship to pass under bridges or cranes. Ballast water enters a ship via intakes below the waterline and is
20 HSF Plants FAQ website. www.hawaiisuperferry.com/travel-information/faqs/baggage-carry-ons/plants/faqs.html.
Accessed July 5, 2007. 21 A link to the Executive Order was posted on the Governor’s website (www.hawaii.gov/gov, accessed on November 5,
2007). The conditions noted here are identified as related to Invasive Species and Cultural and Natural Resources.
2-27

CHAPTER 2 KAHULUI COMMERCIAL HARBOR 2030 MASTER PLAN EXISTING COMMERCIAL HARBOR FACILITIES AND OPERATIONS DRAFT ENVIRONMENTAL IMPACT STATEMENT
taken in and discharged either by pumping or gravitational flow. It may either be carried in dedicated tanks (segregated ballast water) or in the cargo holds (nonsegregated ballast water). The discharged ballast water may contain marine organisms and sediments taken in through the intakes which have accumulated in the ballast tanks. Ballast sediment, which includes particulates such as plankton and organic/inorganic detritus that have settled to the bottom of the tanks over time, is difficult to dispose of and often is removed when the vessel is in port or dry dock. Sediments in the ballast tanks may get stirred up when the tanks are refilled and the organisms in the sediment may get re-suspended and discharged when the tanks are emptied. Ships exchanging ballast water from areas outside of Kahului Commercial Harbor may introduce invasive species.
1 2 3 4 5 6 7 8 9
10 11
12 13 14 15 16 17 18 19 20 21 22 23 24
25 26 27 28 29
30 31 32
The DLNR-DAR is the designated lead agency for preventing the introduction of alien aquatic organisms and for carrying out the destruction of these organisms through the regulation of ballast water discharges and hull fouling organisms through Act 134 Sessions Law 2000, which subsequently became Chapter 187A, Part III, HRS, Alien Aquatic Organisms, and the State of Hawai‘i Aquatic Invasive Species Management Plan.22 On October 12, 2007, new regulations in HAR Title 13 Chapter 76, Non-indigenous Aquatic Species, were drafted. The new rules are intended to minimize the spread of non-indigenous aquatic organisms through ballast water management.23 These rules identify prohibited activities such as failure to follow a ballast water management plan, discharge of ballast water in state marine waters, or failure to submit a ballast water report form, unless exempted under the law as described in the rules. HAR 13-76 also outlines ballast water exchange, discharge, and reporting requirements.
In addition to the state rules, the USCG has developed a Mandatory Ballast Water Management (MBWM) program which requires all vessels equipped with ballast water tanks that took on ballast water less than 200 miles from any shoreline, entering U.S. waters from beyond the 200-mile Exclusive Economic Zone (EEZ),24 to “employ at least one of the following ballast water management practices:
1. Perform complete ballast water exchange in an area no less than 200 nautical miles from any shore prior to discharging ballast water in U.S. waters;
22 State of Hawai‘i, Department of Land and Natural Resources, Division of Aquatic Resources. September 2003. State of
Hawai‘i Aquatic Invasive Species (AIS) Management Plan. 23 Hawai‘i Administrative Rules. Title 13 Department of Land and Natural Resources Subtitle 4 Fisheries Part IV
Fisheries Resource Management Chapter 76 Non-indigenous Aquatic Species. 24 The EEZ is an area an area beyond and adjacent to the territorial sea, under which the rights and jurisdiction of the
coastal State and the rights and freedoms of other States are governed by the relevant provisions of the United Nations Convention on the Law of the Sea. www.un.org/Depts/los/convention_agreements/texts/unclos/part5.htm. Accessed September 14, 2007.
2-28

KAHULUI COMMERCIAL HARBOR 2030 MASTER PLAN CHAPTER 2 DRAFT ENVIRONMENTAL IMPACT STATEMENT EXISTING COMMERCIAL HARBOR FACILITIES AND OPERATIONS
2. Retain ballast water onboard the vessel; or 1
2 3 4
5 6 7 8 9
10 11 12
13
14 15
16 17
18
19 20 21 22 23 24 25 26 27
3. Prior to the vessel entering U.S. waters, use an alternative environmentally sound method of ballast water management that has been approved by the Coast Guard.”25
Mid-ocean ballast water exchange is the preferred management practice currently being employed for the majority of vessels. This is because retention of ballast water onboard a vessel may impede the ability to load cargo, and according to a May 2007 U.S. Environmental Protection Agency (EPA) fact sheet on performance verification of ship ballast water treatment technologies,26 it appears that on-going development of, and government verification of, alternative environmentally sound ballast water management is still in progress. Numerous technologies under development or being considered include the following types of treatment:
• Mechanical treatment methods such as filtration and separation.
• Physical treatment methods such as ozonation, deoxygenation ultra-violet treatment, electric pulse, and heat treatment.
• Biological and chemical treatment methods such biocides or hydrogen peroxide treatment.27
Hull Fouling
Hull-fouling organisms, such as diatoms, algae, bacteria (micro-sessile), mollusks, sea squirts, sponges, sea anemones, bryozoans, tubeworms, polychaetes, and barnacles (macro-sessile), may live on ship hulls and may be released into receiving waters through natural ocean currents, vessel draft, rubbing against harbor pilings, or running aground. While the September 2003 State of Hawai‘i Aquatic Invasive Species Management Plan recognizes that “[t]he greatest number of marine invertebrates have probably arrived in Hawai‘i through hull fouling…”28 the majority of trans-oceanic vessels enter harbors on O‘ahu and may not pose as much of a threat on neighbor islands.
25 Title 33, CFR Part 151.2035. 26 U.S. EPA. May 2007. Fact Sheet, Performance Verification of Ship Ballast Water Treatment Technologies and
Exchange Screening Technologies. 27 Global Ballast Water Programme, International Maritime Organization. 26-27 March 2001. Proceedings, 1st
International Ballast Water Treatment R&D Symposium. Ed. Steve Raaymakers. London. 28 State of Hawai‘i, Department of Land and Natural Resources, Division of Aquatic Resources. September 2003. State of
Hawai‘i Aquatic Invasive Species (AIS) Management Plan.
2-29

CHAPTER 2 KAHULUI COMMERCIAL HARBOR 2030 MASTER PLAN EXISTING COMMERCIAL HARBOR FACILITIES AND OPERATIONS DRAFT ENVIRONMENTAL IMPACT STATEMENT
The Alien Aquatic Organism Task Force (AAOTF), established by DLNR to address ballast water and hull fouling issues, has made recommendations to address hull fouling, including development of inspection protocols for use by USCG during vessel inspections, continuation of studies on the impact of nonnative aquatic organisms in Hawai‘i, and inclusion of ballast water and hull fouling issues in DLNR and DOA education and information programs.
1 2 3 4 5 6
7
8 9
10 11 12 13
2.3.5 Other Management Measures Affecting Vessel Operations Vessels operating in Hawai‘i harbors are subject to additional federal and state regulations on emissions into the air and water (under HRS Chapter 342D and regulations adopted by the Hawai‘i State DOH). Harbor conditions may be monitored in response to citizen complaints. Furthermore, under EO 07-10, large capacity ferry vessels may not discharge wastewater into the ocean, including but not limited to the coastal waters of the State of Hawai‘i.
2-30

ChApTER 3 Future Commercial Harbor Facility Requirements


CHAPTER 3 FUTURE COMMERCIAL HARBOR FACILITY REQUIREMENTS
1
2
3
4
5 6 7 8 9
10
11 12 13 14
15
16
17
18 19 20 21 22 23
3.1 METHODOLOGY
Several methods and tools are available for forecasting future cargo and passenger volumes at Kahului Commercial Harbor. These include historical data, socio-economic projections, anticipated changes in maritime technology, and changes in shippers’ reliance on the commercial harbor. Combining these tools, it is possible to forecast changes in demand and assess the level of flexibility that may be needed to respond to sudden or unanticipated changes.
It is not practical to expect precise forecasts of long-term demand. It is useful, however, to develop a reasonable estimate of future demand to enable prioritization, scheduling, funding, and implementation of projects to meet the anticipated demand in a timely manner.
3.2 CARGO AND PASSENGER THROUGHPUT PROJECTIONS
Summary of Cargo Throughput Projections
Two methods were used to forecast future cargo volumes. The first method uses historical cargo data; the second method uses historic and projected population growth to determine an annual growth rate for cargo throughput. Sections 3.2.1 and 3.2.2 provide further details for each method, with an evaluation of the analysis in Section 3.2.3. Table 3-1 shows a comparison of the resulting projections based on historical cargo data and on population growth forecasts.
3-1

CHAPTER 3 KAHULUI COMMERCIAL HARBOR 2030 MASTER PLAN FUTURE COMMERCIAL HARBOR FACILITY REQUIREMENTS DRAFT ENVIRONMENTAL IMPACT STATEMENT
Table 3-1. Summary Comparison of Cargo Throughput Projections Based on Historical Cargo Data and Population Growth Forecasts
1 2
Historical Cargo Data Population Growth
Cargo Category Unit FY95 FY05
Cargo Forecast
FY30
Annual Growth Rate FY05–FY30
Cargo Forecast
FY30
Annual Growth Rate FY05–FY30
Containers TEU 64,199 126,600 258,441 2.9% 223,523 2.3% Vehicles Tons 121,392 156,959 209,798 1.2% 227,739 1.5% Break-Bulk Tons 267,855 288,061 294,722 0.1% 508,599 2.3% Dry-Bulk Tons 532,721 706,497 665,231 −0.2% 1,247,387 2.3% Liquid-Bulk Tons 620,952 926,932 1,606,208 2.2% 1,344,928 1.5% TEU = twenty-foot equivalent unit 3
4 5 6
7
8 9
10 11 12 13 14 15
16 17 18 19 20 21 22
FY = fiscal year
Summary of Passenger Throughput Projections
For the analysis, passengers were separated into two groups: cruise ship and inter-island ferry passengers. For cruise ship passenger forecasts, a separate study was commissioned to analyze the Hawai‘i cruise market trends for Kahului (see Appendix C). This study looks at both historical trends and Maui’s potential capture of the Hawai‘i cruise market. Results from this analysis show that Kahului Commercial Harbor could expect between 452,000 to 613,000 cruise ship passengers by fiscal year 2030 (FY30).1 Section 3.2.4 provides further discussion of cruise ship passenger forecasts.
Since the inter-island ferry service started in December 2007, ferry passenger projections assume that the average vehicle and passenger demand (410 passengers, 110 vehicles)2 will be fully met starting in FY08. A second inter-island ferry vessel (anticipated to begin sometime in 2009) is expected to fully meet the average demand in FY10. By FY30, 256,000 ferry passengers would be going through Kahului Commercial Harbor. Section 3.2.5 provides further discussion of ferry passenger forecasts.
1 State of Hawai‘i, Department of Transportation, Harbors Division (DOT Harbors) fiscal year starts July 1 and ends
June 30. 2 Fehr & Peers/Kaku Associates, Inc. Kahului Harbor Master Plan Traffic Study – Appendix H of this EIS.
3-2

KAHULUI COMMERCIAL HARBOR 2030 MASTER PLAN CHAPTER 3 DRAFT ENVIRONMENTAL IMPACT STATEMENT FUTURE COMMERCIAL HARBOR FACILITY REQUIREMENTS
3.2.1 Cargo Throughput Projections Based On Historical Cargo Data
1 2
3 4 5 6 7 8 9
10 11 12 13 14 15
16 17
The annual cargo data collected between FY95 and FY05 were used to predict future throughput quantities for each type of cargo. The technique used to evaluate the existing data and predict future values is linear regression analysis, a statistical tool that models the relationship between variables by fitting a linear equation through the observed data. The model evaluates all the data, not just the beginning and end points, such that trends in the data can be used to predict future values. The data between FY95 and FY05 were analyzed and extrapolated to future years up to FY30. Table 3-2 provides a summary of the results for each of the cargoes discussed in the following sections, including known throughput quantities for FY95 and FY05, and projected quantities for FY30. Growth rates are shown for primary cargo categories: containers, vehicles, break-bulk, dry-bulk, and liquid-bulk cargoes. The actual growth rates from FY95 to FY05 and the projected growth rates from FY05 to FY30 are shown for comparison purposes.
Table 3-2. Kahului Commercial Harbor Cargo Forecasts and Growth Rates (Imports and Exports) Based on Historical Data, FY95 to FY30
Annual Growth Rate
Cargo Category Type Unit FY95 FY05 FY30
FY95–FY05
FY05–FY30
Containers TEU 64,199 126,600 258,441 7.0% 2.9% Vehicles Tons 121,392 156,959 209,798 2.6% 1.2% Break-Bulk Lumber Tons 9,528 6,884 11,608 Produce Tons 15,244 20,157 43,599 Livestock Tons 434 206 223 Other Tons 242,649 260,814 239,292 Total Tons 267,855 288,061 294,722 0.7% 0.1% Dry-Bulk Sugar Tons 175,960 190,192 102,102 Cement Tons 40,303 57,570 102,114 Scrap Metal Tons 7,471 6,525 3,649 Sand/
Gravel Tons 243,809 383,080 412,221
Coal Tons 65,178 69,130 45,144 Total Tons 532,721 706,497 665,231 2.9% −0.2%
3-3

CHAPTER 3 KAHULUI COMMERCIAL HARBOR 2030 MASTER PLAN FUTURE COMMERCIAL HARBOR FACILITY REQUIREMENTS DRAFT ENVIRONMENTAL IMPACT STATEMENT
Table 3-2. Kahului Commercial Harbor Cargo Forecasts and Growth Rates (Imports and Exports) Based on Historical Data, FY95 to FY30
(continued)
1 2 3
Annual Growth Rate
Cargo Category Type Unit FY95 FY05 FY30
FY95–FY05
FY05–FY30
Liquid-Bulk Total Petroleum*
Tons 561,590 852,795 1,537,903
Molasses Tons 55,125 70,189 66,715 Chemicals Tons 4,237 3,948 1,590 Total Tons 620,952 926,932 1,606,208 4.1% 2.2%
* Total petroleum is comprised of jet fuel, gasoline, diesel, liquefied petroleum gas (LPG), and fuel oil.
4 5 6 7
8 9
10 11
12 13 14 15 16 17 18 19
20 21 22
gories.) 23
Containers 24
ntainerized cargo volumes in-25 26 27 28 29
The results indicate that throughput of containers, vehicles, and liquid-bulk cargo will continue to increase through FY30, albeit at a slower rate of increase compared to FY95 to FY05. Break-bulk and dry-bulk cargoes will remain close to their current levels.
Historical cargo data between FY95 and FY05 were provided by the State of Hawai‘i, Department of Transportation Harbors Division (DOT Harbors). The data were sorted by commodity type and direction of movement (import versus export) for analysis purposes. The total volume of cargo moving through Kahului Commercial Harbor experienced significant growth between FY95 and FY05, with total throughput of approximately 2.1 million tons in FY95, expanding to over 3.0 million tons in FY05. However, some cargoes increased more than others, and some cargoes actually declined during the period.
The following provides a detailed breakdown and discussion of historical data throughput, between FY95 and FY05, for the major cargo categories. (Table 3-2 provides a summary of the historical data broken out by each major cargo category. Appendix D provides graphs for all the cargo cate
Statewide cocreased greatly over the past decade, and Kahului Commercial Harbor was no exception. Total Kahului Commercial Harbor container throughput, including imports and exports, both
Containers (TEUs)
0
26,000
Import Export
52,000
78,000
104,000
130,000
95 96 97 98 99 00 01 02 03 04 05
Total
FY
3-4

KAHULUI COMMERCIAL HARBOR 2030 MASTER PLAN CHAPTER 3 DRAFT ENVIRONMENTAL IMPACT STATEMENT FUTURE COMMERCIAL HARBOR FACILITY REQUIREMENTS
full and empty, increased from approximately 64,200 TEU to 126,600 TEU, for an annualized growth rate of 7.0 percent.
1 2
Vehicles 3
oughput experienced slow but steady growth during the period, with 4 5 6
Break-Bulk: Lumber, Produce, Livestock, Other Break-Bulk 7
erable variation 8 9
10
• Lumber declined from 9,528 to 6,884 tons. 11
12
ns. 13
an-container loads [LCL]) 14 15
TOTAL BREAK-BULK. Although there was considerable variation for some of the 16 17 18 19 20 21 22 23
Dry-Bulk: Sugar, Cement, Scrap Metal, Sand and Gravel, Coal 24
verall growth 25 26 27
• Sugar exports increased slightly from 175,960 to 190,912 tons, but FY05 28 29 30
• 303 to 57,570 tons. 31
Vehicle thrimports rising from 71,189 to 96,645 tons, and exports rising from 50,203 to 60,314 tons, for an overall growth of 2.6 percent per year.
Growth in break-bulk cargo volumes were mixed and showed considthrough the period, but still managed to show overall gain of 0.7 percent per year between FY95 and FY05. Individual break-bulk cargoes are summarized as follows:
• Livestock decreased from 434 to 206 tons.
• Produce increased from 15,244 to 20,157 to
• Other (uncategorized) break-bulk (primarily less-thwas consistent during the period and increased from 242,649 to 260,814 tons.
break-bulk cargoes, when viewed as a whole, growth was relatively consistent during the period. Total volume increased marginally from 267,855 tons in FY95, to 288,061 tons in FY05. After examining the data closely, it is apparent that the overall growth experienced at Kahului Commercial Harbor during the period was realized by cargoes other than break-bulk (e.g., containers). However, it is acknowledged that break-bulk is still a vital component of the harbor operation and needs to be accommodated in the future.
Dry-bulk cargo volumes were variable during the period and showed oof 2.9 percent per year between FY95 and FY05. The dry-bulk cargoes are summarized below:
exports were down compared to the period between FY98 and FY00 when volumes were in the 230,000-ton range.
Cement imports increased steadily from 40,
3-5

CHAPTER 3 KAHULUI COMMERCIAL HARBOR 2030 MASTER PLAN FUTURE COMMERCIAL HARBOR FACILITY REQUIREMENTS DRAFT ENVIRONMENTAL IMPACT STATEMENT
• Scrap metal exports were highly variable year to year and declined overall 1 2
• put (primarily export) declined for several years 3 4 5
• om 65,178 to 69,130 6 7
Factors complicating the projection of future dry-bulk demand are discussed in 8 9
ULK. Taken as a whole, dry-bulk cargoes experienced moderate growth 10 11 12 13 14
Liquid-Bulk: Jet Fuel, Gasoline, Diesel, LPG, Fuel Oil 15
95 to FY05, with an 16 17
18
s. 19
20
21
ns. 22
PETROL oleum imports 23 increased from 560,613 tons in FY95 to 24
25 26 27 28 29 30
OLASSES, CHEMICALS. Liquid-bulk 31 e the following: 32
from 7,471 to 6,525 tons.
Sand and gravel throughfollowing FY97 but has increased since FY02 to a record high in FY05, and shows an overall increase from 243,809 to 383,080 tons.
Coal imports have been variable and increased overall frtons.
Section 3.2.3.
TOTAL DRY-Bof 2.9 percent per year from 532,721 tons in FY95, to 706,497 tons in FY05. As with break-bulk, dry-bulk cargoes were not a primary driver in the growth experienced at Kahului Commercial Harbor between FY95 and FY05, but continue to play an important role in the harbor and need to be accommodated in future years.
Liquid-bulk cargoes have shown consistent growth from FYannualized growth rate of 4.1 percent. Individual cargoes are summarized as follows:
• Jet fuel imports increased from 50,887 to 200,445 tons.
• Gasoline imports increased from 174,943 to 252,349 ton
• Diesel imports increased from 197,045 to 288,211 tons.
• LPG imports increased from 13,480 to 15,403 tons.
• Fuel oil imports decreased from 123,586 to 95,291 to
EUM. Overall, total petr
851,699 tons in FY05, for an annual growth rate of 4.3 percent. The records also indicate some exports of petroleum products during the period, but these were sporadic and insig-nificant in terms of quantities, so they are not reflected in the throughput quantities above.
LIQUID-BULK OTHER THAN PETROLEUM: Mcargoes other than petroleum products includ
Petroleum (Tons)900,000
0
150,000
300,000
450,000
600,000
750,000
95 96 97 98 99 00 01 02 03 04 05
Import Export Total
FY
3-6

KAHULUI COMMERCIAL HARBOR 2030 MASTER PLAN CHAPTER 3 DRAFT ENVIRONMENTAL IMPACT STATEMENT FUTURE COMMERCIAL HARBOR FACILITY REQUIREMENTS
• Molasses exports increased from 55,125 tons in FY95 to 92,763 tons in FY00, but have decreased since then and leveled off at 70,189
1 tons in FY05. 2
3 4
TOT 5 a whole rom 6 620,952 tons in FY95 to 926,932 tons in 7
8 9
10 11 12 13
3.2.2 Growth 14
Another common method of forecasting cargo and passenger volumes is to assume 15 ui 16 u-17
18 19 20 21 22 23 24
25 26
• Imports of chemicals were mixed during the period and showed a slight decline from 4,237 to 3,948 tons.
AL LIQUID-BULK. Liquid-bulk cargoes as have shown consistent growth f
FY05, for an annual growth rate of 4.1 percent. As illustrated in the sections above, the quantities and growth experienced during the period are principally a result of petroleum imports (92 percent in FY05), with little impact from exports (molasses) or other no
Cargo Throughput Projections Based on Population
n-petroleum products.
that growth in throughput will be tied to population or economic growth. For MaCounty, population can be further subdivided by residents, visitors, and de facto poplation. De facto population is defined as the number of persons physically present in an area regardless of their usual place of residence. This includes visitors present but excludes residents temporarily absent. The population and economic projections for the state and counties were developed by the State Department of Business, Economic Development and Tourism (DBEDT). The analysis uses at least 20 years of historical data with models of the state and county-level economies. Estimates from the 2030 Series projections by DBEDT are shown in Table 3-3.
Table 3-3. Historic and Projected Maui County Population Growth, FY95 to FY30
Year(s) Maui
Residents Visitors De Facto
Population County Output
($ million) FY95 117,895 155,144 39,701 FY00 128,968 41,934 168,540 6,535 FY05 140,050 46,923 181,850 7,340 FY10 151,300 51,781 197,550 8,309 FY20 174,450 61,781 229,700 10,413 FY30 199,550 71,370 263,500 12,958
Total Liquid-Bulk
0
200,000
400,000
600,000
800,000
1,000,000
95 96 97 98 99 00 01 02 03 04 05
Import Export Total
FY
3-7

CHAPTER 3 KAHULUI COMMERCIAL HARBOR 2030 MASTER PLAN FUTURE COMMERCIAL HARBOR FACILITY REQUIREMENTS DRAFT ENVIRONMENTAL IMPACT STATEMENT
Table 3-3. Historic and Projected Maui County Population Growth, 1 FY95 to FY30 (continued) 2
Year(s) Maui
Residents De Facto County Output
Visitors Population ($ million)
Average Annual Growth FY95–FY00 1.8% 1.1% FY00–FY05 1.7% 2.3% 1.5% 2.4% FY05–FY30 1.4% 1.7% 1.5% 2.3%
Source: State of Hawai‘i, DBEDT. 2004, Population and Economic Projections for the State of 3 Hawaii to 2030. 4 5 6
For each of the primary cargo categories, the applicable growth rate from Table 3-3 7 was used to project future cargo throughput. Containers, break-bulk, and dry-bulk 8 were assumed to follow the overall economy of Maui County, so the growth rate of 9 2.3 percent was used for these cargoes. Vehicles and liquid-bulk were assumed to 10 follow the de facto population; therefore, 1.5 percent was used for these projections. 11 The projections based on population and economic growth are summarized in Table 12 3-4. 13
Table 3-4. Kahului Commercial Harbor Cargo Forecasts and Growth 14 Rates Based on Population Growth FY05 to FY30 15
Annual Growth Rate
Cargo Category Type Unit FY05 FY30 FY05–FY30
Containers TEU 126,600 223,523 2.3% Vehicles Tons 156,959 227,739 1.5% Break-Bulk Lumber Tons 6,884 12,154 Produce Tons 20,157 35,589 Livestock Tons 206 364 Other Tons 260,814 460,492 Total Tons 288,061 508,599 2.3% Dry-Bulk Sugar Tons 190,192 335,802 Cement Tons 57,570 101,645 Scrap Metal Tons 6,525 11,521 Sand/Gravel Tons 383,080 676,364 Coal Tons 69,130 122,056 Total Tons 706,497 1,247,387 2.3%
3-8
KAHULUI COMMERCIAL HARBOR 2030 MASTER PLAN CHAPTER 3 DRAFT ENVIRONMENTAL IMPACT STATEMENT FUTURE COMMERCIAL HARBOR FACILITY REQUIREMENTS
T1 Rates Based on P o FY30 (continued) 2
able 3-4. Kahului Commercial Harbor Cargo Forecasts and Growth opulation Growth FY05 t
Annual Growth Rate
Cargo Category Type Unit FY05 FY30 FY05–FY30
Liquid-Bulk Total P m Tons 852,795 1,237,359 etroleu Molasses Tons 70,189 ,840 101 Chemicals Tons 3,948 ,728 5 Total Tons 926,932 1,344,928 1.5%
3
3.2.3 4
5 6 7 8 9
ns for intermediate years FY10 and FY20, in addition to the FY30 projections. 10
11 12
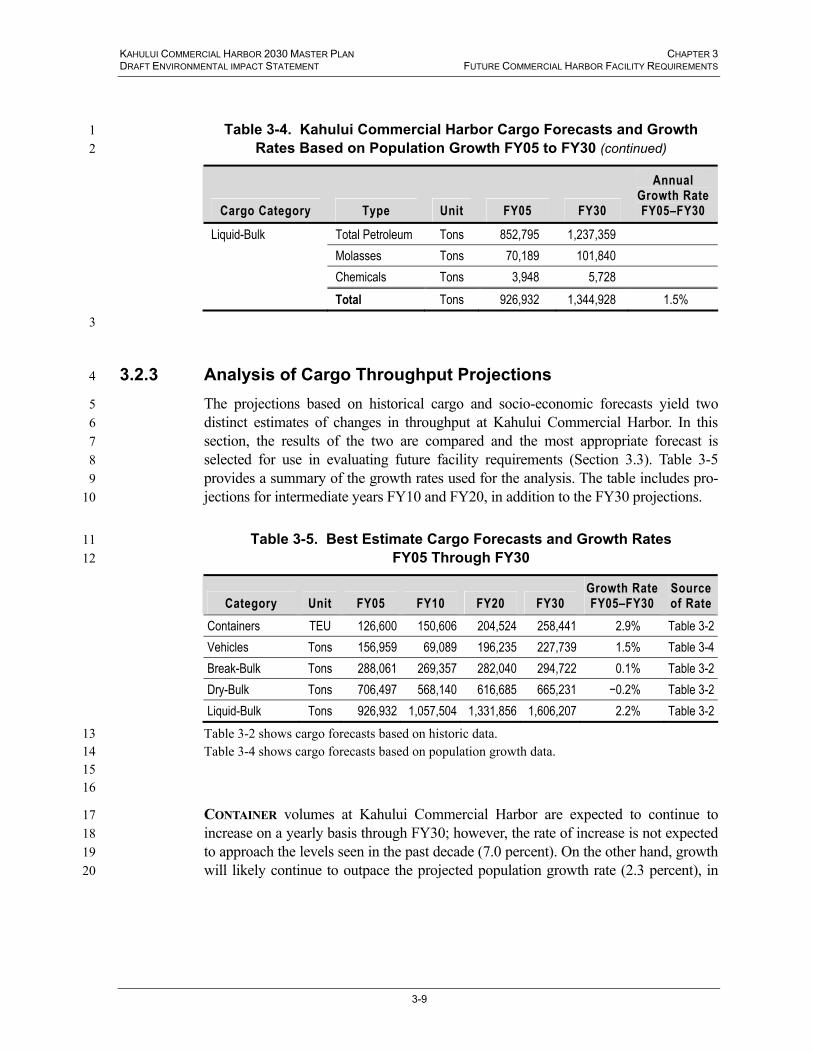
Analysis of Cargo Throughput Projections The projections based on historical cargo and socio-economic forecasts yield two distinct estimates of changes in throughput at Kahului Commercial Harbor. In this section, the results of the two are compared and the most appropriate forecast is selected for use in evaluating future facility requirements (Section 3.3). Table 3-5 provides a summary of the growth rates used for the analysis. The table includes pro-jectio
Table 3-5. Best Estimate Cargo Forecasts and Growth Rates FY05 Through FY30
Category Unit FY05 FY10 FY20 FY30 Growth Rate
Y30 Source of Rate FY05–F
Co U 1ntainers TE 26,600 150,606 204,524 258,441 2.9% Table 3-2Vehicles Tons 156,959 69,089 196,235 227,739 .5% 3-4 1 TableBreak-Bulk Tons 288,061 269,357 282,040 294,722 .1% 3-2 0 TableDry-Bulk Tons 706,497 568,140 616,685 665,231 .2% Table 3-2−0Liquid-Bulk Tons 32 926,9 1,057,504 1,331,856 1,606,207 .2% Table 3-22
Table 3-2 shows cargo f sed on historic data. 13 Table 3-4 shows cargo f s based on p on g14 15 16
C AINER volumes at Kahului Com ial H are e to contin to 17 i ease on a yearly b h FY3 ever, the rate of increase is not expected 18 to approach the levels past d (7.0 t). O er hand, gr wth 19 will likely continue to ro pop grow 2.3 percen in 20
orecasts baorecast opulati rowth data.
ONT merc arbor xpected uencr asis throug 0; how
seen in the ace the p
ecade percenu
n the oth o outp jected lation th rate ( t),
3-9

CHAPTER 3 KAHULUI COMMERCIAL HARBOR 2030 MASTER PLAN FUTURE COMMERCIAL HARBOR FACILITY REQUIREMENTS DRAFT ENVIRONMENTAL IMPACT STATEMENT
par n 1 cargo gr lanning 2 purposes. 3
VE s base rgo gr d p tion gr de f 4 grow erc ent per ear ra5
B K-BULK cargoes g lumbe duce, ck, a imarily 6 cargo), are expected t gligible (0.1 percen ual inc based on cargo 7 growth, or moderate ( rcent) incr base pul th. Si rgo 8
being increasingly containerized, it is unlikely that break-bulk will see much of an 9 increase. However, LCL and other break-bulk cargoes have shown resilience over the 10 past decade, so for planning purposes, the projection based on cargo growth (0.1 11
12
13 14 15 16
n 17 increasing production of packaged sugar that would be exported in containers 18 rath r than 19 present levels. Successful r as a branded product could 20 lead to completely phasing out bulk sugar operations. Also, 21
ld p e a lan et f ar c22
ND GR A dy ep th ty of in 23 06.4 Ac ng stu d r for odu 24 te, bot a ‘a d se sser extent fo 25
each re hm s o s unt us 26 basis, di o o aui a 44, 27
barges containing approximately 28 per week leaving Maui. 29
eviously available on 30 Maui are dwindling due to development on existing dunes, preservation of 31 selected dunes, the available sites being mined by concrete companies, and sand 32
33
t because it is more efficient than break-bulk operations.3 The projection based oowth, with an annual growth rate of 2.9 percent, will be used for p
HICLE projectione 1.2 p
d on ca owth an opula owth ( acto) indicateth in th ent to 1.5 perc y nge.
REA , includin r, pro livesto nd other (pr LCLo have ne t) ann reases1.5 pe eases d on po ation grow nce ca
is
percent) will be used.
DRY-BULK cargoes include sugar, cement, scrap metal, sand, gravel, and coal, and represent both imports and exports. All of these cargoes have shown historical variations and are subject to market conditions that may have a significant impact on future volumes, particularly sugar and sand, which are discussed below.
SUGAR. Hawaiian Commercial & Sugar Company (HC&S) is interested i
er than as bulk sugar. This would result in a lower volume of bulk sugamarketing of Maui Suga
ethanol production onMaui cou rovid n on-is d mark or sug ane.
SAND A AVEL. sand stu was pr ared for e Coun Maui Februaryof 20 cordi to the dy, san is prima ily used the pr ction ofconcre h on M ui and O hu. San is also u d to a le r backfilland b plenis ent. The tudy als quantifie the amo of sand ed on anannual inclu ng appr ximately 74,000 t ns on M nd 2 000 tonsexported to O‘ahu. The sand is exported by4,000 tons, resulting in an average of one barge Conclusions of the study indicate that the sand resources pr
resources needed for future beach replenishment projects. The study estimates that
hers Ltd. has announced plans to end LCL service in the next few years. Whether Young Brothers or others date smaller loads into containers is unknown. The projections made here reflect the cost of different ways
3 Young Brotwill consoliof handling cargo demand, not a policy preference or the actions of a single operator.
4 County of Maui, Department of Public Works and Environmental Management. February 2006. Maui Inland Sand Resource Quantification Study. Maui, Hawaii.
3-10

KAHULUI COMMERCIAL HARBOR 2030 MASTER PLAN CHAPTER 3 DRAFT ENVIRONMENTAL IMPACT STATEMENT FUTURE COMMERCIAL HARBOR FACILITY REQUIREMENTS
the available supply will only last another five to six years. Consequently, sand export is expected to decline.
1 2
Based on the uncertainty associated with sugar exports and the future prospects for 3 4
n cargo growth (−0.2 percent) 5 will be used. 6
7 8 9
10 11
Transportation of petroleum products is part of a systematic problem statewide, and 12 13 14 15
e ethanol, 16 biodiesel, and their feedstocks. 17
Eth18 attr19 hav20 is d21 dec , using a combination of 22 local and imported feedstocks, demand for imported fuel would still decrease, but raw 23 feed24 Har25
A b26 oil f27 oil 28 In 29 rou30 be 31 sign32 wou33
34 35
sand and gravel, dry-bulk throughput is not likely to increase in future years. Therefore, for planning purposes, the projection based o
LIQUID-BULK cargoes include jet fuel, gasoline, diesel, LPG, fuel oil, ethanol, molasses, and chemicals. All of these cargoes, except molasses, are primarily imports. Petroleum products make up the overwhelming majority of these imports. With the exception of fuel oil, petroleum products have shown consistent growth in the past and are expected to continue their growth trend.
DOT Harbors is currently undertaking a Statewide Fuel Facilities Development Plan,5 which includes Kahului Commercial Harbor. In developing the plan, it became apparent that not only will the quantities of fuel continue to increase in the future, but also the variety of fuels will become more diverse. Specific examples includ
anol is an alcohol-based fuel that can be made from sugar cane, which makes it active for use in Hawai‘i. Plans to develop ethanol production facilities on Maui e not materialized, so there is currently no impact on the harbor. If an ethanol plant eveloped using local feedstocks, the demand for imported fuel to Maui would rease. On the other hand, if an ethanol plant is developed
stock would then be imported, resulting in new activity at Kahului Commercial bor.
iodiesel production plant on Maui is planned to start operations in 2009. Vegetable eedstock would be imported for production of biodiesel. Ultimately, locally grown
products could be used to produce biodiesel, but this is a long-term consideration. the near- to mid-term, the volume of vegetable oil feedstock would increase ghly as the volume of imported diesel decreases. Also, methanol would likely also imported as a catalyst for biodiesel production. Although there would not be a ificant change in volume, a dedicated transmission pipeline for feedstock products ld be necessary if the existing molasses pipeline at Pier 1B is not available.
Overall, liquid-bulk throughput is expected to increase annually by 2.2 percent based on cargo growth and 1.5 percent based on population growth. Although the future of
State of Hawai‘i, DOT Harbors. Unpublished. S5 tatewide Fuel Facilities Development Plan.
3-11

CHAPTER 3 KAHULUI COMMERCIAL HARBOR 2030 MASTER PLAN FUTURE COMMERCIAL HARBOR FACILITY REQUIREMENTS DRAFT ENVIRONMENTAL IMPACT STATEMENT
biof1 reas olume estimate. Therefore, the growth rate based on 2 cargo growth will be used. 3
3.2.4 4
ip passenger projections, a separate market study (Appendix C) was 5 mmi ned 6
7 8
9 er volumes in the Hawai‘i region and in 10
11
12
3.2.4.1 13
for Kahului 14 15 16 17 18 19 20 21 22
ting of in-transit passengers was not consistent on a yearly basis. However, 23 24 25
26 27 28 29 30 31
32 33
was struggling, other cruise lines increased their visits to Hawai‘i. Foreign cruise ship 34 4,000 passengers in 35
uels is uncertain, the growth rates are expected to be significant enough to make it onable to plan for the higher v
Cruise Ship Passenger Projections For cruise shco ssio to evaluate the Hawai‘i cruise market and determine throughput projections through FY30. The study primarily used two methods to project passenger throughput for Kahului Commercial Harbor:
• Development of an unconstrained passenger forecast through market analysis based on historic growth of passengKahului.
• Market capture analysis for Kahului within the Hawai‘i sub-sector.
Cruise Passenger Throughput FY95 Through FY05
Cruise passenger records Commercial Harbor between FY95 and FY05 were analyzed to determine the actual annual passenger throughput. Passengers from foreign and domestic vessels that embark or disembark at Kahului were counted twice for revenue purposes, whereas inter-island cruise passengers using Kahului as a port-of-call (in-transit passengers) were only counted once. The analysis was complicated by the fact that reporonce the inter-island vessels were separated from the foreign vessels, a pattern of steady growth in passenger throughput became evident.
Based on the analysis, passenger volumes at Kahului Commercial Harbor were relatively stable between FY95 and FY00, with a typical annual total of 45,000 to 55,000 passengers (except FY96). The volumes increased steadily from 52,973 in 2000 to 147,450 in FY05. The annual growth rate between FY95 and FY05 was 12.5 percent; however, between FY00 and FY05, the growth rate was much higher at 22.7 percent.
Within that time period between FY00 and FY05, Hawai‘i witnessed in 2001 the closing of its only inter-island carrier, American Hawaii Cruises. While that operator
passengers visiting Kahului Commercial Harbor increased from
Total Cruise Passengers (Passengers)
0
40,000
80,000
120,000
160,000
95 96 97 98 99 00 01 02 03 04 05
Inter-Island ShipsForeign ShipsTotal
FY
3-12

KAHULUI COMMERCIAL HARBOR 2030 MASTER PLAN CHAPTER 3 DRAFT ENVIRONMENTAL IMPACT STATEMENT FUTURE COMMERCIAL HARBOR FACILITY REQUIREMENTS
FY01 to 114,000 passengers in FY04. In 2004, NCL America, the Hawai‘i-based subsidiary of Norwegian Cruise Line (NCL), entered the inter-island market and currently operates three U.S.-f
1 2
lagged ships in Hawai‘i. These are the Pride of Aloha, 3 Pride of America, and Pride of Hawaii.6 Even though the mix of cruise ship operators 4 and the number of Hawai‘i-based ships have varied over the past decade, demand for 5
reasing since FY95 (see Appendix C 6 7
3.2.4.2 8 9
Acc10 projecte11 growth 9 percent. Using a lower growth rate of 1.7 percent results in a 12 throughpu based on 13 mod se industry 14 trends, average vessel size and destination growth, and regional trends in Hawai‘i. As 15
ditions (supply and 16 ections. A benefit of 17
18 ese projections are based on historical 19 ing dependent on the number of ships 20
, although there were practically no 21 00 and FY05, the growth rate did 22
ovides a summary of FY30 throughput 23 24
25 26
Hawai‘i cruises remains and has been steadily incfor the Hawai‘i cruise market study).
Cruise Passenger FY30 Throughput Based on Historical Growth Rate
ording to the 2007 Kahului Cruise Market Study,7 passenger throughput is d to reach 592,000 passengers by FY30. This result is based on an annual rate of 2.
t of 452,000 passengers by FY30. These growth rates are ifying the historical passenger growth by taking into consideration crui
the cruise industry is highly dependent on changing market condemand), it is useful to look at both high and low ranges for projestimating a higher growth rate helps in the plawould be needed in a “worst case” scenario. Thtrends in total passenger demand rather than behomeported in Hawai‘i. As described previouslyHawai‘i-based cruise operations between FYincrease 23 percent in those years. Table 3-6 prbased on historical growth of passengers.
Table 3-6. Growth Rate Analysis of Kahului Cruise Market Through FY30
nning process to see what facilities
FY00 Annual Growth Rate
FY06 FY30 FY07–FY30 451,673 1.7%
Passengers 52,973 263,017 517,108 2.3% 591,555 2.9%
Source: Bermello Ajamil & Partners. March 2007. 2007 Kahului Cruise Market Study.
27 28 29
7, NCL announced that the Pride of Hawaii will be transferred to NCL’s European routes in 2008.
jamil and Partners, Inc. March 2007. 2007 Kahului Cruise Market Study.
6 In April 2007 Bermello A
3-13

CHAPTER 3 KAHULUI COMMERCIAL HARBOR 2030 MASTER PLAN FUTURE COMMERCIAL HARBOR FACILITY REQUIREMENTS DRAFT ENVIRONMENTAL IMPACT STATEMENT
3.2.4.3 1 2
3 4 5 6
to Kahului are approximately at 85.6 percent 7 passenger occupancy levels. For comparison, cruise ships in the Caribbean (U.S. east 8
low 9 ket 10
rate, 59 and 69 percent respectively, Kahului can expect from 525,000 to 11 12 13
14
Cruise Passenger FY30 Throughput Based on Market Capture Analysis
A second method provided in the cruise market study for projecting future passenger throughput is based on market capture. Market capacity is limited by the overall potential passenger capacity of vessels sailing through Hawaiian waters. An annual growth rate of 2.3 percent results in a capacity of 889,000 passengers by FY30 for the Hawai‘i region. Cruise ships sailing
coast) market typically sail at 97 to 104 percent occupancy. This comparatively rate in Hawai‘i allows for considerable growth potential. Using a low and high marcapture613,000 passengers by FY30. Table 3-7 shows the FY30 throughput using three different growth rates (low, medium, and high).
Table 3-7. Kahului Market Capture Analysis Through FY30
FY00 FY06 Market Capture Rate FY30 59% 524,557
Passengers 52,973 263,017 64% 569,010 69% 613,464
Source: Bermello Ajamil & Partners. March 2007. 2007 Kahului Cruise Market Study.
Inter-island Ferry Passenger P
15 16 17
3.2.5 rojections 18
Inter-isla s a new 19 service, cur 20 historical data to analyze. In orde ojections through FY30, several 21 assumptions were made: 22
• The inter-island ferry ship will arri e at Commerci bor once per 23 da arri e o M. T ice will be able Sunday 24 through Saturday (sev days a week with 52 weeks to th r). The ferry 25
26
• cond inter-island ferry vessel will begin operations sometime in 2009 27 nd call at Kahului Commercial Harbor with the same daily service schedule 28
as the first ferry. Its expected arrival time is late night. For planning purposes, 29 projections for this ferry assume that the average load, 110 vehicles and 410 30
nd ferry service started regular operations in December 2007. As this irently operating under close government supervision, there are no
r to determine pr
v Kahului al Hary with an val tim f 9:30 A he serv avail
en e yea8will carry an average load of 110 vehicles and 410 passengers.
The sea
8 CH2MHill. November 2006. Traffic Study for Kahului Ferry Terminal.
3-14

KAHULUI COMMERCIAL HARBOR 2030 MASTER PLAN CHAPTER 3 DRAFT ENVIRONMENTAL IMPACT STATEMENT FUTURE COMMERCIAL HARBOR FACILITY REQUIREMENTS
passengers, will be met starting in FY10. (The ferry can carry a maxim282
um of 1 passenger vehicles and 866 passengers.) 2
3
4
• Demand for ferry traffic is treated as stable and met as of FY10.
Table 3-8. Inter-island FY30 Projections
Category Unit FY08 FY10 FY30
Inter-island Ferry #1 Passengers Each 149,240 149,240 149,240 Inter-island Ferry #2 Passengers Each not applicable 149,240 149,240 TOTAL 149,240 298,480 298,480
5
3.3 PROJ6
3.3.1 Functional equirements Model 7
To provide a basis for planning and progra ming of future facilities, an operations/ 8 planning meet 9 projecte isting 10 and fut haracteristics were applied to the analysis to determine the required 11 number gth, and draft of future berths. The model was also used to determine open 12 and covered storage requirements for containers/general cargo, vehicles, and break-13
14
15 16 17
• Navigational access, 18
• 19
• 20 21
22
• 23
For this analysis, the model evaluates the two primary 24 elements of capacity: berth transfer and storage require-25
ECTED 2030 FACILITY REQUIREMENTS
Rm
model was used to calculate berth and storage requirements tod cargo and passenger demand throughput over the forecast period. Ex
e ship cur, len
bulk cargo.
A critical factor in maritime facility planning is the need to maintain a balance between the major elements that deter-mines terminal capacity, which include:
berth transfer: transfer of cargo to and from the vessel and the berth.
gate transfer: the procedures and duration for cargo entering or leaving the termin l ar
Berth transfer,
Cargo handling and storage area (both open and covered) requirements, a ea through
the entrance/exit gates.
remote transfer: the distance from the berth to the storage area.
• Gate transfer, and
Remote (off-port) transfer.
3-15

CHAPTER 3 KAHULUI COMMERCIAL HARBOR 2030 MASTER PLAN FUTURE COMMERCIAL HARBOR FACILITY REQUIREMENTS DRAFT ENVIRONMENTAL IMPACT STATEMENT
ments. 1 address es the highest capacity values; 2 howeve link. This is 3 typi l cy and cargo 4 dwell times. 5
The analysis uses a model that links the forecasted growth of primary cargo categories 6 to the req ements mo tin prod para are on 7 e atio aila indu dard ed t cal 8 con del ppor nity impacts of changes in 9 o tivity plits no o les re 10 f al requirements of the port. 11
3.3.2 Berth Requirements 12
13 in Section 3.2 were translated into berth requirements for 14
ased on 15 inputs to 16
17
18
19
20
lost for non-operational reasons (weather, work 21 22
23
r ship, 24
U (containers), 25
ctors, and 26
27
Som o categories were combined since they shar28 instance, th load-on/load-off (LO/LO) a29 (RO O vehicles and are handled simila30 combined in the analysis. The remaining cargo categories include31
pace, their require-32
Once these are evaluated, the remaining elements of capacity can then be ed. The berth simulation model often providr, the actual capacity of a terminal is controlled by the weakest
cal y the storage area, which in turn is dependent on handling efficien
uir del. Opera g and uctivity meters based xisting port inform n, where av ble, or stry stan s modifi o suit lo
ditions. The moperations, produc
offers the o, cargo s
tu, tech
to evaluate logy, and w rking ru on futu
unction
The cargo and passenger throughput projections developed dwell time: the amount of time a container
each of the primary cargo and passenger categories boperating and productivity parameters. The various the model include:
• ship working time at berth,
• daily working hours,
• berth occupancy factors,
• time
spends in the terminal.
gangs: a unit of workers employed to load and unload cargo from ships.
restow: reloading or relocating cargo.
stoppages, etc.),
• average moves/tons per hour,
• number of cranes/gangs pe
• average weight per TE
• cargo restow fa
• peaking and congestion factors.
e f the primary cargo e berth space. For containerized cargo, bo
/R ), share berth space with nd roll-on/roll-off rly, so they were break-bulk, dry-
bulk, and liquid-bulk. Although these cargoes may share berth s
3-16

KAHULUI COMMERCIAL HARBOR 2030 MASTER PLAN CHAPTER 3 DRAFT ENVIRONMENTAL IMPACT STATEMENT FUTURE COMMERCIAL HARBOR FACILITY REQUIREMENTS
ments for handling and storage are very different. Passenger categories are also addressed separately.
Table 3-9 summarizes the berth requirements from FY05 through FY30 for primary
1 2
3 cargo and passenger categories: 4
5 Table 3-9. Berth Requirements to Meet Throughput Projections
Fiscal Year
Cargo/Use Category FY05 FY10 FY20 FY30
Containers and Vehicles 1.50 1.68 2.24 2.80 Break-Bulk 0.82 0.77 0.81 0.84 Subtotal: General Cargo Berths 2.32 2.45 3.05 3.64 Dry-Bulk 1.25 1.01 1.08 1.14 Liquid-Bulk 1.08 1.26 1.59 1.93 Subtotal: Dry- and Liquid-Bulk Berths 2.33 2.27 2.67 3.07 Subtotal: Cargo Berths 4.65 4.72 1 5.71 6.7Rounded 5 5 6 7 Cru P 1 1 2 2 ise assenger Inter-island 1 1 1 1 Ferry S to 2 2 3 ub tal: Passenger Berths 3 To 7 7 10 tal Berths 9
6 7
In addit e total berth length is a critical consideration for 8 devel pm ents. For each type of cargo and passenger 9 cate call at Kahului Commercial Harbor. The 10 bert g valuate the various sizes of vessels for 11 each type Table 3-10, which shows the average 12 vess ize for each cargo and passenger category, including 13 the req ach. The average vessel size is actually a 14 weighted averag by each vessel. 15
ion to the number of berths, tho ent of future facility requirem
gory, a variety of different vessels hin records for FY06 were reviewed to e
. This information is summarized inel size and maximum vessel s
uired mooring allowance for ee based on the number of calls made
3-17

CHAPTER 3 KAHULUI COMMERCIAL HARBOR 2030 MASTER PLAN FUTURE COMMERCIAL HARBOR FACILITY REQUIREMENTS DRAFT ENVIRONMENTAL IMPACT STATEMENT
Table 3-10. Berth Length by Category 1
Average Maximum
argo Type LOA (feet)
MA (feet)
Adjusted LOA (feet)
LOA (feet)
MA (feet)
Adjusted LOA (feet) C
Auto ship 428 100 528 579 679 100 Container/G 100 350 100 450 eneral 325 Cargo Barge
425
Container Ship 800 200 1,000 826 200 1,026 Cruise Ship 886 200 1,086 965 200 1,165 Dry-Bulk Ship 237 100 3 6 2 8837 85 00 5 Inter-Island Ferry 355 400* 755 355 400 755 Liquid-Bulk Barge 295 100 3 3 1 4295 28 00 8 Liquid-Bulk Ship** 420 120 540 521 200 721 Military Vessel 198 80 2 3 1 4778 78 00 8 Other/Break-Bulk 394 100 494 497 100 597 Tug 115 50 165 135 50 185
L rall 2 M3 * arge/ramp for ferry loading 4
* Includes propane and fuels 5 6 7
8 9
10 11 12
30 13
OA = length oveA = mooring allowance
Includes b*
Vessel sizes have increased over the years, so it is reasonable to assume that the average vessel size will continue to increase over the forecast period. Therefore, for the purpose of estimating berth length requirements for FY30, the maximum length is used, as it is a better indicator of future needs than the average length. This is summarized in Table 3-11.
Table 3-11. Berth Requirements Summary for FY
Vessel Length Berth Number Total Berth Cargo Category Type (LOA) Length of Berths Length
Container/General Cargo Barg 0 ft 450 ft 900 e 35 2 Container/Auto Shi 82 026p 6 ft 1, ft 1 1,026 Bre Ba 3 50ak-Bulk rge 50 ft 4 ft 1 450 Dry-Bulk Shi 558 758 p ft ft 1 758Liquid-Bulk Barg 328 428 e ft ft 1 428Liquid-Bulk Ship 521 ft 200 ft 1 721 Subtotal: Cargo 7 4,283
3-18

KAHULUI COMMERCIAL HARBOR 2030 MASTER PLAN CHAPTER 3 DRAFT ENVIRONMENTAL IMPACT STATEMENT FUTURE COMMERCIAL HARBOR FACILITY REQUIREMENTS
Table 3-11. Berth Requirements Summary for FY30 (continued) 1
Vessel Length Berth Number Total Berth Cargo Category Type (LOA) Length of Berths Length
Cruise Passenger CruiSh
965 1,165se ip
ft ft 2 2,330
Inter-Island Ferry Fer 355 ft 355 ry * ft* 1 355Subtotal: Passenger 3 2,685 Total 1 0 6,968
L rall 2 ft = feet 3
s no longer needed. 4 5 6
and berth lengths are listed separately, in some cases it 7 ay be possible to share berth space depending on availability. For instance, cruise 8
essels currently share berth space with cargo vessels at Pier 1. Providing a second 9 10 11
3.3.3 12
The cargo throughput projections developed in Section 3.2 were used to determine 13 open and co indices and 14 dwell times appropriate for l co s. Inp is mo clud15
• , 16
od, 17
age densities, 18
pe of equipment, an19
king and congesti ctors. 20
Cargo Containers 21
For containerized cargo, input to the model is further broken down to include imports 22 and exports, full and empty containers, distribution of 20-, 40-, and 45-foot units, 23 reefers, and out-of-service units. Output from the model includes open storage area 24 requirements for full containers, empty containers, reefers, and out of service units (or 25 chassis storage). These areas are summed to arrive at the net container yard area, and a 26 factor is applied (20 percent) to account for terminal circulation, entry gates, and the 27
OA = length ove
* Assumes barge/ramp i
Although the number of berths mvcruise berth may be avoided or delayed if cruise vessels are allowed to share berth space with cargo vessels in the future. Refer to Chapter 4 for further discussion.
Storage Requirements
vered storage needs by cargo category, using storage densitythe loca ndition uts to th del in e:
cargo dwell times
• storage meth
• stor
• ty d
• pea on fa
3-19

CHAPTER 3 KAHULUI COMMERCIAL HARBOR 2030 MASTER PLAN FUTURE COMMERCIAL HARBOR FACILITY REQUIREMENTS DRAFT ENVIRONMENTAL IMPACT STATEMENT
irregul uired. 1 The result of this analysis is n T 12. 2
ble 3-12. iner Req ents b ear 3
ar shape of the operational areas to calculate the total terminal area reqshown i able 3-
Ta Conta Yard uirem y Y
Containers
Year Full Empty
Out of Service Total Reefers Net CY
(ac) Total (ac) Chassis Terminal
(ac) (ac) FY05 6.7 11.8 18.5 2.3 0.2 1.0 2 25.2 FY10 8.0 14.0 22.0 2.7 0.2 24.9 29.9 FY20 10.9 19.0 29.9 3.7 0.3 33.9 40.6 FY30 13.8 24.0 37.8 4.7 0.3 42.8 51.4
CY = container yard 4 c = acres 5
6 7
8 9
Vehicles 10
ed to calculate required areas for imports and 11 12 13
Table 3-13. Vehicle Storage Requirements by Year 14
a
As shown in the table, the required container storage area would double over the forecast period, from 25.2 acres in FY05 to 51.4 acres in FY30.
For vehicle storage, the model was usexports, including their respective dwell times and typical storage densities. Results of this analysis are shown in Table 3-13.
Year Import Exports Total FY05 6.3 ac 2.5 ac 8.8 ac FY10 6.7 ac 3.0 ac 10.7 ac FY20 7.7 ac 4.1 ac 11.8 ac FY30 8.9 ac 5.3 ac 14.2 ac
ac = acres 15 16
17
18 19 20 21 22
As shown, the required vehicle storage area would increase from 8.8 acres in FY05 to 14.2 acres in FY30. The current auto storage area at Kahului Commercial Harbor is approximately 3.7 acres, which indicates a significant shortfall. However, this is somewhat misleading, as some vehicles are stored elsewhere on the property (i.e., Pier 2/3 area), and some vehicles are stored on non-DOT Harbor property. Nevertheless,
3-20

KAHULUI COMMERCIAL HARBOR 2030 MASTER PLAN CHAPTER 3 DRAFT ENVIRONMENTAL IMPACT STATEMENT FUTURE COMMERCIAL HARBOR FACILITY REQUIREMENTS
additional vehicle storage area is needed in the near term to alleviate congestion and certainly in the long term as vehicle throughput is p
1 rojected to increase. 2
Covered Sto3
Cov rage or hand o rgo and oth 4 se to su ea hi nl to as tai t 5 s (CFS or nal it wa umed th a percenta f int nd 6 c ers, im an ports, processe the CFS. Further as 7 a d tha l of “Oth reak-B ” (prima eral m andis in 8 c rs) oce at the CFS. Ou from the del consi f the ed 9 a squa et fo rt d e rt cargo, mmarize able 10
ble 3-14. Covered Storage (CFS) Area Requirements by Year 11
rage
ered sto is required f ling/conss is commo
lidating LCL cay referred
er cargoesner freighnsitive expo re to w ther. T a con
tationontain
). Fboth
the aports
ysis, d ex
s assare
at d at
ge o er-isla, it w
ssume t al the er B ulk rily gen erch e notontaine is pr ssed tput mo sts o requirrea in re fe r impo cargo an xpo as su d in T 3-14.
Ta
Year Import Exports Total FY05 22,200 sq ft 18,000 sq ft 40,200 sq ft FY10 23,800 sq ft 20,200 sq ft 44,000 sq ft FY20 29,100 sq ft 26,100 sq ft 55,200 sq ft FY30 34,500 sq ft 31,900 sq ft 66,400 sq ft
sq ft = square feet 12 13 14
orage requirements would increase as cargo 15 throughput increases during the forecast period. However, the two sheds serving Pier 2 16 were recently ter-island 17 cargo. The car rminal o has agr ontinue t L business at 18 Kahului Comm Harbor h 2010,9 indicated it may not be 19 willing to co after that t overed storage is still an i nt part of port 20 operations an xpected to ired in fu A co orage building 21 does not nec have to be d adjacent pier, but m ocated off port 22 property to conserve space nea ers for ope ge. 23
Dry-Bulk 24
25 26
The model predicts that covered st
demolished to provide additional open storage space for ingo teercial
perator throug
eed to c but has
he LC that
ntinue ime. C mportad is e be requ ture years. vered st
essarily locate to the ay be lr the pi n stora
Dry-bulk cargoes include sugar, cement, scrap metal, sand, and coal. Sugar is transferred by conveyor at Pier 1 to storage facilities located off port property. No
ai‘i. April 2007. Summary of Memorandum of Understanding Between Young Brothers, Department of
ion and Department of Commerce and Consumer Affairs on Less Than Container Load Cargo.
9 State of HawTransportatwww.hawaii.gov/gov/news/releases/2006/news/releases/Folder.2006-04-27.2244/YB%20Agreement%20LCL%20Summary.8.21.06.pdf/download. Accessed May 2007.
3-21
CHAPTER 3 KAHULUI COMMERCIAL HARBOR 2030 MASTER PLAN FUTURE COMMERCIAL HARBOR FACILITY REQUIREMENTS DRAFT ENVIRONMENTAL IMPACT STATEMENT
additional storage space, open or covered, is required for this operation. Cement is off-loaded at Pier 2 and is transferred via transmission pipelines to storage s
1 ilos located in 2
the Pier 2/3 back area. These silos are to be relocated in the future to the current 3 location of the Maui District’s office. No additional space is required on DOT Harbors 4
ining dry-bulk cargoes are stored off site and trucked for 5 6
7
8 9
el. 10 Currently, Pier 3 is the primary berthing location for fuel barges. The area fronting that 11 pier is ems 12 include a 13 result, fully d fuel bar Pier 1 in lieu . 14
Fuel delive part of a roblem st d DOT currently 15 undertakin tatewide ilities De an (F ahului 16 Commerci bor is n state fac onflicts b id-bulk 17 fuel transp and oth sers. Beca ortat alized in 18 nature pliance with numerous safety regulations, it is highly desirable 19 to have dedicated fuel product handling facilities separate from other harbor activities. 20 The Fu l Plan is examining the feasibility of such facilities at each commercial harbor 21
22
23 24 25 26 27
se needs were identified as 28 follows: 29
cient transport of fuels will require dedicated fuel piers to ensure an 30 31
32 constantly changing volumes and types of fuels. 33
property. The remaloading/unloading at the berth. No storage space is required on DOT Harbors property.
Liquid-Bulk
A major consideration in the future development of Kahului Commercial Harbor is the receiving and storing of shipments of fuel products, including fuel oil for Maui Electric Company’s generating stations, gasoline, diesel, ethanol, and aviation fu
too shallow for berthing of fully-loaded fuel barges. Other operational problconflicts with barge operations at Pier 2 and berthing of cement barges. As
loade ges use of Pier 3
ry is systemic p atewide, an Harbors is g a S Fuel Fac velopment Pl uel Plan). Kal Harorters
ot the onlyer harbor u
ility with cuse fuel transp
etween liquion is speci
and requires com
ein the state, including Kahului Commercial Harbor.
Not only will the volume of fuels increase in the future, but the variety of fuels will become more diverse. Biofuels and other alternative fuels will increase in importance, and the technical sophistication in transporting and storing these fuels will evolve. New facilities will have to be flexible to accommodate varying fuel types, changing fuel loading technology, and new designs of fuel barges, fuel ships, and piers.
Requirements for Kahului Commercial Harbor to meet the
1. Effiincreasingly technically demanding handling of fuel.
2. Fuel piers need to be flexible in space and configuration to accommodate
3-22

KAHULUI COMMERCIAL HARBOR 2030 MASTER PLAN CHAPTER 3 DRAFT ENVIRONMENTAL IMPACT STATEMENT FUTURE COMMERCIAL HARBOR FACILITY REQUIREMENTS
3. New designs of barges and fuel ships (e.g., double hull)10 have to be accommodated, which calls for generous lengths and draft capacities of future fuel piers.
4. Fuel piers can be built on marginal locations in the harbor, not requiring the quality of access that cargo piers need.
1 2 3
4 5
irements as the primary considerations, potential scenarios for fuel 6 7 8 9
10 11 12 13 14
3.3.4 15
16 17 18 19
20
21 22 23
c. is not 24 necessary. Instead, a small building or canopy, approximately 4,000 square feet, is 25
26 27
Inte s28
The existing inter-island ferry operations area at Pier 2 comprises approximately 4.4 29 acres w30
With these requfacilities in Kahului Commercial Harbor have been evaluated, involving all three existing piers, combinations of piers, and even areas outside the harbor. Although it is still unclear which scenario will be adopted, four general scenarios are being considered. The first involves a new Pier 4 adjacent to the existing Pier 3; the second would extend towards Pier 1 and enlarge Pier 3; the third would construct a new bulkhead system using sheet piles in the front of the existing Pier 3; and the fourth would use Pier 1C and the Pier 1D Extension as berth sites. These scenarios are depicted and discussed further in Chapter 4.
Passenger Requirements Passenger operations at Kahului Commercial Harbor include cruise ships and the inter-island ferry. For safety and security reasons, passenger operations should be separated from cargo operations to the extent practical and should include dedicated facilities for parking, public transportation, and passenger processing and comfort.
Cruise Ship
Future facility requirements for cruise operations include approximately 3.3 acres for parking and traffic circulation. Space is provided for 12 buses and 100 autos, both private vehicles and taxis. Since Kahului Commercial Harbor is not a homeport, a cruise terminal building with baggage claim space, ticketing/registration, et
sufficient to protect passengers from the elements while coming off or getting on the ship.
r-I land Ferry
ith dedicated facilities for vehicle queuing, vehicle inspections, passenger pick-
10 The Oil Pollution Act of 1990 requires tank vessels over a specified tonnage and operating in U.S. waters to have
double hulls or equivalent or greater protection by January 1, 2015. This measure is to help provide protection to the marine environment by increasing the environmental and operational safety of tank vessels.
3-23

CHAPTER 3 KAHULUI COMMERCIAL HARBOR 2030 MASTER PLAN FUTURE COMMERCIAL HARBOR FACILITY REQUIREMENTS DRAFT ENVIRONMENTAL IMPACT STATEMENT
up a 1 are not 2
3.3.5 Ad3
As the ui, Kahului Commercial Harbor has to 4 accommodate a diverse range of operations and activities.11 These include: ship 5
6 7 8 9
10
11 12
n), the harbor is projected to run out of 13 storage space by 2008 and will need to look to acquire additional lands and/or modify 14 the way cargo operations are managed. This would involve constructing additional 15
assenger), extending current piers, as well 16 17 18 19 20
nts 21 are projected to increase by 92 percent by FY30, future land area will need to increase 22
47 percent increase) to meet this future demand. Along with the 23 24 25 26 27
3.3.6 28 irements 29
Presently, the harbor basin is 2,050 feet wide by 2,400 feet long with a project depth 30 eakwaters protect the harbor with an entrance to the north. 31
32 33
34 installation of concrete armor units (tetrapods) weighing up to 50 tons each. The 35
nd drop-off, passenger waiting, luggage handling, and bathrooms. Ferry facilities expected to increase substantially.
ditional Land Area to Meet 2030 Requirements only deep-draft commercial port on Ma
berthing (barges, container ships, fuel tankers, tubgoats, cruise ships, ferry vessels; safe navigation operations); cargo handling and storage (containers, fuels, hazardous materials, vehicles, and others); port security (terminals and within the harbor); cruise ship and inter-island ferry operations; and recreational uses of the harbor (canoe paddling, surfing, fishing).
Kahului Commercial Harbor is located within a highly developed area. As a result, available land space is scarce and expensive. According to the Kahului Commercial Harbor 2025 Master Plan (2025 Master Pla
multi-use piers (handling both cargo and pas other types of berthing options such as tendering or off-shore piping. The commercial harbor is 448 acres in size. The available open storage area is approximately 45.6 acres, which excludes the submerged land and approximately 20 percent for areas consisting of internal roads, traffic circulation, working aisles, buildings, and other areas not used for handling cargo. As cargo storage requireme
to 67 acres (requirement for more land area is the need for additional berths to accommodate an increase in ship traffic—larger vessels and more ships calling at Kahului Commercial Harbor. Future projections show a need for 10 berths (an increase of 43 percent) by FY30.
Dredging and Breakwater Construction to Meet FY30 Requ
of 35 feet. Two large brSpecifically, the East and West Breakwaters protect Kahului Commercial Harbor from direct exposure to wind and waves from the north and northeast. The breakwaters have a long history of construction and repair and have held up well following
Agencies that operate within the harbor include DOT Harbors, U.S. Coast Guard (USCG), and the State Division of Boating and Ocean Recreation (DOBOR).
11
3-24

KAHULUI COMMERCIAL HARBOR 2030 MASTER PLAN CHAPTER 3 DRAFT ENVIRONMENTAL IMPACT STATEMENT FUTURE COMMERCIAL HARBOR FACILITY REQUIREMENTS
entrance channel between the breakwaters is 660 feet wide and 40 feet deep, which is adequate for vessels currently entering
1 the harbor. No significant changes to the 2
entrance channel are expected through FY30, as the channel width cannot be 3 increased without removing a portion of the East or West Breakwater, and the depth 4
. Neither of these 5 6
7 8 9
10 11
12 13 14 15 16 17 18 19 20
21 22
23 24
25 26
for short and 27 at the West 28
evelopment (Pier 5). Alternative C was generally acceptable for 29 30
31 32 33 34
would not be increased unless the harbor basin depth was increasedscenarios appears likely.
The harbor basin will require expansion as facilities improvements are made in response to growing demands through FY30. In particular, development of the West Breakwater Harbor area for cargo or passenger operations would involve expansion of the turning basin by approximately 800 feet to the west to provide a 35-foot depth for vessels to safely navigate into the new berth(s).
Construction of new facilities to accommodate future cargo projections necessitates expansion into areas of the harbor that are not currently used, such as the West Breakwater Harbor Development. These areas are exposed to higher wave energy passing through the entrance channel and will require improvements to the existing breakwaters. The U.S. Army Corps of Engineers, Engineer Research and Development Center (USACE ERDC) conducted a study12 in support of the 2025 Master Plan for Kahului Commercial Harbor. Three configurations of breakwater extensions were numerically modeled to evaluate the response to wind, waves, swell, and harbor oscillations:
• Alternative A (2025 Master Plan)—Reorient entrance channel; construct 900-foot seaward extension of the East Breakwater.
• Alternative B (Plan B)—Construct a realigned 900-foot seaward extension of the East Breakwater.
• Alternative C (Plan C)—Construct a 450-foot seaward extension on the East Breakwater and a 600-foot landward extension on West Breakwater.
The study concluded that Alternatives A and B were generally acceptable long waves but noted concerns about wind wave and swell energy Breakwater Harbor Dshort waves, but oscillations may increase at Piers 1, 2, and 5.
For planning purposes, a 900-foot seaward extension at the East Breakwater is considered an important facility improvement to reduce wave energy within the harbor. There is still a concern regarding potential wave and swell energy at the West Breakwater Harbor Development, which would impact navigation and vessel
i, Hawaii.
12 U.S. Army Corps of Engineers, Engineer Research and Development Center. June 2002. Wave Climate and Wave Response, 2025 Plan, Kahului Harbor, Mau
3-25

CHAPTER 3 KAHULUI COMMERCIAL HARBOR 2030 MASTER PLAN FUTURE COMMERCIAL HARBOR FACILITY REQUIREMENTS DRAFT ENVIRONMENTAL IMPACT STATEMENT
berthing. Consequently, a breakwater extension or similar structure is necessary to protect vessels at the West Breakwater Harbor Development. The actual design and extent of these extensions are subject to further technical evaluation using the numerical or physical models developed by the ERDC, as well as further environ-mental review. It is envisioned that the extension would be parallel to the berth to minimize encroachment
1 2 3 4 5
into the harbor basin. Figure 3-1 shows the anticipated 6 location and configuration of breakwater extensions at the East and West Breakwaters. 7
3-26

