kampala - organisation for economic co-operation and development
TRANSCRIPT
Uganda
Kampala
key figures• Land area, thousands of km2: 200• Population, thousands (2000): 23 300• GDP per capita, $ (2000): 266• Life expectancy (1995-2000): 41.9• Illiteracy rate (2001): 31.9
UGANDA gb 10/01/02 15:11 Page 291

UGANDA gb 10/01/02 15:11 Page 292
African Economic Outlook© OECD/BAD 2002
293
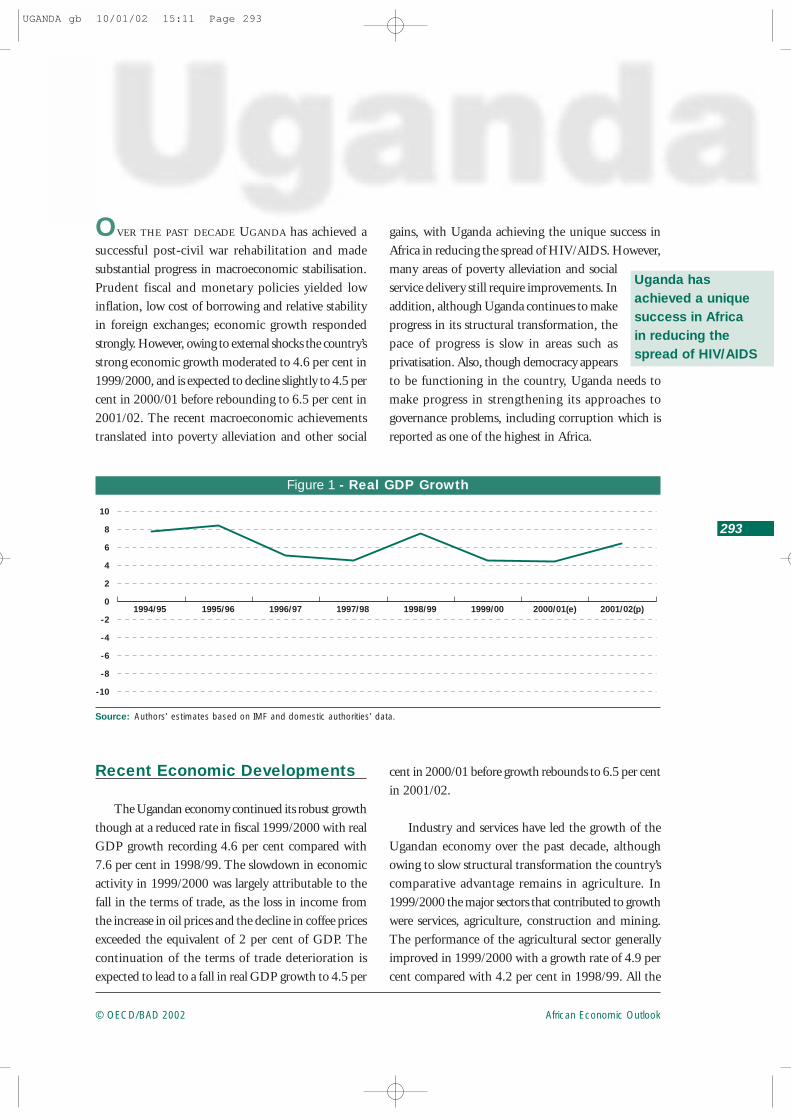
OVER THE PAST DECADE UGANDA has achieved asuccessful post-civil war rehabilitation and madesubstantial progress in macroeconomic stabilisation.Prudent fiscal and monetary policies yielded lowinflation, low cost of borrowing and relative stabilityin foreign exchanges; economic growth respondedstrongly. However, owing to external shocks the country’sstrong economic growth moderated to 4.6 per cent in1999/2000, and is expected to decline slightly to 4.5 percent in 2000/01 before rebounding to 6.5 per cent in2001/02. The recent macroeconomic achievementstranslated into poverty alleviation and other social
gains, with Uganda achieving the unique success inAfrica in reducing the spread of HIV/AIDS. However,many areas of poverty alleviation and socialservice delivery still require improvements. Inaddition, although Uganda continues to makeprogress in its structural transformation, thepace of progress is slow in areas such asprivatisation. Also, though democracy appearsto be functioning in the country, Uganda needs tomake progress in strengthening its approaches togovernance problems, including corruption which isreported as one of the highest in Africa.
Uganda has achieved a unique success in Africa in reducing the spread of HIV/AIDS
-10
1994/95 1995/96 1996/97 1997/98 1998/99 1999/00 2000/01(e) 2001/02(p)
-8
-6
-4
-2
0
2
4
6
8
10
Figure 1 - Real GDP Growth
Source: Authors’ estimates based on IMF and domestic authorities’ data.
Recent Economic Developments
The Ugandan economy continued its robust growththough at a reduced rate in fiscal 1999/2000 with realGDP growth recording 4.6 per cent compared with7.6 per cent in 1998/99. The slowdown in economicactivity in 1999/2000 was largely attributable to thefall in the terms of trade, as the loss in income fromthe increase in oil prices and the decline in coffee pricesexceeded the equivalent of 2 per cent of GDP. Thecontinuation of the terms of trade deterioration isexpected to lead to a fall in real GDP growth to 4.5 per
cent in 2000/01 before growth rebounds to 6.5 per centin 2001/02.
Industry and services have led the growth of theUgandan economy over the past decade, althoughowing to slow structural transformation the country’scomparative advantage remains in agriculture. In1999/2000 the major sectors that contributed to growthwere services, agriculture, construction and mining.The performance of the agricultural sector generallyimproved in 1999/2000 with a growth rate of 4.9 percent compared with 4.2 per cent in 1998/99. All the
UGANDA gb 10/01/02 15:11 Page 293
African Economic Outlook © OECD/BAD 2002
294
Uganda
sub-sectors, except the cash crop sub-sector, experiencedsignificant positive growth. Food crop production(plantain, sweet potatoes, maize, cassava, etc.) increasedin 1999/2000 as rainfall was largely normal comparedwith the drought in the previous year. The good runin food production is expected to continue in 2000/01as agro-meteorological data have indicated normal rainsin the first quarter of 2001. Cash crop production fellin 1999/2000 owing to poor performance of coffee andtobacco. Coffee deliveries, which are a proxy forproduction, have declined since 1997/98. Deliverieshave dropped from 222 000 tonnes in 1997/98 to205 000 tonnes in 1998/99, with a further fall to170 800 tonnes in 1999/2000. The prolonged droughtand, to some extent, coffee wilt disease have negativelyimpacted on coffee deliveries. Tobacco purchases alsodeclined from 23 500 tonnes in 1998/99 to21 500 tonnes in 1999/2000. The prolonged droughtup to 1999 in the West Nile area that affectedproduction of the flue-cured Virginia crop is largelyresponsible for the lower yields. Similarly, cotton outputfell from 117 000 bales in 1998/99 to 100 000 balesin 1999/2000 owing largely to a fall in world prices,which was a disincentive to cotton planting despitethe availability of production inputs (seeds andchemicals). On the other hand, tea production hascontinued to improve slightly since 1998/99, withproduction of green leaf up in 1999/2000 to139 500 tonnes compared with 136 300 tonnes in1998/99. Prospects for tea production are higher given
the Uganda tea industry’s planting rehabilitation andproductivity improvements.
The industrial sector achieved a growth rate ofabout 6 per cent in 1999/2000 which, though higherthan the rate in 1998/99, constituted a declinecompared with growth levels in 1997/98. The industrialsector in 1999/2000 was affected by the worseningterms of trade. With Ugandan industry catering mainlyfor the local market but relying heavily on importedinputs, the foreign exchange squeeze resulting from theterms of trade shock affected production. Themanufacturing sub-sector suffered as its growth ratefell to 6 per cent in 1999/2000 compared with 9.5 percent in 1998/99. However, growth in constructionand mining continued to be robust with a growth rateof 8.5 per cent in 1999/2000. The growth was derivedmainly from expansion in public road construction andprivate building construction. At the same time,expansion in construction created demand for sand andclay thereby expanding the mining and quarryingsector.
Growth in the services sector in 1999/2000 wasaccounted for mainly by the expansion intelecommunication services, although road transportservices, commerce and trade services and communityservices also enjoyed moderate growth. Tele-communication services expanded by 35 per cent in1999/2000 as a result of the continuous expansion in
1990 1991 1992 1993 1994 1995 1996 1997 1998 1999 2000
■ Africa ■ Uganda
0
100
200
300
400
500
600
700
800
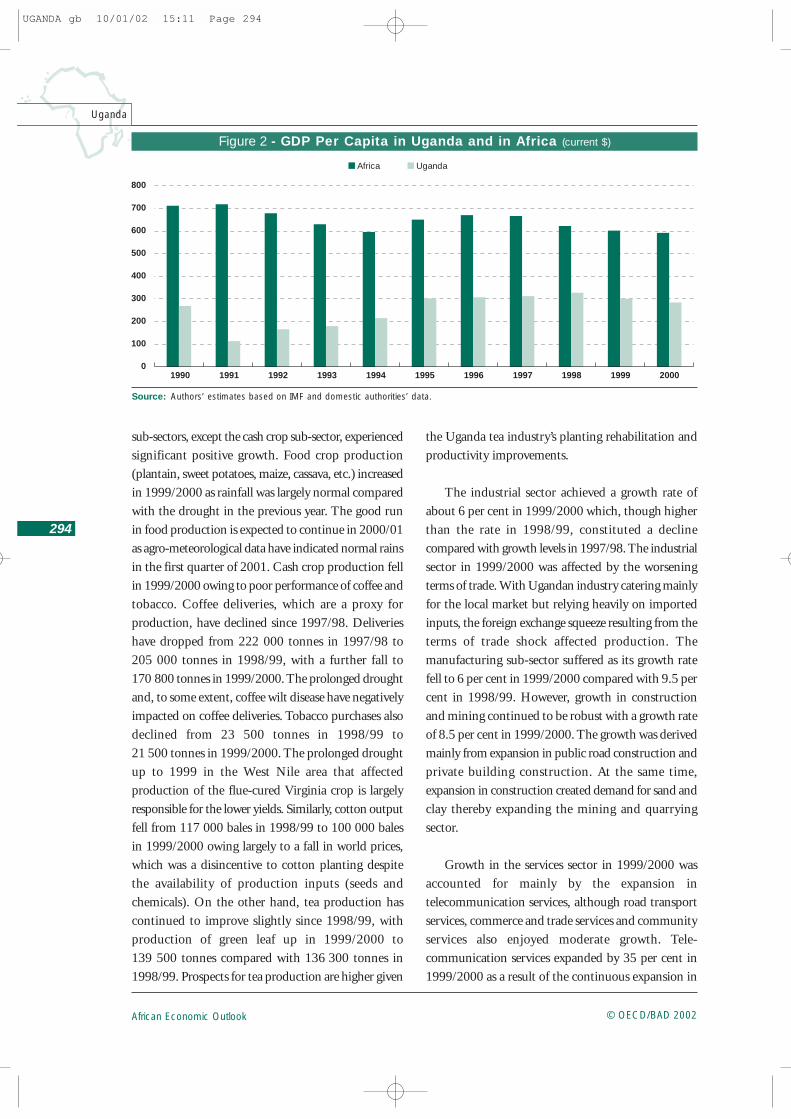
Figure 2 - GDP Per Capita in Uganda and in Africa (current $)
Source: Authors’ estimates based on IMF and domestic authorities’ data.
UGANDA gb 10/01/02 15:11 Page 294

African Economic Outlook© OECD/BAD 2002
295
Uganda
0 2 4 6 8 10 12
Agriculture
Mining
Manufacturing
Energy
Construction
Wholesale and retail trade
Transport and communications
Tourism
Government services
Others
GDP at factor cost
■ Volume ■ Price ■ Value
Figure 4 - Sectoral Contribution to GDP Growth, 2000/2001
Source: Authors’ estimates based on IMF data.
Agriculture
Mining
Manufacturing
Wholesaleand retail trade
Construction Energy
Transport and communications
OthersGovernment
services
Tourism
5% 42%
8% 1%1%
12%
2%
9%
16%4%
Figure 3 - GDP by Sector in 2000/2001
Source: Authors’ estimates based on IMF data.
mobile, cellular, internet and fixed telephone servicessince 1996.
The direction of Uganda’s growth performanceappeared to depend on what happened to consumers,especially private consumers, as the growth performancehas been characterised by the strong consumption of
the private sector. However, in 1999/2000 totalconsumption came in at the previous year’s level withprivate consumption falling from its highs. This wasdue to the impact of the external shock that reducedprivate incomes and thus reduced domesticconsumption. The high share of consumption in totalincome is expected to continue in 2000/01 and 2001/02
UGANDA gb 10/01/02 15:11 Page 295

African Economic Outlook © OECD/BAD 2002
296
Uganda
as private consumption remains at high levels. At thesame time Uganda is expected to maintain an evenhigher level of domestic investment in 2000/01 and2001/02 owing to higher levels of foreign savingsfinancing domestic investment.
Macroeconomic Policy
Fiscal and Monetary Policies
The implementation of the budget in 2000 posedmajor difficulties for the Ugandan government. Theexternal shock that constrained real GDP growthcontributed to poor domestic revenue performance.However, higher than anticipated levels of externalgrants, as donors moved to support Uganda’s
preparations for general and presidential elections,more than offset the shortfall in domestic revenue.Under the government’s fiscal and monetaryprogramme, any excess or shortfall of donor budgetsupport leads to an increase/reduction in governmentsavings, rather than a change in expenditure. Thus,the larger than expected level of resources arising fromhigher grants could not be used to increase spendingbecause this would have widened the domestic fiscaldeficit and reduced incentives for domestic resourcemobilisation.
The overall tax revenue performance was poorer in1999/2000 as it stabilised at the 1998/99 level of about10.5 per cent of GDP. There were poor collections incorporate tax, excisable goods and fuel import duty,arising partly from the terms of trade shock. The poor
Table 1 - Demand Composition (percentage of GDP)
Source: Authors’ estimates and predictions based on domestic authorities’ data.
1994/95 1997/98 1998/99 1999/00 2000/01(e) 2001/02(p)
Gross capital formation 17.1 15.5 17.2 22.6 25.1 26.2Public 6.1 5.2 5.5 10.0 11.5 12.0Private 11.1 10.3 11.8 12.6 13.6 14.2
Total consumption 95.4 102.9 100.4 99.3 99.4 97.5Public 10.6 10.3 11.1 12.6 12.9 12.8Private 84.8 92.6 89.2 86.7 86.6 84.7
External demand -12.5 -18.4 -17.6 -21.9 -24.5 -23.7Exports 11.7 9.4 11.4 10.1 8.5 9.1Imports -24.2 -27.8 -29.0 -32.0 -33.0 -32.8
Table 2 - Public Financesa (percentage of GDP)
a. Fiscal year begins 1 July.b. Only major items are reported.Source: Authors’ estimates and predictions based on domestic authorities’ data.
1994/95 1997/98 1998/99 1999/00 2000/01(e) 2001/02(p)
Total Revenue and grantsb 14.3 15.5 15.6 17.2 19.6 18.3Taxes 9.1 9.8 10.6 10.4 10.5 10.1Grants 4.4 5.1 4.7 6.4 8.8 7.9
Total expenditure and net lendingb 16.8 15.9 17.3 19.9Current expenditure 9.2 9.3 9.9 11.2
Excluding interest 8.2 8.3 9.1 10.4 10.6 10.6Wages and salaries 2.5 3.3 3.9 4.0 4.3 4.5Interest on public debt 1.0 1.0 0.8 0.8
Capital expenditure 7.4 6.6 7.3 8.7 10.0 10.4
Primary balance -1.6 0.5 -0.9 -2.0 -0.2 -2.7Overall balance -2.5 -0.4 -1.6 -2.8
UGANDA gb 10/01/02 15:11 Page 296

African Economic Outlook© OECD/BAD 2002
297
Uganda
revenue performance persisted into 2000/01 as thenegative terms of trade shock extended into the firsthalf of 2001. Low receipts have been recorded fromexcise duty on locally produced goods owing to less thananticipated domestic demand, and on petroleumproducts owing to increases in international prices.Consequently, revenue projections for 2000/01 arebeing revised downwards.
The government had to restrain public expenditureto target levels in order to maintain its demandmanagement policies during 1999/2000. Totalgovernment expenditure increased to about 20 percent of GDP in 1999/2000 compared with 17.3 percent of GDP in 1998/99. However, the higherexpenditure levels in 1999/2000 were closer to thebudget targets as the government implemented strictercash budget rules, matching expenditures strictly withavailable resources. The expenditure restraintsnotwithstanding, the budget outturns representeddeterioration in the fiscal performance as the primarybalance moved from a deficit of 0.9 per cent of GDPin 1998/99 to a deficit of 2 per cent of GDP in1999/2000. The primary deficit is expected to subsideto 0.2 per cent of GDP in 2000/01 as donors continueto increase grants to Uganda after the successfulcompletion of the democratic elections. The primarydeficit is expected to widen to 2.7 per cent of GDP in2001/02 following total revenue shortfalls as grantdisbursements stabilise and total expenditure continuesits moderate expansion.
Within the context of its broad monetary policyobjective of containing money supply to levels consistentwith price stability, monetary policy management in2000 faced three challenges. First, preventing excessliquidity as a result of maturing promissory notes (PNs)that had been issued by the Bank of Uganda (BOU) toUgandan Commercial Bank, Standard Chartered andCentenary Rural Development Bank with respect to theiracquiring deposit liabilities of banks closed in 1999.Second, mopping up liquidity arising from governmentspending of donor aid. Third, differentiating the pressureson the exchange rate arising from the terms of trade shockfrom speculative activities in the foreign exchangemarket. Monetary policy was conducted mainly by
varying the net issuance of Treasury bills and adjustingthe policy margins on the rediscount rate and the bankrate. The BOU also introduced Repurchase Agreements(REPOs) in August 2000 as a flexible fine-tuninginstrument. In addition, the base for the computationof commercial banks’ reserve requirement was widenedin September 2000, to include foreign currency depositsat the same ratio as local shilling deposits. Furthermore,from December 2000, reserve requirements on alldeposits were adjusted upwards by one percentage pointto 9 per cent and 10 per cent on time/savings anddemand deposits respectively.
Following these developments, broad money (M3),which comprises currency in circulation plus bankdeposits including foreign exchange accounts, grew by16.1 per cent between June 1999 and June 2000, andby 13.6 per cent between June 2000 and March 2001.A breakdown of M3 into its components showed thatthe growth came mainly from foreign currency deposits,which grew by 18 per cent, and currency in circulation,which grew by 15 per cent. The higher growth inforeign currency deposits indicated a tendency towardsthe dollarisation of the economy. The BOU appearedto get around this problem with the implementationof uniform cash reserve ratio on both domestic andforeign deposit liabilities. This appeared to reduce thedollarisation problem as the foreign deposit/M3 ratiodeclined from about 27 per cent in September 2000to 24 per cent in March 2001.
Consumer price inflation, which is primarilydetermined by trends in food prices, has remainedrelatively low in Uganda. The years of drought withdrought-related declines in food production as in 1997saw a rise in the rate of inflation, and as food productionrecovered, as in 1998, food prices fell and inflationalso declined. With the drought in 1999 and its effecton food crops, the annual rate of inflation rose to5.3 per cent. During 2000, inflation remained stableat 4.2 per cent in the first quarter, but rose to 6.1 percent in November before falling back to 4.2 per centin December. The depreciation of the exchange rate andthe rise in oil prices were among the reasons for thebuilding up of inflationary pressures during the year.The build-up of inflation is expected to continue with
UGANDA gb 10/01/02 15:11 Page 297
African Economic Outlook © OECD/BAD 2002
298
Uganda
the annual average rate rising to 4.1 per cent in 2000/01and further to 4.5 per cent in 2001/02, reflecting thestrong demand conditions in the economy.
The Bank of Uganda emphasis on T-bills in meetingits monetary policy challenges in 2000 led to the rateof interest on the 91-day T-bills rising from 16.8 percent at the beginning of July 2000 to a peak of 25.8 percent by mid-January, 2001. The increase in T-bill ratesreflected the sharp rise in the volume of T-bills issuedand held by the commercial banks. The interest rateson the T-bills have since declined to 9.96 per cent inApril 2001, as more aggressive sales of foreign currencyby the BOU to the market enabled the BOU to placeless emphasis on T-bills to control liquidity. In responseto the declining rates on the T-bills, commercial bankshave adjusted their prime lending rates downwards.
The Ugandan shilling is market-determined withthe monetary authorities intervening as necessary tomaintain stability in the foreign exchange market. Theexchange rate of the shilling has followed a downwardtrend over the past five years. However, what wasdesirable in view of the need to maintain Uganda’sexport competitiveness was the depreciation of the realeffective exchange rate of the shilling. During 1999,the nominal effective exchange rate (NEER) of theshilling depreciated by 16.4 per cent against the USdollar, as the dollar strengthened against world currenciesgenerally. The real effective exchange rate (REER)depreciated by 13.4 per cent during the year. Theshilling continued its slide in 2000 and into 2001,attributed largely to the deterioration in the terms oftrade. The NEER and the REER are estimated to havedepreciated by 7 per cent and 3.6 per cent respectivelybetween June 2000 and March 2001.
The BOU’s cautious intervention in the inter-bankforeign exchange market kept the foreign exchangemarket from experiencing major turbulence. BetweenJune 2000 and March 2001, the BOU sold about$140 million to keep stability in the foreign exchangemarket. Stability in the market was also maintained bymoral persuasion from the BOU with caution, followedby actions to convince commercial banks, forex bureauxand other agents that the shilling is not a one-way bet,
and that those banks which speculate will suffer theconsequences as the BOU is not a buyer of last resort.The BOU also made efforts to enhance transparencyof transactions on the IFEM, by directing all authoriseddealers in the market to connect to the Reuters systemwith effect from 1 July 2001. Indicative quotes will nowbe posted on Reuters as opposed to the current systemof receiving quotations via the telephone. Interventionoperations of the BOU will also be posted to Reuters.
External Position
Uganda continues to revise its trade regime in itsannual budgets towards the liberalisation of its externaltrade. The maximum duty rate was reduced from 20 percent to 15 per cent in 1998. In 1999, import bans onbeer, soft drinks, and car batteries were lifted. In 2000,the government gave indications to eliminating thesurcharge on beer, cigarettes and other tobacco products.Uganda has an outstanding issue in trade policyinvolving the elimination of the differential use ofexcise taxes for imports and domestic goods in thecontext of COMESA and the East African Community(EAC). On this issue, the government indicated in2000 that existing discriminatory excises on selectedimports will be phased out within the framework fortrade liberalisation to be undertaken in the context ofthe EAC. These taxes were duly eliminated upon theapproval of the 2001/02 budget in July 2001. Thegovernment has already removed the special protectionaccorded to textiles.
The external sector of Uganda has continued since1999/2000 to operate under pressure owing to thedeteriorating terms of trade and poor exportperformance. The terms of trade shock led to a wideningof the trade deficit. Although the depreciation of theexchange rate dampened import demand somewhat,this was more than offset by a reduction in exportearnings. Coffee exports, the main export earner, areestimated to contribute only about 27 per cent of totalexports in 2000, down from 43 per cent in 1999. Thisreduction was due to a 4 per cent fall in volumesexported and, more importantly, a 37 per cent fall ininternational coffee prices compared with the previousyear. The value of non-coffee exports — hides and
UGANDA gb 10/01/02 15:11 Page 298
African Economic Outlook© OECD/BAD 2002
299
Uganda
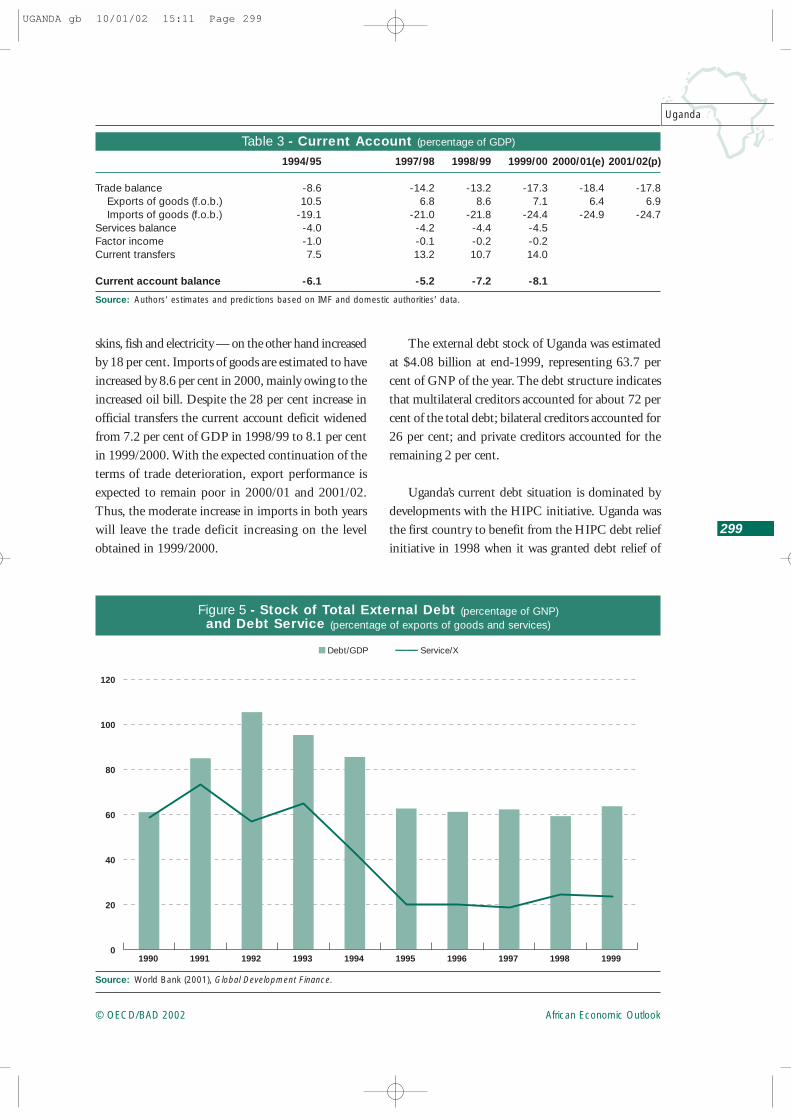
Table 3 - Current Account (percentage of GDP)
Source: Authors’ estimates and predictions based on IMF and domestic authorities’ data.
1994/95 1997/98 1998/99 1999/00 2000/01(e) 2001/02(p)
Trade balance -8.6 -14.2 -13.2 -17.3 -18.4 -17.8Exports of goods (f.o.b.) 10.5 6.8 8.6 7.1 6.4 6.9Imports of goods (f.o.b.) -19.1 -21.0 -21.8 -24.4 -24.9 -24.7
Services balance -4.0 -4.2 -4.4 -4.5Factor income -1.0 -0.1 -0.2 -0.2Current transfers 7.5 13.2 10.7 14.0
Current account balance -6.1 -5.2 -7.2 -8.1
skins, fish and electricity — on the other hand increasedby 18 per cent. Imports of goods are estimated to haveincreased by 8.6 per cent in 2000, mainly owing to theincreased oil bill. Despite the 28 per cent increase inofficial transfers the current account deficit widenedfrom 7.2 per cent of GDP in 1998/99 to 8.1 per centin 1999/2000. With the expected continuation of theterms of trade deterioration, export performance isexpected to remain poor in 2000/01 and 2001/02.Thus, the moderate increase in imports in both yearswill leave the trade deficit increasing on the levelobtained in 1999/2000.
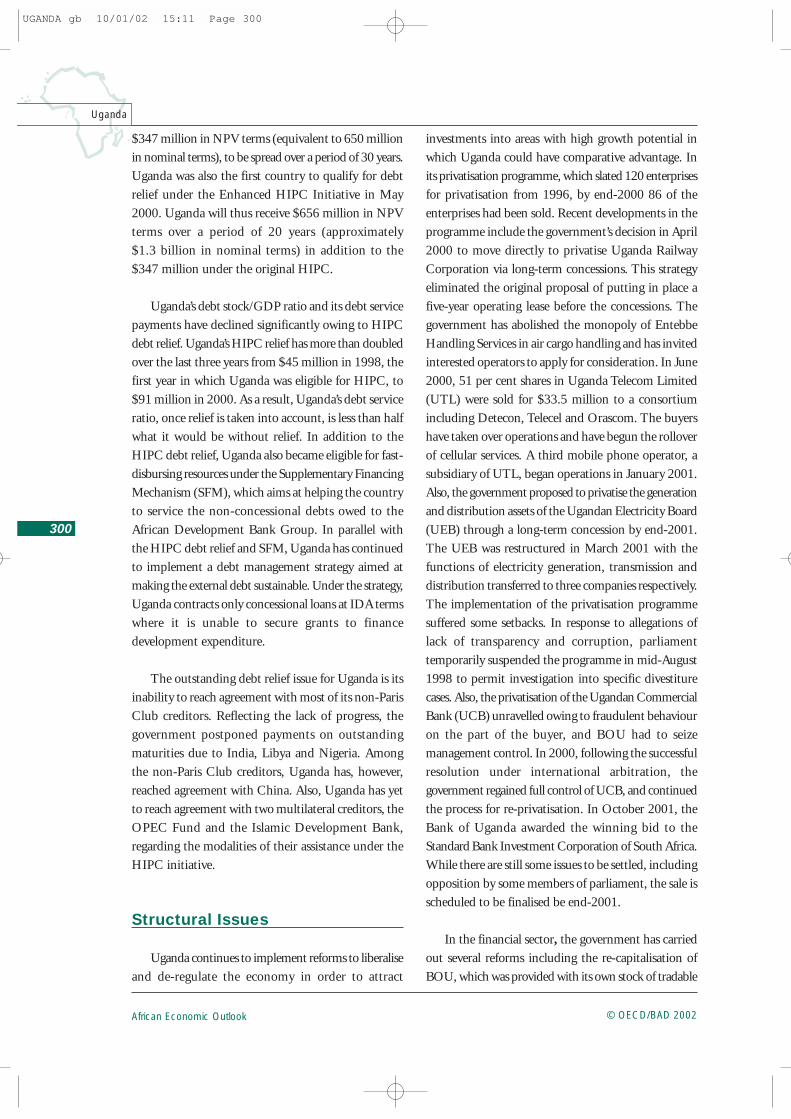
The external debt stock of Uganda was estimatedat $4.08 billion at end-1999, representing 63.7 percent of GNP of the year. The debt structure indicatesthat multilateral creditors accounted for about 72 percent of the total debt; bilateral creditors accounted for26 per cent; and private creditors accounted for theremaining 2 per cent.
Uganda’s current debt situation is dominated bydevelopments with the HIPC initiative. Uganda wasthe first country to benefit from the HIPC debt reliefinitiative in 1998 when it was granted debt relief of
199519941993199219911990 1996 1997 1998 1999
■ Debt/GDP —— Service/X
0
20
40
60
80
100
120
Figure 5 - Stock of Total External Debt (percentage of GNP)and Debt Service (percentage of exports of goods and services)
Source: World Bank (2001), Global Development Finance.
UGANDA gb 10/01/02 15:11 Page 299
African Economic Outlook © OECD/BAD 2002
300
Uganda
$347 million in NPV terms (equivalent to 650 millionin nominal terms), to be spread over a period of 30 years.Uganda was also the first country to qualify for debtrelief under the Enhanced HIPC Initiative in May2000. Uganda will thus receive $656 million in NPVterms over a period of 20 years (approximately$1.3 billion in nominal terms) in addition to the$347 million under the original HIPC.
Uganda’s debt stock/GDP ratio and its debt servicepayments have declined significantly owing to HIPCdebt relief. Uganda’s HIPC relief has more than doubledover the last three years from $45 million in 1998, thefirst year in which Uganda was eligible for HIPC, to$91 million in 2000. As a result, Uganda’s debt serviceratio, once relief is taken into account, is less than halfwhat it would be without relief. In addition to theHIPC debt relief, Uganda also became eligible for fast-disbursing resources under the Supplementary FinancingMechanism (SFM), which aims at helping the countryto service the non-concessional debts owed to theAfrican Development Bank Group. In parallel withthe HIPC debt relief and SFM, Uganda has continuedto implement a debt management strategy aimed atmaking the external debt sustainable. Under the strategy,Uganda contracts only concessional loans at IDA termswhere it is unable to secure grants to financedevelopment expenditure.
The outstanding debt relief issue for Uganda is itsinability to reach agreement with most of its non-ParisClub creditors. Reflecting the lack of progress, thegovernment postponed payments on outstandingmaturities due to India, Libya and Nigeria. Amongthe non-Paris Club creditors, Uganda has, however,reached agreement with China. Also, Uganda has yetto reach agreement with two multilateral creditors, theOPEC Fund and the Islamic Development Bank,regarding the modalities of their assistance under theHIPC initiative.
Structural Issues
Uganda continues to implement reforms to liberaliseand de-regulate the economy in order to attract
investments into areas with high growth potential inwhich Uganda could have comparative advantage. Inits privatisation programme, which slated 120 enterprisesfor privatisation from 1996, by end-2000 86 of theenterprises had been sold. Recent developments in theprogramme include the government’s decision in April2000 to move directly to privatise Uganda RailwayCorporation via long-term concessions. This strategyeliminated the original proposal of putting in place afive-year operating lease before the concessions. Thegovernment has abolished the monopoly of EntebbeHandling Services in air cargo handling and has invitedinterested operators to apply for consideration. In June2000, 51 per cent shares in Uganda Telecom Limited(UTL) were sold for $33.5 million to a consortiumincluding Detecon, Telecel and Orascom. The buyershave taken over operations and have begun the rolloverof cellular services. A third mobile phone operator, asubsidiary of UTL, began operations in January 2001.Also, the government proposed to privatise the generationand distribution assets of the Ugandan Electricity Board(UEB) through a long-term concession by end-2001.The UEB was restructured in March 2001 with thefunctions of electricity generation, transmission anddistribution transferred to three companies respectively.The implementation of the privatisation programmesuffered some setbacks. In response to allegations oflack of transparency and corruption, parliamenttemporarily suspended the programme in mid-August1998 to permit investigation into specific divestiturecases. Also, the privatisation of the Ugandan CommercialBank (UCB) unravelled owing to fraudulent behaviouron the part of the buyer, and BOU had to seizemanagement control. In 2000, following the successfulresolution under international arbitration, thegovernment regained full control of UCB, and continuedthe process for re-privatisation. In October 2001, theBank of Uganda awarded the winning bid to theStandard Bank Investment Corporation of South Africa.While there are still some issues to be settled, includingopposition by some members of parliament, the sale isscheduled to be finalised be end-2001.
In the financial sector, the government has carriedout several reforms including the re-capitalisation ofBOU, which was provided with its own stock of tradable
UGANDA gb 10/01/02 15:11 Page 300
African Economic Outlook© OECD/BAD 2002
301
Uganda
securities; and the restructuring of the UgandanDevelopment Bank (UDB) to enable it to provide long-term development finance. In addition, BOU has takenmeasures to strengthen its supervisory and regulatoryrole by increasing the number of on-site inspections, andstrengthening off-site surveillance. The problem ofinsolvency in commercial banks has been addressedwith the BOU enforcing a policy that requires banksfailing to meet the capital adequacy ratio either to takeremedial measures “leading to prompt recapitalisation”or face closure within a specified period of time. In thiscontext, BOU closed the International Credit Bank inSeptember 1998; the Greenland Bank in April 1999;and the Co-operative Bank in May 1999. Thegovernment announced in 2000 that problems hadbeen encountered in the recovery of assets in the threebanks liquidated, in part because the enforcement of thesale of mortgaged properties through the courts hasmoved slowly and because insider loans have beendifficult to realise in the absence of collateral. Thesedifficulties continued into 2001. In addition, liquidationcosts have been very high.
Political and Social Context
Uganda has made progress in many areas ofgovernance. Although gains in democracy in Ugandaremain contested, at present the country’s leaders areelected through adult suffrage. The government helda referendum on political parties during 2000 followedby presidential elections in March 2001 andparliamentary elections in June 2001. Amid claims offraud, vote-rigging and intimidation of voters made bythe opposition as well as by some foreign observers,President Yoweri Museveni was re-elected. Although theclaims of fraud might dent Uganda’s image as ademocratic country, the re-election of PresidentMuseveni meant that political and economic policieswould remain in line with those of recent years. Withregard to stabilisation in the political process, there isthe continual problem of insurgency in the North.Although the armed gangs have largely been controlledby government forces, greater vigilance is still requiredto prevent an armed rebellion that could threatenpolitical stability.
In spite of the good intentions of the governmentin promoting accountability and transparency in publiclife, corruption remains a major social canker in Uganda.Many of the services that are most relevant for thepoor (such as police and health care) are considered tobe among the most corrupt, as are also other agenciesin the judicial system, including the judicial and criminalcourts. The 1998 National Integrity Survey found that40 per cent of service users have to pay bribes to workersin key public services. Transparency International’slatest index on corruption, which is based on theperception of businessmen, ranked Uganda 89 out of91 countries. The average number of corruption-relatedcomplaints per month that the Inspector General ofGovernment (IGG) receives rose from 143 in 1998 to399 in the first half of 2000. In June 2000 thegovernment published its strategy plan to fightcorruption and build ethics and integrity in publicoffice. However, the question remains as to how far thePlan can go given the current status quo in politicaland public life in Uganda.
Uganda has since 1992 conducted five nationallyrepresentative household surveys measuring livingstandards of the population. The results of these surveysindicate that economic growth in the 1990s hastranslated into increases in household consumptionand a reduction in income poverty. Even during 1997-2000, when there was a slower pace of economic growth,the reduction in poverty appeared to continue.According to the household surveys’ results, theproportion of the population living below the povertyline of $1 a day declined from 56 per cent in 1992 to44 per cent in 1997, and then to 35 per cent in 2000(a decline of 38 per cent since 1992). The 2000 surveyindicates that while poverty has declined, inequality inUganda has increased, especially after 1997.Consumption gains have been inequitably distributedacross the population, with the richest decile havingexperienced the largest rise in living standards: it hasseen its real consumption increase by 20 per cent since1997, whereas consumption levels of the poorest decilehas grown by only 8 per cent. In addition, regionalinequality has widened, with the North and East of thecountry having the largest proportions of the poor. Inparticular, the poverty situation in the North has
UGANDA gb 10/01/02 15:11 Page 301

African Economic Outlook © OECD/BAD 2002
302
Uganda
worsened since 1997, while poverty has declined in allother regions. Insecurity is the main reason behind thelack of progress in poverty alleviation in the North. Thesurveys also indicate that poverty in Uganda continuesto be a rural phenomenon; the rural-urban gap haswidened, with 96 per cent of the poor living in ruralareas in 2000.
The government currently makes directinterventions towards poverty alleviation. These includemost notably the Poverty Action Fund (PAF), financedby a combination of the HIPC debt relief savings,donor budget support and other government resources.The PAF resources have increased significantly fromabout Shs. 80 billion ($64 million) in 1998 toShs. 167 billion ($114 million) in 1999 and toShs. 330 billion ($189 million) in 2000. The resourcesare channelled to local government in the form ofconditional grants to support key activities in the areasof rural roads, agricultural extension, primary healthcare,water and sanitation and primary education.
Uganda’s Household Surveys indicate animprovement in the health status of the populationbetween 1997 and 2000, across regions, urban andrural, male and female. The indicators of improvementare also suggested in child health. In pursuance of itsUganda National Minimum Health Care Package thatconcentrates on the control of communicable diseases,the government has started refurbishing the 6 000outreach stations in the country and is drafting a planfor the revitalisation of the immunisation programmes.However, there is an acute shortage of qualified staffin the health sector. In 2000, only 40 per cent of healthunits had trained staff — lower than the governmenttarget of 55 per cent.
The government has continued the implementationof its HIV/AIDS control programme. The HIV sero-prevalence declined from 10 per cent to 8.3 per centbetween 1996 and 2000. Infection rates from SentinelSurveillance sites continued to show a decline as aresult of behaviour change and the use of condoms.Uganda’s achievement with AIDS awareness andprevention, unique in Africa, had been the result ofgovernment campaigns in which state officials and
community elders openly discussed AIDS issues. In spiteof the major achievement, AIDS remains a substantialthreat to public health and constitutes a significantobstacle to rapid human capital accumulation.Surveillance data show that 10 per cent of the adultpopulation (15-49 years) is HIV-infected. AIDS isresponsible for up to 12 per cent of annual deaths andhas become the leading cause of death among the 15-49 age group. One of the most visible and immediateimpacts of the epidemic is the rapidly growing numberof AIDS orphans. UNAIDS (2000) estimates that atend-1999, 1.7 million children (under 15 years) hadlost their mother or both parents to AIDS. Areas thathave proved to be problematic are making health careaffordable to people living with AIDS and striking abalance between preventive and curative services.
The cornerstone of Uganda’s education policy isuniversal primary education. Access to education by allincome groups and gross enrolments have increased asa result of this policy. The net primary enrolment ratehas improved from 83 per cent in 1998 to 94 per centin 2000. Primary school completion rate, which stoodat 40 per cent in 1998, had improved to 45 per centin 2000. However, the quality of education seems tohave suffered in the process. Several indicators ofeducational quality have not improved as expected.The average pupil-textbook ratio has not declined atthe rate envisaged: at 6.7:1 in 2000, it was higher thanthe anticipated level of 6.0:1. Infrastructure in schoolshas improved, but the average pupil-classroom ratio of125:1 is higher than the target level of 118:1. Also,though the average pupil-teacher ratio declined to 65:1in 2000 from 68:1 in 1999, it was still higher than thetarget 58:1. There are two main reasons behind the poorperformance in these areas; higher than anticipatedgross primary enrolments and continued delays inteacher recruitment. The government is making effortsto improve quality by increasing the availability oftextbooks, expanding school construction and hiringmore teachers. To overcome partially the shortage ofqualified teachers, the government has modified entryrequirements to the teaching services to permitsecondary school graduates to join. In addition, theprocedures for newly recruited government employeesaccessing the payroll is being rationalised.
UGANDA gb 10/01/02 15:11 Page 302