ronald steenblik (oecd) - organisation for economic co-operation
TRANSCRIPT

OECD Expert Workshop on Estimating Support to Fossil Fuels, Paris, 18-19 November 2010
Estimating support to biofuels: lessons learned
Ronald Steenblik Senior Trade Policy Analyst
OECD Trade and Agriculture Directorate

OECD Trade & Agriculture Directorate 2
Interest: rapid rate of growth
o Government support to ethanol traces back to the 1970s in Brazil and the United States, 1990s for the EU, and 2000s in other countries.
o Production and hence subsidies was small until recently. However, with boom in energy prices, and consequent new policies, production soared.

OECD Trade & Agriculture Directorate 3
Increasing share of agricultural output
2007 actual 2013-17 average
(new initiatives)
Maize, US
Share of US output 23.2% 38%
Share of world output 8.4% 13%
Vegetable oils, EU
Share of EU output 47.2% 129%
Share of world output 8.7% 20%

OECD Trade & Agriculture Directorate 4
OECD estimation of impact of removing biofuel support on world commodity prices, 2013-2017 average

OECD Trade & Agriculture Directorate 5
Potential environmental effects
Concern about land-use and other effects

OECD Trade & Agriculture Directorate 6
Measurement motivation: to assess cost-effectiveness
Policy rationales for support policies:
1. Aid farmers, or the rural sector more generally
2. Improve foreign exchange, through import substitution
3. Reduce dependence on energy imported from “unstable”counries
4. Improve quality of the air in cities
5. (Later) Reduce greenhouse gas (GHG) emissions
OECD Trade & Agriculture Directorate 7
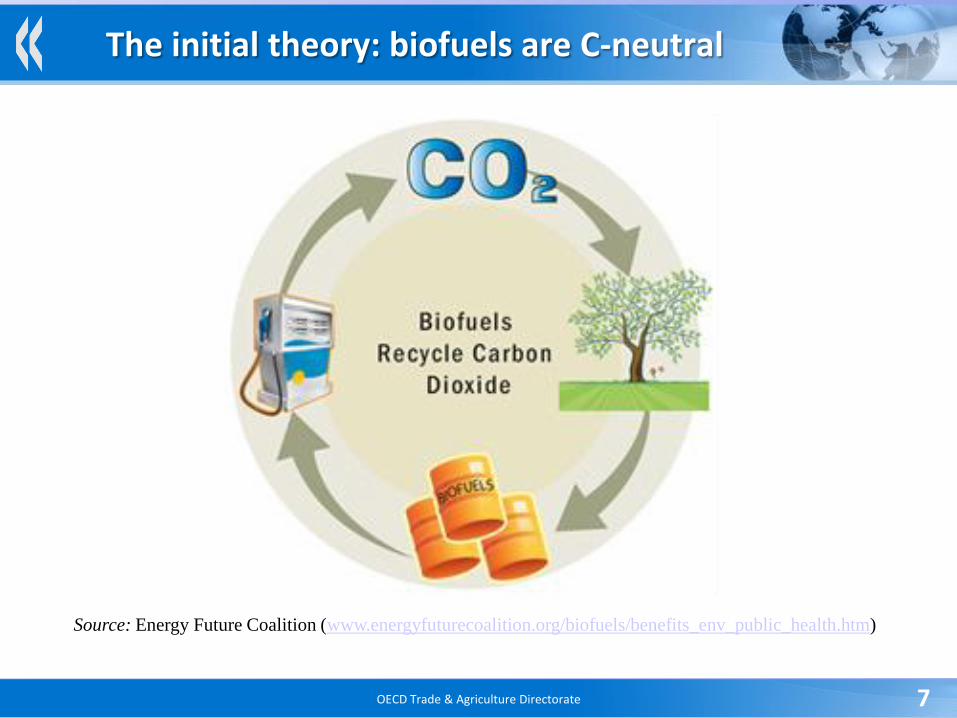
The initial theory: biofuels are C-neutral
Source: Energy Future Coalition (www.energyfuturecoalition.org/biofuels/benefits_env_public_health.htm)

OECD Trade & Agriculture Directorate 8
Who undertook the work?
• Little initial interest in measuring subsidies at the international level.
• However, some organizations — notably the Global Subsidies Initiative (GSI) — noticed that there was a gap in information on subsidies to the sector, and anticipated the need. Started a series of studies in 2006.
• That work eventually spawned new academic work, but generally on analysis, not data.

OECD Trade & Agriculture Directorate 9
Feedstock crop
Energy
Labor
Capital
Water
Intermediate inputs
Land
Subsidies to
value-adding factors
Subsidies to the supply
of intermediate inputs
Crop & irrigation
subsidies
Energy subsidies
Subsidies to
production:
• Production-
linked payments
and tax credits;
•Tax
exemptions;
•Market price
support ( e.g.
import tariffs)
Value-adding factors
Biofuel
By-products
Subsidies to
storage and
distribution
infra-
structure
Vehicles
(car, bus,
truck)
Subsidies for
purchase of
biofuel
Subsidies for
purchase of or
operation of
vehicle
Consumers
of by-
products
(e.g.,
livestock
producers)
Subsidies to
by-product
consuming
industry
Subsidies to
intermediate inputs
Production Consumption
Biofuel Manufacturing
Plant
How the sector is subsidized

OECD Trade & Agriculture Directorate 10
What were the data challenges?
• Direct budgetary expenditure only small part of the picture, and often spread across different ministries and jurisdictions.
• Data on capital-related subsidies are scarce.
• Most important subsidies typically tax related. Information on rates of tax usually available, but not on tax expenditure.
• Estimates of support often required knowing affected volumes, but data on volumes produced or consumed was often not reported by governments.

OECD Trade & Agriculture Directorate 11
What were the methodological challenges?
• Price support often provided through a combination of import tariffs, tax credits or exemptions, and blending mandates.
• Conceptually difficult to disentangle effects in the absence of good price data.
• What should be the reference price for MPS calcula-tions: world biofuel prices, or substitute petroleum products?

OECD Trade & Agriculture Directorate 12
What was the response to the information?
• Initial estimates for just the largest OECD countries placed biofuel support at $11 billion in 2006, and rising rapidly.
• Cost of subsidies was generally in excess of $250 per tonne of CO2-eq avoided.
• Industry generally tried to discredit estimates, or point to employment or taxes it paid.
• Main impact was to raise questions among the environmental and development communities, but eventually also has influenced debate on budget priorities.
http://i160.photobucket.com
OECD Trade & Agriculture Directorate 13
What monitoring continues?
• GSI has provided updates of two of its studies (USA and EU). Partial updates have been undertaken in some cases by studies by national environmental NGOs.
• New country-level studies appearing.
• OECD, through its agricultural PSEs and CSEs picks up some of the support, but only a small fraction.

OECD Trade & Agriculture Directorate 14
Recent IEA estimates of support to biofuels
• For its World Energy Outlook 2010, the IEA published global estimates; updated specific estimates for the USA, the EU and China; and produced new estimates for Brazil.
• Global estimates came to $20 billion in 2009, two-thirds benefitting ethanol, and USA and EU collectively accounting for 80% of government support.
• The IEA projects that, globally, government support to biofuels (under its “New Policies Scenario”) could average $45 billion a year between 2010 and 2020, and $65 billion a year between 2021 and 2035.

OECD Trade & Agriculture Directorate 15
Lessons learned
• Possible now, thanks to Internet, for non-governmental entities to track down information on subsidies.
• However, clearly easier if countries co-operate with researchers.
• NGOs can be the “forward scouts” of subsidy research, but serious monitoring requires large resources.
• No matter who undertakes work, it helps to have guidance on estimation methods. Re-inventing the wheel each time is wasteful.

OECD Trade & Agriculture Directorate 16
Thank You
For more information: [email protected]
www.oecd.org/agriculture
www.oecd.org/trade
Visit our websites:
Contact us: