kansas math and science teacher mobility, 2006-2012 ku center for stem learning steven obenhaus...
TRANSCRIPT
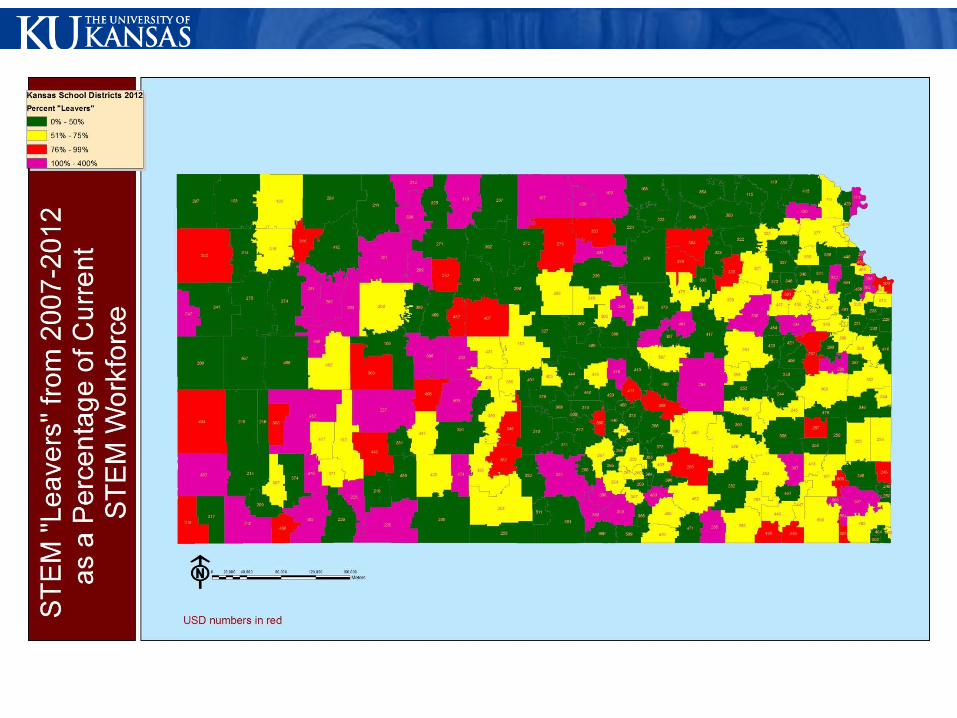
Kansas Math and ScienceTeacher Mobility, 2006-2012
KU Center for STEM Learning
Steven Obenhaus [email protected]

“The challenge to our schools is not just a looming teacher shortage, but rather a shortage of great teachers in the schools and communities where they are needed most” -- Education Secretary Arne Duncan, 2009

Kansas Numbers for 2012-2013• 480,149 total student enrollment• 209,209 secondary students• 286 school districts• Total math teachers: 3028• Total science teachers: 2878• Math teachers per district: mean—10.6, mode—3, median
—4, max—306 • Science teachers per district: mean—10.1, mode—3,
median—4, max—206
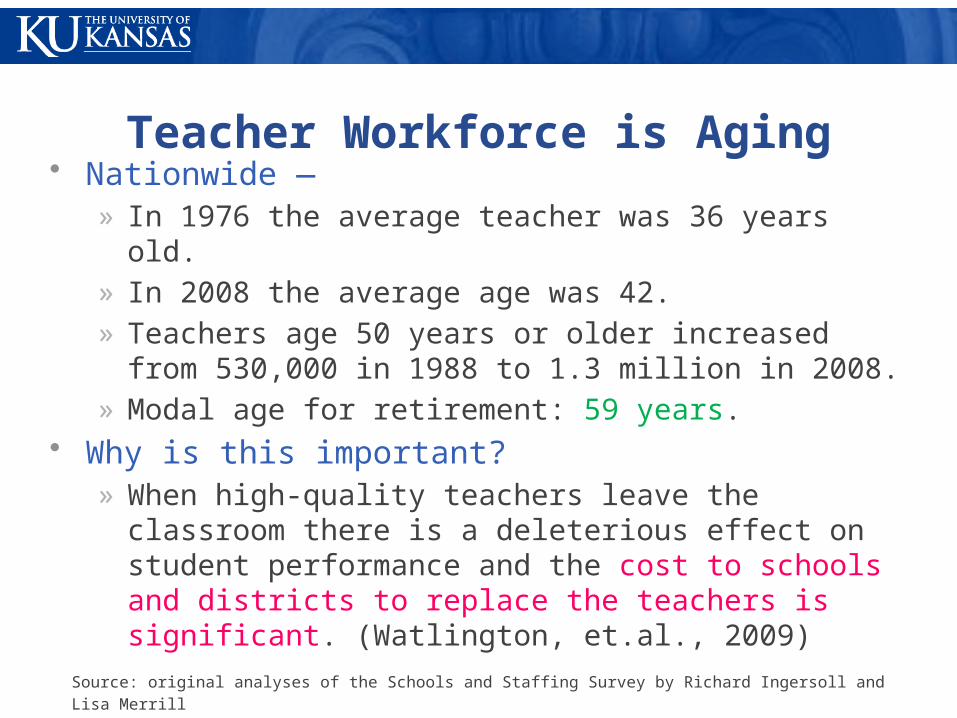
Teacher Workforce is Aging• Nationwide —
» In 1976 the average teacher was 36 years old.» In 2008 the average age was 42.» Teachers age 50 years or older increased from 530,000 in
1988 to 1.3 million in 2008.» Modal age for retirement: 59 years.
• Why is this important?» When high-quality teachers leave the classroom there is a
deleterious effect on student performance and the cost to schools and districts to replace the teachers is significant. (Watlington, et.al., 2009)
Source: original analyses of the Schools and Staffing Survey by Richard Ingersoll and Lisa Merrill

1988 Age Distribution
Source: original analyses of the Schools and Staffing Survey by Richard Ingersoll and Lisa Merrill

2008 Age Distribution
Source: original analyses of the Schools and Staffing Survey by Richard Ingersoll and Lisa Merrill
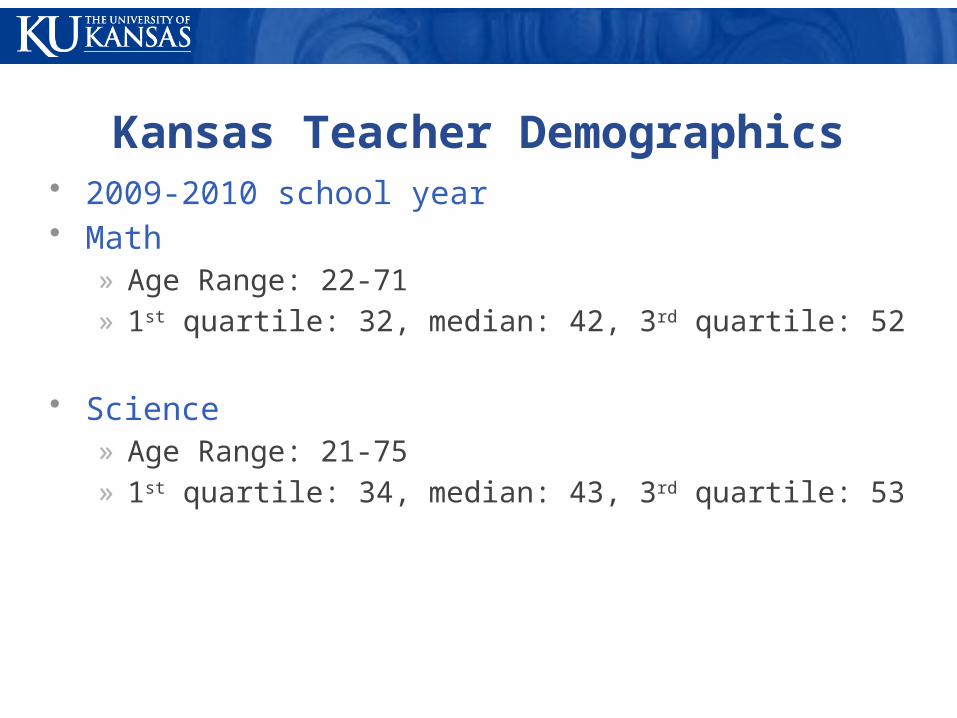
Kansas Teacher Demographics• 2009-2010 school year• Math
» Age Range: 22-71» 1st quartile: 32, median: 42, 3rd quartile: 52
• Science» Age Range: 21-75» 1st quartile: 34, median: 43, 3rd quartile: 53

22 24 26 28 30 32 34 36 38 40 42 44 46 48 50 52 54 56 58 60 62 64 66 68 70
(blan
k)0
20
40
60
80
100
120
Kansas Math Teacher Age Distribution 2010

21 23 25 27 29 31 33 35 37 39 41 43 45 47 49 51 53 55 57 59 61 63 65 67 69 71 74
(blan
k)0
10
20
30
40
50
60
70
80
90
Kansas Science Teacher Age Distribu-tion 2010
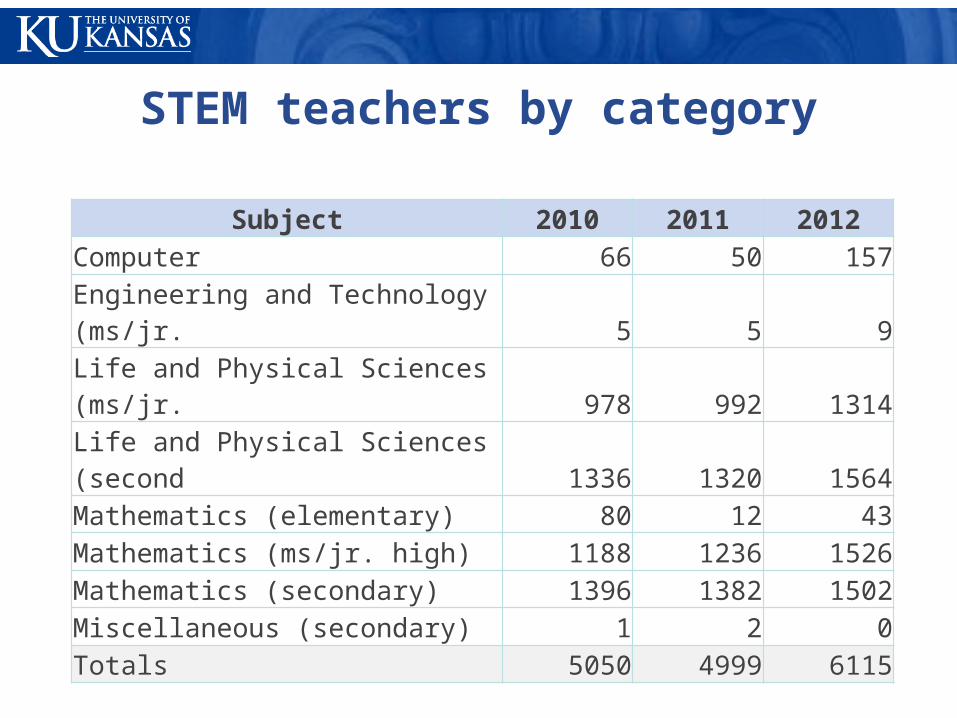
STEM teachers by category
Subject 2010 2011 2012Computer 66 50 157Engineering and Technology (ms/jr. 5 5 9Life and Physical Sciences (ms/jr. 978 992 1314Life and Physical Sciences (second 1336 1320 1564Mathematics (elementary) 80 12 43Mathematics (ms/jr. high) 1188 1236 1526Mathematics (secondary) 1396 1382 1502Miscellaneous (secondary) 1 2 0Totals 5050 4999 6115
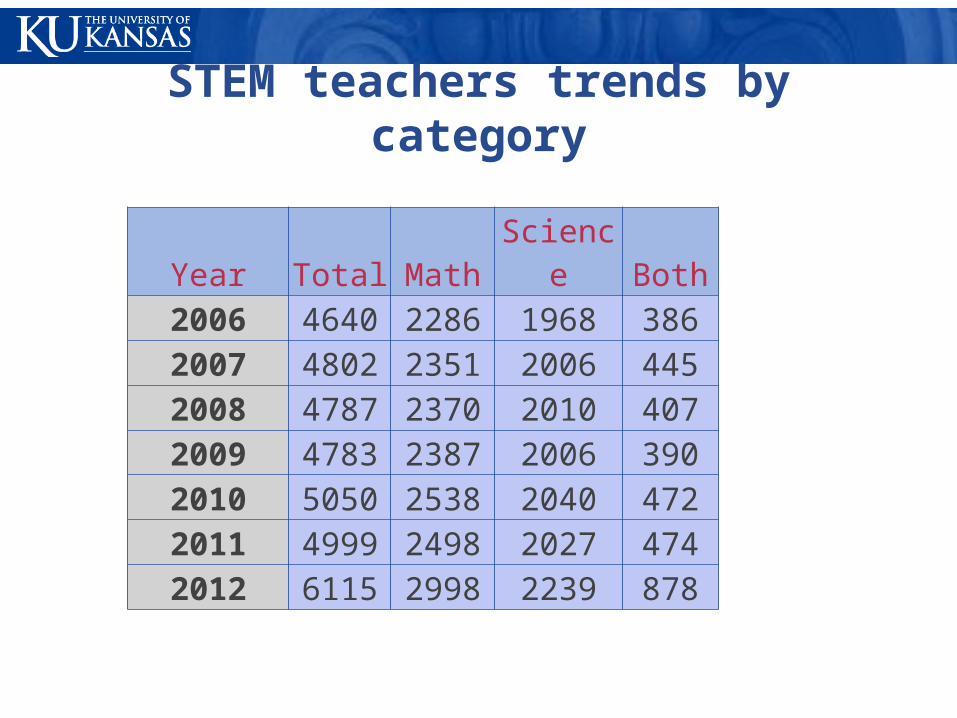
STEM teachers trends by category
Year Total Math Science Both
2006 4640 2286 1968 386
2007 4802 2351 2006 445
2008 4787 2370 2010 407
2009 4783 2387 2006 390
2010 5050 2538 2040 472
2011 4999 2498 2027 474
2012 6115 2998 2239 878

The surge of teacher retirements has prompted some researchers to estimate a need to hire between 2.9 and 5.1 million full-time teachers between 2008 and 2020 (Aaronson & Meckel, 2008). This echoes earlier calls for recruitment, such as Secretary Richard Riley’s appeal in 1994 for 2 million new teachers. In response to his challenge, the U.S. hired approximately 2.25 million teachers over the next decade. Between 1995 and 2005, schools and districts lost 2.7 million teachers due to steadily increasing attrition among beginning teachers and normal retirements. (Carroll, 2007) Now we are facing an unprecedented wave of retirements, on top of beginning teacher attrition that has grown worse over the past 15 years. There is no way that current recruiting strategies – even in hyper drive – can meet this challenge.
Carroll & Foster, 2010

While young teachers and the fresh ideas they can bring are essential to improve teaching effectiveness, experience always matters in teaching. Research clearly shows that with each year of experience, teachers improve their
proficiency and effectiveness during the first seven years.”
--Carroll & Foster, Who Will Teach? Experience Matters, 2010
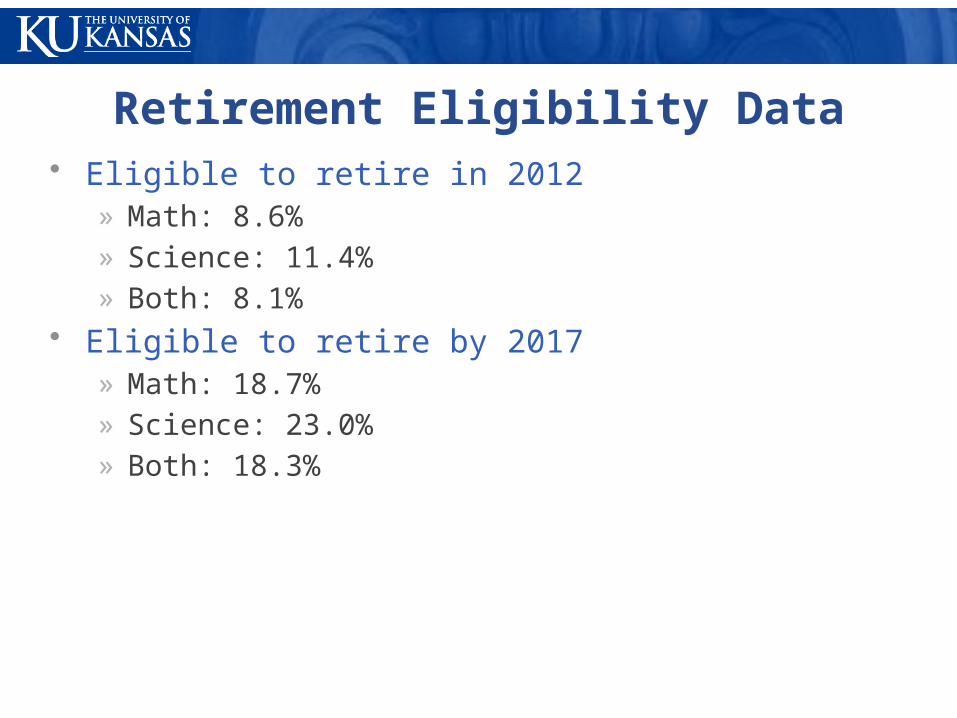
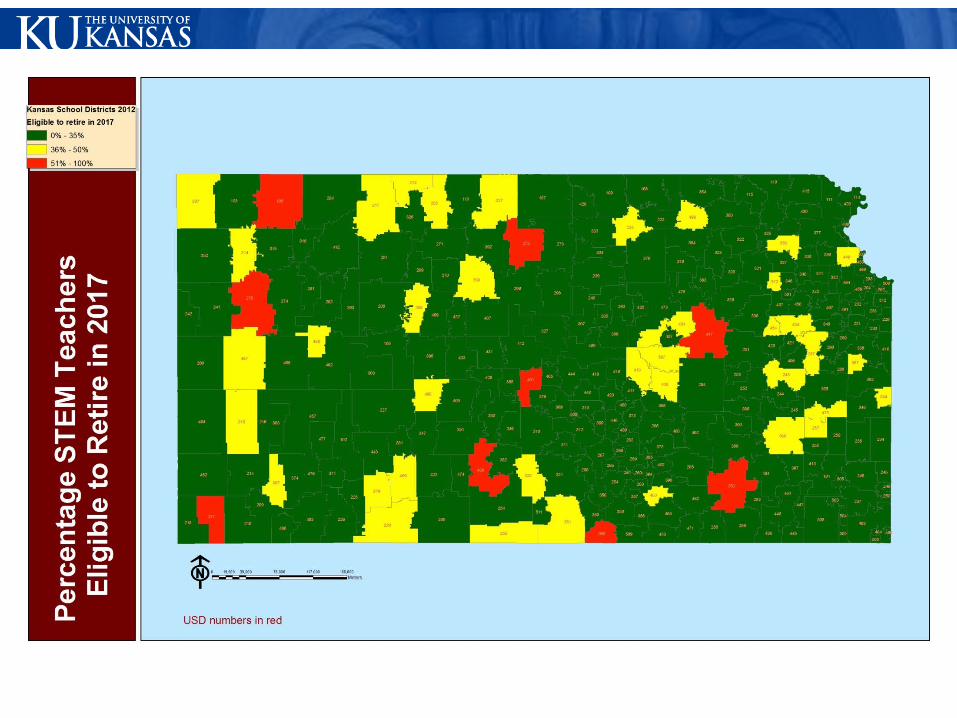
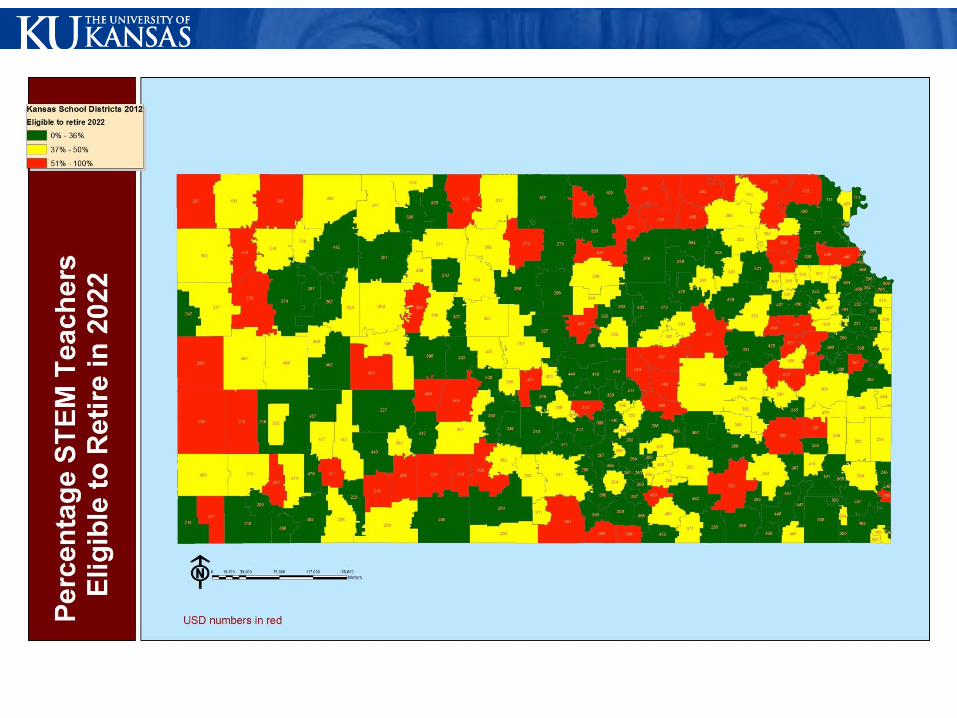
Retirement Eligibility Data• Eligible to retire in 2012
» Math: 8.6%» Science: 11.4%» Both: 8.1%
• Eligible to retire by 2017» Math: 18.7% » Science: 23.0%» Both: 18.3%

Of all those who were teaching anytime from 2006 to 2012 each fell into one of six categories.
• Leaver – taught prior to 2012 but not in 2012.• Mover – changed school districts without a year or more
break.• Returner – took a year or more off then returned to same
district.• Returner_mover – took a year or more break and returned to
a different district.• Starter – 2012 was the teacher’s first year teaching (some
may have taught prior to 2006 and would be categorized as returners if we had the data)
• Stayer – taught prior to 2012 and taught continuously for at least two years in same district through 2012.

All teachers by status in 2012
Status in 2012
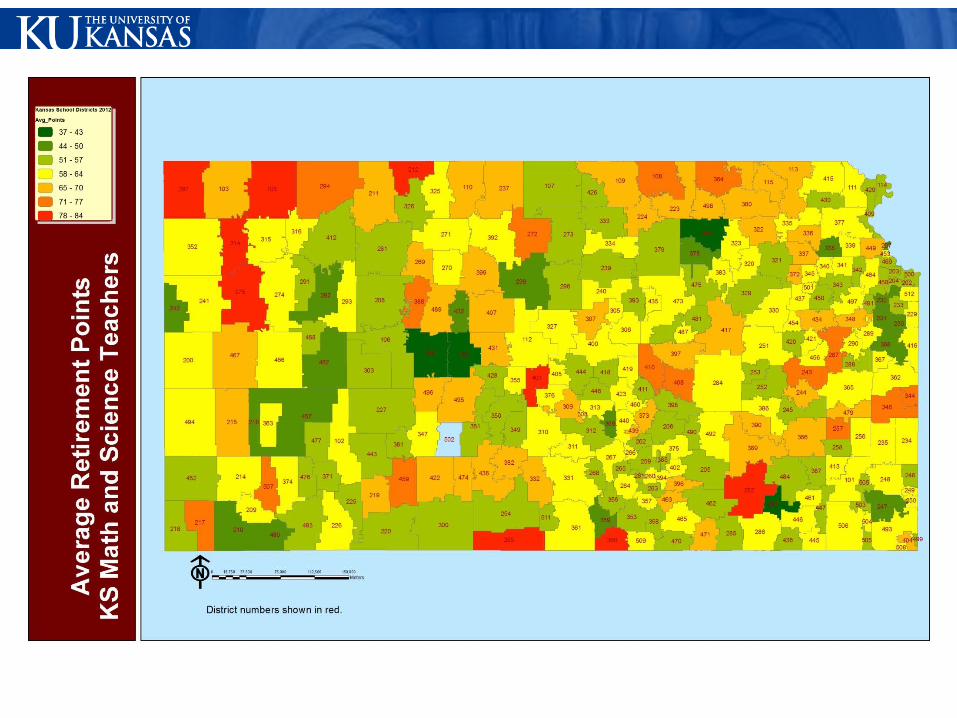
Count Percent Average points
Median points
leaver 3002 32.93 60.2 56mover 518 5.68 50.4 53returner 408 4.48 60.9 64returner/mover
184 2.02 53.4 69.5
starter 1397 15.32 49.6 69stayer 3608 39.57 61.4 48 9117 100

“85” points = Retirement eligible
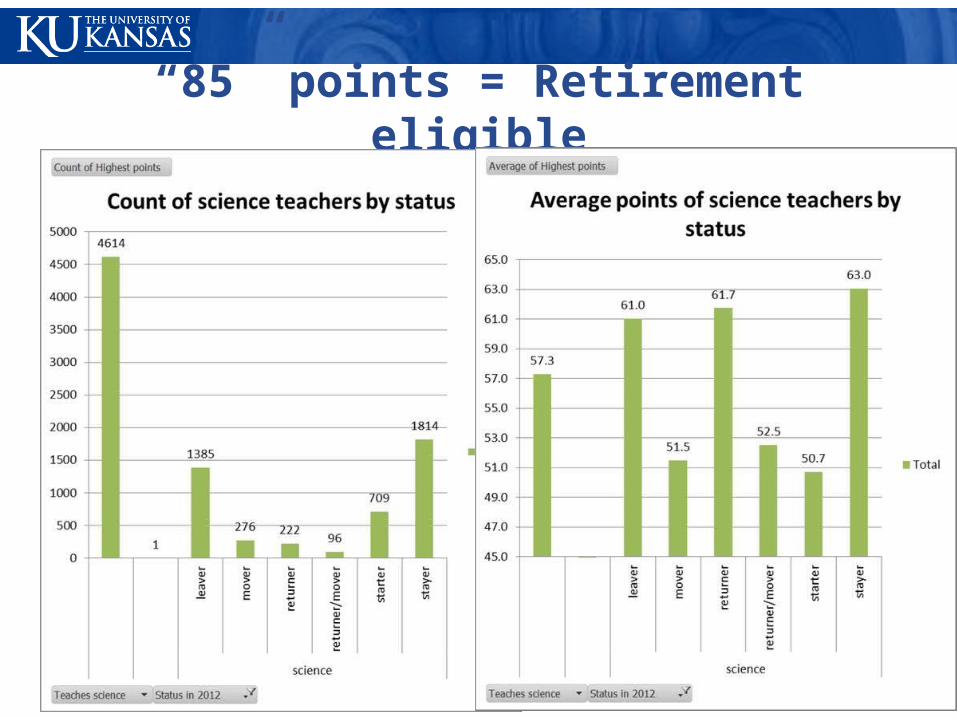
“85” points = Retirement eligible
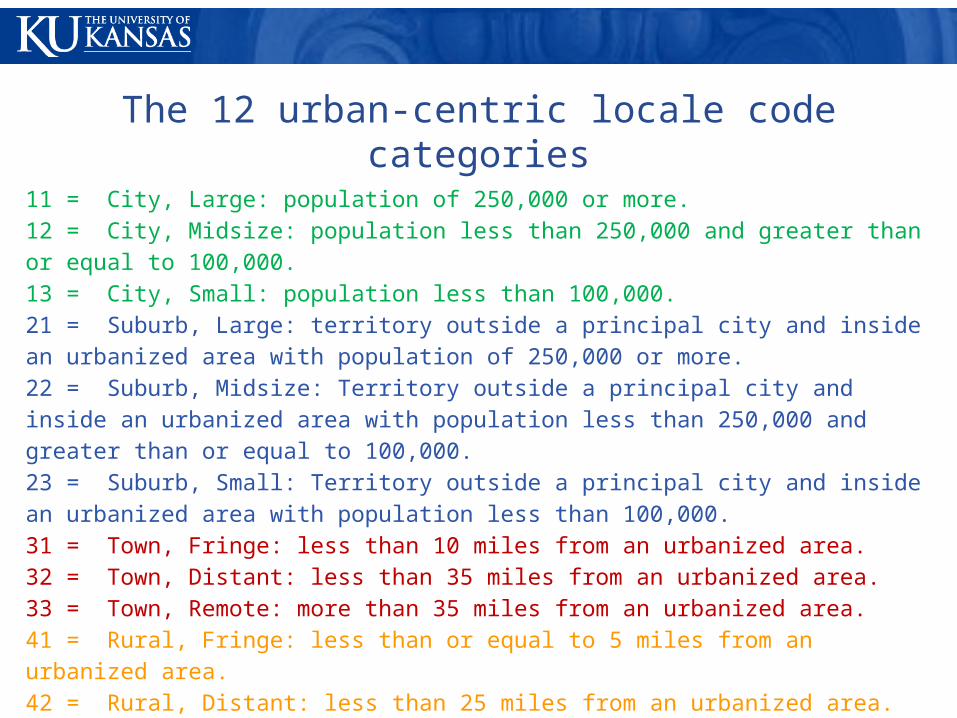
The 12 urban-centric locale code categories
11 = City, Large: population of 250,000 or more. 12 = City, Midsize: population less than 250,000 and greater than or equal to 100,000. 13 = City, Small: population less than 100,000. 21 = Suburb, Large: territory outside a principal city and inside an urbanized area with population of 250,000 or more. 22 = Suburb, Midsize: Territory outside a principal city and inside an urbanized area with population less than 250,000 and greater than or equal to 100,000. 23 = Suburb, Small: Territory outside a principal city and inside an urbanized area with population less than 100,000. 31 = Town, Fringe: less than 10 miles from an urbanized area. 32 = Town, Distant: less than 35 miles from an urbanized area. 33 = Town, Remote: more than 35 miles from an urbanized area. 41 = Rural, Fringe: less than or equal to 5 miles from an urbanized area.42 = Rural, Distant: less than 25 miles from an urbanized area.43 = Rural, Remote: more than 25 miles from an urbanized area.
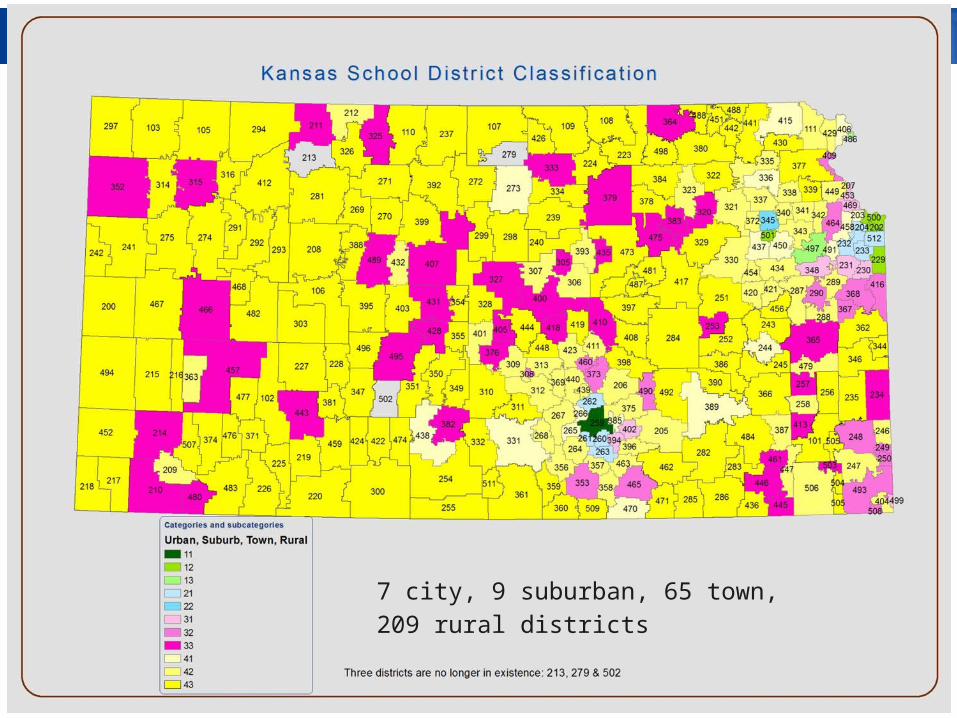
7 city, 9 suburban, 65 town, 209 rural districts

Districts & Teachers by Locale

30 40 50 60 70 80 90 100 110 (blank)0
20
40
60
80
100
120
140
160
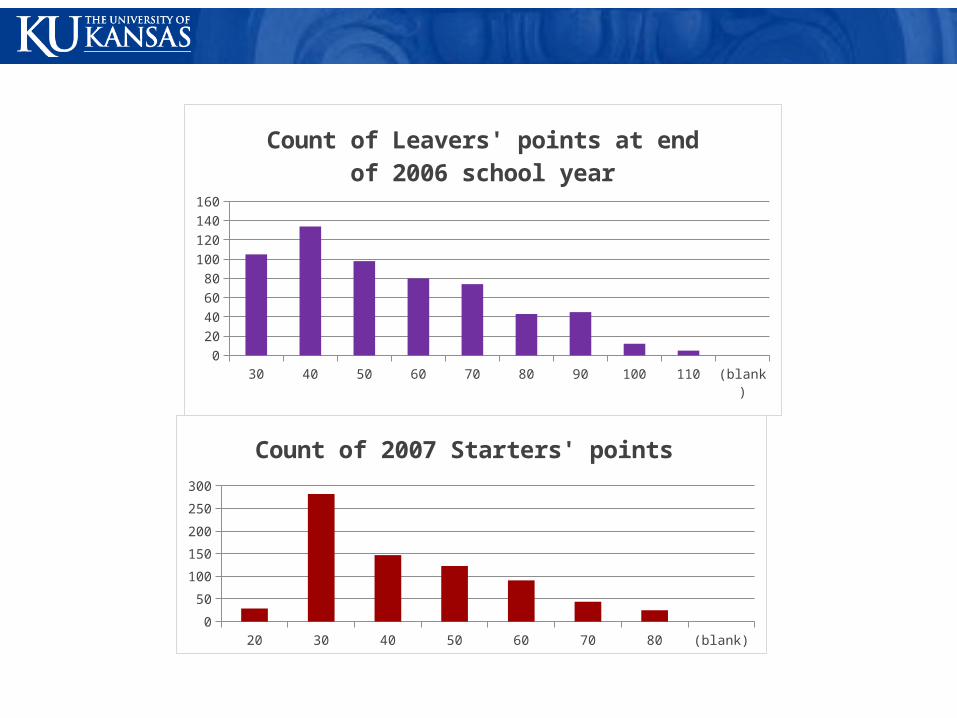
Count of Leavers' points at end of 2006 school year
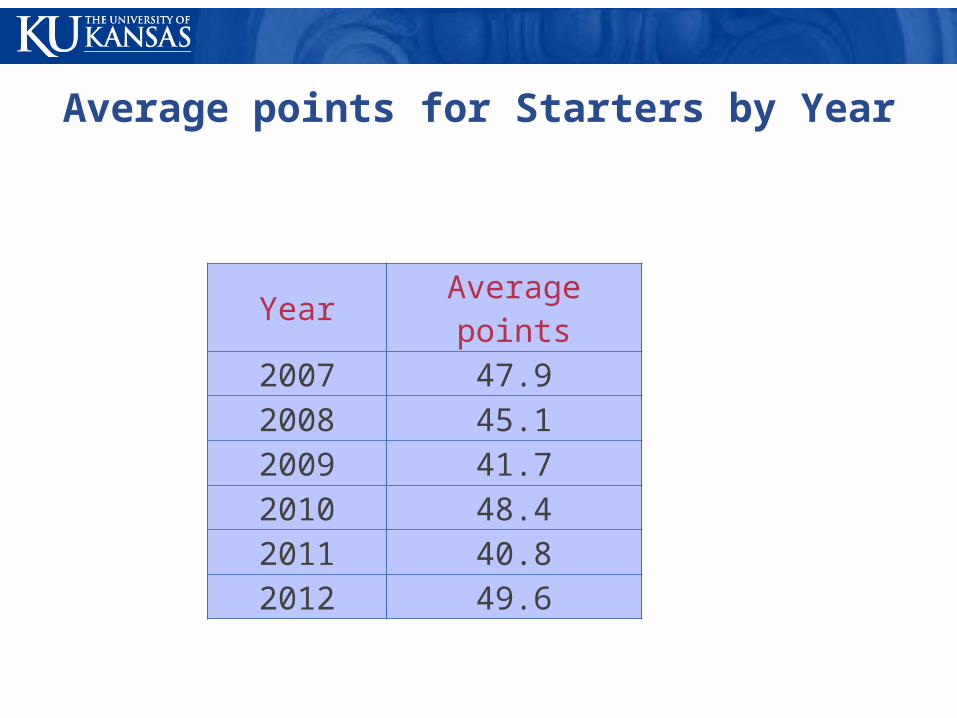
Average points for Starters by Year
Year Average points2007 47.92008 45.12009 41.72010 48.42011 40.82012 49.6

Research on STEM teacher turnover• “The schools do seem to lose more experienced teachers
and teachers with high-demand science and math degrees”
• “a science or math undergraduate degree was associated with odds of attrition approximately twice those for teachers with other undergraduate degrees.”
• “Harrington (2001) blames specific shortages of math and science teachers on a dysfunctional labor market held hostage by poor allocation of resources, disincentives to productivity, and, ironically, inequity. Equal pay for all teachers, he argues, distorts the market for teachers in these technical subject areas.”
Teacher Attrition and Retention: A Meta-Analytic and Narrative Review of the Research, Geoffrey D. Borman and N. Maritza Dowling, Review of Educational Research, Vol. 78, No. 3 (Sep., 2008) , pp. 367-409.
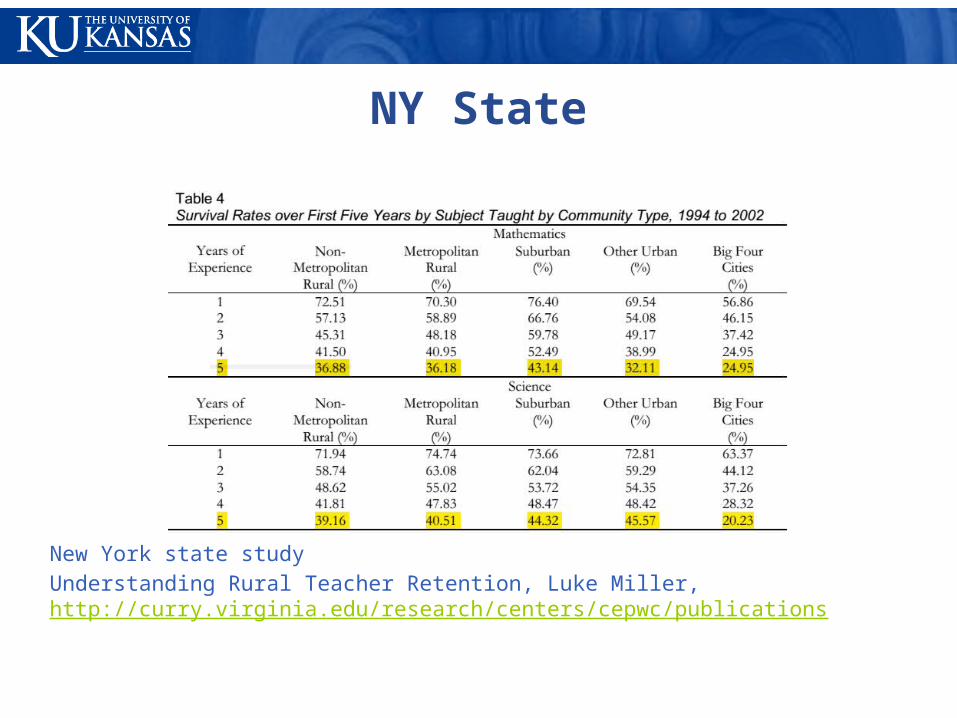
NY State
New York state study
Understanding Rural Teacher Retention, Luke Miller, http://curry.virginia.edu/research/centers/cepwc/publications
30 40 50 60 70 80 90 100 110 (blank)0
20
40
60
80
100
120
140
160
Count of Leavers' points at end of 2006 school year
20 30 40 50 60 70 80 (blank)0
50
100
150
200
250
300
Count of 2007 Starters' points

NC study• “Finally, teachers who majored in mathematics and
science, and especially secondary teachers, are more likely to attrite. Scholars hypothesize that the high exit rates of these teachers are due to the increased alternative opportunities available to people with math and science knowledge and skills.”
Kukla-Acevedo, S. (2009). Leavers, Movers, and Stayers: The Role of Workplace Conditions in Teacher Mobility Decisions. Journal of Educational Research, 102(6), 443-452.

Central US study• “In this sample of schools successful in recruiting, all of the
vacancies were filled, although three principals reported that mathematics and science vacancies were the most difficult to fill.”
Beesley, A., Atwill, K., Blair, P., & Barley, Z. (2008). Strategies for recruitment and retention of secondary teachers in Central Region schools. Denver, CO: Mid-continent Research for Education and Learning.

Rural studies“Schools in rural areas and small towns are more likely to deal with vacancies by cancelling planned course offerings and assigning an administrator or counselor to teach those classes (NCES, 2006). This solution to rural teacher shortages presents dire consequences for rural science, technology, engineering, and mathematics (STEM) instruction in particular. Due to teacher shortages, teachers specializing in other fields are sometimes required to teach STEM courses even if they are underprepared and uncomfortable with teaching these subjects. Ultimately, student science achievement suffers when there is a STEM teacher shortage and when the available teachers are underqualified for the subjects they teach.”
Goodpaster, K. P. S., Adedokun, O. A., & Weaver, G. C. (2012). Teachers' Perceptions of Rural STEM Teaching: Implications for Rural Teacher Retention. Rural Educator, 33(3), 9-22.

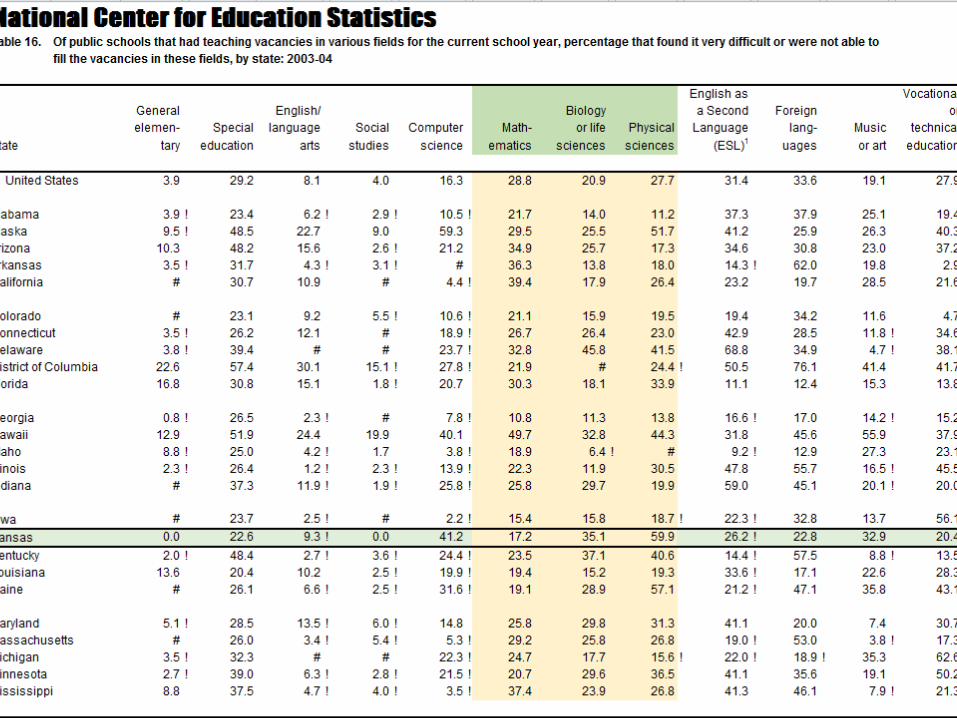
Rural studies“The areas of certification that districts reported as being the most difficult to fill were Math, Science, and Special Education. • Over 50% of responding districts reported math as being
particularly difficult to fill • Over 50 % reported science as being difficult to fill • Approximately 43% reported special education as being
particularly difficult to fill”
“Rural Teacher Retention Study” National Research Center on Rural Education Support policy brief
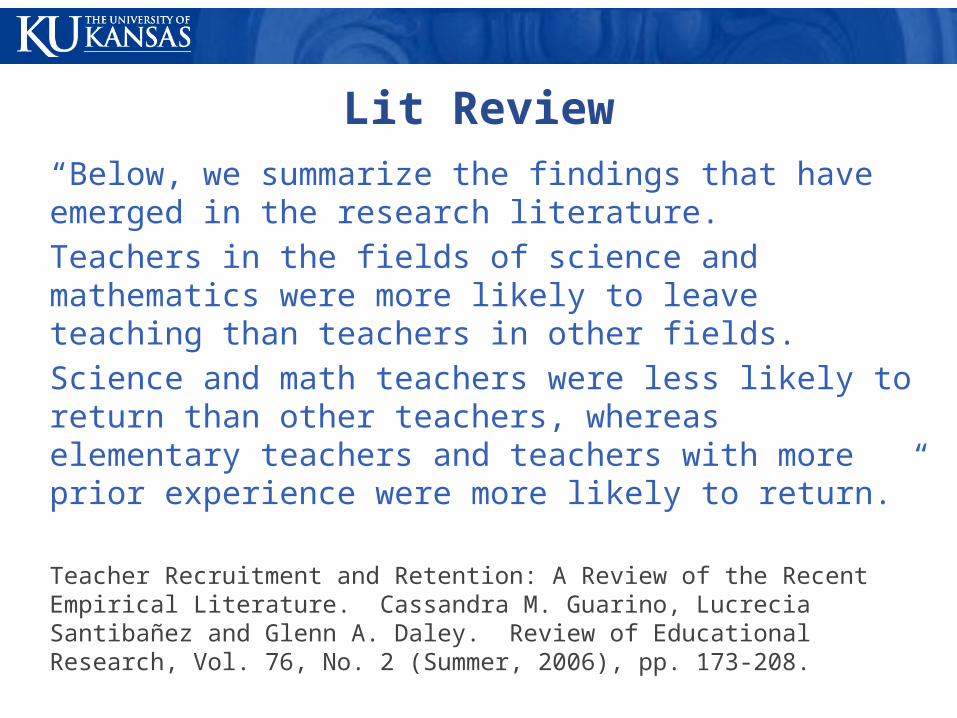
Lit Review“Below, we summarize the findings that have emerged in the research literature.
Teachers in the fields of science and mathematics were more likely to leave teaching than teachers in other fields.
Science and math teachers were less likely to return than other teachers, whereas elementary teachers and teachers with more prior experience were more likely to return.”
Teacher Recruitment and Retention: A Review of the Recent Empirical Literature. Cassandra M. Guarino, Lucrecia Santibañez and Glenn A. Daley. Review of Educational Research, Vol. 76, No. 2 (Summer, 2006), pp. 173-208.

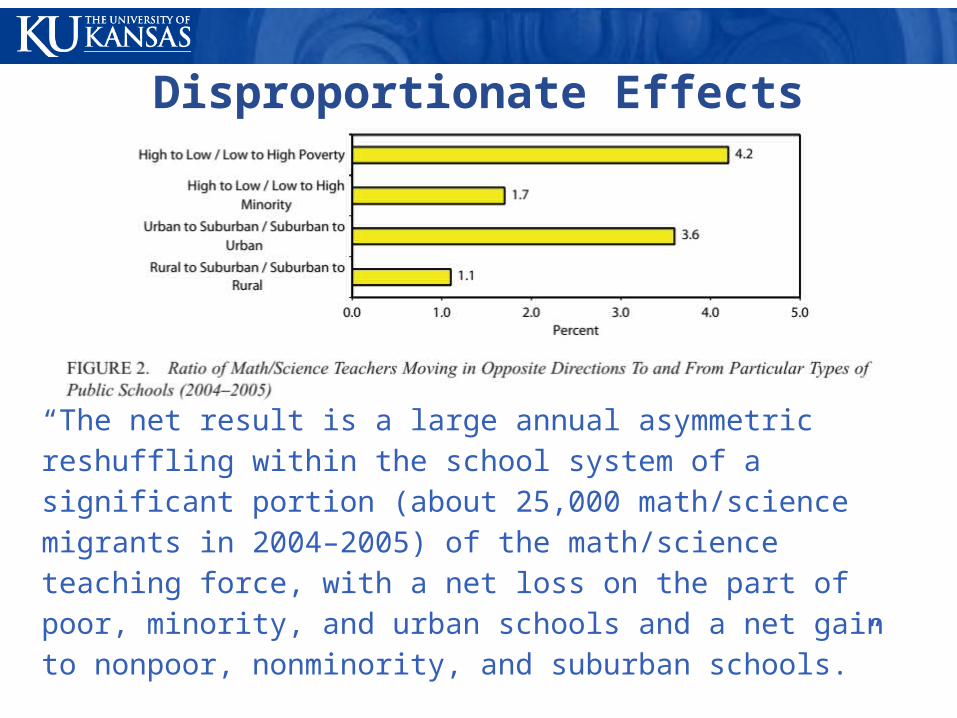
Disproportionate Effects
“The net result is a large annual asymmetric reshuffling within the school system of a significant portion (about 25,000 math/science migrants in 2004–2005) of the math/science teaching force, with a net loss on the part of poor, minority, and urban schools and a net gain to nonpoor, nonminority, and suburban schools.”
Ingersoll & May, The Magnitude, Destinations, and Determinants of Mathematics and Science Teacher Turnover. Educational Evaluation and Policy Analysis, December 2012, Vol. 34, No. 4, pp. 435–464.
Disproportionate Effects“For example, in the shortage areas of science and math, we found that there was more tolerance and leeway among school administrators regarding quality of practice, including allowing weaker teachers to stay on or switch into high-need subject areas despite weak practice and lack of content knowledge. This study also reveals, however, that the recruitment problem in science and other shortage areas was also a retention problem because strong teachers in high-need subject areas could more easily move from one school to another, having the luxury of searching for a culture that was a good fit.”
Cochran-Smith, M., McQuillan, P., Mitchell, K., Terrell, D. G., Barnatt, J., D’Souza, L., . . . Gleeson, A. M. (2012). A Longitudinal Study of Teaching Practice and Early Career Decisions: A Cautionary Tale. American Educational Research Journal, 49(5), 844-880.
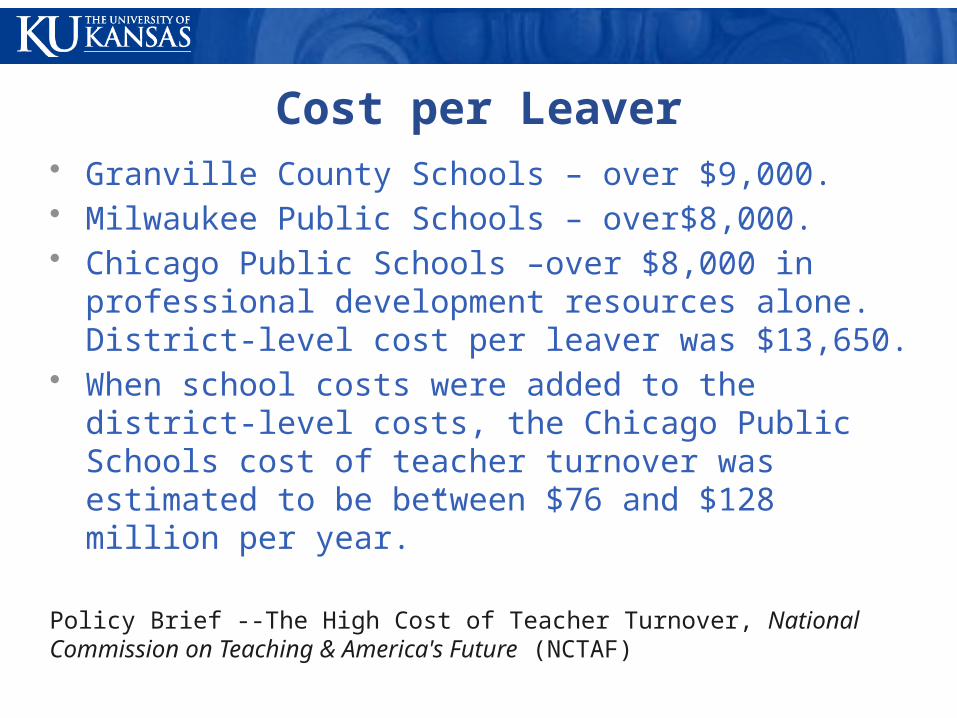
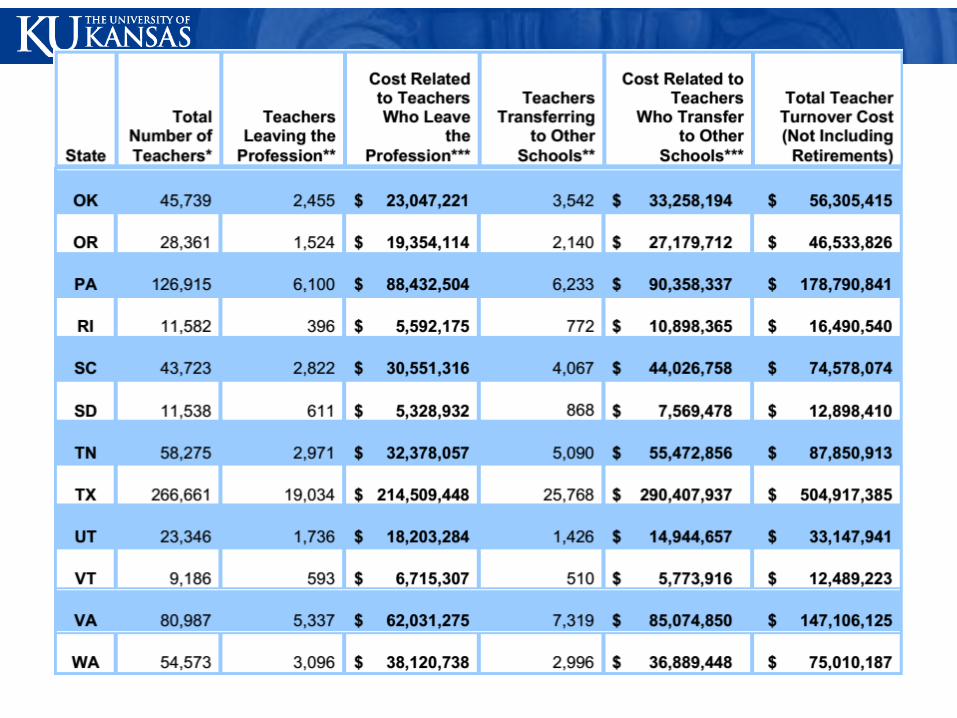
Cost per Leaver• Granville County Schools – over $9,000. • Milwaukee Public Schools – over$8,000. • Chicago Public Schools –over $8,000 in professional
development resources alone. District-level cost per leaver was $13,650.
• When school costs were added to the district-level costs, the Chicago Public Schools cost of teacher turnover was estimated to be between $76 and $128 million per year.”
Policy Brief --The High Cost of Teacher Turnover, National Commission on Teaching & America's Future (NCTAF)
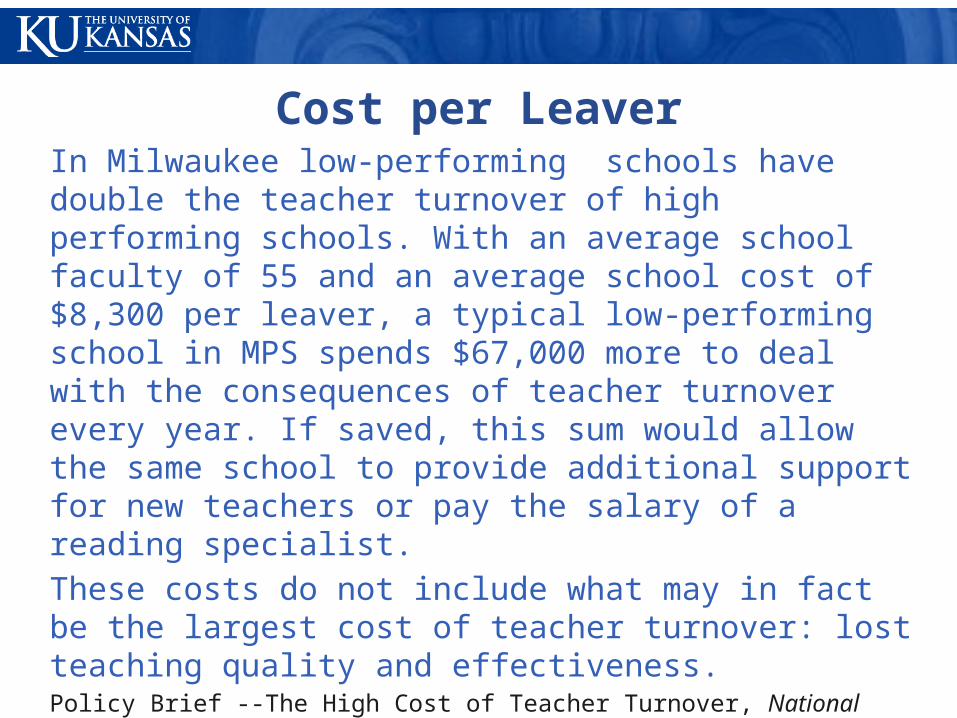
Cost per LeaverIn Milwaukee low-performing schools have double the teacher turnover of high performing schools. With an average school faculty of 55 and an average school cost of $8,300 per leaver, a typical low-performing school in MPS spends $67,000 more to deal with the consequences of teacher turnover every year. If saved, this sum would allow the same school to provide additional support for new teachers or pay the salary of a reading specialist.
These costs do not include what may in fact be the largest cost of teacher turnover: lost teaching quality and effectiveness.Policy Brief --The High Cost of Teacher Turnover, National Commission on Teaching & America's Future (NCTAF)


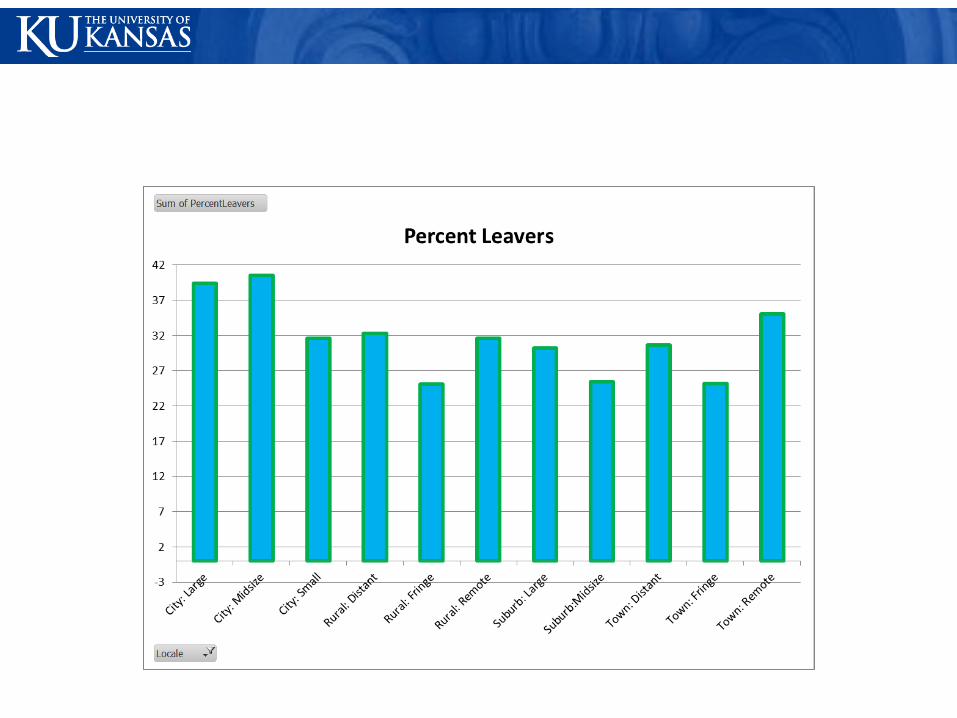
Leavers by Locale (as percentage of workforce)
Number who left district between 2007-2012/ number teaching in 2012
City 74%
Suburb 51%
Town 61%
Rural 59%