katalog bps : 1101001 -...
TRANSCRIPT


Katalog BPS : 1101001.76
SULAWESI BARAT DALAM ANGKA
Sulawesi Barat in Figures
2010
Badan Pusat Statistik Provinsi Sulawesi Barat BPS – Statistics of Sulawesi Barat Province

PROVINSI SULAWESI BARAT DALAM ANGKA 2010 Sulawesi Barat in Figures 2010 ISSN/International Standart Series Number : 1978 - 0400 No. Publikasi/Publication Number : 76550.0801 Katalog BPS/BPS Catalogue : 1101001.76 Ukuran Buku/Book Size : 15 cm x 21 cm Jumlah Halaman/Number of Pages : 463 + halaman/pages Naskah/Manuscript : BPS Propinsi Sulawesi Barat BPS – Statistics of Sulawesi Barat Province Penyunting/Editor : Bidang Integrasi Pengolahan Diseminasi Statistik Division of Data Processing Integration and Statistical Disemination Gambar dan Grafik/ Charth: Seksi Diseminasi dan Layanan Statistik Division of Data Processing Integration and Statistical Disemination Gambar Kulit/ Cover Design: Seksi Diseminasi dan Layanan Statistik Division of Data Processing Integration and Statistical Disemination Diterbitkan oleh/Published by: BPS Provinsi Sulawesi Barat BPS-Statistics of Sulawesi Barat Province Dicetak Oleh/ Printwd by: Boleh dikutip dengan menyebut sumbernya May be cited with reference to the source

Peta Provinsi Sulawesi Barat Map of Sulawesi Barat Province
KEPULAUAN BALA-BALAKANG
KAB. MAMUJU UTARA
POLEWALI
MAJENE
SELAT MAKASSAR
KAB. DONGGALA SULTENG
KAB. LUWU UTARA
SULSEL
KAB. TANA TORAJA SULSEL
KAB.PINRANG SULSEL
KAB. ENREKAN
G SULSEL
PPPRRROOOVVVIIINNNSSSIII SSSUUULLLAAAWWWEEESSSIII
BARAT KAB.
MAMUJU
KAB. MAMAS
MAMAS
KAB. MAJENE
MAMUJU
PASANG KAYU
P.Karampuang
KAB. POLEWALI MANDAR

LAMBANG DAERAH PROVINSI SULAWESI BARAT Symbol of Sulawesi Barat Province
Arti dan Lambang daerah Propinsi Sulawesi Barat, terdiri dari 12 bagian:
1. Maendar Kalumpang tegak berwarna emas; 2. Daratan dan lautan; 3. Gugusan gunung; 4. Sawah; 5. Perahu Sandeq; 6. Ombak Lima; 7. Padi, Bunga Melati dan Sutra; 8. Trisula (Doe Pakka); 9. Payung; 10. Bintang Lima; 11. Bendera Merah Putih dan tulisan di dalamnya; 12. Balenga Lita.
Visi : Terwujudnya kehidupan masyarakat SULAWESI BARAT yang produktif dan terpenuhi hak-hak dasarnya secara merata. Misi : Meningkatkan derajat kehidupan yang layak bagi masyarakat Sulawesi Barat, serta meningkatkan kesetaraan dengan provinsi lainnya

GUBERNUR PROVINSI SULAWESI BARAT
H. ANWAR ADNAN SALEH
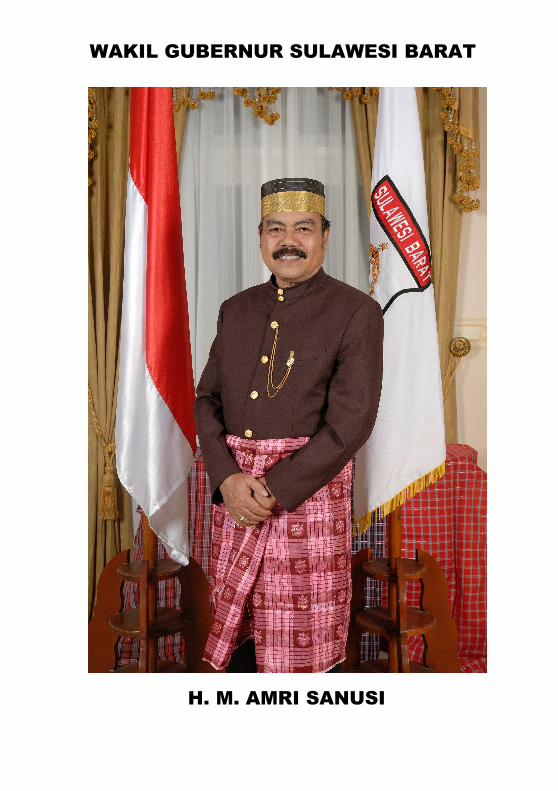
WAKIL GUBERNUR SULAWESI BARAT
H. M. AMRI SANUSI
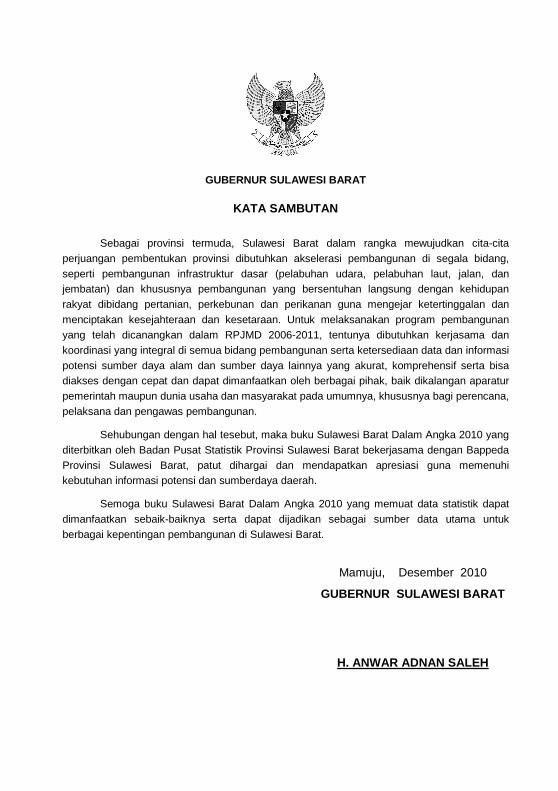
GUBERNUR SULAWESI BARAT
KATA SAMBUTAN
Sebagai provinsi termuda, Sulawesi Barat dalam rangka mewujudkan cita-cita perjuangan pembentukan provinsi dibutuhkan akselerasi pembangunan di segala bidang, seperti pembangunan infrastruktur dasar (pelabuhan udara, pelabuhan laut, jalan, dan jembatan) dan khususnya pembangunan yang bersentuhan langsung dengan kehidupan rakyat dibidang pertanian, perkebunan dan perikanan guna mengejar ketertinggalan dan menciptakan kesejahteraan dan kesetaraan. Untuk melaksanakan program pembangunan yang telah dicanangkan dalam RPJMD 2006-2011, tentunya dibutuhkan kerjasama dan koordinasi yang integral di semua bidang pembangunan serta ketersediaan data dan informasi potensi sumber daya alam dan sumber daya lainnya yang akurat, komprehensif serta bisa diakses dengan cepat dan dapat dimanfaatkan oleh berbagai pihak, baik dikalangan aparatur pemerintah maupun dunia usaha dan masyarakat pada umumnya, khususnya bagi perencana, pelaksana dan pengawas pembangunan.
Sehubungan dengan hal tesebut, maka buku Sulawesi Barat Dalam Angka 2010 yang diterbitkan oleh Badan Pusat Statistik Provinsi Sulawesi Barat bekerjasama dengan Bappeda Provinsi Sulawesi Barat, patut dihargai dan mendapatkan apresiasi guna memenuhi kebutuhan informasi potensi dan sumberdaya daerah.
Semoga buku Sulawesi Barat Dalam Angka 2010 yang memuat data statistik dapat dimanfaatkan sebaik-baiknya serta dapat dijadikan sebagai sumber data utama untuk berbagai kepentingan pembangunan di Sulawesi Barat.
Mamuju, Desember 2010
GUBERNUR SULAWESI BARAT
H. ANWAR ADNAN SALEH

FOREWORD
As a new province, Sulawesi Barat tend to accelerate the development on all sectors such as infrastructure (airport, harbour, road and bridges) especially the development were conduct benevicially for basic need of people such as food crops, plantation N fishery they were all to increase the welfare and equity in economic capability. To implement the development program that had been planned for mid term development (RPJMD) for years 2006-2011, absolutely need cooperation and coordination on all part of development institution, the availability of data and information of natural resources and other resources need accuracy and comprehenshipness and they can be accessed rapidly. Those might used by all stakeholders not only by government and business usage also by people as greater consumers, especially for planning, implementation and supervise the development program.
Due, the book of Sulawesi Barat in Figures 2010, published by BPS-Statistics of Sulawesi Barat Province in collaboration with Regional Development Planning Board of Sulawesi Barat Province (BAPPEDA), should be highly appreciated and pleasantly welcome.
I really expect this book that describing the potential and development have been achieved in the last few years, will be beneficial to all parties, both the government and the private institution and could really become the main data source of Sulawesi Barat Province.
Mamuju, December 2010
GOVERNOR,
H. ANWAR ADNAN SALEH

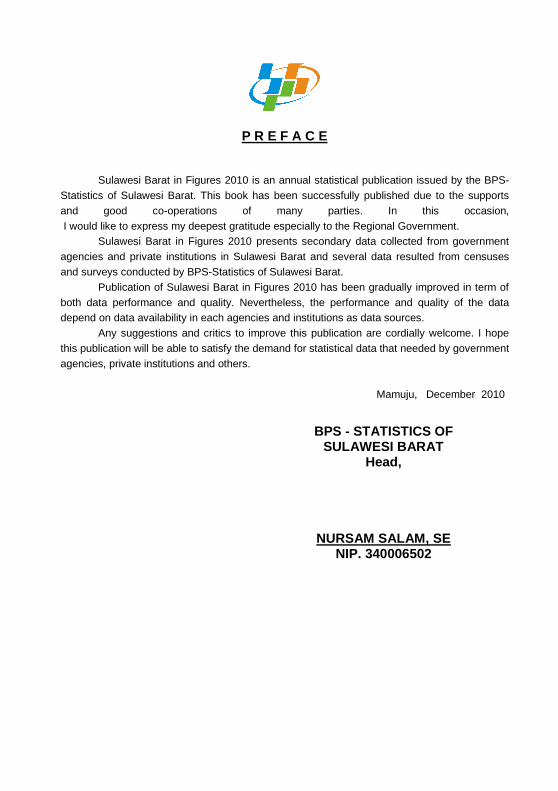
PENGANTAR
Buku Sulawesi Barat Dalam Angka 2010 ini merupakan publikasi statistik tahunan yang diterbitkan oleh Badan Pusat Statistik (BPS) Provinsi Sulawesi Barat. Berhasilnya penerbitan publikasi ini berkat dukungan dan kerja sama yang baik dari semua pihak, untuk ini kami mengucapkan terima kasih terutama kepada Pemerintah Daerah.
Dalam buku ini disajikan data sekunder yang berasal dari berbagai Instansi Pemerintah dan Swasta di Provinsi Sulawesi Barat serta berbagai data hasil sensus dan survei yang dilaksanakan BPS Provinsi Sulawesi Barat.
Publikasi Sulawesi Barat Dalam Angka 2010 disempurnakan secara bertahap baik tampilan maupun kualitasnya. Namun demikian, isinya akan sangat bergantung pada ketersediaan data di masing-masing dinas dan instansi sebagai sumber data.
Saran dan kritik dari semua pihak untuk perbaikan publikasi ini sangat kami harapkan dan semoga publikasi ini dapat membantu kebutuhan data statistik yang diperlukan pemerintah, swasta dan masyarakat.
Mamuju, Desember 2010
BADAN PUSAT STATISTIK
PROVINSI SULAWESI BARAT Kepala,
NURSAM SALAM, SE NIP. 340006502
P R E F A C E
Sulawesi Barat in Figures 2010 is an annual statistical publication issued by the BPS-Statistics of Sulawesi Barat. This book has been successfully published due to the supports and good co-operations of many parties. In this occasion, I would like to express my deepest gratitude especially to the Regional Government.
Sulawesi Barat in Figures 2010 presents secondary data collected from government agencies and private institutions in Sulawesi Barat and several data resulted from censuses and surveys conducted by BPS-Statistics of Sulawesi Barat.
Publication of Sulawesi Barat in Figures 2010 has been gradually improved in term of both data performance and quality. Nevertheless, the performance and quality of the data depend on data availability in each agencies and institutions as data sources.
Any suggestions and critics to improve this publication are cordially welcome. I hope this publication will be able to satisfy the demand for statistical data that needed by government agencies, private institutions and others.
Mamuju, December 2010
BPS - STATISTICS OF
SULAWESI BARAT Head,
NURSAM SALAM, SE NIP. 340006502

TABLE OF CONTENT
SULAWESI BARAT IN FIGURES 2010 xi
DAFTAR ISI Contents
Halaman Page
Peta Propinsi Sulawesi Barat Map of Sulawesi Barat...................................................................................................... i
FOTO GUBERNUR PROVINSI SULAWESI BARAT iii
SAMBUTAN GUBERNUR PROVINSI SULAWESI BARAT Foreword by the Governor of Sulawesi Barat Province...…………………....................... v SAMBUTAN KETUA BAPPEDA PROVINSI SULAWESI BARAT Foreword by the Director of Regional Development Planning Board of Sulawesi Barat Province...…………………....................……………………………………………………………. vii PENGANTAR KEPALA BPS PROPINSI SULAWESI BARAT Preface by the Director of BPS Statistic of Sulawesi Barat..................…………............ ix DAFTAR ISI List of Contents ..................................................................................................................... xi DAFTAR TABEL List of Tables........................................................................................................................ xiii DAFTAR GRAFIK List of Graphs....................................................................................................................... xxxiv PENJELASAN UMUM Explanatary Notes ..................................................................................................................
xxxvi
1. KEADAAN GEOGRAFIS DAN IKLIM Geographical Conditions and Climate...................................................................... 1 – 24
2. PEMERINTAHAN Government
………………………………………………………………………………….. 25 – 48
3.
PENDUDUK DAN KETENAGAKERJAAN Population and Employment ............................................................................. 49 – 82
4. SOSIAL Social at affair ………………...............……………………………………………… 83 – 152

DAFTAR ISI
xii SULAWESI BARAT DALAM ANGKA 2010
5. PERTANIAN Agriculture.………..................................................................................................... 153 – 280
6. PERINDUSTRIAN, PERTAMBANGAN DAN ENERGI Manufacturing,Mining and Energy .......................................................................... 281 – 306
7. TRANSPORTASI DAN KOMUNIKASI Transportation and Communication
............................................................................ 307 – 332
8. KEUANGAN DAERAH Finance.................................................................................................................... 333 – 374
9. PENDAPATAN REGIONAL, INFLASI, NTP Regional Income , Infltation,
NTPNTP..…………….……………………….……………………………375 – 438
10. KEMISKINAN Poverty ……………..............................………...............................................……… 439 – 452
11. PERBANDINGAN NASIONAL National
sssssssCccccCCompaComparison.......................................................453 – 462
SEKILAS BPS About BPS
…………………………………………………………………………………………463
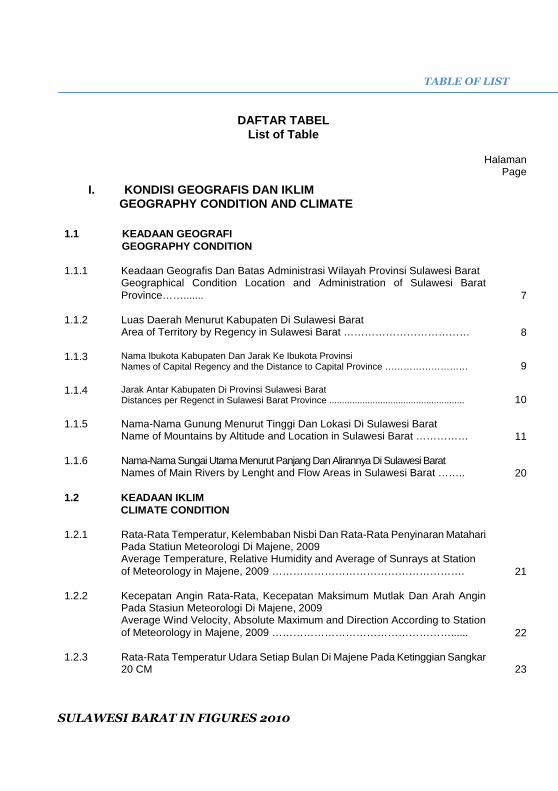
TABLE OF LIST
SULAWESI BARAT IN FIGURES 2010
DAFTAR TABEL List of Table
Halaman Page
I. KONDISI GEOGRAFIS DAN IKLIM GEOGRAPHY CONDITION AND CLIMATE
1.1 KEADAAN GEOGRAFI GEOGRAPHY CONDITION 1.1.1 Keadaan Geografis Dan Batas Administrasi Wilayah Provinsi Sulawesi Barat
Geographical Condition Location and Administration of Sulawesi Barat Province……....... 7
1.1.2 Luas Daerah Menurut Kabupaten Di Sulawesi Barat
Area of Territory by Regency in Sulawesi Barat ……………………………… 8 1.1.3 Nama Ibukota Kabupaten Dan Jarak Ke Ibukota Provinsi
Names of Capital Regency and the Distance to Capital Province ……………………… 9 1.1.4 Jarak Antar Kabupaten Di Provinsi Sulawesi Barat
Distances per Regenct in Sulawesi Barat Province ..................................................... 10 1.1.5 Nama-Nama Gunung Menurut Tinggi Dan Lokasi Di Sulawesi Barat
Name of Mountains by Altitude and Location in Sulawesi Barat …………… 11 1.1.6 Nama-Nama Sungai Utama Menurut Panjang Dan Alirannya Di Sulawesi Barat
Names of Main Rivers by Lenght and Flow Areas in Sulawesi Barat …….. 20 1.2 KEADAAN IKLIM
CLIMATE CONDITION 1.2.1 Rata-Rata Temperatur, Kelembaban Nisbi Dan Rata-Rata Penyinaran Matahari
Pada Statiun Meteorologi Di Majene, 2009 Average Temperature, Relative Humidity and Average of Sunrays at Station of Meteorology in Majene, 2009 ………………………………………………. 21
1.2.2 Kecepatan Angin Rata-Rata, Kecepatan Maksimum Mutlak Dan Arah Angin
Pada Stasiun Meteorologi Di Majene, 2009 Average Wind Velocity, Absolute Maximum and Direction According to Station of Meteorology in Majene, 2009 ……………………………………………...... 22
1.2.3 Rata-Rata Temperatur Udara Setiap Bulan Di Majene Pada Ketinggian Sangkar
20 CM 23
DAFTAR TABEL
SULAWESI BARAT DALAM ANGKA 2010 xiv
Average of Temperature Every Month in Majene at Cage Elevation Above Ground 20 cm 1.2.4 Jumlah Curah Hujan, Hari Hujan Dan Tekanan Atm Setiap Bulan Di Majene
Pada Stasiun Meteorologi Dan Geofisika Majene, 2009 Total Rainfall and Pressure Atm Day each Month, in The Meteorological and Gefisika Station At Majene, 2009 …………………………………………… 24
II. PEMERINTAHAN
GOVERNMENT
2.1 WILAYAH ADMINISTRASI ADMINISTRATIVE AREA 2.1.1 Jumlah Kecamatan, Desa/Kelurahan, Dan Nama-Nama Ibukota Kabupaten Di
Sulawesi Barat, 2009 Number of Districts, Villages/Wards, and Capitals of Regency in Sulawesi Barat, 2009 .. 29
2.2 PEMILIHAN UMUM GENERAL ELECTION 2.2.1 Banyaknya Anggota DPRD Provinsi Menurut Partai Dan Jenis Kelamin Provinsi
Sulawesi Barat, 2009 Member of Provincial Parliament from Result of General Election by Party and Sex in Sulawesi Barat, 2009 ……………….…………………………………… 30
2.2.2 Banyaknya Anggota DPRD Provinsi Menurut Partai Dan Pendidikan Provinsi
Sulawesi Barat, 2009 Member of Provincial Parliament from Result of General Electionby Party and Graduated in Sulawesi Barat, 2009 …………………………..…….………… 31
2.2.3 Banyaknya Anggota DPRD Provinsi Menurut Komisi Dan Jenis Kelamin Hasil
Pemilu Provinsi Sulawesi Barat, 2009 Member of Provincial Regional Parliament from Result of General Election by Komision and Sex in Sulawesi Barat, 2009 …………………………………… 32
2.2.4 Banyaknya Anggota DPRD Provinsi Menurut Komisi Dan Pendidikan Provinsi
Sulawesi Barat, 2009 Member of Provincial Regional Parliament from Result of General Electionby Komision and Graduated in Sulawesi Barat, 2009 …………………..……… 33
2.2.5 Banyaknya Anggota DPRD Kabupaten Menurut Partai Provinsi Sulawesi Barat,
2009 Member of Regency Parliament from Result of General Election by Party in Sulawesi Barat, 2009 …………………………………………………………… 34

TABLE OF LIST
SULAWESI BARAT IN FIGURES 2010
2.3 SUMBER DAYA MANUSIA HUMAN RESOURCES 2.3.1 Banyaknya Pegawai Negeri Sipil Di Lingkungan Pemerintah Provinsi Sulawesi
Barat Menurut Unit Kerja/Instansi Dan Pendidikan, 2009 Number Of Civil Servants Environmebt in Sulawesi Barat Province Government By Work Unit/Institution and Education, 2009 ………………… 42
2.3.2 Banyaknya Pegawai Negeri Sipil Di Lingkungan Pemerintah Provinsi Sulawesi
Barat Menurut Unit Kerja/Instansi Dan Golongan, 2009 Number Of Civil Servants Environmebt in Sulawesi Barat Province Government By Work Unit/Institution and Grade, 2009 ……………………… 45
2.3.3 BANYAKNYA PEGAWAI NEGERI SIPIL DI PROVINSI SULAWESI BARAT
MENURUT LINGKUNGAN KERJA/INSTANSI DAN GOLONGAN, 2009 Number Of Civil Servants Environmebt in Sulawesi Barat Province Government By Work Institution and Grade, 2009 …………………………… 48
III. PENDUDUK DAN KETENAGAKERJAAN POPULATION AND EMPLOYMENT
3.1 PENDUDUK POPULATION
3.1.1 Jumlah Penduduk, Rasio Jenis Kelamin, Jumlah Rumahtangga Dan Rata─Rata Anggota Rumah Tangga Menurut Kabupaten Di Sulawesi Barat, 2009 Number of Population, Sex Ratio, Member of Households and Average Household Member by in Sulawesi Barat …………………………………… 56
3.1.2 Jumlah Penduduk Dan Pertumbuhan Penduduk Menurut Kabupaten Di Sulawesi Barat, 2009 Number and Annual Population Growth by Regency in Sulawesi Barat ……
57
3.1.3 Rasio Jenis Kelamin Menurut Kelompok Umur Dan Kabupaten Di Sulawesi Barat,2009 Sex Ratio By Age Group and Regency in Sulawesi Barat, 2009 …………… 58
3.1.4 Distribusi Dan Kepadatan Penduduk Menurut Kabupaten Di Sulawesi
Barat,2009 Distribution and Population Density By Regency in Sulawesi Barat, 2009 … 59
3.1.5 Angka Beban Tanggungan, Penduduk Menurut Kelompok Umur Dan
Kabupaten Di Sulawesi Barat, 2009 60

DAFTAR TABEL
SULAWESI BARAT DALAM ANGKA 2010 xvi
Number of Liability Costs, Population By Age Group and Regency In Sulawesi Barat, 2009 ……………………………………………………………
3.1.6 Persentase Penduduk Berumur 10 Tahun Ke Atas Menurut Jenis Kelamin Dan
Status Perkawinan Per Kabupaten Di Sulawesi Barat, Tahun 2009 Percentage of Population Aged 10 Years According to Gender Above and Marriage Status As of Regency In Sulawesi Barat, 2009 ……………………… 61
3.1.7 Persentase Penduduk Menurut Kabupaten Dan Kelompok Umur Di Sulawesi
Barat, 2009 Percentage Population by Regency And Age Group In Sulawesi Barat, …… 62
3.1.8 Jumlah Penduduk Menurut Kabupaten Dan Kelompok Umur Di Sulawesi Barat,
2009 Number Population by Regency And Age Group In Sulawesi Barat, ……… 63
3.1.9 Penduduk Berumur 7-24 Tahun Yang Masih Sekolah Menurut Kabupaten Dan
Golongan Umur Di Sulawesi Barat, 2009 Population 7-24 Years of Ages and Over Attending School by Regency and Age Group in Sulawesi Barat, 2009 …………………………………………… 64
3.1.10 Persentase Penduduk Berumur 10 Tahun Ke Atas Menurut Kabupaten Dan Pendidikan Tertinggi Yang Ditamatkan Di Sulawesi Barat, 2009 Percentage of Population of 10 Years of Age and Over by Educational Attainment and Regency, 2009 ………………………………………………… 65
3.2 KETENAGAKERJAAN EMPLOYMENT
3.2.1 Penduduk Berumur 15 Tahun Ke Atas Menurut Kabupaten, Jenis Kegiatan Selama Seminggu Yang Lalu Di Sulawesi Barat, 2009 Population 15 Years of Age and Over by Regency and Type of Activity During the Previous Week in Sulawesi Barat,2009 ………………………… 67
3.2.2 Penduduk Berumur 15 Tahun Keatas Yang Bekerja Selama Seminggu Yang
Lalu Menurut Kabupaten Dan Lapangan Usaha Utama Di Sulawesi Barat, 2009 Population 15 Years and Over Who Worked During The Previous Week by Regency and Main Industry in Sulawesi Barat ……………………………… 69
3.2.3 Upah Minimum Regional (UMR) Di Sulawesi Barat, 1997-2009
Regional Minimum Wages in Sulawesi Barat, 1997-2009 …………………… 70 3.2.4 Jumlah Tenaga Kerja Yang Terdaftar Pada Departemen Tenaga Kerja Di
Sulawesi Barat, 2006-2009 Number of Worker Registry in Sulawesi Barat, 2006-2009 ………………… 71

TABLE OF LIST
SULAWESI BARAT IN FIGURES 2010
3..2.5 Jumlah Transmigran Menurut Daerah Asal Dan Daerah Penempatan Di Sulawesi Barat, 2008-2009 Number of Transmigrants by Place of Origin and Location of Placement in Sulawesi Barat, the Fiscal Year, 2008-2009 …………………………………… 72
3.4 PENGELUARAN PENDUDUK
3.4.1 Persentase Penduduk Menurut Kabupaten Dan Golongan Pengeluaran Per
Kapita Sebulan, 2009 Percentage of Population by Regency and Monthly Per Capita Expenditure Class,2009 78
3.4.2 Persentase Pengeluaran Rata-Rata Per Kapita Sebulan Menurut Jenis
Pengeluaran Dan Golongan Pengeluaran Per Kapita Sebulan Di Sulawesi Barat, 2009 Percentage of Average Expenditure Per Month By Type Capita Expenses and Class Per Capita Expenditure Month In Sulawesi Barat, 2009 ................ 81
SOSIAL Social
3.1 PENDIDIKAN EDUCATION 4.1.1 Banyaknya Sekolah, Guru Dan Murid Sekolah Dasar (Sd) Menurut Kabupaten
Di Sulawesi Barat, 2009 Number of Schools, Teachers and Pupils of Primary Schools by Regency in Sulawesi Barat, 2009 ………………………………………………………………… 91
4.1.2 Banyaknya Sekolah Dasar (SD) Menurut Kabupaten Di Sulawesi Barat, 2009 Number of Primary Schools by Regency in Sulawesi Barat 2009 ......................... 92
4.1.3 Banyaknya Guru Sekolah Dasar (SD) Menurut Kabupaten Di Sulawesi Barat, 2009 Number of Primary Schools Teachers by Regency in Sulawesi Barat, 2009 ......................
93 4.1.4 Banyaknya Murid Sekolah Dasar (SD) Menurut Jenis Kelamin Dan Kabupaten
Di Sulawesi Barat, 2009 Number of Primary Schools Pupils by Sex and Regency in Sulawesi Barat … ..... 94
4.1.5 Banyaknya Lulusan Sekolah Dasar (SD) Menurut Kabupaten Di Sulawesi Barat,
2009 Number of Pupils Graduated from Primary Schools by Regency in Sulawesi Barat, 2009 ............................................................................................................... 95

DAFTAR TABEL
SULAWESI BARAT DALAM ANGKA 2010 xviii
4.1.6 Banyaknya Pegawai Dan Jumlah Ruang Kelas Sekolah Dasar/Madrasah Ibtidaiyah (SD/MI) Di Sulawesi Barat, 2009 Number of Employment and Total Primary School Rooming Primary School and Islamic Elemntary School (SD/MI) in Sulawesi Barat, 2009 ……………… 96
4.1.7 Banyaknya Sekolah, Guru Dan Murid Sekolah Lanjutan Tingkat Pertama (SLTP)
Menurut Status Dan Kabupaten Di Sulawesi Barat, 2009 Number of Schools, Teachers and Pupils of Junior High Schools by Regency in Sulawesi Barat, 2009 ............................................................................................ 97
4.1.8 Banyaknya Pegawai Dan Jumlah Ruang Kelas Sekolah Menengah
Pertama/Madrasah Tsanawiyah (SMP/MTs) Di Sulawesi Barat, 2009 Number of Employment and Total Junior High School Rooming Promary School and Islamic Junior High School (SMP/MTs) in Sulawesi Barat, 2009 … 98
4.1.9 Banyaknya Sekolah, Guru Dan Murid Sekolah Menengah Umum (SMU)
Menurut Kabupaten Di Sulawesi Barat, 2009 Number of Schools, Teachers and Pupils of Senior High Schools by Status and Regency in Sulawesi Barat, 2009 ........................................................................... 99
4.1.10 Banyaknya Pegawai Dan Jumlah Ruang Kelas Sekolah Menengah Umum/Madrasah Aliyah (SMU/MA) Di Sulawesi Barat, 2009 Number of Employment and Total Senior High School Rooming Promary School and Islamic Seniorr High School (SMU/MA) in Sulawesi Barat, 2009 … 100
4.1.11 Banyaknya Sekolah, Guru, Murid Sekolah Menengah Kejuruan (SMK) Menurut Kabupaten Di Sulawesi Barat, 2009 Number of Schools, Teachers,of Vocationally High in Sulawesi Barat,2009…… ......................................................................................................... 101
4.1.12 Banyaknya Pegawai Dan Jumlah Ruang Kelas Sekolah Menengah Kejuruan (SMK) Di Sulawesi Barat, 2009 Number of Employment and Total Classroom Vocationally High School in Sulawesi Barat, 2009 ……………………………………………………….…… 102
4.1.13 Banyaknya Lulusan Sekolah Lanjutan Tingkat Atas (Slta) Menurut Kabupaten Di Sulawesi Barat, 2004/2005-2008/2009 Number of Pupils Graduated from Senior High Schools by Regency/ Municipality in Sulawesi Barat, 2004/2005-2008/2009 ............................................ 103
4.1.14 Banyaknya Sekolah, Guru, Murid Dan Lulusan Madrasah Ibtidaiyah Menurut Kabupaten Di Sulawesi Barat, 2009 Number of Pupils Graduated from Senior High Schools by Regency/ Municipality in Sulawesi Barat, 2009 ........................................................................ 104

TABLE OF LIST
SULAWESI BARAT IN FIGURES 2010
4.1.15 Banyaknya Sekolah, Guru, Murid Dan Lulusan Madrasah Tsanawiyah Menurut Kabupaten Di Sulawesi Barat, 2009 Number of Pupils Graduated from Senior High Schools by Regency/ Municipality in Sulawesi Barat, 2009 ........................................................................ 105
4.1.16 Banyaknya Sekolah, Guru, Murid Dan Lulusan Madrasah Aliyah Menurut Kabupaten Di Sulawesi Barat, 2009 Number of Pupils Graduated from Senior High Schools by Regency/ Municipality in Sulawesi Barat, 2009 ........................................................................ 106
4.1.17 Banyaknya Sekolah, Guru, Murid Dan Lulusan TK Menurut Kabupaten Di Sulawesi Barat, 2009 Number of Pupils Graduated from Senior High Schools by Regency/ Municipality in Sulawesi Barat, 2009 ........................................................................ 107
4.1.18 Banyaknya Sekolah, Guru, Murid Dan Lulusan SLB Menurut Kabupaten Di
Sulawesi Barat, 2009 Number of Pupils Graduated from Senior High Schools by Regency/ Municipality in Sulawesi Barat, 2009 ...................................................................... 108
4.1.19 Banyaknya Sekolah, Guru, Murid Dan Lulusan SDLB Menurut Kabupaten Di Sulawesi Barat, 2009 Number of Pupils Graduated from Senior High Schools by Regency/ Municipality in Sulawesi Barat, 2009 ....................................................................... 109
4.2 KESEHATAN HEALTH 4.2.1 Banyaknya Rumah Sakit Umum, Rumah Sakit Umum Regional Dan Rumah
Sakit Khusus Menurut Kabupaten Di Sulawesi Barat, 2009 Number of Public Hospital, Regional Hospital and Special Hospitals by Regency/ Municipality in Sulawesi Barat, 2009 ....................................................... 110
4.2.2 Banyaknya Puskesmas, Puskesmas Pembantu, Puskesmas Keliling Dan
Posyandu Menurut Kabupaten Di Sulawesi Barat, 2009 Number of Public Health Centers and Integrated Health Service Post by Regency/ Municipality in Sulawesi Barat,2009 ........................................................ 112
4.2.3 Banyaknya Tenaga Kesehatan Menurut Jenis Tenaga Kesehatan Di Sulawesi
Barat, 2007-2009 Number of Health Personal by Kinds Profession in Sulawesi Barat,2007-2009 ……… 113
4.2.4 Banyaknya Penderita Yang Menjalani Rawat Inap Dan Meninggal Oleh Penyakit
Menular Menurut Jenis Penyakit Di Sulawesi Barat, 2009 Number of Patients was Spent the Night at Hospital and Death by Kind of Disease in Sulawesi Barat, 2009.............................................................................. 114

DAFTAR TABEL
SULAWESI BARAT DALAM ANGKA 2010 xx
4.2.5 Penyakit Menonjol Dirinci Menurut Kabupaten Di Provinsi Sulawesi Barat, 2007-2009
Top Disease by Regency in Sulawesi Barat Province,2007-2009 …………… 115 4.2.6 Jumlah Sasaran Dan Realisasi Imunisasi BCG Dan Campak Menurut
Kabupaten Di Sulawesi Barat, 2009 Number of Target and Realization of BCG and Campak Immunization by Regency/ Municipality in Sulawesi Barat, 2009 ...................................................... 116
4.2.7 Jumlah Sasaran Dan Realisasi Imunisasi Polio Menurut Kabupaten Di Sulawesi
Barat, 2009 Number of Target and Realization of Polio Immunization by Regency in Sulawesi Barat, 2009 ................................................................................................ 117
4.3 KELUARGA BERENCANA FAMILY PLANNING 4.3.1 Banyaknya Akseptor Baru Dan Akseptor Aktif Menurut Jenis Kontrasepsi Yang
Dipakai Di Sulawesi Barat, 2009 Number of New and Active Family Plannings Acceptors by Methods of Family Plannings Currenty Used in Sulawesi Barat, 2009 ……………… .......................... 119
4.3.2 Banyaknya Akseptor Baru Dan Akseptor Aktif Menurut Kabupaten Di Sulawesi Barat, 2009 Number of New and Active Family Planning Acceptors by Regency in Sulawesi Barat, 2009 ............................................................................................................... 120
4.3.3 Banyaknya Klinik Keluarga Berencana Menurut Kabupaten Di Sulawesi Barat, 2009 Number of Family Planning Clinics by Regency/ Municipality in Sulawesi Barat, 2009 121
4.4 AGAMA RELIGION
4.4.1 Banyaknya Penduduk Menurut Agama Dirinci Per Kabupaten Di Provinsi
Sulawesi Barat, 2009 Number of Population by Religion per Regency in Sulawesi Barat Province, 2009…… 122
4.4.2 Banyaknya Tempat Peribadatan Menurut Agama Dan Kabupaten Di Sulawesi
Barat, 2009 Number of Worship Facilities by Religion and Regency in Sulawesi Barat, 2009.. .......... 123
4.4.3 Banyaknya Rohaniawan Menurut Agama Dan Kabupaten Di Sulawesi Barat,
2009 Number of Clergymen by Religion and Regency in Sulawesi Barat, 2009.. ........... 125

TABLE OF LIST
SULAWESI BARAT IN FIGURES 2010
4.4.4 Jumlah Jemaah Haji Menurut Kabupaten Dan Jenis Kelamin Di Sulawesi
Barat,2009 Number of Pilgrims by Regency and Sex in Sulawesi Barat, 2009 ………………… 127
4.4.5 Jumlah Jemaah Haji Menurut Kabupaten Dan Pendidikan Di Sulawesi Barat,
2009 Number of Pilgrims by Regency and Education in Sulawesi Barat,2009……………… 128
4.4.6 Jumlah Jemaah Haji Menurut Profesi Dan Kabupaten Di Sulawesi Barat, 2009
Number of Pilgrims by Profession and Regency in Sulawesi Barat, 2009 ……………. 129
4.4.7 Jumlah Jemaah Haji Menurut Kabupaten Dan Bank Tempat Penyetoran Biaya
Perjalanan Ibadah Haji (BPIH) Di Sulawesi Barat, 2009 Total Pilgrims by Regency at Place Bank Deposit of Travel Expenses Pilgrims (BPIH) in Sulawesi Barat, 2009 ……………………………………… 130
4.4.8 Jumlah Jemaah Haji Menurut Kabupaten Dan Kelompok Umur Di Sulawesi
Barat, 2009 Number Pilgrims by Regency and Age Groups in Sulawesi Barat, 2009 …… 131
4.4.9 Jumlah Jemaah Haji Yang Pernah dan Belum Pernah Haji Sebelumnya Menurut
Kabupaten di Sulawesi Barat, 2009 Number Pilgrims Ever and Never before by Regency and Ever in Sulawesi barat, 2009 132
4.4.10 Jumlah Imam Yang Mendapat Bantuan, TPA/TKA Dan Majelis Taqlim Menurut
Kabupaten Di Sulawesi Barat, 2009 Number Prest Gets the Help, TPA/TKA and Taqlim Assembly by Regency in Sulawesi Barat, 2009 …………………………………………………………….. 133
4.4.11 Jumlah Penerimaan Zakat, Infak Dan Shadaqah Menurut Kabupaten Di
Sulawesi Barat, 2009 Total Revenue Zakat, Infak dan Shadaqah by Regency in Sulawesi barat, 2009 …… 134
4.4.12 Jumlah Penyaluran Zakat, Infak Dan Shadaqah Menurut Kabupaten Di
Sulawesi Barat, 2009 Total Distribution Zakat, Infak dan Shadaqah by Regency in Sulawesi barat, 2009 … 135
DAFTAR TABEL
SULAWESI BARAT DALAM ANGKA 2010 xxii
4.5 SOSIAL LAINNYA OTHER SOCIAL AFFAIRS 4.5.1 Jumlah Rumahtangga Menurut Status Penguasaan Bangunan Tempat Tinggal
Di Sulawesi Barat, 2009 Number of Households by Livehouse Building Status in Sulawesi Barat, 2009……… 136
4.5.2 Jumlah Rumahtangga Menurut Kabupaten Dan Jenis Sumber Air Minum Di Sulawesi Barat, 2009 Number of Households by Regency and Source of Drinking Water in Sulawesi Barat 2009 ……………………………………………………………….. 137
4.5.3 Jumlah Rumahtangga Menurut Kabupaten Dan Sumber Penerangan Utama, 2009 Number of Households by Regency and Source Of Light in Sulawesi Barat, 2009 ……………………………………………………………………. 139
4.5.4 Jumlah Rumahtangga Menurut Kabupaten Dan Luas Lantai Bangunan Di Sulawesi Barat, 2009 Number of Households by Regency and Floor Width in Sulawesi Barat,2009 140
4.5.5 Jumlah Rumahtangga Menurut Kabupaten Dan Jenis Atap Rumah Terluas Yang Digunakan, 2009 Number of household by Regency and Types Used Widest, 2009 ………… 141
4.5.6 Banyaknya Lembaga Pemasyarakatan/Rumah Tahanan Negara, Jumlah
Narapidana Dan Tahanan Menurut Kabupaten Di Sulawesi Barat, 2009 Number of State Prison, Detention and House Their Capacities in Sulawesi Barat,2009 142
4.5.7 Jumlah peserta asuransi kesehatan yang tercatat pada PT. Askes menurut
kabupaten, 2009 Number Participants of Health Insurance Listed at PT Askes by Regency in Sulawesi Barat, 2009 ……….……………………………………………………... 143
4.5.8 Jumlah peserta asuransi kesehatan yang tercatat pada pt. Askes yang
melakukan kunjungan berobat ke rumah sakit daerah menurut kabupaten, 2009 Number Participants of Health Insurance Listed at PT ASKES by Regency in Sulawesi Barat, 2009 ………………………………..…………………………... 144
4.5.9 Jumlah Peserta Jamkesmas Yang Tercatat Pada Pt Askes Yang Melakukan
Kunjungan Ke Rumah Sakit Daerah Menurut Kabupaten, 2009 Number Participants of Health Insurance Listed at PT ASKES by Regency in Sulawesi Barat, 2009 …………………………………………………………… 145

TABLE OF LIST
SULAWESI BARAT IN FIGURES 2010
4.5.10 Jumlah Perkara Pidana Yang Masuk, Diputus Dan Sisa Pada Pengadilan
Negeri Di Sulawesi Barat, 2009 Number Sign of Criminals Cases, Disconnected and Rest in State Court in Sulawesi Barat, 2009 ……………………………………………………………... 146
4.5.11 Jumlah Perkara Perdata Yang Masuk, Diputus Dan Sisa Pada Pengadilan
Negeri Di Sulawesi Barat, 2009 Number Sign of Criminals Cases, Disconnected and Rest in State Court in Sulawesi Barat, 2009 ……………………………………………………………... 147
4.5.12 Jumlah Hakim, Panitera/Panitera Pengganti Pada Pengadilan Negeri Di
Sulawesi Barat, 2009 Number Judge, Clerk/Register Substitute Court in Sulawesi Barat, 2009 …… 148
4.5.13 Jumlah Panti Asuhan Dan Anak Yang Di Asuh Dirinci Perkabupaten Di
Sulawesi Barat, 2009 Number Arphanageand Children by Regency in Sulawesi Barat, 2009 ……… 149
4.5.14 Jumlah Karang Taruna Dirinci Menurut Kondisi Dan Kabupaten Di Sulawesi
Barat, 2009 Number Youth Workers by Conditions and Regency in Sulawesi Barat, 2009 150
4.5.15 Jumlah Akta Yang Dikeluarkan Oleh PPAT Yang Terdata Pada Badan
Pertanahan Nasional Menurut Kabupaten, 2009 Number AKTA by PPAT recorded at BPN by Regency in Sulawesi Barat 2009 151
4.5.16 Jumlah Kejadian Kecelakaan Lalu Lintas Dan Jumlah Korban Menurut
Kabupaten Di Sulawesi Barat, 2009 Number events and Total of Traffic Accident Victims by Regency in Sulawesi Barat, 152
V. PERTANIAN AGRICULTURE
5.1 TANAMAN PANGAN FOOD CROPS 5.1.1 Luas Areal Sawah Menurut Sistem Pengairannya Dirinci Per Kabupaten Di
Sulawesi Barat (Ha), 2009 Wetland Area by Drainasing System per Regency in Sulawesi Barat (Hectare), 2009 183
5.1.2 Luas Lahan Sawah Irigasi Dan Non Irigasi Menurut Irigasinya Per Kabupaten Di 185

DAFTAR TABEL
SULAWESI BARAT DALAM ANGKA 2010 xxiv
Sulawesi Barat (Ha), 2009 Wetland Area by Irriagation and Non Irrigation per Regency in Sulawesi Barat (Hectare), 2009
5.1.3 Luas Panen Dan Produksi Padi Sawah Menurut Kabupaten Di Sulawesi Barat, 2009 Harvested Area and Production of Wet Land Paddy per Regency in Sulawesi Barat 2009 186
5.1.4 Luas Panen Dan Produksi Padi Ladang Menurut Kabupaten Di Sulawesi Barat,
2009 Harvested Area and Production of Dry Land Paddy per Regency in Sulawesi Barat, 2009 …………………………………………………………………………….. 187
5.1.5 Luas Panen Dan Produksi Padi Menurut Jenisnya Dirinci Per Kabupaten Di
Sulawesi Barat, 2009 Harvested Area and Production of Paddy by Kind per Regency in Sulawesi Barat, 2009
188
5.1.6 Luas Panen Dan Produksi Jagung Menurut Kabupaten Di Sulawesi Barat, 2009
Harvested Area and Production of Maize by Regency in Sulawesi Barat,2009 ... 189 5.1.7 Luas Panen Dan Produksi Ubi Jalar Menurut Kabupaten Di Sulawesi Barat,
2009 Harvested Area and Production of Sweet Potatos by Regency in Sulawesi Barat, 2009…………………………………………………………………….. 190
5.1.8 Luas Panen Dan Produksi Ubi Kayu Menurut Kabupaten Di Sulawesi Barat,
2009 Harvested Area and Production of Cassava by Regency in Sulawesi Barat, 2009…………………………………………………………….……………………… 191
5.1.9 Luas Panen Dan Produksi Kacang Tanah Menurut Kabupaten Di Sulawesi
Barat, 2009 Harvested Area and Production of Peanuts by Regency in Sulawesi Barat, 2009…………………………………………………………………………………… 192
5.1.10 Luas Panen Dan Produksi Kedelai Menurut Kabupaten Di Sulawesi Barat, 2009
Harvested Area and Production of Soyabeans by Regency in Sulawesi Barat, 2009……… 193
5.1.11 Luas Panen Dan Produksi Kacang Hijau Menurut Kabupaten Di Sulawesi Barat,
2009 Harvested Area and Production of Small Green Pea by Regency in Sulawesi Barat, 2009…………………………………………………………………………… 194

TABLE OF LIST
SULAWESI BARAT IN FIGURES 2010
5.2 SAYURAN VEGETABLES 5.2.1 Luas Panen Dan Produksi Bawang Merah Menurut Kabupaten Di Sulawesi
Barat, 2009 Harvested Area and Production of Shallot by Regency in Sulawesi Barat, 2009…………………………………………………………………………………… 195
5.2.2 Luas Panen Dan Produksi Bawang Daun Menurut Kabupaten Di Sulawesi
Barat, 2009 Harvested Area and Production of sallot Leaf by Regency in Sulawesi Barat, 2009… 196
5.2.3 Luas Panen Dan Produksi Kentang Menurut Kabupaten Di Sulawesi Barat,
2009 Harvested Area and Production of Potato by Regency in Sulawesi Barat, …………… 197
5.2.4 Luas Panen Dan Produksi Kubis Menurut Kabupaten Di Sulawesi Barat, 2009
Harvested Area and Production of Cabbage by Regency in Sulawesi Barat, 2009….……… 198 5.2.5 Luas Panen Dan Produksi Kembang Kol Menurut Kabupaten Di Sulawesi Barat,
2009 Harvested Area and Production of Kombang Kol by Regency in Sulawesi Barat, 2009 … 199
5.2.6 Luas Panen Dan Produksi Petsai/Sawi Menurut Kabupaten Di Sulawesi Barat,
2009 Harvested Area and Production of Mustard Green by Regency in Sulawesi Barat, 2009 … 200
5.2.7 Luas Panen Dan Produksi Wortel Menurut Kabupaten Di Sulawesi Barat, 2009
Harvested Area and Production of Carrot by Regency in Sulawesi Barat, 2009 ……........ 201 5.2.8 Luas Panen Dan Produksi Kacang Merah Menurut Kabupaten Di Sulawesi
Barat, 2009 Harvested Area and Production of Red Beans by Regency in Sulawesi Barat, 2009 …… 202
5.2.9 Luas Panen Dan Produksi Jkacang Panjang Menurut Kabupaten Di Sulawesi
Barat, 2009 Harvested Area and Production of Long Beans by Regency in Sulawesi Barat, 2009 203
5.2.10 Luas Panen Dan Produksi Cabe Besar Menurut Kabupaten Di Sulawesi Barat,
2009 Harvested Area and Production of Chilies Large by Regency in Sulawesi Barat, 2009 … 204
5.2.11 Luas Panen Dan Produksi Cabe Rawit Menurut Kabupaten Di Sulawesi Barat,
2009 Harvested Area and Production of Chayane peppers by Regency in Sulawesi Barat, 2009 205

DAFTAR TABEL
SULAWESI BARAT DALAM ANGKA 2010 xxvi
5.2.12 Luas Panen Dan Produksi Tomat Menurut Kabupaten Di Sulawesi Barat, 2009
Harvested Area and Production of Tomatoes by Regency in Sulawesi Barat, 2009 … 206
5.2.13 Luas Panen Dan Produksi Terong Menurut Kabupaten Di Sulawesi Barat,
2009 Harvested Area and Production of Terong by Regency in Sulawesi Barat, 2009 …………… 207
5.2.14 Luas Panen Dan Produksi Buncis Menurut Kabupaten Di Sulawesi Barat, 2009
Harvested Area and Production of Snaps by Regency in Sulawesi Barat, 2009 ………… 208
5.2.15 Luas Panen Dan Produksi Ketimun Menurut Kabupaten Di Sulawesi Barat,
2009 Harvested Area and Production of Cucumbaer by Regency in Sulawesi Barat, 2009 … 209
5.2.16 Luas Panen Dan Produksi Labu Siam Menurut Kabupaten Di Sulawesi Barat,
2009 Harvested Area and Production of Squash by Regency in Sulawesi Barat, 2009 ……… 210
5.2.17 Luas Panen Dan Produksi Kangkung Menurut Kabupaten Di Sulawesi Barat,
2009 Harvested Area and Production of Water Spinach by Regency in Sulawesi Barat, 2009 211
5.2.18 Luas Panen Dan Produksi Bayam Menurut Kabupaten Di Sulawesi Barat,
2009 Harvested Area and Production of Spinach by Regency in Sulawesi Barat, 2009 …… 212
5.3 BUAH-BUAHAN FRUITS 5.3.1 Banyaknya Tanaman Mengahsilkan Dan Produksi Durian Menurut Kabupaten
Di Sulawesi Barat, 2009 Number Plants Producing and Production of Durians by regency in Sulawesi Barat, 2009 ………………………………………………………………………….. 213
5.3.2 Banyaknya Tanaman Mengahsilkan Dan Produksi Alpokat Menurut Kabupaten
Di Sulawesi Barat, 2009 Number Plants Producing and Production of Alpokado by regency in Sulawesi Barat, 2009 ………………………………………………………………………….. 214
5.3.3 Banyaknya Tanaman Mengahsilkan Dan Produksi Jambu Air Menurut
Kabupaten Di Sulawesi Barat, 2009 Number Plants Producing and Production of Guava by regency in Sulawesi Barat, 2009 …………………………………………………………………………….. 215

TABLE OF LIST
SULAWESI BARAT IN FIGURES 2010
5.3.4 Banyaknya Tanaman Mengahsilkan Dan Produksi Jambu Air Menurut
Kabupaten Di Sulawesi Barat, 2009 Number Plants Producing and Production of Jambu Air by Regency in Sulawesi Barat, 2009 ………………………………………………………………………….. 216
5.3.5 Banyaknya Tanaman Mengahsilkan Dan Produksi Jeruk Besar Menurut
Kabupaten Di Sulawesi Barat, 2009 Number Plants Producing and Production of Big Orange by Regency in Sulawesi Barat, 2009 ………………………………………………………………….. 217
5.3.6 Banyaknya Tanaman Mengahsilkan Dan Produksi Belimbing Menurut
Kabupaten Di Sulawesi Barat, 2009 Number Plants Producing and Production of Carambola by Regency in Sulawesi Barat, 2009 ………………………………………………………………….. 218
5.3.7 Banyaknya Tanaman Mengahsilkan Dan Produksi Jeruk Siam/Keprok Menurut
Kabupaten Di Sulawesi Barat, 2009 Number Plants Producing and Production of Orange by Regency in Sulawesi Barat, 2009 …………………………………………………………………………….. 219
5.3.8 Banyaknya Tanaman Mengahsilkan Dan Produksi Mangga Menurut Kabupaten
Di Sulawesi Barat, 2009 Number Plants Producing and Production of Manggo by Regency in Sulawesi Barat, 2009 …………………………………………………………………………….. 220
5.3.9 Banyaknya Tanaman Mengahsilkan Dan Produksi Manggis Menurut Kabupaten
Di Sulawesi Barat, 2009 Number Plants Producing and Production of Mangusteen by Regency in Sulawesi Barat, 2009 ………………………………………………………………… 221
5.3.10 Banyaknya Tanaman Mengahsilkan Dan Produksi Nangka/Cempedak Menurut
Kabupaten Di Sulawesi Barat, 2009 Number Plants Producing and Production of Jackfruit by Regency in Sulawesi Barat, 2009 ………………………………………………………………………….. 222
5.3.11 Banyaknya Tanaman Mengahsilkan Dan Produksi Salak Menurut Kabupaten Di
Sulawesi Barat, 2009 Number Plants Producing and Production of Bark by Regency in Sulawesi Barat, 2009. 223
5.3.12 Banyaknya Tanaman Mengahsilkan Dan Produksi Sawo Menurut Kabupaten Di
Sulawesi Barat, 2009 Number Plants Producing and Production of Crysophyllium by Regency in Sulawesi Barat, 2009 …………………………………………………………………. 224
DAFTAR TABEL
SULAWESI BARAT DALAM ANGKA 2010 xxviii
5.3.13 Banyaknya Tanaman Mengahsilkan Dan Produksi Markisa Menurut Kabupaten
Di Sulawesi Barat, 2009 Number Plants Producing and Production of Passion by Regency in Sulawesi Barat, 2009 …………………………………………………………………………….. 225
5.3.14 Banyaknya Tanaman Mengahsilkan Dan Produksi Sirsak Menurut Kabupaten Di
Sulawesi Barat, 2009 Number Plants Producing and Production of Sousep by Regency in Sulawesi Barat, 2009 …………………………………………………………………………….. 226
5.3.15 Banyaknya Tanaman Mengahsilkan Dan Produksi Melinjo Menurut Kabupaten
Di Sulawesi Barat, 2009 Number Plants Producing and Production of melinjo by Regency in Sulawesi Barat, 2009 …………………………………………………………………………….. 227
5.3.16 Banyaknya Tanaman Mengahsilkan Dan Produksi Petai Menurut Kabupaten Di
Sulawesi Barat, 2009 Number Plants Producing and Production of Petai by Regency in Sulawesi Barat, 2009 228
5.3.17 Banyaknya Tanaman Mengahsilkan Dan Produksi Jengkol Menurut Kabupaten
Di Sulawesi Barat, 2009 Number Plants Producing and Production of Jengkol by Regency in Sulawesi Barat, 2009 …………………………………………………………………………….. 229
5.3.18 Banyaknya Tanaman Mengahsilkan Dan Produksi Sukun Menurut Kabupaten
Di Sulawesi Barat, 2009 Number Plants Producing and Production of Tootnies by Regency in Sulawesi Barat, 2009 …………………………………………………………………………….. 230
5.3.19 Banyaknya Tanaman Mengahsilkan Dan Produksi Rambutan Menurut
Kabupaten Di Sulawesi Barat, 2009 Number Plants Producing and Production of Rambutan by Regency in Sulawesi Barat, 2009 ………………………………………………………………………….. 231
5.3.20 Banyaknya Tanaman Mengahsilkan Dan Produksi Pepaya Menurut Kabupaten
Di Sulawesi Barat, 2009 Number Plants Producing and Production of Papayas by Regency in Sulawesi Barat, 2009 ………………………………………………………………………….. 232
5.3.21 Banyaknya tanaman mengahsilkan dan produksi pisang menurut kabupaten di
sulawesi barat, 2009 Number Plants Producing and Production of Bananas by Regency in Sulawesi Barat, 2009 ………………………………………………………………………….. 233
TABLE OF LIST
SULAWESI BARAT IN FIGURES 2010
5.3.22 Banyaknya Tanaman Mengahsilkan Dan Produksi Nenas Menurut Kabupaten
Di Sulawesi Barat, 2009 Number Plants Producing and Production of Pineapples by Regency in Sulawesi Barat, 2009 ………………………………………………………………….. 234
5.3.23 Banyaknya Tanaman Mengahsilkan Dan Produksi Langsat/Duku Menurut
Kabupaten Di Sulawesi Barat, 2009 Number Plants Producing and Production of Lanzens by Regency in Sulawesi Barat, 2009 …………………………………………………………………………….. 235
5.4 BIOFARMAKA
MEDICINAL PLANTS 5.4.1 Luas Panen Dan Produksi Jahe Menurut Kabupaten Di Sulawesi Barat, 2009
Harvested Area and Production of Ginger in Sulawesi Barat, 2009 ……………… 236 5.4.2 Luas Panen Dan Produksi Laos/Lengkuas Menurut Kabupaten Di Sulawesi
Barat, 2009 Harvested Area and Production of galangal in Sulawesi Barat, 2009 …………… 237
5.4.3 Luas Panen Dan Produksi Kencur Menurut Kabupaten Di Sulawesi Barat, 2009
Harvested Area and Production of Kencur in Sulawesi Barat, 2009 …………… 238 5.4.4 Luas Panen Dan Produksi Kunyit Menurut Kabupaten Di Sulawesi Barat, 2009
Harvested Area and Production of Turmeries in Sulawesi Barat, 2009 ………… 239 5.4.5 Luas Panen Dan Produksi Lempuyang Menurut Kabupaten Di Sulawesi Barat,
2009 Harvested Area and Production of Zingiber in Sulawesi Barat, 2009 …………… 240
5.4.6 Luas Panen Dan Produksi Temulawak Menurut Kabupaten Di Sulawesi Barat,
2009 Harvested Area and Production of Curcuma in Sulawesi Barat, 2009 ……… 241
5.4.7 Luas Panen Dan Produksi Temuireng Menurut Kabupaten Di Sulawesi Barat,
2009 Harvested Area and Production of Temuireng in Sulawesi Barat, 2009 ………… 242
5.4.8 Luas Panen Dan Produksi Temukunci Menurut Kabupaten Di Sulawesi Barat,
2009 Harvested Area and Production of Temukunci in Sulawesi Barat, 2009 ………… 243
5.4.9 Luas Panen Dan Produksi Kapulaga Menurut Kabupaten Di Sulawesi Barat,
2009 Harvested Area and Production of kapulaga in Sulawesi Barat, 2009 …………… 244
DAFTAR TABEL
SULAWESI BARAT DALAM ANGKA 2010 xxx
5.4.10 Luas Panen Dan Produksi Mengkudu/Pace Menurut Kabupaten Di Sulawesi
Barat, 2009 Harvested Area and Production of Mengkudu in Sulawesi Barat, 2009 ………… 245
5.4.11 Luas Panen Dan Produksi Mahkota Dewa Menurut Kabupaten Di Sulawesi
Barat, 2009 Harvested Area and Production of Mahkota Dewa in Sulawesi Barat, 2009 …… 246
5.4.12 Luas Panen Dan Produksi Keji Beling Menurut Kabupaten Di Sulawesi Barat,
2009 Harvested Area and Production of Keji Beling in Sulawesi Barat, 2009 ……… 247
5.4.13 Luas Panen Dan Produksi Sambiloto Menurut Kabupaten Di Sulawesi Barat,
2009 Harvested Area and Production of Paniculata in Sulawesi Barat, 2009 …………. 248
5.4.14 Luas Panen Dan Produksi Lidah Buaya Menurut Kabupaten Di Sulawesi Barat,
2009 Harvested Area and Production of Aloe Vera in Sulawesi Barat, 2009 ………….. 249
5.5 TANAMAN HIAS
ORNAMENTAL PLANT 5.5.1 Luas Panen Dan Produksi Anggrek Menurut Kabupaten Di Sulawesi Barat,
2009 Harvested Area and Production of Orcid in Sulawesi Barat, 2009 ………………. 250
5.5.2 Luas Panen Dan Produksi Anthurium Bunga Menurut Kabupaten Di Sulawesi
Barat, 2009 Harvested Area and Production of Anthurium Bunga in Sulawesi Barat, 2009 … 251
5.5.3 Luas Panen Dan Produksi Gladiol Menurut Kabupaten Di Sulawesi Barat, 2009
Harvested Area and Production of Gladiol in Sulawesi Barat, 2009 …………..… 252 5.5.4 Luas Panen Dan Produksi Heliciona Menurut Kabupaten Di Sulawesi Barat,
2009 Harvested Area and Production of Heliciona in Sulawesi Barat, 2009 …………. 253
5.5.5 Luas Panen Dan Produksi Mawar Menurut Kabupaten Di Sulawesi Barat, 2009
Harvested Area and Production of Rose in Sulawesi Barat, 2009 ……………….. 254 5.5.6 Luas Panen Dan Produksi Melati Menurut Kabupaten Di Sulawesi Barat, 2009
Harvested Area and Production of Jasmine in Sulawesi Barat, 2009 ………….. 255

TABLE OF LIST
SULAWESI BARAT IN FIGURES 2010
5.5.7 Luas Panen Dan Produksi Palem Menurut Kabupaten Di Sulawesi Barat, 2009 Harvested Area and Production of Palm in Sulawesi Barat, 2009 ………….……. 256
5.5.8 Luas Panen Dan Produksi Pakis Menurut Kabupaten Di Sulawesi Barat, 2009
Harvested Area and Production of Fern in Sulawesi Barat, 2009 ………….…….. 257
5.6 KEHUTANAN FORESTRY 5.6.1 Luas Kawasan Hutan Berdasarkan Fungsi Di Sulawesi Barat (HA), 2009
Area of Forest by Function in Sulawesi Barat (Hectare),2009 ……………………. 258 5.6.2 Produksi Hasil Hutan Kayu Dan Non Kayu Di Sulawesi Barat (Dalam M3), 2009
Production of Timber and Non Timber in Sulawesi Barat (In Cubic), …………… 260
5.6.3 Produksi Hasil Hutan Kayu Dan Non Kayu Di Sulawesi Barat (Dalam M3), 2009 Production of Timber and Non Timber in Sulawesi Barat (In Meter Cubic), … … 261
5.7 PERKEBUNAN EASTATE CROPS 5.7.1 Banyaknya Perusahaan Perkebunan Besar Swasta Menurut Lokasi, Luas Lahan, Luas Tanaman
Yang Diusahakan Dan Jenis Tanaman Di Sulawesi Barat , 2009 Number of Estate Establishments by Location, Land Area, Planted Area and Kind of Crops in Sulawesi Barat, ………………………………………………… 262
5.7.2 Luas Panen Dan Produksi Kelapa Dalam Menurut Kabupaten Di Sulawesi
Barat, 2009 Harvested Area and Production of Tall Coconut by Regency in Sulawesi Barat, 2009 ….… 263
5.7.3 Luas Panen Dan Produksi Kelapa Hibrida Menurut Kabupaten Di Sulawesi
Barat, 2009 Harvested Area and Production of Hybrida Coconut by Regency in Sulawesi Barat, 2009 ……………………………………………………………………………… 264
5.7.4 Luas Panen Dan Produksi Kelapa Sawit Menurut Kabupaten Di Sulawesi Barat,
2009 Harvested Area and Production of Coconut Palm by Regency in Sulawesi Barat,2009 265
5.7.5 Luas Panen Dan Produksi Kakao Menurut Kabupaten Di Sulawesi Barat,2009
Harvested Area and Production of Cocoa by Regency in Sulawesi Barat, 2009 ……… 266

DAFTAR TABEL
SULAWESI BARAT DALAM ANGKA 2010 xxxii
5.7.6 Luas Panen Dan Produksi Cengkeh Menurut Kabupaten Di Sulawesi Barat,
2009 Harvested Area and Production of Clove by Regency in Sulawesi Barat, 2009 ………… 267
5.7.7 Luas Panen Dan Produksi Sagu Menurut Kabupaten Di Sulawesi Barat, 2009
Harvested Area and Production of Sago by Regency in Sulawesi Barat, 2009……… 268 5.7.8 Luas Panen Dan Produksi Aren/Enau Menurut Kabupaten Di Sulawesi Barat,
2009 Harvested Area and Production of Sugar Palm by Regency in Sulawesi Barat, 2009 ……… 269
5.7.9 Luas Panen Dan Produksi Kemiri Menurut Kabupaten Di Sulawesi Barat, 2009
Harvested Area and Production of Candienut by Regency in Sulawesi Barat, 2009 ……… 270 5.7.10 Luas Panen Dan Produksi Vanili Menurut Kabupaten Di Sulawesi Barat, 2009
Harvested Area and Production of Vanili by Regency in Sulawesi Barat,2009 ……… 271 5.7.11 Luas Panen Dan Produksi Lada Menurut Kabupaten Di Sulawesi Barat, 2009
Harvested Area and Production of Pepper by Regency in Sulawesi Barat, 2009 ……… 272 5.7.12 Luas Panen Dan Produksi Jambu Mete Menurut Kabupaten Di Sulawesi Barat,
2009 Harvested Area and Production of Cashew Nut by Regency in Sulawesi Barat, 2009………… 273
5.7.13 Luas Panen Dan Produksi Kapuk Menurut Kabupaten Di Sulawesi Barat, 2009
Harvested Area and Production of Kapok by Regency in Sulawesi Barat, 2009………… 274 5.7.14 Luas Panen Dan Produksi Kopi Robusta Menurut Kabupaten Di Sulawesi
Barat, 2009 Harvested Area and Production of Robusta Coffee by Regency in Sulawesi Barat,2009 275
5.7.15 Luas Panen Dan Produksi Kopi Arabika Menurut Kabupaten Di Sulawesi Barat,
2009 Harvested Area and Production of Arabica Coffee by Regency in Sulawesi Barat,2009 276
5.8 PETERNAKAN ANIMAL HUSBANDRY 5.8.1 Populasi Ternak Besar Menurut Jenis Ternak Dan Kabupaten Di Sulawesi Barat
(Ekor), 2009 Number of Big Livestock by Kind and Regency in Sulawesi Barat (Heads), 2009 277
5.8.2 Populasi Ternak Kecil Menurut Jenis Ternak Dan Kabupaten Di Sulawesi Barat 278

TABLE OF LIST
SULAWESI BARAT IN FIGURES 2010
(Ekor), 2009 Number of Small Livestock by Kind and Regency in Sulawesi Barat (Heads), 2009 ..........................................................................................................................
5.8.3 Populasi Unggas Menurut Jenis Ternak Dan Kabupaten Di Sulawesi Barat
(Ekor), 2009 Number of Poultry by Kind and Regency in Sulawesi Barat (Heads), 2009…. ..... 279
5.8.4 Produksi Telur Menurut Jenis Ternak Dan Kabupaten Di Sulawesi Barat (Kg),
2009 Production of Eggs by Kind and Regency in Sulawesi Barat (Kg), 2009……....... 280
5.8.5 Produksi Daging Ternak Besar Menurut Jenis Ternak Dan Kabupaten Di
Sulawesi Barat (Kg), 2009 Number Meet Production of Big Livestock by Kind and regency in Sulawesi Barat (Kg), 2009 ……………………………………………………………….……….. 281
5.8.6 Produksi Daging Ternak Kecil Menurut Jenis Ternak Dan Kabupaten Di
Sulawesi Barat (Kg), 2009 Number Meet Production of Small Livestock by Kind and regency in Sulawesi Barat (Kg), 2009 ……………………………………………………………………… 282
5.8.7 Jumlah Pemotongan Ternak Besar Menurut Jenis Ternak Dan Kabupaten Di
Sulawesi Barat (Ekor), 2009 Number of Big Livestock by kind and Regency in Sulawesi Barat (Heads), 2009 … 283
5.8.8 Jumlah Pemotongan Ternak Kecil Menurut Jenis Ternak Dan Kabupaten Di
Sulawesi Barat (Ekor), 2009 Number of Small Livestock by kind and Regency in Sulawesi Barat (Heads), 2009 … 284
5.8.9 Jumlah Pemotongan Unggas Menurut Jenis Ternak Dan Kabupaten Di
Sulawesi Barat (Ekor), 2009 Number of Poultry by kind and Regency in Sulawesi Barat (Heads), 2009 …………… 285
5.9 PERIKANAN FISHERY 5.9.1 Produksi Ikan Darat Menurut Jenis Budidaya Dan Kabupaten Di Provinsi
Sulawesi Barat (Ton), 2009 Number Inland Aquawater Culture production by type of Culture and regency in Sulawesi Barat (Ton), 2009 ………………………………………………………….. 286
5.9.2 Nilai Produksi Ikan Darat Menurut Jenis Budidaya Dan Kabupaten Di Provinsi 287

DAFTAR TABEL
SULAWESI BARAT DALAM ANGKA 2010 xxxiv
Sulawesi Barat (Rp. 000), 2009 Value ofr Inland Aquawater Culture production by type of Culture and regency in Sulawesi Barat (000. Rp), 2009 ……………………………………………………..
5.9.3 Produksi Perikanan Budidaya Menurut Jenis Budidaya Dan Kabupaten Di
Provinsi Sulawesi Barat (Rp. 000), 2009 Number Inland Aquawater Culture production by type of Culture and regency in Sulawesi Barat (000 Rp.), 2009 ………………………………………….………….. 288
5.9.4 Produksi Perikanan Budidaya Menurut Jenis Budidaya Dan Kabupaten Di
Provinsi Sulawesi Barat, 2009 Value of Inland Aquawater Culture production by type of Culture and regency in Sulawesi Barat, 2009 ………………………………………………………………….. 289
5.9.5 Jumlah RTP/PP Budidaya Pembesaran Perikanan Menurut Lokasi Budidaya
Dan Kabupaten Di Sulawesi Barat, 2009 Number RTP/PP Enlargement by Location and Regency in Sulawesi Barat, 2009 290
5.9.6 Luas Usaha Pembesaran Perikanan Menurut Lokasi Pembesaran Dan
Kabupaten Di Sulawesi Barat (Ha), 2009 Size Enlargement Fishernies Bussiness by Location and regency in Sulawesi Barat (Ha), 2009 …………………………………………………………………… 291
5.9.7 Produksi Perikanan Budidaya Laut Menurut Triwulanan Dan Kabupaten (Ton),
2009 Marine Fishernies production by Quarter and Regency In Sulawesi Barat (ton), 2009 292
5.9.8 Produksi Perikanan Budidaya Tambak Menurut Triwulanan Dan Kabupaten
(Ton), 2009 Aquawater Fishernies production by Quarter and Regency In Sulawesi Barat (Ton),2009 ……………………………………………………………………………… 293
5.9.9 Produksi Perikanan Budidaya Kolam Menurut Triwulanan Dan Kabupaten (Ton),
2009 Aquawater Culture Fishernies production by Quarter and Regency In Sulawesi Barat (Ton), 2009 ……………………………………………………………………… 294
5.9.10 Produksi Perikanan Budidaya Jaring Apung Menurut Triwulanan Dan
Kabupaten, 2009 Floating Cage Aquawater Culture Fishernies Production by Quarter and Regency In Sulawesi Barat (Ton), 2009 ……………………………………………. 295
5.9.11 Produksi Perikanan Budidaya Sawah Menurut Triwulanan Dan Kabupaten 296

TABLE OF LIST
SULAWESI BARAT IN FIGURES 2010
(Ton), 2009 Aquawater production by Quarter and Regency In Sulawesi Barat (Ton), 2009
5.9.12 Nilai Produksi Perikanan Budidaya Laut Menurut Triwulanan Dan Kabupaten,
2009 Value Marine Fishernies production by Quarter and Regency In Sulawesi Barat (000 Rp.), 2009 ……………………………………………………………… 297
5.9.13 Nilai Produksi Perikanan Budidaya Tambak Menurut Triwulanan Dan
Kabupaten, 2009 Value Aquawater Fishernies production by Quarter and Regency In Sulawesi Barat (000 Rp.), 2009 ……………………………………………………………….. 298
5.9.14 Nilai Produksi Perikanan Budidaya Kolam Menurut Triwulanan Dan Kabupaten,
2009 Value Aquawater Culture Fishernies production by Quarter and Regency In Sulawesi Barat (000 Rp.), 2009 …………………………………………………… 299
5.9.15 Nilai Produksi Perikanan Budidaya Jaring Apung Menurut Triwulanan Dan
Kabupaten (Rp. 000), 2009 Value Floating Cage Aquawater Culture Fishernies Production by Quarter and Regency In Sulawesi Barat (000 Rp.), 2009 ………………………………………… 300
5.9.16 Nilai Produksi Perikanan Budidaya Sawah Menurut Triwulanan Dan Kabupaten
(Rp. 000), 2009 Value Aquawater production by Quarter and Regency In Sulawesi Barat (000 Rp.), 2009 ……………………………………………………………………………… 301
5.9.17 Nilai Produksi Pembesaran Perikanan Menurut Jenis Ikan Dan Kabupaten Di
Sulawesi Barat (Rp. 000), 2009 Value Fishery Production by Kind of Fish and Regency in Sulawesi Barat (000 Rp.), 2009 .............................................................................................................. 302
5.9.18 Produksi Pembesaran Perikanan Menurut Jenis Ikan Dan Kabuapaten Di Sulawesi Barat,
2009 Production of Fishery by Kind of Fish and Regency in Sulawesi Barat (Ton), 2009 … 303
5.10 VAKSINASI
VAKSINATION 5.10.1 Kegiatan Vaksinasi Menurut Jenis Vaksinasi Perkabupaten Di Sulawesi Barat,
2009 Vaksinasation Activity by Kind Of VaksinPer Regency in Sulawesi Barat, 2009 304
DAFTAR TABEL
SULAWESI BARAT DALAM ANGKA 2010 xxxvi
VI. PERINDUSTRIAN, ENERGI DAN PERTAMBANGAN MANUFACTURING, ENERGY AND MINING 6.1 INDUSTRI MANUFACTURING 6.1.1 Banyaknya Perusahaan, Tenaga Kerja Industri Menurut Kabupaten Di Sulawesi
Barat, 2009 Number of Establishments, Investment, Worker and The Value of Production by Regency in Sulawesi Barat,2009 ............................................................................ 311
6.1.2 Nilai Investasi, Nilai Produksi Dan Nilai Bahan Baku/Bahan Penolong Industri Menurut Kabupaten Di Sulawesi Barat, 2009 Investment Value, Production Value, and Other Materials Value of Industry by Regency in Sulawesi Barat, 2009 ............................................................................ 312
6.1.3 Nilai Investasi Dan Produksi Menurut Kabupaten Dan Jenis Industri Di Sulawesi Barat (Juta Rupiah), 2009 Value of Investment and Production by Regency and Kind of Industry in Sulawesi Barat (in Million)2009 ............................................................................... 313
6.2 INDUSTRI BESAR SEDANG LARGE AND MEDIUM INDUSTRY 6.2.1 Banyaknya Perusahaan, Tenaga Kerja, Dan Pengeluaran Untuk Tenaga Kerja
Industri Besar/Sedang Menurut Kode Klasifikasi Industri Di Sulawesi Barat, 2009 Number of Establishment, Workers and Employment Costs of Large and Medium Manufacturing Industries by Industry Classification Code in Sulawesi Barat 2009 ................................................................................................................ 314
6.2.2 Biaya Input Industri Besar/Sedang Menurut Kode Klasifikasi Industri Di Sulawesi
Barat (Dalam Juta Rupiah),2009 Input Cost of Large and Medium Manufacturing Industries by Industry Classification Code in Sulawesi Barat (Million Rupiahs)2009 …………………… 315
6.2.3 Nilai Output Industri Besar/Sedang Menurut Kode Klasifikasi Industri Di Sulawesi Barat, 2009 Value of Gross Output of Large and Medium Manufacturing Industries by Industry Classification Code in Sulawesi Barat 2009 ……………………………… 316
6.2.4 Nilai Pemakaian Bahan Bakar Industri Besar/Sedang Menurut Kode Klasifikasi Industri Di Sulawesi Barat, 2009 Number and Value of Fuel and Lubricants Used of Large/Medium Manufacturing Industries by Industry Classification Code in Sulawesi Barat 2009 ....................... 317

TABLE OF LIST
SULAWESI BARAT IN FIGURES 2010
6.2.5 Nilai Tambah Industri Besar/Sedang Menurut Kode Klasifikasi Industri Di Sulawesi Barat (Dalam Juta Rupiah), 2009 Value Added of Large/Medium Manufacturing Industries by Industry Classification Code in Sulawesi Barat (Million Rupiahs) 2009 .. ............................. 318
6.2.6 Biaya Input Perusahaan Air Minum Di Sulawesi Barat (Dalam Ribuan Rupiah), 2009 Input Cost of Municipal Water Corporation in Sulawesi Barat (Thousand Rupiahs) 2009 319
6.3 ENERGI ENERGY 6.3.1 Pengeluaran Lainnya Perusahaan Air Minum Di Sulawesi Barat (Dalam Ribuan
Rupiah), 2009 Other Expenditures of Municipal Water Company in Sulawesi Barat (Thousand Rupiahs), 2009 ........................................................................................................ 320
6.3.2 Banyaknya Dan Nilai Air Minum Yang Disalurkan Perusahaan Air Minum Di
Sulawesi Barat (Dalam Ribuan Rupiah), 2009 Quantity and Value of Sanitary Water Distributed to Customers in Sulawesi Barat (Thousand Rupiahs), 2009 ............................................................................ 321
6.3.3 Nilai Output Perusahaan Air Minum Di Sulawesi Barat (Dalam Ribuan Rupiah),
2009 Value of Gross Output of Municipal Water Corporation in Sulawesi Barat (Thousand Rupiahs), 2009 ...................................................................................... 322
6.3.4 Jumlah Pelanggan, Daya Tersambung, Dan Energi Terjual Tiap Cabang/Unit Di
Sulawesi Barat, 2009 Number of Costumers, Connected Capacity, and Energy Sold by Branch/Unit in Sulawesi Barat ......................................................................................................... 323
6.3.5 Konsumsi Bahan Bakar Minyak di Sulawesi Barat Menurut Jenis BBM Dan
Triwulan, 2010 Fuel Consumption in Sulawesi Barat by Kind Of Fuel and Quarter, 2010 ………… 324
6.4 PERTAMBANGAN DAN PENGGALIAN MINING AND QUARRYING 6.4.1 Jumlah Perusahaan Pertambangan Dan Penggalian Menurut Kabupaten Dan
Jenis Pertambangan, 2009 325

DAFTAR TABEL
SULAWESI BARAT DALAM ANGKA 2010 xxxviii
Number of Mining and quarrying establishment by Regency and Type of Mining, 2009
6.4.2 Jumlah Perusahaan Pertambangan Menurut Kabupaten Dan Bahan Galian,
2009 Number of Quarrying Establishment by Regency and Kind of Material, 2009 ………… 326
6.4.3 Jumlah Perusahaan Penggalian Menurut Kabupaten Dan Jenis Badan Hukum,
2009 Number of Quarrying Establishment by Regency and Kind of , 2009 ………… 327
6.4.4 Jumlah Tenaga Kerja Perusahaan Dan Usaha Penggalian Menurut Kabupaten,
2009 Number of Establishment and Labour of Quarrying Company by Regency, 2009 328
6.4.5 Jumlah Tenaga Kerja Perusahaan Dan Usaha Penggalian Menurut Jenis Bahan
Galian, 2009 Number of Establishment and Labour of Quarrying Company by Regency, 2009 329
VII. TRANSPORTASI DAN AKOMODASI TRANSPORTATION AND ACCOMODATION 7.1 TRANSPORTASI TRANSPORTATION 7.1.1 Panjang Jalan Menurut Status Jalan Tiap Kabupaten Di Sulawesi Barat (Dalam
KM), 2009 Length of Roada per Regency by Road Status in Sulawesi Barat, 2009 ............ 339
7.1.2 Panjang Jalan Menurut Jenis Permukaan Di Sulawesi Barat (Dalam KM) , 2008-2009 Length of Road by Type of Surface in Sulawesi Barat, 2008-2009……………………… 340
7.1.3 Panjang Jalan Menurut Kondisi Jalan Di Sulawesi Barat,2008-2009
Length of Road by Road Condition in Sulawesi Barat,2008-2009 ……………… 342 7.1.4 Panjang Jalan Menurut Kelas Jalan Di Sulawesi Barat, 2008-2009
Length of Road by Class in Sulawesi Barat,2008-2009 ………..………………… 344 7.1.5 Lalu Lintas Penerbangan Dalam Negeri Di Pelabuhan Udara Tampapadang,
2009 Domestic Air Traffic at Tampapadang Air Port, 2009 …………….……………… 346

TABLE OF LIST
SULAWESI BARAT IN FIGURES 2010
7.1.6 Aktivitas Pelabuhan Sulawesi Barat, 2009
Sea Port Activities in Sulawesi Barat,2009 .............................................................. 348 7.1.7 Aktivitas Muat Pelabuhan Sulawesi Barat, 2007-2009
Activity of Loading Port in Sulawesi Barat, 2007-2009…. ...................................... 349 7.1.8 Aktivitas Bongkar Pelabuhan Sulawesi Barat, 2007-2009
Activity of Discharging Port in Sulawesi Barat,2007-2009 …. ................................ 350 7.1.9 Banyaknya Penumpang Angkutan Laut Di Provinsi Sulawesi Barat(Orang), 2009
Number of Passenger of marine Transportation in Sulawesi Barat ,2009 ……… 351 7.1.10 Banyaknya Kunjungan Kapal Dan Jumlah DWT/GRT Menurut Jenis Pelayaran
Dan Pelabuhan, 2009 Number of Call Ships and Tonage by Sea Port and Trips, 2009 ………………… 352
7.2 AKOMODASI LAINNYA OTHER ACCOMODATION 7.2.1 Banyaknya Stasiun Pemancar TVRI Serta Kekuatan Daya Pancar Menurut
Tempat Kedudukannya Tahun 2009 Number Of TVRI Transmitter Station And Broadcasting Power In Sulawesi Barat, 2009 353
7.2.2 Tingkat Penghunian Kamar (TPK) Hotel Berbintang Dan Akomodasi Lainnya Di
Provinsi Sulawesi Barat, 2009 Occupancy rate at The Starry Hotel and Another Accomodation In Sulawesi Barat, 2009 …………………………………………………………………………….. 354
7.2.3 Rata-Rata Lama Menginap Tamu Asing Dan Nusantara Pada Hotel Berbintang
Dan Akomodasi Lainnya Di Provinsi Sulawesi Barat, 2009 Average of Length Stay of Foreign and Domestic Guest at The Sy=tarry Hotel and Another Accomodation In Sulawesi Barat, 2009 ……………………………… 355
7.2.4 Rata-Rata Tamu Per Kamar (Guest Per Room) Pada Hotel Berbintang Dan Akomodasi Lainnya Di Provinsi Sulawesi Barat, 2009 Average of Guest Per Room at Starry Hotel and Another Accomodation in Sulawesi Barat, 2009 356
VIII. KEUANGAN DAN HARGA-HARGA FINANCE AND PRICES

DAFTAR TABEL
SULAWESI BARAT DALAM ANGKA 2010 xl
8.1 PERBANKAN BANKING 8.1.1 Jumlah Bank Dan Kantor Bank Menurut Kelompok Bank Di Sulawesi Barat, 2009
Number Of Banks And Bank Office By Group Of Bank In Sulawesi Barat, 2009 364 8.1.2 Jumlah Bank Menurut Jenis Dan Status Kantor Di Sulawesi Barat, 2009
Number Of Banks By Group Of Bank And Status Of Office In Sulawesi Barat 2009…..… 365
8.1.3 Posisi Simpanan Perbankan Menurut Jenisnya Dankelompok Bank Di Sulawesi
Barat, (Juta Rupiah) Pada Keadaan Desember 2009 Positionof Banking Deposit By Type Dan Bank Group In Sulawesi Barat, On Desember 2009 …………………………………………………………………………. 366
8.1.4 Posisi Kredit Perbankan Menurut Sektor Ekonomi Di Sulawesi Barat (Juta
Rupiah), 2006-2009 Credit Position By Economic Sector In Sulawesi Barat, 2006-2009 ……………… 367
8.1.5 Posisi Kredit Perbankan Menurut Jenis Penggunaan Di Sulawesi Barat (Juta
Rupiah), 2009 Credits Potition By Type Of Use In Sulawesi Barat (Million Rupiahs) 2009 .. .......... 368
8.1.6 Banyaknya Penabung Dan Nilai Tabungan Dirinci Menurut Kabupaten Di
Sulawesi Barat Number Of Accounts And Value Of Saving By Regency In Sulawesi Barat . ......... 369
8.1.7 Kurs Tengah Beberapa Mata Uang Asing Terhadap Rupiah Di Bank Indonesia
Cabang Makassar, 2005-2010 Foreign Exchange Rate Of Foreign Currensies To The Rupiahs In Bank Of Indonesia Makassar, 2005-2009 …………………………………………………….. 370
8.2 KEUANGAN PEMERINTAH PROVINSI PROVINCE GOVERNMENT FINANCE 8.2.1 Rancangan Pendapatan Daerah Pemerintah Provinsi Sulawesi Barat Menurut
Jenis Pendapatan (Rupiah), 2009 Draft Local Revenue of The Government of Sulawesi Barat Province by Kind of Revenue, 2009 .......................................................................................................... 371
8.2.2 Rancangan Pengeluaran Daerah Pemerintah Provinsi Sulawesi Barat Menurut
Jenis Pengeluaran (Rupiah), 2009 Draft Local Expenditure Of The Government Of Sulawesi Barat Province By Kind Of Expenditure 2009 .......................................................................................... 372
8.2.3 Rekapitulasi Pembiayaan Daerah Pemerintah Provinsi Sulawesi Barat(Rupiah),
2009 373
TABLE OF LIST
SULAWESI BARAT IN FIGURES 2010
Local FinanceRecapitulation of The Government Of Sulawesi Barat Province (Rupiah) 2009 ………………………………………………………………………..
8.2.4 Rancangan Anggaran Pendapatan Dan Belanja Daerah Pemerintah Provinsi
Sulawesi Barat(Rupiah), 2009 Draft Of APBD Of The Government Of Sulawesi Barat Province (Rupiah), 2009 374
8.2.5 Rancangan Pengeluaran Pemerintah Provinsi Sulawesi Barat Menurut Jenis Pengeluaran (Rupiah), 2009 Draft Development Expenditure Of The Government Of Sulawesi Barat Province By Kind Of Expenditure (Rupiah), 2009 …………………………………………… 377
8.3 KEUANGAN PEMERINTAH KABUPATEN REGENCY GOVERNMENT FINANCE 8.3.1 APBD Pemerintah Kabupaten Se Provinsi Sulawesi Barat Menurut Jenisnya
(Ribu Rupiah), 2010 Baudget Government Revenue And Expenditure By Kind (000 Rp.) 2010 ……… 378
8.3.2 Anggaran Pendapatan Pemerintah Kabupaten Se Sulawesi Barat Menurut
Sumbernya (000 Rp), 2010 Government Revenue Budget In Sulawesi Barat (000 Rp), 2010 ………………… 379
8.3.3 Anggaran Belanja Pemerintah Kabupaten Se Sulawesi Barat Menurut
Sumbernya (000 Rp), 2010 Budget Of Government Expenditure In Sulawesi Barat (000 Rp), 2010 ………… 380
8.3.4 Anggaran Pembiayaan Pemerintah Kabupaten Se Sulawesi Barat Menurut
Sumbernya (000 Rp), 2010 Budget Of Government Expenditure In Sulawesi Barat (000 Rp), 2010 ………… 381
8.3.5 Target PAD Pemerintah Kabupaten Se Provinsi Sulawesi Barat Menurut
Sumbernya (000rp), 2010 Plan Of Revenued Government By Sources (000 Rp), 2010 ……………………… 382
8.3.6 Target Dana Perimbangan Pemerintah Kabupaten Se Provinsi Sulawesi Barat
Menurut Sumbernya (000rp), 2010 Target Of Means Budget Government By Sources (000 Rp), 2010 ……………… 383
8.3.7 Rencana Belanja Aparatur Daerah Pemerintah Kabupaten Se Sulawesi Barat
Menurut Jenisnya (000rp), 2010 Draft Expenditure Tolls Government By Type (000rp), 2010 ……………………… 385
8.3.8 Rencana Belanja Pelayanan Publik Pemerintah Kabupaten Se Sulawesi Barat Menurut Jenisnya (000rp), 2010 Draft Expenditure Tolls Government By Type (000rp), 2010 ……………………… 386

DAFTAR TABEL
SULAWESI BARAT DALAM ANGKA 2010 xlii
8.4 PAJAK TAX 8.4.1 Target Dan Realisasi Penerimaan Pajak Bumi Dan Bangunan (Pbb) Menurut
Kabupaten Di Sulawesi Barat (Dalam Ribuan Rupiah), 2009 Target And Actual Revenues Of Land And Housing Tax By Regency In Sulawesi Barat 2009…………………………………………………………….………………………… 388
8.4.2 Realisasi Penerimaan PBB Menurut Sektor Per Kabupaten Di Sulawesi Barat
(Dalam Ribuan Rupiah), 2009 Actual Revenues Of Land And Housing Tax By Sector And Regency In Sulawesi Barat, (In Thousand Rupiahs) 2009 ………………………………………………….. 390
8.4.3 Realisasi Penerimaan Pajak Penghasilan (PPh) Menurut Kabupaten dan
Jenisnya Di Sulawesi Barat (Ribuan Rupiah), 2009 Actual Revenues Of Income Tax By regency and Kind In Sulawesi Barat (In Thousand)2009 ........................................................................................................ 392
8.5 KOPERASI COOPERATION
8.5.1 Jumlah Koperasi Dan Anggota Menurut Kabupaten Di Sulawesi Barat, 2009 Number Of Cooperative And Cooperative Member By Regency In Sulawesi Barat 2009… ............................................................................................................. 393
8.5.2 Besarnya Aset Koperasi Menurut Kabupaten Di Sulawesi Barat, 2009 Value Of Asset Cooperative By Regency In Sulawesi Barat 2009 .......................... 394
8.5.3 Besarnya Volume Usaha Dan Sisa Hasil Usaha (SHU) Koperasi Menurut
Kabupaten Di Sulawesi Barat(Rp. 000), 2009 Number Of Volume Of Activity And Profit Cooperative By Regency In Sulawesi Barat (Rp.000) …………………………………………………………………………. 395
8.5.4 Jumlah Pusat Perdagangan Menurut Kabupaten Di Sulawesi Barat, 2009 Number of Trade Centre by Regency in Sulawesi Barat, 2009 …………………… 396
8.6 SEMBAKO 8.6.1 Rata-Rata Harga Eceran 9 Bahan Pokok Dirinci Per Komoditas Menurut
Kabupaten Di Provinsi Sulawesi Barat, 2008-2009 Average Retail Price of 9 Essential Commodities by Kinds per Regency in Sulawesi barat province2008-2009 ........................................................................... 397

TABLE OF LIST
SULAWESI BARAT IN FIGURES 2010
IX. PENDAPATAN REGIONAL REGIONAL INCOME
9.1 PRODUK DOMESTIK REGIONAL BRUTO GROSS REGIONAL DOMESTIC PRODUCTS 9.1.1 Produk Domestik Regional Bruto Menurut Lapangan Usaha Di Sulawesi Barat
Atas Dasar Harga Berlaku (Juta Rupiah) 2007-2009 Gross Regional Domestic Product By Industrial Origin In Sulawesi Barat At Current Market Prices (Million Rupiahs)2007-2009 .................................................. 405
9.1.2 Produk Domestik Regional Bruto Menurut Lapangan Usaha Di Sulawesi Barat
Atas Dasar Harga Konstan 2000 (Juta Rupiah), 2007-2009 Gross Regional Domestic Product By Industrial Origin In Sulawesi Barat At Constant 2000 Market Prices (Million Ruppiahs0, 2007-2009 ................................ 408
9.1.3 Distribusi Persentase PDRB Menurut Lapangan Usaha Provinsi Sulawesi Barat
Atas Dasar Harga Berlaku (Persen), 2007-2009 Percentage Distribution Of Grdp By Industrial Origin In Sulawesi Barat At Current Market Price(Percent), 2007-2009 ............................................................... 411
9.1.4 Distribusi Persentase PDRB Menurut Lapangan Usaha Provinsi Sulawesi Barat
Atas Dasar Harga Konstan 2000 (Persen), 2007-2009 Percentage Distribution Of Grdp By Industrial Origin In Sulawesi Barat At Constant 2000 Market Price(Percent), 2007-2009 ................................................... 414
9.1.5 Produk Domestik Regional Bruto Dan Angka Per Kapita Provinsi Sulawesi Barat
Atas Dasar Harga Berlaku, 2007-2009 Gross Regional Domestic Product And Per Capita Figure In Sulawesi Barat At Current Market Price, 2007-2009 .............................................................................. 417
9.1.6 Produk Domestik Regional Bruto Dan Angka Per Kapita Provinsi Sulawesi Barat
Atas Dasar Harga Konstan 2000, 2007-2009 Gross Regional Domestic Product And Per Capita Figure In Sulawesi Barat Constant 2000 Market Price, 2007-2009 ................................................................ 418
9.1.7 PDRB Perkapita Provinsi Sulawesi Barat (Rupiah), 2004-2009
GRDP Per Capita Figure In Sulawesi Barat (Rupiah), 2004-2009 ........................... 419 9.1.8 Produk Domestik Regional Bruto Menurut Penggunaan Atas Dasar Harga
Berlaku (Dalam Juta Rp), 2007-2009 Gross Regional Domestic Product By Expenditure At Current Market Prices (Million Rupiahs), 2007-2009 .................................................................................... 420

DAFTAR TABEL
SULAWESI BARAT DALAM ANGKA 2010 xliv
9.1.9 PDRB Menurut Penggunaan Atas Dasar Harga Konstan 2000 (Dalam Juta Rp), 2007-2009 Gross Regional Domestic Product By Expenditure At Constant 2000 Market Prices (Million Rupiahs), 2007-2009 ......................................................................... 421
9.1.10 PDRB Kabupaten Dan Pdrb Provinsi Menurut Harga Konstan 2000 Dan Harga
Berlaku, PDRB Perkapita Dan Jumlah Penduduk Pertengahan Tahun Se Sulawesi Barat 422
9.2 IHK/INFLASI IHK/INFLASI 9.2.1 Indeks Harga Konsumen (IHK) Berdasarkan Komoditas Barang Dan Jasa Di
Kota Mamuju, 2009 Consumer Rate Index Based Comodity Types Goods And Services In Mamuju City, 2009 ……………………………………………………………………………… 423
9.2.2 Inflasi Bulanan Berdasarkan Komoditi/ Jenis Barang Dan Jasa Di Kota Mamuju, 2009 Inflastion Monthly Based Comodity Types Of Goods And Services In Mamuju City, 2009 439
9.3 NILAI TUKAR PETANI FARMERS ERCHANGE RATE 9.3.1 Nilai Tukar Petani (NTP) Di Provinsi Sulawesi Barat, Juni 2009-Juli 2010
Farmmers Ezchange Rate In Sulawesi Barat Province, Juni 2009-Juli 2010 …………. 455
9.3.2 Nilai Tukar Petani (NTP) Sub Sektor Tanaman Pangan Di Provinsi Sulawesi
Barat, Juni 2009-Juli 2010 Farmmers Ezchange Ratesub Sector Food Crops In Sulawesi Barat Province, Juni 2009-Juli 2010 ……………………………………………………………………. 456
9.3.3 Nilai Tukar Petani (NTP) Sub Sektor Hortikultura Di Provinsi Sulawesi Barat,
Juni 2009-Juli 2010 Farmmers Ezchange Ratesub Sector Horticulture In Sulawesi Barat Province, Juni 2009-Juli 2010 …………………………………………………………………. 457
9.3.4 Nilai Tukar Petani (NTP) Sub Sektor Tanaman Perkebunan Di Provinsi
Sulawesi Barat, Juni 2009-Juli 2010 Farmmers Ezchange Ratesub Sector Plantation People In Sulawesi Barat Province, Juni 2009-Juli 2010 ……………………………………………………….. 458
9.3.5 Nilai Tukar Petani (NTP) Sub Sektor Peternakan Di Provinsi Sulawesi Barat,
Juni 2009-Juli 2010 Farmmers Ezchange Ratesub Sector Livestock In Sulawesi Barat Province, 459

TABLE OF LIST
SULAWESI BARAT IN FIGURES 2010
Juni 2009-Juli 2010 ……………………………………………………………….….. 9.3.6 Nilai Tukar Petani (NTP) Sub Sektor Perikanan Di Provinsi Sulawesi Barat, Juni
2009-Juli 2010 Farmmers Ezchange Ratesub Sector Fishery In Sulawesi Barat Province, Juni 2009-Juli 2010 …………………………………………………………………….….. 460
9.9 Realisasi Pengadaan Gabah Oleh Perum Bulog Menurut Kabupaten Di
Sulawesi Barat (Ton), 2007-2009 Actual Shell Of Rice Procurement By Regency In Sulawesi Barat (Ton), 2009 … 461
9.10.1 Persentase Penduduk Menurut Kabupaten Dan Golongan Pengeluaran
Perkapita Sebulan, 2009 Percentage Of Pupulation By Rgency And Monthly Per Capita Expenditure Class, 2009 462
9.10.2 Persentase Pengeluaran Rata-Rata Per Kapita Sebulan Menurut Jenis
Pengeluaran Dan Golongan Pengeluaran Per Kapita Sebulan Di Sulawesi Barat, 2009 ………………. 465

DAFTAR TABEL
SULAWESI BARAT DALAM ANGKA 2010 xlvi
X. KEMISKINAN POVERTY
10.1.1 Jumlah Dan Persentase Penduduk Miskin Menurut Daerah Di Sulawesi Barat,
2009 Number And Percentage Of Poor Population By Region In Sulawesi Barat Province, 2009 …………………………………………………………………………. 472
10.1.2 Garis Kemiskinan Menurut Daerah Di Sulawesi Barat, 2007-2010
According To The Regional Poverty Lines In Sulawesi Barat Province, 2007-2010……… 473
10.1.3 Komponen Garis Kemiskinan Menurut Daerah Di Sulawesi Barat, 2009
Components According Regional Poverty Lines In Sulawesi Barat Province, 2009 …. 474
10.1.4 Indeks Kedalaman Kemiskinan (P1) Dan Indeks Keparahan Kemiskinan (P2) Di
Sulawesi Barat Menurut Daerah, 2007-2010 Poverty Depth Index (P1) And Illness Poverty Index (P2) According In Sulawesi Barat Province By Region, 2007-2010 …………………………………………….. 475
10.1.5 Jumlah Penduduk Miskin Menurut Kabupaten Di Provinsi Sulawesi Barat, 2009
Number Of Poor Population By Regency In Sulawesi Barat Province, 2009 …… 476 10.1.6 Persentase Penduduk Miskin Menurut Kabupaten Di Provinsi Sulawesi Barat,
2005-2009 Percentage Of Poor Population By Regency In Sulawesi Barat Province, 2005-2009 … 477
10.1.7 Garis Kemiskinan Menurut Kabupaten Di Provinsi Sulawesi Barat, 2005-2009
Poverty Line By Regency In Sulawesi Barat Province, 2005-2009 ……………… 478 10.1. Jumlah Rumah Tangga Sasaran Menurut Kabupaten Di Provinsi Sulawesi
Barat, 2008 Number Of Household Goals By Regency In Sulawesi Barat Province, 2008 … 479

TABLE OF LIST
SULAWESI BARAT IN FIGURES 2010
PERBANDINGAN NASIONAL National Comparison
11.1 Indeks Harga Konsumen (IHK) Kota-Kota Besar Di Pulau Sulawesi, Juni –
Desember 2009 Consumer Price Index (CPI) In The City In Sulawesi Island, June – December 2009 486
11.2. Inflasi Kota-Kota Besar Di Pulau Sulawesi Juni – Desember 2009
Inflation In The City In Sulawesi Island, June – Desember 2009 ........................... 487 11.3 Nilai Tukar Petani (NTP) Provinsi Di Pulau Sulawesi, Juni – Desember 2009
Farmers Exchange Rate (Ntp) By Province In Sulawesi Island, June – Desember 2009 488
11.4 Upah Minimum Nominal Dan Riil Menurut Provinsi, 2006-2008
Nominal And Real Minimum Wage By Province, 2006-2008 ……………………… 489

LIST OF GRAPHS
SULAWESI BARAT IN FIGURES 2010 xxxiv
Daftar Grafik List Of Graphs
Grafik Graph
Uraian Description
Halaman Page
1.1 Nama Sungai Utama di Sulawesi Barat Menurut Panjangnya (KM), 2009
Name of Mains River by Length and Flow Areas in Sulawesi Barat, 2009…………………………… 5
1.2 Persentase Luas Kabupaten Se-Sulawesi Barat, 2009
Percentage Area of Regency to total Area of Sulawesi Barat, 2009 ……………………………………….. 6
2.1 Jumlah Anggota DPRD Provinsi Sulawesi Barat Hasil Pemilihan Umum 2004 dan 2009
Number of assembly Member of Sulawesi Barat Provinces According election Results 2004 and 2009 ……………………………………………………………………………… 28
3.1 Perkembangan Jumlah Penduduk Sulawesi Barat, 2004-2009
Growthing Population In Sulawesi Barat 2004-2009 .......................................... 53 3.2 Jumlah Penduduk Menurut Kabupaten di Sulawesi Barat, Tahun 2009
Number of Population by Regency in Sulawesi Barat Province, 2009 …………………… 54 3.3 Jumlah Penduduk Berumur 15 Tahun Keatas yang Bekerja Di Sulawesi
Barat, 2009 Population 15 Years old who Worked in Sulawesi Barat, 2009 ……………………………..
55 4.1 Jumlah Sekolah Di Sulawesi Barat, 2009
Number of Schools in Sulawesi Barat, 2009……………………………………………………………… 87
4.2 Jumlah Guru Pada Setiap Jenjang Pendidikan di Sulawesi Barat, 2009
Number of Teachers at Each Educationally in Sulawesi Barat, 2009………………… 88 4.3 Jumlah Jemaah Haji Menurut Kabupaten di Sulawesi Barat 2009
Number of Pilgrims By Regency in Sulawesi Barat, 2009………………………………… 89 4.4 Jumlah Tenaga Kesehatan Di Sulawesi Barat, Tahun 2009
Number of Health Personal by Kinds Profession in Sulawesi Barat, 2009 …………… 90 5.1 Perkembangan Produksi Padi Tahun 2006 – 2009
Development of Rice Production, 2006-2009…………………………………………… 157

DAFTAR GRAFIK
SULAWESI BARAT DALAM ANGKA 2010 xxxv
5.2 Produksi Tanaman Palawija di Sulawesi Barat Tahun 2009 Production of Crops in Sulawesi Barat, 2009…………………………………………… 158 6.1 Jumlah Daya Tersambung (KVA) dan Energi Terjual (MWh) Menurut Rayon, 2009
Number Installed Power (KVA) and Energy Sold by Rayon, 2009 285 6.2 Perkembangan Pendapatan PDAM Se-Sulawesi Barat (Rupiah)Tahun 2009
Revenue Growth of PDAM in Sulawesi Barat, 2009 ……………………………………… 286 7.1 Panjang Jalan di Sulawesi Barat Menurut Status, 2009
Length Road at Sulawesi Barat by Status, 2009 ……………………………………………… 312 7.2 Perkembangan Jumlah Penumpang yang Melalui Bandara Tampa Padang, Tahun
2005-2009 Progres of Passenger at Tampapadang Airport , 2005-2009…………………………… 313
7.3 Perkembangan Tingkat Penghunian Kamar Hotel (TPK) Selama 2009
Progres of Occupantion Room Rate in 2009 …………………………………………… 314 8.1 Jumlah Kredit yang Disalurkan Oleh Perbankan di Sulawesi Barat (Juta Rupiah), 2009
Credits Potition By Economi Sector In Sulawesi Barat (Million Rupiahs), 2009 ……… 337
8.2 Anggaran Pendapatan dan Belanja Pemerintah Provinsi Sulawesi Barat (Juta Rupiah), 2009 Draft local Revenue and Expenditure of The Government of Sulawesi Barat Province, 2009 338
8.3 Nilai Tukar Beberapa Mata Uang Asing Terhadap Rupiah, Selama 2005 – 2010 Figure Foreign Exchange Rate of Foreign Currencies ti The Rupiahs, 2005-2010 … 339
9.1 Struktur Perekonomian Sulawesi Barat Tahun 2009 (Persen) Economic Structure of Sulawesi Barat, 2009 ……………………………………………… 379
9.2 Perkembangan PDRB Perkapita Sulawesi Barat Atas Dasar Harga Berlaku dan Harga Konstan (Rupiah) Tahun 2004 – 2009 Progres os PDRB Percapita in Sulawesi Barat by Current and Constant Price, 2004-2009 380
10.1 Garis Kemiskinan Menurut Kabupaten Di Sulawesi Barat, Tahun 2009
Proverty Line By Regency in Sulawesi Barat, 2009 ……………………………………… 442 10.2 Jumlah Penduduk Miskin Menurut Daerah, 2007-2010
Number of Poor Population By Region, 2007-2010 ………………………………………… 443 11.1 Nilai Tukar Petani di Sulawesi Barat 2009
Progres of Farmers Exchange at Sulawesi Barat, 2009 ………………………………… 456 11.2 Perkembangan IHK Kota Mamuju 2009
Progress of IKH at Mamuju City, 2009 ……………………………………………………. 457

SADAR STATISTIK
Penyelenggara : Sadar untuk menggunakan teknik statistik
yang tepat guna dan menyajikan data statistik yang diperlukan konsumen secara tepat waktu, akurat dan mudah dipahami.
Responden :
Sadar untuk memberikan jawaban apa adanya sesuai dengan kenyataan tanpa ragu-ragu.
Pengguna : Sadar untuk memahami metode, konsep/definisi
serta memanfaatkan data statistik secara optimal.

PENJELASAN UMUM/EXPLANATORY NOTES
SULAWESI BARAT DALAM ANGKA 2010 xxxvi
PENJELASAN UMUM / EXPLANATORY NOTES
Tanda-tanda, satuan-satuan dan lain-lainnya yang di gunakan dalam publikasi ini adalah sebagai berikut : Symbols measurement unit and other acronyms which are used in this publication, are as follows :
1. TANDA-TANDA / SYMBOLS
Data belum tersedia /Data not yet available…. Data tidak tersedia/ Data not available……… Data dapat diabaikan /Data negligible……… Tanda desimal /Decimal point………………… Angka sementara /Final………………………. Angka sangat sementara /Preliminary……… Angka sangat-sangat sementara /Advance… Angka diperbaiki /Revised figures…………… Angka perkiraan /Extimated figures………… Rupiah /Rupiahs ...................... Dollar Amerika /US Dollars ............ Meter /meter ......................... Meter persegi /meter per square....... Meter kubik /meter cubic ............. Kilometer /met........................ Kilometer persegi /kilometer per square Hektar /hectare ......................
: : : : : : : : : : : : : : : : :
… - 0 , x) xx) xxx) r) e) Rp. $ m m2 m3
km km2 ha
2. SATUAN / UNITS
Barrel/ barrel ………………………………… Boto l/bottle………………………………………… Kilimoter (km )/kilometers (km)……………….. Kwintal (kw )/quintal (ql)……………………….. Liter (untuk beras )/litre (for rice)…………….. Metricubic feet (mef )/metricubic feet…………. Metric ton (m.ton )/metric ton (m.ton)………… Once (oz )/once (oz)……………………………… Ton /ton……………………………………………. Sak (untuk semen)/ sack (for cement)…………
: : : : : : : : : :
158,99 liter/ litres=1/6,2898 m3 700 cc 1 000 meter/ meters (m) 100 kg 0,80 kg 1/35,3 m3 0,98421 long ton = 1000 kg 28,31 gram/ grams 1 000 kg 40 kg atau/ or 50 kg
Satuan lain : buah, bungkus, butir, helai/lembar, k alen, batang, pulsa, ton kilometer (ton-km), jam, menit, persen (%) Others units : unit, pack, number, pieces, tin, pulsa, ton-kilometres (ton-km), hour, minute, percents (%)

1 KEADAAN GEOGRAFI
DAN IKLIM Geographical Conditions
And Climate

GEOGRAPHICAL CONDITION AND CLIMATE
SULAWESI BARAT IN FIGURES 2010 3
1.1 Keadaan Geografi
Provinsi Sulawesi Barat yang beribukota
di Mamuju terletak antara 0o12' – 3o38’
Lintang Selatan dan 118o43'15’’ – 119o54'3’’
Bujur Timur, yang berbatasan dengan
Provinsi Sulawesi Tengah di sebelah utara
dan Selat Makassar di sebelah barat. Batas
sebelah selatan dan timur adalah Provinsi
Sulawesi Selatan.
Jumlah sungai yang mengaliri wilayah
Sulawesi Barat tercatat sekitar 8 aliran
sungai, dengan jumlah aliran terbesar di
Kabupaten Polewali Mandar, yakni 5 aliran
sungai. Sungai terpanjang tercatat ada dua
sungai yakni Sungai Saddang yang mengalir
meliputi Kabupaten Tator, Enrekang, Pinrang
dan Polewali Mandar serta Sungai Karama di
Kabupaten Mamuju. Panjang kedua sungai
tersebut masing-masing 150 km.
Di Sulawesi Barat terdapat 193 buah
gunung, dengan gunung tertinggi adalah
Gunung Ganda Dewata dengan ketinggian
3.037 meter diatas permukaan laut. Gunung
ini berdiri tegak di Kabupaten Mamuju.
Luas wilayah Provinsi Sulawesi Barat
tercatat 16.937,16 kilometer persegi yang
meliputi 5 Kabupaten. Kabupaten Mamuju
merupakan kabupaten terluas dengan luas
8.014,06 kilometer persegi atau meliputi
47,32 persen dari seluruh wilayah Sulawesi
Barat.
1.1 Geographical Condition
The province of Sulawesi Barat with
Mamuju its capital is located between zero
and 12' –3038‘ South Latitude, and 118o43'15”
up to 119o54'3” East Longitude. This Province
is bounded by the Province of Central
Sulawesi at the north side and Makassar
Strait at the west side. Boundary at south and
east is Sulawesi Selatan Province.
There are 8 rivers in Sulawesi Barat, 5
of which flow in Polewali Mandar. The two
longest rivers are Saddang River and
Karama River whose length are about 150 km
each. Saddang River flows through Tana
Toraja, Enrekang, Pinrang Regencies and
Polewali Mandar, and Karama River is in
Mamuju Regency.
The province of Sulawesi Barat has 193
Mountains. Mountain Ganda Dewata is the
highest mountain, which 3,037 meters above
the sea level. This mountain stands in
Mamuju Regency.
The area of Province of Sulawesi Barat
area is 16.937,16 square km which include 5
regencies. Mamuju is the largest district with
an area of 8.014,06 square kilometers, or
covering 47,32 percent of the entire region of
Sulawesi Barat.

KEADAAN GEOGRAFI DAN IKLIM
4 SULAWESI BARAT DALAM ANGKA 2010
1.2 Suhu Dan Kelembaban Udara
Suhu udara di suatu tempat antara lain ditentukan
oleh tinggi rendahnya tempat tersebut dari permukaan air
laut dan jaraknya dari pantai. Berdasarkan laporan dari
Stasiun Meteorologi Kabupaten Majene Pada tahun
2009 suhu udara di Sulawesi Barat berkisar antara 24,90
°C hingga 34,80 °C. dengan rata-rata suhu udara se kitar
27,48 °C.
Propinsi Sulawesi Barat mempunyai
kelembaban udara relatif tinggi, dimana pada
tahun 2008 rata-rata berkisar antara 76,5
persen sampai 82,8 persen. Data suhu
minimum dan maksimum serta posisi Stasiun
Pengamatan disajikan pada Tabel 1.2.1
sementara arah dan kecepatan angin serta
kelembaban udara disajikan pada Tabel 1.2.2
1.3 Kecepatan Angin
Kecepatan angin hampir di seluruh
kabupaten di Sulawesi Barat umumnya
merata setiap bulannya, yaitu berkisar 5
km/jam hingga 11 km/jam.
1.2 Temperature And Humidity
Air temperature somewhere between the
others is determined by the high and low
places of the sea surface and its distance
from the beach. Based on reports from the
Meteorological Station in 2009 Majene District
in Sulawesi Barat air temperature ranged
between 24.90 ° C to 34.80 ° C. with an
average temperature of about 27.48 ° C.
The relative humidity in Sulawesi Barat
is usually high. In 2008, the humidity ranged
from 76,5 percent to 82,8 percent. Data on
minimum and maximum temperature as well
as the position of observation station are
presented in Table 1.2.1, while velocity and
wind direction also the level of humidity are
presented in Table 1.2.2.
1.3 Surface Winds
In general, wind velocities in all
regencies of Sulawesi Barat were similar
ranged from 5 km/hour to 11 km/hour.

GEOGRAPHICAL CONDITION AND CLIMATE
SULAWESI BARAT IN FIGURES 2010 5
Grafik 1.1 Nama Sungai Utama di Sulawesi Barat Menurut Panjangnya (KM), 2009 Figure Name of Mains River by Length and Flow Areas in Sulawesi Barat, 2009

KEADAAN GEOGRAFI DAN IKLIM
6 SULAWESI BARAT DALAM ANGKA 2010
Gafik 1.2 Persentase Luas Kabupaten Se-Sulawesi Barat, 2009
Figure Percentage Area of Regency to total Area of Sulawesi Barat, 2009

GEOGRAPHICAL CONDITION AND CLIMATE
SULAWESI BARAT IN FIGURES 2010 7
Tabel 1.1.1 Keadaan Geografis Dan Batas Administrasi Wilayah P rovinsi Sulawesi Barat, 2009
Table Geographical Condition Location And Administration Of Sulawesi Barat, 2009
Keadaan Geografis / Geographical Condition
Provinsi Sulawesi Barat Secara Geografis Terletak A ntara/ Geographically, the Province of Sulawesi Barat lies between:
0°°°°12' - 3°°°°38' Lintang Selatan/ South Latitude
118°°°°43'15’’ - 119 °°°°54’3’’ Bujur Timur/ East Longitude
Provinsi Ini Dibatasi/ This Province was bounded by:
Sebelah Utara / in the northern side by : Sulawesi Tengah / Sulawesi Tengah
Sebelah timur / In the eastern side by : Sulawesi Selatan / sulawesi selatan
Sebelah Barat / In the western side by : Selat Makassar / Makassar Strait
Sebelah Selatan / in the Southern side by : Sulawesi Selatan / Sulawesi Selatan
Luas W i l ayah P r ov ins i S u lawes i B a r a t Ada lah 16 .937 , 16 K m ², S eca r a Adm in i s t r as i P em er in tahan P r ov ins i S u lawes i B a r a t T e r bag i M en jad i 5 K abupa ten , Yang Te r d i r i D a r i 69 K ecam atan / The P rov i nce o f S u l awes i B a ra t a rea i s 16 .937 ,16 K m 2 , A dmi n i s t ra t i ve l y t h i s P rov i nce cons i s t o f 5 regency , and d i v i ded i n t o 69 D i s t r i c t s .
Sumber / Source : Kantor Wilayah Badan Pertanahan Nasional (BPN) Provinsi Sulawesi Barat / Regional Office of National Land Board of Sulawesi Barat Province

KEADAAN GEOGRAFI DAN IKLIM
8 SULAWESI BARAT DALAM ANGKA 2010
Tabel 1.1.2 Luas Daerah Menurut Kabupaten Di Sulawesi Barat, 20 09 Table Area of Region by Regency/City in Sulawesi Barat, 2009
Kode Wilayah
Area code
Kabupaten Regency
Luas Area (km2)
Persentase Thd Luas Sulawesi Barat
Percentage To Total Area Of Sulawesi Barat
(1)
(2)
(3)
(4)
01.
Majene 947,84 5,59
02.
Polewali Mandar 2 022,30 11,94
03.
Mamasa 2 909,21 17,18
04
Mamuju 8 014,06 47,32
05.
Mamuju Utara 3 043,75 17,97
Jumlah – Total 16 937,16 100,00
Sumber / Source : Kantor Wilayah Badan Pertanahan Nasional (BPN) Provinsi Sulawesi Barat / Regional Office of National Land Board of Sulawesi Barat Province

GEOGRAPHICAL CONDITION AND CLIMATE
SULAWESI BARAT IN FIGURES 2010 9
Tabel 1.1.3
Nama Ibukota Kabupaten Dan Jarak Ke Ibukota Provins i, 2009 Table The Capital of Regency and Distance to Capital of Province, 2009
Kode Wilayah
Area code
Kabupaten Regency
Nama Ibukota The capital of regency
Jarak Ke Ibukota Provinsi
Distance to capital of province
(km)
(1) (2) (3) (4)
01
02
03
04
05
Majene
Polewali Mandar
Mamasa
Mamuju
Mamuju Utara
Banggae
Polewali
Mamasa
Mamuju
Pasangkayu
143
199
292
0
276
Sumber/ Source : Badan Pusat Statistik (Bps) Provinsi Sulawesi B arat/ Badan Pusat Statistics of
Sulawesi Barat Province

KEADAAN GEOGRAFI DAN IKLIM
10 SULAWESI BARAT DALAM ANGKA 2010
Tabel
1.1.4 Jarak Antar Kabupaten Di Provinsi Sulawesi Barat (K m), 2009
Table Distances Per Regenct In Sulawesi Barat Province (Km), 2009
Majene Majene
Polman 56 Polman
Mamasa 149 93 Mamasa
Mamuju 143 199 292 Mamuju
Matra 419 475 568 276 Matra
Sumber/Source : Badan Pusat Statistik (BPS) Provinsi Sulawesi Barat/ Badan Pusat Statistics of Sulawesi Barat Province

GEOGRAPHICAL CONDITION AND CLIMATE
SULAWESI BARAT IN FIGURES 2010 11
Nama Gunung Name of Mountains
Tinggi Altitude
(m)
Lokasi Location
(Kabupaten/Regency)
(1)
(2)
(3)
1. Pateresan 845 Majene
2. Barangdai 881 Majene
3. Tanduk 986 Majene
4. Mayanloli 982 Majene
5. Seleng 1 001 Majene
6. Bulido 865 Majene
7. Pamboang 302 Majene
8. Gobang 329 Majene
9. Baurusung 214 Majene
10. Totoli 114 Majene
11. Ujung 238 Majene
12. Tammedingin 1 145 Polewali Mandar
13. Lalia 863 Polewali Mandar
14. Kira 1 310 Polewali Mandar
15. Bohang batu 1 084 Polewali Mandar
16. Tetuho 1 448 Polewali Mandar
17. Ulupedowu 976 Polewali Mandar
18. Pasapa 809 Polewali Mandar
19. Buo 298 Polewali Mandar
20. Panabung 424 Polewali Mandar
Tabel 1.1.5 Nama-Nama Gunung Menurut Tinggi Dan Lokasi Di Sulaw esi Barat, 2009 Table Name of Mountains by Altitude and Location in Sulawesi Barat, 2009

KEADAAN GEOGRAFI DAN IKLIM
12 SULAWESI BARAT DALAM ANGKA 2010
Lanjutan Tabel/ Table Continued : 1.1.5
Nama Gunung Name of mountains
Tinggi Altitude
(m)
Lokasi Location
(kabupaten/regency)
(1)
(2)
(3)
21. Kalumbia 315 Polewali Mandar
22. Lumalan 340 Polewali Mandar
23. Talebo 470 Polewali Mandar
24. Kaneka 242 Polewali Mandar
25. Patiorang 648 Polewali Mandar
26. Bulan 181 Polewali Mandar
27. Puang 1 219 Polewali Mandar
28. Pao 1 024 Polewali Mandar
29. Sokang 1 163 Polewali Mandar
30. Tambun 1 104 Polewali Mandar
31. Canggo 127 Polewali Mandar
32. Panummang 246 Polewali Mandar
33. Pusuk 535 Polewali Mandar
34. Tanete polo 996 Polewali Mandar
35. Barumbung 410 Polewali Mandar
36. Pangerengan 327 Polewali Mandar
37. Batu 303 Polewali Mandar
38. Ongko 179 Polewali Mandar
39. Tandeng 420 Polewali Mandar
40. Pangrengrean 2 630 Mamasa
41. Parorean 2 480 Mamasa
42. Galundum 2 169 Mamasa
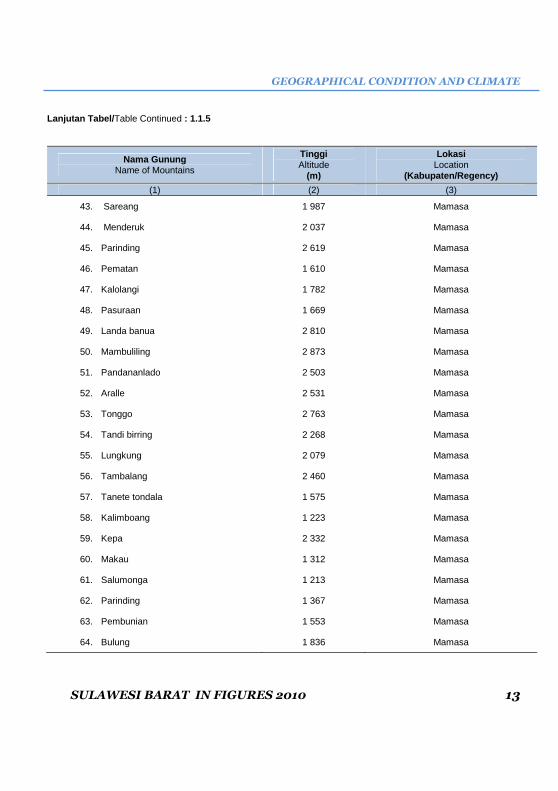
GEOGRAPHICAL CONDITION AND CLIMATE
SULAWESI BARAT IN FIGURES 2010 13
Lanjutan Tabel/ Table Continued : 1.1.5
Nama Gunung Name of Mountains
Tinggi Altitude
(m)
Lokasi Location
(Kabupaten/Regency) (1)
(2)
(3)
43. Sareang 1 987 Mamasa
44. Menderuk 2 037 Mamasa
45. Parinding 2 619 Mamasa
46. Pematan 1 610 Mamasa
47. Kalolangi 1 782 Mamasa
48. Pasuraan 1 669 Mamasa
49. Landa banua 2 810 Mamasa
50. Mambuliling 2 873 Mamasa
51. Pandananlado 2 503 Mamasa
52. Aralle 2 531 Mamasa
53. Tonggo 2 763 Mamasa
54. Tandi birring 2 268 Mamasa
55. Lungkung 2 079 Mamasa
56. Tambalang 2 460 Mamasa
57. Tanete tondala 1 575 Mamasa
58. Kalimboang 1 223 Mamasa
59. Kepa 2 332 Mamasa
60. Makau 1 312 Mamasa
61. Salumonga 1 213 Mamasa
62. Parinding 1 367 Mamasa
63. Pembunian 1 553 Mamasa
64. Bulung 1 836 Mamasa

KEADAAN GEOGRAFI DAN IKLIM
14 SULAWESI BARAT DALAM ANGKA 2010
Lanjutan Tabel/ Table Continued : 1.1.5
Nama Gunung Name of Mountains
Tinggi Altitude
(m)
Lokasi Location
(Kabupaten/Regency)
(1)
(2)
(3)
65. Pasapa 2 145 Mamasa
66. Salutabulo 1 656 Mamasa 67. Dopang 1 805 Mamasa 68. Gigi 2 447 Mamasa 69. Kandeapi 1 662 Mamasa 70. Kabuare 1 984 Mamasa
71. Tabating 407 Mamuju
72. Takke 277 Mamuju 73. Tadayang 289 Mamuju 74. Tandetarakang 403 Mamuju 75. Kabu-kabu 239 Mamuju 76. Tanalalang 285 Mamuju 77. Toppong 605 Mamuju 78. Salulullung 586 Mamuju 79. Tamme garonggong 455 Mamuju 80. Betteng 595 Mamuju 81. Salokayu 210 Mamuju 82. Sare 363 Mamuju 83. Kanis 256 Mamuju 84. Talawal 81 Mamuju 85. Malasiga 230 Mamuju 86. Tamadao 329 Mamuju

GEOGRAPHICAL CONDITION AND CLIMATE
SULAWESI BARAT IN FIGURES 2010 15
Lanjutan Tabel/ Table Continued : 1.1.5
Nama Gunung Name of Mountains
Tinggi Altitude
(m)
Lokasi Location
(Kabupaten/Regency)
(1)
(2)
(3)
87. Karondong 451 Mamuju 88. Malereng 269 Mamuju 89. Neneparodo 137 Mamuju 90. Tanga 381 Mamuju 91. Baturondang 489 Mamuju 92. Tande-tande 606 Mamuju 93. Membungkang 849 Mamuju 94. Callue 616 Mamuju 95. Tandang 734 Mamuju 96. Tanao 946 Mamuju 97. Rantekalua 845 Mamuju 98. Sokko 995 Mamuju 99. Saludengen 330 Mamuju 100. Barerong 174 Mamuju 101. Kamansi 951 Mamuju 102. Basarimba 1 265 Mamuju 103. Tunggumanuk 1 474 Mamuju 104. Lara 1 341 Mamuju 105. Kalia 1 195 Mamuju 106. Benggaulu 595 Mamuju 107. Hopo 303 Mamuju 108. Pabettengan 297 Mamuju

KEADAAN GEOGRAFI DAN IKLIM
16 SULAWESI BARAT DALAM ANGKA 2010
Lanjutan Tabel/ Table Continued : 1.1.5
Nama Gunung Name of Mountains
Tinggi Altitude
(m)
Lokasi Location
(Kabupaten/Regency)
(1)
(2)
(3)
109. Rajaba 472 Mamuju 110. Takanasi 185 Mamuju 111. Kapal 277 Mamuju 112. Mambarbolo 176 Mamuju 113. Lombong 288 Mamuju 114. Tabolang 310 Mamuju 115. Rea 795 Mamuju 116. Kalondo 522 Mamuju 117. Batusitanduk 241 Mamuju 118. Salulebo 496 Mamuju 119. Ballang 464 Mamuju 120. Ambeake 221 Mamuju 121. Tamenangka 279 Mamuju 122. Palapi 313 Mamuju 123. Passapa 299 Mamuju 124. Kalasoppeng 167 Mamuju 125. Rumbia 330 Mamuju 126. Limboro 390 Mamuju 127. Taeso 168 Mamuju 128. Kuwayang 174 Mamuju 129. Ranu 317 Mamuju 130. Balo 470 Mamuju
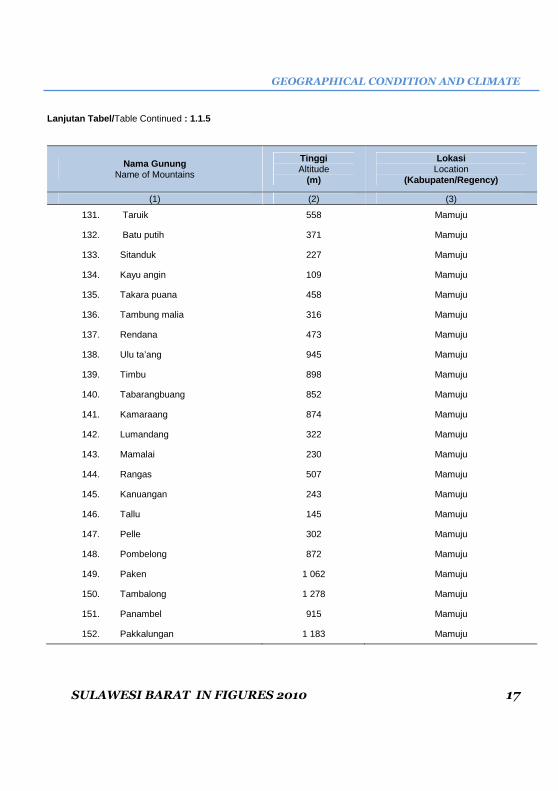
GEOGRAPHICAL CONDITION AND CLIMATE
SULAWESI BARAT IN FIGURES 2010 17
Lanjutan Tabel/ Table Continued : 1.1.5
Nama Gunung Name of Mountains
Tinggi Altitude
(m)
Lokasi Location
(Kabupaten/Regency)
(1)
(2)
(3)
131. Taruik 558 Mamuju 132. Batu putih 371 Mamuju 133. Sitanduk 227 Mamuju 134. Kayu angin 109 Mamuju 135. Takara puana 458 Mamuju 136. Tambung malia 316 Mamuju 137. Rendana 473 Mamuju 138. Ulu ta’ang 945 Mamuju 139. Timbu 898 Mamuju 140. Tabarangbuang 852 Mamuju 141. Kamaraang 874 Mamuju 142. Lumandang 322 Mamuju 143. Mamalai 230 Mamuju 144. Rangas 507 Mamuju 145. Kanuangan 243 Mamuju 146. Tallu 145 Mamuju 147. Pelle 302 Mamuju 148. Pombelong 872 Mamuju 149. Paken 1 062 Mamuju 150. Tambalong 1 278 Mamuju 151. Panambel 915 Mamuju 152. Pakkalungan 1 183 Mamuju

KEADAAN GEOGRAFI DAN IKLIM
18 SULAWESI BARAT DALAM ANGKA 2010
Lanjutan Tabel/ Table Continued : 1.1.5
Nama Gunung Name of Mountains
Tinggi Altitude
(m)
Lokasi Location
(Kabupaten/Regency)
(1)
(2)
(3)
153. Tarombe 1 036 Mamuju 154. Basarimba 1 548 Mamuju 155. Sinjango 1 083 Mamuju 156. Malepang 1 830 Mamuju 157. Taba 1 876 Mamuju 158. Pamatongko 2 007 Mamuju 159. Tirobali 2 816 Mamuju 160. Ranompedapan 1 665 Mamuju 161. Tammapupu 1 820 Mamuju 162. Tadedek 2 280 Mamuju 163. Tengnge 2 586 Mamuju 164. Pumbalaan 1 705 Mamuju 165. Popandangan 1 597 Mamuju 166. Kalondo 1 966 Mamuju 167. Kayutuo 1 627 Mamuju 168. Lungkung 1 376 Mamuju 169. Baba 1 091 Mamuju 170. Ganda dewata 3 037 Mamuju 171. Kapuasan 2 758 Mamuju 172. Pepengan 1 861 Mamuju 173. Langi 2 236 Mamuju 174. Pelokaan 1 041 Mamuju
Lanjutan Tabel/ Table Continued : 1.1.5
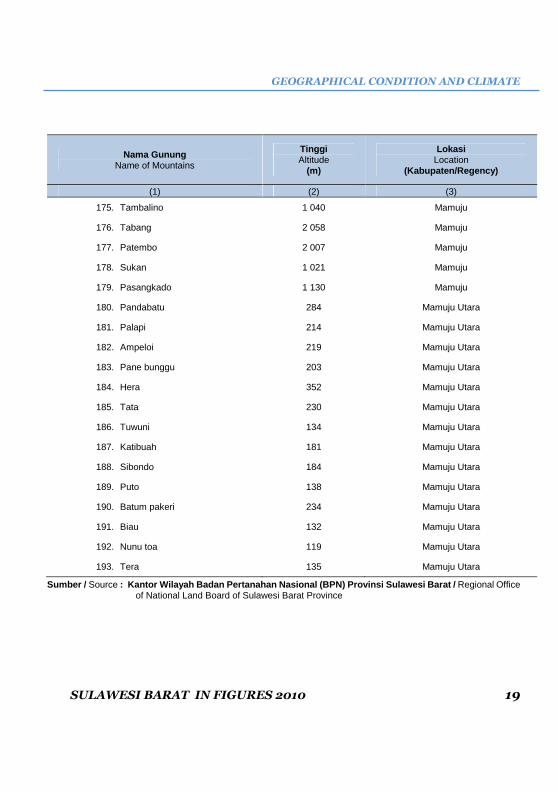
GEOGRAPHICAL CONDITION AND CLIMATE
SULAWESI BARAT IN FIGURES 2010 19
Nama Gunung Name of Mountains
Tinggi Altitude
(m)
Lokasi Location
(Kabupaten/Regency)
(1)
(2)
(3)
175. Tambalino 1 040 Mamuju
176. Tabang 2 058 Mamuju
177. Patembo 2 007 Mamuju
178. Sukan 1 021 Mamuju
179. Pasangkado 1 130 Mamuju
180. Pandabatu 284 Mamuju Utara
181. Palapi 214 Mamuju Utara
182. Ampeloi 219 Mamuju Utara
183. Pane bunggu 203 Mamuju Utara
184. Hera 352 Mamuju Utara
185. Tata 230 Mamuju Utara
186. Tuwuni 134 Mamuju Utara
187. Katibuah 181 Mamuju Utara
188. Sibondo 184 Mamuju Utara
189. Puto 138 Mamuju Utara
190. Batum pakeri 234 Mamuju Utara
191. Biau 132 Mamuju Utara
192. Nunu toa 119 Mamuju Utara
193. Tera 135 Mamuju Utara
Sumber / Source : Kantor Wilayah Badan Pertanahan Nasional (BPN) Provinsi Sulawesi Barat / Regional Office of National Land Board of Sulawesi Barat Province

KEADAAN GEOGRAFI DAN IKLIM
20 SULAWESI BARAT DALAM ANGKA 2010
Tabel 1.1.6 Nama-Nama Sungai Utama Menurut Panjang Dan Aliran S ungai Di Sulawesi Barat, 2009
Table Name of Mains River by Length and Flow Areas in Sulawesi Barat, 2009
Nama Sungai Name of River
Panjang Length (Km)
Lokasi Location
(1)
(2)
(3)
1. Saddang 150 Tator, Enrekang, Pinrang, Polewali Mandar
2. Matakali 28 Polewali Mandar
3. Mambi 95 Polewali Mandar
4. Mandar 90 Polewali Mandar
5. Manyamba 28 Majene
6. Malunda 38 Majene
7. Kaluku 32 Mamuju, Polewali Mandar
8. Karama 150 Mamuju
Sumber / Source : Kantor Wilayah Badan Pertanahan Nasional (BPN) Provinsi Sulawesi Barat / Regional Office of National Land Board of Sulawesi Barat Province

GEOGRAPHICAL CONDITION AND CLIMATE
SULAWESI BARAT IN FIGURES 2010 21
Tabel 1.2.1
Rata-Rata Temperatur, Kelembaban Nisbi, Dan Rata-Ra ta Penyinaran Matahari Pada Stasiun Meteorologi Di Majene, 2009
Table Average of Temperature, Relative Humidity, and Average of Sunrays at Station of Meteorology in Majene 2009
Bulan Month
Rata-Rata Temperatur Average of temperature (c°)
Kelembaban Nisbi
Relative Humidity
(%)
Rata-Rata Penyinaran
Matahari Average of Sunrays
(%) Rata-Rata Average
Maksimum Maximum
Minimum Minimum
(1)
(2)
(3)
(4)
(5)
(6)
01. Januari – January 26,90 30,70 24,40 82,4 61,0
02. Februari - February 24,60 28,20 21,80 70,5 48,4
03. Maret – March 27,20 31,1 24,40 81,1 74,8
04. April – April 27,60 31,40 25,00 81,4 80,0
05. Mei – May 27,60 31,50 24,90 82,3 79,6
06. Juni – June 27,60 31,40 25,10 79,6 83,7
07. Juli – July 27,00 30,70 24,30 78,1 70,5
08. Agustus – August 27,60 31,50 24,90 75,9 88,6
09. September – September 28,40 32,30 24,30 75,8 94,3
10. Oktober – October 28,50 32,40 25,30 77,1 82,9
11. Nopember – November 28,10 31,90 25,00 80,2 80,4
12. Desember – December 28,20 32,70 24,80 76,4 64,2
2009 27,46 31,32 24,60 78,4 75,7
2008 27,10 30,80 24,50 80,0 4,9
2007 27,20 30,90 24,60 79,2 58,6
2006 27,20 33,40 22,80 77,4 62,6
Sumber / Source : Stasiun Meteorologi, Klimatologi Dan Geofisika M ajene / Meteorological , Climatologi and Gefisika Station At Majene
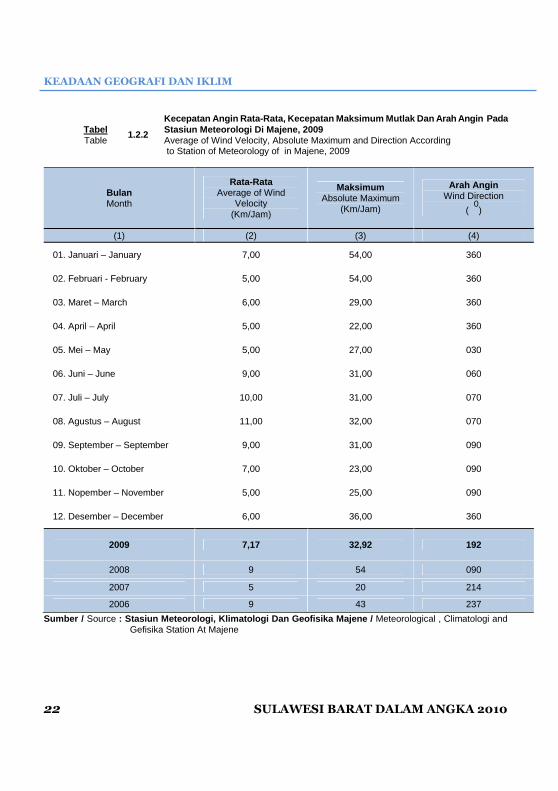
KEADAAN GEOGRAFI DAN IKLIM
22 SULAWESI BARAT DALAM ANGKA 2010
Tabel 1.2.2
Kecepatan Angin Rata-Rata, Kecepatan Maksimum Mutla k Dan Arah Angin Pada Stasiun Meteorologi Di Majene, 2009
Table Average of Wind Velocity, Absolute Maximum and Direction According to Station of Meteorology of in Majene, 2009
Bulan Month
Rata-Rata Average of Wind
Velocity (Km/Jam)
Maksimum Absolute Maximum
(Km/Jam)
Arah Angin Wind Direction
( 0)
(1)
(2)
(3)
(4)
01. Januari – January 7,00 54,00 360
02. Februari - February 5,00 54,00 360
03. Maret – March 6,00 29,00 360
04. April – April 5,00 22,00 360
05. Mei – May 5,00 27,00 030
06. Juni – June 9,00 31,00 060
07. Juli – July 10,00 31,00 070
08. Agustus – August 11,00 32,00 070
09. September – September 9,00 31,00 090
10. Oktober – October 7,00 23,00 090
11. Nopember – November 5,00 25,00 090
12. Desember – December 6,00 36,00 360
2009 7,17 32,92 192
2008 9 54 090
2007 5 20 214
2006 9 43 237
Sumber / Source : Stasiun Meteorologi, Klimatologi Dan Geofisika M ajene / Meteorological , Climatologi and Gefisika Station At Majene
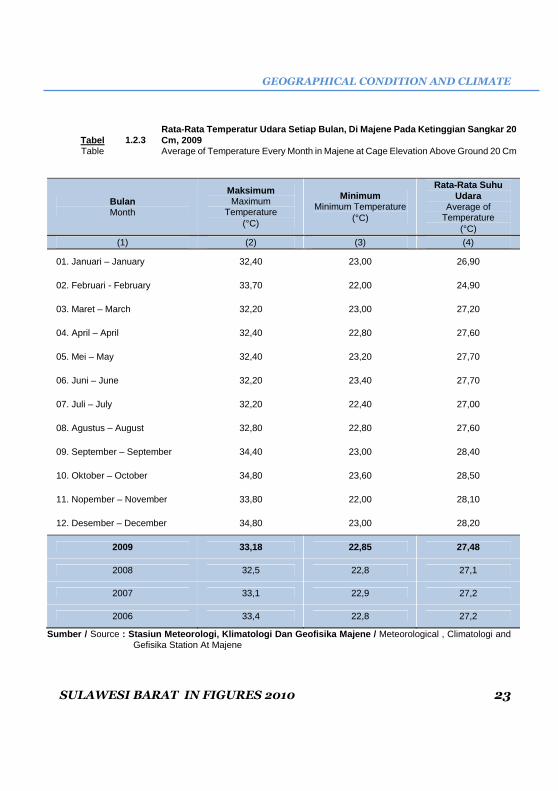
GEOGRAPHICAL CONDITION AND CLIMATE
SULAWESI BARAT IN FIGURES 2010 23
Tabel 1.2.3 Rata-Rata Temperatur Udara Setiap Bulan, Di Majene Pada Ketinggian Sangkar 20 Cm, 2009
Table Average of Temperature Every Month in Majene at Cage Elevation Above Ground 20 Cm
Bulan Month
Maksimum Maximum
Temperature (°C)
Minimum Minimum Temperature
(°C)
Rata-Rata Suhu Udara
Average of Temperature
(°C) (1)
(2)
(3)
(4)
01. Januari – January 32,40 23,00 26,90
02. Februari - February 33,70 22,00 24,90
03. Maret – March 32,20 23,00 27,20
04. April – April 32,40 22,80 27,60
05. Mei – May 32,40 23,20 27,70
06. Juni – June 32,20 23,40 27,70
07. Juli – July 32,20 22,40 27,00
08. Agustus – August 32,80 22,80 27,60
09. September – September 34,40 23,00 28,40
10. Oktober – October 34,80 23,60 28,50
11. Nopember – November 33,80 22,00 28,10
12. Desember – December 34,80 23,00 28,20
2009 33,18 22,85 27,48
2008 32,5 22,8 27,1
2007 33,1 22,9 27,2
2006 33,4 22,8 27,2
Sumber / Source : Stasiun Meteorologi, Klimatologi Dan Geofisika M ajene / Meteorological , Climatologi and Gefisika Station At Majene

KEADAAN GEOGRAFI DAN IKLIM
24 SULAWESI BARAT DALAM ANGKA 2010
Tabel 1.2.4
Jumlah Curah Hujan, Hari Hujan Dan Tekanan Atm Set iap Bulan Di Majene Pada Stasiun Meteorologi, Klimatologi Dan Geofisika Maje ne, 2009
Table Total Rainfall, Rainfall And Pressure Atm Day Each Month In The Meteorological , Climatologi and Gefisika Station At Majene, 2009
Bulan Month
Curah Hujan Total Rainfall
(mm)
Hari Hujan Total of Rain Days
(Hari)
Tekanan Atmosfer Atmosfer Preasure
(mb)
(1)
(2)
(3)
(4)
01. Januari – January 597,8 18 1 010,5
02. Februari - February 163,2 22 1 009,3
03. Maret – March 139,6 17 1 010,4
04. April – April 148,0 17 1 010,0
05. Mei – May 122,3 20 1 009,8
06. Juni – June 20,6 7 1 011,3
07. Juli – July 59,5 13 1 011,4
08. Agustus – August 32,6 8 1 011,2
09. September – September 6,2???? 5 1 011,4
10. Oktober – October 116,5 13 1 011,6
11. Nopember – November 152,5 15 1 009,8
12. Desember – December 154,4 14 1 010,5
2009 142,8 14 1 010,6
Sumber / Source : Stasiun Meteorologi, Klimatologi Dan Geofisika M ajene / Meteorological , Climatologi and Gefisika Station At Majene
2 PEMERINTAHAN
Goverment

GOVERNMENT
SULAWESI BARAT IN FIGURES 2010 27
2. Pemerintahan
Pemerintah Provinsi Sulawesi Barat
menaungi 5 wilayah kabupaten yang
berstatus otonomi.
Dari 5 Kabupaten tersebut, didalamnya
terdapat 69 wilayah kecamatan, dan 603
desa/kelurahan pada tahun 2009.
Kecamatan pemekaran terakhir adalah
Kecamatan Kepulauan Bala-Balakang (dari
Kecamatan Simboro Kepulauan) dan dua
kecamatan di Kabupaten Mamasa
(Kecamatan Rante Bulahan Timur dan
Mehalaan Barat).
Kabupaten Mamasa kondisi 2009 telah
memiliki 17 wilayah kecamatan dan 178
desa/kelurahan. Sementara Kabupaten
Polewali Mandar dan Mamuju memiliki jumlah
kecamatan yang sama yaitu 16 kecamatan
dan masing-masing memiliki 167 dan 155
desa/kelurahan. KemudianKabupaten Majene
dan Mamuju Utara juga memiliki jumlah
kecamatan sama yaitu 12 wilayah dan
masing-masing memiliki 40 dan 63
desa/keluarahan.
2. Government
The Province of Sulawesi Barat
administrates 5 Regency/Municipality which
are regencies status.
In 2009, from the regency/municipality
Province of Sulawesi Barat has 69
districts,and 603 definitive villages/wards.
Sub latest expansion is the District of
Bala-Balakang Islands (from Sub Simboro
Kepulauan) and two districts in Mamasa
(District Rante BulahanTimur and Mehalaan
Barat)
Mamasa Regency 2009 has had the
condition 17 districts and 178 villages.
Meanwhile, Polewali Mandar and Mamuju
have the same number of 16 districts and
each district has 167 and 155 villages.
Majene and Mamuju Utara regency also has
the same number of 12 regions and each has
40 and 63 villages / keluarahan
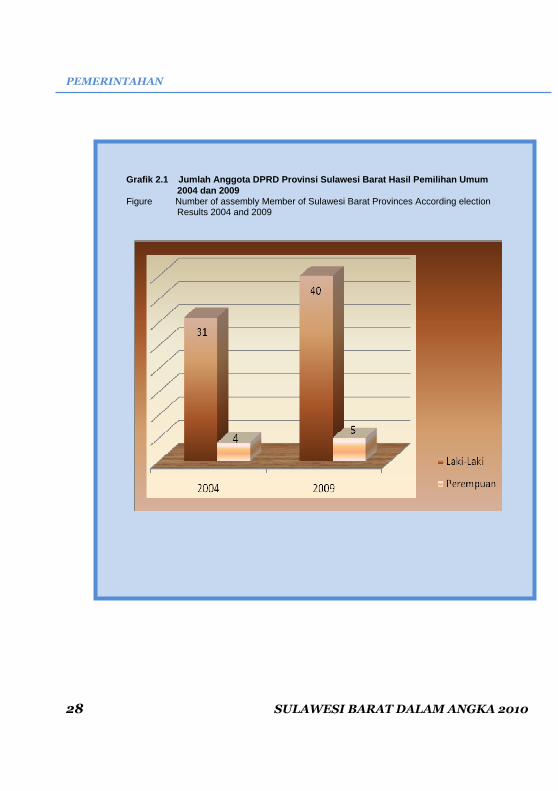
PEMERINTAHAN
28 SULAWESI BARAT DALAM ANGKA 2010
Grafik 2.1 Jumlah Anggota DPRD Provinsi Sulawesi Barat Hasil Pemilihan Umum 2004 dan 2009
Figure Number of assembly Member of Sulawesi Barat Provinces According election Results 2004 and 2009

GOVERNMENT
SULAWESI BARAT IN FIGURES 2010 29
Tabel 2.1.1 Jumlah Kecamatan, Desa/Kelurahan, Dan Nama-Nama Ibu kota Kabupaten Di Sulawesi Barat 2009
Table Number of Districts, Villages/Wards, and Capitals of Regency in Sulawesi Barat, 2009
Kabupaten Regency
Ibukota Capitals
Kecamatan Districts
Desa / Kelurahan Villages and Wards
(1)
(2)
(3)
(6)
01. Majene Banggae 8 40
02. Polewali Mandar Polewali 16 167
03. Mamasa Mamasa 17 178
04. Mamuju Mamuju 16 155
05. Mamuju Utara Pasangkayu 12 63
Jumlah - Total 69 603
2008 66 602
2007 65 535
2006 53 490
Sumber / Source : Badan Pusat Statistik (BPS) Provinsi Sulawesi Barat / Statistics of Sulawesi Barat Province
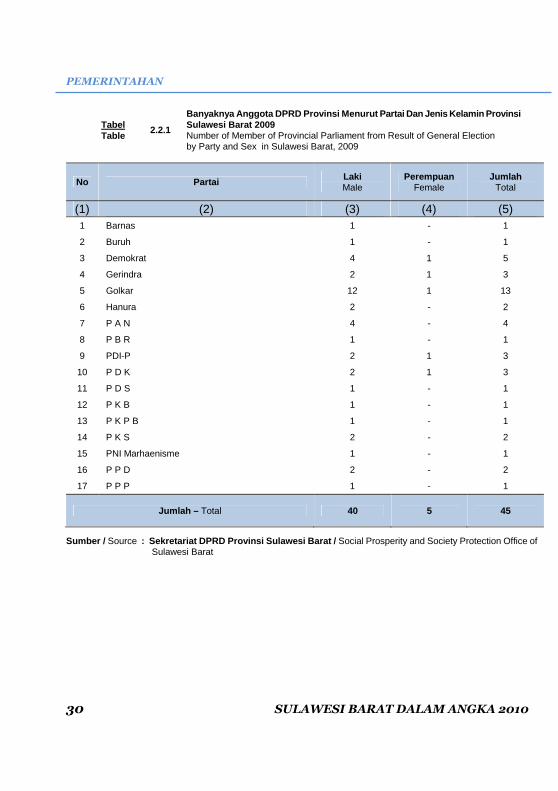
PEMERINTAHAN
30 SULAWESI BARAT DALAM ANGKA 2010
Tabel 2.2.1
Banyaknya Anggota DPRD Provinsi Menurut Partai Dan Jenis Kelamin Provinsi Sulawesi Barat 2009
Table Number of Member of Provincial Parliament from Result of General Election by Party and Sex in Sulawesi Barat, 2009
No Partai Laki Male
Perempuan Female
Jumlah Total
(1)
(2)
(3)
(4)
(5)
1 Barnas 1 - 1
2 Buruh 1 - 1
3 Demokrat 4 1 5
4 Gerindra 2 1 3
5 Golkar 12 1 13
6 Hanura 2 - 2
7 P A N 4 - 4
8 P B R 1 - 1
9 PDI-P 2 1 3
10 P D K 2 1 3
11 P D S 1 - 1
12 P K B 1 - 1
13 P K P B 1 - 1
14 P K S 2 - 2
15 PNI Marhaenisme 1 - 1
16 P P D 2 - 2
17 P P P 1 - 1
Jumlah – Total 40 5 45
Sumber / Source : Sekretariat DPRD Provinsi Sulawesi Barat / Social Prosperity and Society Protection Office of Sulawesi Barat

GOVERNMENT
SULAWESI BARAT IN FIGURES 2010 31
Tabel 2.2.2
Banyaknya Anggota DPRD Provinsi Menurut Partai Dan Pendidikan Provinsi Sulawesi Barat 2009
Table Member of Provincial Parliament from Result of General Election by Party and Graduated in Sulawesi Barat, 2009
No Partai SLTA D3 S1 S2/S3 Jumlah Total
(1)
(2) (4)
(5) (6)
(7)
(8)
1 Barnas - - - 1 1
2 Buruh - - - 1 1
3 Demokrat 1 - 4 - 5
4 Gerindra 1 - 2 - 3
5 Golkar 2 - 6 5 13
6 Hanura - - - 2 2
7 P A N 2 - 1 1 4
8 P B R - - 1 - 1
9 PDI-P 2 - 1 - 3
10 P D K - - 1 2 3
11 P D S 1 - - - 1
12 P K B - - 1 - 1
13 P K P B - - 1 - 1
14 P K S - - 2 - 2
15 PNI Marhaenisme 1 - - - 1
16 P P D - - 1 1 2
17 P P P - - 1 - 1
Jumlah – Total 10 - 22 13 45
Sumber / Source : Sekretariat DPRD Provinsi Sulawesi Barat / Social Prosperity and Society Protection Office of Sulawesi Barat

PEMERINTAHAN
32 SULAWESI BARAT DALAM ANGKA 2010
Tabel 2.2.3
Banyaknya Anggota DPRD Provinsi Menurut Komisi Dan Jenis Kelamin Hasil Pemilu Provinsi Sulawesi Barat 2009
Table Member of Provincial Regional Parliament from Result of General Election by Komision and Sex in Sulawesi Barat, 2009
No Komisi Laki Male
Perempuan Female
Jumlah Total
(1)
(2)
(3)
(4)
(5)
01. Pimpinan 4 - 4
02. Komisi A 7 3 10
03. Komisi B 10 - 10
04. Komisi C 11 - 11
05. Komisi D 8 2 10
Jumlah / Total 40 5 45
Sumber / Source : Sekretariat DPRD Provinsi Sulawesi Barat / Social Prosperity and Society Protection Office of Sulawesi Barat
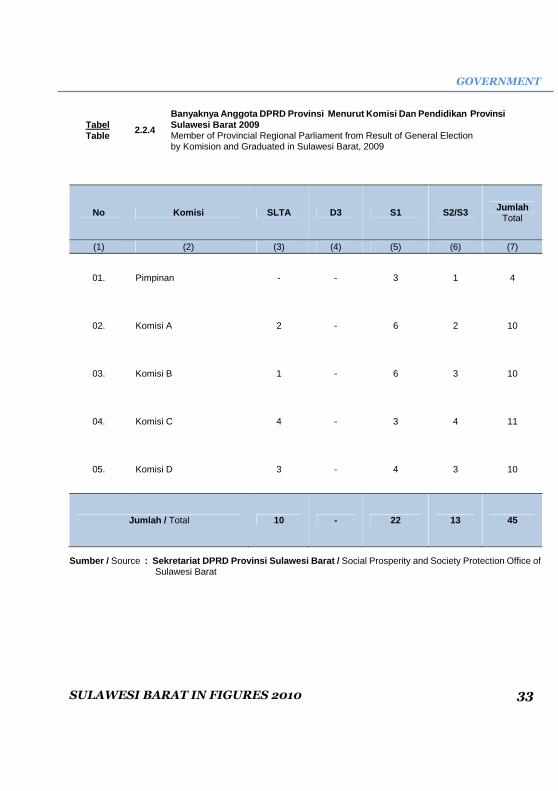
GOVERNMENT
SULAWESI BARAT IN FIGURES 2010 33
Tabel 2.2.4
Banyaknya Anggota DPRD Provinsi Menurut Komisi Dan Pendidikan Provinsi Sulawesi Barat 2009
Table Member of Provincial Regional Parliament from Result of General Election by Komision and Graduated in Sulawesi Barat, 2009
No Komisi SLTA D3 S1 S2/S3 Jumlah Total
(1)
(2) (3) (4) (5) (6)
(7)
01. Pimpinan - - 3 1 4
02. Komisi A 2 - 6 2 10
03. Komisi B 1 - 6 3 10
04. Komisi C 4 - 3 4 11
05. Komisi D 3 - 4 3 10
Jumlah / Total 10 - 22 13 45
Sumber / Source : Sekretariat DPRD Provinsi Sulawesi Barat / Social Prosperity and Society Protection Office of Sulawesi Barat

PEMERINTAHAN
34 SULAWESI BARAT DALAM ANGKA 2010
Tabel 2.2.5
Banyaknya Anggota DPRD Kabupaten Menurut Partai P rovinsi Sulawesi Barat 2009
Table Member of provincial and regional parliament from result of general election By party in sulawesi barat, 2009
Kode Wilayah
Area Code
Kabupaten Regency
Nama Partai Name of Party
Hanura P K P B P P P I P P R N Gerindra
(1)
(2)
(3)
(4)
(5)
(6)
(7)
01. Majene 1 1 - 1 2
02. Polewali Mandar 4 1 2 - -
03. Mamasa 1 - - - -
04. Mamuju 4 2 - - -
05. Mamuju Utara 2 - - - 1
Jumlah / Total 12 4 2 1 3
GOVERNMENT
SULAWESI BARAT IN FIGURES 2010 35
Lanjutan Tabel / Table Continued : 2.2.5
Kode Wilayah
Area Code
Kabupaten Regency
Nama Partai Name of Party
Barnas P K P I P K S P A N P P I B
(1)
(2)
(8)
(9)
(10)
(11)
(12)
01. Majene - - - 2 1
02. Polewali Mandar 2 - 2 4 -
03. Mamasa - 1 - 1 3
04. Mamuju 1 - 2 4 -
05. Mamuju Utara - - 2 3 -
Jumlah / Total 3 1 6 14 4

PEMERINTAHAN
36 SULAWESI BARAT DALAM ANGKA 2010
Lanjutan Tabel / Table Continued : 2.2.5
Kode Wilayah
Area Code
Kabupaten Regency
Nama Partai Name of Party
Kedaulatan P P D P K B P P I PNI
Marhaenisme
(1)
(2)
(13)
(14)
(15)
(16)
(17)
01. Majene 1 - - - 1
02. Polewali Mandar - - 1 - -
03. Mamasa - - 1 - -
04. Mamuju - 2 - - -
05. Mamuju Utara - - 1 - -
Jumlah / Total 1 2 3 - 1

GOVERNMENT
SULAWESI BARAT IN FIGURES 2010 37
Lanjutan Tabel / Table Continued : 2.2.5
Kode Wilayah
Area Code
Kabupaten Regency
Nama Partai Name of Party
P D P P K P P M B P P D I P D K
(1)
(2)
(18)
(19)
(20)
(21)
(22)
01. Majene - - 1 - 2
02. Polewali Mandar 2 - - - 2
03. Mamasa - - 1 - 2
04. Mamuju - - - - 1
05. Mamuju Utara - - 1 - 1
Jumlah / Total 2 - 3 - 8
PEMERINTAHAN
38 SULAWESI BARAT DALAM ANGKA 2010
Lanjutan Tabel / Table Continued : 2.2.5
Kode Wilayah
Area Code
Kabupaten Regency
Nama Partai Name of Party
Republikan
Pelopor Golkar P P P P D S
(1)
(2)
(18)
(19)
(20)
(21)
(22)
01. Majene 1 - 2 1 -
02. Polewali Mandar - 1 6 2 -
03. Mamasa - 1 4 1 1
04. Mamuju 1 - 5 1 1
05. Mamuju Utara - - 5 1 -
Jumlah / Total 2 2 22 6 2

GOVERNMENT
SULAWESI BARAT IN FIGURES 2010 39
Lanjutan Tabel / Table Continued : 2.2.5
Kode Wilayah
Area Code
Kabupaten Regency
Nama Partai Name of Party
P N B K I P B B P D I P P B R Patriot
(1)
(2)
(18)
(19)
(20)
(21)
(22)
01. Majene - 1 1 2 -
02. Polewali Mandar - - 2 - -
03. Mamasa - 1 1 1 1
04. Mamuju - - 3 1 3
05. Mamuju Utara - - 4 1 -
Jumlah / Total - 2 11 5 4
PEMERINTAHAN
40 SULAWESI BARAT DALAM ANGKA 2010
Lanjutan Tabel / Table Continued : 2.2.5
Kode Wilayah
Area Code
Kabupaten Regency
Nama Partai Name of Party
Demokrat P D K I P I S P K N U Merdeka
(1)
(2)
(18)
(19)
(20)
(21)
(22)
01. Majene 3 - - - -
02. Polewali Mandar 4 - 1 - 3
03. Mamasa 2 - - - -
04. Mamuju 5 - - - -
05. Mamuju Utara 2 - - - -
Jumlah / Total 16 - 1 - 3
GOVERNMENT
SULAWESI BARAT IN FIGURES 2010 41
Lanjutan Tabel / Table Continued : 2.2.5
Kode Wilayah
Area Code
Kabupaten Regency
Nama Partai Name of Party
Jumlah
P P N U I P S I Buruh
(1)
(2)
(23) (24)
(26)
(27)
01. Majene 1 - - 25
02. Polewali Mandar - 1 - 40
03. Mamasa - 2 - 25
04. Mamuju - - - 35
05. Mamuju Utara - - - 25
Jumlah / Total 1 3 - 150
Sumber / Source : Biro Tata Pemerintahan Sekretariat Daerah Provins i Sulawesi Barat / Agency Governance of Secretariat Sulawesi Barat Province

PEMERINTAHAN
42 SULAWESI BARAT DALAM ANGKA 2010
Tabel 2.3.1
Banyaknya Pegawai Negeri Sipil Di Lingkungan Pemeri ntah Provinsi Sulawesi Barat Menurut Unit Kerja/Instansi Dan Pendidikan 20 09
Table Number Of Civil Servants Environment In Sulawesi Barat Province Government By Work Unit / Institution And Education, 2009
No. Unit Kerja / Instansi
Pendidikan
Jumlah >S1 DI-III <SLTA
(1) (2) (5) (4) (3) (6)
I Badan/Dinas/Instansi Otonom 1 047 180 234 1 461
1 Sekretaris Daerah 1 - - 1
2 Asist. Bid. Ketataprajaan Setda 1 - - 1
3 Asist. Bid. Pembangunan Setda 1 - - 1
4 Asist. Bid. Administrasi Setda 1 - - 1
5 Biro Tata Pemerintahan Setda 22 1 3 26
6 Biro Hukum Setda 12 - - 12
7 Biro Humas dan Protokol Setda 15 1 2 18
8 Biro Ekonomi & Pembangunan Setda 14 1 2 17
9 Biro Perlengkapan dan Asset Setda 19 1 3 23
10 Biro Kesra Setda 13 1 2 16
11 Biro Ortala & Kepegawaian Setda 18 3 1 22
12 Biro Keuangan Setda 26 3 4 33
13 Biro Umum 18 5 9 32
14 Dinas Pekerjaan Umum Daerah 81 9 75 165
15 Dinas Kesehatan Daerah 69 30 3 102
16 Dinas Pendidikan Nasional Daerah 59 6 17 82
17 Dinas Tenaga Kerja & Trasnmigrasi Daerah
20 1 6 27
18 Dinas Pertanian & Perternakan Daerah
56 2 21 79
19 Dinas Kelautan & Perikanan Daerah 28 5 2 35
20 Dinas Kehutanan Daerah 28 2 2 32

GOVERNMENT
SULAWESI BARAT IN FIGURES 2010 43
Lanjutan Tabel/ Table Continued : 2.3.1
No Unit Kerja / Instansi
Pendidikan
Jumlah
>S1 Dipl I/II/III <SLTA
(1) (2) (3) (4) (5) (6)
21 Dinas Perhubungan, Komunikasi dan Informatika Dareah
32 1 12 45
22 Dinas Koperasi, UKM dan Prindag Daerah
26 2 5 33
23 Dinas Energi & Sumber Daya Mineral Daerah
25 - - 25
24 Dinas Pendapatan Daerah 34 6 8 48
25 Dinas Olah Raga, Pariwisata & Kebudayaan Daerah
32 4 7 43
26 Satuan Polisi Pamong Praja 9 - 6 15
27 Badan Pemberdayaan Masyarakat dan Pemerintah Desa Daerah
21 1 5 27
28 Badan Kepegawaian, Pendidikan dan Pelatihan Daerah
35 2 4 41
29 Dians Perkebunan Daerah 27 2 4 33
30 Badan Perencanaan Pembangunan, Pengembangan dan Statistik Daerah
38 2 2 42
31 Badan Kesbang, Politik & Linmas Daerah
19 1 3 23
32 Badan Promosi Penanaman Modal Daerah
18 2 1 21
33 Badan Lingkungan Hidup Daerah 23 3 2 28
34 Dinas Sosial Daerah 28 3 4 35
35 Badan Pemberdayaan Perempuan dan KB
13 5 1 19
36 Inspektorat Daerah 27 4 2 33
37 Rumah Sakit Umum Daerah 50 65 5 120
38 Bandan Ketahanan Pangan dan Penyuluhan Daerah
21 1 4 26
39 Kantor Kependudukan & Catatan Sipil Daerah
- - - -

PEMERINTAHAN
44 SULAWESI BARAT DALAM ANGKA 2010
Lanjutan Tabel/ Table Continued : 2.3.1
No Unit Kerja / Instansi
Pendidikan
Jumlah
>S1 Dipl I/II/III <SLTA
(1) (2) (5) (6) (7) (10)
40 Kantor Perpustakaan Arsip dan Dokumentai Daerah
10 - 1 11
41 Kantor Perwakilan Pemda Prov.Sulbar di Jakarata
4 - - 4
42 Sekretariat DPRD Provinsi 32 1 4 37
43 Sekretariat KORPRI 4 - - 4
44 Sekretariat KPU Provinsi 12 4 2 18
45 Staff Khusus Gubernur 5 - - 5
Badan/Dinas Vertikal 221 37 53 311
46 Badan Koordinasi Keluarga Berencana Nasional
40 4 - 44
47 Balai Pengelolaan DAS Lariang Mamasa
13 1 14 28
48 Badan Pusat Statistik Prov Sulawesi Barat
23 5 13 41
49 Kanwil Kementerian Hukum dan HAM 41 11 5 57
50 Stasiun Karantina IkanKelas II 4 3 3 11
51 Kanwil Badan Pertanahan Nasional 22 8 2 32
52 Kanwil Kementeerian Agama 60 - 3 63
53 Stasiun Karantina PertanianKelas II 10 - 10 20
54 Balai Pengkajian Teknologi Pertanian 8 5 3 16
Jumlah / Total 1 268 217 287 1 772
Sumbe r / Source : Badan Kepegawaian Dan Diklat Daerah Provinsi Sulawe si Barat / Personnel and training Regional agency of Sulawesi Barat Province
.

GOVERNMENT
SULAWESI BARAT IN FIGURES 2010 45
Tabel 2.3.2
Banyaknya Pegawai Negeri Sipil Di Lingkungan Pemeri ntah Provinsi Sulawesi Barat Menurut Unit Kerja/Instansi Dan Golongan 200 9
Table Number Of Civil Servants Environment In Sulawesi Barat Province Government By Work Unit / Institution And Grade, 2009
No Unit Kerja/Instansi
Golongan
Jumlah
IV III II I
(1) (2) (3) (4) (5) (6) (7)
I Badan/Dinas Otonomi Daerah 272 913 274 2 1 461
1 Sekretaris Daerah 1 - - - 1
2 Asist. Bid. Ketata Prajaan Setda 1 - - - 1
3 Asist. Bid. Pembangunan Setda 1 - - - 1
4 Asist. Bid. Administrasi Setda 1 - - - 1
5 Biro Tata Pemerintahan Setda 4 20 2 - 26
6 Biro Hukum Setda 6 6 - - 12
7 Biro Humas dan Protokol Setda 6 11 1 - 18
8 Biro Ekonomi & Pembangunan Setda 3 10 4 - 17
9 Biro Perlengkapan & Asset Setda 6 13 4 - 23
10 Biro Kesra Setda 4 10 2 - 16
11 Biro Ortala & Kepegawaian Setda 8 11 3 - 22
12 Biro Keuangan Setda 5 24 4 - 33
13 Biro Umum 3 16 13 - 32
14 Dinas Pekerjaan Umum Daerah 7 111 45 2 165
15 Dinas Kesehatan Daerah 6 63 33 - 102
16 Dinas Pendidikan Nasional Daerah 24 47 11 - 82
17 Dinas Tenaga Kerja & Trasnmigrasi Daerah 6 19 2 - 27
18 Dinas Pertanian & Perternakan Daerah 8 63 8 - 79
19 Dinas Kelautan & Perikanan Daerah 6 22 7 - 35
20 Dinas Kehutanan Daerah 4 26 2 - 32

PEMERINTAHAN
46 SULAWESI BARAT DALAM ANGKA 2010
Lanjutan Tabel/ Table Continued : 2.3.2
No Unit Kerja/Instansi
Golongan
Jumlah
IV III II I
(1) (2) (3) (4) (5) (6) (7)
21 Dinas Perhubungan, Komunikasi dan Informatika Dareah
7 30 8 - 45
22 Dinas Koperasi, UKM dan Prindag Daerah 6 24 3 - 33
23 Dinas Energi & Sumber Daya Mineral Daerah 4 21 - - 25
24 Dinas Pendapatan Daerah 7 34 7 - 48
25 Dinas Olah Raga, Pariwisata & Kebudayaan Daerah 19 16 8 - 43
26 Satuan Polisi Pamong Praja 5 4 6 - 15
27 Badan Pemberdayaan Masyarakat dan Pemerintah Desa Daerah
10 16 1 - 27
28 Badan Kepegawaian, Pendidikan dan Pelatihan Daerah
9 27 5 - 41
29 Dians Perkebunan Daerah 6 23 4 - 33
30 Badan Perencanaan Pembangunan, Pengembangan dan Statistik Daerah
7 31 4 - 42
31 Badan Kesbang, Politik & Linmas Daerah 7 12 4 - 23
32 Badan Promosi Penanaman Modal Daerah 10 9 2 - 21
33 Badan Lingkungan Hidup Daerah 7 20 1 - 28
34 Dinas Sosial Daerah 10 22 3 - 35
35 Badan Pemberdayaan Perempuan dan KB 9 8 2 - 19
36 Inspektorat Daerah 11 19 3 - 33
37 Rumah Sakit Umum Daerah 5 55 60 - 120
38 Bandan Ketahanan Pangan dan Penyuluhan Daerah 4 19 3 - 26
39 Kantor Kependudukan & Catatan Sipil Daerah
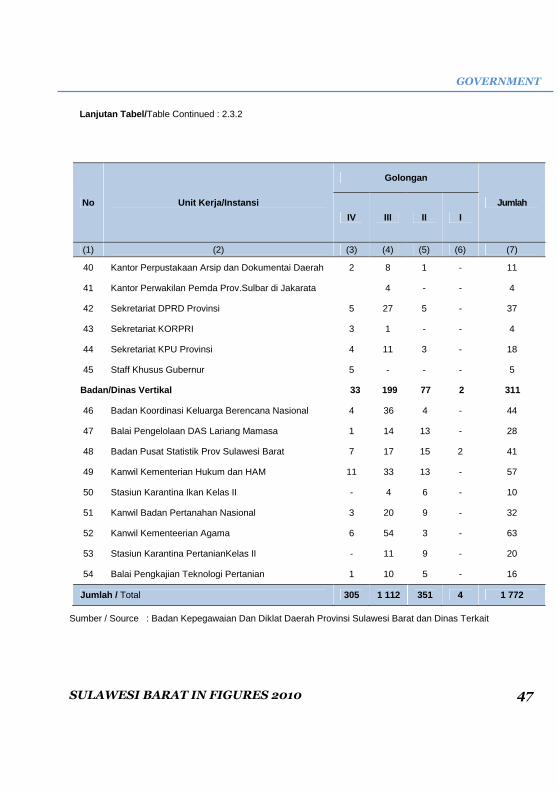
GOVERNMENT
SULAWESI BARAT IN FIGURES 2010 47
Lanjutan Tabel/ Table Continued : 2.3.2
No Unit Kerja/Instansi
Golongan
Jumlah
IV III II I
(1) (2) (3) (4) (5) (6) (7)
40 Kantor Perpustakaan Arsip dan Dokumentai Daerah 2 8 1 - 11
41 Kantor Perwakilan Pemda Prov.Sulbar di Jakarata 4 - - 4
42 Sekretariat DPRD Provinsi 5 27 5 - 37
43 Sekretariat KORPRI 3 1 - - 4
44 Sekretariat KPU Provinsi 4 11 3 - 18
45 Staff Khusus Gubernur 5 - - - 5
Badan/Dinas Vertikal 33 199 77 2 311
46 Badan Koordinasi Keluarga Berencana Nasional 4 36 4 - 44
47 Balai Pengelolaan DAS Lariang Mamasa 1 14 13 - 28
48 Badan Pusat Statistik Prov Sulawesi Barat 7 17 15 2 41
49 Kanwil Kementerian Hukum dan HAM 11 33 13 - 57
50 Stasiun Karantina Ikan Kelas II - 4 6 - 10
51 Kanwil Badan Pertanahan Nasional 3 20 9 - 32
52 Kanwil Kementeerian Agama 6 54 3 - 63
53 Stasiun Karantina PertanianKelas II - 11 9 - 20
54 Balai Pengkajian Teknologi Pertanian 1 10 5 - 16
Jumlah / Total 305 1 112 351 4 1 772
Sumber / Source : Badan Kepegawaian Dan Diklat Daerah Provinsi Sulawesi Barat dan Dinas Terkait
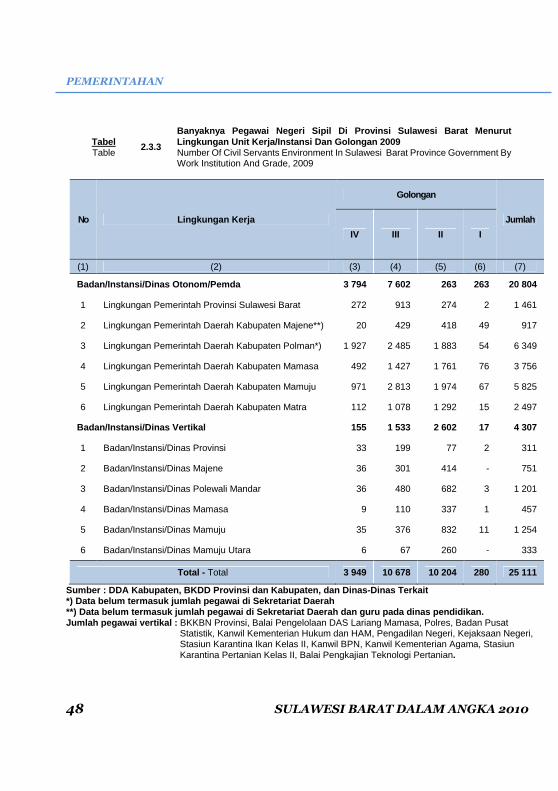
PEMERINTAHAN
48 SULAWESI BARAT DALAM ANGKA 2010
Tabel 2.3.3
Banyaknya Pegawai Negeri Sipil Di Provinsi Sulawesi Barat Menurut Lingkungan Unit Kerja/Instansi Dan Golongan 2009
Table Number Of Civil Servants Environment In Sulawesi Barat Province Government By Work Institution And Grade, 2009
No Lingkungan Kerja
Golongan
Jumlah
IV III II I
(1) (2) (3) (4) (5) (6) (7)
Badan/Instansi/Dinas Otonom/Pemda 3 794 7 602 263 2 63 20 804
1 Lingkungan Pemerintah Provinsi Sulawesi Barat 272 913 274 2 1 461
2 Lingkungan Pemerintah Daerah Kabupaten Majene**) 20 429 418 49 917
3 Lingkungan Pemerintah Daerah Kabupaten Polman*) 1 927 2 485 1 883 54 6 349
4 Lingkungan Pemerintah Daerah Kabupaten Mamasa 492 1 427 1 761 76 3 756
5 Lingkungan Pemerintah Daerah Kabupaten Mamuju 971 2 813 1 974 67 5 825
6 Lingkungan Pemerintah Daerah Kabupaten Matra 112 1 078 1 292 15 2 497
Badan/Instansi/Dinas Vertikal 155 1 533 2 602 17 4 307
1 Badan/Instansi/Dinas Provinsi 33 199 77 2 311
2 Badan/Instansi/Dinas Majene 36 301 414 - 751
3 Badan/Instansi/Dinas Polewali Mandar 36 480 682 3 1 201
4 Badan/Instansi/Dinas Mamasa 9 110 337 1 457
5 Badan/Instansi/Dinas Mamuju 35 376 832 11 1 254
6 Badan/Instansi/Dinas Mamuju Utara 6 67 260 - 333
Total - Total 3 949 10 678 10 204 280 25 111
Sumber : DDA Kabupaten, BKDD Provinsi dan Kabupaten, dan Dinas-Dinas Terkait *) Data belum termasuk jumlah pegawai di Sekretariat Daerah **) Data belum termasuk jumlah pegawai di Sekretariat Daerah dan guru pada dinas pendidikan. Jumlah pegawai vertikal : BKKBN Provinsi, Balai Pengelolaan DAS Lariang Mamasa, Polres, Badan Pusat
Statistik, Kanwil Kementerian Hukum dan HAM, Pengadilan Negeri, Kejaksaan Negeri, Stasiun Karantina Ikan Kelas II, Kanwil BPN, Kanwil Kementerian Agama, Stasiun Karantina Pertanian Kelas II, Balai Pengkajian Teknologi Pertanian.

3 PENDUDUK DAN
KETENAGAKERJAAN Population and
Employment

POPULATION AND EMPLOYMENT
SULAWESI BARAT IN FIGURES 2010 51
3.1. Penduduk
Sebagai daerah yang baru dengan
sejumlah potensi yang dimilikinya, Sulawesi
Barat memiliki daya tarik tersendiri bagi
sejumlah migran untuk memilih daerah ini
sebagai tempat tinggal baru. Berdasarkan
proyeksi SUPAS 2005 - 2015 Badan Pusat
Statistik Provinsi Sulawesi Barat,
pertumbuhan penduduk tahun 2009 sekitar
1,96 persen dibanding tahun 2005.
Pertumbuhan tersebut terutama
disebabkan oleh faktor migrasi yang cukup
tinggi sejak terbentuknya Sulawesi Barat
disamping sebagai daerah tujuan
transmigrasi. Oleh karena itu, penduduk
Sulawesi Barat diperkirakan telah mencapai
1.047.739 jiwa pada tahun 2009 yang
tersebar di 5 kabupaten. Jumlah penduduk
terbesar yakni 362.106 jiwa (34,56 persen)
mendiami Kabupaten Polewali Mandar
Seperti yang telah di maklumi
sebelumnya, bahwa penduduk Sulawesi
Barat pada tahun 2009, kaum laki-laki lebih
banyak dari kaum perempuan. Hal ini
tercermin dari angka rasio jenis kelamin
yang lebih besar dari 100.
Berdasarkan distribusi penduduk di
semua kabupaten, Kabupaten Polewali
Mandar memiliki tingkat kepadatan yang
tinggi sekitar 179 jiwa/Km², sedangkan
Kabupaten Mamuju Utara hanya berkisar
37 jiwa/Km².
3.1 Population
As a new region with a number of its
potentiality, Sulawesi Barat has a special
attraction for migrants to choose this area
as a new dwelling. Based on projection of
SUPAS 2005 - 2015, the Central Data of
Statistics of Sulawesi Barat, population
growth at 2009 of about 1,96 percent than
2005. The growth rate that caused by the
migration factor is quite high since the
formation of Sulawesi Barat as well as
transmigration destination areas. Therefore,
residents of Sulawesi Barat is estimated to
have reached 1.047.739 soul in the year
2009 are spread across five districts. The
largest population of 362.106 inhabitants
(34.56 percent) lived in Polewali Mandar.
As has been previously understood,
that the population of Sulawesi Barat in
2009, men more than women. This is
reflected in sex ratios greater than 100.
Based on population distribution in all
districts, Polewali Mandar district has a high density level of about 179 inhabitants / km
², while the Mamuju Utara ranged only 37
inhabitants / km ².

PENDUDUK DAN KETENAGAKERJAAN
52 SULAWESI BARAT DALAM ANGKA 2010
3.2. Angkatan Kerja
Penduduk Usia Kerja (PUK)
didefinisikan sebagai penduduk yang
berumur 15 tahun ke atas. Penduduk Usia
Kerja terdiri dari Angkatan Kerja dan Bukan
Angkatan Kerja. Mereka yang termasuk
dalam Angkatan Kerja adalah penduduk
yang bekerja atau yang sedang mencari
pekerjaan, sedangkan Bukan Angkatan
Kerja adalah mereka yang bersekolah,
mengurus rumahtangga atau melakukan
kegiatan lainnya.
Jumlah angkatan kerja di Sulawesi
Barat meningkat sekitar 15.702 orang dari
tahun sebelumnya yang hanya berkisar
495.959 orang pada tahun 2008.
Jika dirinci menurut kabupaten, tingkat
pengangguran tertinggi berada di
Kabupaten Polewali Mandar sekitar 6,23
persen, Kabupaten Majene sendiri berkisar
5,89 persen. Hal ini jika dicermati, berada
jauh diatas level Sulawesi Barat yang
hanya bertengger pada titik 4,51 persen.
Dilihat dari segi lapangan usaha,
sebagian besar penduduk Sulawesi Barat
bekerja disektor pertanian yang berjumlah
300.357 orang atau sekitar 61,54 persen
dari jumlah penduduk yang bekerja. Sektor
lainnya yang juga menyerap tenaga kerja
yang cukup besar adalah sektor
perdagangan dan jasa-jasa.
Upah minimum Provinsi Sulawesi
Barat, selalu mengalami peningkatan.
Selama kurun waktu 2006-2009 terjadi
peningkatan sekitar 85,14 persen. Hal ini
diharapkan dapat meningkatkan taraf hidup
para pekerja di Sulawesi Barat
3.2 Labor Force
Working Age Population is defined as
the population aged 15 years and over.
Working Age Population consists of the
Labor Force and Not in Labour Force. They
are included in the Labor Force are people
working or looking for work, while the Labor
Force are not those who go to school,
taking care of household or doing other
activities.
Total labor force in Sulawesi Barat
increased by approximately 16 702 people
from the previous year which is only about
495959 people in 2008.
If specified by the district, the highest
unemployment rate in Polewali Mandar
around 6.23 percent, the District itself
ranges from 5.89 percent Majene. This is, if
observed, was far above the level of
Sulawesi Barat is just perched on the point
of 4,51 percent.
Viewed from the aspect of the business
field, most of the residents of Sulawesi
Barat working agricultural sector amounted
to 300 357 persons or about 61.54 percent
of the total working population. Other
sectors that also absorb sufficient labor was
trade and services.
The minimum wage in Sulawesi Barat
Province, was always an increase. During
the period 2006-2009 there was an
increase of about 85,14 percent. This is
expected to improve the standard of living
of workers in Sulawesi Barat.

POPULATION AND EMPLOYMENT
SULAWESI BARAT IN FIGURES 2010 53
Grafik 3.1 Perkembangan Jumlah Penduduk Sulawesi Barat Tahun 2004-2009
Figure Progres of Sulawesi Barat Population, 2004-2009
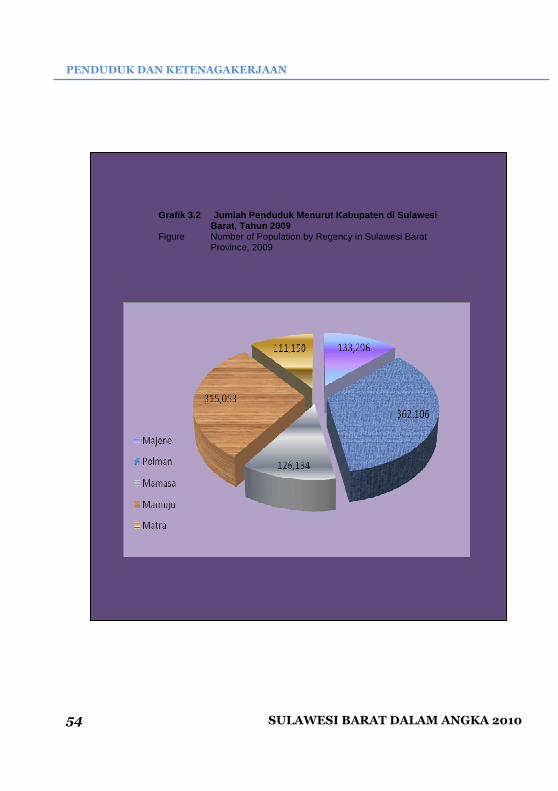
PENDUDUK DAN KETENAGAKERJAAN
54 SULAWESI BARAT DALAM ANGKA 2010
Grafik 3.2 Jumlah Penduduk Menurut Kabupaten di Sulawesi Barat, Tahun 2009
Figure Number of Population by Regency in Sulawesi Barat Province, 2009
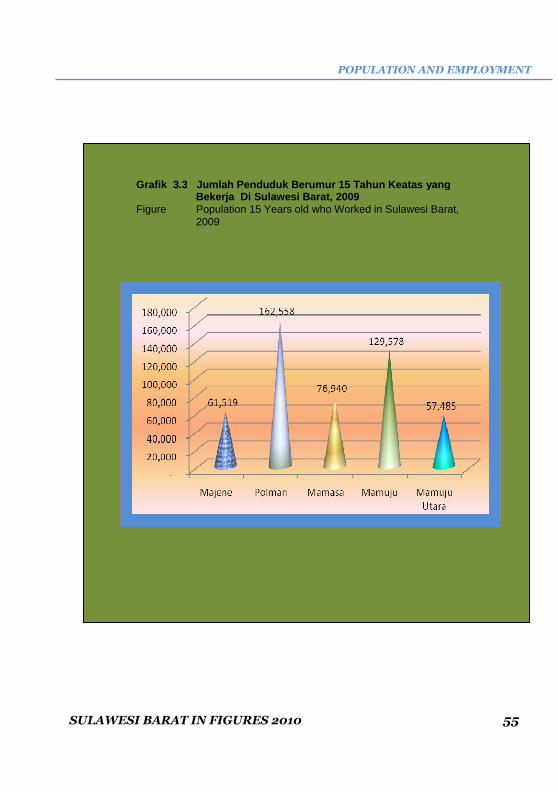
POPULATION AND EMPLOYMENT
SULAWESI BARAT IN FIGURES 2010 55
Grafik 3.3 Jumlah Penduduk Berumur 15 Tahun Keatas yang Bekerja Di Sulawesi Barat, 2009
Figure Population 15 Years old who Worked in Sulawesi Barat, 2009

PENDUDUK DAN KETENAGAKERJAAN
56 SULAWESI BARAT DALAM ANGKA 2010
Tabel 3.1.1 Jumlah Penduduk, Rasio Jenis Kelamin Menurut Kabupa ten Di Sulawesi Barat 2009
Table Number of Population, Sex Ratio by Regency in Sulawesi Barat, 2009
Kode
Wilayah AreaCode
Kabupaten Regency
Penduduk Population Rasio
Jenis Kelamin
Sex Ratio
Rumah Tangga House-holds
Rata-Rata Anggota
RT Average
Haousehold
Member
Laki-Laki Male
Perem-Puan
Female
Jumlah Total
(1)
(2)
(3)
(4)
(5)
(6)
(7)
(68
01 Majene 66 430 66 866 133 296 99,35 27 006 4,94
02 Polewali Mandar 178 748 183 358 362 106 97,49 79 186 4,57
03 Mamasa 64 487 61 647 126 134 104,61 29 940 4,21
04 Mamuju 161 924 153 129 315 053 105,74 71 957 4,38
05. Mamuju Utara 58 431 52 719 111 150 110,83 26 397 4,21
Jumlah- Total 530 020 517 719 1 047 739 102,38 234 486 4,47
2008 522 228 510 028 1 032 256 102,39 231 738 4,50
2007 514 481 502 182 1 016 663 102,45 228 284 4,50
Sumber / Source : Proyeksi Supas 2005-2015 / Projection of Supas 2005-2015

POPULATION AND EMPLOYMENT
SULAWESI BARAT IN FIGURES 2010 57
Tabel 3.1.2 Jumlah Penduduk Dan Laju Pertumbuhan Penduduk Menur ut Kabupaten Di Sulawesi Barat 2005-2009
Table Number of Annual Population Growth Rate by Regency in Sulawesi Barat, 2005-2009
Kabupaten Regency
2005 2006 2007 2008 2009
Laju Pertum-Buhan
Penduduk Annual
Growth Rate (2005-2009)
(% tahun)
(1) (2)
(3)
(4)
(5)
(6)
(7)
01 Majene 131 413 131 977 133 232 133 183 133 296 0,36
02 Polewali Mandar 352 407 356 391 361 202 361 342 362 106 0,68
03 Mamasa 120 496 121 921 123 786 125 309 126 134 1,15
04 Mamuju 269 876 284 331 296 828 305 473 315 053 3,95
05.
Mamuju Utara 95 237 98 035 101 615 106 949 111 150 3,94
Jumlah– Total 969 429 992 655 1 016 663 1 032 256 1 047 739 1,96
Sumber / Source : Proyeksi Supas 2005-2015 / Projection of Supas 2005-2015
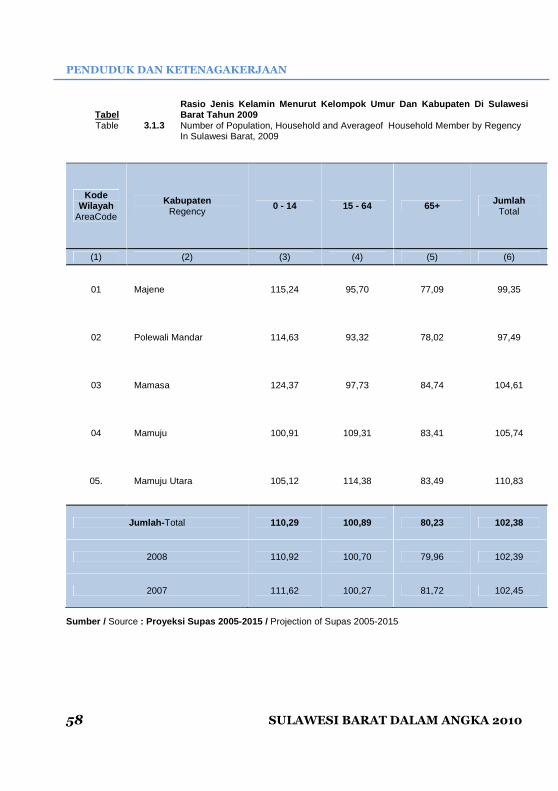
PENDUDUK DAN KETENAGAKERJAAN
58 SULAWESI BARAT DALAM ANGKA 2010
Tabel 3.1.3
Rasio Jenis Kelamin Menurut Kelompok Umur Dan Kabup aten Di Sulawesi Barat Tahun 2009
Table Number of Population, Household and Averageof Household Member by Regency In Sulawesi Barat, 2009
Kode Wilayah
AreaCode
Kabupaten Regency
0 - 14 15 - 64 65+ Jumlah Total
(1) (2) (3) (4) (5) (6)
01 Majene 115,24 95,70 77,09 99,35
02 Polewali Mandar 114,63 93,32 78,02 97,49
03 Mamasa 124,37 97,73 84,74 104,61
04 Mamuju 100,91 109,31 83,41 105,74
05. Mamuju Utara 105,12 114,38 83,49 110,83
Jumlah- Total 110,29 100,89 80,23 102,38
2008 110,92 100,70 79,96 102,39
2007 111,62 100,27 81,72 102,45
Sumber / Source : Proyeksi Supas 2005-2015 / Projection of Supas 2005-2015
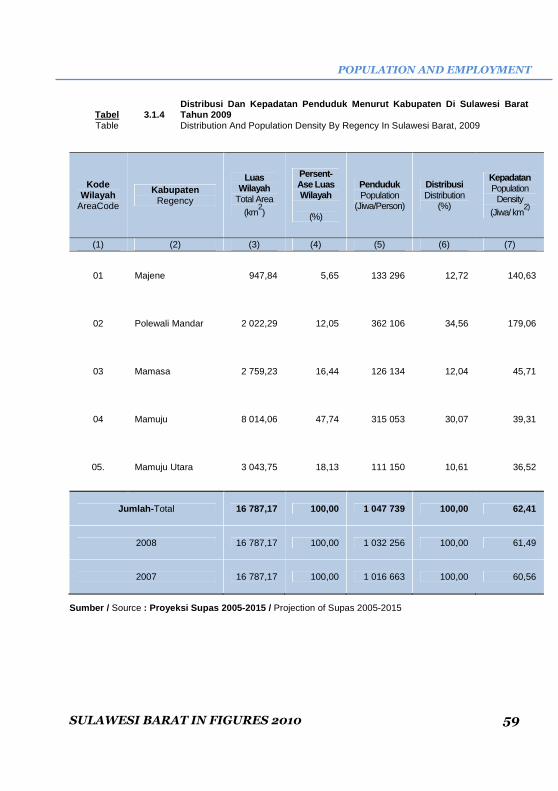
POPULATION AND EMPLOYMENT
SULAWESI BARAT IN FIGURES 2010 59
Tabel 3.1.4 Distribusi Dan Kepadatan Penduduk Menurut Kabupaten Di Sulawesi Barat Tahun 2009
Table Distribution And Population Density By Regency In Sulawesi Barat, 2009
Kode Wilayah
AreaCode
Kabupaten Regency
Luas Wilayah
Total Area (km
2)
Persent-Ase Luas Wilayah
(%)
Penduduk Population
(Jiwa/Person)
Distribusi Distribution
(%)
Kepadatan Population
Density (Jiwa/ km
2)
(1)
(2)
(3)
(4)
(5)
(6)
(7)
01 Majene 947,84 5,65 133 296 12,72 140,63
02 Polewali Mandar 2 022,29 12,05 362 106 34,56 179,06
03 Mamasa 2 759,23 16,44 126 134 12,04 45,71
04 Mamuju 8 014,06 47,74 315 053 30,07 39,31
05. Mamuju Utara 3 043,75 18,13 111 150 10,61 36,52
Jumlah- Total 16 787,17 100,00 1 047 739 100,00 62,41
2008 16 787,17 100,00 1 032 256 100,00 61,49
2007 16 787,17 100,00 1 016 663 100,00 60,56
Sumber / Source : Proyeksi Supas 2005-2015 / Projection of Supas 2005-2015

PENDUDUK DAN KETENAGAKERJAAN
60 SULAWESI BARAT DALAM ANGKA 2010
Tabel 3.1.5
Angka Beban Tanggungan, Penduduk Menurut Kelompok U mur Dan Kabupaten Di Sulawesi Barat Tahun 2009
Table Numbers Of Liability Costs, Population By Age Group And Regency In Sulawesi Barat,2009
Kode Wilayah
AreaCode
Kabupaten Regency
0 - 14 15 - 64 65+ Angka Beban Tanggungan
(%)
(1)
(2)
(3)
(4)
(5)
(6)
01 Majene 35 689 89 988 7 619 48,13
02 Polewali Mandar 96 510 242 995 22 601 49,02
03 Mamasa 40 539 77 444 8 151 62,87
04 Mamuju 95 735 208 985 10 333 50,75
05. Mamuju Utara 33 595 75 461 2 094 47,29
Jumlah- Total 302 068 694 873 50 798 50,78
2008 297 387 684 571 50 298 50,79
2007 296 889 671 076 48 698 51,50
Sumber / Source : Proyeksi Supas 2005-2015 / Projection of Supas 2005-2015

POPULATION AND EMPLOYMENT
SULAWESI BARAT IN FIGURES 2010 61
Tabel Table 3.1.6
Persentase Penduduk Berumur 10 Tahun Ke Atas Menuru t Jenis Kelamin Dan Status Perkawinan Per Kabupaten Di Sulawesi Barat T ahun 2009
Percentage Of Population Aged 10 Years According To Gender Above And Marriage Status As Of Regency In Sulawesi Barat, 2009
Kabupaten Regency
Laki-Laki Male
Perempuan
Female
Belum Kawin Kawin Cerai
Hidup Cerai Mati
Belum Kawin Kawin Cerai
Hidup Cerai Mati
(1) (2) (3) (4) (5) (6) (7) (8) (9)
01. Majene 51,07 46,15 0,36 2,42
42,14 44,56 3,32 9,98
02. Polewali Mandar 46,33 49,03 0,77 3,82
36,32 48,52 3,45 11,71
03. Mamasa 45,44 51,58 0,90 2,08
32,38 55,13 4,44 8,05
04. Mamuju 42,28 54,72 0,94 2,06
34,32 54,90 2,52 8,27
05. Mamuju Utara 39,41 57,79 1,16 1,64
30,95 62,51 1,89 4,64
2009 44,84 51,65 0,83 2,68
35,50 52,02 3,12 9,36
2008 58,23 39,68 0,63 1,46
51,71 39,61 2,66 6,02
2007 43,18 53,71 0,93 2,18
35,70 53,21 2,78 8,30
Sumber / Source : Hasil Survei Sosial Ekonomi Nasional (SUSENAS) 2 009 / Results of 2008 National Socio Economic Survey (SUSENAS) 2009

PENDUDUK DAN KETENAGAKERJAAN
62 SULAWESI BARAT DALAM ANGKA 2010
Tabel 3.1.7 Persentase Penduduk Menurut Kabupaten Dan Kelompok Umur Di Sulawesi Barat 2009
Table Percentage Population by Regency And Age Group In Sulawesi Barat, 2009
Kelompok Umur
Age Group (Tahun/Years)
Majene (%)
Polman (%)
Mamasa (%)
Mamuju (%)
Matra (%)
Provinsi Sulbar
(%)
(1)
(2)
(3)
(4)
(5)
(6)
(7)
0 – 4 8,63 8,59 10,36 9,79 9,74 9,29
5 – 9 9,22 9,18 11,07 10,47 10,41 9,93
10 – 14 8,92 8,88 10,71 10,13 10,07 9,61
15 – 19 9,85 9,79 8,95 9,67 9,90 9,67
20 – 24 9,44 9,39 8,59 9,28 9,50 9,28
25 – 29 9,15 9,10 8,32 8,99 9,20 8,99
30 – 34 8,44 8,39 7,68 8,29 8,49 8,29
35 – 39 7,73 7,68 7,03 7,59 7,77 7,59
40 – 44 6,15 6,11 5,59 6,04 6,19 6,04
45 – 49 5,34 5,31 4,86 5,25 5,37 5,25
50 – 54 4,68 4,65 4,25 4,59 4,70 4,59
55 – 59 3,77 3,75 3,43 3,71 3,80 3,71
60 – 64 2,96 2,94 2,69 2,91 2,97 2,90
65 – 69 2,35 2,57 2,66 1,35 0,77 1,99
70 – 74 1,78 1,94 2,01 1,02 0,59 1,51
75+ 1,58 1,73 1,79 0,91 0,52 1,34
Jumlah - Total
100,00 100,00 100,00 100,00 100,00 100,00
Sumber / Source : Proyeksi Supas 2005-2015 / Projection of Supas 2005-2015

POPULATION AND EMPLOYMENT
SULAWESI BARAT IN FIGURES 2010 63
Tabel 3.1.8 Jumlah Penduduk Menurut Kabupaten Dan Kelompok Umur Di Sulawesi Barat 2009
Table Number Population by Regency And Age Group In Sulawesi Barat, 2009
Kelompok Umur
Age Group (Tahun/Year
s)
Majene (Jiwa)
Polman (Jiwa)
Mamasa (Jiwa)
Mamuju (Jiwa)
Matra (Jiwa)
Provinsi Sulbar (Jiwa)
(1)
(2)
(3)
(4)
(5)
(6)
(7)
0 – 4 11 501 31 101 13 064 30 852 10 826 97 344
5 – 9 12 292 33 239 13 962 32 972 11 570 104 036
10 – 14 11 896 32 169 13 513 31 911 11 198 100 687
15 – 19 13 123 35 437 11 294 30 477 11 005 101 335
20 – 24 12 589 33 993 10 834 29 235 10 556 97 208
25 – 29 12 201 32 946 10 500 28 334 10 231 94 212
30 – 34 11 253 30 385 9 684 26 133 9 436 86 891
35 – 39 10 299 27 811 8 863 23 918 8 637 79 529
40 – 44 8 199 22 141 7 056 19 042 6 876 63 314
45 – 49 7 119 19 224 6 127 16 533 5 970 54 973
50 – 54 6 233 16 830 5 364 14 474 5 226 48 126
55 – 59 5 031 13 586 4 330 11 685 4 219 38 852
60 – 64 3 941 10 642 3 392 9 153 3 305 30 433
65 – 69 3 133 9 295 3 352 4 250 861 20 892
70 – 74 2 373 7 041 2 539 3 219 652 15 825
75+ 2 112 6 265 2 260 2 864 581 14 082
Jumlah / Total
133 296 362 106 126 134 315 053 111 150 1 047 739
Sumber / Source : Proyeksi Supas 2005-2015 / Projection of Supas 2005-2015
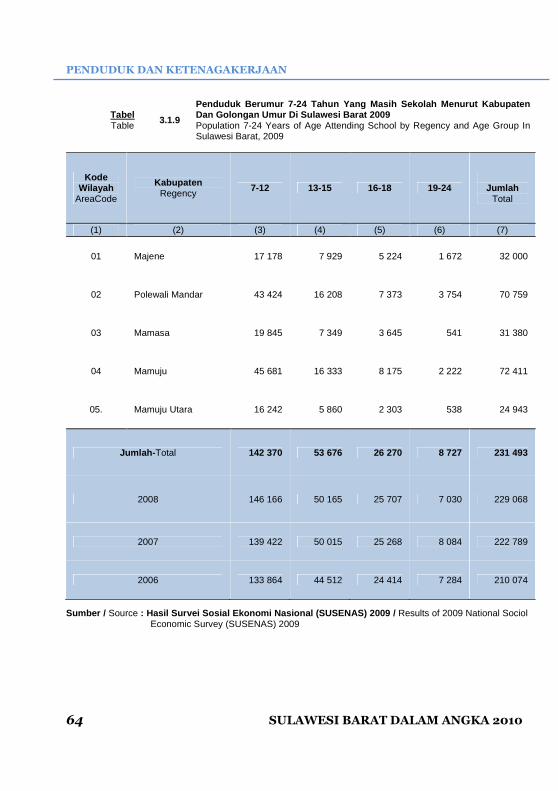
PENDUDUK DAN KETENAGAKERJAAN
64 SULAWESI BARAT DALAM ANGKA 2010
Tabel 3.1.9
Penduduk Berumur 7-24 Tahun Yang Masih Sekolah Menu rut Kabupaten Dan Golongan Umur Di Sulawesi Barat 2009
Table Population 7-24 Years of Age Attending School by Regency and Age Group In Sulawesi Barat, 2009
Kode Wilayah
AreaCode
Kabupaten Regency
7-12 13-15 16-18 19-24
Jumlah Total
(1)
(2)
(3)
(4)
(5)
(6)
(7)
01 Majene 17 178 7 929 5 224 1 672 32 000
02 Polewali Mandar 43 424 16 208 7 373 3 754 70 759
03 Mamasa 19 845 7 349 3 645 541 31 380
04 Mamuju 45 681 16 333 8 175 2 222 72 411
05. Mamuju Utara 16 242 5 860 2 303 538 24 943
Jumlah- Total 142 370 53 676 26 270 8 727 231 493
2008 146 166 50 165 25 707 7 030 229 068
2007 139 422 50 015 25 268 8 084 222 789
2006 133 864 44 512 24 414 7 284 210 074
Sumber / Source : Hasil Survei Sosial Ekonomi Nasional (SUSENAS) 20 09 / Results of 2009 National Sociol Economic Survey (SUSENAS) 2009

POPULATION AND EMPLOYMENT
SULAWESI BARAT IN FIGURES 2010 65
Tabel 3.1.10
Persentase Penduduk Berumur 10 Tahun Ke Atas Menuru t Kabupaten Dan Pendidikan Tertinggi Yang Ditamatkan Di Sulawesi B arat 2009
Table Percentage of Population of 10 Years of Age & Over by Educational Attainment And Regency in Sulawesi Barat, 2009
Kode Wilayah
AreaCode
Kabupaten Regency
Tidak/Belum Tamat
Sekolah Dasar
Never/Not Attended School
Pendidikan Tertinggi Yang Ditamatkan Educational Attainment
Sekolah Dasar
Primary School
SMTP Junior High
School
SMTA Senior High
School
SMK Vocational
High School
(1)
(2)
(3)
(4)
(5)
(6)
(7)
01 Majene 28,75 30,65 17,79 12,47 4,14
02 Polewali Mandar 30,21 30,23 17,28 12,69 6,01
03 Mamasa 30,46 32,35 16,45 11,19 3,96
04 Mamuju 30,95 29,10 16,18 14,13 2,58
05. Mamuju Utara 27,48 39,61 16,12 11,31 2,08
Rata-Rata - Average 29,99 31,17 16,79 12,77 4,08
2008 30,19 32,39 16,34 12,14 3,39
2007 36,59 33,86 13,86 9,13 2,95

PENDUDUK DAN KETENAGAKERJAAN
66 SULAWESI BARAT DALAM ANGKA 2010
Lanjutan Tabel/ Table Continued : 3.1.10
Kode Wilayah
AreaCode
Kabupaten Regency
Pendidikan Tertinggi Yang Ditamatkan Educational Attainment
Jumlah Total Diploma
I/II Diploma
III Diploma
IV/Strata 1 Strata 2 / Strata 3
(1)
(2) (8)
(9)
(10)
(11)
(12)
01 Majene 1,24 0,99 3,95 0,02 100,00
02 Polewali Mandar 0,90 0,87 1,79 0,03 100,00
03 Mamasa 2,26 0,90 2,44 0,00 100,00
04 Mamuju 1,44 1,28 4,01 0,32 100,00
05. Mamuju Utara 0,93 1,15 1,21 0,11 100,00
Rata-Rata – Average 1,27 1,04 2,76 0,12 100,00
2008 1,25 0,79 3,36 0,14 100,00
2007 1,10 0,59 1,79 0,13 100,00
Sumber / Source : Hasil Survei Sosial Ekonomi Nasional (SUSENAS) 20 09 / Results of 2009 National Socio Economic Survey (SUSENAS) 2009

POPULATION AND EMPLOYMENT
SULAWESI BARAT IN FIGURES 2010 67
Tabel 3.2.1
Penduduk Berumur 15 Tahun Ke Atas Menurut Kabupaten Dan Kegiatan Selama Seminggu Yang Lalu Di Sulawesi Barat 2009
Table Population 15 Years of Age and Over by Regency Type of Activity During the Previous Week in Sulawesi Barat, 2009
Kabupaten Regency
Angkatan Kerja Economically Active
Tingkat Pengangguran Terbuka
(TPT) Unemployment
Rate (%)
% Bekerja Terhadap Angkatan
kerja %Working to Economically
Active
Bekerja Working
Pengangguran Unemployment
Jumlah Total
(1)
(2)
(3)
(4)
(5)
(6)
Majene 61 519 3 851 65 370 5,89 94,11
Polewali Mandar 162 558 10 795 173 353 6,23 93,77
Mamasa 76 940 1 509 78 449 1,92 98,08
Mamuju 129 578 4 512 134 090 3,36 96,64
Mamuju Utara 57 485 2 397 59 882 4,00 96,00
Jumlah- Total 488 080 23 064 511 144 4,51 95,49
2008 473 309 22 650 495 959 4,57 95,43
2007 444 863 25 634 470 497 5,45 94,55

PENDUDUK DAN KETENAGAKERJAAN
68 SULAWESI BARAT DALAM ANGKA 2010
Lanjutan Tabel/ Table Continued : 3.2.1
Kabupaten Regency
Bukan Angkatan Kerja Not Economically Active
Jumlah Penduduk Usia Kerja
% Angk Kerja thd Penduduk Usia Kerja %Economi cally Active to Working
Age Population
Sekolah Attending
School
Mengurus RT House
Keeping
Lainnya Others
Jumlah Total
(1)
(7)
(8
(9)
(10)
(11)
(12)
Majene 12 104 23 019 9 638 44 761 110 131 59,36
Polewali Mandar 17 387 54 495 10 638 82 250 255 873 67,75
Mamasa 7 560 10 790 4 977 23 327 101 776 77,08
Mamuju 14 550 36 203 11 200 61 953 196 043 68,40
Mamuju Utara 4 877 19 954 2 408 27 239 87 121 68,73
Jumlah- Total 56 478 144 461 38 861 239 800 750 994 68,07
2008 56 816 144 600 38 768 240 184 736 143 67,37
2007 59 217 151 501 40 210 250 928 721 425 65,22
Sumber / Source : Hasil Survei Sosial Ekonomi Nasional (SUSENAS) 20 09 / Results of 2009 National Socio Economic Survey (SUSENAS) 2009

POPULATION AND EMPLOYMENT
SULAWESI BARAT IN FIGURES 2010 69
Tabel 3.2.2
Penduduk Berumur 15 Tahun Ke Atas Yang Bekerja Sela ma Seminggu Yang Lalu Menurut Kabupaten Dan Lapangan Pekerjaan Utama Di Sulawesi Barat 2009
Table Population 15 Years of Age and Over Who Worked during The Previous Week by RegencyAnd Main Industry in Sulawesi Barat, 2009
Kode Wilayah
Area Code
Kabupaten Regency
Pertanian Agriculture
Industri Manufacture
Jasa Services
Jumlah Total
(1)
(2)
(3)
(4)
(5)
(6)
01 Majene 23 601 8 296 29 622 61 519
02 Polewali Mandar 89 958 24 732 47 868 162 558
03 Mamasa 61 587 3 104 12 249 76 940
04 Mamuju 82 684 10 389 36 505 129 578
05. Mamuju Utara 42 527 3 818 11 140 57 485
Jumlah- Total 300 357 50 339 137 684 488 080
2008 305 968 41 821 125 520 473 309
2007 295 144 31 691 118 028 444 863
Sumber / Source : Hasil Survei Sosial Ekonomi Nasional (SUSENAS) 2 009 / Results of 2009 National Socio Economic Survey (SUSENAS) 2009
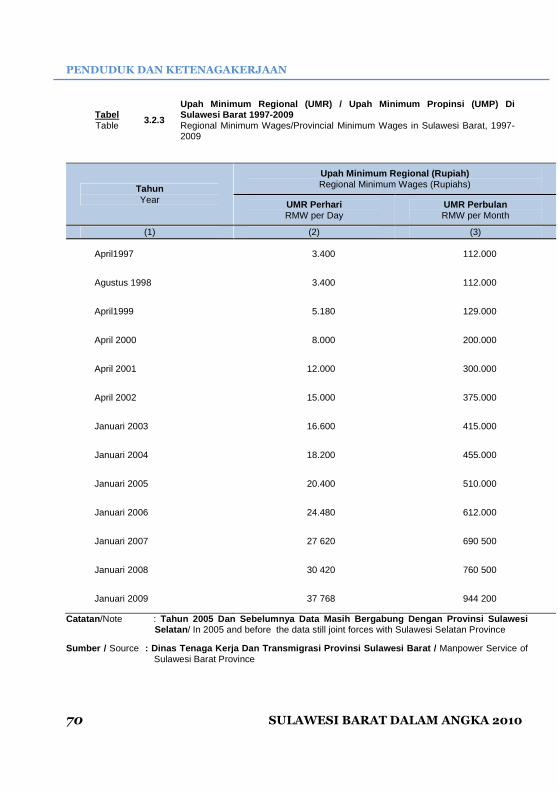
PENDUDUK DAN KETENAGAKERJAAN
70 SULAWESI BARAT DALAM ANGKA 2010
Tabel 3.2.3
Upah Minimum Regional (UMR) / Upah Minimum Propinsi (UMP) Di Sulawesi Barat 1997-2009
Table Regional Minimum Wages/Provincial Minimum Wages in Sulawesi Barat, 1997-2009
Tahun Year
Upah Minimum Regional (Rupiah) Regional Minimum Wages (Rupiahs)
UMR Perhari RMW per Day
UMR Perbulan RMW per Month
(1)
(2)
(3)
April1997 3.400 112.000
Agustus 1998 3.400 112.000
April1999 5.180 129.000
April 2000 8.000 200.000
April 2001 12.000 300.000
April 2002 15.000 375.000
Januari 2003 16.600 415.000
Januari 2004 18.200 455.000
Januari 2005 20.400 510.000
Januari 2006 24.480 612.000
Januari 2007 27 620 690 500
Januari 2008 30 420 760 500
Januari 2009 37 768 944 200
Catatan /Note : Tahun 2005 Dan Sebelumnya Data Masih Bergabung Deng an Provinsi Sulawesi Selatan / In 2005 and before the data still joint forces with Sulawesi Selatan Province
Sumber / Source : Dinas Tenaga Kerja Dan Transmigrasi Provinsi Sul awesi Barat / Manpower Service of Sulawesi Barat Province

POPULATION AND EMPLOYMENT
SULAWESI BARAT IN FIGURES 2010 71
Tabel 3.2.4 Jumlah Tenaga Kerja Yang Terdaftar Pada Departemen Tenaga Kerja Di Sulawesi Barat 2006-2009
Table Number of Worker Registry in Sulawesi Barat, 2006 - 2009
Tahun Year
Laki-Laki Male
Perempuan Female
Jumlah Total
(1)
(2)
(3)
(4)
2006 15 190 3 150 18 340
2007 16 999 3 464 20 463
2008 17 426 3 464 20 890
2009 16 750 4 936 21 694
Sumber/ Source : Dinas Tenaga Kerja Dan Transmigrasi Provinsi Sul awesi Barat / Manpower Service of Sulawesi Barat Province
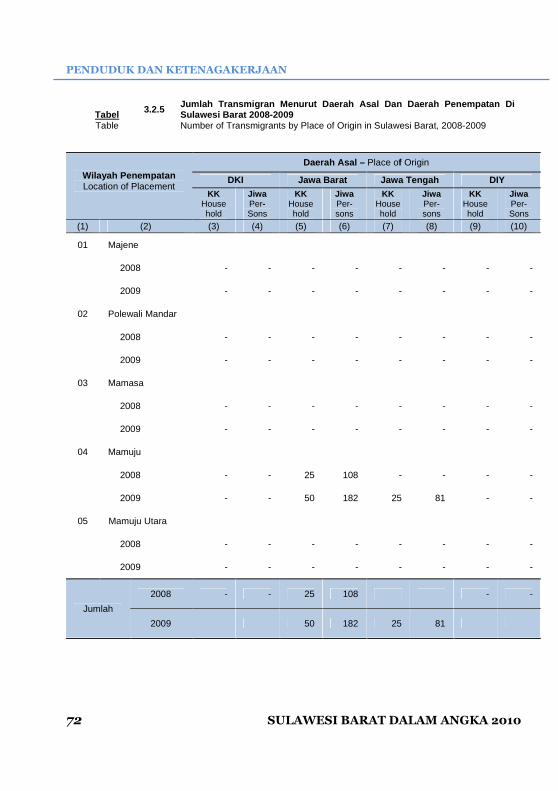
PENDUDUK DAN KETENAGAKERJAAN
72 SULAWESI BARAT DALAM ANGKA 2010
Tabel 3.2.5
Jumlah Transmigran Menurut Daerah Asal Dan Daerah P enempatan Di Sulawesi Barat 2008-2009
Table Number of Transmigrants by Place of Origin in Sulawesi Barat, 2008-2009
Wilayah Penempatan Location of Placement
Daerah Asal – Place of Origin
DKI Jawa Barat Jawa Tengah DIY KK
Household
Jiwa Per- Sons
KK Household
Jiwa Per- sons
KK Household
Jiwa Per- sons
KK Household
Jiwa Per- Sons
(1)
(2)
(3)
(4)
(5)
(6)
(7)
(8)
(9)
(10)
01 Majene
2008 - - - - - - - -
2009 - - - - - - - -
02 Polewali Mandar
2008 - - - - - - - -
2009 - - - - - - - -
03 Mamasa
2008 - - - - - - - -
2009 - - - - - - - -
04 Mamuju
2008 - - 25 108 - - - -
2009 - - 50 182 25 81 - -
05 Mamuju Utara
2008 - - - - - - - -
2009 - - - - - - - -
Jumlah
2008 - - 25 108 - -
2009 50 182 25 81

POPULATION AND EMPLOYMENT
SULAWESI BARAT IN FIGURES 2010 73
Lanjutan Tabel/ Table Continued : 3.2.5
Wilayah Penempatan Location of Placement
Daerah Asal - Place of Origin
Jawa Timur Bali NTB NTT
KK household
Jiwa Per- Sons
KK Household
JIWA per- sons
KK Household
Jiwa Per- sons
KK Household
Jiwa Per- Sons
(1)
(2)
(11)
(12)
(13)
(14)
(15)
(16)
(17)
(18)
01 Majene
2008 - - - - - - - -
2009 25 77 - - - - - -
02 Polewali Mandar
2008 - - - - - - - -
2009 - - - - - - - -
03 Mamasa
2008 - - - - - - - -
2009 - - - - - - - -
04 Mamuju
2008 25 88 - - 75 275 - -
2009 25 77 - - - - - -
05 Mamuju Utara
2008 - - - - - - - -
2009 - - - - - - - -
Jumlah
2008 25 88 - - 75 275 - -
2009 50 154 - - - - - -

PENDUDUK DAN KETENAGAKERJAAN
74 SULAWESI BARAT DALAM ANGKA 2010
Lanjutan Tabel/ Table Continued : 3.2.5
Wilayah Penempatan Location of Placement
Daerah Asal – Place of Origin
Maluku/ Ambon Dili/ Tim-tim Kaltim Sultra
KK Household
Jiwa Per- Sons
KK Household
Jiwa Per- sons
KK Household
Jiwa Per- sons
KK Household
Jiwa Per- Sons
(1)
(2)
(11)
(12)
(13)
(14)
(15)
(16)
(17)
(18)
01 Majene
2008 - - - - - - - -
2009 - - - - - - - -
02 Polewali Mandar
2008 - - - - - - - -
2009 - - - - - - - -
03 Mamasa
2008 - - - - - - - -
2009 - - - - - - - -
04 Mamuju
2008 - - - - - - - -
2009 - - - - - - - -
05 Mamuju Utara
2008 - - - - - - - -
2009 - - - - - - - -
Jumlah
2008 - - - - - - - -
2009 - - - - - - - -

POPULATION AND EMPLOYMENT
SULAWESI BARAT IN FIGURES 2010 75
Lanjutan Tabel/ Table Continued : 3.2.5
Wilayah Penempatan Location of Placement
Daerah Asal – Place of Origin
Luwu Sidrap Gowa Mamuju
KK Household
Jiwa Per- Sons
KK Household
Jiwa Per- sons
KK Household
Jiwa Per- sons
KK Household
Jiwa Per- Sons
(1)
(2)
(19)
(20)
(21)
(22)
(23)
(24)
(25)
(26)
01 Majene
2008 - - - - - - - -
2009 - - - - - - - -
02 Polewali Mandar
2008 - - - - - - - -
2009 - - - - - - - -
03 Mamasa
2008 - - - - - - - -
2009 - - - - - - - -
04 Mamuju
2008 - - - - - - 50 223
2009 - - - - - - 100 398
05 Mamuju Utara
2008 - - - - - - - -
2009 - - - - - - - -
Jumlah
2008 - - - - - - 50 223
2009 - - - - - - 100 398

PENDUDUK DAN KETENAGAKERJAAN
76 SULAWESI BARAT DALAM ANGKA 2010
Lanjutan Tabel/ Table Continued : 3.2.5
Wilayah Penempatan Location of Placement
Daerah Asal/ Place of Origin
Maros Makassar Jeneponto Poso/ Sul-Tengah
KK Household
Jiwa Per- Sons
KK Household
Jiwa Per- sons
KK Household
Jiwa Per- sons
KK Household
Jiwa Per- Sons
(1)
(2)
(27)
(28)
(29)
(30)
(31)
(32) (33) (34)
01 Majene
2008 - - - - - - - -
2009 - - - - - - - -
02 Polewali Mandar
2008 - - - - - - - -
2009 - - - - - - - -
03 Mamasa
2008 - - - - - - - -
2009 - - - - - - - -
04 Mamuju
2008 - - - - - - - -
2009 - - - - - - - -
05 Mamuju Utara
2008 - - - - - - - -
2009 - - - - - - - -
Jumlah
2008 - - - - - - - -
2009 - - - - - - - -

POPULATION AND EMPLOYMENT
SULAWESI BARAT IN FIGURES 2010 77
Lanjutan Tabel/ Table Continued : 3.2.5
Wilayah Penempatan Location of Placement
Daerah Asal – Place of Origin Jumlah/ Total
Lokal
KK Household
Jiwa Persons
KK Household
Jiwa Persons
(1)
(2)
(35)
(36)
(37)
(38)
01 Majene
2008 100 445 100 445
2009 - - - -
02 Polewali Mandar
2008 125 579 125 579
2009 - - - -
03 Mamasa
2008 - - - -
2009 150 699 150 699
04 Mamuju
2008 150 662 150 662
2009 100 398 100 398
05 Mamuju Utara
2008 - - - -
2009 - - - -
Jumlah 2008 375 1 686 375 1 686
2009 250 1 097 250 1 097
Sumber / Source : Dinas Tenaga Kerja Dan Transmigrasi Provinsi Sulawe si Barat / Transmigration and Forest Squatter Resettiement Service of Sulawesi Barat
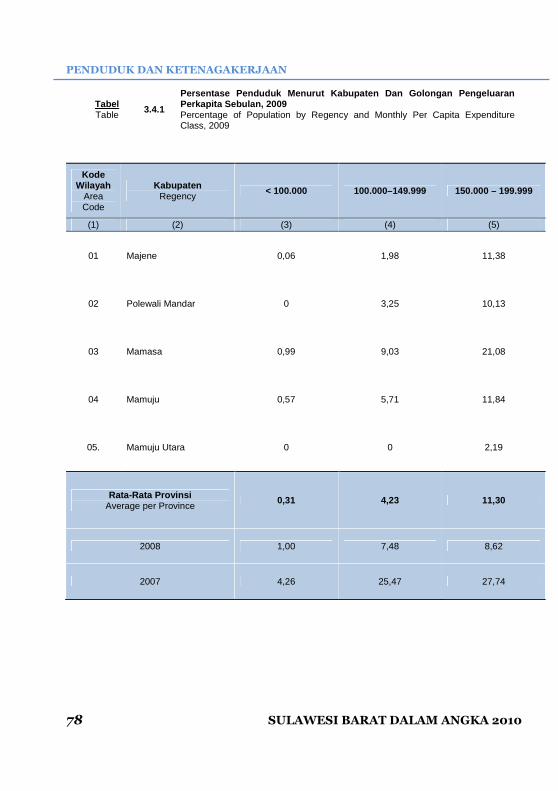
PENDUDUK DAN KETENAGAKERJAAN
78 SULAWESI BARAT DALAM ANGKA 2010
Tabel 3.4.1
Persentase Penduduk Menurut Kabupaten Dan Golongan Pengeluaran Perkapita Sebulan, 2009
Table Percentage of Population by Regency and Monthly Per Capita Expenditure Class, 2009
Kode Wilayah
Area Code
Kabupaten Regency < 100.000 100.000–149.999 150.000 – 199.999
(1)
(2)
(3)
(4)
(5)
01 Majene 0,06 1,98 11,38
02 Polewali Mandar 0 3,25 10,13
03 Mamasa 0,99 9,03 21,08
04 Mamuju 0,57 5,71 11,84
05. Mamuju Utara 0 0 2,19
Rata-Rata Provinsi Average per Province
0,31 4,23 11,30
2008 1,00 7,48 8,62
2007 4,26 25,47 27,74
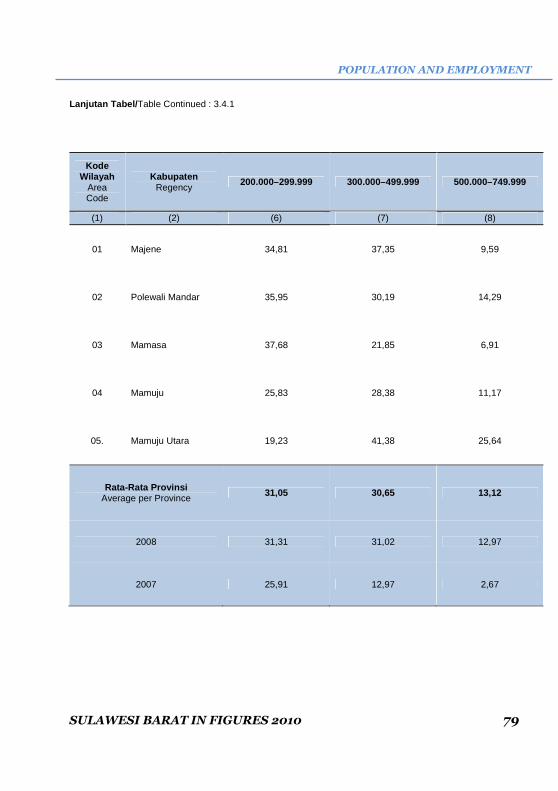
POPULATION AND EMPLOYMENT
SULAWESI BARAT IN FIGURES 2010 79
Lanjutan Tabel/ Table Continued : 3.4.1
Kode Wilayah
Area Code
Kabupaten Regency
200.000–299.999 300.000–499.999 500.000–749.999
(1)
(2)
(6)
(7) (8)
01 Majene 34,81 37,35 9,59
02 Polewali Mandar 35,95 30,19 14,29
03 Mamasa 37,68 21,85 6,91
04 Mamuju 25,83 28,38 11,17
05. Mamuju Utara 19,23 41,38 25,64
Rata-Rata Provinsi Average per Province
31,05 30,65 13,12
2008 31,31 31,02 12,97
2007 25,91 12,97 2,67
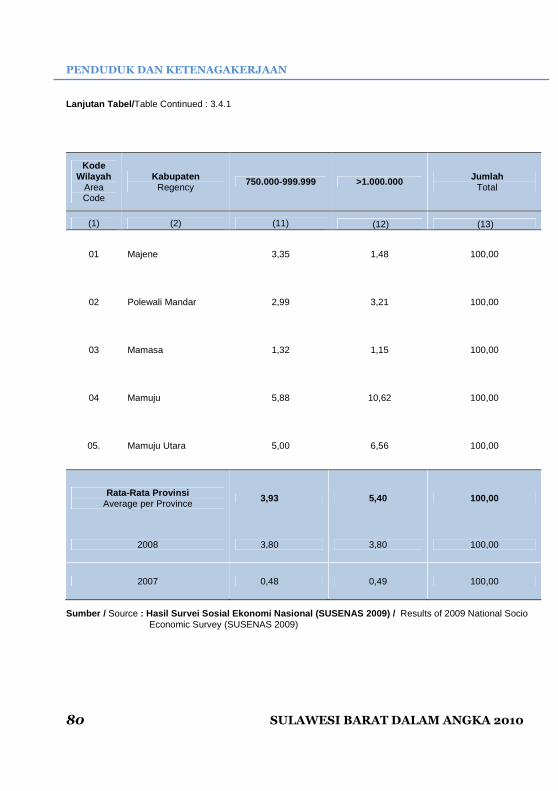
PENDUDUK DAN KETENAGAKERJAAN
80 SULAWESI BARAT DALAM ANGKA 2010
Lanjutan Tabel/ Table Continued : 3.4.1
Kode Wilayah
Area Code
Kabupaten Regency
750.000-999.999 >1.000.000 Jumlah Total
(1)
(2)
(11) (12) (13)
01 Majene 3,35 1,48 100,00
02 Polewali Mandar 2,99 3,21 100,00
03 Mamasa 1,32 1,15 100,00
04 Mamuju 5,88 10,62 100,00
05. Mamuju Utara 5,00 6,56 100,00
Rata-Rata Provinsi Average per Province
3,93 5,40 100,00
2008 3,80 3,80 100,00
2007 0,48 0,49 100,00
Sumber / Source : Hasil Survei Sosial Ekonomi Nasional (SUSENAS 20 09) / Results of 2009 National Socio Economic Survey (SUSENAS 2009)

POPULATION AND EMPLOYMENT
SULAWESI BARAT IN FIGURES 2010 81
Tabel Table 3.4.2
Persentase Pengeluaran Rata-Rata Per Kapita Sebulan Menurut Jenis Pengeluaran Dan Golongan Pengeluaran Per Kapita Seb ulan Di Sulawesi Barat 2009
Percentage Of Average Expenditure Per Month By Type Capita Expenses And Class Per Capita Expenditure Month In Sulawesi Barat, 2009
Jenis Pengeluaran < 100.000
100.000 – 149.999
150.000 – 199.000
200.000 – 299.000
300.000 – 499.999
(1)
(2)
(3)
(4)
(5)
(6)
Padi-padian 39,28 32,61 28,89 22,14 15,62
Umbi-umbian 1,95 1,11 0,99 0,82 0,71
Ikan 5,69 10,16 12,39 13,68 12,60
Daging 0,00 0,03 0,15 0,48 0,77
Telur dan Susu 0,67 1,25 1,40 1,87 3,04
Sayur-sayuran 6,54 5,66 4,50 4,62 3,98
Kacang-kacangan 0,67 0,45 0,51 0,77 0,91
Buah-buahan 1,13 1,52 1,11 1,42 1,59
Minyak dan lemak 4,73 3,30 3,37 3,05 2,70
Bahan Minuman 5,18 4,88 4,65 4,22 3,66
Bumbu-bumbuan 2,95 2,11 1,84 1,59 1,46
Konsumsi lainnya 1,49 1,08 1,43 1,88 2,22
Makanan dan Minuman
0,96 1,90 2,97 4,13 5,45
Minuman Alkohol 0,00 0,07 0,24 0,13 0,14
Tembakau dan Sirih 3,06 6,59 6,92 8,07 8,67
Total Makanan 74,13 72,72 71,34 68,87 63,51
Perumahan 14,43 11,99 13,30 15,31 17,86
Aneka Barang & Jasa 8,71 1,39 11,34 10,63 12,10
Pakaian & Alas Kaki 1,66 2,51 2,52 2,72 2,96
Barang Tahan Lama 0,25 0,82 0,83 1,30 2,08
Pajak & Asuransi 0,17 0,19 0,25 0,41 0,67 Transportasi dan Jasa Lain
0,47 0,37 0,43 0,77 0,81
Total Bukan Makanan 25,69 27,28 28,66 31,13 36,49
Rata-Rata Pengeluaran Sebulan 100,00 100,00 100,00 100,00 100,00

PENDUDUK DAN KETENAGAKERJAAN
82 SULAWESI BARAT DALAM ANGKA 2010
Lanjutan Tabel/ Table Continued 3.4.2 :
Jenis Pengeluaran Kind of Expenditure
500.000 – 749.000
750.000 – 999.999
> 1.000.000
(1)
(7)
(8)
(9)
Padi-padian 10,32 7,15 3,46
Umbi-umbian 0,54 0,40 0,14
Ikan 10,35 9,08 4,68
Daging 1,51 1,22 1,22
Telur dan Susu 3,61 3,10 2,70
Sayur-sayuran 3,24 2,54 1,39
Kacang-kacangan 1,09 0,94 0,55
Buah-buahan 1,62 1,73 2,00
Minyak dan lemak 2,11 1,56 1,02
Bahan Minuman 2,97 2,22 1,22
Bumbu-bumbuan 1,18 0,99 0,61
Konsumsi lainnya 2,28 1,82 1,23
Makanan dan Minuman 7,20 7,94 11,94
Minuman Alkohol 0,21 0,03 0,10
Tembakau dan Sirih 7,69 7,05 4,30
Total Makanan 55,91 47,77 36,57
Perumahan 20,29 23,78 26,38
Aneka Barang & Jasa 13,75 16,54 18,77
Pakaian & Alas Kaki 3,04 3,44 4,02
Barang Tahan Lama 4,14 5,28 11,20
Pajak & Asuransi 0,98 1,47 1,39
Keperluan Pesta 1,89 1,71 1,67
Total Bukan Makanan 44,09 52,23 63,43
Rata-Rata Pengeluaran Sebulan Average Expenditure a Month
100,00 100,00 100,00
Sumber / Source : Hasil Survei Sosial Ekonomi Nasional (SUSENAS 20 09) / Results of 2009 National Socio Economic Survey (SUSENAS 2009)

4 SOSIAL Social
SOCIAL
SULAWESI BARAT IN FIGURES 2010 85
4.1. Pendidikan
Pembangunan bidang pendidikan
bertujuan untuk mencerdaskan kehidupan
bangsa. Pembangunan Sumber Daya Manusia
(SDM) suatu negara akan menentukan
karakter dari pembangunan ekonomi dan
sosial, karena manusia adalah pelaku aktif dari
seluruh kegiatan tersebut.
Dari tahun ke tahun partisipasi seluruh
masyarakat dalam dunia pendidikan semakin
meningkat, hal ini berkaitan dengan berbagai
program pendidikan yang dicanangkan
pemerintah untuk lebih meningkatkan
kesempatan masyarakat untuk mengenyam
bangku pendidikan.
Peningkatan partisipasi pendidikan untuk
memperoleh bangku pendidikan tentunya
harus diikuti dengan berbagai peningkatan
penyediaan sarana fisik pendidikan dan
tenaga pendidik yang memadai.
Tabel 4.1.1-4.1.19 menyajikan data
jumlah sekolah dan guru serta jumlah murid
pada setiap jenjang pendidikan melalui jenjang
pendidikan dasar hingga tingkat menengah.
4.2. Kesehatan
Tabel 4.2.1 menyajikan data jumlah
rumah sakit yang berada di Propinsi Sulawesi
Barat.
Dalam pelaksanaan program
Keluarga Berencana (KB), jumlah akseptor
baru yang terjaring pada tahun 2009 sebanyak
28.133 orang.
4.1. Education
The aim of development in education is to
improve intellectual life of the nation. The
development of human resources determine
the character of economic and social
development, due to the fact that human is the
subject of development.
From year to year throughout the
community participation in education is
increasing, this is related to various education
programs launched by the government to
further improve people the chance to get an
education bench
Educational participation progress to
reach education, of course supported by the
availability of infrastructures and
educators/teachers.
Table 4.1.1 - 4.1.15 show the number of
school, teachers and pupils by level of
education, from elementary school to
secondary school
.
4.2. Health
Table 4.2.1 show the number of hospital
in Sulawesi Barat.
The Implementation of Family Planning
program capsured new acceptors about
28.133 persons in 2009.

SOSIAL
86 SULAWESI BARAT DALAM ANGKA 2010
4.3. Agama
Perkembangan pembangunan di bidang
spritual dapat dilihat dari besarnya sarana
peribadatan masing-masing agama. Tempat
peribadatan umat Islam yang berupa masjid,
pada tahun 2009 berjumlah 1 647 unit.
Tempat peribadatan untuk umat Kristiani,
Hindu dan Budha masing-masing memiliki 93
gereja Khatolik, 635 gereja Protestan, 597 Pura
dan 4 Wihara.
4.3 Religion
The Development of the spiritual sector
can be reflected by the number of worship
houses of each religions. For Moslems there
mosques, are 1 647 units in 2009.
In others, number of catholic churches are
93 units, protestant church are 635 units, Hindu
temples are 597 units and Buddhist temples are
4 units.

SOCIAL
SULAWESI BARAT IN FIGURES 2010 87
Grafik 4.1 Jumlah Sekolah Di Sulawesi Barat, 20 09 Figure Number of Schools in Sulawesi Barat, 2009

SOSIAL
88 SULAWESI BARAT DALAM ANGKA 2010
Grafik 4.2 Jumlah Guru Pada Setiap Jenjang Pen didikan di Sulawesi Barat, 2009 Figure Number of Teachers at Each Educationally in Sulawesi Barat, 2009

SOCIAL
SULAWESI BARAT IN FIGURES 2010 89
Grafik 4.3 Jumlah Jemaah Haji Menurut Kabupaten di Sulawesi Barat 2009 Figure Number of Pilgrims By Regency in Sulawesi Barat, 2009
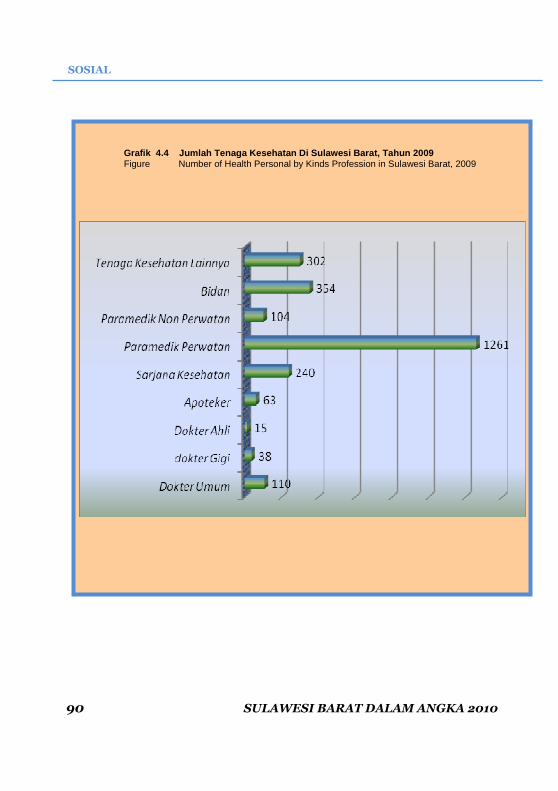
SOSIAL
90 SULAWESI BARAT DALAM ANGKA 2010
Grafik 4.4 Jumlah Tenaga Kesehatan Di Sulawesi Barat, Tahun 2009 Figure Number of Health Personal by Kinds Profession in Sulawesi Barat, 2009

SOCIAL
SULAWESI BARAT IN FIGURES 2010 91
Tabel 4.1.1
Banyaknya Sekolah, Guru, Dan Murid Sekolah Dasar (S D) Menurut Kabupaten Di Sulawesi Barat 2009
Table Number of Schools, Teachers, and Pupils of Primary Schools by Regency in Sulawesi Barat 2009
Kode Wilayah
Area Code
Kabupaten Regency
Sekolah Schools
Guru Teachers
Murid Pupils
(1) (2)
(3)
(4)
(5)
01 Majene 197 2 581 23 966
02 Polewali Mandar 384 3 436 66 974
03 Mamasa 234 1 552 32 854
04 Mamuju 476 6 288 62 993
05. Mamuju Utara 142 1 407 24 819
Jumlah - Total 1.433 15 264 211 606
2008 1 187 9 924 160 438
2007 1 138 8 493 170 242
2006 1 363 7 346 162 028
2005 1 335 6 878 158 273
Sumber/Source : Dinas Pendidikan Nasional Provinsi Sulawesi Barat / National Education Services
Sulawesi Barat Province Catatan / Note : Data Tahun 2005 & 2006 Dikutip dari Buku Daerah Dal am Angka se Provinsi
Sulawesi Barat / Cited From Each Regency Figure in Sulawesi Barat

SOSIAL
92 SULAWESI BARAT DALAM ANGKA 2010
Tabel 4.1.2
Banyaknya Sekolah Dasar Negeri dan Swasta Menurut Kabupaten Di Sulawesi Barat 2009
Table Number of Primary Schools ( Public and Private) by Regency in Sulawesi Barat, 2009
Kode Wilayah
Area Code
Kabupaten Regency
Negeri Public
Swasta Private
Jumlah Total
(1)
(2)
(3)
(4)
(5)
01 Majene 164 33 197
02 Polewali Mandar 314 70 384
03 Mamasa 217 17 234
04 Mamuju 447 29 476
05. Mamuju Utara 124 18 142
Jumlah - Total 1 266 167 1 433
2008 1 149 38 1 187
2007 1 121 17 1 138
2006 1 080 30 1 110
2005 1 061 28 1 089
Catatan / Note : Data Tahun 2005 & 2006 Dikutip dari Buku Daerah Dalam Angka se Provinsi Sulawesi Barat / Cited From Each Regency Figure in Sulawesi Barat
Sumber/Source : Dinas Pendidikan Nasional Provinsi Sulawesi Barat / National Education Services
Sulawesi Barat Province

SOCIAL
SULAWESI BARAT IN FIGURES 2010 93
4.1.3
Banyaknya Guru Sekolah Dasar Negeri dan Swasta Menu rut Kabupaten Di Sulawesi Barat 2009 Tabel
Table Number of Primary Schools Teachers (Public and Provate) by Regency in Sulawesi Barat, 2009
Kode Wilayah
Area Code
Kabupaten Regency
Negeri Public
Swasta Private
Jumlah Total
(1)
(2)
(3)
(4)
(5)
01 Majene … … 2 581
02 Polewali Mandar … … 3 436
03 Mamasa … … 1 552
04 Mamuju … … 6 288
05. Mamuju Utara … … 1 407
Jumlah – Total *) … … 15 264
2008 9 858 66 9 924
2007 7 873 620 8 493
2006 7 221 47 7 268
2005 6 494 379 6 873
Catatan / Note : Data Tahun 2005 & 2006 Dikutip dari Buku Daerah Dalam Angka se Provinsi Sulawesi Barat / Cited From Each Regency Figure in Sulawesi Barat
Sumber/Source : Dinas Pendidikan Nasional Provinsi Sulawesi Barat / National Education Services
Sulawesi Barat Province *) Data tidak dirinci

SOSIAL
94 SULAWESI BARAT DALAM ANGKA 2010
Tabel
4.1.4
Banyaknya Murid Sekolah Dasar (SD) Menurut Kabupate n Dan Jenis Kelamin Di Sulawesi Barat 2009 Table Number Of Primary Schools Pupils By Regency And Sex In Sulawesi Barat, 2009
Kode Wilayah
Area code
Kabupaten Regency
Laki-Laki Male
Perempuan Female
Jumlah Total
(1)
(2)
(3)
(4)
(5)
01 Majene 12 364 11 602 23 966
02 Polewali Mandar 34 336 32 638 66 974
03 Mamasa 17 074 15 780 32 854
04 Mamuju 32 757 30 236 62 993
05. Mamuju Utara 13 064 11 755 24 819
Jumlah - total 109 595 102 011 211 606
2008 83 077 77 361 160 438
2007 85 487 84 755 170 242
2006 108 511 1 81 110 630
2005 171 237 2 188 173 425
Catatan : Data Tahun 2005 & 2006 Dikutip dari Buku Daerah Dalam Angka se Provinsi Sulawesi Barat / Cited From Each Regency Figure in Sulawesi Barat
Sumber/ Source : Dinas Pendidikan Nasional Provinsi Sulawesi Bar at / National Education Services
Sulawesi Barat Province

SOCIAL
SULAWESI BARAT IN FIGURES 2010 95
Tabel
4.1.5
Banyaknya Lulusan Sekolah Dasar (SD) Menurut Kabup aten Di Sulawesi Barat 2009 Table Number of Pupils Graduated from Primary Schools by Regency in Sulawesi Barat, 2009
Kode Wilayah
Area Code
Kabupaten Regency
Negeri Public
Swasta Private
Jumlah
Total
(1)
(2)
(3)
(4)
(5)
01 Majene 3 044 … 3 044
02 Polewali Mandar 7 125 18 7 143
03 Mamasa 3 505 32 3 537
04 Mamuju 6 566 … 6 566
05. Mamuju Utara 2 511 87 2 596
Jumlah - Total 22 751 137 22 888
2008 - - -
2007 14 108 2 368 16 476
Sumber/ Source : Dinas Pendidikan Nasional Provinsi Sulawesi Bar at / National Education Services
Sulawesi Barat Province

SOSIAL
96 SULAWESI BARAT DALAM ANGKA 2010
Tabel
4.1.6
Banyaknya Pegawai Dan Jumlah Ruang Kelas Sekolah Da sar/Madrasah Ibtidaiyah (SD/MI) Negeri dan Swasta Di Sulawesi B arat 2009
Table
Number Of Employess and Total Primary School Roomin Prymary School and Islamic Elementary School (SD/MI) in Sulawesi Barat 2009
Nomor Uraian Negeri Public
Swasta Private
Jumlah
Total
(1)
(2)
(3)
(4)
(5)
I Jumlah Pegawai 1 136 24 1 160
a. Tenaga Admnistrasi 209 8 217
b. Penjaga Sekolah 844 16 860
c. Petugas Perpustakaan
83 0 83
II Jumlah Ruang Kelas 5 529 182 5 711
Ruang Kelas Milik 5 481 182 5 663
Menurut Kondisi
a. Baik 3 247 141 3 388
b. Rusak Ringan 1 114 30 1 144
c. Rusak Berat 1 120 11 1 131
Ruang Kelas Bukan Milik 48 0 48
Sumber/ Source : Dinas Pendidikan Nasional Provinsi Sulawesi Bar at / National Education Services Sulawesi Barat Province
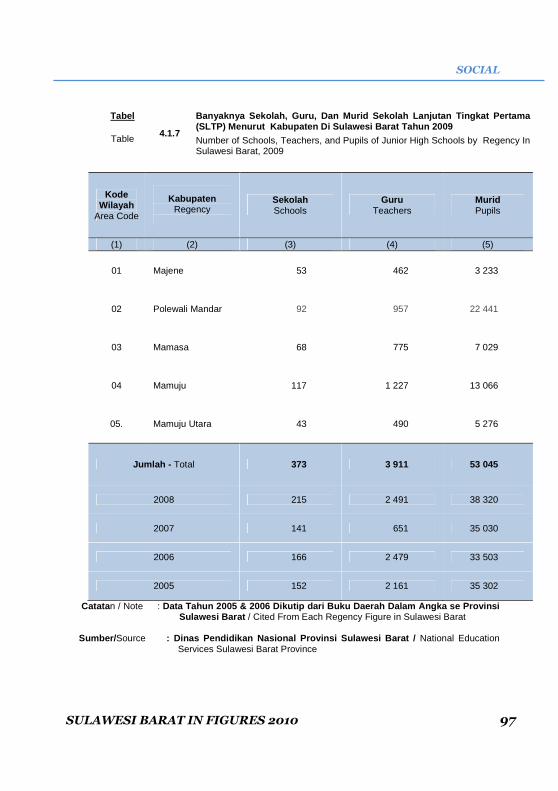
SOCIAL
SULAWESI BARAT IN FIGURES 2010 97
Tabel
4.1.7
Banyaknya Sekolah, Guru, Dan Murid Sekolah Lanjutan Tingkat Pertama (SLTP) Menurut Kabupaten Di Sulawesi Barat Tahun 2 009
Table Number of Schools, Teachers, and Pupils of Junior High Schools by Regency In Sulawesi Barat, 2009
Kode Wilayah
Area Code
Kabupaten Regency
Sekolah Schools
Guru Teachers
Murid Pupils
(1)
(2)
(3)
(4)
(5)
01 Majene 53 462 3 233
02 Polewali Mandar 92 957 22 441
03 Mamasa 68 775 7 029
04 Mamuju 117 1 227 13 066
05. Mamuju Utara 43 490 5 276
Jumlah - Total 373 3 911 53 045
2008 215 2 491 38 320
2007 141 651 35 030
2006 166 2 479 33 503
2005 152 2 161 35 302
Catatan / Note : Data Tahun 2005 & 2006 Dikutip dari Buku Daerah Dal am Angka se Provinsi Sulawesi Barat / Cited From Each Regency Figure in Sulawesi Barat
Sumber/ Source : Dinas Pendidikan Nasional Provinsi Sulawesi Barat / National Education
Services Sulawesi Barat Province

SOSIAL
98 SULAWESI BARAT DALAM ANGKA 2010
Tabel
4.1.8
Banyaknya Pegawai Dan Jumlah Ruang Kelas Sekolah Me nengah Pertama/Madrasah Tsanawiyah (SMP/MTs) Negeri dan Sw asta Di Sulawesi Barat 2009
Table
Number Of Employess and Total Junior High School Roomin Prymary School and Islamic Junior Highy School (SMP/MTs) in Sulawesi Barat 2009
Nomor Uraian Negeri Public
Swasta Private
Jumlah
Total
(1)
(2)
(3)
(4)
(5)
I Jumlah Pegawai 930 116 1 046
a. Tenaga Admnistrasi 148 36 184
b. Tenaga Teknis 782 80 862
c. Petugas Perpustakaan … … …
II Jumlah Ruang Kelas
Ruang Kelas Milik 1 152 262 1 414
Menurut Kondisi
a. Baik 845 195 1 040
b. Rusak Ringan 181 33 214
c. Rusak Berat 82 28 110
Ruang Kelas Bukan Milik 44 6 50
Sumber / Source : Dinas Pendidikan Nasional Provinsi Sulawesi B arat / National Education Services Sulawesi Barat Province
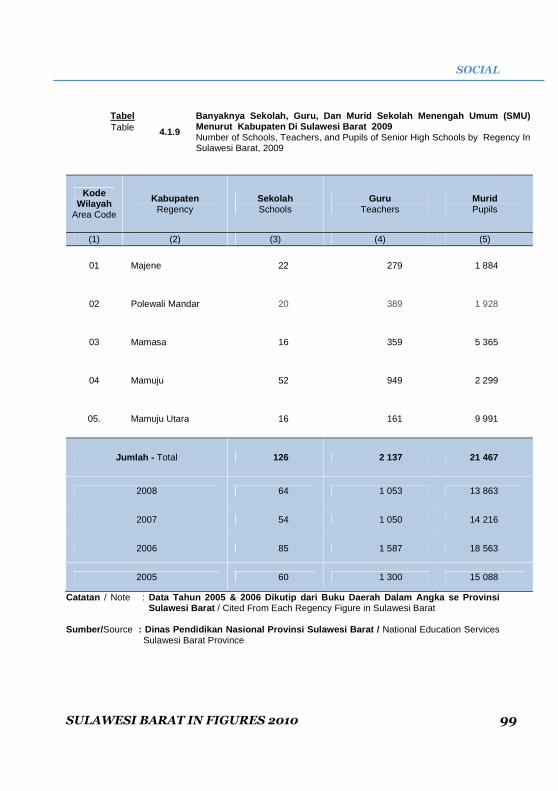
SOCIAL
SULAWESI BARAT IN FIGURES 2010 99
Tabel
4.1.9
Banyaknya Sekolah, Guru, Dan Murid Sekolah Menengah Umum (SMU) Menurut Kabupaten Di Sulawesi Barat 2009 Table Number of Schools, Teachers, and Pupils of Senior High Schools by Regency In Sulawesi Barat, 2009
Kode Wilayah
Area Code
Kabupaten Regency
Sekolah Schools
Guru Teachers
Murid Pupils
(1)
(2)
(3)
(4)
(5)
01 Majene 22 279 1 884
02 Polewali Mandar 20 389 1 928
03 Mamasa 16 359 5 365
04 Mamuju 52 949 2 299
05. Mamuju Utara 16 161 9 991
Jumlah - Total 126 2 137 21 467
2008 64 1 053 13 863
2007 54 1 050 14 216
2006 85 1 587 18 563
2005 60 1 300 15 088
Catatan / Note : Data Tahun 2005 & 2006 Dikutip dari Buku Daerah Dal am Angka se Provinsi Sulawesi Barat / Cited From Each Regency Figure in Sulawesi Barat
Sumber/ Source : Dinas Pendidikan Nasional Provinsi Sulawesi Bar at / National Education Services
Sulawesi Barat Province

SOSIAL
100 SULAWESI BARAT DALAM ANGKA 2010
Tabel
4.1.10
Banyaknya Pegawai Dan Jumlah Ruang Kelas Sekolah Me nengah Umum/Madrasah Aliyah(SMU/MA) Di Sulawesi Barat 200 9 Table Number Of Employess and Total Senior High School and Islamic Senior High School (SMU/MA) in Sulawesi Barat 2009
Nomor Uraian
Status Sekolah
Jumlah Total
Negeri Public
Swasta Private
(1)
(2)
(3)
(4)
(5)
I Jumlah Pegawai 192 42 234
a. Tenaga Admnistrasi 30 13 43
b. Tenaga Teknis 162 29 191
c. Petugas Perpustakaan … … …
II Jumlah Ruang Kelas
Ruang Kelas Milik 319 116 435
Menurut Kondisi
a. Baik 268 18 376
b. Rusak Ringan 25 6 31
c. Rusak Berat 26 2 28
Ruang Kelas Bukan Milik 58 1 59
Sumber/ Source : Dinas Pendidikan Nasional Provinsi Sulawesi Bar at / National Education Services Sulawesi Barat Province

SOCIAL
SULAWESI BARAT IN FIGURES 2010 101
Tabel Table
4.1.11
Banyaknya Sekolah, Guru, Dan Murid Sekolah Menengah Kejuruan (SMK) Menurut Kabupaten Di Sulawesi Barat 2009 Number of Schools, Teachers, and Pupils of Skilled High Schools by Regency In Sulawesi Barat, 2009
Kode Wilayah
Area Code
Kabupaten Regency
Sekolah Schools
Guru Teachers
Murid Pupils
(1)
(2)
(3)
(4)
(5)
01 Majene 7 211 749
02 Polewali Mandar 18 266 6 395
03 Mamasa 12 228 1 424
04 Mamuju 13 347 1 971
05. Mamuju Utara 4 41 336
Jumlah - Total 54 1 093 10 875
2008 49 684 6 100
2007 42 934 8 125
2006 32 870 7 997
2005 29 498 4 283
Catatan / Note : Data Tahun 2005 & 2006 Dikutip dari Buku Daerah Dal am Angka se Provinsi
Sulawesi Barat / Cited From Each Regency Figure in Sulawesi Barat
Sumber/ Source : Dinas Pendidikan Nasional Provinsi Sulawesi Bar at / National Education Services Sulawesi Barat Province

SOSIAL
102 SULAWESI BARAT DALAM ANGKA 2010
Tabel
4.1.12
Banyaknya Pegawai Dan Jumlah Ruang Kelas Sekolah Me nengah Kejuruan (SMK) Negeri dan Swasta Di Sulawesi Barat 2009 Table Number Of Employess and Total Classroom Vocationally High School in Sulawesi Barat 2009
Nomor Uraian Negeri Public
Swasta Private
Jumlah
Total
(1)
(2)
(3)
(4)
(5)
I Jumlah Pegawai 249 61 310
a. Tenaga Admnistrasi 21 20 41
b. Tenaga Teknis 228 41 269
c. Petugas Perpustakaan … … …
II Jumlah Ruang Kelas
Ruang Kelas Milik 186 99 285
Menurut Kondisi
a. Baik 166 88 254
b. Rusak Ringan 18 10 28
c. Rusak Berat 2 1 3
Ruang Kelas Bukan Milik 0 9 9
Sumber/ Source : Dinas Pendidikan Nasional Provinsi Sulawesi Bar at / National Education Services
Sulawesi Barat Province
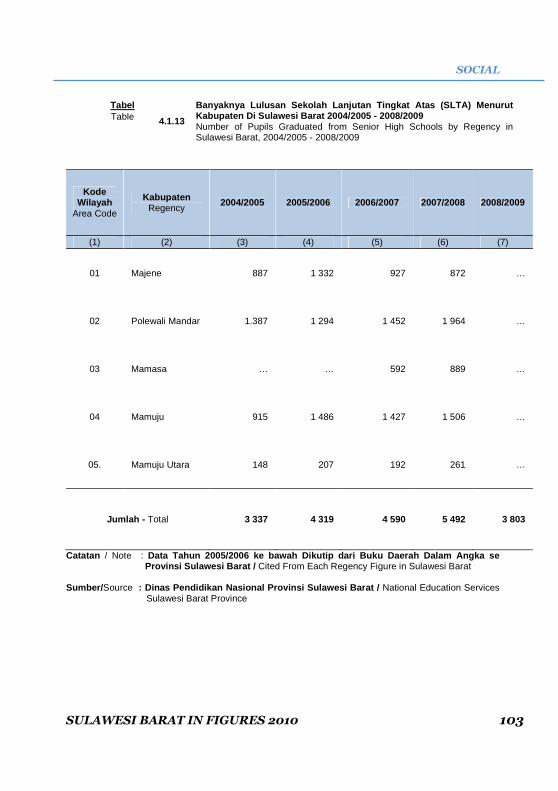
SOCIAL
SULAWESI BARAT IN FIGURES 2010 103
Tabel
4.1.13
Banyaknya Lulusan Sekolah Lanjutan Tingkat Atas (SL TA) Menurut Kabupaten Di Sulawesi Barat 2004/2005 - 2008/2009 Table Number of Pupils Graduated from Senior High Schools by Regency in Sulawesi Barat, 2004/2005 - 2008/2009
Kode Wilayah
Area Code
Kabupaten Regency
2004/2005 2005/2006 2006/2007 2007/2008 2008/2009
(1)
(2)
(3)
(4)
(5)
(6)
(7)
01 Majene 887 1 332 927 872 …
02 Polewali Mandar 1.387 1 294 1 452 1 964 …
03 Mamasa … … 592 889 …
04 Mamuju 915 1 486 1 427 1 506 …
05. Mamuju Utara 148 207 192 261 …
Jumlah - Total 3 337 4 319 4 590 5 492 3 803
Catatan / Note : Data Tahun 2005/2006 ke bawah Dikutip dari Buku Dae rah Dalam Angka se Provinsi Sulawesi Barat / Cited From Each Regency Figure in Sulawesi Barat
Sumber/ Source : Dinas Pendidikan Nasional Provinsi Sulawesi Bar at / National Education Services
Sulawesi Barat Province

SOSIAL
104 SULAWESI BARAT DALAM ANGKA 2010
Tabel Table
4.1.14
Banyaknya Sekolah, Guru, Murid Dan Lulusan Madrasah Ibtidaiyah Menurut Kabupaten Di Sulawesi Barat 2009 Number of Schools, Teachers, Pupils and Graduated of Madrasah Ibtidaiyah by Regency in Sulawesi Barat 2009
Kode Wilayah
Area Code
Kabupaten
Regency
Sekolah Schools
Guru Teachers
Murid Students
Lulusan*) Graduated
(1) (2)
(3)
(4)
(5)
(6)
01 Majene 18 330 1 607 172
02 Polewali Mandar 65 509 7 329 856
03 Mamasa 8 109 547 47
04 Mamuju 22 190 1 507 83
05. Mamuju Utara 11 74 752 50
Jumlah - Total 124 1 212 11 742 1 208
2008 116 401 10 181 …
2007 111 434 10 087 16 496
2006 103 811 9 273 981
*)Catatan / Note : Data Bersumber dari Dinas Pendidikan Provinsi Sulaw esi Barat / National Education Services Sulawesi Barat Province
Sumber / Source : Kanwil Kementerian Agama Provinsi Sulawesi Barat / Regional Office of the Ministry of Religious Affairs in Sulawesi Barat Province

SOCIAL
SULAWESI BARAT IN FIGURES 2010 105
Tabel Table
4.1.15
Banyaknya Sekolah, Guru, Murid Dan Lulusan Madrasah Tsanawiyah Menurut Kabupaten Di Sulawesi Barat 2009 Number of Schools, Teachers, Pupils and Graduated of Madrasah Tsanawiyah by Regency in Sulawesi Barat 2009
Kode Wilayah
Area Code
Kabupaten
Regency
Sekolah Schools
Guru Teachers
Murid Students
Lulusan*) Graduated
(1) (2)
(3)
(4)
(5)
(6)
01 Majene 21 96 1 402 313
02 Polewali Mandar 29 127 4 039 929
03 Mamasa 4 2 215 64
04 Mamuju 31 46 2 651 608
05. Mamuju Utara 16 7 831 185
Jumlah - Total 101 278 9 138 2 099
2008 83 105 7 875 1 881
2007 77 111 7 588 1 872
*)Catatan / Note : Data Bersumber dari Dinas Pendidikan Provinsi Sulaw esi Barat / National
Education Services Sulawesi Barat Province
Sumber / Source : Kanwil Kementerian Agama Provinsi Sulawesi Barat / Regional Office of the Ministry of Religious Affairs in Sulawesi Barat Province
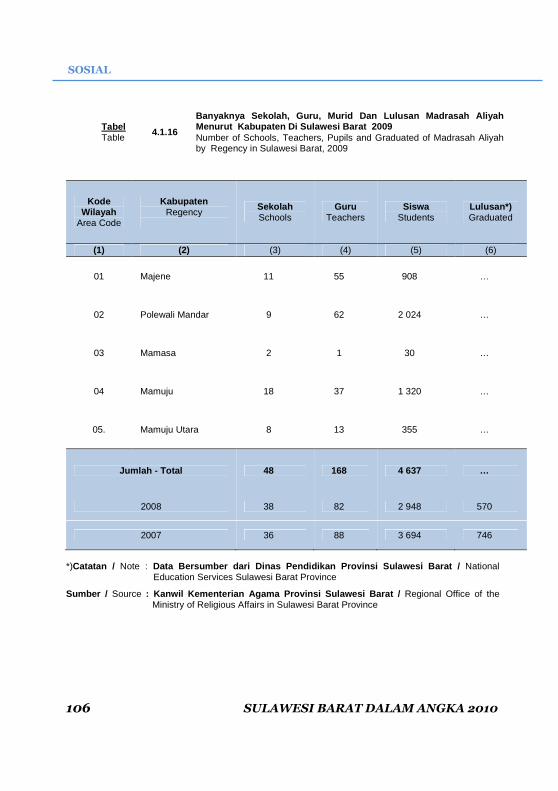
SOSIAL
106 SULAWESI BARAT DALAM ANGKA 2010
Tabel Table
4.1.16
Banyaknya Sekolah, Guru, Murid Dan Lulusan Madrasah Aliyah Menurut Kabupaten Di Sulawesi Barat 2009 Number of Schools, Teachers, Pupils and Graduated of Madrasah Aliyah by Regency in Sulawesi Barat, 2009
Kode Wilayah
Area Code
Kabupaten Regency
Sekolah Schools
Guru Teachers
Siswa Students
Lulusan*) Graduated
(1) (2)
(3)
(4)
(5)
(6)
01 Majene 11 55 908 …
02 Polewali Mandar 9 62 2 024 …
03 Mamasa 2 1 30 …
04 Mamuju 18 37 1 320 …
05. Mamuju Utara 8 13 355 …
Jumlah - Total 48 168 4 637 …
2008 38 82 2 948 570
2007 36 88 3 694 746
*)Catatan / Note : Data Bersumber dari Dinas Pendidikan Provinsi Sulaw esi Barat / National
Education Services Sulawesi Barat Province
Sumber / Source : Kanwil Kementerian Agama Provinsi Sulawesi Barat / Regional Office of the Ministry of Religious Affairs in Sulawesi Barat Province

SOCIAL
SULAWESI BARAT IN FIGURES 2010 107
Tabel Table
4.1.17
Banyaknya Sekolah, Guru, Murid Dan Lulusan TK Men urut Kabupaten Di Sulawesi Barat 2009 Number of Schools, Teachers, Pupils and Graduated of Nursery Schools by Regency in Sulawesi Barat 2009
Kode Wilayah
Area Code
Kabupaten Regency
Sekolah Schools
Guru Teachers
Murid Students
Lulusan Graduated
(1) (2)
(3)
(4)
(5)
(6)
01 Majene … 635 … …
02 Polewali Mandar … 389 … …
03 Mamasa 105 259 … …
04 Mamuju 84 695 … …
05. Mamuju Utara 20 121 … …
Jumlah - Total 209 2 099 … …
2008 … 819 … …
2007 365 863 27 590 7 177
Sumber/ Source : Dinas Pendidikan Nasional Provinsi Sulawesi Bar at / National Education Services
Sulawesi Barat Province

SOSIAL
108 SULAWESI BARAT DALAM ANGKA 2010
Tabel
4.1.18
Banyaknya Sekolah, Guru, Murid Dan Lulusan SLB Men urut Kabupaten Di Sulawesi Barat 2009 Table Number of Schools, Teachers, Pupils and Graduated of Extraordinary Schools by Regency in Sulawesi Barat 2008
Kode Wilayah
Area Code
Kabupaten Regency
Sekolah Schools
Guru Teachers
Murid Students
Lulusan Graduated
(1) (2)
(3)
(4)
(5)
(6)
01 Majene … 37 … …
02 Polewali Mandar … 28 … …
03 Mamasa … … … …
04 Mamuju … 45 … …
05. Mamuju Utara … 2 … …
Jumlah - Total … 112 … …
Sumber/ Source : Dinas Pendidikan Nasional Provinsi Sulawesi Bar at / National Education Services
Sulawesi Barat Province
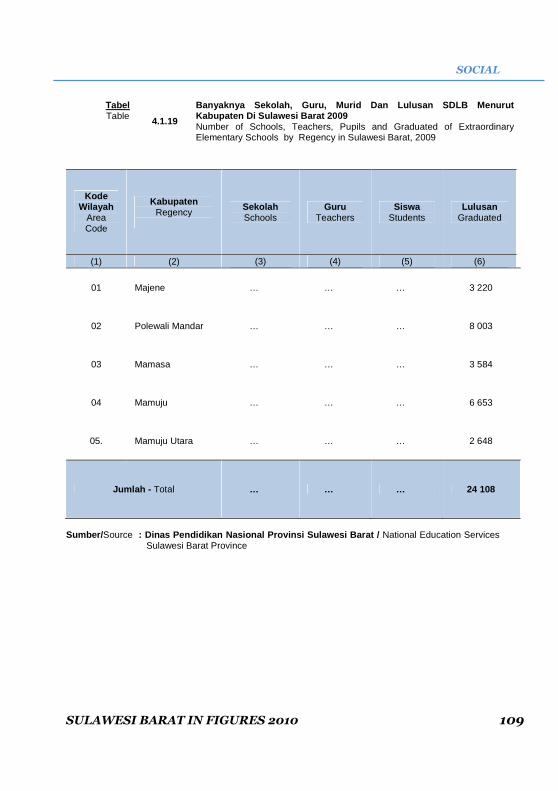
SOCIAL
SULAWESI BARAT IN FIGURES 2010 109
Tabel
4.1.19
Banyaknya Sekolah, Guru, Murid Dan Lulusan SDLB Men urut Kabupaten Di Sulawesi Barat 2009 Table Number of Schools, Teachers, Pupils and Graduated of Extraordinary Elementary Schools by Regency in Sulawesi Barat, 2009
Kode Wilayah
Area Code
Kabupaten Regency
Sekolah Schools
Guru Teachers
Siswa Students
Lulusan Graduated
(1) (2)
(3)
(4)
(5)
(6)
01 Majene … … … 3 220
02 Polewali Mandar … … … 8 003
03 Mamasa … … … 3 584
04 Mamuju … … … 6 653
05. Mamuju Utara … … … 2 648
Jumlah - Total … … … 24 108
Sumber/ Source : Dinas Pendidikan Nasional Provinsi Sulawesi Bar at / National Education Services
Sulawesi Barat Province
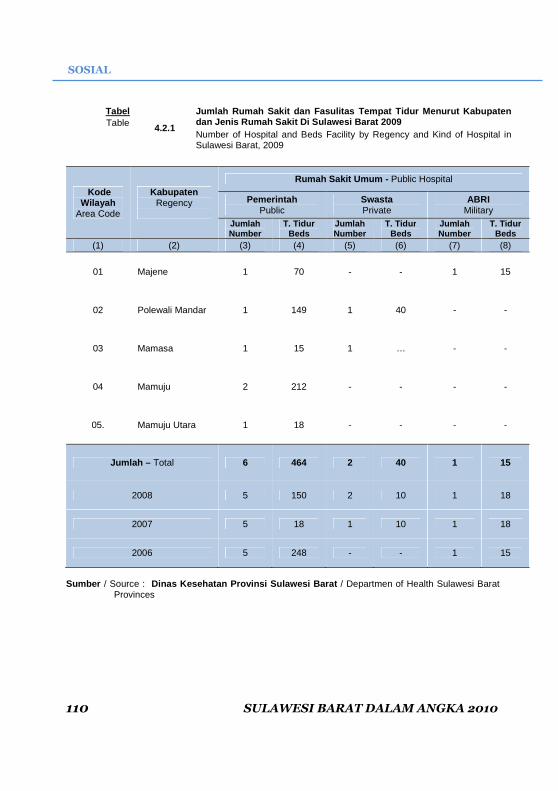
SOSIAL
110 SULAWESI BARAT DALAM ANGKA 2010
Tabel
4.2.1
Jumlah Rumah Sakit dan Fasulitas Tempat Tidur Menur ut Kabupaten dan Jenis Rumah Sakit Di Sulawesi Barat 2009 Table Number of Hospital and Beds Facility by Regency and Kind of Hospital in Sulawesi Barat, 2009
Kode Wilayah
Area Code
Kabupaten Regency
Rumah Sakit Umum - Public Hospital
Pemerintah Public
Swasta Private
ABRI Military
Jumlah Number
T. Tidur Beds
Jumlah Number
T. Tidur Beds
Jumlah Number
T. Tidur Beds
(1)
(2)
(3)
(4)
(5)
(6)
(7)
(8)
01 Majene 1 70 - - 1 15
02 Polewali Mandar 1 149 1 40 - -
03 Mamasa 1 15 1 … - -
04 Mamuju 2 212 - - - -
05. Mamuju Utara 1 18 - - - -
Jumlah – Total 6 464 2 40 1 15
2008 5 150 2 10 1 18
2007 5 18 1 10 1 18
2006 5 248 - - 1 15
Sumber / Source : Dinas Kesehatan Provinsi Sulawesi Barat / Departmen of Health Sulawesi Barat
Provinces

SOCIAL
SULAWESI BARAT IN FIGURES 2010 111
Lanjutan Tabel / Table Continued : 4.2.1
Kode Wilayah
Area Code
Kabupaten Regency
RSU Pusat Regional Hospital
Rumah Sakit Khusus - Special Hospital
Pemerintah Public
Swasta Private
Jumlah Number
T. Tidur Beds
Jumlah Number
T. Tidur Beds
Jumlah Number
T. Tidur Beds
(1)
(2)
(9)
(10)
(11)
(12)
(13)
(14)
01 Majene - - - - - -
02 Polewali Mandar - - - - - -
03 Mamasa - - - - - -
04 Mamuju - - - - - -
05. Mamuju Utara - - - - - -
Jumlah - Total - - - - - -
2008 - - - - - -
2007 - - - - - -
Sumber / Source : Dinas Kesehatan Provinsi Sulawesi Barat / Departmen of Health Sulawesi Barat
Provinces

SOSIAL
112 SULAWESI BARAT DALAM ANGKA 2010
Tabel
4.2.2
Banyaknya Puskesmas, Puskesmas Pembantu, Puskesmas Keliling, Dan Poskesdes Menurut Kabupaten Di Sulawesi Barat 2009 Table Number of Public Health Centers and Integrated Health Service Post by Regency in Sulawesi Barat, 2009
Kode Wilayah
Area Code
Kabupaten Regency
Puskesmas Public Health
Center
Puskesmas Pembantu
Public Health Sub Center
Puskesmas Keliling
Mobile Public Health Center
(Roda 4)
Poskesdes Health
Service Post
(1)
(2)
(3)
(4)
(5)
(6)
01 Majene 9 35 10 -
02 Polewali Mandar 23 56 18 -
03 Mamasa 19 71 - -
04 Mamuju 25 - 23 154
05. Mamuju Utara 11 40 10 -
Jumlah – Total 87 202 61 154
2008 75 282 … …
2007 73 273 … 1 814
2006 66 200 … 926
Catatan / Note :Tahun 2006 data dikutip dari buku Daerah Dalam Angk a se-Provinsi Sulawesi Barat / Cited from Each Regency in Figure in Sulawesi Barat
Sumber / Source : Dinas Kesehatan Provinsi Sulawesi Barat / Departmen of Health Sulawesi Barat Provinces
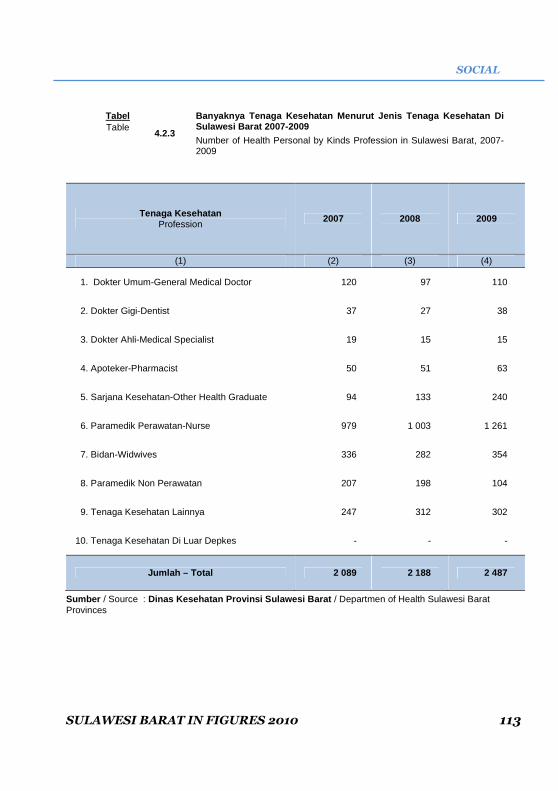
SOCIAL
SULAWESI BARAT IN FIGURES 2010 113
Tabel
4.2.3
Banyaknya Tenaga Kesehatan Menurut Jenis Tenaga Kes ehatan Di Sulawesi Barat 2007-2009 Table Number of Health Personal by Kinds Profession in Sulawesi Barat, 2007-2009
Tenaga Kesehatan Profession
2007 2008 2009
(1)
(2) (3) (4)
1. Dokter Umum-General Medical Doctor 120 97 110
2. Dokter Gigi-Dentist 37 27 38
3. Dokter Ahli-Medical Specialist 19 15 15
4. Apoteker-Pharmacist 50 51 63
5. Sarjana Kesehatan-Other Health Graduate 94 133 240
6. Paramedik Perawatan-Nurse 979 1 003 1 261
7. Bidan-Widwives 336 282 354
8. Paramedik Non Perawatan 207 198 104
9. Tenaga Kesehatan Lainnya 247 312 302
10. Tenaga Kesehatan Di Luar Depkes - - -
Jumlah – Total 2 089 2 188 2 487
Sumber / Source : Dinas Kesehatan Provinsi Sulawesi Barat / Departmen of Health Sulawesi Barat Provinces

SOSIAL
114 SULAWESI BARAT DALAM ANGKA 2010
Tabel
4.2.4
Banyaknya Penderita Yang Menjalani Rawat Inap, Rawa t Jalan dan Meninggal Akibat Penyakit Menular Menurut Jenis Pen yakit Di Sulawesi Barat 2009
Table
Number of Patients was Spent the night at Hospital and Death by Kind of Disease in Sulawesi Barat, 2009
Jenis Penyakit Disease
Rawat Inap (Jiwa)
Spent the night at Hospital
Rawat Jalan (Jiwa) Death
Meninggal (Jiwa)
(1)
(2)
(3)
(4)
01. Demam Berdarah-Fever … … …
02. Kolera-Cholera … … …
03. Diare-Diarrhea … … …
04. Typhus … … …
05. T B C … … …
06. Tetanus … … …
07. Kusta-Leprosy … … …
- PB … … …
- MB … … …
08. Malaria-Feverish … … …
09. Diphteria … … …
10. Penyakit Kelamin-Venereal … … …
- G O … … …
- SYPHILIS … … …
11. Gigitan Anjing Gila-Rabies … … …
Jumlah - Total … … …
2008 1 486 7 306 48
2007 1 441 7 305 48
2006 … 3 089 7
Sumber / Source : Dinas Kesehatan Provinsi Sulawesi Barat / Departmen of Health Sulawesi Barat Provinces

SOCIAL
SULAWESI BARAT IN FIGURES 2010 115
Tabel
4.2.5 Penyakit Menonjol Dirinci Menurut Kabupaten Di Prov insi Sulawesi Barat 2007 -2009 Table Top Disease by Regency in Sulawesi Barat Province, 2007-2009
Kode Wilayah
Area Code
Kabupaten Regency
2007 2008 2009
(1)
(2) (3) (4) (5)
01 Majene Diare DBD Malaria
02 Polewali Mandar Diare Diare Ispa
03 Mamasa Diare - Diare
04 Mamuju Malaria Malaria Malaria
05 Mamuju Utara Diare Rabies Diare
Sumber / Source : Dinas Kesehatan Provinsi Sulawesi Barat / Departmen of Health Sulawesi Barat Provinces

SOSIAL
116 SULAWESI BARAT DALAM ANGKA 2010
Tabel
4.2.6
Jumlah Sasaran Dan Realisasi Imunisasi BCG Dan Camp ak Menurut Kabupaten Di Sulawesi Barat 2009 Table Number of Target and Realization of BCG and Campak Immunization by Regency in Sulawesi Barat 2009
Kode Wilayah
Area Code
Kabupaten Regency
Jumlah Sasaran
Number of Target
BCG Campak
Realisasi Realization
% Realisasi
Realization %
(1)
(2)
(3)
(4)
(5)
(6)
(7)
01 Majene 3 678 3 545 96,38
3 436 93,42
02 Polewali Mandar 8 171 6 984 85,47
6 307 77,19
03 Mamasa 2 838 2 619 92,28
2 300 81,04
04 Mamuju 7 412 5 943 80,18
5 150 69,48
05 Mamuju Utara 2 882 2 536 88,00
2 388 82,86
Jumlah - Total 24 981 21 627 86,57
19 581 78,38
2008 26 003 22 144 85
20 169 77,6
2007 25 838 16 214 62,8
17 848 69,1
Sumber / Source : Dinas Kesehatan Provinsi Sulawesi Barat / Departmen of Health Sulawesi Barat Provinces

SOCIAL
SULAWESI BARAT IN FIGURES 2010 117
Tabel
4.2.7
Jumlah Sasaran Dan Realisasi Imunisasi Polio Menuru t Kabupaten Di Sulawesi Barat 2009 Table Number of Target and Realization of Polio Immunization by Regency in Sulawesi Barat, 2009
Kode Wilayah
Area Code
Kabupaten Regency
Jumlah Sasaran
Number of Target
Polio-1 Polio-2
Realisasi Realization % Realisasi
Realization %
(1)
(2)
(3)
(4)
(5)
(6)
(7)
01 Majene 3 678 3 546 96,41 3 529 95,95
02 Polewali Mandar 8 171 7 285 89,16 7 046 86,23
03 Mamasa 2 838 2 702 95,21 2 597 91,51
04 Mamuju 7 412 6 195 83,58 5 861 79,07
05. Mamuju Utara 2 882 2 632 91,33 2 643 91,71
Jumlah - Total 24 981 22 360 89,51 21 676 86,77
2008 26 003 23 439 90,1 22 397 86,1
2007 25 838 15 810 61,2 19 157 74,1
Sumber / Source : Dinas Kesehatan Provinsi Sulawesi Barat / Departmen of Health Sulawesi Barat Provinces

SOSIAL
118 SULAWESI BARAT DALAM ANGKA 2010
Lanjutan Tabel/ Table Continued : 4.2.7
Kode Wilayah
Area Code
Kabupaten Regency
Jumlah Sasaran
Number of Target
Polio-3 Polio-4
Realisasi Realization
% Realisasi Realization
%
(1)
(2)
(3)
(4)
(5)
(6)
(7)
01 Majene 3 678 3 559 96,76 3 474 94,45
02 Polewali Mandar 8 171 6 870 84,08 6 682 81,78
03 Mamasa 2 838 2 476 87,24 2 331 82,14
04 Mamuju 7 412 5 439 73,38 5 334 71,96
05. Mamuju Utara 2 882 2 393 83,03 2 335 81,71
Jumlah - Total 24 981 20 737 83,01 20 176 80,77
2008 26 003 21 247 81,7 20 373 78,3
2007 25 838 11 913 46,1 10 975 42,5
Sumber / Source : Dinas Kesehatan Provinsi Sulawesi Barat / Departmen of Health Sulawesi Barat Provinces

SOCIAL
SULAWESI BARAT IN FIGURES 2010 119
Tabel
4.3.1
Banyaknya Akseptor Baru Dan Akseptor Aktif Menurut Jenis Kontrasepsi Yang Dipakai Di Sulawesi Barat, 2009
Table
Number of New and Active Family Planning Acceptors by Method of Family Planning Currently Used in Sulawesi Barat,2009
Sumber / Source : Badan Koordinasi Keluarga Berencana Nasional Sul awesi Barat / National Family Planning Coordination Board of Sulawesi Barat
Kontrasepsi Method of Contraception
2007
2008
2009
Jumlah Number
% Jumlah
Number %
Jumlah Number
%
(1) (2) (3)
(4)
(5) (6) (7) I Akseptor Baru- New Acceptors 21 506 100,00 28 133 100,00 39 773 100,00
1. Pil-Pill 9 213 42,84 10 411 37,01 13.333 33,52
2 . IUD-Intra Uterine Device 240 1,12 259 0,92 435 1,09
3 . Suntikan-Injections 9 059 42,12 12 754 45,33 12.001 30,17
4 . Kondom/Lainnya- Condom/Others
1 231 5,72
2 270 8,07
10.879 27,35
5 . Implant 1 743 8,10 2 303 8,19 2.945 7,40
6 . MOP/MOW – Man/Women Sterilization
20 0,09 136 0,48 180 0,45
II Akseptor Aktif- Active Acceptors 94 994 100,00 109 567 100,00 117 311 100,00
1 . Pil-Pill 49 237 51,83 56 256 51,34 57.608 49,11
2 . IUD-Intra Uterine Device 3 968 4,18 3 666 3,35 3.580 3,05
3 . Suntikan-Injections 32 443 34,15 38 953 35,55 40.566 34,58
4 . Kondom/Lainnya- Condom/Others
1 424 1,50
3 067 2,80
6.093 5,19
5 . Implant 6 969 7,34 6 477 5,91 8.355 7,12
6 . MOP/MOW – Man/Women Sterilization
953 1,00
1 148 1,05
1.109 0,95
7. Obat Vaginal 0 0 0 0 0 0
Jumlah – Total 116 500 xx
137 700 xx
157 084 xx

SOSIAL
120 SULAWESI BARAT DALAM ANGKA 2010
Tabel
4.3.2
Banyaknya Akseptor Baru Dan Akseptor Aktif Menurut Kabupaten Di Sulawesi Barat 2009 Table Number of New and Active Family Planning Acceptors by Regency in Sulawesi Barat 2009
Kode Wilayah
Area Code
Kabupaten Regency
Akseptor Baru New Acceptors
Akseptor Aktif Active Acceptors
(1)
(2)
(3)
(5)
01 Majene 5.516 15.365
02 Polewali Mandar 13.419 32.370
03 Mamasa 2.240 17.066
04 Mamuju 12.690 36.413
05. Mamuju Utara 5.908 16.097
Jumlah - Total 39.773 117.311
2008 28 133 109 567
2007 21 506 94 994
2006 80 780 99 192
Sumber / Source : Badan Koordinasi Keluarga Berencana Nasional Sul awesi Barat / National Family Planning Coordination Board of Sulawesi Barat

SOCIAL
SULAWESI BARAT IN FIGURES 2010 121
Tabel
4.3.3 Banyaknya Klinik Keluarga Berencana Menurut Kabupat en Di Sulawesi Barat 2004-2009 Table Number of Family Planning Clinics by Regency in Sulawesi Barat, 2004 -2009
Kabupaten Regency
2004 2005 2006 2007 2008 2009
(1)
(2)
(3)
(4) (5)
(6)
(7)
01. Majene 22 8 8 8 10 11
02. Polewali Mandar 8 8 19 19 19 19
03. Mamasa 15 16 16 16 17 17
04. Mamuju 12 18 18 18 18 22
05. Mamuju Utara 3 3 9 9 9 12
Jumlah - Total 60 53 70 70 73 81
Sumber / Source : Badan Koordinasi Keluarga Berencana Nasional Sul awesi Barat / National Family Planning Coordination Board of Sulawesi Barat

SOSIAL
122 SULAWESI BARAT DALAM ANGKA 2010
Tabel
4.4.1
Banyaknya Penduduk Menurut Agama Dirinci Per Kabupa ten Di Provinsi Sulawesi Barat 2009 Table Number of Population by Religion per Regency in Sulawesi Barat Province 2009
Kode Wilayah
Area Code
Kabupaten Regency
Islam Moslem
Katholik Catholic
Protestan Protestant
Hindu Hindu
Budha Buddhist
Jumlah Total
(1) (2)
(3)
(4)
(5)
(6)
(7)
(8)
01 Majene 148 353 106 188 - - 148 647
02 Polewali Mandar 339 353 2 212 8 187 781 129 350 662
03 Mamasa 22 992 4 025 96 027 13 728 - 136 772
04 Mamuju 227 228 4 324 47 027 7 035 188 285 802
05. Mamuju Utara 89 560 3 453 10 640 6 180 4 109 837
Jumlah - Total 827 925 14 120 162 836 27 724 321 1 032 926
2008 947 281 13 664 137 769 33 946 418 1 133 078
2007 804 150 13 664 174 174 28 009 321 1 020 318
2006 804 150 13 664 135 420 28 009 321 981 564
Catatan / Note : Tahun 2006 data dikutip dari buku Daerah Dalam Ang ka Se-Provinsi Sulawesi Barat / Cited from Each Regency in Figure Sulawesi Barat
Sumber / Source : Kanwil Kementerian Agama Provinsi Sulawesi Barat / Regional of Religious Ministry Office at Sulawesi Barat Province

SOCIAL
SULAWESI BARAT IN FIGURES 2010 123
Tabel
4.4.2
Banyaknya Tempat Peribadatan Menurut Agama Dan Kabu paten Di Sulawesi Barat 2009 Table Number of Worship Facilities by Religion and Regency in Sulawesi Barat 2009
Kode Wilayah
Area Code
Kabupaten Regency
Islam Moslem
Masjid Mosque
Langgar Worship House
Mushola Small Mosque
Jumlah Total
(1)
(2)
(3)
(4)
(5)
(6)
01 Majene 266 - 17 283
02 Polewali Mandar 566 74 67 707
03 Mamasa 93 - 7 100
04 Mamuju 457 - 53 510
05. Mamuju Utara 265 74 20 355
Jumlah – Total 1 647 74 164 1 955
2008 1 626 57 218 1 901
2007 1 616 56 210 1 882
2006 1 588 60 209 1 857

SOSIAL
124 SULAWESI BARAT DALAM ANGKA 2010
Tabel Lanjutan/ Table Continued : 4.4.2
Kode Wilayah
Area Code
Kabupaten Regency
Gereja Katholik Catholic Church
Gereja Protestan Protestant
Church
Pura Hindu Hindu
Temple
Wihara Budha
Buddhist Temple
Jumlah Total
(1)
(2)
(7)
(8)
(9)
(10) (11)
01 Majene 1 1 - … 2
02 Polewali Mandar 12 25 - … 37
03 Mamasa 37 431 365 … 833
04 Mamuju 25 120 1 … 146
05. Mamuju Utara 18 58 231 … 307
Jumlah - Total 93 635 597 4 1 369
2008 124 754 70 4 2 855
2007 121 771 77 2 2 487
2006 43 722 52 2 2 685
Catatan / Note : Tahun 2006 data dikutip dari buku Daerah Dalam Ang ka Se-Provinsi Sulawesi
Barat / Cited from Each Regency in Figure Sulawesi Barat Sumber / Source : Kanwil Kementerian Agama Provinsi Sulawesi Barat / Regional of Religious
Ministry Office at Sulawesi Barat Province
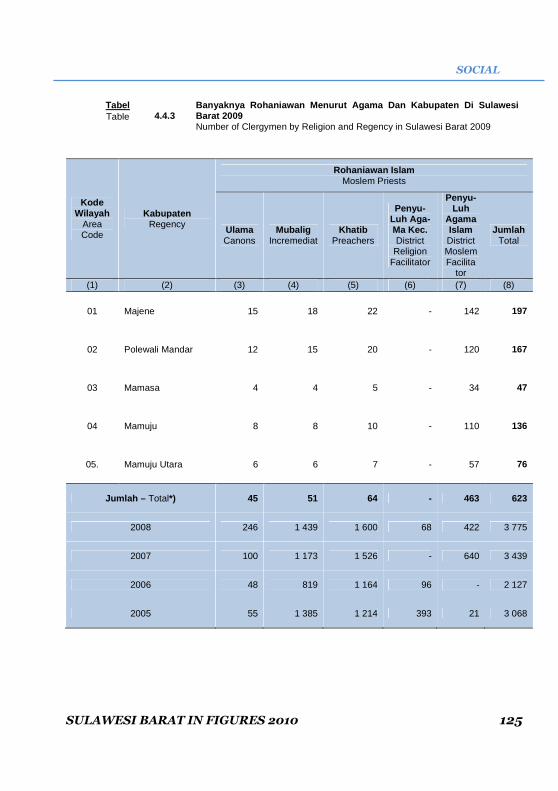
SOCIAL
SULAWESI BARAT IN FIGURES 2010 125
Tabel
4.4.3 Banyaknya Rohaniawan Menurut Agama Dan Kabupaten Di Sulawesi Barat 2009 Table Number of Clergymen by Religion and Regency in Sulawesi Barat 2009
Kode Wilayah
Area Code
Kabupaten Regency
Rohaniawan Islam Moslem Priests
Ulama Canons
Mubalig Incremediat
Khatib Preachers
Penyu-Luh Aga- Ma Kec. District Religion
Facilitator
Penyu-Luh
Agama Islam District Moslem Facilita
tor
Jumlah Total
(1)
(2)
(3)
(4)
(5)
(6)
(7)
(8)
01 Majene 15 18 22 - 142 197
02 Polewali Mandar 12 15 20 - 120 167
03 Mamasa 4 4 5 - 34 47
04 Mamuju 8 8 10 - 110 136
05. Mamuju Utara 6 6 7 - 57 76
Jumlah – Total*) 45 51 64 - 463 623
2008 246 1 439 1 600 68 422 3 775
2007 100 1 173 1 526 - 640 3 439
2006 48 819 1 164 96 - 2 127
2005 55 1 385 1 214 393 21 3 068
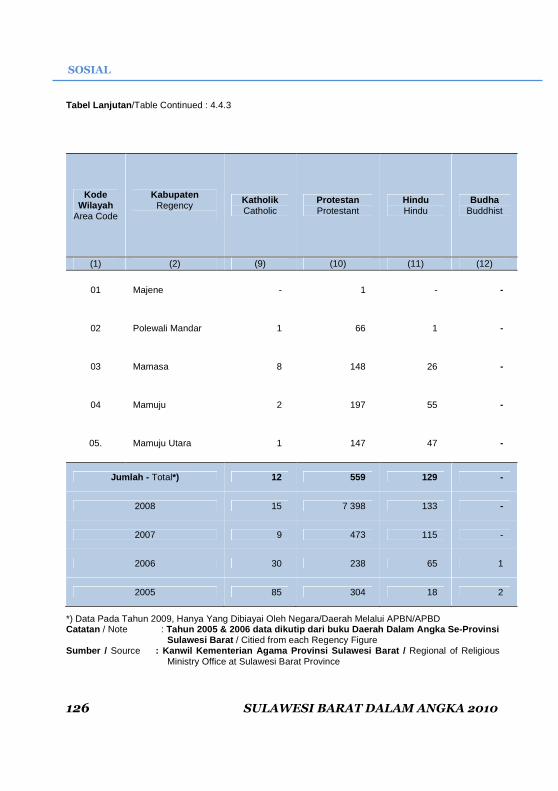
SOSIAL
126 SULAWESI BARAT DALAM ANGKA 2010
Tabel Lanjutan /Table Continued : 4.4.3
Kode Wilayah
Area Code
Kabupaten Regency
Katholik Catholic
Protestan Protestant
Hindu Hindu
Budha Buddhist
(1)
(2)
(9)
(10)
(11)
(12)
01 Majene - 1 - -
02 Polewali Mandar 1 66 1 -
03 Mamasa 8 148 26 -
04 Mamuju 2 197 55 -
05. Mamuju Utara 1 147 47 -
Jumlah - Total*) 12 559 129 -
2008 15 7 398 133 -
2007 9 473 115 -
2006 30 238 65 1
2005 85 304 18 2
*) Data Pada Tahun 2009, Hanya Yang Dibiayai Oleh Negara/Daerah Melalui APBN/APBD Catatan / Note : Tahun 2005 & 2006 data dikutip dari buku Daerah Dal am Angka Se-Provinsi
Sulawesi Barat / Citied from each Regency Figure Sumber / Source : Kanwil Kementerian Agama Provinsi Sulawesi Ba rat / Regional of Religious
Ministry Office at Sulawesi Barat Province

SOCIAL
SULAWESI BARAT IN FIGURES 2010 127
Tabel
4.4.4 Jumlah Jemaah Haji Menurut Kabupaten Dan Jenis Ke lamin Di Sulawesi Barat 2009 Table Number of Pilgrims by Regency and Sex in Sulawesi Barat 2009
Kode Wilayah
Area Code
Kabupaten Regency
Laki-Laki Male
Perempuan Female
Jumlah Total
(1)
(2)
(3)
(4) (5)
01 Majene 78 174 252
02 Polewali Mandar 144 358 502
03 Mamasa 36 76 112
04 Mamuju 156 290 446
05. Mamuju Utara 60 94 154
Jumlah - Total 474 972 1 466
2008 470 991 1 461
2007 478 1 068 1 546
Sumber / Source : Kanwil Kementerian Agama Provinsi Sulawesi Ba rat / Regional of Religious
Ministry Office at Sulawesi Barat Province

SOSIAL
128 SULAWESI BARAT DALAM ANGKA 2010
Tabel
4.4.5 Jumlah Jemaah Haji Menurut Kabupaten Dan Pendidik an Di Sulawesi Barat 2009 Table Number of Pilgrims by Regency and Education in Sulawesi Barat 2009
Kode Wilayah
Area Code
Kabupaten Regency
SD Primary School
SLTP Junior High
School
SLTA Senior High
School
PT/AK University
Jumlah Total
(1)
(2)
(3)
(4) (5)
(6) (7)
01 Majene 100 22 71 59 252
02 Polewali Mandar 224 68 117 93 502
03 Mamasa 19 12 59 22 112
04 Mamuju 199 71 102 74 446
05. Mamuju Utara 74 22 34 24 154
Jumlah - Total 396 195 383 272 1 466
2008 468 185 478 249 1 380
2007 615 187 416 216 1 434
Sumber / Source : Kanwil Kementerian Agama Provinsi Sulawesi Ba rat / Regional of Religious
Ministry Office at Sulawesi Barat Province

SOCIAL
SULAWESI BARAT IN FIGURES 2010 129
Tabel 4.4.6
Jumlah Jemaah Haji Menurut Profesi Dan Kabupaten Di Sulawesi Barat 2009 Table Number of Pilgrims by Profession and Regency in Sulawesi Barat 2009
Profesi Profession
Majene Polewali Mandar Mamasa Mamuju Mamuju
Utara Jumlah
Total
(1)
(2)
(3)
(4) (5)
(6) (7)
1. PNS/Civil Servant 66 78 12 77 15 248
2. TNI-Polri/Military-Police 3 3 1 3 1 11
3. Pedagang-Pengusaha/ Businessman
33 5 6 13 2 59
4. Petani-Nelayan/ Farmer-Fishermen
26 44 9 62 30 171
5. Pegawai Swasta/ Private Civil
30 122 24 70 16 262
6. Pelajar-Mahasiswa/Student 5 12 1 6 5 29
7. Ibu Rumahtangga/ Housewives
77 217 56 199 81 630
8. Pegawai BUMN 1 8 - 4 1 14
9. Lainnya/Others 11 13 3 12 3 42
Jumlah - Total 252 502 112 446 154 1 466
2008 209 493 126 413 142 1 383
2007 208 411 67 377 153 1 216
Sumber / Source : Kanwil Kementerian Agama Provinsi Sulawesi Ba rat / Regional of Religious
Ministry Office at Sulawesi Barat Province

SOSIAL
130 SULAWESI BARAT DALAM ANGKA 2010
Tabel
4.4.7
Jumlah Jemaah Haji Menurut Kabupaten Dan Bank Tem pat Penyetoran Biaya Perjalanan Ibadah Haji (BPIH) Di Sulawesi Barat 2009
Table
Total Pilgrims by Regency and Place Bank Deposit of Travel Expenses Pilgrimage (BPIH) in Sulawesi Barat, 2009
Kode Wilayah
Area Code
Kabupaten Regency
B R I BNI 46 BANK
SULSELBAR Jumlah Total
(1)
(2)
(3)
(4)
(5)
(6)
01 Majene 192 56 4 252
02 Polewali Mandar 318 147 37 502
03 Mamasa 59 2 51 112
04 Mamuju 353 60 33 446
05. Mamuju Utara 7 1 146 154
Jumlah - Total 929 266 271 1 466
Sumber / Source : Kanwil Kementerian Agama Provinsi Sulawesi Ba rat / Regional of Religious Ministry Office at Sulawesi Barat Province

SOCIAL
SULAWESI BARAT IN FIGURES 2010 131
Tabel 4.4.8
Jumlah Jemaah Haji Menurut Kabupaten Dan Kelompok Umur Di Sulawesi Barat Tahun 2009 Table Total Muslim Pilgrims by Regency and Age Groups Sulawesi Barat 2009
Kelompok Umur
Age Group Majene
Polewali Mandar Mamasa Mamuju
Mamuju Utara
Jumlah Total
(1)
(2)
(3)
(4)
(5)
(6)
(7)
11 - 20 2 8 - 7 4 21
21 – 30 11 35 10 47 15 118
31 – 40 51 108 25 119 53 356
41 – 50 68 162 37 126 40 433
51 – 60 65 98 26 86 24 299
61 – 70 42 72 9 49 17 189
71 – 80 13 15 4 10 1 43
81 – 90 - 4 1 2 - 7
>91 - - - - - -
Jumlah - Total 252 502 112 446 154 1 466
Sumber / Source : Kanwil Kementerian Agama Provinsi Sulawesi Ba rat / Regional of Religious Ministry Office at Sulawesi Barat Province

SOSIAL
132 SULAWESI BARAT DALAM ANGKA 2010
Tabel
4.4.9
Jumlah Jemaah Haji Yang Pernah dan Belum Pernah Ha ji Sebelumnya Menurut Kabupaten Dan Pernah Haji Di Sulawesi Bara t Tahun 2009 Table Total Muslim Pilgrims Ever and Never before by Regency in Sulawesi Barat 2009
Kode Wilayah
Area Code
Kabupaten Regency
Pernah Haji Ever
Belum Pernah Haji Never
Jumlah Total
(1)
(2)
(3)
(4) (5)
01 Majene 4 248 252
02 Polewali Mandar 5 497 502
03 Mamasa 2 110 112
04 Mamuju 1 445 446
05. Mamuju Utara 5 149 154
Jumlah - Total 17 1 449 1 466
Sumber / Source : Kanwil Kementerian Agama Provinsi Sulawesi Ba rat / Regional of Religious Ministry Office at Sulawesi Barat Province
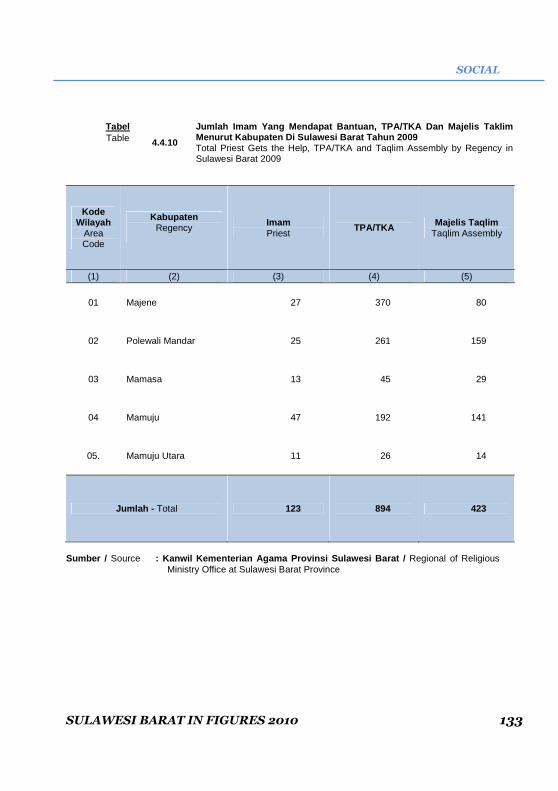
SOCIAL
SULAWESI BARAT IN FIGURES 2010 133
Tabel
4.4.10
Jumlah Imam Yang Mendapat Bantuan, TPA/TKA Dan Maje lis Taklim Menurut Kabupaten Di Sulawesi Barat Tahun 2009 Table Total Priest Gets the Help, TPA/TKA and Taqlim Assembly by Regency in Sulawesi Barat 2009
Kode Wilayah
Area Code
Kabupaten Regency
Imam Priest
TPA/TKA Majelis Taqlim Taqlim Assembly
(1)
(2)
(3)
(4) (5)
01 Majene 27 370 80
02 Polewali Mandar 25 261 159
03 Mamasa 13 45 29
04 Mamuju 47 192 141
05. Mamuju Utara 11 26 14
Jumlah - Total 123 894 423
Sumber / Source : Kanwil Kementerian Agama Provinsi Sulawesi Ba rat / Regional of Religious
Ministry Office at Sulawesi Barat Province
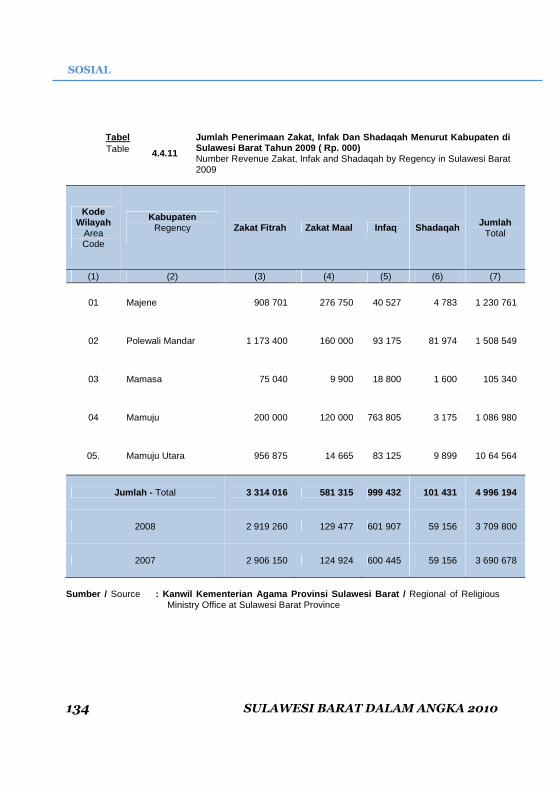
SOSIAL
134 SULAWESI BARAT DALAM ANGKA 2010
Tabel
4.4.11
Jumlah Penerimaan Zakat, Infak Dan Shadaqah Menurut Kabupaten di Sulawesi Barat Tahun 2009 ( Rp. 000) Table Number Revenue Zakat, Infak and Shadaqah by Regency in Sulawesi Barat 2009
Kode Wilayah
Area Code
Kabupaten Regency
Zakat Fitrah Zakat Maal Infaq Shadaqah Jumlah
Total
(1)
(2)
(3)
(4) (5)
(6) (7)
01 Majene 908 701 276 750 40 527 4 783 1 230 761
02 Polewali Mandar 1 173 400 160 000 93 175 81 974 1 508 549
03 Mamasa 75 040 9 900 18 800 1 600 105 340
04 Mamuju 200 000 120 000 763 805 3 175 1 086 980
05. Mamuju Utara 956 875 14 665 83 125 9 899 10 64 564
Jumlah - Total 3 314 016 581 315 999 432 101 431 4 996 194
2008 2 919 260 129 477 601 907 59 156 3 709 800
2007 2 906 150 124 924 600 445 59 156 3 690 678
Sumber / Source : Kanwil Kementerian Agama Provinsi Sulawesi Ba rat / Regional of Religious
Ministry Office at Sulawesi Barat Province

SOCIAL
SULAWESI BARAT IN FIGURES 2010 135
Tabel
4.4.12
Jumlah Penyaluran Zakat, Infak Dan Shadaqah Menurut Kabupaten Dan Bidang Penyaluran Di Sulawesi Barat Tahun 2009 ( Rp. 000)
Table
Number Distribution Zakat, Infaq and Shadaqah by Regency and Field Distribution in Sulawesi Barat 2009
Kode Wilayah
Area Code
Kabupaten Regency
Fakir Miskin Sarana
Pendidikan Sarana Ibadah
Modal Kerja
Sarana Umum
(1)
(2)
(3)
(4) (5)
(6) (7)
01 Majene 260 000 135 000 134 901 218 169 165 000
02 Polewali Mandar 272 367 177 420 263 770 272 367 265 000
03 Mamasa 19 500 11 363 10 363 17 272 13 817
04 Mamuju 485 000 11 750 53 700 11 000 39 750
05. Mamuju Utara 186 678 138 006 112 006 186 672 149 342
Jumlah - Total 1 223 545 473 539 574 740 705 480 632 909
2008 1 150 183 426 309 457 159 702 481 591 828
2007 1 150 183 426 309 457 159 702 592 591 828
Sumber / Source : Kanwil Kementerian Agama Provinsi Sulawesi Ba rat / Regional of Religious Ministry Office at Sulawesi Barat Province

SOSIAL
136 SULAWESI BARAT DALAM ANGKA 2010
Tabel 4.5.1
Jumlah Rumahtangga Menurut Status Penguasaan Bangun an Tempat Tinggal Di Sulawesi Barat, 2009 Table Number of Households by Livehouse Building Status in Sulawesi Barat 2009
Kode Wilayah Area Code
Kabupaten Regency
Milik Sendiri Kontrak Sewa Bebas
Sewa Dinas
Milik Orang Tua/
Saudara
Lain nya
Jumlah Total
(1)
(2)
(3) (4) (5)
(6)
(7)
(8) (9) (10)
01 Majene 23 403 325 267 417 175 2 328 91 27 006
02 Polewali Mandar 69 125 1 024 80 240 1 022 7 615 80 79 186
03 Mamasa 25 998 246 49 197 691 2 759 0 29 940
04 Mamuju 62 910 1 722 1 898 2 056 823 2 445 103 71 957
05. Mamuju Utara 22 064 82 703 1 152 824 1 489 83 26 397
Jumlah - Total 203 500 3 399 2 997 4 062 3 535 16 636 357 234 486
2008 200 968 4 186 2 528 4 389 7 164 12 007 496 231 738
2007 196 775 3 603 1 053 4 114 5 877 16 459 403 228 284
2006 197 979 3 382 974 3 335 5 510 11 696 407 223 283
Sumber / Source : Hasil Survei Sosial Ekonomi Nasional (Susenas) K eadaan Juli 2009 / Result of the July 2009 National Social Economic Survey

SOCIAL
SULAWESI BARAT IN FIGURES 2010 137
Tabel
4.5.2
Jumlah Rumahtangga Menurut Kabupaten Dan Jenis Sumb er Air Minum Di Sulawesi Barat, 2009 Table Number of Households by Regency and Source of Drinking in Sulawesi Barat, 2009
Kode Wilayah
Area Code
Kabupaten Regency
Air Dalam Kema-
San
Leding Pipe
Pompa Air
Pump
Sumur Ter-
Lindung Covered
Well
Sumur Tak Ter-Lindung
Uncovered well
Mata Air Ter-
Lindung Covered Spring
(1)
(2)
(3)
(4)
(5)
(6)
(7)
(8)
01 Majene 1 228 9 418 1 788 8 286 1 231 4 234
02 Polewali Mandar 1 949 20 412 9 872 21 564 4 001 9 253
03 Mamasa 49 1 625 0 99 1 084 2 463
04 Mamuju 7 649 6 180 5 956 21 282 13 247 5 136
05. Mamuju Utara 1 361 41 3 714 11 791 5 735 945
Jumlah - Total 12 236 37 676 21 324 63 002 25 298 22 031
2008 8 709 37 371 23 072 66 836 27 221 19 750
2007 2 119 23 409 16 644 77 196 35 162 27 439
2006 1 814 28 570 8 795 70 302 34 359 24 254
Sumber / Source : Hasil Survei Sosial Ekonomi Nasional (Susenas) K eadaan Juli 2009 / Result of the July 2009 National Social Economic Survey

SOSIAL
138 SULAWESI BARAT DALAM ANGKA 2010
Lanjutan Tabel/ Table Continued : 4.5.2
Kode Wilayah
Area Code
Kabupaten Regency
Mata Air Tak Ter-Lindung
Covered Spring
Sungai Rivers
Air hujan Rain water
Lainnya Others
Jumlah Total
(1)
(2)
(8)
(9)
(10)
(11)
(12)
01 Majene 420 401 0 0 27 006
02 Polewali Mandar 3 927 7 968 240 0 79 186
03 Mamasa 22 746 1 874 0 0 29 940
04 Mamuju 7 899 4 099 412 103 71 957
05. Mamuju Utara 165 2 481 164 0 26 397
Jumlah – Total 35 157 16 823 816 103 234 486
2008 33 296 12 721 2 456 306 231 738
2007 25 365 19 918 545 487 228 284
2006 29 850 20 753 3 237 1 349 223 283
Sumber / Source : Hasil Survei Sosial Ekonomi Nasional (Susenas) K eadaan Juli 2009 / Result of the July 2009 National Social Economic Survey

SOCIAL
SULAWESI BARAT IN FIGURES 2010 139
Tabel
4.5.3
Jumlah Rumahtangga Menurut Kabupaten Dan Sumber Pen erangan Utama, 2009 Table Number of Households by Regency and Source Of Light in Sulawesi Barat 2009
Kode Wilayah Area Code
Kabupaten Regency
List
rik P
LN
List
rik N
on P
LN
Pet
rom
aks
/ Ala
din
Pel
ita /
Sen
ter /
Obo
r
LAIN
NY
A
JUMLAH Total
(1)
(2)
(3) (4) (5)
(6) (9) (10)
01 Majene 23 624 2 654 33 511 184 27 006
02 Polewali Mandar 66 344 6 970 558 5 154 160 79 186
03 Mamasa 5 267 14 187 641 9 501 344 29 940
04 Mamuju 35 186 17 879 103 18 275 514 71 975
05 Mamuju Utara 4 083 15 875 247 6 151 41 26 397
Jumlah - Total 134 504 57 565 1 582 39 592 1 243 234 486
2008 127 788 52 018 3 084 48 026 822 231 735
2007 106 419 50 955 8 785 60 281 1 844 228 284
2006 96 606 47 819 10 159 67 750 949 223 283
Sumber / Source : Hasil Survei Sosial Ekonomi Nasional (Susenas) K eadaan Juli 2009 / Result of the July 2009 National Social Economic Survey
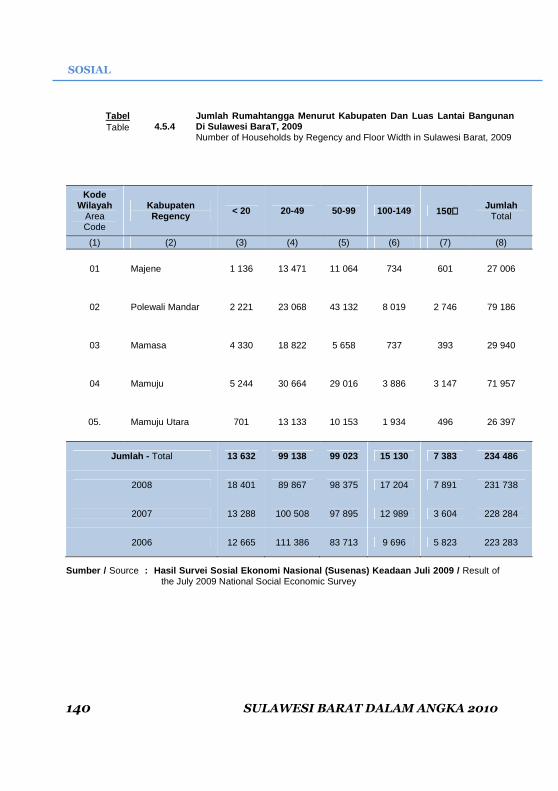
SOSIAL
140 SULAWESI BARAT DALAM ANGKA 2010
Tabel 4.5.4
Jumlah Rumahtangga Menurut Kabupaten Dan Luas Lanta i Bangunan Di Sulawesi BaraT, 2009 Table Number of Households by Regency and Floor Width in Sulawesi Barat, 2009
Kode Wilayah
Area Code
Kabupaten Regency < 20 20-49 50-99 100-149 150++++
Jumlah Total
(1)
(2)
(3)
(4)
(5)
(6)
(7)
(8)
01 Majene 1 136 13 471 11 064 734 601 27 006
02 Polewali Mandar 2 221 23 068 43 132 8 019 2 746 79 186
03 Mamasa 4 330 18 822 5 658 737 393 29 940
04 Mamuju 5 244 30 664 29 016 3 886 3 147 71 957
05. Mamuju Utara 701 13 133 10 153 1 934 496 26 397
Jumlah - Total 13 632 99 138 99 023 15 130 7 383 234 486
2008 18 401 89 867 98 375 17 204 7 891 231 738
2007 13 288 100 508 97 895 12 989 3 604 228 284
2006 12 665 111 386 83 713 9 696 5 823 223 283
Sumber / Source : Hasil Survei Sosial Ekonomi Nasional (Susenas) K eadaan Juli 2009 / Result of the July 2009 National Social Economic Survey

SOCIAL
SULAWESI BARAT IN FIGURES 2010 141
Tabel 4.5.5
Jumlah Rumahtangga Menurut Kabupaten Dan Jenis Atap Rumah Terluas Yang Digunakan, 2009 Table Number Of Household By Regency And Types Used Widest, 2009
Kode Wilayah Area Code
Kabupaten Regency
Bet
on
Gen
teng
Sira
p
Sen
g
Asb
es
Ijuk/
Rum
biA
Lain
nya
Jumlah Total
(1)
(2)
(3) (4) (5)
(6)
(7)
(8) (9) (10)
01 Majene 108 542 192 16 653 466 8 678 367 27 006
02 Polewali Mandar 592 706 158 58 553 511 17 666 0 79 186
03 Mamasa 98 148 786 21 871 49 5 166 1 822 29 940
04 Mamuju 308 1 949 1 233 45 934 3 248 18 940 309 71 957
05. Mamuju Utara 165 328 82 19 922 165 5 735 0 26 397
Jumlah - Total 1 271 4 673 2 451 162 933 4 475 56 185 2 498 234486
2008 1 104 7 493 1 567 154 113 3 442 61 280 2 739 231 738
2007 626 6 281 3 086 145 438 4 832 63 022 4 999 228 284
Sumber / Source : Hasil Survei Sosial Ekonomi Nasional (Susenas) K eadaan Juli 2009 / Result of the July 2009 National Social Economic Survey

SOSIAL
142 SULAWESI BARAT DALAM ANGKA 2010
Tabel
4.5.6
Banyaknya Lembaga Pemasyarakatan/Rumah Tahanan Nega ra, Jumlah Narapidana Dan Tahanan Menurut Kabupaten Di Sulawes i Barat 2009 Table
Number of State Prison, Detention and House Their Capacities in Sulawesi Barat, 2009
Kode Wilayah
Area Code
Kabupaten Regency
Jumlah L P
Number of Prison
Rutan Negara Detention Jumlah
Napi Number of Prisoners
Jumlah Tahanan Number of Arrestee
Jumlah Total
(6)+(7) Jumlah Number
Kapasitas Capacity
(1)
(2)
(3)
(4)
(5)
(6)
(7)
(8)
01 Majene - 1 75 537 472 1 009
02 Polewali Mandar 2 - 160 139 1 140
03 Mamasa - 1 70 70 48 118
04 Mamuju - 1 90 749 1 057 1 806
05. Mamuju Utara - - - - - -
Jumlah – Total 2 3 395 1 495 1 578 3 073
2008 2 2 395 2 545 2 416 4 961
2007 1 1 - 167 59 226
Catatan : Di Kabupaten Polewali Mandar Terdapat 1 Unit Bapas yang Menampung Napi dan Tahanan Yang Bersifat Bimbingan Klien Dewasa dan Anak
Di Kabupaten Mamasa Masih Berstatus Cabang Rutan Sumber / Source : Buku Daerah Dalam Angka Se Propinsi Sulawesi Barat / Cited from each
Regency in Figures in Sulawesi Barat Province
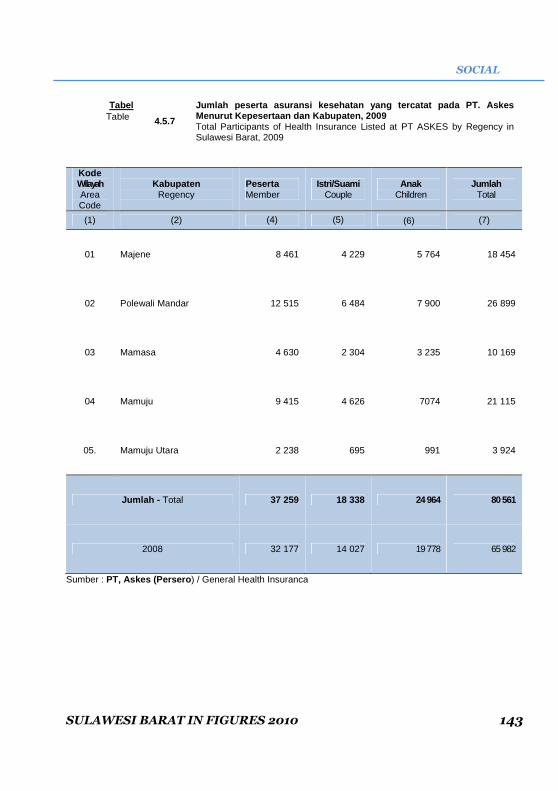
SOCIAL
SULAWESI BARAT IN FIGURES 2010 143
Tabel
4.5.7
Jumlah peserta asuransi kesehatan yang tercatat pad a PT. Askes Menurut Kepesertaan dan Kabupaten, 2009 Table Total Participants of Health Insurance Listed at PT ASKES by Regency in Sulawesi Barat, 2009
Kode Wilayah Area Code
Kabupaten
Regency
Peserta Member
Istri/Suami Couple
Anak Children
Jumlah Total
(1)
(2) (4) (5)
(6)
(7)
01 Majene 8 461 4 229 5 764 18 454
02 Polewali Mandar 12 515 6 484 7 900 26 899
03 Mamasa 4 630 2 304 3 235 10 169
04 Mamuju 9 415 4 626 7074 21 115
05. Mamuju Utara 2 238 695 991 3 924
Jumlah - Total 37 259 18 338 24 964 80 561
2008 32 177 14 027 19 778 65 982
Sumber : PT, Askes (Persero ) / General Health Insuranca

SOSIAL
144 SULAWESI BARAT DALAM ANGKA 2010
Tabel
4.5.8
Jumlah Peserta Asuransi Kesehatan Yang Tercatat Pad a PT. Askes Yang Melakukan Kunjungan Berobat Ke Rumah Sakit Dae rah Menurut Kabupaten , 2009 Table Total Participants of Health Insurance Listed at PT ASKES by Regency in Sulawesi Barat, 2009
Bulan Majene Polewali Mandar Mamasa Mamuju Mamuju Utara Jumlah
(2) (4) (5)
(6)
(7)
Januari – January 363 1 382 6 225 - 1 976
Februari - February
359 1 433 2 228 - 2 022
Maret – Maret 388 1 516 6 272 - 2 182
April – April 397 1 401 9 210 - 2 017
Mei – May 398 1 411 8 257 - 2 074
Juni – June 409 1 578 9 257 26 2 279
Juli – July 412 1 361 11 291 52 2 127
Agustus – August 409 1 394 11 269 62 2 135
September – September
329 1 082 15 214 53 1 693
Oktober – October 427 1 308 11 280 70 2 076
November – Novemver
339 1 017 6 168 53 1 583
Desember - December
360 1 254 7 188 40 1 849
Jumlah - Total 4 320 16 137 94 2 671 356 23 578
Catatan : Periode Januari – Mei Belum ada Pe;ayanan di Mamuju Utara
Sumber / Source : PT, Askes (Persero) / General Helath Insurance

SOCIAL
SULAWESI BARAT IN FIGURES 2010 145
Tabel
4.5.9
Jumlah Peserta Jamkesmas Yang Tercatat Pada PT. Ask es Yang Melakukan Kunjungan Ke Rumah Sakit Daerah Menurut K abupaten, 2009
Table
Total Participants of Health Insurance Listed at PT ASKES by Regency in Sulawesi Barat, 2009
Bulan
Kabupaten
Majene Polewali Mandar Mamasa Mamuju Mamuju
Utara Jumlah
(2) (4) (5)
(6)
(7)
Januari – January
66 1 092 - 207 - 1 365
Februari - February 293 471 71 151 - 986
Maret – Maret 429 1 266 11 278 - 1 984
April – April 351 1 039 16 128 - 1 534
Mei – May 409 1 061 36 190 - 1 696
Juni – June 457 1 608 3 213 - 2 281
Juli – July 331 922 21 172 - 1 446
Agustus – August
333 944 30 168 - 1 475
September – September
277 892 34 180 - 1 383
Oktober – October 343 1 066 20 190 - 1 619
November – Novemver
286 894 10 187 - 1 377
Desember - December 274 1 352 23 151 - 1 800
Jumlah 3 849 12 607 275 2 215 - 18 946
Catatan / Note : Selama Tahun 2009 Belum Melakukan Pelayanan Jamkesmas
Sumber / Source : PT, Askes (Persero) / General Helath Insurance
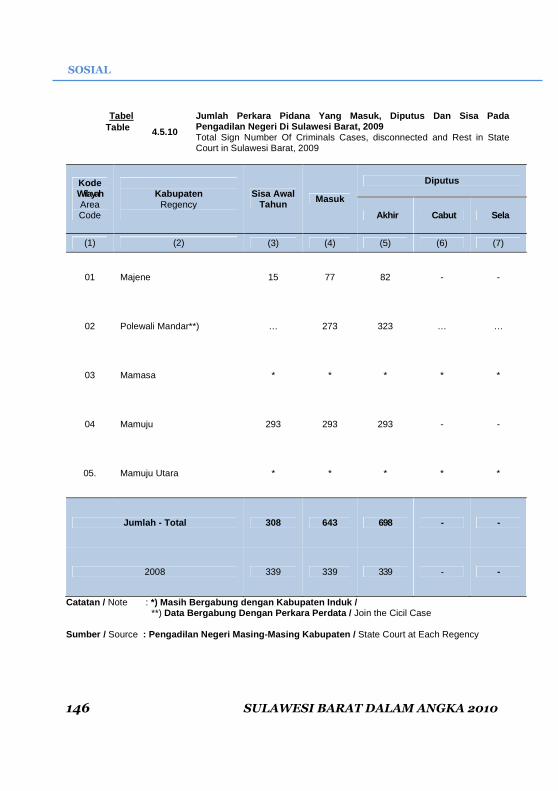
SOSIAL
146 SULAWESI BARAT DALAM ANGKA 2010
Tabel
4.5.10
Jumlah Perkara Pidana Yang Masuk, Diputus Dan Sisa Pada Pengadilan Negeri Di Sulawesi Barat, 2009 Table Total Sign Number Of Criminals Cases, disconnected and Rest in State Court in Sulawesi Barat, 2009
Kode Wilayah Area Code
Kabupaten
Regency
Sisa Awal Tahun Masuk
Diputus
Akhir Cabut Sela
(1)
(2) (3) (4) (5) (6) (7)
01 Majene 15 77 82 - -
02 Polewali Mandar**) … 273 323 … …
03 Mamasa * * * * *
04 Mamuju 293 293 293 - -
05. Mamuju Utara * * * * *
Jumlah - Total 308 643 698 - -
2008 339 339 339 - -
Catatan / Note : *) Masih Bergabung dengan Kabupaten Induk / **) Data Bergabung Dengan Perkara Perdata / Join the Cicil Case Sumber / Source : Pengadilan Negeri Masing-Masing Kabupaten / State Court at Each Regency
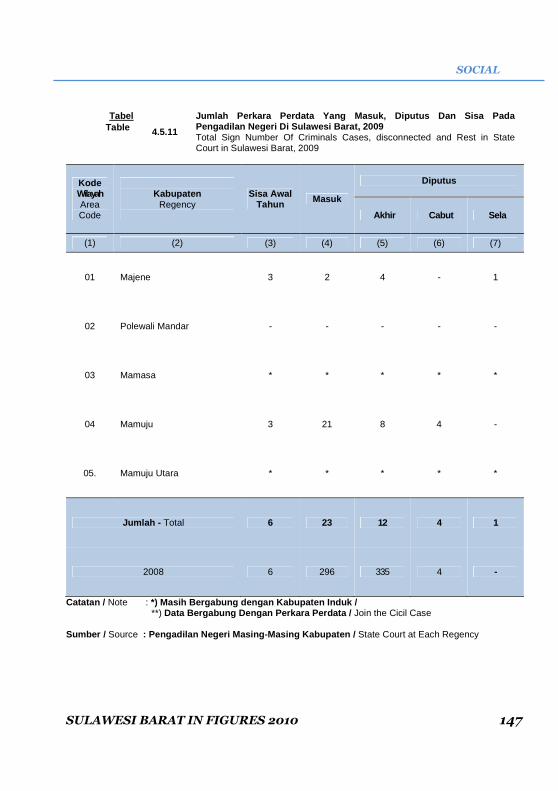
SOCIAL
SULAWESI BARAT IN FIGURES 2010 147
Tabel
4.5.11
Jumlah Perkara Perdata Yang Masuk, Diputus Dan Sisa Pada Pengadilan Negeri Di Sulawesi Barat, 2009 Table Total Sign Number Of Criminals Cases, disconnected and Rest in State Court in Sulawesi Barat, 2009
Kode Wilayah Area Code
Kabupaten
Regency
Sisa Awal Tahun Masuk
Diputus
Akhir Cabut Sela
(1)
(2) (3) (4) (5) (6) (7)
01 Majene 3 2 4 - 1
02 Polewali Mandar - - - - -
03 Mamasa * * * * *
04 Mamuju 3 21 8 4 -
05. Mamuju Utara * * * * *
Jumlah - Total 6 23 12 4 1
2008 6 296 335 4 -
Catatan / Note : *) Masih Bergabung dengan Kabupaten Induk / **) Data Bergabung Dengan Perkara Perdata / Join the Cicil Case Sumber / Source : Pengadilan Negeri Masing-Masing Kabupaten / State Court at Each Regency

SOSIAL
148 SULAWESI BARAT DALAM ANGKA 2010
Tabel 4.5.12
Jumlah Hakim, Panitera/Panitra Pengganti, dan Juru Sita Pada Pengadilan Negeri di Sulawesi Barat, 2009 Table Number Judge, Clerk/Register Substitute State Court in Sulawesi Barat, 2009
Kode Wilayah Area Code
Kabupaten
Regency
Hakim Panitera Penitera Pengganti Juru Sita
(1)
(2) (3) (5) (6) (7)
01 Majene 8 1 5 5
02 Polewali Mandar … … … …
03 Mamasa * * * *
04 Mamuju 10 1 5 5
05. Mamuju Utara * * * *
jumlah - Total 18 2 10 10
2008 15 2 9 11
Catatan / Note : *) Masih Bergabung dengan Kabupaten Induk / **) Data Bergabung Dengan Perkara Perdata / Join the Cicil Case Sumber / Source : Pengadilan Negeri Masing-Masing Kabupaten / State Court at Each Regency

SOCIAL
SULAWESI BARAT IN FIGURES 2010 149
Tabel 4.5.13
Jumlah Panti Asuhan Dan Anak Yang Di Asuh Dirinci P er Kabupaten Di Sulawesi Barat, 2009 Table Number Arphanageand Children by Regency in Sulawesi Barat, 2009
Kode Wilayah Area Code
Kabupaten
Regency
Jumlah Panti Asuhan Jumlah Anak Yang Di Asuh
Pemerintah Swasta Pemerintah Swasta
(1)
(2) (3) (5) (6) (7)
01 Majene - 12 - 349
02 Polewali Mandar - 15 - 487
03 Mamasa - 5 - 138
04 Mamuju - 11 - 390
05. Mamuju Utara - - - -
Jumlah - Total - 43 - 1 364
2008 - 43 - 1 364
Sumber / Source : Dinas Sosial Provinsi Sulawesi Barat / Society Agency Sulawesi Barat Provinces

SOSIAL
150 SULAWESI BARAT DALAM ANGKA 2010
Tabel 4.5.14
Jumlah Karang Taruna Dirinci Menurut Kondisi Dan Ka bupaten Di Sulawesi Barat, 2009 Table
Total Youth Workers by Conditions and Regency in Sulawesi Barat, 2009
Kode Wilayah Area Code
Kabupaten
Regency
Tumbuh/Pasif Berkembang / Aktif
Maju/ Aktif Kreatif Percontohan
(1)
(2) (3) (5) (6) (7)
01 Majene - 46 1 -
02 Polewali Mandar 6 87 3 -
03 Mamasa - 96 1 -
04 Mamuju 35 26 5 1
05. Mamuju Utara 29 3 1 -
Jumlah - Total 70 258 11 1
2008 41 255 10 -
Sumber / Source : Dinas Sosial Provinsi Sulawesi Barat / Society Agency Sulawesi Barat Provinces
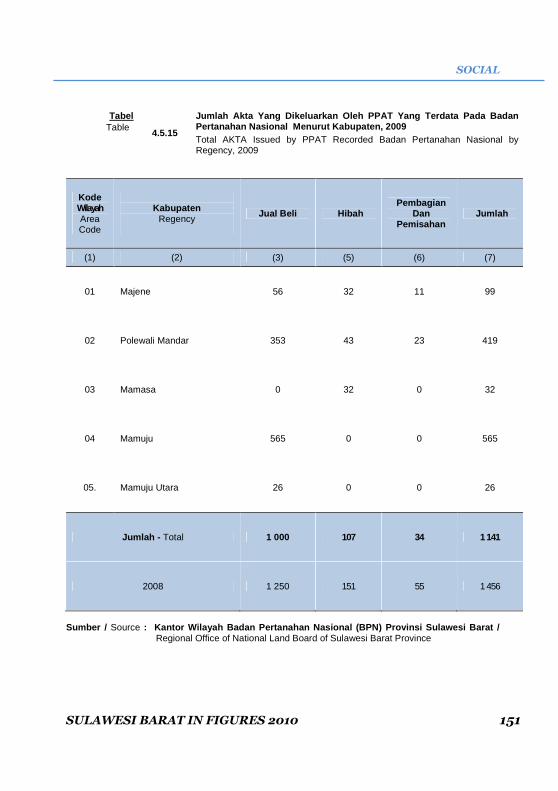
SOCIAL
SULAWESI BARAT IN FIGURES 2010 151
Tabel
4.5.15
Jumlah Akta Yang Dikeluarkan Oleh PPAT Yang Terdata Pada Badan Pertanahan Nasional Menurut Kabupaten, 2009 Table Total AKTA Issued by PPAT Recorded Badan Pertanahan Nasional by Regency, 2009
Kode Wilayah Area Code
Kabupaten
Regency
Jual Beli Hibah Pembagian
Dan Pemisahan
Jumlah
(1)
(2) (3) (5) (6) (7)
01 Majene 56 32 11 99
02 Polewali Mandar 353 43 23 419
03 Mamasa 0 32 0 32
04 Mamuju 565 0 0 565
05. Mamuju Utara 26 0 0 26
Jumlah - Total 1 000 107 34 1 141
2008 1 250 151 55 1 456
Sumber / Source : Kantor Wilayah Badan Pertanahan Nasional (BPN) Provinsi Sulawesi Barat /
Regional Office of National Land Board of Sulawesi Barat Province

SOSIAL
152 SULAWESI BARAT DALAM ANGKA 2010
Tabel
4.5.16
Jumlah Kejadian Kecelakaan Lalu Lintas Dan Jumlah K orban Menurut Kabupaten, 2009 Table
Number Events and Total of Traffic Accident Victims by Regency, 2009
Kode Wilayah Area Code
Kabupaten
Regency
Jumlah Kejadian
Kecelakaan
Jumlah korban
Mati Luka Berat Luka Ringan
(1)
(2) (3) (5) (6) (7)
01 Majene 4 201 14 538 2 171
02 Polewali Mandar * * * *
03 Mamasa 33 4 9 20
04 Mamuju 67 61 34 21
05. Mamuju Utara 1 217 31 41 91
Jumlah 5 518 110 622 2 303
Sumber / Source : Dinas Kesehatan Provinsi Sulawesi Barat / Departmen of Health Sulawesi Barat Provinces

5 PERTANIAN Agriculture

AGRICULTURE
SULAWESI BARAT IN FIGURES 2010 155
5.1. Tanaman Pangan
Sebagai daerah agraris dengan dukungan iklim tropis, Sulawesi Barat menyimpan sejuta potensi, dan menjadi salah satu sumber kehidupan ekonomi masyarakat di daerah ini. Hal ini terlihat dari masih dominannya sumbangan sektor pertanian terhadap total
pembentukan PDRB Sulawesi Barat.
Di sektor pertanian, Sulawesi Barat merupakan penghasil padi dan palawija yang cukup besar di Kawasan Timur Indonesia. Tahun 2009, produksi padi sekitar 310.706 ton yang terdiri dari produksi padi sawah sekitar 298.790 ton dan selebihnya adalah
produksi padi ladang sebesar 11.916 ton.
Produksi padi tahun ini mengalami penurunan di banding tahun sebelumnya dikarenakan adanya kerusakan saluran induk pada Bendungan Sekka-Sekka yang berada di Kabupaten Polewali Mandar. Dimana kapasitas bendungan ini mampu mengairi areal persawahan sekitar + 5.000 meter persegi di hampir semua kecamatan di
Polewali Mandar.
Selain produksi tanaman padi yang cukup besar, produksi tanaman palawija juga memperlihatkan progress yang cukup menggembirakan. Dari sekian produksi palawija yang ada di Sulawesi Barat, semua komoditi hamper mengalami perkembangan
yang menggembirakan.
Produksi yang meningkat diantaranya adalah jagung dengan produksi 58.320 ton; produksi kacang kedelai sekitar 3.154 ton sedangkan produksi kacang hijau dan kacang tanah masing-
masing sekitar 3.153 ton dan 1.001 ton.
5.1. Production Of Food Crops
As an agricultural area with the support of the tropical climate of Sulawesi Barat save a million potential, and become one of the sources of the economic life of people in this area. This can be seen from the still dominant agricultural sector contribution to total GDP formation of Sulawesi Barai.
In the agricultural sector, Sulawesi Barat is a producer of paddy and large enough in eastern Indonesia. In 2009, rice production of about 310 706 tonnes of paddy production of about 298 790 tonnes and the rest are upland rice production amounted to 11 916 tonnes.
Paddy production this year has decreased compared to previous years due to damage to the parent tract on Sekka-Sekka Dam located in Polewali Mandar. Where the capacity of this dam is able to irrigate the rice field of about + 5000 square meters in almost all districts in Polewali Mandar.
Apart from paddy production is big, the production of secondary food crops also showed a promising progress. Among all the arable crops production in West Sulawesi, all commodities almost been progressing satisfactorily.
Increased production of which is 58 320 tonnes of maize production; soybean production around 3154 tonnes, while production of green beans and peanuts each of about 3153 tons and 1001 tons.

PERTANIAN
SULAWESI BARAT DALAM ANGKA 2010 156
�
5.2. Tanaman Perkebunan
Komoditi tanaman perkebunan adalah semua jenis tanaman yang di usahkan oleh rakyat (tidak berbadan hukum) dan kegiatan perkebunan yang di lakukan oleh perusahaan
(berbadan hukum).
Jenis tanaman perkebunan yang cukup dominan di Sulawesi Barat adalah kelapa dalam dengan produksi sekitar 35.448,6 ton, kakao dengan produksi sekitar 38.661 ton dan berbagai tanaman perkebunan lainnya seperti cengkeh, sagu aren/enau dan lain sebagainya.
5.3. Kehutanan
Seiring dengan perkembangan Sulawesi Barat, mewajibkan tersedianya lahan yang digunakan untuk pembangunan. Dengan terbatasnya lahan siap guna yang tersedia, memaksa terjadinya pengalihan fungsi lahan hutan. Hal ini mengakibatkan berkurangnya luas
hutan yang ada di daerah ini.
Kawasan hutan di Sulawesi Barat pada tahun 2009 sekitar 1.119.796 ha atau berkurang sekitar 142.708 Ha dari luas lahan tahun sebelumnya. Berdasrkan klasifikasinya, hutan di Sulawesi Barat terdiri atas hutan lindung sekitar 666.358 Ha, hutan produksi terbatas dan produksi biasa masing-masing seluas 321.527 ha dan
61.300 ha.
Produksi hasil hutan di sulawesi Barat terdiri dari kayu dan non kayu. Produksi kayu sekitar 10.809 meter kubik yang tersebar di kabupaten Polewali Mandar, Mamuju dan Mamuju Utara, sedangkan produksi non kayu yang berupa rotan hanya sekitar 3.081 meter kubik yang terbesar di
Kabupaten Polman dan Mamuju Utara.
5.2. Estate Crops Plantation commodities are all types of
crops cultivated by the people (not a legal entity) and plantation activities are done by the
company (legal entity).
Type a fairly dominant plantation crop in Sulawesi Barat coconut production is approximately 35448.6 tons, cocoa producing around 38 661 tonnes and a variety of other plantation crops such as cloves, sago palm /
palm, and others.
5.3 Forestry
Along with the development of SulawesiBarat, requires the availability of land used for development. With limited land available ready to use, forcing the diversion of forest land conversion. This results in less extensive forests in this region.
Forest area in Sulawesi Barat in the year 2009 approximately 1,119,796 ha or less around 142 708 hectares of land area the previous year. Based on their classification, cutaneous in Sulawesi Barat consists of approximately 666.358 hectares of protected forest, production forest and regular production each covering 321 527 ha and 61 300 ha.
Production of forest products in West Sulawesi consists of wood and non wood. Production of about 10 809 cubic meters of wood scattered in Polewali Mandar regency, Mamuju and Mamuju Utara, whereas non-wood production such as rattan only about 3081 cubic meters of the largest in Polman and MamujuUtara.

AGRICULTURE
SULAWESI BARAT IN FIGURES 2010 157
Grafik 5.1 Perkembangan Produksi Padi Tahun 200 6 – 2009 Figure Development of Rice Production, 2006-2009

PERTANIAN
SULAWESI BARAT DALAM ANGKA 2010 158
�
Grafik 5.2 Produksi Tanaman Palawija di Sulawesi Barat Tahun 2009 Figure Production of Crops in Sulawesi Barat, 2009

AGRICULTURE
SULAWESI BARAT IN FIGURES 2010 159
Tabel
5.1.1
Luas Lahan Sawah Menurut Sistem Pengairannya Dirin ci Per Kabupaten Di Provinsi Sulawesi Barat (Ha), 2009 Table Wetland Area by Drainasing System Per Regency in Sulawesi Barat Province (Hectare), 2009
ode Wilayah
Area Code
Kabupaten Regency
Teknis Setengah Teknis Sederhana Desa/Non Pu
(1)
(2)
(3)
(4)
(5)
(6)
01 Majene - 166 50 192
02 Polewali Mandar 12 076 1 604 286 554
03 Mamasa 408 311 1 373 12 633
04 Mamuju 100 450 1 086 2 035
05 Mamuju Utara 61 176 487 266
Jumlah - Total 12 645 2 707 3 282 15 680
2008 12 317 1 886 1 713 16 392
2007 12 422 2 403 3 351 12 440
2006 11 286 2 327 2 677 15 002
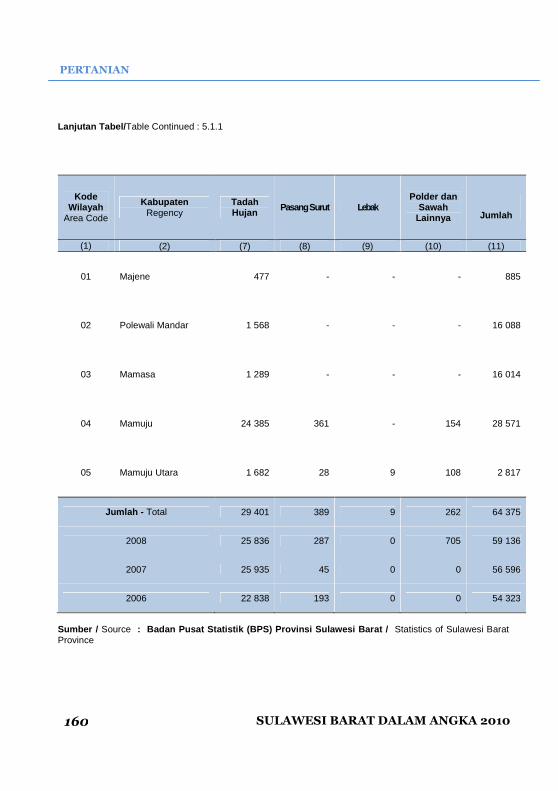
PERTANIAN
SULAWESI BARAT DALAM ANGKA 2010 160
�
Lanjutan Tabel/ Table Continued : 5.1.1
Kode Wilayah
Area Code
Kabupaten Regency
Tadah Hujan Pasang Surut Lebak
Polder dan Sawah
Lainnya Jumlah
(1)
(2)
(7)
(8)
(9)
(10)
(11)
01 Majene 477 - - - 885
02 Polewali Mandar 1 568 - - - 16 088
03 Mamasa 1 289 - - - 16 014
04 Mamuju 24 385 361 - 154 28 571
05 Mamuju Utara 1 682 28 9 108 2 817
Jumlah - Total 29 401 389 9 262 64 375
2008 25 836 287 0 705 59 136
2007 25 935 45 0 0 56 596
2006 22 838 193 0 0 54 323
Sumber / Source : Badan Pusat Statistik (BPS) Provinsi Sulawesi Ba rat / Statistics of Sulawesi Barat Province

AGRICULTURE
SULAWESI BARAT IN FIGURES 2010 161
Tabel
5.1.2
Luas Lahan Sawah Irigasi Dan Non Irigasi Menurut I rigasinya Per Kabupaten Di Provinsi Sulawesi Barat (Ha), 2009 Table Wetland Area by IrrigationAnd Non Irrigation per Regency in Sulawesi Barat Province (Hectare), 2009
Kode Wilayah
Area Code
Kabupaten Regency
Irigasi Irrigation
Bukan Irigasi Not Irrigation
Jumlah Total
(1)
(2)
(3)
(4)
(5)
01 Majene 408 477 885
02 Polewali Mandar 14 520 1 568 16 088
03 Mamasa 14 725 1 289 16 014
04 Mamuju 3 671 24 900 28 571
05 Mamuju Utara 990 1 827 2 817
Jumlah – Total 34 314 30 061 64 375
2008 31 183 22 037 53 220
2007 29 475 21 325 50 800
2006 31 292 23 031 54 323
Sumber / Source : Badan Pusat Statistik (BPS) Provinsi Sulawesi Ba rat / Statistics of Sulawesi Barat Province

PERTANIAN
SULAWESI BARAT DALAM ANGKA 2010 162
�
Tabel
5.1.3
Luas Panen, Produksi Dan Produktivitas Padi Sawah D i Provinsi Sulawesi Barat, 2009 Table Harvested Area, Production and Productivityof Wet land Paddy in Sulawesi Barat Province, 2009
Tahun Year
Luas Panen Harvested Area
(Ha)
Produksi Production
(Ton)
Produktivitas Productivity
(Ku/Ha)
(1) (3) (4) (5)
2009 60 731 298 790 49,20
Sub-Bround I (Januari-April) 25 092 133 364 53,15
Sub-Bround II (Mei-Agustus) 24 359 115 681 47,49
Sub-Bround III (September-Desember) 11 280 49 745 44,10
2008 65 913 324 445 49,22
2007 60 375 297 181 49,22
2006 59 565 289 632 48,62
Catatan / Notes : Produksi Dalam GKG / Production In GKG Sumber / Source : Badan Pusat Statistik (BPS) Provinsi Sulawesi Bar at / Statistics of Sulawesi Barat Province

AGRICULTURE
SULAWESI BARAT IN FIGURES 2010 163
Tabel
5.1.4
Luas Panen, Produksi Dan Produktivitas Padi Ladang Di Provinsi Sulawesi Barat, 2009 Table Harvested Area, Production and Productivity of Dry Land Paddy in Sulawesi Barat Province, 2009
Tahun Year
Luas Panen Harvested Area
(Ha)
Produksi Production
(Ton)
Produktivitas Productivity
(Ku/Ha)
(1) (3) (4) (5)
2009
4 242 11 916 28,09
Sub-Bround I (Januari-April) 2 259 6 072 26,88
Sub-Bround II (Mei-Agustus) 1 855 5 541 29,87
Sub-Bround III (September-Desember) 128 303 23,67
2008 6 558 18 776 28,63
2007 6 255 15 495 24,77
2006 4 897 11 984 24,47
Catatan / Notes : Produksi Dalam GKG / Production In GKG Sumber / Source : Badan Pusat Statistik (BPS) Provinsi Sulawesi Bar at / Statistics of Sulawesi Barat Province
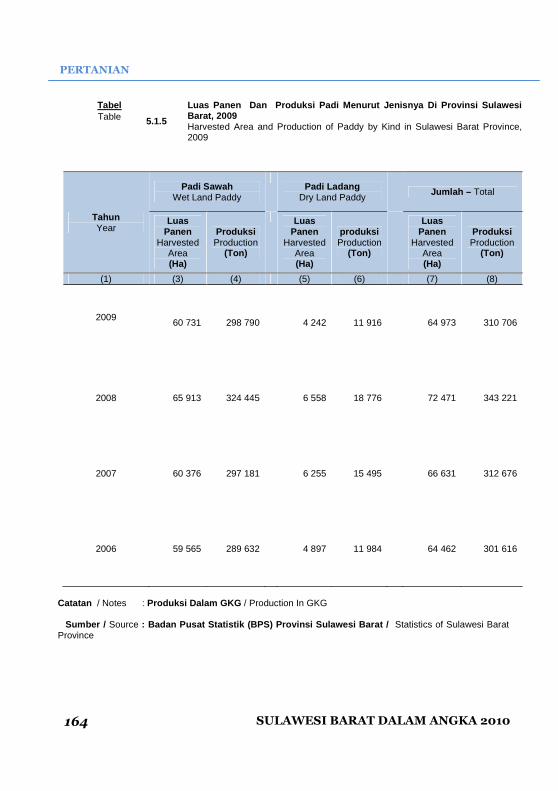
PERTANIAN
SULAWESI BARAT DALAM ANGKA 2010 164
�
Tabel
5.1.5
Luas Panen Dan Produksi Padi Menurut Jenisnya Di Provinsi Sulawesi Barat, 2009 Table Harvested Area and Production of Paddy by Kind in Sulawesi Barat Province, 2009
Tahun Year
Padi Sawah Wet Land Paddy
Padi Ladang
Dry Land Paddy
Jumlah – Total
Luas Panen
Harvested Area (Ha)
Produksi Production
(Ton)
Luas Panen
Harvested Area (Ha)
produksi Production
(Ton)
Luas Panen
Harvested Area (Ha)
Produksi Production
(Ton)
(1) (3) (4) (5) (6) (7) (8)
2009 60 731 298 790
4 242 11 916
64 973 310 706
2008 65 913 324 445
6 558 18 776
72 471 343 221
2007 60 376 297 181
6 255 15 495
66 631 312 676
2006 59 565 289 632
4 897 11 984
64 462 301 616
Catatan / Notes : Produksi Dalam GKG / Production In GKG Sumber / Source : Badan Pusat Statistik (BPS) Provinsi Sulawesi Bar at / Statistics of Sulawesi Barat Province
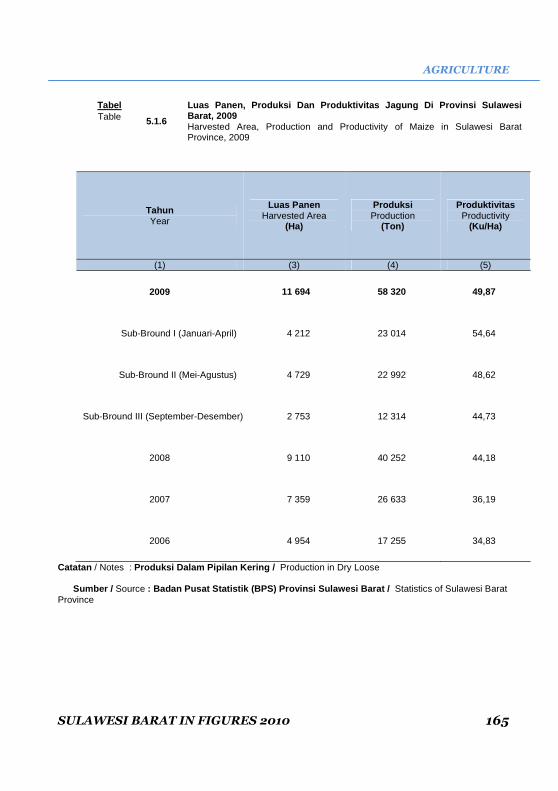
AGRICULTURE
SULAWESI BARAT IN FIGURES 2010 165
Tabel
5.1.6
Luas Panen, Produksi Dan Produktivitas Jagung Di Pr ovinsi Sulawesi Barat, 2009 Table Harvested Area, Production and Productivity of Maize in Sulawesi Barat Province, 2009
Tahun Year
Luas Panen Harvested Area
(Ha)
Produksi Production
(Ton)
Produktivitas Productivity
(Ku/Ha)
(1) (3) (4) (5)
2009 11 694 58 320 49,87
Sub-Bround I (Januari-April) 4 212 23 014 54,64
Sub-Bround II (Mei-Agustus) 4 729 22 992 48,62
Sub-Bround III (September-Desember) 2 753 12 314 44,73
2008 9 110 40 252 44,18
2007 7 359 26 633 36,19
2006 4 954 17 255 34,83
Catatan / Notes : Produksi Dalam Pipilan Kering / Production in Dry Loose Sumber / Source : Badan Pusat Statistik (BPS) Provinsi Sulawesi Bar at / Statistics of Sulawesi Barat Province

PERTANIAN
SULAWESI BARAT DALAM ANGKA 2010 166
�
Tabel
5.1.7
Luas Panen, Produksi Dan Produktivitas Ubi Jalar Di Provinsi Sulawesi Barat, 2009 Table Harvested Area, Production and Productivity of Sweet Potatos in Sulawesi Barat Province, 2009
Tahun Year
Luas Panen Harvested Area
(Ha)
Produksi Production
(Ton)
Produktivitas Productivity
(Ku/Ha)
(1) (3) (4) (5)
2009 1 430 15 756 110,18
Sub-Bround I (Januari-April) 302 3 354 111,06
Sub-Bround II (Mei-Agustus) 561 6 095 108,65
Sub-Bround III (September-Desember) 567 6 307 111,23
2008 1 442 15 895 110,23
2007 846 9 304 109,98
2006 590 6 391 108,32
Sumber / Source : Badan Pusat Statistik (BPS) Provinsi Sulawesi Bar at / Statistics of Sulawesi Barat Province Catatan / Notes : Produksi Dalam Umbi Basah / Produstionin Wet Tuber

AGRICULTURE
SULAWESI BARAT IN FIGURES 2010 167
Tabel
5.1.8
Luas Panen, Produksi Dan Produktivitas Ubi Kayu Di Provinsi Sulawesi Barat, 2009 Table Harvested Area, Production and Productivity of Cassava in Sulawesi Barat Province, 2009
Tahun Year
Luas Panen Harvested Area
(Ha)
Produksi Production
(Ton)
Produktivitas Productivity
(Ku/Ha)
(1) (2) (3) (4)
2009
2 852 47 781 167,54
Sub-Bround I (Januari-April) 737 14 504 196,80
Sub-Bround II (Mei-Agustus) 1 179 18 893 160,25
Sub-Bround III (September-Desember) 936 14 384 153,68
2008 3 902 54 809 140,46
2007 3 309 45 921 138,78
2006 3 220 42 379 131,61
Sumber / Source : Badan Pusat Statistik (BPS) Provinsi Sulawesi Bar at / Statistics of Sulawesi Barat Province Catatan / Notes : Produksi Dalam Umbi Basah / Produstionin Wet Tuber

PERTANIAN
SULAWESI BARAT DALAM ANGKA 2010 168
�
Tabel
5.1.9
Luas Panen, Produksi Dan Produktivitas Kacang Tanah Di Provinsi Sulawesi Barat, 2009 Table Harvested Area, Production and Productivity of Peanuts in Sulawesi Barat Province, 2009
Tahun Year
Luas Panen Harvested Area
(Ha)
Produksi Production
(Ton)
Produktivitas Productivity
(Ku/Ha)
(1) (2) (3) (4)
2009
711 1 001 14,08
Sub-Bround I (Januari-April) 153 217 14,18
Sub-Bround II (Mei-Agustus) 270 380 14,07
Sub-Bround III (September-Desember) 288 404 14,02
2008 528 744 14,09
2007 552 777 14,08
2006 395 541 13,70
Sumber / Source : Badan Pusat Statistik (BPS) Provinsi Sulawesi Bar at / Statistics of Sulawesi Barat Province Catatan/Notes : Produksi Dalam Biji Kering
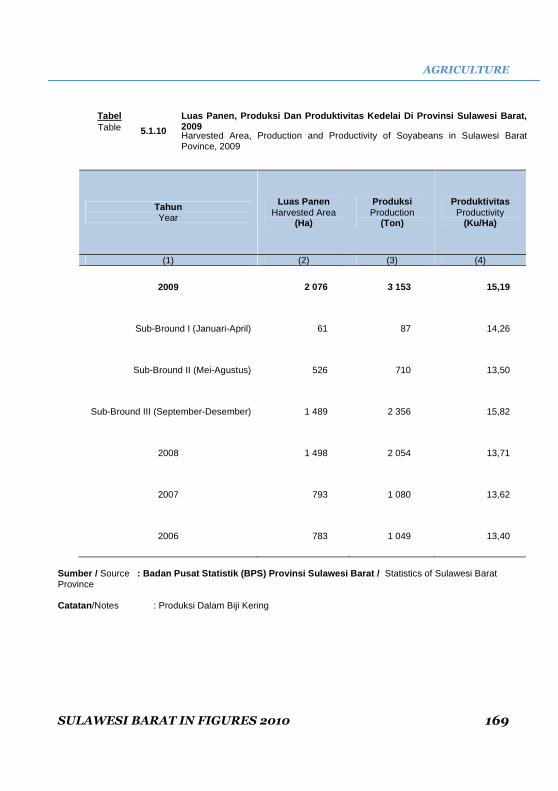
AGRICULTURE
SULAWESI BARAT IN FIGURES 2010 169
Tabel
5.1.10
Luas Panen, Produksi Dan Produktivitas Kedelai Di P rovinsi Sulawesi Barat, 2009 Table Harvested Area, Production and Productivity of Soyabeans in Sulawesi Barat Povince, 2009
Tahun Year
Luas Panen Harvested Area
(Ha)
Produksi Production
(Ton)
Produktivitas Productivity
(Ku/Ha)
(1) (2) (3) (4)
2009 2 076 3 153 15,19
Sub-Bround I (Januari-April) 61 87 14,26
Sub-Bround II (Mei-Agustus) 526 710 13,50
Sub-Bround III (September-Desember) 1 489 2 356 15,82
2008 1 498 2 054 13,71
2007 793 1 080 13,62
2006 783 1 049 13,40
Sumber / Source : Badan Pusat Statistik (BPS) Provinsi Sulawesi Bar at / Statistics of Sulawesi Barat Province Catatan /Notes : Produksi Dalam Biji Kering

PERTANIAN
SULAWESI BARAT DALAM ANGKA 2010 170
�
Tabel
5.1.11
Luas Panen, Produksi Dan Produktivitas Kacang Hijau Di Provinsi Sulawesi Barat, 2009 Table Harvested Area, Production and Productivity of Small Green Pea in Sulawesi Barat Province, 2009
Tahun Year
Luas Panen Harvested Area
(Ha)
Produksi Production
(Ton)
Produktivitas Productivity
(Ku/Ha)
(1) (2) (3) (4)
2009 803 1 093 13,61
Sub-Bround I (Januari-April) 323 449 13,90
Sub-Bround II (Mei-Agustus) 273 388 14,21
Sub-Bround III (September-Desember) 207 256 12,35
2008 981 1 294 13,18
2007 817 1 073 13,13
2006 705 908 12,88
Sumber / Source : Badan Pusat Statistik (BPS) Provinsi Sulawesi Bar at / Statistics of Sulawesi Barat Province Catatan/Notes : Produksi Dalam Biji Kering

AGRICULTURE
SULAWESI BARAT IN FIGURES 2010 171
Tabel 5.2.1
Luas Panen Dan Produksi Bawang Merah Menurut Kabupa ten Di Sulawesi Barat, 2009 Table Harvested Area and Production of Shallot by Regency in Sulawesi Barat, 2009
Kode Wilayah
Area Code
Kabupaten Regency
Luas Panen Harvested Area
(Ha)
Produksi Production
(Ton)
(1) (2) (3) (4)
01 Majene 31 64,9
02 Polewali Mandar 300 798,0
03 Mamasa 19 18,2
04 Mamuju - -
05 Mamuju Utara - -
Jumlah - Total 350 881,1
2008 193 24,0
2007 587 290,8
2006 206 133,4
Sumber / Source : Badan Pusat Statistik (BPS) Provinsi Sulawesi Bar at / Statistics of Sulawesi Barat Province

PERTANIAN
SULAWESI BARAT DALAM ANGKA 2010 172
�
Tabel
5.2.2
Luas Panen Dan Produksi Bawang Daun Menurut Kabupat en Di Sulawesi Barat, 2009 Table Harvested Area and Production of Shallot Leaf by Regency in Sulawesi Barat, 2009
Kode Wilayah
Area Code
Kabupaten Regency
Luas Panen Harvested Area
(Ha)
Produksi Production
(Ton)
(1) (2) (3) (4)
01 Majene
1 4
02 Polewali Mandar 91 143
03 Mamasa 80 63
04 Mamuju 57 122
05 Mamuju Utara - -
Jumlah - Total 299 332
Sumber / Source : Badan Pusat Statistik (BPS) Provinsi Sulawesi Bar at / Statistics of Sulawesi Barat Province
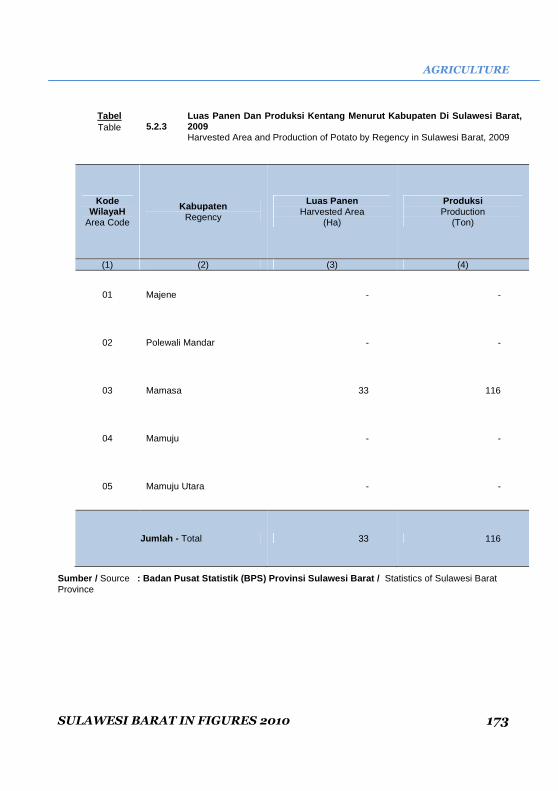
AGRICULTURE
SULAWESI BARAT IN FIGURES 2010 173
Tabel 5.2.3
Luas Panen Dan Produksi Kentang Menurut Kabupaten D i Sulawesi Barat, 2009 Table Harvested Area and Production of Potato by Regency in Sulawesi Barat, 2009
Kode WilayaH
Area Code
Kabupaten Regency
Luas Panen Harvested Area
(Ha)
Produksi Production
(Ton)
(1) (2) (3) (4)
01 Majene - -
02 Polewali Mandar - -
03 Mamasa 33 116
04 Mamuju - -
05 Mamuju Utara - -
Jumlah - Total 33 116
Sumber / Source : Badan Pusat Statistik (BPS) Provinsi Sulawesi Bar at / Statistics of Sulawesi Barat Province

PERTANIAN
SULAWESI BARAT DALAM ANGKA 2010 174
�
Tabel 5.2.4
Luas Panen Dan Produksi Kubis Menurut Kabupaten Di Sulawesi Barat, 2009 Table Harvested Area and Production of Cabbage by Regency in Sulawesi Barat, 2009
Kode Wilayah
Area Code
Kabupaten Regency
Luas Panen Harvested Area
(Ha)
Produksi Production
(Ton)
(1) (2) (3) (4)
01 Majene 3 29
02 Polewali Mandar - -
03 Mamasa 34 391
04 Mamuju - -
05 Mamuju Utara - -
Jumlah - Total 37 420
Sumber / Source : Badan Pusat Statistik (BPS) Provinsi Sulawesi Bar at / Statistics of Sulawesi Barat Province

AGRICULTURE
SULAWESI BARAT IN FIGURES 2010 175
Tabel
5.2.5
Luas Panen Dan Produksi Kembang Kol Menurut Kabupat en Di Sulawesi Barat, 2009 Table Harvested Area and Production of Kembang Kol by Regency in Sulawesi Barat, 2009
Kode Wilayah
Area Code
Kabupaten Regency
Luas Panen Harvested Area
(Ha)
Produksi Production
(Ton)
(1) (2) (3) (4)
01 Majene - -
02 Polewali Mandar - -
03 Mamasa 9 32
04 Mamuju - -
05 Mamuju Utara - -
Jumlah - Total 9 4
Sumber / Source : Badan Pusat Statistik (BPS) Provinsi Sulawesi Bar at / Statistics of Sulawesi Barat Province

PERTANIAN
SULAWESI BARAT DALAM ANGKA 2010 176
�
Tabel
5.2.6
Luas Panen Dan Produksi Petsai/Sawi Menurut Kabupat en Di Sulawesi Barat, 2009 Table Harvested Area and Production of Mustard Green by Regency in Sulawesi Barat, 2009
Sumber / Source : Badan Pusat Statistik (BPS) Provinsi Sulawesi Bar at / Statistics of Sulawesi Barat Province
Kode Wilayah
Area Code
Kabupaten Regency
luas panen Harvested Area
(Ha)
Produksi Production
(Ton)
(1) (2) (3) (4)
01 Majene 12 17
02 Polewali Mandar 77 182
03 Mamasa 127 85
04 Mamuju 155 206
05 Mamuju Utara - -
Jumlah - Total 371 490
2008 292 135
2007 169 118
2006 246 231

AGRICULTURE
SULAWESI BARAT IN FIGURES 2010 177
Tabel 5.2.7
Luas Panen Dan Produksi Wortel Menurut Kabupaten Di Sulawesi Barat, 2009 Table
Harvested Area and Production of Carrot by Regency in Sulawesi Barat, 2009
Kode Wilayah
Area Code
Kabupaten Regency
Luas Panen Harvested Area
(Ha)
Produksi Production
(Ton)
(1) (2) (3) (4)
01 Majene - -
02 Polewali Mandar - -
03 Mamasa 14 42
04 Mamuju - -
05 Mamuju Utara - -
Jumlah - Total 14 42
Sumber / Source : Badan Pusat Statistik (BPS) Provinsi Sulawesi Bar at / Statistics of Sulawesi Barat Province

PERTANIAN
SULAWESI BARAT DALAM ANGKA 2010 178
�
Tabel 5.2.8
Luas Panen Dan Produksi Kacang Merah Menurut Kabupa ten Di Sulawesi Barat, 2009 Table Harvested Area and Production of Red Beans by Regency in Sulawesi Barat, 2009
Kode Wilayah
Area Code
Kabupaten Regency
Luas Panen Harvested Area
(Ha)
Produksi Production
(Ton)
(1) (2) (3) (4)
01 Majene - -
02 Polewali Mandar - -
03 Mamasa 45 45
04 Mamuju - -
05 Mamuju Utara - -
Jumlah - Total 45 45
Sumber / Source : Badan Pusat Statistik (BPS) Provinsi Sulawesi Bar at / Statistics of Sulawesi Barat Province

AGRICULTURE
SULAWESI BARAT IN FIGURES 2010 179
Tabel 5.2.9
Luas Panen Dan Produksi Kacang Panjang Menurut Kabu paten Di Sulawesi Barat, 2009 Table Harvested Area and Production of Long Beans by Regency in Sulawesi Barat, 2009
Kode Wilayah
Area Code
Kabupaten Regency
Luas Panen Harvested Area
(Ha)
Produksi Production
(Ton)
(1) (2) (3) (4)
01 Majene 84 205
02 Polewali Mandar 180 324
03 Mamasa 133 110
04 Mamuju 379 458
05 Mamuju Utara 92 310
Jumlah - Total 868 1 407
Sumber / Source : Badan Pusat Statistik (BPS) Provinsi Sulawesi Bar at / Statistics of Sulawesi Barat Province

PERTANIAN
SULAWESI BARAT DALAM ANGKA 2010 180
�
Tabel
5.2.10
Luas Panen Dan Produksi Cabe Besar/Lombok Besar Men urut Kabupaten Di Sulawesi Barat, 2009 Table Harvested Area and Production of Chilies Large by Regency in Sulawesi Barat, 2009
Sumber / Source : Badan Pusat Statistik (BPS) Provinsi Sulawesi Bar at / Statistics of Sulawesi Barat Province
Kode Wilayah
Area Code
Kabupaten Regency
Luas Panen Harvested Area
(Ha)
Produksi Production
(Ton)
(1) (2) (3) (4)
01 Majene 76 208
02 Polewali Mandar 39 83
03 Mamasa 43 41
04 Mamuju 185 367
05 Mamuju Utara 57 216
Jumlah - Total 400 914
2008 246 608
2007 315 1 644
2006 695 2 669

AGRICULTURE
SULAWESI BARAT IN FIGURES 2010 181
Tabel
5.2.11
Luas Panen Dan Produksi Cabe Rawit Menurut Kabupate n Di Sulawesi Barat, 2009 Table Harvested Area and Production of Chayenne Pepper by Regency in Sulawesi Barat, 2009
Kode Wilayah
Area Code
Kabupaten Regency
Luas Panen Harvested Area
(Ha)
Produksi Production
(Ton)
(1) (2) (3) (4)
01 Majene 147 252
02 Polewali Mandar 98 84
03 Mamasa 152 42
04 Mamuju 272 668
05 Mamuju Utara 83 444
Jumlah - Total 752 1 590
Sumber / Source : Badan Pusat Statistik (BPS) Provinsi Sulawesi Bar at / Statistics of Sulawesi Barat Province
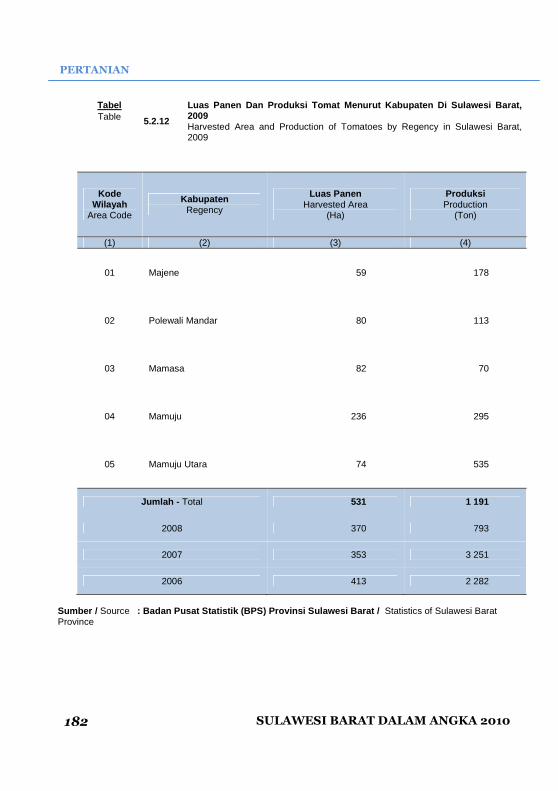
PERTANIAN
SULAWESI BARAT DALAM ANGKA 2010 182
�
Tabel
5.2.12
Luas Panen Dan Produksi Tomat Menurut Kabupaten Di Sulawesi Barat, 2009 Table Harvested Area and Production of Tomatoes by Regency in Sulawesi Barat, 2009
Sumber / Source : Badan Pusat Statistik (BPS) Provinsi Sulawesi Bar at / Statistics of Sulawesi Barat Province
Kode Wilayah
Area Code
Kabupaten Regency
Luas Panen Harvested Area
(Ha)
Produksi Production
(Ton)
(1) (2) (3) (4)
01 Majene 59 178
02 Polewali Mandar 80 113
03 Mamasa 82 70
04 Mamuju 236 295
05 Mamuju Utara 74 535
Jumlah - Total 531 1 191
2008 370 793
2007 353 3 251
2006 413 2 282

AGRICULTURE
SULAWESI BARAT IN FIGURES 2010 183
Tabel 5.2.13
Luas Panen Dan Produksi Terong Menurut Kabupaten Di Sulawesi Barat, 2009 Table Harvested Area and Production of Eggplant by Regency in Sulawesi Barat, 2009
Sumber / Source : Badan Pusat Statistik (BPS) Provinsi Sulawesi Bar at / Statistics of Sulawesi Barat Province
Kode Wilayah
Area Code
Kabupaten Regency
Luas Panen Harvested Area
(Ha)
Produksi Production
(Ton)
(1) (2) (3) (4)
01 Majene 64 122
02 Polewali Mandar 91 210
03 Mamasa 93 72
04 Mamuju 242 717
05 Mamuju Utara 86 591
jumlah - Total 576 1 712
2008 337 2 083
2007 603 3 251
2006 440 1 717

PERTANIAN
SULAWESI BARAT DALAM ANGKA 2010 184
�
Tabel 5.2.14
Luas Panen Dan Produksi Buncis Menurut Kabupaten Di Sulawesi Barat, 2009 Table Harvested Area and Production of Snaps by Regency in Sulawesi Barat, 2009
Kode Wilayah
Area Code
Kabupaten Regency
Luas Panen Harvested Area
(Ha)
Produksi Production
(Ton)
(1) (2) (3) (4)
01 Majene 3 11
02 Polewali Mandar 1 1
03 Mamasa 47 168
04 Mamuju - -
05 Mamuju Utara - -
Jumlah - Total 51 180
Sumber / Source : Badan Pusat Statistik (BPS) Provinsi Sulawesi Bar at / Statistics of Sulawesi Barat Province
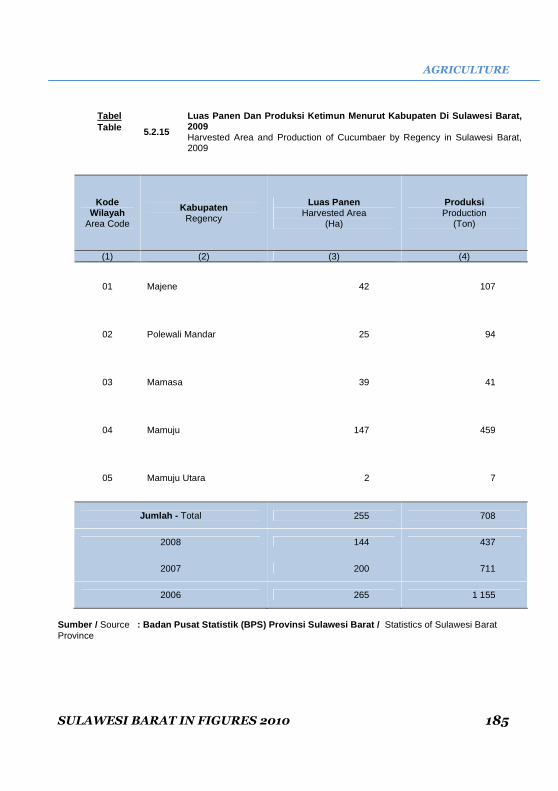
AGRICULTURE
SULAWESI BARAT IN FIGURES 2010 185
Tabel
5.2.15
Luas Panen Dan Produksi Ketimun Menurut Kabupaten D i Sulawesi Barat, 2009 Table Harvested Area and Production of Cucumbaer by Regency in Sulawesi Barat, 2009
Sumber / Source : Badan Pusat Statistik (BPS) Provinsi Sulawesi Bar at / Statistics of Sulawesi Barat Province
Kode Wilayah
Area Code
Kabupaten Regency
Luas Panen Harvested Area
(Ha)
Produksi Production
(Ton)
(1) (2) (3) (4)
01 Majene 42 107
02 Polewali Mandar 25 94
03 Mamasa 39 41
04 Mamuju 147 459
05 Mamuju Utara 2 7
Jumlah - Total 255 708
2008 144 437
2007 200 711
2006 265 1 155

PERTANIAN
SULAWESI BARAT DALAM ANGKA 2010 186
�
Tabel 5.2.16
Luas Panen Dan Produksi Labu Siam Menurut Kabupaten Di Sulawesi Barat, 2009 Table Harvested Area and Production of Squash by Regency in Sulawesi Barat, 2009
Kode Wilayah
Area Code
Kabupaten Regency
Luas Panen Harvested Area
(Ha)
Produksi Production
(Ton)
(1) (2) (3) (4)
01 Majene - -
02 Polewali Mandar 2 25
03 Mamasa 153 1 318
04 Mamuju 4 3
05 Mamuju Utara 5 10
Jumlah - Total 164 1 356
Sumber / Source : Badan Pusat Statistik (BPS) Provinsi Sulawesi Bar at / Statistics of Sulawesi Barat Province

AGRICULTURE
SULAWESI BARAT IN FIGURES 2010 187
Tabel
5.2.17
Luas Panen Dan Produksi Kangkung Menurut Kabupaten Di Sulawesi Barat, 2009 Table Harvested Area and Production of Water Spinach by Regency in Sulawesi Barat, 2009
Kode Wilayah
Area Code
Kabupaten Regency
Luas Panen Harvested Area
(Ha)
Produksi Production
(Ton)
(1) (2) (3) (4)
01 Majene 67 174
02 Polewali Mandar 73 207
03 Mamasa 73 93
04 Mamuju 332 407
05 Mamuju Utara 1.2 555
Jumlah - Total 657 1 436
Sumber / Source : Badan Pusat Statistik (BPS) Provinsi Sulawesi Bar at / Statistics of Sulawesi Barat Province

PERTANIAN
SULAWESI BARAT DALAM ANGKA 2010 188
�
Tabel 5.2.18
Luas Panen Dan Produksi Bayam Menurut Kabupaten Di Sulawesi Barat, 2009 Table Harvested Area and Production of Spinach by Regency in Sulawesi Barat, 2009
Sumber / Source : Badan Pusat Statistik (BPS) Provinsi Sulawesi Bar at / Statistics of Sulawesi Barat Province
Kode Wilayah
Area Code
Kabupaten Regency
Luas Panen Harvested Area
(Ha)
Produksi Production
(Ton)
(1) (2) (3) (4)
01 Majene 68 130
02 Polewali Mandar 65 148
03 Mamasa 115 74
04 Mamuju 278 417
05 Mamuju Utara 131 751
Jumlah - Total 657 1 520
2008 392 955
2007 340 1 297
2006 437 1 004

AGRICULTURE
SULAWESI BARAT IN FIGURES 2010 189
Tabel
5.3.1
Banyaknya Tanaman Menghasilkan Dan Produksi Durian Menurut Kabupaten Di Sulawesi Barat, 2009 Table Number Plants Producing and Production of Durians by Regency in Sulawesi Barat, 2009
Kode Wilayah
Area Code
Kabupaten Regency
Tanaman Menghasilkan Plantas Produce
(Pohon)
Produksi Production
(Ton)
(1) (2) (3) (4)
01 Majene 45 135 3 536
02 Polewali Mandar 3 915 621
03 Mamasa 1 051 399
04 Mamuju 12 386 3 585
05 Mamuju Utara 2 505 909
Jumlah - Total 64 992 9 050
2008 39 454 3 947
2007 37 376 3 013
Sumber / Source : Badan Pusat Statistik (BPS) Provinsi Sulawesi Bar at / Statistics of Sulawesi Barat Province

PERTANIAN
SULAWESI BARAT DALAM ANGKA 2010 190
�
Tabel
5.3.2
Banyaknya Tanaman Menghasilkan Dan Produksi Alpokat Menurut Kabupaten Di Sulawesi Barat, 2009 Table Number Plants Producing and Production of Durians by Regency in Sulawesi Barat, 2009
kode wilayah
Area Code
Kabupaten Regency
Tanaman Menghasilkan Plants Produce
(Pohon)
Produksi Production
(Ton)
(1) (2) (3) (4)
01 Majene 144 16
02 Polewali Mandar 67 4
03 Mamasa 4 008 854
04 Mamuju 390 88
05 Mamuju Utara 35 4
Jumlah - Total 4 644 966
Sumber / Source : Badan Pusat Statistik (BPS) Provinsi Sulawesi Bar at / Statistics of Sulawesi Barat Province

AGRICULTURE
SULAWESI BARAT IN FIGURES 2010 191
Tabel
5.3.3
Banyaknya Tanaman Menghasilkan Dan Produksi Jambu B iji Menurut Kabupaten Di Sulawesi Barat, 2009 Table Number Plants Producing and Production of Guava by Regency in Sulawesi Barat, 2009
Kode WilayaH
Area Code
Kabupaten Regency
Tanaman Menghasilkan Plants Produce
(Pohon)
Produksi Production
(Ton)
(1) (2) (3) (4)
01 Majene 744 48
02 Polewali Mandar 257 17
03 Mamasa 2 454 123
04 Mamuju 3 484 261
05 Mamuju Utara … 10
Jumlah - Total 6 939 459
Sumber / Source : Badan Pusat Statistik (BPS) Provinsi Sulawesi Bar at / Statistics of Sulawesi Barat Province
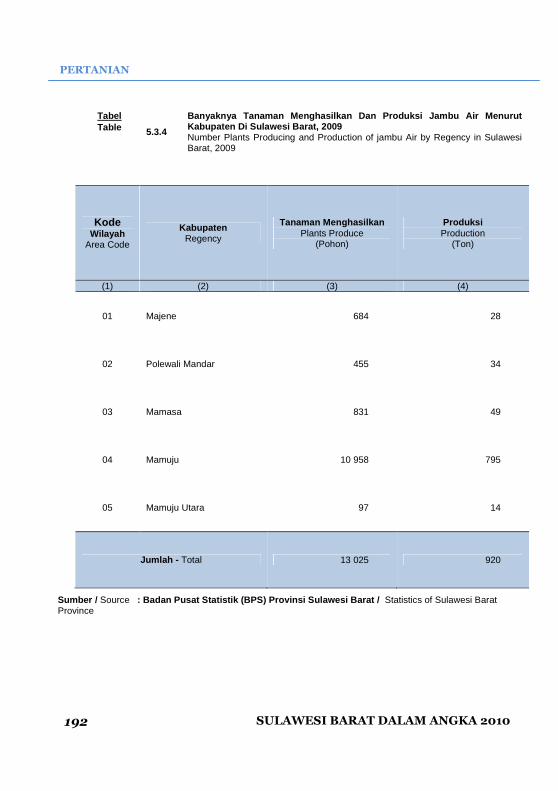
PERTANIAN
SULAWESI BARAT DALAM ANGKA 2010 192
�
Tabel
5.3.4
Banyaknya Tanaman Menghasilkan Dan Produksi Jambu A ir Menurut Kabupaten Di Sulawesi Barat, 2009 Table Number Plants Producing and Production of jambu Air by Regency in Sulawesi Barat, 2009
Kode Wilayah
Area Code
Kabupaten Regency
Tanaman Menghasilkan Plants Produce
(Pohon)
Produksi Production
(Ton)
(1) (2) (3) (4)
01 Majene 684 28
02 Polewali Mandar 455 34
03 Mamasa 831 49
04 Mamuju 10 958 795
05 Mamuju Utara 97 14
Jumlah - Total 13 025 920
Sumber / Source : Badan Pusat Statistik (BPS) Provinsi Sulawesi Bar at / Statistics of Sulawesi Barat Province
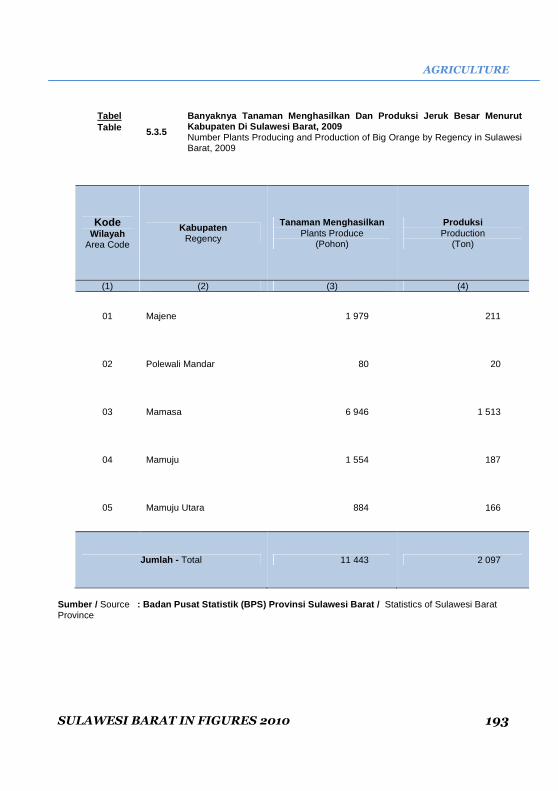
AGRICULTURE
SULAWESI BARAT IN FIGURES 2010 193
Tabel
5.3.5
Banyaknya Tanaman Menghasilkan Dan Produksi Jeruk B esar Menurut Kabupaten Di Sulawesi Barat, 2009 Table Number Plants Producing and Production of Big Orange by Regency in Sulawesi Barat, 2009
Kode Wilayah
Area Code
Kabupaten Regency
Tanaman Menghasilkan Plants Produce
(Pohon)
Produksi Production
(Ton)
(1) (2) (3) (4)
01 Majene 1 979 211
02 Polewali Mandar 80 20
03 Mamasa 6 946 1 513
04 Mamuju 1 554 187
05 Mamuju Utara 884 166
Jumlah - Total 11 443 2 097
Sumber / Source : Badan Pusat Statistik (BPS) Provinsi Sulawesi Bar at / Statistics of Sulawesi Barat Province
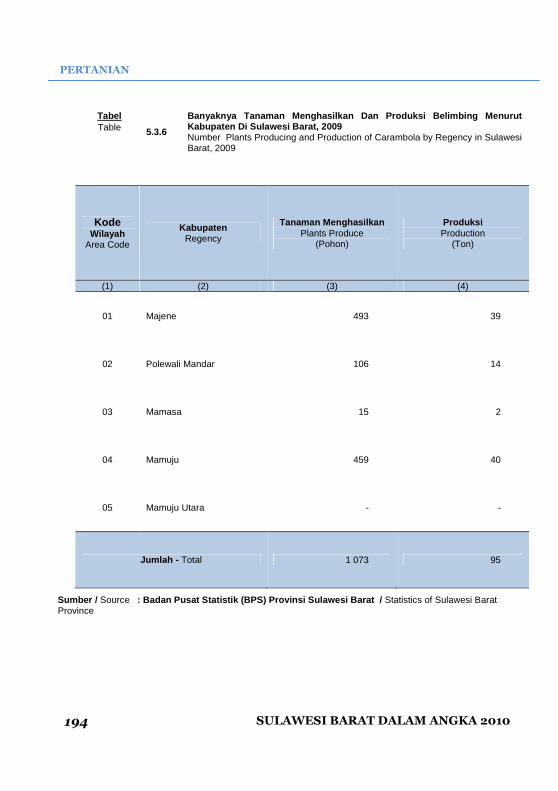
PERTANIAN
SULAWESI BARAT DALAM ANGKA 2010 194
�
Tabel
5.3.6
Banyaknya Tanaman Menghasilkan Dan Produksi Belimbi ng Menurut Kabupaten Di Sulawesi Barat, 2009 Table Number Plants Producing and Production of Carambola by Regency in Sulawesi Barat, 2009
Kode Wilayah
Area Code
Kabupaten Regency
Tanaman Menghasilkan Plants Produce
(Pohon)
Produksi Production
(Ton)
(1) (2) (3) (4)
01 Majene 493 39
02 Polewali Mandar 106 14
03 Mamasa 15 2
04 Mamuju 459 40
05 Mamuju Utara - -
Jumlah - Total 1 073 95
Sumber / Source : Badan Pusat Statistik (BPS) Provinsi Sulawesi Bar at / Statistics of Sulawesi Barat Province
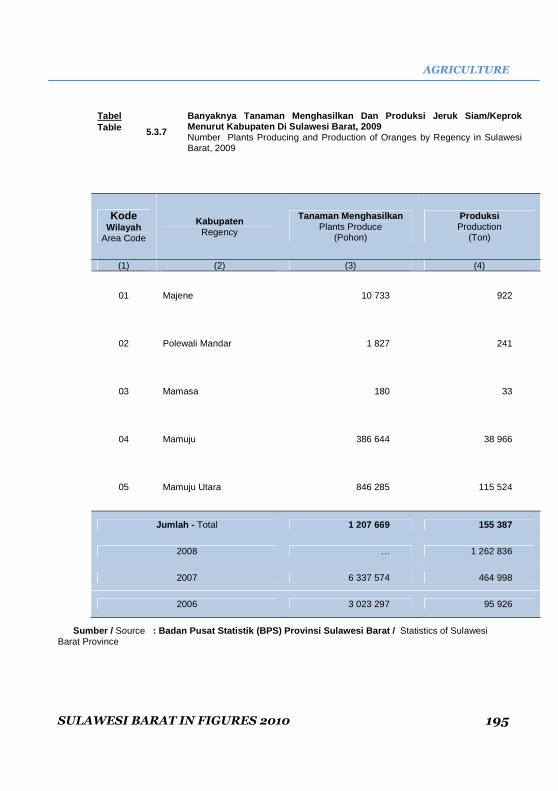
AGRICULTURE
SULAWESI BARAT IN FIGURES 2010 195
Tabel
5.3.7
Banyaknya Tanaman Menghasilkan Dan Produksi Jeruk S iam/Keprok Menurut Kabupaten Di Sulawesi Barat, 2009 Table Number Plants Producing and Production of Oranges by Regency in Sulawesi Barat, 2009
Sumber / Source : Badan Pusat Statistik (BPS) Provinsi Sulawesi Bar at / Statistics of Sulawesi Barat Province
Kode Wilayah
Area Code
Kabupaten Regency
Tanaman Menghasilkan Plants Produce
(Pohon)
Produksi Production
(Ton)
(1) (2) (3) (4)
01 Majene 10 733 922
02 Polewali Mandar 1 827 241
03 Mamasa 180 33
04 Mamuju 386 644 38 966
05 Mamuju Utara 846 285 115 524
Jumlah - Total 1 207 669 155 387
2008 … 1 262 836
2007 6 337 574 464 998
2006 3 023 297 95 926

PERTANIAN
SULAWESI BARAT DALAM ANGKA 2010 196
�
Tabel
5.3.8
Banyaknya Tanaman Menghasilkan Dan Produksi Mangga Menurut Kabupaten Di Sulawesi Barat, 2009 Table number Plants Producing and Production of Mangos by Regency in Sulawesi Barat, 2009
Sumber / Source : Badan Pusat Statistik (BPS) Provinsi Sulawesi Bar at / Statistics of Sulawesi Barat Province
Kode Wilayah
Area Code
Kabupaten Regency
Tanaman Menghasilkan Plants Produce
(Pohon))
Produksi Production
(Ton)
(1) (2) (3) (4)
01 Majene 50 110 6 617
02 Polewali Mandar 67 325 3 201
03 Mamasa 692 379
04 Mamuju 2 407 1 095
05 Mamuju Utara 936 232
Jumlah – Total 121 470 11 524
2008 45 000 76 930
2007 103 081 59 751
2006 170 465 72 914

AGRICULTURE
SULAWESI BARAT IN FIGURES 2010 197
Tabel
5.3.9
Banyaknya Tanaman Menghasilkan Dan Produksi Manggis Menurut Kabupaten Di Sulawesi Barat, 2009 Table Number Plants Producing and Production of Mangosteen by Regency in Sulawesi Barat, 2009
Kode Wilayah
Area Code
Kabupaten Regency
Tanaman Menghasilkan Plants Produce
(Pohon)
Produksi Production
(Ton)
(1) (2) (3) (4)
01 Majene - -
02 Polewali Mandar - -
03 Mamasa 4 344 787
04 Mamuju 20 8
05 Mamuju Utara … 266
Jumlah - Total 4 364 1 061
Sumber / Source : Badan Pusat Statistik (BPS) Provinsi Sulawesi Bar at / Statistics of Sulawesi Barat Province

PERTANIAN
SULAWESI BARAT DALAM ANGKA 2010 198
�
Tabel
5.3.10
Banyaknya Tanaman Menghasilkan Dan Produksi Nangka/ Cempedak Menurut Kabupaten Di Sulawesi Barat, 2009 Table Number Plants Producing and Production of Jackfruit by Regency in Sulawesi Barat, 2009
Kode Wilayah
Area Code
Kabupaten Regency
Tanaman Menghasilkan Plants Produce
(Pohon)
Produksi Production
(Ton)
(1) (2) (3) (4)
01 Majene 34 551 2 710
02 Polewali Mandar 4 600 616
03 Mamasa 6 668 1 356
04 Mamuju 6 709 1 575
05 Mamuju Utara 3 191 201
Jumlah - Total 55 722 6 458
Sumber / Source : Badan Pusat Statistik (BPS) Provinsi Sulawesi Bar at / Statistics of Sulawesi Barat Province

AGRICULTURE
SULAWESI BARAT IN FIGURES 2010 199
Tabel
5.3.11
Banyaknya Tanaman Menghasilkan Dan Produksi Salak M enurut Kabupaten Di Sulawesi Barat, 2009 Table Number Plants Peoducing and Production of Bark by Regency in Sulawesi Barat, 2009
Kode Wilayah
Area Code
Kabupaten Regency
Tanaman Menghasilkan Plants Produce
(Pohon)
Produksi Production
(Ton)
(1) (2) (3) (4)
01 Majene 1 175 7
02 Polewali Mandar 479 7
03 Mamasa 1 065 18
04 Mamuju 2 989 85
05 Mamuju Utara 200 5
Jumlah - Total 5 908 122
Sumber / Source : Badan Pusat Statistik (BPS) Provinsi Sulawesi Bar at / Statistics of Sulawesi Barat Province

PERTANIAN
SULAWESI BARAT DALAM ANGKA 2010 200
�
Tabel
5.3.12
Banyaknya Tanaman Menghasilkan Dan Produksi Sawo Me nurut Kabupaten Di Sulawesi Barat, 2009 Table Number Plants Producing and Production of Crysophyllum by Regency in Sulawesi Barat, 2009
Kode Wilayah
Area Code
Kabupaten Regency
Tanaman Menghasilkan Plants Produce
(Pohon)
Produksi Production
(Ton)
(1) (2) (3) (4)
01 Majene - -
02 Polewali Mandar 55 14
03 Mamasa … 1
04 Mamuju 152 21
05 Mamuju Utara - -
Jumlah - Total 207 36
Sumber / Source : Badan Pusat Statistik (BPS) Provinsi Sulawesi Bar at / Statistics of Sulawesi Barat Province

AGRICULTURE
SULAWESI BARAT IN FIGURES 2010 201
Tabel
5.3.13
Banyaknya Tanaman Menghasilkan Dan Produksi Markisa Menurut Kabupaten Di Sulawesi Barat, 2009 Table
Number Plants Producing and Production of Passion Fruit by Regency in Sulawesi Barat, 2009
Kode Wilayah
Area Code
Kabupaten Regency
Tanaman Menghasilkan Plants Produce
(Pohon)
Produksi Production
(Ton)
(1) (2) (3) (4)
01 Majene - -
02 Polewali Mandar - -
03 Mamasa 34 810 1 471
04 Mamuju - -
05 Mamuju Utara 280 5
Jumlah - Total 35 090 1 476
Sumber / Source : Badan Pusat Statistik (BPS) Provinsi Sulawesi Bar at / Statistics of Sulawesi Barat Province
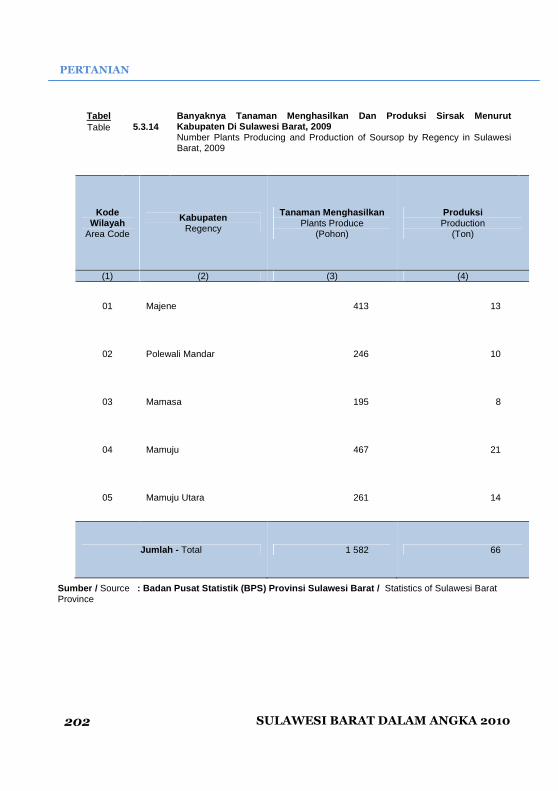
PERTANIAN
SULAWESI BARAT DALAM ANGKA 2010 202
�
Tabel 5.3.14
Banyaknya Tanaman Menghasilkan Dan Produksi Sirsak Menurut Kabupaten Di Sulawesi Barat, 2009 Table
Number Plants Producing and Production of Soursop by Regency in Sulawesi Barat, 2009
Kode Wilayah
Area Code
Kabupaten Regency
Tanaman Menghasilkan Plants Produce
(Pohon)
Produksi Production
(Ton)
(1) (2) (3) (4)
01 Majene 413 13
02 Polewali Mandar 246 10
03 Mamasa 195 8
04 Mamuju 467 21
05 Mamuju Utara 261 14
Jumlah - Total 1 582 66
Sumber / Source : Badan Pusat Statistik (BPS) Provinsi Sulawesi Bar at / Statistics of Sulawesi Barat Province

AGRICULTURE
SULAWESI BARAT IN FIGURES 2010 203
Tabel 5.3.15
Banyaknya Tanaman Menghasilkan Dan Produksi Melinjo Menurut Kabupaten Di Sulawesi Barat, 2009 Table
Number Plants Producing and Production of Melinjo by Regency in Sulawesi Barat, 2009
Kode Wilayah
Area Code
Kabupaten Regency
Tanaman Menghasilkan Plants Produce
(Pohon)
Produksi Production
(Ton)
(1) (2) (3) (4)
01 Majene - -
02 Polewali Mandar - -
03 Mamasa 79 2
04 Mamuju - -
05 Mamuju Utara - -
JUMLAH - Total 79 2
Sumber / Source : Badan Pusat Statistik (BPS) Provinsi Sulawesi Bar at / Statistics of Sulawesi Barat Province

PERTANIAN
SULAWESI BARAT DALAM ANGKA 2010 204
�
Tabel 5.3.16
Banyaknya Tanaman Menghasilkan Dan Produksi Petai M enurut Kabupaten Di Sulawesi Barat, 2009 Table
Number Plants Producing and Production of Petai by Regency in Sulawesi Barat, 2009
Kode Wilayah
Area Code
Kabupaten Regency
Tanaman Menghasilkan Plants Produce
(Pohon)
Produksi Production
(Ton)
(1) (2) (3) (4)
01 Majene - -
02 Polewali Mandar - -
03 Mamasa 78 4
04 Mamuju - -
05 Mamuju Utara - -
Jumlah - Total 78 4
Sumber / Source : Badan Pusat Statistik (BPS) Provinsi Sulawesi Bar at / Statistics of Sulawesi Barat Province

AGRICULTURE
SULAWESI BARAT IN FIGURES 2010 205
Tabel
5.3.17
Banyaknya Tanaman Menghasilkan Dan Produksi Jengkol Menurut Kabupaten Di Sulawesi Barat, 2009 Table
Number Plants Producing and Production of Jengkol by Regency in Sulawesi Barat, 2009
Kode Wilayah
Area Code
Kabupaten Regency
Tanaman Menghasilkan Plants Produce
(Pohon)
Produksi Production
(Ton)
(1) (2) (3) (4)
01 Majene - -
02 Polewali Mandar - -
03 Mamasa 37 8
04 Mamuju - -
05 Mamuju Utara - -
Jumlah - Total 37 8
Sumber / Source : Badan Pusat Statistik (BPS) Provinsi Sulawesi Bar at / Statistics of Sulawesi Barat Province

PERTANIAN
SULAWESI BARAT DALAM ANGKA 2010 206
�
Tabel 5.3.18
Banyaknya Tanaman Menghasilkan Dan Produksi Sukun M enurut Kabupaten Di Sulawesi Barat, 2009 Table
Number Plants Producing and Production of Toothless Gum by Regency in Sulawesi Barat, 2009
Kode Wilayah
Area Code
Kabupaten Regency
Tanaman Menghasilkan Plants Produce
(Pohon)
Produksi Production
(Ton)
(1) (2) (3) (4)
01 Majene 5 234 325
02 Polewali Mandar 360 57
03 Mamasa 56 6
04 Mamuju 127 69
05 Mamuju Utara 518 40
Jumlah - Total 6 295 497
Sumber / Source : Badan Pusat Statistik (BPS) Provinsi Sulawesi Bar at / Statistics of Sulawesi Barat Province

AGRICULTURE
SULAWESI BARAT IN FIGURES 2010 207
Tabel
5.3.19
Banyaknya Tanaman Menghasilkan Dan Produksi Rambuta n Menurut Kabupaten Di Sulawesi Barat, 2009 Table Number Plants Producing and Production of Rambutans by Regency in Sulawesi Barat, 2009
Sumber / Source : Badan Pusat Statistik (BPS) Provinsi Sulawesi Bar at / Statistics of Sulawesi Barat Province
Kode Wilayah
Area Code
Kabupaten Regency
Tanaman Menghasilkan Plants Produce
(Pohon))
Produksi Production
(Ton)
(1) (2) (3) (4)
01 Majene 9 552 572
02 Polewali Mandar 8 048 688
03 Mamasa 331 102
04 Mamuju 13 723 2 192
05 Mamuju Utara 8 892 1 179
Jumlah - Total 40 546 4 732
2008 15 500 85 034
2007 60 617 11 464
2006 112 722 21 609

PERTANIAN
SULAWESI BARAT DALAM ANGKA 2010 208
�
Tabel
5.3.20
Banyaknya Tanaman Menghasilkan Dan Produksi Pepaya Menurut Kabupaten Di Sulawesi Barat, 2009 Table Number Plants Producing Area and Production of Papayas by Regency in Sulawesi Barat, 2009
Sumber / Source : Badan Pusat Statistik (BPS) Provinsi Sulawesi Bar at / Statistics of Sulawesi Barat Province
Kode Wilayah
Area Code
Kabupaten Regency
Tanaman Menghasilkan Plants Produce
(Pohon)
Produksi Production
(Ton)
(1) (2) (3) (4)
01 Majene 14 249 672
02 Polewali Mandar 3 972 322
03 Mamasa 2 421 110
04 Mamuju 6 166 535
05 Mamuju Utara 368 91
Jumlah - Total 27 176 1 730
2008 5 700 3 757
2007 11 261 887
2006 18 719 1 652

AGRICULTURE
SULAWESI BARAT IN FIGURES 2010 209
Tabel
5.3.21
Banyaknya Tanaman Menghasilkan Dan Produksi Pisang Menurut Kabupaten Di Sulawesi Barat, 2009 Table Number Plants Produing and Production of Bananas by Regency in Sulawesi Barat, 2009
Sumber / Source : Badan Pusat Statistik (BPS) Provinsi Sulawesi Bar at / Statistics of Sulawesi Barat Province
Kode Wilayah
Area Code
Kabupaten Regency
Tanaman Menghasilkan Plants Produce
(Pohon)
Produksi Production
(Ton)
(1) (2) (3) (4)
01 Majene 547 492 34 947
02 Polewali Mandar 61 748 3 722
03 Mamasa 28 389 1 312
04 Mamuju 42 103 2 139
05 Mamuju Utara 21 473 753
Jumlah - Total 701 205 42 873
2008 49 500 173 784
2007 293 162 66 121,63
2006 492 058 83 274
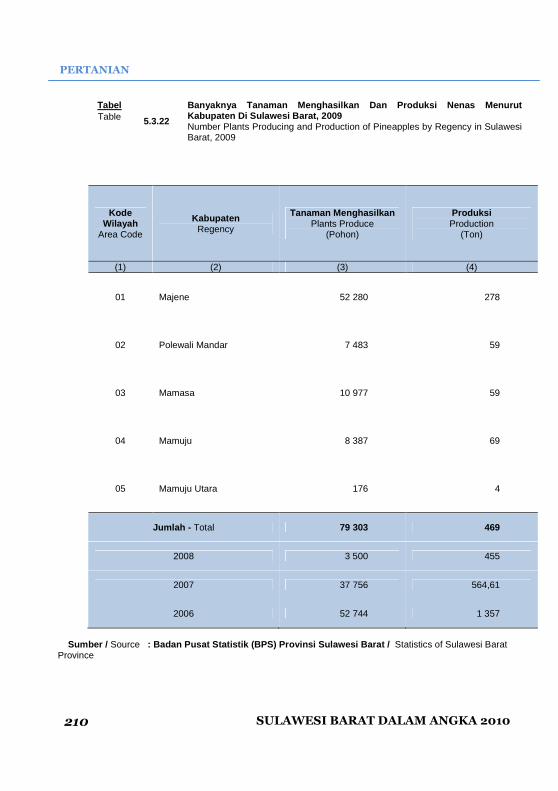
PERTANIAN
SULAWESI BARAT DALAM ANGKA 2010 210
�
Tabel
5.3.22
Banyaknya Tanaman Menghasilkan Dan Produksi Nenas M enurut Kabupaten Di Sulawesi Barat, 2009 Table Number Plants Producing and Production of Pineapples by Regency in Sulawesi Barat, 2009
Sumber / Source : Badan Pusat Statistik (BPS) Provinsi Sulawesi Bar at / Statistics of Sulawesi Barat Province
Kode Wilayah
Area Code
Kabupaten Regency
Tanaman Menghasilkan Plants Produce
(Pohon)
Produksi Production
(Ton)
(1) (2) (3) (4)
01 Majene 52 280 278
02 Polewali Mandar 7 483 59
03 Mamasa 10 977 59
04 Mamuju 8 387 69
05 Mamuju Utara 176 4
Jumlah - Total 79 303 469
2008 3 500 455
2007 37 756 564,61
2006 52 744 1 357

AGRICULTURE
SULAWESI BARAT IN FIGURES 2010 211
Tabel
5.3.23
Banyaknya Tanaman Menghasilkan Dan Produksi Langsat /Duku Menurut Kabupaten Di Sulawesi Barat, 2009 Table Number Plants Producing and Production of Lanzons by Regency in Sulawesi Barat, 2009
Sumber / Source : Badan Pusat Statistik (BPS) Provinsi Sulawesi Bar at / Statistics of Sulawesi Barat Province
Kode Wilayah
Area Code
Kabupaten Regency
Tanaman Menghasilkan Plants Produce
(Pohon)
Produksi Production
(Ton)
(1) (2) (3) (4)
01 Majene 25 726 1 150
02 Polewali Mandar 6 524 1 822
03 Mamasa 1 553 496
04 Mamuju 21 248 4 284
05 Mamuju Utara 2 024 852
Jumlah - Total 57 075 8 604
2009 75 000 87 022
2007 56 690 10 626,74
2006 165 142 24 988

PERTANIAN
SULAWESI BARAT DALAM ANGKA 2010 212
�
Tabel 5.4.1
Luas Panen Dan Produksi Jahe Menurut Kabupaten Di S ulawesi Barat, 2009 Table Harvested Area and Production of Ginger by Regency in Sulawesi Barat, 2009
Sumber / Source : Badan Pusat Statistik (BPS) Provinsi Sulawesi Bar at / Statistics of Sulawesi Barat Province
Kode WilayaH
Area Code
Kabupaten Regency
Luas Panen Harvested Area
(M²)
Produksi Production
(KG)
(1) (2) (3) (4)
01 Majene 562 3 618
02 Polewali Mandar 1 642 4 583
03 Mamasa 14 855 37 263
04 Mamuju 16 823 40 031
05 Mamuju Utara 305 773
Jumlah - Total 34 187 86 268

AGRICULTURE
SULAWESI BARAT IN FIGURES 2010 213
Tabel 5.4.2
Luas Panen Dan Produksi Laos/Lengkuas Menurut Kabup aten Di Sulawesi Barat, 2009 Table Harvested Area and Production of Galangal by Regency in Sulawesi Barat, 2009
Sumber / Source : Badan Pusat Statistik (BPS) Provinsi Sulawesi Bar at / Statistics of Sulawesi Barat Province
Kode Wilayah
Area Code
Kabupaten Regency
Luas Panen Harvested Area
(M²)
Produksi Production
(KG)
(1) (2) (3) (4)
01 Majene 983 7 690
02 Polewali Mandar 1 991 16 957
03 Mamasa 18 389 40 948
04 Mamuju 5 973 11 502
05 Mamuju Utara 205 485
Jumlah - Total 27 541 77 582

PERTANIAN
SULAWESI BARAT DALAM ANGKA 2010 214
�
Tabel 5.4.3
Luas Panen Dan Produksi Kencur Menurut Kabupaten Di Sulawesi Barat, 2009 Table Harvested Area and Production of Kencur by Regency in Sulawesi Barat, 2009
Sumber / Source : Badan Pusat Statistik (BPS) Provinsi Sulawesi Bar at / Statistics of Sulawesi Barat Province
Kode Wilayah
Area Code
Kabupaten Regency
Luas Panen Harvested Area
(M²)
Produksi Production
(KG)
(1) (2) (3) (4)
01 Majene 640 5 627
02 Polewali Mandar 766 2 327
03 Mamasa 1 170 1 420
04 Mamuju 5 745 11 151
05 Mamuju Utara - -
Jumlah - Total 8 321 20 525

AGRICULTURE
SULAWESI BARAT IN FIGURES 2010 215
Tabel
5.4.4
Luas Panen Dan Produksi Kunyit Menurut Kabupaten Di Sulawesi Barat, 2009 Table Harvested Area and Production of Turmerics by Regency in Sulawesi Barat, 2009
Sumber / Source : Badan Pusat Statistik (BPS) Provinsi Sulawesi Bar at / Statistics of Sulawesi Barat Province
Kode Wilayah
Area Code
Kabupaten Regency
Luas Panen Harvested Area
(M²)
Produksi Production
(KG)
(1) (2) (3) (4)
01 Majene 4 646 39 517
02 Polewali Mandar 4 799 13 441
03 Mamasa 8 043 18 692
04 Mamuju 6 769 8 247
05 Mamuju Utara 105 116
Jumlah - Total 24 362 80 003

PERTANIAN
SULAWESI BARAT DALAM ANGKA 2010 216
�
Tabel
5.4.5
Luas Panen Dan Produksi Lempuyang Menurut Kabupaten Di Sulawesi Barat, 2009 Table Harvested Area and Production of Zingiber Zerumbet by Regency in Sulawesi Barat, 2009
Sumber / Source : Badan Pusat Statistik (BPS) Provinsi Sulawesi Bar at / Statistics of Sulawesi Barat Province
Kode Wilayah
Area Code
Kabupaten Regency
Luas Panen Harvested Area
(M²)
Produksi Production
(KG)
(1) (2) (3) (4)
01 Majene 8 17
02 Polewali Mandar 38 120
03 Mamasa 686 889
04 Mamuju 263 1 707
05 Mamuju Utara - -
Jumlah - Total 995 2 733

AGRICULTURE
SULAWESI BARAT IN FIGURES 2010 217
Tabel
5.4.6
Luas Panen Dan Produksi Temulawak Menurut Kabupaten Di Sulawesi Barat, 2009 Table Harvested Area and Production of Curcuma by Regency in Sulawesi Barat, 2009
Sumber / Source : Badan Pusat Statistik (BPS) Provinsi Sulawesi Bar at / Statistics of Sulawesi Barat Province
Kode Wilayah
Area Code
Kabupaten Regency
Luas Panen Harvested Area
(M²)
Produksi Production
(KG)
(1) (2) (3) (4)
01 Majene 32 203
02 Polewali Mandar 45 109
03 Mamasa 1 290 3 878
04 Mamuju 5 029 6 210
05 Mamuju Utara 2 6
Jumlah - Total 6 398 10 406

PERTANIAN
SULAWESI BARAT DALAM ANGKA 2010 218
�
Tabel
5.4.7
Luas Panen Dan Produksi Temuireng Menurut Kabupaten Di Sulawesi Barat, 2009 Table Harvested Area and Production of Temuireng by Regency in Sulawesi Barat, 2009
Sumber / Source : Badan Pusat Statistik (BPS) Provinsi Sulawesi Bar at / Statistics of Sulawesi Barat Province
Kode Wilayah
Area Code
Kabupaten Regency
Luas Panen Harvested Area
(M²)
Produksi Production
(KG)
(1) (2) (3) (4)
01 Majene - -
02 Polewali Mandar 2 6
03 Mamasa 5 6
04 Mamuju 1 58 906
05 Mamuju Utara - -
Jumlah - Total 165 918

AGRICULTURE
SULAWESI BARAT IN FIGURES 2010 219
Tabel
5.4.8
Luas Panen Dan Produksi Temukunci Menurut Kabupaten Di Sulawesi Barat, 2009 Table Harvested Area and Production of Temukunci by Regency in Sulawesi Barat, 2009
Sumber / Source : Badan Pusat Statistik (BPS) Provinsi Sulawesi Bar at / Statistics of Sulawesi Barat Province
Kode Wilayah
Area Code
Kabupaten Regency
Luas Panen Harvested Area
(M²)
Produksi Production
(KG)
(1) (2) (3) (4)
01 Majene - -
02 Polewali Mandar 2 2
03 Mamasa 75 150
04 Mamuju 19 31
05 Mamuju Utara - -
Jumlah - Total 94 181

PERTANIAN
SULAWESI BARAT DALAM ANGKA 2010 220
�
Tabel 5.4.9
Luas Panen Dan Produksi Kapulaga Menurut Kabupaten Di Sulawesi Barat, 2009 Table Harvested Area and Production of Kapulaga by Regency in Sulawesi Barat, 2009
Sumber / Source : Badan Pusat Statistik (BPS) Provinsi Sulawesi Bar at / Statistics of Sulawesi Barat Province
Kode Wilayah
Area Code
Kabupaten Regency
Luas Panen Harvested Area
(M²)
Produksi Production
(KG)
(1) (2) (3) (4)
01 Majene - -
02 Polewali Mandar - -
03 Mamasa 85 85
04 Mamuju 88 215
05 Mamuju Utara - -
Jumlah - Total 173 300
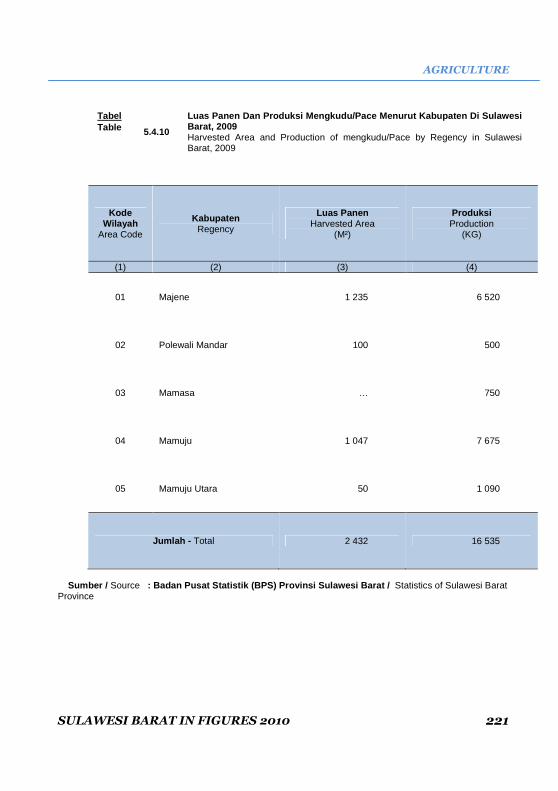
AGRICULTURE
SULAWESI BARAT IN FIGURES 2010 221
Tabel
5.4.10
Luas Panen Dan Produksi Mengkudu/Pace Menurut Kabup aten Di Sulawesi Barat, 2009 Table Harvested Area and Production of mengkudu/Pace by Regency in Sulawesi Barat, 2009
Sumber / Source : Badan Pusat Statistik (BPS) Provinsi Sulawesi Bar at / Statistics of Sulawesi Barat Province
Kode Wilayah
Area Code
Kabupaten Regency
Luas Panen Harvested Area
(M²)
Produksi Production
(KG)
(1) (2) (3) (4)
01 Majene 1 235 6 520
02 Polewali Mandar 100 500
03 Mamasa … 750
04 Mamuju 1 047 7 675
05 Mamuju Utara 50 1 090
Jumlah - Total 2 432 16 535

PERTANIAN
SULAWESI BARAT DALAM ANGKA 2010 222
�
Tabel
5.4.11
Luas Panen Dan Produksi Mahkota Dewa Menurut Kabupa ten Di Sulawesi Barat, 2009 Table Harvested Area and Production of Mahkota Dewa by Regency in Sulawesi Barat, 2009
Sumber / Source : Badan Pusat Statistik (BPS) Provinsi Sulawesi Bar at / Statistics of Sulawesi Barat Province
Kode Wilayah
Area Code
Kabupaten Regency
Luas Panen Harvested Area
(M²)
Produksi Production
(KG)
(1) (2) (3) (4)
01 Majene - -
02 Polewali Mandar - -
03 Mamasa … 800
04 Mamuju 3 60 140
05 Mamuju Utara - -
Jumlah - Total 3 60 940

AGRICULTURE
SULAWESI BARAT IN FIGURES 2010 223
Tabel
5.4.12
Luas Panen Dan Produksi Keji Beling Menurut Kabupat en Di Sulawesi Barat, 2009 Table Harvested Area and Production of Keji Beling by Regency in Sulawesi Barat, 2009
Sumber / Source : Badan Pusat Statistik (BPS) Provinsi Sulawesi Bar at / Statistics of Sulawesi Barat Province
Kode Wilayah
Area Code
Kabupaten Regency
Luas Panen Harvested Area
(M²)
Produksi Production
(KG)
(1) (2) (3) (4)
01 Majene 1 9
02 Polewali Mandar 1 1
03 Mamasa 425 425
04 Mamuju 25 95
05 Mamuju Utara - -
Jumlah - Total 450 530

PERTANIAN
SULAWESI BARAT DALAM ANGKA 2010 224
�
Tabel
5.4.13
Luas Panen Dan Produksi Sambiloto Menurut Kabupaten Di Sulawesi Barat, 2009 Table Harvested Area and Production of Paniculata by Regency in Sulawesi Barat, 2009
Sumber / Source : Badan Pusat Statistik (BPS) Provinsi Sulawesi Bar at / Statistics of Sulawesi Barat Province
Kode Wilayah
Area Code
Kabupaten Regency
Luas Panen Harvested Area
(M²)
Produksi Production
(KG)
(1) (2) (3) (4)
01 Majene 136 694
02 Polewali Mandar 57 113
03 Mamasa 565 2 565
04 Mamuju 115 578
05 Mamuju Utara - -
Jumlah - Total 873 3 950

AGRICULTURE
SULAWESI BARAT IN FIGURES 2010 225
Tabel
5.4.14
Luas Panen Dan Produksi Lidah Buaya Menurut Kabupat en Di Sulawesi Barat, 2009 Table Harvested Area and Production of Aloe Vera by Regency in Sulawesi Barat, 2009
Sumber / Source : Badan Pusat Statistik (BPS) Provinsi Sulawesi Bar at / Statistics of Sulawesi Barat Province
Kode Wilayah
Area Code
Kabupaten Regency
Luas Panen Harvested Area
(M²)
Produksi Production
(KG)
(1) (2) (3) (4)
01 Majene 2 23
02 Polewali Mandar - -
03 Mamasa 11 151
04 Mamuju 20 156
05 Mamuju Utara - -
Jumlah - Total 33 330

PERTANIAN
SULAWESI BARAT DALAM ANGKA 2010 226
�
Tabel 5.5.1
Luas Panen Dan Produksi Anggrek Menurut Kabupaten D i Sulawesi Barat, 2009 Table Harvested Area and Production of Orchid by Regency in Sulawesi Barat, 2009
Sumber / Source : Badan Pusat Statistik (BPS) Provinsi Sulawesi Bar at / Statistics of Sulawesi Barat Province
Kode Wilayah
Area Code
Kabupaten Regency
Luas Panen Harvested Area
(M²)
Produksi Production (Tangkai)
(1) (2) (3) (4)
01 Majene 20 132
02 Polewali Mandar 99 352
03 Mamasa 257 797
04 Mamuju 3 089 19 392
05 Mamuju Utara - -
Jumlah - Total 3 465 20 673
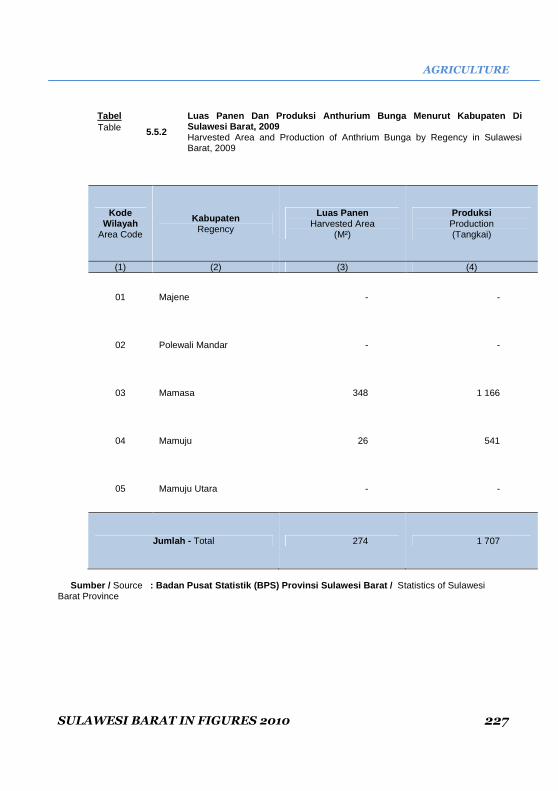
AGRICULTURE
SULAWESI BARAT IN FIGURES 2010 227
Tabel
5.5.2
Luas Panen Dan Produksi Anthurium Bunga Menurut Kab upaten Di Sulawesi Barat, 2009 Table Harvested Area and Production of Anthrium Bunga by Regency in Sulawesi Barat, 2009
Sumber / Source : Badan Pusat Statistik (BPS) Provinsi Sulawesi Bar at / Statistics of Sulawesi Barat Province
Kode Wilayah
Area Code
Kabupaten Regency
Luas Panen Harvested Area
(M²)
Produksi Production (Tangkai)
(1) (2) (3) (4)
01 Majene - -
02 Polewali Mandar - -
03 Mamasa 348 1 166
04 Mamuju 26 541
05 Mamuju Utara - -
Jumlah - Total 274 1 707

PERTANIAN
SULAWESI BARAT DALAM ANGKA 2010 228
�
Tabel 5.5.3
Luas Panen Dan Produksi Gladiol Menurut Kabupaten D i Sulawesi Barat, 2009 Table Harvested Area and Production of Gladiol by Regency in Sulawesi Barat, 2009
Sumber / Source : Badan Pusat Statistik (BPS) Provinsi Sulawesi Bar at / Statistics of Sulawesi Barat Province
Kode Wilayah
Area Code
Kabupaten Regency
Luas Panen Harvested Area
(M²)
Produksi Production (Tangkai)
(1) (2) (3) (4)
01 Majene - -
02 Polewali Mandar - -
03 Mamasa 15 15
04 Mamuju 600 2 295
05 Mamuju Utara - -
Jumlah - Total 615 2 310

AGRICULTURE
SULAWESI BARAT IN FIGURES 2010 229
Tabel
5.5.4
Luas Panen Dan Produksi Heliconia (Pisang-Pisangan) Menurut Kabupaten Di Sulawesi Barat, 2009 Table Harvested Area and Production of Helicomia by Regency in Sulawesi Barat, 2009
Sumber / Source : Badan Pusat Statistik (BPS) Provinsi Sulawesi Bar at / Statistics of Sulawesi Barat Province
Kode Wilayah
Area Code
Kabupaten Regency
Luas Panen Harvested Area
(M²)
Produksi Production (Tangkai)
(1) (2) (3) (4)
01 Majene 17 142
02 Polewali Mandar 10 10
03 Mamasa 381 916
04 Mamuju 71 1 383
05 Mamuju Utara - -
Jumlah - Total 479 2 451

PERTANIAN
SULAWESI BARAT DALAM ANGKA 2010 230
�
Tabel 5.5.5
Luas Panen Dan Produksi Mawar Menurut Kabupaten Di Sulawesi Barat, 2009 Table
Harvested Area and Production of Rose by Regency in Sulawesi Barat, 2009
Sumber / Source : Badan Pusat Statistik (BPS) Provinsi Sulawesi Bar at / Statistics of Sulawesi Barat Province
Kode Wilayah
Area Code
Kabupaten Regency
Luas Panen Harvested Area
(M²)
Produksi Production (Tangkai)
(1) (2) (3) (4)
01 Majene 6 127
02 Polewali Mandar 9 9
03 Mamasa 113 726
04 Mamuju 294 1 294
05 Mamuju Utara - -
Jumlah - Total 422 2 156

AGRICULTURE
SULAWESI BARAT IN FIGURES 2010 231
Tabel 5.5.6
Luas Panen Dan Produksi Melati Menurut Kabupaten Di Sulawesi Barat, 2009 Table Harvested Area and Production of Jasmine by Regency in Sulawesi Barat, 2009
Sumber / Source : Badan Pusat Statistik (BPS) Provinsi Sulawesi Bar at / Statistics of Sulawesi Barat Province
Kode Wilayah
Area Code
Kabupaten Regency
Luas Panen Harvested Area
(M²)
Produksi Production
(KG)
(1) (2) (3) (4)
01 Majene 5 181
02 Polewali Mandar 15 47
03 Mamasa 27 1 927
04 Mamuju 17 487
05 Mamuju Utara - -
Jumlah - Total 57 2 642

PERTANIAN
SULAWESI BARAT DALAM ANGKA 2010 232
�
Tabel 5.5.7
Luas Panen Dan Produksi Palem Menurut Kabupaten Di Sulawesi Barat, 2009 Table Harvested Area and Production of Palm by Regency in Sulawesi Barat, 2009
Sumber / Source : Badan Pusat Statistik (BPS) Provinsi Sulawesi Bar at / Statistics of Sulawesi Barat Province
Kode Wilayah
Area Code
Kabupaten Regency
Luas Panen Harvested Area
(M²)
Produksi Production
(Pohon)
(1) (2) (3) (4)
01 Majene - -
02 Polewali Mandar 27 180
03 Mamasa 100 510
04 Mamuju 528 1 055
05 Mamuju Utara - -
Jumlah - Total 655 1 745
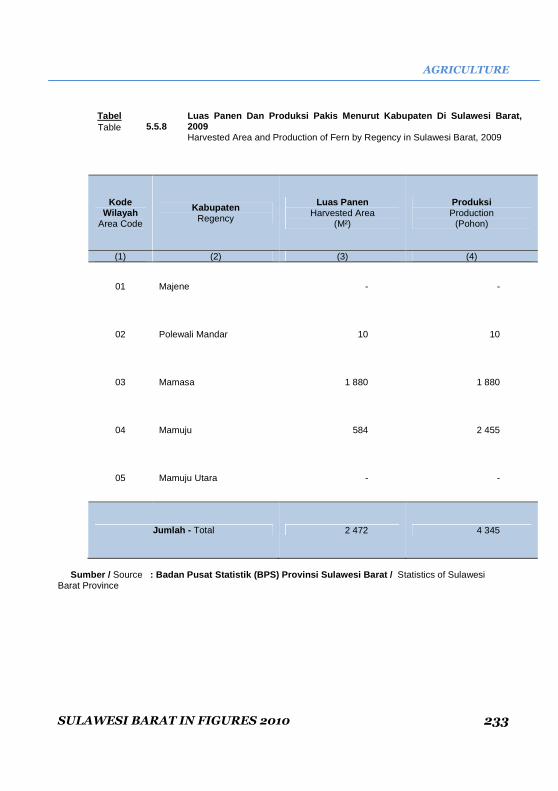
AGRICULTURE
SULAWESI BARAT IN FIGURES 2010 233
Tabel 5.5.8
Luas Panen Dan Produksi Pakis Menurut Kabupaten Di Sulawesi Barat, 2009 Table Harvested Area and Production of Fern by Regency in Sulawesi Barat, 2009
Sumber / Source : Badan Pusat Statistik (BPS) Provinsi Sulawesi Bar at / Statistics of Sulawesi Barat Province
Kode Wilayah
Area Code
Kabupaten Regency
Luas Panen Harvested Area
(M²)
Produksi Production
(Pohon)
(1) (2) (3) (4)
01 Majene - -
02 Polewali Mandar 10 10
03 Mamasa 1 880 1 880
04 Mamuju 584 2 455
05 Mamuju Utara - -
Jumlah - Total 2 472 4 345

PERTANIAN
SULAWESI BARAT DALAM ANGKA 2010 234
�
Tabel 5.6.1
Luas Kawasan Hutan Berdasarkan Fungsi Di Sulawesi B arat (Dalam Ha), 2009 Table Area of Forestry by Function in Sulawesi Barat ( In Hectare,) 2009
Kabupaten Regency
Hutan Lindung Protected
Forest
Hutan produksi Terbatas
Limited Production Forest
Hutan produksi Biasa
Ordinary Production Forest
(1)
(2)
(3)
(4)
01 Majene 51 117
7 772 -
02 Polewali Mandar 77 550 43 040 -
03 Mamasa 104 090 12 225 -
04 Mamuju 340 225 201 043 59 249
05 Mamuju Utara 96 376 57 527 2 051
Jumlah - Total 666 358 321 527 61 300
2008 707 485 431 083 66 502
2007 707 485 431 083 66 502
2006 716 702 464 443 66 502
Sumber / Source : Dinas Kehutanan Provinsi Sulawesi Barat / Forestry Service at Sulawesi Barat Province
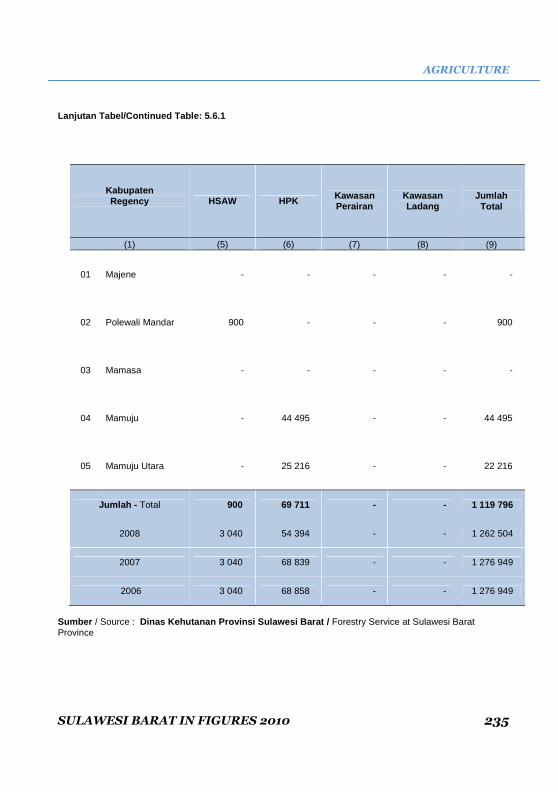
AGRICULTURE
SULAWESI BARAT IN FIGURES 2010 235
Lanjutan Tabel/ Continued Table: 5.6.1
Kabupaten Regency
HSAW HPK Kawasan
Perairan Kawasan Ladang
Jumlah Total
(1)
(5)
(6)
(7)
(8)
(9)
01 Majene - - - - -
02 Polewali Mandar 900 - - - 900
03 Mamasa - - - - -
04 Mamuju - 44 495 - - 44 495
05 Mamuju Utara - 25 216 - - 22 216
Jumlah - Total 900 69 711 - - 1 119 796
2008 3 040 54 394 - - 1 262 504
2007 3 040 68 839 - - 1 276 949
2006 3 040 68 858 - - 1 276 949
Sumber / Source : Dinas Kehutanan Provinsi Sulawesi Barat / Forestry Service at Sulawesi Barat Province

PERTANIAN
SULAWESI BARAT DALAM ANGKA 2010 236
�
Tabel
5.6.2 Produksi Hasil Hutan Kayu Dan Non Kayu Di Sulawes i Barat (Dalam) 2009
Table Production of Timber and Non Timber in Sulawesi Barat (In Meter Cubic) 2098
Kabupaten Regency
Kayu Timber
Non Kayu Non Timber
(ton)
Dari HPH Di Luar HPH Jumlah Rotan Damar Getah
Pinus Jumlah
(1) (2) (3) (4) (5) (6) (7) (8)
01 Majene - - - - - -
02 Polewali Mandar - 314 314 2 327 - - 2 327
03 Mamasa - - - - - - -
04 Mamuju - 5 952 5 952 754 - - 754
05 Mamuju Utara - 4 543 4 543 - - - -
Jumlah - Total - 10 809 10 809 3 081 - - 3 081
2008 * 1 156 11 175 1 970 - - 1 970
2007 16 040 - 50 574 2 836 - - 2 836
2006 15 250 4 625 49 907 4 143 - - 4 143
Sumber / Source : Dinas Kehutanan Provinsi Sulawesi Barat / Forestry Service at Sulawesi Barat Province

AGRICULTURE
SULAWESI BARAT IN FIGURES 2010 237
Tabel
5.6.3
Produksi Hasil Hutan Kayu Dan Non Kayu Di Sulawes i Barat (Dalam M 3 ) 2008-2009 Table Production of Timber and Non Timber in Sulawesi Barat (In Meter Cubic) 2008-2009
Komoditi – Commodity Satuan Unit
2008 2009
(1)
(2)
(3) (4)
I. Produksi Kayu – Production of Timber M3 11 175 10 809
1. Dari Hak Penguasaan Hutan Ffrom Forest Consession Rights M3 - -
2. Non Hak Penguasaan Hutan From Non Forest Consession Rights M3 - 10 809
II. Produksi Non Kayu - Non Timber Productions Ton 1 970 3 081
1. Rotan – Rattan Ton 1 970 3 081
2 . Damar/Kopal – Resin Ton - -
3. Kayu Gaharu- Aloes Wood Ton - -
4. Getah Pinus-Pine Resin Ton - -
Sumber / Source : Dinas Kehutanan Provinsi Sulawesi Barat / Forestry Service at Sulawesi Barat Province

PERTANIAN
SULAWESI BARAT DALAM ANGKA 2010 238
�
Tabel
5.7.1
Banyaknya Perusahaan Perkebunan, Luas Lahan, Luas T anaman, Jenis Tanaman Yang Diusahakan Dan Luas Panen Di Provinsi Sulawesi Barat, 2009
Table
Number Of Companies Plantation, Land Area, Area Of Plant, The Plant Species And Area Endeavored Harvest In Sulawesi Barat Province, 2009
Lokasi Location
Banyaknya Perusahaan Number of
Establishment
Luas Lahan Land of Area
(Ha)
Luas Tanaman Planted
Area (Ha)
Jenis Tanaman
Kind of Crops
Luas Panen Harvested
Area (Ha)
(1)
(2)
(3)
(4)
(5)
(6)
Majene - - - - -
Polewali Mandar … … … … …
Mamasa … … … … …
Mamuju 3 - 12 699 - -
Mamuju Utara … … … … …
Jumlah - Total 3 …. 12 699 … …
Sumber / Source : Buku Daerah Dalam Angka Se Provinsi Sulawesi Bara t / Cited from each Regency in Figures in Sulawesi Barat Province

AGRICULTURE
SULAWESI BARAT IN FIGURES 2010 239
Tabel
5.7.2
Luas Panen Dan Produksi Kelapa Dalam Menurut Kabup aten Di Sulawesi Barat, 2009 Table Harvested Area and Production of Tall Coconut by Regency in Sulawesi Barat, 2009
Kode Wilayah
Area Code
Kabupaten Regency
Luas Panen Harvested Area
(Ha)
Produksi Production
(Ton)
(1) (2) (3) (4)
01 Majene 9 118 9 532
02 Polewali Mandar 22 501 18 934
03 Mamasa 75,5 15,96
04 Mamuju 7 376 6 966,65
05 Mamuju Utara … …
Jumlah - Total 39 070,5 35 448,61
2008 37 305 52 673
2007 50 026 59 379
2006 57 562 49 395
Sumber / Source : Buku Daerah Dalam Angka Se Provinsi Sulawesi Bara t / Cited from each Regency in Figures in Sulawesi Barat Province

PERTANIAN
SULAWESI BARAT DALAM ANGKA 2010 240
�
Tabel
5.7.3
Luas Panen Dan Produksi Kelapa Hibrida Menurut Kabu paten Di Sulawesi Barat, 2009 Table Harvested Area and Production of Hybrida Coconut by Regency in Sulawesi Barat, 2009
Sumber / Source : Buku Daerah Dalam Angka Se Provinsi Sulawesi Bara t / Cited from each Regency in Figures in Sulawesi Barat Province
Kode Wilayah
Area Code
Kabupaten Regency
Luas Panen Harvested Area
(Ha)
Produksi Production
(Ton)
(1) (2) (3) (4)
01 Majene 1 026 1 030
02 Polewali Mandar 3 789 2 267
03 Mamasa … …
04 Mamuju 1 473 508
05 Mamuju Utara … …
Jumlah - Total 6 288 3 805
2008 4 852 4 160
2007 4 951 5 114
2006 5 611 5 189

AGRICULTURE
SULAWESI BARAT IN FIGURES 2010 241
Tabel
5.7.4
Luas Panen Dan Produksi Kelapa Sawit Menurut Kabupa ten Di Sulawesi Barat, 2009 Table Harvested Area and Production of Coconut Palm by Regency in Sulawesi Barat, 2009
Sumber / Source : Buku Daerah Dalam Angka Se Provinsi Sulawesi Bara t / Cited from each Regency in Figures in Sulawesi Barat Province
Kode Wilayah
Area Code
Kabupaten Regency
Luas Panen Harvested Area
(Ha)
Produksi Production
(Ton)
(1) (2) (3) (4)
01 Majene - -
02 Polewali Mandar - -
03 Mamasa - -
04 Mamuju 6 365 6 533,54
05 Mamuju Utara … …
Jumlah - Total 6 365 6 533,54
2008 7 018 2 700
2007 57 527 163 715
2006 16 736 259 787

PERTANIAN
SULAWESI BARAT DALAM ANGKA 2010 242
�
Tabel 5.7.5
Luas Panen Dan Produksi Kakao Menurut Kabupaten Di Sulawesi Barat, 2009 Table Harvested Area and Production of Cocoa by Regency in Sulawesi Barat, 2009
Sumber / Source : Buku Daerah Dalam Angka Se Provinsi Sulawesi Bara t / Cited from each Regency in Figures in Sulawesi Barat Province
Kode Wilayah
Area Code
Kabupaten Regency
Luas Panen Harvested Area
(Ha)
Produksi Production
(Ton)
(1) (2) (3) (4)
01 Majene 11 101 6 312
02 Polewali Mandar 47 722 22 823
03 Mamasa 13 427 6 526
04 Mamuju … …
05 Mamuju Utara … …
Jumlah - Total 72 250 38 661
2008 122 598 46 258
2007 146 905 77 545
2006 144 255 106 361
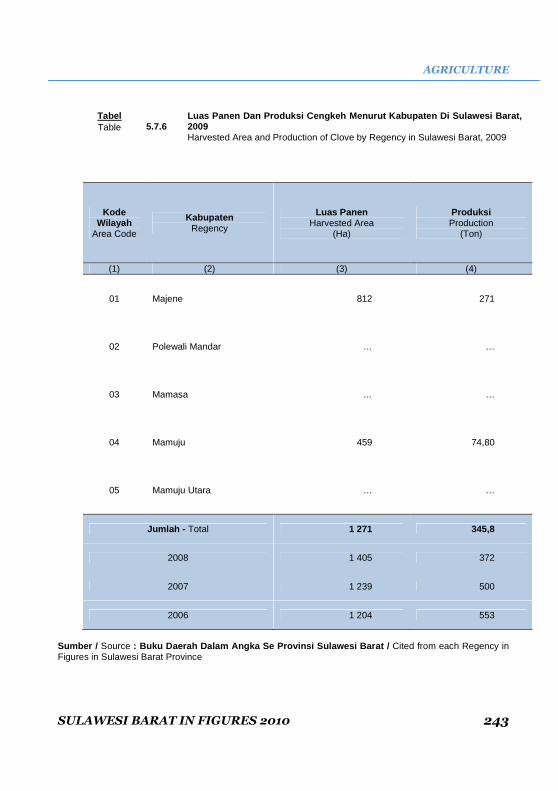
AGRICULTURE
SULAWESI BARAT IN FIGURES 2010 243
Tabel 5.7.6
Luas Panen Dan Produksi Cengkeh Menurut Kabupaten D i Sulawesi Barat, 2009 Table Harvested Area and Production of Clove by Regency in Sulawesi Barat, 2009
Sumber / Source : Buku Daerah Dalam Angka Se Provinsi Sulawesi Bara t / Cited from each Regency in Figures in Sulawesi Barat Province
Kode Wilayah
Area Code
Kabupaten Regency
Luas Panen Harvested Area
(Ha)
Produksi Production
(Ton)
(1) (2) (3) (4)
01 Majene 812 271
02 Polewali Mandar … …
03 Mamasa … …
04 Mamuju 459 74,80
05 Mamuju Utara … …
Jumlah - Total 1 271 345,8
2008 1 405 372
2007 1 239 500
2006 1 204 553

PERTANIAN
SULAWESI BARAT DALAM ANGKA 2010 244
�
Tabel 5.7.7
Luas Panen Dan Produksi Sagu Menurut Kabupaten Di S ulawesi Barat, 2009 Table Harvested Area and Production of Sago by Regency in Sulawesi Barat, 2009
Sumber / Source : Buku Daerah Dalam Angka Se Provinsi Sulawesi Bara t / Cited from each Regency in Figures in Sulawesi Barat Province
Kode Wilayah
Area Code
Kabupaten Regency
Luas Panen Harvested Area
(Ha)
Produksi Production
(Ton)
(1) (2) (3) (4)
01 Majene 192 57
02 Polewali Mandar - -
03 Mamasa - -
04 Mamuju 830 44,5
05 Mamuju Utara … …
Jumlah - Total 1 122 102,5
2008 1 344 152
2007 1 565 777
2006 1180 529

AGRICULTURE
SULAWESI BARAT IN FIGURES 2010 245
Tabel
5.7.8
Luas Panen Dan Produksi Aren/Enau Menurut Kabupaten Di Sulawesi Barat, 2009 Table Harvested Area and Production of Sugar Palm by Regency in Sulawesi Barat, 2009
Sumber / Source : Buku Daerah Dalam Angka Se Provinsi Sulawesi Bara t / Cited from each Regency in Figures in Sulawesi Barat Province
Kode Wilayah
Area Code
Kabupaten Regency
Luas Panen Harvested Area
(Ha)
produksi Production
(Ton)
(1) (2) (3) (4)
01 Majene 176 39
02 Polewali Mandar - -
03 Mamasa - -
04 Mamuju … …
05 Mamuju Utara 7 2
Jumlah - Total 183 41
2008 758 305
2007 1 323 771
2006 1 112 648

PERTANIAN
SULAWESI BARAT DALAM ANGKA 2010 246
�
Tabel
5.7.9
Luas Panen Dan Produksi Kemiri Menurut Kabupaten Di Sulawesi Barat, 2009 Table Harvested Area and Production of Candienut by Regency in Sulawesi Barat, 2009
Sumber / Source : Buku Daerah Dalam Angka Se Provinsi Sulawesi Bara t / Cited from each Regency in Figures in Sulawesi Barat Province
Kode Wilayah
Area Code
Kabupaten Regency
Luas Panen Harvested Area
(Ha)
Produksi Production
(Ton)
(1) (2) (3) (4)
01 Majene 2 745 1 928
02 Polewali Mandar 3 431 1 018
03 Mamasa - -
04 Mamuju 1 879 615,3
05 Mamuju Utara … …
Jumlah - Total 8 055 3 561,3
2008 6 436 2 829
2007 6 854 4 117
2006 6 405 4 084

AGRICULTURE
SULAWESI BARAT IN FIGURES 2010 247
Tabel 5.7.10
Luas Panen Dan Produksi Vanili Menurut Kabupaten Di Sulawesi Barat, 2009 Table Harvested Area and Production of Vanili by Regency in Sulawesi Barat, 2009
Kode Wilayah
Area Code
Kabupaten Regency
Luas Panen Harvested Area
(Ha)
Produksi Production
(Ton)
(1) (2) (3) (4)
01 Majene 611 55
02 Polewali Mandar - -
03 Mamasa - -
04 Mamuju 88 0,18
05 Mamuju Utara … …
Jumlah - Total 699 55,18
2008 912 77,90
2007 1 234 91,84
2006 1 234 318
Sumber / Source : Buku Daerah Dalam Angka Se Provinsi Sulawesi Bara t / Cited from each Regency in Figures in Sulawesi Barat Province

PERTANIAN
SULAWESI BARAT DALAM ANGKA 2010 248
�
Tabel 5.8.11
Luas Panen Dan Produksi Lada Menurut Kabupaten Di S ulawesi Barat, 2009 Table Harvested Area and Production of Pepper by Regency in Sulawesi Barat, 2009
Sumber / Source : Buku Daerah Dalam Angka Se Provinsi Sulawesi Bara t / Cited from each Regency in Figures in Sulawesi Barat Province
Kode Wilayah
Area Code
Kabupaten Regency
Luas Panen Harvested Area
(Ha)
Produksi Production
(Ton)
(1) (2) (3) (4)
01 Majene 20 7
02 Polewali Mandar 254 25
03 Mamasa … …-
04 Mamuju 91 6,55
05 Mamuju Utara … …
Jumlah - Total 365 38,55
2008 470 42,31
2007 516 43,82
2006 445 31
AGRICULTURE
SULAWESI BARAT IN FIGURES 2010 249
Tabel
6.7.12
Luas Panen Dan Produksi Jambu Mete Menurut Kabupate n Di Sulawesi Barat, 2009 Table Harvested Area and Production of Cashew Nut by Regency in Sulawesi Barat, 2009
Sumber / Source : Buku Daerah Dalam Angka Se Provinsi Sulawesi Bara t / Cited from each Regency in Figures in Sulawesi Barat Province
Kode Wilayah
Area Code
Kabupaten Regency
Luas Panen Harvested Area
(Ha)
Produksi Production
(Ton)
(1) (2) (3) (4)
01 Majene 865 216
02 Polewali Mandar - -
03 Mamasa - -
04 Mamuju 9 …
05 Mamuju Utara
Jumlah - Total 874 216
2008 1 359,5 253,32
2007 1 696,6 355,31
2006 1 620 304

PERTANIAN
SULAWESI BARAT DALAM ANGKA 2010 250
�
Tabel 5.7.13
Luas Panen Dan Produksi Kapuk Menurut Kabupaten Di Sulawesi Barat, 2009 Table Harvested Area and Production of Kapok by Regency in Sulawesi Barat, 2009
Kode Wilayah
Area Code
Kabupaten Regency
Luas Panen Harvested Area
(Ha)
Produksi Production
(Ton)
(1) (2) (3) (4)
01 Majene 264 47
02 Polewali Mandar - -
03 Mamasa - -
04 Mamuju 61 37,05
05 Mamuju Utara
Jumlah - Total 325 84,05
2008 626 84,20
2007 601 73,96
2006 622 110
Sumber / Source : Buku Daerah Dalam Angka Se Provinsi Sulawesi Bara t / Cited from each Regency in Figures in Sulawesi Barat Province

AGRICULTURE
SULAWESI BARAT IN FIGURES 2010 251
Tabel
5.7.14
Luas Panen Dan Produksi Kopi Robusta Menurut Kabupa ten Di Sulawesi Barat, 2009 Table Harvested Area and Production of Robusta Coffee by Regency in Sulawesi Barat, 2009
Sumber / Source : Buku Daerah Dalam Angka Se Provinsi Sulawesi Bara t / Cited from each Regency in Figures in Sulawesi Barat Province
Kode Wilayah
Area Code
Kabupaten Regency
Luas Panen Harvested Area
(Ha)
Produksi Production
(Ton)
(1) (2) (3) (4)
01 Majene 824 230
02 Polewali Mandar 1 766 208
03 Mamasa 6 987 4 285
04 Mamuju 765 250,75
05 Mamuju Utara … …
Jumlah - Total 10 342 4 973,75
2008 8 612,05 6 925,66
2007 6 029,40 6 740,79
2006 10 154 5 534
PERTANIAN
SULAWESI BARAT DALAM ANGKA 2010 252
�
Tabel
5.7.15
Luas Panen Dan Produksi Kopi Arabika Menurut Kabupa ten Di Sulawesi Barat, 2009 Table Harvested Area and Production of Arabica Coffee by Regency in Sulawesi Barat, 2009
Sumber / Source : Buku Daerah Dalam Angka Se Provinsi Sulawesi Bara t / Cited from each Regency in Figures in Sulawesi Barat Province
Kode Wilayah
Area Code
Kabupaten Regency
Luas Panen Harvested Area
(Ha)
Produksi Production
(Ton)
(1) (2) (3) (4)
01 Majene 368 47
02 Polewali Mandar 241 57
03 Mamasa 6 025 3 162
04 Mamuju 281 59
05 Mamuju Utara … …
Jumlah - Total 6 915 3 325
2008 5 694,1 3 936,24
2007 5 791,1 3 673,18
2006 7 354 3 356

AGRICULTURE
SULAWESI BARAT IN FIGURES 2010 253
Tabel 5.8.1
Populasi Ternak Besar Menurut Jenis Ternak Dan Kabu paten Di Sulawesi Barat (Ekor), 2009 Table Number of Big Livestock by Kind and Regency in Sulawesi Barat (Heads), 2009
‘kode Wilayah
Area Code
Kabupaten Regency
Sapi Perah Milk Cow
Sapi Cow
Kerbau Buffalo
Kuda Horse
(1)
(2)
(3)
(4)
(5)
(6)
01 Majene - 19 747 205 164
02 Polewali Mandar - 31 090 1 078 6 074
03 Mamasa 8 1 861 5 439 2 066
04 Mamuju - 58 769 6 159 574
05 Mamuju Utara - 12 812 147 151
Jumlah - Total 8 124 632 13 028 9 029
2008 5 109 138 14 920 8 666
2007 4 100 295 14 885 8 975
2006 - 90 773 14 393 8 714
Sumber / Source: Distanak Provinsi Sulawesi Barat / Agriculture and Livestock Service of Sulawesi Barat Province

PERTANIAN
SULAWESI BARAT DALAM ANGKA 2010 254
�
Tabel 5.8.2
Populasi Ternak Kecil Menurut Jenis Ternak Dan Kabu paten Di Sulawesi Barat (Ekor), 2009 Table Number of Small Livestock by Kind and Regency in Sulawesi Barat (Heads), 2009
Kode Wilayah
Area Code
Kabupaten Regency
Kambing Goat
Domba Sheep
Babi Pig
(1)
(2)
(3)
(4)
(5)
01 Majene 30 834 - ...
02 Polewali Mandar 167 614 - 11 150
03 Mamasa 457 - 34 960
04 Mamuju 26 909 - 114 304
05 Mamuju Utara 5 335 - 3 692
Jumlah – Total 231 149 - 164 106
2008 222 308 - 152 080
2007 270 993 - 125 376
2006 254 347 - 127 804
Sumber / Source: Distanak Provinsi Sulawesi Barat / Agriculture and Livestock Service of Sulawesi Barat Province

AGRICULTURE
SULAWESI BARAT IN FIGURES 2010 255
Tabel
5.8.3
Populasi Unggas Menurut Jenis Ternak Dan Kabupaten Di Sulawesi Barat (Ekor) 2009 Table Number of Poultry (Heads) by Kind and Regency in Sulawesi Barat (Heads), 2009
Kode Wilayah
Area Code
Kabupaten Regency
Itik Duck
Ayam Ras Broiler
Ayam Kampung
Domestic Hens
(1)
(2)
(3)
(4)
(5)
01 Majene 9 918 61 774 61 774
02 Polewali Mandar 1 834 970 1 168 380 3 785 123
03 Mamasa 15 964 10 325 124 178
04 Mamuju 251 011 15 170 2 352 384
05 Mamuju Utara 15 508 11 435 332 918
Jumlah – Total 2 127 371 1 267 084 6 656 377
2008 1 871 332 82 195 5 223 449
2007 1 810 184 128 569 2 108 411
2006 1 758 508 417 688 4 609 073
Sumber / Source: Distanak Provinsi Sulawesi Barat / Agriculture and Livestock Service of Sulawesi Barat Province

PERTANIAN
SULAWESI BARAT DALAM ANGKA 2010 256
�
Tabel 5.8.4
Produksi Telur Menurut Jenis Ternak Dan Kabupaten Di Sulawesi Barat (Kg), 2009 Table Production of Eggs by Kind and Regency in Sulawesi Barat (Kg) , 2009
Kode Wilayah
Area Code
Kabupaten Regency
Ayam Kampung Domestic
Hens
Ayam Ras Layer
Itik Duck
Jumlah Total
(1)
(2)
(3)
(4)
(5)
(6)
01 Majene 1 485 - - 1 485
02 Polewali Mandar 2 604 164 44 138 9 869 202 12 517 604
03 Mamasa 52 850 - 75 259 128 379
04 Mamuju 747 258 - 180 210 927 468
05 Mamuju Utara 475 225 215 915
Jumlah - Total 3 406 232 44 363 10 124 886 13 575 481
2008 3 965 502 1 948 666 10 023 958 15 938 126
2007 4 398 149 210 000 1 806 194 6 414 343
2006 2 066 002 135 200 1 729 858 3 431 060
Sumber / Source: Distanak Provinsi Sulawesi Barat / Agriculture and Livestock Service of Sulawesi Barat Province
AGRICULTURE
SULAWESI BARAT IN FIGURES 2010 257
Tabel
5.8.5
Produksi Daging Ternak Besar Menurut Jenis Ternak D an Kabupaten Di Sulawesi Barat (Kg), 2009 Table Number meet Production of Big Livestock by Kind and Regency in Sulawesi Barat (Kg), 2009
‘Kode Wilayah
Area Code
Kabupaten Regency
Sapi Perah Milk Cow
Sapi Cow
Kerbau Buffalo
Kuda Horse
(1)
(2)
(3)
(4)
(5)
(6)
01 Majene - 131 885 - -
02 Polewali Mandar - 756 456 36 766 -
03 Mamasa - 32 680 67 460 -
04 Mamuju - 435 900 2 900 300
05 Mamuju Utara - 4 500 - -
Jumlah - Total - 1 361 421 107 126 300
2008 - 1 580 689 120 018 2 425
2007 - 2 129 172 364 999 18 531
Sumber / Source: Distanak Provinsi Sulawesi Barat / Agriculture and Livestock Service of Sulawesi Barat Province

PERTANIAN
SULAWESI BARAT DALAM ANGKA 2010 258
�
Tabel
5.8.6
Produksi Daging Ternak Kecil Menurut Jenis Ternak Dan Kabupaten Di Sulawesi Barat (Kg), 2009 Table Number Meet Production of Small Livestock by Kind and Regency in Sulawesi Barat (Kg), 2009
Kode Wilayah
Area Code
Kabupaten Regency
Kambing Goat
Domba Sheep
Babi Pig
(1)
(2)
(3)
(4)
(5)
01 Majene 31 109 - -
02 Polewali Mandar 377 798 - 57 177
03 Mamasa 2 810 - 194 930
04 Mamuju 85 325 - 391 600
05 Mamuju Utara 2 500 - -
Jumlah – Total 499 542 - 643 707
2008 829 328 - 282 554
2007 679 751 - 274 618
Sumber / Source: Distanak Provinsi Sulawesi Barat / Agriculture and Livestock Service of Sulawesi Barat Province
AGRICULTURE
SULAWESI BARAT IN FIGURES 2010 259
Tabel 5.8.7
Jumlah Pemotongan Ternak Besar Menurut Jenis Terna k Dan Kabupaten Di Sulawesi Barat (Ekor), 2009 Table Number of Big Livestock by Kind and Regency in Sulawesi Barat (Heads), 2009
Kode Wilayah
Area Code
Kabupaten Regency
Sapi Perah Milk Cow
Sapi Cow
Kerbau Buffalo
Kuda Horse
(1)
(2)
(3)
(4)
(5)
(6)
01 Majene - 265 4 4
02 Polewali Mandar - 5 257 190 -
03 Mamasa - 191 349 -
04 Mamuju - 7 265 42 5
05 Mamuju Utara - 264 12 -
Jumlah - Total - 13 242 597 9
2008 - 8 229 431 12
2007 - 4 532 535 122
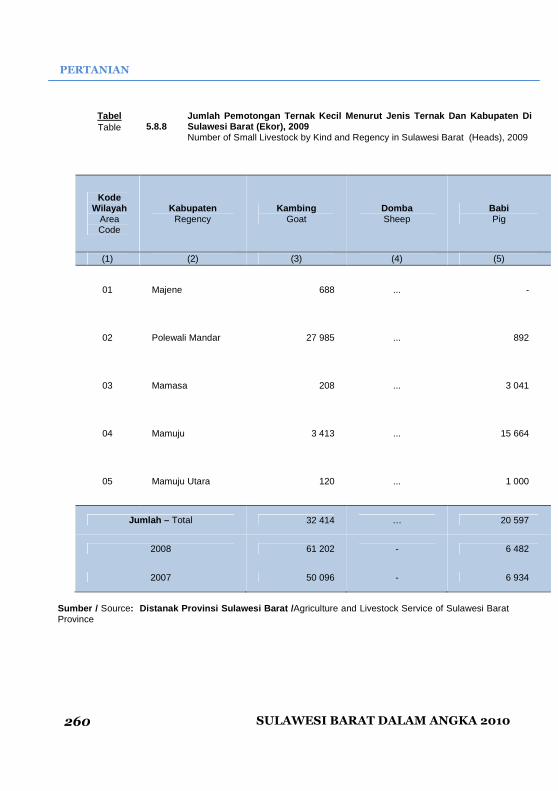
PERTANIAN
SULAWESI BARAT DALAM ANGKA 2010 260
�
Tabel 5.8.8
Jumlah Pemotongan Ternak Kecil Menurut Jenis Ternak Dan Kabupaten Di Sulawesi Barat (Ekor), 2009 Table Number of Small Livestock by Kind and Regency in Sulawesi Barat (Heads), 2009
Kode Wilayah
Area Code
Kabupaten Regency
Kambing Goat
Domba Sheep
Babi Pig
(1)
(2)
(3)
(4)
(5)
01 Majene 688 ... -
02 Polewali Mandar 27 985 ... 892
03 Mamasa 208 ... 3 041
04 Mamuju 3 413 ... 15 664
05 Mamuju Utara 120 ... 1 000
Jumlah – Total 32 414 … 20 597
2008 61 202 - 6 482
2007 50 096 - 6 934
Sumber / Source: Distanak Provinsi Sulawesi Barat / Agriculture and Livestock Service of Sulawesi Barat Province

AGRICULTURE
SULAWESI BARAT IN FIGURES 2010 261
Tabel 5.8.9
Jumlah Pemotongan Unggas Menurut Jenis Ternak Dan K abupaten Di Sulawesi Barat (Ekor) 2009 Table Number of Poultry by Kind and Regency in Sulawesi Barat (Heads), 2009
Kode Wilayah
Area Code
Kabupaten Regency
Itik Duck
Ayam Ras Broiler
Ayam Kampung
Domestic Hens
(1)
(2)
(3)
(4)
(5)
01 Majene 372 - 5 232
02 Polewali Mandar - - -
03 Mamasa 1 549 11 155 7 450
04 Mamuju 31 016 11 875 437 123
05 Mamuju Utara - 3 000 3 500
Jumlah – Total 32 937 26 029 453 305
2008 22 154 15 979 447 527
2007 751 … 11 940
Sumber / Source: Distanak Provinsi Sulawesi Barat / Agriculture and Livestock Service of Sulawesi Barat Province

PERTANIAN
SULAWESI BARAT DALAM ANGKA 2010 262
�
Tabel
5.9.1
Produksi Ikan Darat Menurut Jenis Budidaya Dan Kab upaten Di Provinsi Sulawesi Barat (Ton) 2009 Table Inland Aquawater Production by Type of Culture and Regency in Sulawesi Barat Province (Ton), 2009
Jenis Budidaya Type of Culture Majene Polman Mamasa Mamuju Matra Prov.
Sulbar
(1)
(2)
(3)
(4)
(5)
(6)
(7)
1. Umum/Open Water - - - - - -
2. Tambak/Brackish Water 168,89 9 491,63 - 5 037,80 343,50 15 041,62
3. Kolam/Fresh Water Pond 1,02 26,00 - 38,45 93,00 158,47
4. Keramba/Cage 0,28 - - - - 0,28
5. Sawah/ Paddy Field - 12,00 186,00 2,50 - 200,50
6. Telaga/Lake - - - - - -
Jumlah - Total 170,19 9 529,63 186,00 5 078,75 436,30 15 400,87
Sumber / Source : Dinas Kelautan Dan Perikanan Provinsi Sulawesi Bara t / Oceanic and Fishery Services of Sulawesi Barat Province

AGRICULTURE
SULAWESI BARAT IN FIGURES 2010 263
Tabel
5.9.2
Nilai Produksi Ikan Darat Menurut Jenis Budidaya Da n Kabupaten Di Provinsi Sulawesi Barat (Rp. 000) 2009 Table Value of Inland Aquawater Production by Type of Culture and Regency in Sulawesi Barat Province (Rp. 000), 2009
Jenis Budidaya Type of Culture Majene Polman Mamasa Mamuju Matra Prov.
Sulbar
(1)
(2)
(3)
(4)
(5)
(6)
(7)
Umum/Open Water - - - - - -
Tambak/Brackish Water 2 727 891 145 033 847 - 73 059 000 19 757 750 240 578 488
Kolam/Fresh Water Pond 9 795 359 000 - 505 560 1 860 000 2 794 355
Keramba/Cage 2 640 - - - 2 640
Sawah/ Paddy Field - 174 000 2 692 831 41 650 - 2 908 481
Telaga/Lake - - - - - -
Jumlah - Total 2 740 326 145 566 847 2 692 831 73 606 710 21 617
750 246 223 964
Sumber / Source : Dinas Kelautan Dan Perikanan Provinsi Sulawesi Bara t / Oceanic and Fishery Services of Sulawesi Barat Province

PERTANIAN
SULAWESI BARAT DALAM ANGKA 2010 264
�
TABEL
5.9.3
Produksi Perikanan Budidaya Menurut Jenis Budidaya Dan Kabupaten Di Provinsi Sulawesi Barat (Ton), 2009 Table Inland Aquawater Culture Production by Type of Culture and Regency in Sulawesi Barat Province (Ton), 2009
Kode Wilayah
Area Code
Kabupaten Regency
Laut Payau Tawar Jumlah
(1)
(2)
(3)
(4)
(5)
(6)
01 Majene 5 143 - 148
02 Polewali Mandar 185 9 488 42 9 715
03 Mamasa - - 322 322
04 Mamuju 989 477 - 1 466
05 Mamuju Utara 115 367 - 482
Jumlah - Total 1 294 10 475 364 12 133
Sumber / Source : Dinas Kelautan Dan Perikanan Provinsi Sulawesi Bara t / Oceanic and Fishery Services of Sulawesi Barat Province
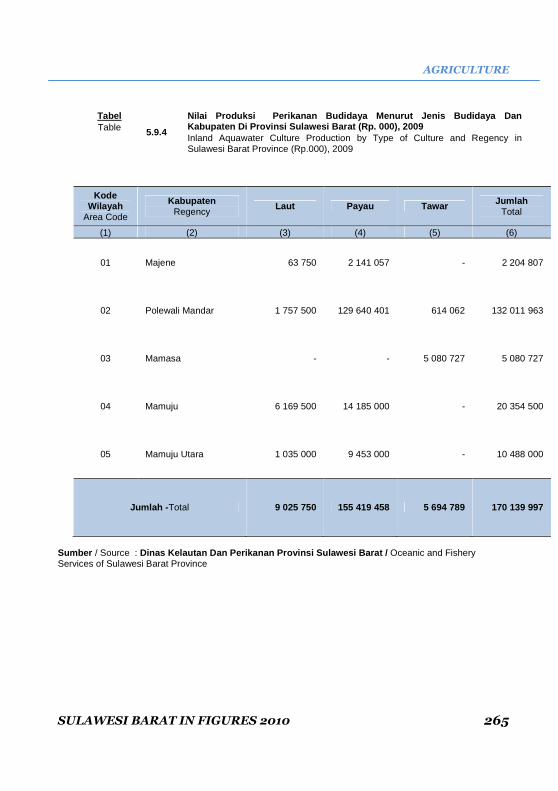
AGRICULTURE
SULAWESI BARAT IN FIGURES 2010 265
Tabel
5.9.4
Nilai Produksi Perikanan Budidaya Menurut Jenis Bu didaya Dan Kabupaten Di Provinsi Sulawesi Barat (Rp. 000), 200 9 Table Inland Aquawater Culture Production by Type of Culture and Regency in Sulawesi Barat Province (Rp.000), 2009
Kode Wilayah
Area Code
Kabupaten Regency
Laut Payau Tawar Jumlah Total
(1)
(2)
(3)
(4)
(5)
(6)
01 Majene 63 750 2 141 057 - 2 204 807
02 Polewali Mandar 1 757 500 129 640 401 614 062 132 011 963
03 Mamasa - - 5 080 727 5 080 727
04 Mamuju 6 169 500 14 185 000 - 20 354 500
05 Mamuju Utara 1 035 000 9 453 000 - 10 488 000
Jumlah - Total 9 025 750 155 419 458 5 694 789 170 139 997
Sumber / Source : Dinas Kelautan Dan Perikanan Provinsi Sulawesi Bara t / Oceanic and Fishery Services of Sulawesi Barat Province

PERTANIAN
SULAWESI BARAT DALAM ANGKA 2010 266
�
Tabel
5.9.5
Jumlah RTP/PP Budidaya Pembesaran Perikanan Menurut Lokasi Budidaya Dan Kabupaten Di Provinsi Sulawesi Barat 2009 Table Number RTP/PP enlargement CultureFisheries by Location and Regency in Sulawesi Barat Province, 2009
Kabupaten Sawah Laut Kolam Tambak Karamba
Jaring Apung
RTP PP RTP PP RTP PP RTP PP RTP PP RTP PP
(1) (2) (3) (4) (5) (6) (7) (8) (9) (10) (11) (12) (13)
Majene - - - - 15 - 207 - - - - -
Polewali Mandar
60 - 171 - 232 3 1,446 - - - - -
Mamasa 3,297 - - - - - - - - - - -
Mamuju 150 - 320 - 200 - 2,000 - - - 1 -
Mamuju Utara - - 87 - 269 - 473 - - - - -
Sulawesi Barat 3,507 - 578 - 716 3 4,126 - - - 1 -
Sumber / Source : Dinas Kelautan Dan Perikanan Provinsi Sulawesi Bara t / Oceanic and Fishery Services of Sulawesi Barat Province

AGRICULTURE
SULAWESI BARAT IN FIGURES 2010 267
Tabel
5.9.6
Luas Usaha Pembesaran Perikanan Menurut Lokasi Pemb esaran Dan Kabupaten Di Provinsi Sulawesi Barat (Ha), 2009 Table size Enlargement Fishernies Bussiness By Location Culture and Regency in Sulawesi Barat Province (Ha), 2009
Kabupaten
Sawah Laut Tambak Kolam Karamba Jaring Apung
Area Air Area Air Area Air Area Air Area Air Area Air
(1) (2) (3) (4) (5) (6) (7) (8) (9) (10) (11) (12) (13)
Majene
-
-
-
-
440.5 393.8
12
10.8
-
-
32
-
Polewali Mandar
40
38
142
140
5,123 4,926
60
58
-
-
- 12,5
Mamasa
3,599
3,189
-
-
-
-
-
-
-
-
-
-
Mamuju 40
35
500
160
5,417
4,333 144
122
-
-
-
-
Mamuju Utara
-
-
66
61
1,645
1,634
85
79
-
-
-
-
Sulawesi Barat
3,679
3,262
708
361
12,626
11,287
301
270
-
-
-
-
Sumber / Source : Dinas Kelautan Dan Perikanan Provinsi Sulawesi Bara t / Oceanic and Fishery Services of Sulawesi Barat Province

PERTANIAN
SULAWESI BARAT DALAM ANGKA 2010 268
�
Tabel
5.9.7
Produksi Perikanan Budidaya Laut Menurut Triwulan D an Kabupaten Di Provinsi Sulawesi Barat (Ton) 2009 Table Marine Fisheries Production by Quarter and Regency in Sulawesi Barat Province (Ton), 2009
No. Kabupaten 2009
Triwulan I Triwulan II Triwulan III Triwulan IV Jumlah
(1) (2) (3) (4) (5) (6) (7)
1 Majene - - - 25,20 25,20
2 Polewali Mandar 450,00 580.00 390,00 2 566,95 3 986,95
3 Mamasa - - - - -
4 Mamuju 2 000,00 4 000,00 40,00 1 075,15 7 115,15
5 Mamuju Utara 80,00 115,00 130,00 92,00 417,00
Sulawesi Barat 2 530,00 4 695,00 560,00 3 759,30 11 544,30
Sumber / Source : Dinas Kelautan Dan Perikanan Provinsi Sulawesi Bara t / Oceanic and Fishery Services of Sulawesi Barat Province

AGRICULTURE
SULAWESI BARAT IN FIGURES 2010 269
Tabel
5.9.8
Produksi Perikanan Budidaya Tambak Menurut Triwulan Dan Kabupaten Di Provinsi Sulawesi Barat (Ton) 2009 Table Aquawater Culture Production by Quarter and Regency in Sulawesi Barat Province, 2009 (Ton)
No. Kabupaten Triwulan I Triwulan II Triwulan III Triwulan IV Jumlah
(1) (2) (3) (4) (5) (6) (7)
1 Majene 105,13 30,06 8,50 25,20 168,89
2 Polewali Mandar 2 124,47 2 508,20 2 292,01 2 566,95 9 491,63
3 Mamasa - - - - -
4 Mamuju 1 412,60 2 250,05 300,00 1 075,15 5 037,80
5 Mamuju Utara 76,30 85,00 90,00 92,00 343,30
Sulawesi Barat 3 718,50 4 873,31 2 690,51 3 759,30 15 041,62
Sumber / Source : Dinas Kelautan Dan Perikanan Provinsi Sulawesi Bara t / Oceanic and Fishery Services of Sulawesi Barat Province
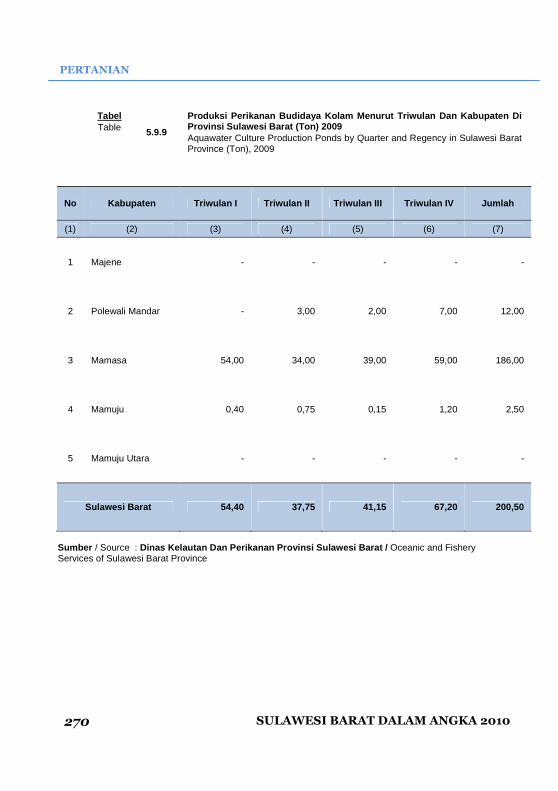
PERTANIAN
SULAWESI BARAT DALAM ANGKA 2010 270
�
Tabel
5.9.9
Produksi Perikanan Budidaya Kolam Menurut Triwulan Dan Kabupaten Di Provinsi Sulawesi Barat (Ton) 2009 Table Aquawater Culture Production Ponds by Quarter and Regency in Sulawesi Barat Province (Ton), 2009
No Kabupaten Triwulan I Triwulan II Triwulan III Triwulan IV Jumlah
(1) (2) (3) (4) (5) (6) (7)
1 Majene - - - - -
2 Polewali Mandar - 3,00 2,00 7,00 12,00
3 Mamasa 54,00 34,00 39,00 59,00 186,00
4 Mamuju 0,40 0,75 0,15 1,20 2,50
5 Mamuju Utara - - - - -
Sulawesi Barat 54,40 37,75 41,15 67,20 200,50
Sumber / Source : Dinas Kelautan Dan Perikanan Provinsi Sulawesi Bara t / Oceanic and Fishery Services of Sulawesi Barat Province

AGRICULTURE
SULAWESI BARAT IN FIGURES 2010 271
Tabel
5.9.10
Produksi Perikanan Budidaya Jaring Apung Menurut Tr iwulan Dan Kabupaten Di Provinsi Sulawesi Barat (Ton) 2009 Table floating Cage Aquaculture Productionby Quarter and Regency in Sulawesi Barat Province (Ton), 2009
No Kabupaten Triwulan I Triwulan II Triwulan III Triwulan IV Jumlah
(1) (2) (3) (4) (5) (6) (7)
1 Majene - - 0,28 - 0,28
2 Polewali Mandar - - - - -
3 Mamasa - - - - -
4 Mamuju - - - - -
5 Mamuju Utara - - - - -
Sulawesi Barat - - 0,28 - 0,28
Sumber / Source : Dinas Kelautan Dan Perikanan Provinsi Sulawesi Bara t / Oceanic and Fishery Services of Sulawesi Barat Province

PERTANIAN
SULAWESI BARAT DALAM ANGKA 2010 272
�
Tabel
5.9.11
Produksi Perikanan Budidaya Sawah Menurut Triwulan Dan Kabupaten Di Provinsi Sulawesi Barat (Ton), 2009 Table Aquaculture Production Fields by Quarter and Regency in Sulawesi Barat Province (Ton), 2009
No Kabupaten Triwulan I Triwulan II Triwulan III Triwulan IV Jumlah
(1) (2) (3) (4) (5) (6) (7)
1 Majene - - - 25,20 25,20
2 Polewali Mandar 450,00 580,00 390,00 2 566,95 3 986,95
3 Mamasa - - - - -
4 Mamuju 2 000,00 4 000,00 40,00 1 075,15 7 115,15
5 Mamuju Utara 80,00 115,00 130,00 92,00 417.00
Sulawesi Barat 2 530,00 4 695,00 560,00 3 759,30 11 544,30
Sumber / Source : Dinas Kelautan Dan Perikanan Provinsi Sulawesi Bara t / Oceanic and Fishery Services of Sulawesi Barat Province

AGRICULTURE
SULAWESI BARAT IN FIGURES 2010 273
Tabel
5.9.12
Nilai Produksi Perikanan Budidaya Laut Menurut Triw ulan Dan Kabupaten Di Provinsi Sulawesi Barat (Rp.000) 2009 Table Marine Fisheries Production Values of Cultureby Quarter and Regency in Sulawesi Barat Province ( 000 Rp.), 2009
No Kabupaten Triwulan I Triwulan II Triwulan III Triwulan IV Jumlah
(1) (2) (3) (4) (5) (6) (7)
1 Majene - - - - -
2 Polewali Mandar 4 275 000 5 510 000 3 705 000 4 085 000 17 575 000
3 Mamasa - - - - -
4 Mamuju 14 000 000 32 000 000 320 000 12 800 000 59 120 000
5 Mamuju Utara 600 000 862 500 975 000 900 000 3 337 500
Sulawesi Barat 18 875 000 38,372 500 5 000 000 17 785 000 80 032 500
Sumber / Source : Dinas Kelautan Dan Perikanan Provinsi Sulawesi Bara t / Oceanic and Fishery Services of Sulawesi Barat Province

PERTANIAN
SULAWESI BARAT DALAM ANGKA 2010 274
�
Tabel
5.10.13
Nilai Produksi Perikanan Budidaya Tambak Menurut Tr iwulan Dan Kabupaten Di Provinsi Sulawesi Barat ( Rp. 000) 200 9 Table Fishery Production Value Of Culture Backish by Quarter and Regency in Sulawesi Barat Province ( 000 Rp.), 2009
No Kabupaten Triwulan I Triwulan II Triwulan III Triwulan IV Jumlah
(1) (2) (3) (4) (5) (6) (7)
1 Majene 1 640 423 461 447 200 156 425 865 2,727,891
2 Polewali Mandar 33 996 137 37 124 700 34 139 065 39 773 945 145 033 847
3 Mamasa - -- - - -
4 Mamuju 19 878 000 33 721 500 5 025 000 14 434 500 73,059,000
5 Mamuju Utara 4 460 250 4 925 000 5 200 000 5 172 500 19,757,750
Sulawesi Barat 59 974 810 76 232 647 44 564 221 59 806 810 240 578 488
Sumber / Source : Dinas Kelautan Dan Perikanan Provinsi Sulawesi Bara t / Oceanic and Fishery Services of Sulawesi Barat Province

AGRICULTURE
SULAWESI BARAT IN FIGURES 2010 275
Tabel
5.9.14
Nilai Produksi Perikanan Budidaya Jaring Apung Menu rut Triwulan Dan Kabupaten Di Provinsi Sulawesi Barat (Rp.000) 2009 Table Fishery Production Value Of Net Pumice by Quarter and Regency in Sulawesi Barat Province ( 000 Rp.), 2009
No Kabupaten Triwulan I Triwulan II Triwulan III Triwulan IV Jumlah
(1) (2) (3) (4) (5) (6) (7)
1 Mamuju - - - - -
2 Majene - - 2 640 - 2 640
3 Polewali Mandar - - - - -
4 Mamasa - - - - -
5 Mamuju Utara - - - - -
Sulawesi Barat - - 2 640 - 2 640
Sumber / Source : Dinas Kelautan Dan Perikanan Provinsi Sulawesi Bara t / Oceanic and Fishery Services of Sulawesi Barat Province

PERTANIAN
SULAWESI BARAT DALAM ANGKA 2010 276
�
Tabel
5.9.15
Nilai Produksi Perikanan Budidaya Sawah Menurut Tri wulan Dan Kabupaten Di Provinsi Sulawesi Barat (Rp. 000) 2009 Table Fishery Production Value Of Filed by Quarter and Regency in Sulawesi Barat Province, 2009 ( 000 Rp.)
No. Kabupaten Triwulan I Triwulan II Triwulan III Triwulan IV Jumlah
(1) (2) (3) (4) (5) (6) (7)
1 Mamuju 4,800 9,000 2,250 25,600 41,650
2 Majene - - - - -
3 Polewali Mandar - 43,500 27,000 103,500 174,000
4 Mamasa 780,485 495,676 575,544 841,126 2,692,831
5 Mamuju Utara - - - - -
Sulawesi Barat 785,285 548,176 604,794 970,226 2,908,481
Sumber / Source : Dinas Kelautan Dan Perikanan Provinsi Sulawesi Bara t / Oceanic and Fishery Services Of Sulawesi Barat Province

AGRICULTURE
SULAWESI BARAT IN FIGURES 2010 277
Tabel
5.9.16
Nilai Produksi Perikanan Budidaya Kolam Menurut Tri wulan Dan Kabupaten Di Provinsi Sulawesi Barat (Rp. 000) 2009 Table Fishery Production Value by Quarter and Regency in Sulawesi Barat Province, (000 Rp.) 2009
No. Kabupaten Triwulan I Triwulan II Triwulan III Triwulan IV Jumlah
(1) (2) (3) (4) (5) (6) (7)
1 Majene - - 9,795 - 9,795
2 Polewali Mandar 16,500 166,000 87,000 89,500 359,000
3 Mamasa - - - - -
4 Mamuju 84,960 277,500 64,500 78,600 505,560
5 Mamuju Utara 400,000 500,000 540,000 420,000 1,860,000
Sulawesi Barat 501,460 943,500 701,295 588,100 2,734,355
Sumber / Source : Dinas Kelautan Dan Perikanan Provinsi Sulawesi Bara t / Oceanic and Fishery Services Of Sulawesi Barat Province

PERTANIAN
SULAWESI BARAT DALAM ANGKA 2010 278
�
Tabel 5.9.17
Nilai Produksi Pembesaran Perikanan Menurut Jenis I kan Dan Kabupaten Di Provinsi Sulawesi Barat Tahun (Rp.000) 2009 Table
Jenis Budidaya Type of Culture Majene Polman Mamasa Mamuju Matra Prov.
Sulbar
(1)
(2)
(3)
(4)
(5)
(6)
(7)
1. Mujair 17 610 95 000 - - - 112 610
2. Bandeng 1 502 646 89 568 342 - 56 500 000 2 157 750 149 728 738
3. Belanak - 81 000 - - - 81 000
4. Kakap - 115 000 - - - 115 000
5. Mas 11 830 379 500 2 550 230 403 650 1 860 000 5 205 210
6. Nila 605 115 500 142 601 - - 258 706
7. Lele - 38 000 - 143 560 - 181 560
8. Kerapu - - - - - -
9. Udang Windu 1 092 332 50 393 980 - 13 910 000 17 600 000 82 996 312
10. Udang Putih 115 303 1 268 025 - - - 1 383 328
11. Udang Api-Api - 2 087 500 - 2 608 300 - 4 695 800
12. Udang Vaname - 1 425 000 - 31 700 - 1 456 700
13. Rebon - - - - - -
14. Kepiting - - - 9 000 - 9 000
15. Rajungan - - - - - -
16. Teripang - - - - - -
17. Rumput Laut - 17 575 000 - 59 120 000 3 337 500 80 032 500
Jumlah - Total 2 740 326 163 141 847 2 692 831 132 727 210 24 955 250 326 256 464
Sumber / Source : Dinas Kelautan Dan Perikanan Provinsi Sulawesi Bara t / Oceanic and Fishery Services Of Sulawesi Barat Province
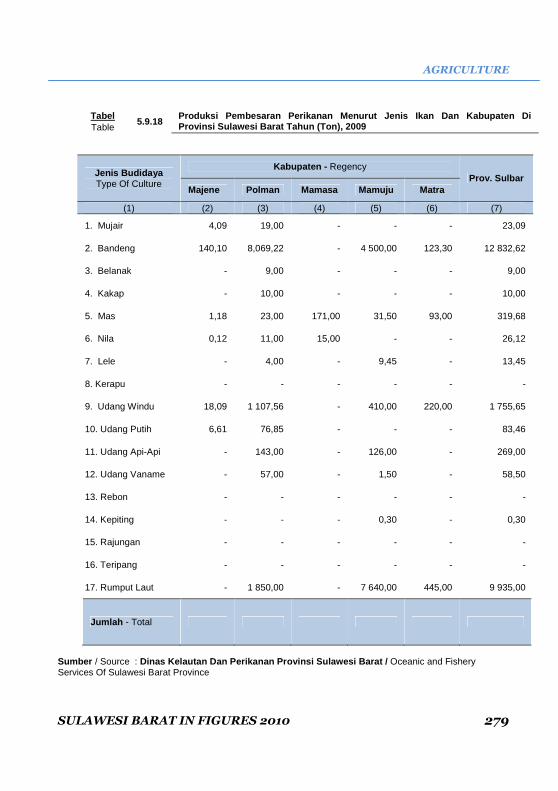
AGRICULTURE
SULAWESI BARAT IN FIGURES 2010 279
Tabel 5.9.18
Produksi Pembesaran Perikanan Menurut Jenis Ikan Da n Kabupaten Di Provinsi Sulawesi Barat Tahun (Ton), 2009 Table
Jenis Budidaya Type Of Culture
Kabupaten - Regency Prov. Sulbar
Majene Polman Mamasa Mamuju Matra
(1)
(2)
(3)
(4)
(5)
(6)
(7)
1. Mujair 4,09 19,00 - - - 23,09
2. Bandeng 140,10 8,069,22 - 4 500,00 123,30 12 832,62
3. Belanak - 9,00 - - - 9,00
4. Kakap - 10,00 - - - 10,00
5. Mas 1,18 23,00 171,00 31,50 93,00 319,68
6. Nila 0,12 11,00 15,00 - - 26,12
7. Lele - 4,00 - 9,45 - 13,45
8. Kerapu - - - - - -
9. Udang Windu 18,09 1 107,56 - 410,00 220,00 1 755,65
10. Udang Putih 6,61 76,85 - - - 83,46
11. Udang Api-Api - 143,00 - 126,00 - 269,00
12. Udang Vaname - 57,00 - 1,50 - 58,50
13. Rebon - - - - - -
14. Kepiting - - - 0,30 - 0,30
15. Rajungan - - - - - -
16. Teripang - - - - - -
17. Rumput Laut - 1 850,00 - 7 640,00 445,00 9 935,00
Jumlah - Total
Sumber / Source : Dinas Kelautan Dan Perikanan Provinsi Sulawesi Bara t / Oceanic and Fishery Services Of Sulawesi Barat Province

PERTANIAN
SULAWESI BARAT DALAM ANGKA 2010 280
�
TABEL 5.10.1
Kegiatan Vaksinasi Menurut Jenis Vaksinasi Per Kabu paten Di Sulawesi Barat 2009 Table Vaccination Activities by Kind by Regency in Sulawesi Barat, 2009
Kabupaten Regency
Jenis Vaksinasi (Dosis) Kind Of Vaccine (Dosage)
S E (Epizooticae) Anthrax
N D (New Castle Diseases)
A I (Avian Influenza)
Rabies
(1)
(2)
(3)
(4)
(5)
(6)
Majene 1 959 - - - -
Polewali Mandar ... .... ... ... ...
Mamasa ... .... ... ... ...
Mamuju ... .... ... ... ...
Mamuju Utara ... .... ... ... ...
Jumlah – Total 1 959 .... ... ... ...
2008 2 882 2 198 - - 300
2007 7 337 5 887 22 025 150 000 2 350
2006 14 888 14 388 57 107 - -
Sumber / Source : Buku Daerah Dalam Angka Se Provinsi Sulawesi Bar at / Cited from each Regency in Figures in Sulawesi Barat Province

6 PERINDUSTRIAN,
PERTAMBANGAN DAN ENERGI
Manufacturing, Mining and Energy

MANUFACTURING, MINING, AND INDUSTRY
SULAWESI BARAT IN FIGURES 2010 283
6.1. Perindustrian Sektor industri dapat dibedakan atas
industri besar, sedang, kecil dan rumahtangga.
Data mengenai industri besar dan sedang
tersedia setiap tahun yang dikumpulkan
dengan cara sensus lengkap, sedangkan data
industri kecil dan rumahtangga tidak tersedia
setiap tahun.
Jumlah perusahaan industri besar/sedang
di Sulawesi Barat pada tahun 2009 sebanyak
15 perusahaan, dengan jumlah tenaga kerja 3
796.
6.2. Pertambangan
Kegiatan pertambangan di Sulawesi
Barat, berdasarkan hasil pendataan SE06
masih didominasi oleh penggalian sekitar 386
usaha dari 396 perusahaan/usaha
pertambangan. Sedangkan dari segi badan
hukum usaha, hanya 7 usaha yang memiliki
badan hukum yang berupa Perseroan Terbatas
(PT), CV, Firma.
Penjelasan Teknis 1. Industri pengolahan dikelompokkan ke
dalam 4 golongan berdasarkan banyaknya pekerja, yaitu :
a. Industri Besar adalah perusahaan
yang mempunyai pekerja 100 orang atau lebih.
b. Industri Sedang adalah perusahaan yang mempunyai pekerja 20-99 orang.
c. Industri kecil adalah perusahaan yang mempunyai pekerja 5-19 orang
d. Industri Rumahtangga adalah usaha kerajinan rumahtangga yang mempunyai pekerja antara 1-4 orang.
6.1. Manufacturing Industry
Manufacturing industry sector is
classified as large, medium, small and
household industries. The data of large and
medium scale industry are available annually,
which were collected as a complete census.
However data of small and household
industries are not available every year.
The number of companies manufacture
large / medium in Sulawesi Barat in 2009 as
many as 15 companies, with 3 796 the amount
of labor
6.2. Mining
Mining activities in Sulawesi Barat, based
on the results of data SE06 is still dominated
by the excavation of about 386 from 396
business firms / mining business. In terms of
business entities, only seven businesses that
have a legal entity in the form of Limited
Liability Company (PT), CV, Firm.
Technical Notes 1. Manufacturing industry is classified in to
four groups according to the number of employees: a. Large scale manufacturing is a
manufacturing establishment having at least 100 employees;
b. Medium scale manufacturing is a manufacturing establishment having 20-99 employees;
c. Small scale manufacturing is a manufacturing establishment having 5-19 employees;
d. Househo ld and cottages industry is a manufacturing establishment having 1-4 employees;

PERINDUSTRIAN, PERTAMBANGAN, DAN ENERGI
SULAWESI BARAT DALAM ANGKA 2010 284
2. Klasifikasi Industri Pengolahan :
a. Industri makanan, minuman dan tembakau.
b. Industri tekstil, pakaian jadi dan kulit. c. Industri kayu dan barang-barang dari
kayu termasuk perabot rumahtangga. d. Industri kertas, dan barang-barang dari
kertas percetakan dan penerbitan. e. Industri kimia, dan barang dari bahan
kimia, minyak bumi, batubara, karet dan plastik.
f. Industri barang galian bukan logam kecuali minyak bumi dan batubara.
g. Industri logam dasar h. Industri barang dari logam, mesin dan
peralatannya. i. Industri pengolahan lainnya.
2. Classification of Manufacturing Industry:
a. Manufacture of food, beverages and tobacco.
b. Manufacture of textiles, clothing and leather.
c. Manufacture of wood and wood products, including furniture.
d. Manufacture of paper and paper products, printing and publishing.
e. Manufacture of chemicals, petroleum, coal, rubber and plastic products.
f. Manufacture of non-metallic mineral products, except petroleum and coal products.
g. Manufacture of basic metals h. Manufacture of fabricated metal
products, machinery and equipment i. Other manucfacturing industries.

MANUFACTURING, MINING, AND INDUSTRY
SULAWESI BARAT IN FIGURES 2010 285
Grafik 6.1 Jumlah Daya Tersambung (KVA) dan En ergi Terjual (MWh) Menurut Rayon, 2009
Figure Number Installed Power (KVA) and Energy Sold by Rayon, 2009
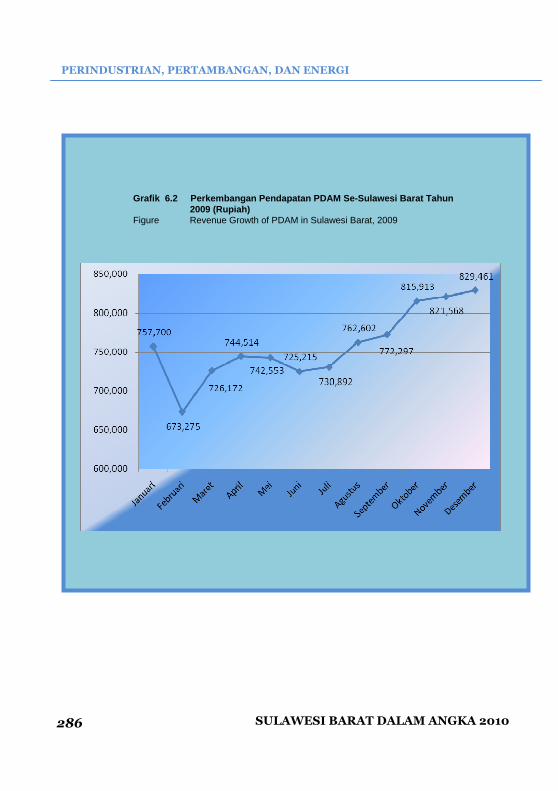
PERINDUSTRIAN, PERTAMBANGAN, DAN ENERGI
SULAWESI BARAT DALAM ANGKA 2010 286
Grafik 6.2 Perkembangan Pendapatan PDAM Se-Sul awesi Barat Tahun 2009 (Rupiah)
Figure Revenue Growth of PDAM in Sulawesi Barat, 2009
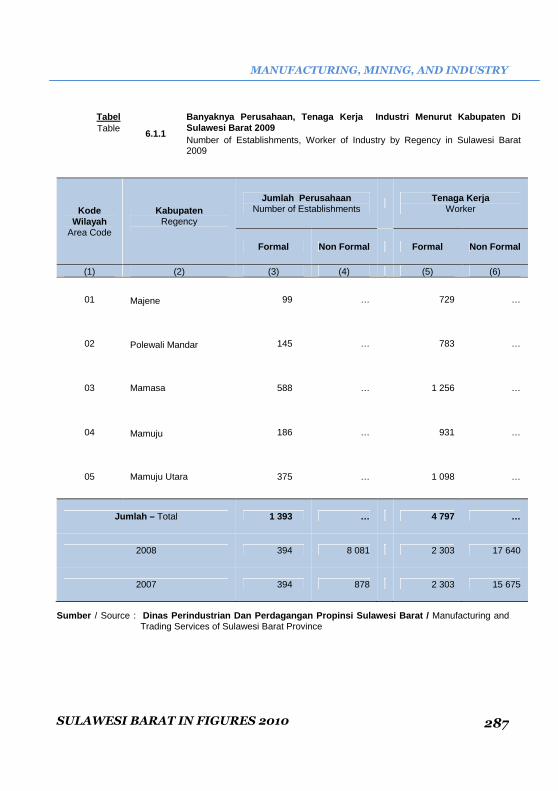
MANUFACTURING, MINING, AND INDUSTRY
SULAWESI BARAT IN FIGURES 2010 287
Tabel
6.1.1
Banyaknya Perusahaan, Tenaga Kerja Industri Menuru t Kabupaten Di Sulawesi Barat 2009 Table Number of Establishments, Worker of Industry by Regency in Sulawesi Barat 2009
Kode Wilayah
Area Code
Kabupaten Regency
Jumlah Perusahaan Number of Establishments
Tenaga Kerja
Worker
Formal Non Formal Formal Non Formal
(1)
(2)
(3)
(4)
(5)
(6)
01 Majene 99 … 729 …
02 Polewali Mandar 145 … 783 …
03 Mamasa 588 … 1 256 …
04 Mamuju 186 … 931 …
05 Mamuju Utara 375 … 1 098 …
Jumlah – Total 1 393 … 4 797 …
2008 394 8 081 2 303 17 640
2007 394 878 2 303 15 675
Sumber / Source : Dinas Perindustrian Dan Perdagangan Propinsi Sulaw esi Barat / Manufacturing and Trading Services of Sulawesi Barat Province

PERINDUSTRIAN, PERTAMBANGAN, DAN ENERGI
SULAWESI BARAT DALAM ANGKA 2010 288
Tabel
6.1.2
Nilai Investasi, Nilai Produksi Dan Nilai Bahan Bak u/Bahan Penolong Industri Menurut Kabupaten Di Sulawesi Barat 2009 Table Investment Value, Production Value, and Other Materials Value of Industry by Regency in Sulawesi Barat 2009
Kabupaten Regency
Nilai Investasi Investment Value
Nilai Produksi Production Value
Nilai Bahan
Baku/Penolong Other Materials Value
Formal Non Formal
Formal
Non Formal Formal Non
Formal
(1)
(2)
(3)
(4)
(6)
(7)
Majene 2 587 421 …
22 701 707 … 4 834 029 …
Polewali Mandar 14 385 500 …
24 820 000 … 2 297 150 …
Mamasa 4 804 053 …
491 025 098 … 1 896 615 …
Mamuju 15 034 442 …
58 650 085 … 20 063 483 …
Mamuju Utara 6 161 100 …
27 577 815 … 11 177 920 …
Jumlah – Total 42 972 516 …
599 954 705 … 40 269 197 …
2008 23 356 177 26 185 886
167 203 360 112 193 039 56 986 989 14 786 397
2007 22 976 177 24 747 932
167 203 360 106 815 456 56 986 989 11 552 704
Sumber / Source : Dinas Perindustrian Dan Perdagangan Propinsi Sulawe si Barat / Manufacturing and Trading Services of Sulawesi Barat Province

MANUFACTURING, MINING, AND INDUSTRY
SULAWESI BARAT IN FIGURES 2010 289
Tabel
6.1.3
Nilai Investasi Dan Produksi Menurut Kabupaten Dan Jenis Industri Di Sulawesi Barat (Juta Rupiah) 2009 Table Value of Invesment and Production by Regency and Kind of Industryin Sulawesi Barat (in Million) 2009
Kode Wilayah
Area Code
Kabupaten Regency
Industri Hasil Pertanian Dan Kehutanan
Agricultural Product Industries
Ind. Logam, Mesin dan Kimia Metal Product, Machinery and
Chemicals Industries
Nilai Investasi Invesment
Value
Nilai ProduksI Production
Value
Nilai Investasi Invesment
Value
Nilai Produksi Production
Value
(1)
(2)
(3)
(4)
(5)
(6)
01
Majene 277 777 1 643 580 2 309 644 4 505 325
02
Polewali Mandar 3 734 500 4 028 000 10 651 000 20 792 000
03 Mamasa 1 366 492 35 900 785 3 437 561 425 124 313
04 Mamuju 4 302 993 28 848 330 10 731 449 29 801 755
05 Mamuju Utara 284 000 507 800 5 877 100 27 080 015
Jumlah - Total 9 965 762 70 928 495 33 006 754 507 303 408
2008 11 480 628 158 076 931 22 923 319 82 592 800
2007 23 356 217 167 203 360 - -
Sumber / Source : Dinas Perindustrian Dan Perdagangan Propinsi Sulaw esi Barat / Manufacturing and Trading Services of Sulawesi Barat Province

PERINDUSTRIAN, PERTAMBANGAN, DAN ENERGI
SULAWESI BARAT DALAM ANGKA 2010 290
Tabel
6.2.1
Banyaknya Perusahaan, Tenaga Kerja, Serta Pengeluar an Untuk Tenaga Kerja Industri Besar/Sedang Menurut Kode Klasifikas i Industri Di Sulawesi Barat 2009
Table
Number of Establishments, Workers and Labor Costs of Large and Medium Manucfacturing Industries by Industry Classification Code in Sulawesi Barat, 2009
Kode Klasifikasi Industri Industrial Classification
Code
Banyaknya Perusahaan Number of
Establishment
Tenaga Kerja (TK) - Workers Pengeluaran Untuk TK
Labor Cost
(Ribu Rp- In
Thousand Rupiahs)
TK Produksi Production Workers
TK Lainnya Others Workers
Jumlah Total
(1)
(2)
(3)
(4)
(5)
(6)
10 7 3 373 154 3 527 78 420 981
13 2 48 8 56 302 800
15 1 6 26 32 29 720
16 2 97 20 117 1 117 800
20 1 12 10 22 81 660
31 2 37 5 42 475 740
Jumlah Total 15 3 573 223 3 796 80 428 701
Sumber / Source : Badan Pusat Statistik (BPS) Provinsi Sulawesi Barat / BPS of Sulawesi Barat Province

MANUFACTURING, MINING, AND INDUSTRY
SULAWESI BARAT IN FIGURES 2010 291
Tabel
6.2.2
Biaya Input Industri Besar/Sedang Menurut Kode Klas ifikasi Industri Di Sulawesi Barat (Dalam Juta Rupiah) 2009 Table
Input Cost of Large and Medium Manufacturing Industries by Industral Classification Code in Sulawesi Barat (Million Rupiahs), 2009
Kode Klasifikasi Industri Industrial
Classification Code
Bahan Baku Raw Material
Bahan bakar Tenagalistrik
Dan gas Fuel, Electricity &
Gas
Sewa Gedung Dan Mesin
Rent of Building & Machineries
Lainnya Other
Jumlah Total
(1)
(2)
(3)
(4)
(5)
(6)
10 1 246 356 17 001 39 712 1 264 109
13 1 080 29 - 58 1 167
15 - 179 - 179
16 8 937 478 - 35 9 450
20 18 6 - 2 26
31 532 14 - 6 552
Jumlah Total 1 256 923 17 707 39 813 1 275 483
Sumber / Source :Badan Pusat Statistik (BPS) Provinsi Sulawesi Barat / BPS of Sulawesi Barat Province

PERINDUSTRIAN, PERTAMBANGAN, DAN ENERGI
SULAWESI BARAT DALAM ANGKA 2010 292
Tabel
6.2.3
Nilai Output Industri Besar Dan Sedang Menurut Kode Klasifikasi Industri Di Sulawesi Barat (Dalam Juta Rupiah) 2009 Table
Value of Gross Output of Large and Medium Manufacturing Industries by Industry Classification Code in Sulawesi Barat (In Million Rupiahs), 2009
Kode Klasifikasi
Industri Industrial
Classification Code
Barang Yang
Dihasil kan
Goods Produce
d
Tenaga listrik
Yang dijual Value of
Electricity Sold
Jasa industri yang
Diberikan Pihak Lain Industrial Service
Rendered
Pendapatan Lain
Selisih Nilai Stock
Barang Setengah
Jadi Increase in
Stock of Semi
Finished Goods
Jumlah Total
(1)
(2)
(3)
(4)
(5)
(6)
(7)
10 1 844 150 - - 2 4 1 844 156
13 3 285 - - 454 5 3 743
15 1 057 - - - - 1 057
16 12 264 - - 252 39 12 555
20 108 - - - -77 31
31 2 731 - - 300 45 2 776
Jumlah - Total 1 863 595 - - 1 008 16 1 864 318
Sumber / Source :Badan Pusat Statistik (BPS) Provinsi Sulawesi Barat / BPS of Sulawesi Barat Province
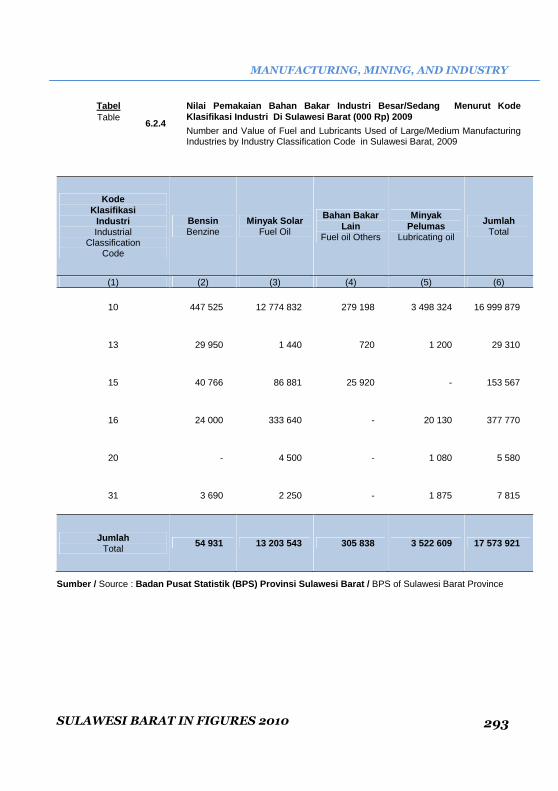
MANUFACTURING, MINING, AND INDUSTRY
SULAWESI BARAT IN FIGURES 2010 293
Tabel
6.2.4
Nilai Pemakaian Bahan Bakar Industri Besar/Sedang Menurut Kode Klasifikasi Industri Di Sulawesi Barat (000 Rp) 20 09 Table Number and Value of Fuel and Lubricants Used of Large/Medium Manufacturing Industries by Industry Classification Code in Sulawesi Barat, 2009
Kode Klasifikasi
Industri Industrial
Classification Code
Bensin Benzine
Minyak Solar Fuel Oil
Bahan Bakar Lain
Fuel oil Others
Minyak Pelumas
Lubricating oil
Jumlah Total
(1)
(2)
(3)
(4)
(5)
(6)
10 447 525 12 774 832 279 198 3 498 324 16 999 879
13 29 950 1 440 720 1 200 29 310
15 40 766 86 881 25 920 - 153 567
16 24 000 333 640 - 20 130 377 770
20 - 4 500 - 1 080 5 580
31 3 690 2 250 - 1 875 7 815
Jumlah Total 54 931 13 203 543 305 838 3 522 609 17 573 921
Sumber / Source : Badan Pusat Statistik (BPS) Provinsi Sulawesi Barat / BPS of Sulawesi Barat Province

PERINDUSTRIAN, PERTAMBANGAN, DAN ENERGI
SULAWESI BARAT DALAM ANGKA 2010 294
Tabel
6.2.5
Nilai Tambah Industri Besar/Sedang Menurut Kode Kl asifikasi Industri Di Sulawesi Barat (Dalam Juta Rupiah) 2009 Table Value Added of Large/ Medium Manufacturing Industries by Industry Classification Code in Sulawesi Barat ( Million Rupiash), 2009
Kode Klasifikasi
Industri Industrial
Classification Code
Nilai Output Value Of
Gross Output
Biaya Input Input Cost
Nilai Tambah (Harga Pasar) Value Added
at Market Prices
Pajak Tidak Langsung
Indirect Taxes
Nilai Tambah Faktor Produksi
Value Added at Factor Costs
(1)
(2)
(3)
(4)
(5)
(6)
10 1 844 156 1 264 109 580 046 5 005 658 467
13 3 743 1 167 2 576 0,125 2 879
15 1 057 179 878 23 908
16 12 554 9 450 3 105 23 4 223
20 31 26 5 0 5 87
31 2 776 552 2 224 1 2 700
Jumlah Total 1 864 319 1 275 483 588 835 5 052,612 669 264
Ket : *) data tidak tersedia
Sumber / Source : Badan Pusat Statistik (BPS) Provinsi Sulawesi Barat / BPS of Sulawesi Barat Province

MANUFACTURING, MINING, AND INDUSTRY
SULAWESI BARAT IN FIGURES 2010 295
Tabel
6.2.6
Biaya Input Perusahaan Air Minum Di Sulawesi Barat (Dalam Ribuan Rupiah) 2007-2009 Table Input Cost of Municipal Water Corporation in Sulawesi Barat ( Thousand Rupiahs), 2006-2009
Uraian Description 2007 2008 2009
(1)
(2)
(3)
(4)
1. Bahan Kimia – Chemicals 141 971 188 503 191 461
2. Tenaga Listrik Yang Dibeli Electricity Purchased
342 820 667 603 649 785
3. Material – Materials
a . Pemakaian Bahan Bakar Minyak Lincir Fuel and Lubricants Used
467 983 1 002 571 861 559
b. Onderdil Bahan-Bahan Untuk Pemeliharaan Dan Perbaikan Prasaranan Produksi Spareparts Materials for Repair and Maintenance
6 075 8 507 44 512
c. Bahan-Bahan Untuk Keperluan Kantor, Alat Tulis Menulis Dan Sebagainya Stationary and Others Material
30 824 124 174 81 231
4. Ongkos Produksi Dan Perbaikan Prasarana Produksi Repair and Maintenance Service
90 599 129 431 54 243
5. Jasa-Jasa – Service 2 494 939 2 486 68 797
6. Sewa Mesin Dan Alat-Alat Kendaraan Rent of Machines and Equipments Vehicles 1 125 20 910 47 597
Jumlah – Total 3 576 336 2 144 185 1 999 183
Sumber / Source :Badan Pusat Statistik (BPS) Provinsi Sulawesi Barat / BPS of Sulawesi Barat Province

PERINDUSTRIAN, PERTAMBANGAN, DAN ENERGI
SULAWESI BARAT DALAM ANGKA 2010 296
Tabel
6.3.1
Pengeluaran Lainnya Perusahaan Air Minum Di Sulawes i Barat (Dalam Ribuan Rupiah) 2007-2009 Table Other Expeditures of Municipal Water Company in Sulawesi Barat (Thousand Rupiahs), 2006-2009
Uraian Description 2007 2008 2009
(1)
(3)
(3) (4)
1. Pajak Tak Langsung Indirect Taxes 5 568 18 956 28 173
2. Sewa Tanah, Gedung Dan Gudang Rent of Land, Building and Warehouse - 2 486 1 500
3. Bunga Atas Pinjaman Interest - 364 -
4. Hadiah/Sumbangan, Derma & Yg Sejenisnya Gifts Contribution etc. 39 031 27 488 14 150
Jumlah – Total 44 599 49 294 43 823
Sumber / Source : Badan Pusat Statistik (BPS) Provinsi Sulawesi Barat / BPS of Sulawesi Barat Province

MANUFACTURING, MINING, AND INDUSTRY
SULAWESI BARAT IN FIGURES 2010 297
Tabel
6.3.2
Banyaknya Dan Nilai Air Minum Yang Disalurkan Perus ahaan Air Minum Di Sulawesi Barat (Dalam Ribuan Rupiah) 2009 Table Quantity and Value of Sanitary Water Distributed to Customers in Sulawesi Barat (Thousand Rupiahs), 2009
Uraian Description
Jumlah Pelanggan
Volume Volume
(m3)
Nilai Value (000)
(1)
(2) (3)
(4)
1. Sosial 419 81 897 95 333
- Sosial Umum 380 69 141 68 275
- Sosial Khusus 39 12 756 27 058
2. Non Niaga 15 411 2 588 192 5 759 653
- RSS (2A) 11 820 2 281 477 5 032 481
- RS (2B) 3 365 247 290 569 609
- RM (2C) 115 3 769 13 850
- Kedutaan Besar/Konsulat 0 0 0
- Instansi Pemerintah 111 55 656 143 714
3. Niaga 971 160 239 748 124
- Niaga Kecil 870 147 975 676 403
- Niaga Besar 101 12 264 71 721
4. Industri 26 2 483 10 918
- Industri Kecil 26 2 483 10 918
- Industri Besar 0 0 0
5. Khusus 1 407 978 102 495
- Pelabuhan 0 0 0
- Tangki 1 5 040 102 495
- Bocor 0 402 938 0
Jumlah - Total 16 828 3 240 789 6 716 523
2008 17 993 3 701 769 8 202 685
2007 18 083 2 443 306 6 664 334
2006 14.316 2.231.142 6.446.233
Sumber / Source :Badan Pusat Statistik (BPS) Provinsi Sulawesi Barat / BPS of Sulawesi Barat Province
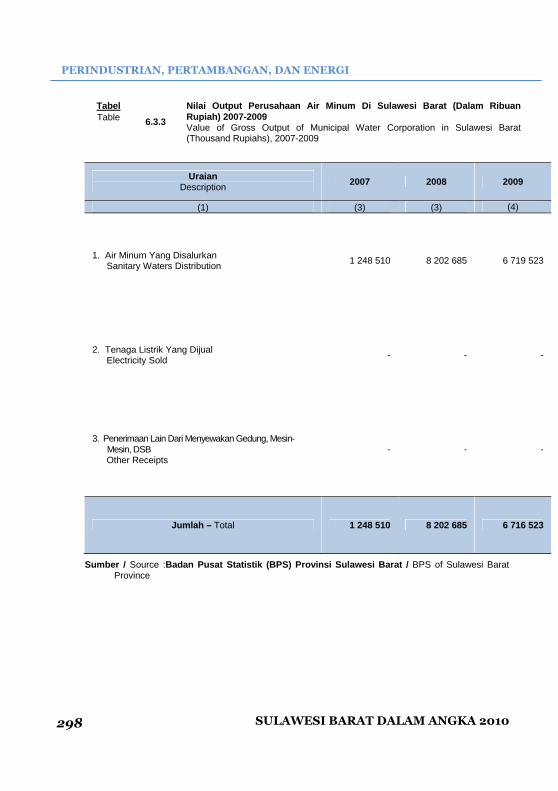
PERINDUSTRIAN, PERTAMBANGAN, DAN ENERGI
SULAWESI BARAT DALAM ANGKA 2010 298
Tabel
6.3.3
Nilai Output Perusahaan Air Minum Di Sulawesi Barat (Dalam Ribuan Rupiah) 2007-2009 Table Value of Gross Output of Municipal Water Corporation in Sulawesi Barat (Thousand Rupiahs), 2007-2009
Uraian
Description 2007 2008 2009
(1)
(3)
(3) (4)
1. Air Minum Yang Disalurkan Sanitary Waters Distribution
1 248 510 8 202 685 6 719 523
2. Tenaga Listrik Yang Dijual Electricity Sold
- - -
3. Penerimaan Lain Dari Menyewakan Gedung, Mesin-Mesin, DSB Other Receipts
- - -
Jumlah – Total 1 248 510 8 202 685 6 716 523
Sumber / Source :Badan Pusat Statistik (BPS) Provinsi Sulawesi Barat / BPS of Sulawesi Barat Province
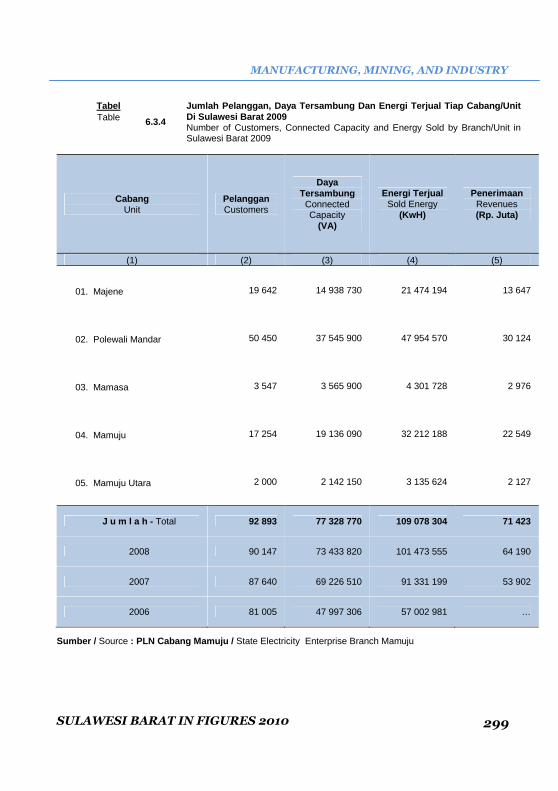
MANUFACTURING, MINING, AND INDUSTRY
SULAWESI BARAT IN FIGURES 2010 299
Tabel
6.3.4
Jumlah Pelanggan, Daya Tersambung Dan Energi Terjua l Tiap Cabang/Unit Di Sulawesi Barat 2009 Table Number of Customers, Connected Capacity and Energy Sold by Branch/Unit in Sulawesi Barat 2009
Cabang Unit
Pelanggan Customers
Daya Tersambung
Connected Capacity
(VA)
Energi Terjual Sold Energy
(KwH)
Penerimaan Revenues (Rp. Juta)
(1)
(2)
(3)
(4)
(5)
01. Majene 19 642 14 938 730 21 474 194 13 647
02. Polewali Mandar 50 450 37 545 900 47 954 570 30 124
03. Mamasa 3 547 3 565 900 4 301 728 2 976
04. Mamuju 17 254 19 136 090 32 212 188 22 549
05. Mamuju Utara 2 000 2 142 150 3 135 624 2 127
J u m l a h - Total 92 893 77 328 770 109 078 304 71 423
2008 90 147 73 433 820 101 473 555 64 190
2007 87 640 69 226 510 91 331 199 53 902
2006 81 005 47 997 306 57 002 981 …
Sumber / Source : PLN Cabang Mamuju / State Electricity Enterprise Branch Mamuju

PERINDUSTRIAN, PERTAMBANGAN, DAN ENERGI
SULAWESI BARAT DALAM ANGKA 2010 300
Tabel
6.3.4 Konsumsi Bahan Bakar Minyak Yang Masuk Ke Sulawesi Barat Menurut Jenis BBM (Kilo Liter), Triwulan I-III Tahun 2010 Table Fuel Consumption in Sulawesi Barat by Kind of Fuel Quarter I-III 2010
Bulan Month
Premium Solar Jumlah Jumlah Spbu Total of Fuel
Pump (1)
(2)
(3)
(4)
(5)
Triwulan I/2010 13 321 6 237 19 558 14
Januari 4 490 2 169 6 659
Februari 4 058 1 898 5 956
Maret 4 773 2 170 6 943
Triwulan II/2010 14 151 6 558 20 709 14
April 4 617 2 114 6 731
Mei 4 713 2 110 6 823
Juni 4 821 2 334 7 155
Triwulan III/2010 14 804 7 023 21 827 14
Juli 5 155 2 484 7 639
Agustus 4 611 2 386 6 997
September 5 038 2 153 7 191
Catatan / Note : Belum Termasuk BBM Yang Masuk Ke Mamuju Utara Sumber / Source : PT. Pertamina (Persero) Depot Pare-Pare

MANUFACTURING, MINING, AND INDUSTRY
SULAWESI BARAT IN FIGURES 2010 301
Tabel 6.4.1
Jumlah Perusahaan Pertambangan Dan Penggalian Menur ut Kabupaten Dan Jenis Pertambangan, 2006 Tabel
Table Number of Mining and Quarrying Establishments by Regency and Kind of Mining, 2006
Kabupaten regency
Minyak dan Gas Bumi Non Migas Penggalian Jumlah
Total
(1)
(2)
(3)
(4)
(5)
01. Majene 0 0 6 6
02. Polewali Mandar 0 0 261 261
03. Mamasa 0 0 14 14
04. Mamuju 0 10 87 97
05. Mamuju Utara 0 0 18 18
Sulawesi Barat 0 10 386 396
Sumber / Source : BPS Sulawesi Barat; Hasil Pendaftaran Perusahaan/Usaha SE06 / BPS Sulawesi
Barat; Establishment Listing Results of SE06

PERINDUSTRIAN, PERTAMBANGAN, DAN ENERGI
SULAWESI BARAT DALAM ANGKA 2010 302
Tabel
6.4.2 Jumlah Perusahaan Penggalian Menurut Kabupaten Dan Jenis Bahan Galian, 2006 Table Number of Quarrying Establishments by Regency and Kind of Material, 2006
Kabupaten Regency
Batu Hias dan
Bangunan
Batu Bahan Industri
Pasir Kerikil Jumlah Total
(1)
(2)
(3)
(4)
(5) (6)
01. Majene 0 0 0 6 6
02. Polewali Mandar 72 1 168 20 261
03. Mamasa 7 0 5 2 14
04. Mamuju 20 3 63 1 87
05. Mamuju Utara 11 0 3 4 18
Sulawesi Barat 110 4 239 33 386
Sumber / Source : BPS Sulawesi Barat; Hasil Pendaftaran Perusahaan/Usaha SE06 / BPS Sulawesi Barat; Establishment Listing Results of SE06

MANUFACTURING, MINING, AND INDUSTRY
SULAWESI BARAT IN FIGURES 2010 303
Tabel 6.4.3
Jumlah Perusahaan Penggalian Menurut Kabupaten Dan Jenis Badan Hukum, 2006 Table Number of Quarrying Establishments by Regency and Kind of Material, 2006
Kabupaten Regency
PT. Persero CV. Firma Lainnya Tidak
Berbadan Hukum
Jumlah Total
(1)
(2)
(3)
(4)
(5) (6)
01. Majene 0 0 0 6 6
02. Polewali Mandar 1 0 1 259 261
03. Mamasa 0 2 0 12 14
04. Mamuju 2 0 0 85 87
05. Mamuju Utara 0 0 1 17 18
Sulawesi Barat 3 2 2 379 386
Sumber / Source : BPS Sulawesi Barat; Hasil Pendaftaran Perusahaan/Usaha SE06 / BPS Sulawesi Barat; Establishment Listing Results of SE06

PERINDUSTRIAN, PERTAMBANGAN, DAN ENERGI
SULAWESI BARAT DALAM ANGKA 2010 304
Tabel 6.4.4
Jumlah Tenaga Kerja Perusahaan Dan Usaha Penggalian Menurut Kabupaten, 2006 Table Number of Establisment and Workers of Quarrying Company by Regency, 2006
Kabupaten Regency
Tenaga Kerja Labour
Jumlah Usaha
Number of Company
Laki-Laki Male
Perempuan Female
Jumlah Total
(1)
(2)
(3)
(4)
(5)
01. Majene 7 4 11 6
02. Polewali Mandar 340 102 442 261
03. Mamasa 28 8 36 14
04. Mamuju 213 26 239 97
05. Mamuju Utara 42 2 44 18
Sulawesi Barat 630 142 772 396
Sumber / Source : BPS Sulawesi Barat; Hasil Pendaftaran Perusahaan/Usaha SE06 / BPS Sulawesi Barat; Establishment Listing Results of SE06
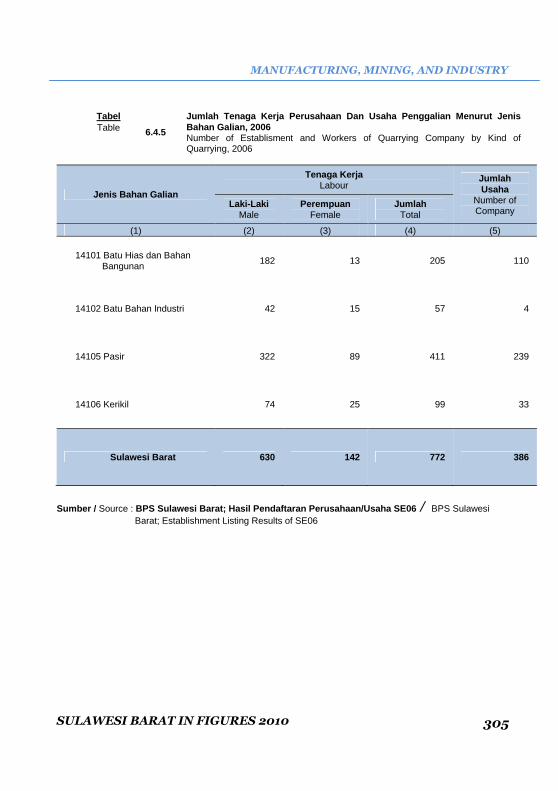
MANUFACTURING, MINING, AND INDUSTRY
SULAWESI BARAT IN FIGURES 2010 305
Tabel
6.4.5
Jumlah Tenaga Kerja Perusahaan Dan Usaha Penggalian Menurut Jenis Bahan Galian, 2006 Table Number of Establisment and Workers of Quarrying Company by Kind of Quarrying, 2006
Jenis Bahan Galian
Tenaga Kerja Labour
Jumlah Usaha
Number of Company
Laki-Laki Male
Perempuan Female
Jumlah Total
(1)
(2)
(3)
(4)
(5)
14101 Batu Hias dan Bahan Bangunan
182 13 205 110
14102 Batu Bahan Industri 42 15 57 4
14105 Pasir 322 89 411 239
14106 Kerikil 74 25 99 33
Sulawesi Barat 630 142 772 386
Sumber / Source : BPS Sulawesi Barat; Hasil Pendaftaran Perusahaan/Usaha SE06 / BPS Sulawesi Barat; Establishment Listing Results of SE06
7 TRANSPORTASI DAN
KOMUNIKASI Transportation and
Communication

TRANSPORTATION AND COMMUNICATION
SULAWESI BARAT IN FIGURES 2010 309
7.1. Panjang Jalan Raya Dan Angkutan
Darat
Jalan merupakan prasarana angkutan
darat yang penting untuk memperlancar
kegiatan perekonomian. Usaha
pembangunan yang makin meningkat
menuntut adanya transportasi untuk
menunjang mobilitas penduduk dan
kelancaran distribusi barang dari dan ke
daerah lain.
Secara umum panjang jalan di Sulawesi
Barat Tahun 2009 sekitar 6 888,45 Km. akan
tetapi kondisi ini cukup memprihatinkan
karena dari segi kondisi jalan, hampir
setengah dari permukaan panjang jalan
Sulawesi Barat dalam kondidi rusak (kategori
rusak dan rusak berat) sekitar 43,47 persen.
7.2. Angkutan Udara
Salah satu moda angkutan yang relatif
baru mulai berkembang di Sulawesi Barat
adalah Bandar Udara Tampa Padang.
Keadaan Bandara Tampa Padang sampai
saat ini masih dalam tahap pembangunan
agar bisa didarati pesawat yang lebih besar.
Dalam kondisi seperti sekarang, Bandara
Tampa Padang sudah pernah didarati
pesawat jenis boeing 737 untuk mengangkut
jemaah haji tahun lalu ke Embarkasi
Makassar. Dan sekarang ini secara rutin telah
ada penerbangan pesawat dengan kapasitas
+ 75 orang dengan rute Makassar-Mamuju.
Aktivitas penerbangan pada tahun 2009,
memperlihatkan kinerja yang cukup
menggembirakan. Hal ini terlihat dari
meningkatnya jumlah kunjungan pesawat dari
7.1. Road And Landways Transportation
Road is a very important infrastructure
for transportation inaccelerating economic
activity. The development program require
transportation to support population mobility
and distribution of goods and services from
and for other city.
Overall length of road in West Sulawesi
Year 2009 approximately 6 888,45 Km.
however, this condition is quite alarming
because in terms of road conditions, nearly
half the length of surface road in West
Sulawesi kondidi damaged (in category;
demaged and severally demaged)
approximately 43,47 percent.
7.2 Air Transportation
One relatively new mode of
transport began to develop in West Sulawesi
is the Tampa Padang Airport. Circumstances
Tampa Padang Airport is still under
construction in order to accommodate larger
aircraft. In conditions like today, the Tampa
Padang Airport has never landed the aircraft
types Boeing 737 to transport the pilgrims last
year to the embarkation of Makassar. And
now this routine has no aviation aircraft with
capacity of 75 people with-Makassar route
Mamuju. Aviation activity in 2009, showed a
promising performance. This can be seen
from the increasing number of visits to and
from aircraft Mamuju.
During the year 2009 flight carrying about 360

TRANSPORTASI DAN KOMUNIKASI
SULAWESI BARAT DALAM ANGKA 2010 310
dan ke Mamuju.
Selama tahun 2009 tercatat sekitar 360 kali penerbangan. Aktivitas penerbangan tertinggi pada Bulan Oktober sektar 45 kali penerbangan, berarti dalam sehari terdapat lebih dari satu kali penerbangan. Jumlah penumpang yang berangkat dari Bandara Tampa Padang selama tahun 2009 sekitar 8.832 orang dan 7.213 orang yang tiba di Bandara Tampa Padang. Jumlah bagasi yang dimuat selama tahun 2009 sekita 37.314 kg, serta penumpang yang datang dengan membawa bagasi sebanyak 38.750 kg.
7.3 Angkutan Laut Sulawesi Barat yang wilayahnya
membujur ke arah utara mempunyai wilayah pesisir pada sepanjang garis pantai barat antara perbatasan wilayah Sulawesi Selatan dan Sulawesi Tengah. Sehingga Sulawesi Barat memiliki potensi laut yang cukup besar, misalnya tempat penangkapan ikan dan pengadaan moda angkutan laut. Di Sulawesi Barat sendiri terdapat beberapa pelabuhan yang didukung oleh beberapa satker pelabuhan.
Aktivitas pelabuhan selama tahun 2009, sedikit mengalami peningkatan dari tahun sebelumnya. Pelayaran nasional sebanyak 2.590 trip dengan jumlah penumpang naik di semua pelabuhan sekitar 35.196 orang sedangkan yang turun pada semua pelabuhan sekitar 24.967 orang. Selain pelayaran nasional, juga terdapat pelayaran asing yang khusus mengangkut produk olahan CPO ke luar negeri seperti China, dan Taiwan.
.
times. Aviation activities occur densely on the
Moon in October about 45 times a flight,
means the day there is more than one flight.
While the number of passengers leaving from
the Tampa Padang Airport around 8 832
people and 7 213 people who arrived at the
Tampa Padang Airport.
The number of baggage loaded during
the year 2009 About a 37 314 kg, with a
passenger who arrived with a trunk as much
as 38 750 kg.
7.3 Marine Transportation
Sulawesi Barat is located on the
shoreline along the western island of
Sulawesi, has the potential for a fairly bright
sea, marine transport modes such as
procurement. Sulawesi Barat itself several
ports that are supported by several satker
port.
Port activities during the year 2009, slightly
increased from the previous year. National
shipping as many as 2590 trip with the
number of passengers increased in all ports
around 35 196 people while down on all the
ports around 24 967 people. In addition to the
national shipping, foreign shipping there are
also specific transport of processed palm oil
products to foreign countries like China, and
Taiwan.
TRANSPORTATION AND COMMUNICATION
SULAWESI BARAT IN FIGURES 2010 311
7.3 Tingkat Penghunian Kamar Hotel
Tingkat penghunian kamar hotel di Sulawesi Barat selama tahun 2009 sekitar 33,66 persen, di mana pada Bulan Juni mencapai nila tertinggi sebesar 43,88 persen
7.3 Rooms Occupancy Rate
Room occupancy rate of hotels in West
Sulawesi during the year 2009 approximately
33.66 per cent, where in June reached the
highest at 43.88 percent indigo

TRANSPORTASI DAN KOMUNIKASI
SULAWESI BARAT DALAM ANGKA 2010 312
Grafik 7.1 Panjang Jalan di Sulawesi Barat Men urut Status, 2009 Fihgure Length Road at Sulawesi Barat by Status, 2009

TRANSPORTATION AND COMMUNICATION
SULAWESI BARAT IN FIGURES 2010 313
Grafik 7.2 Perkembangan Jumlah Penumpang yang Me lalui Bandara Tampa Padang, Tahun 2005-2009
Figure Progres of Passenger at Tampapadang Airport , 2005-2009

TRANSPORTASI DAN KOMUNIKASI
SULAWESI BARAT DALAM ANGKA 2010 314
Grafik 7.3 Perkembangan Tingkat Penghunian Kamar Hotel (TPK) Selama 2009 Figure Progre of Occupantion Room Rate in 2009
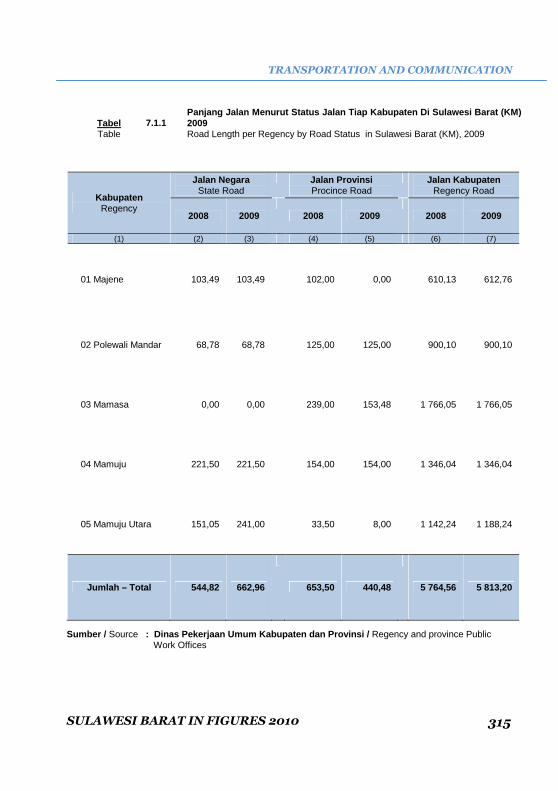
TRANSPORTATION AND COMMUNICATION
SULAWESI BARAT IN FIGURES 2010 315
Tabel 7.1.1 Panjang Jalan Menurut Status Jalan Tiap Kabupaten D i Sulawesi Barat (KM) 2009
Table Road Length per Regency by Road Status in Sulawesi Barat (KM), 2009
Kabupaten Regency
Jalan Negara State Road
Jalan Provinsi Procince Road
Jalan Kabupaten Regency Road
2008 2009
2008 2009
2008 2009
(1) (2) (3) (4) (5) (6) (7)
01 Majene 103,49 103,49
102,00 0,00
610,13 612,76
02 Polewali Mandar 68,78 68,78
125,00 125,00
900,10 900,10
03 Mamasa 0,00 0,00
239,00 153,48
1 766,05 1 766,05
04 Mamuju 221,50 221,50
154,00 154,00
1 346,04 1 346,04
05 Mamuju Utara 151,05 241,00
33,50 8,00
1 142,24 1 188,24
Jumlah – Total 544,82 662,96
653,50 440,48
5 764,56 5 813,20
Sumber / Source : Dinas Pekerjaan Umum Kabupaten dan Provinsi / Regency and province Public Work Offices

TRANSPORTASI DAN KOMUNIKASI
SULAWESI BARAT DALAM ANGKA 2010 316
Tabel 7.1.2 Panjang Jalan Menurut Jenis Permukaan Di Sulawesi B arat, 2008-2009 Table Length of Road by Type of Surface in Sulawesi Barat,2007-2009
Jenis Permukaan Type of Surface
Jalan Negara Jalan Provinsi
2008 (km)
2009 (km)
Perubahan (%)
2008 (km)
2009 (km)
Perubahan (%)
(1) (2) (3) (4) (5) (6) (7)
a. Diaspal 475,39 634,77 33,53 368,00 106,00 -71,20
b. Kerikil 27,43 0,00 -100,00 261,50 234,48 -10,33
c. Tanah 0,00 0,00 0,00 24,00 36,00 50,00
d. Tidak Dirinci 42,00 0,00 -100,00 0,00 64,00 -100,00
Jumlah – Total 544,82 634,77 16,51 653,50 440,48 -32,60

TRANSPORTATION AND COMMUNICATION
SULAWESI BARAT IN FIGURES 2010 317
Lanjutan Tabel / Table Continued : 7.1.2
Jenis Permukaan Type of Surface
Jalan Kabupaten
2008 (km)
2009 (km)
Perubahan (%)
(1) (8) (9) (10)
a. Diaspal 950,55 1 099,75 15,70
b. Kerikil 1 816,73 1 686,37 -7,18
c. Tanah 2 248,87 2 223,89 -1,11
d. Tidak Dirinci 748,41 803,18 7,32
Jumlah – Total 5 764,56 5 813,20 0,84
Sumber / Source : Dinas Pekerjaan Umum Kabupaten dan Provinsi / Regency and province Public Work Offices

TRANSPORTASI DAN KOMUNIKASI
SULAWESI BARAT DALAM ANGKA 2010 318
Tabel 7.1.3 Panjang Jalan Menurut Kondisi Jalan Di Sulawesi Bar at, 2008-2009 Table Length of Road by Road Condition in Sulawesi Barat,2008-2009
Kondisi Jalan Road Condition
Jalan Negara Jalan Provinsi
2008 (km)
2009 (km)
Perubahan (%)
2008 (km)
2009 (km)
Perubahan (%)
(1) (2) (3) (4) (5) (6) (7)
a. Baik 439,39 589.77 34,22 379,70 155,00 -59,18
b. Sedang 68,00 35,00 -45,53 96,60 103,00 6,63
c. Rusak 37,43 10,00 -73,28 131,70 62,41 -52,61
d. Rusak Berat 0,00 0,00 0,00 45,50 102,07 163,89
Jumlah – Total 544,82 634,77 16,51 653,50 440,48 -32,60

TRANSPORTATION AND COMMUNICATION
SULAWESI BARAT IN FIGURES 2010 319
Lanjutan Tabel/ Table Continued : 7.1.3
Kondisi Jalan Road Condition
JALAN KABUPATEN
2008 (km)
2009 (km)
Perubahan (%)
(1) (8) (9) (10)
a. Baik 1 831,85 1 982,00 8,20
b. Sedang 969,00 1 029,27 6,22
c. Rusak 1878,24 1 596,95 -14,98
d. Rusak Berat 1 085,48 1 204,98 11,01
Jumlah – Total 5 764,56 5 813,20 0,84
Sumber / Source : Dinas Pekerjaan Umum Kabupaten dan Provinsi / Regency and province Public Work Offices

TRANSPORTASI DAN KOMUNIKASI
SULAWESI BARAT DALAM ANGKA 2010 320
Tabel 7.1.4 Panjang Jalan Menurut Kelas Jalan Di Sulawesi Barat , 2008-2009 Table Length of Road by Class in Sulawesi Barat,2008-2009
Kelas Jalan Road Class
Jalan Negara
Jalan Provinsi
2008 (km)
2009 (km)
Perubahan (%)
2008 (km)
2009 (km)
Perubahan
(%) (1) (2) (3) (4) (5) (6) (7)
a. Kelas I 151,05 214,85 42,24
199,00 0,00 -100,00
b. Kelas II 290,28 75,43 -74,01
153,50 0,00 -100,00
c. Kelas III 103,49 103,49 0,00
159,00 440,48 177,03
d. Kelas IIIA 0,00 0,00 0,00
0,00 0,00 0,00
e. Kelas IIIB 0,00 0,00 0,00
114,00 0,00 -100,00
f. Kelas IIIC 0,00 0,00 0,00
4,00 0,00 -100,00
g. Tidak Dirinci 0,00 241,00 -100,00
24,00 0,00 -100,00
Jumlah – Total 544,82 634,77 16,51
653,50 440,48 -32,60
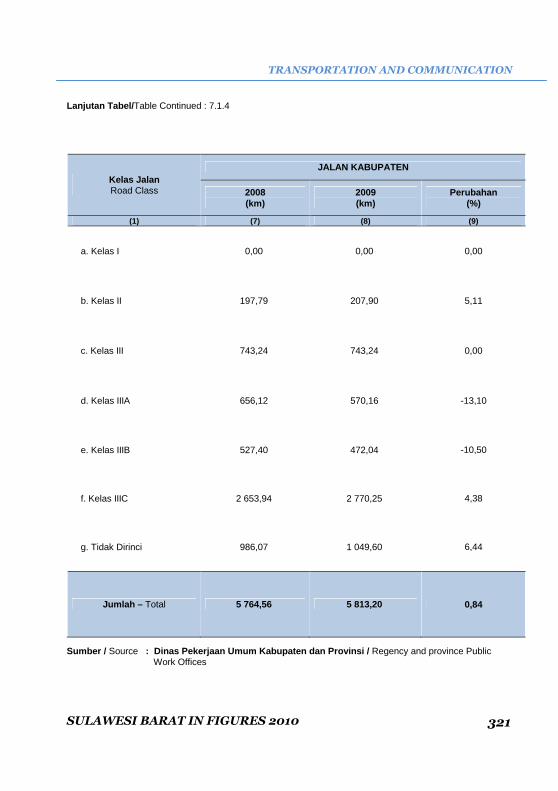
TRANSPORTATION AND COMMUNICATION
SULAWESI BARAT IN FIGURES 2010 321
Lanjutan Tabel/ Table Continued : 7.1.4
Kelas Jalan Road Class
JALAN KABUPATEN
2008 (km)
2009 (km)
Perubahan (%)
(1) (7) (8) (9)
a. Kelas I 0,00 0,00 0,00
b. Kelas II 197,79 207,90 5,11
c. Kelas III 743,24 743,24 0,00
d. Kelas IIIA 656,12 570,16 -13,10
e. Kelas IIIB 527,40 472,04 -10,50
f. Kelas IIIC 2 653,94 2 770,25 4,38
g. Tidak Dirinci 986,07 1 049,60 6,44
Jumlah – Total 5 764,56 5 813,20 0,84
Sumber / Source : Dinas Pekerjaan Umum Kabupaten dan Provinsi / Regency and province Public Work Offices

TRANSPORTASI DAN KOMUNIKASI
SULAWESI BARAT DALAM ANGKA 2010 322
Tabel 7.1.5 Lalu Lintas Penerbangan Dalam Negeri Di Pelabuhan U dara Tampapadang, 2009
Table Domestic Air Traffic at Tampapadang Air Port, 2009
Bulan Month
Pesawat Aircrafts (Unit)
Penumpang Passengers
(Jiwa)
Berangkat Departures
Datang Arrivals
Berangkat Departures
Datang Arrivals
Transit Transit
(1) (2) (3) (4) (5) (6)
Januari – January 17 17
583 524 -
Februari – February 13 13
458 470 -
Maret – March 16 16
558 539 -
April – April 10 10
242 264 -
Mei - M a y 30 30
739 568 -
Juni – Juny 28 28
337 297 -
Juli – July 41 41
911 662 -
Agustus – August 41 41
912 800 -
September – September 37 37
887 788 -
Oktober – October 45 46
842 688 -
Nopember – November 43 42
1 028 655 -
Desember – December 39 39
832 958 -
Jumlah - Total 360 360
8 829 7 213 -
2008 299 299
7 652 7 389 -
2007 199 199
2 921 2 872 -
2006 250 250
3 962 3 828 -
2005 230 230
3 113 3 006 95

TRANSPORTATION AND COMMUNICATION
SULAWESI BARAT IN FIGURES 2010 323
Lanjutan Tabel/ Table Continued : 7.1.5
Bulan Month
Bagasi Baggage
(Kg)
Barang Cargo (Kg)
Paket Pos Mail (Kg)
Muat Loaded
Bongkar Unloaded
Muat Loaded
Bongkar Unloaded
Muat Loaded
Bongkar Unloaded
(1) (7) (8) (9) (10) (11) (12)
Januari – January 2 960 4 057
- -
- -
Februari – February 2 596 2 860
- -
- -
Maret – March 2 434 4 047
- -
- -
April – April 660 1 425
- -
- -
Mei - M a y 3 522 3 601
- -
- -
Juni – Juny 1 674 968
- -
- -
Juli – July 1 473 895
- -
- -
Agustus – August 4 700 4 349
- -
- -
September – September 4 805 4 760
- -
- -
Oktober – October 4 501 4 600
- -
- -
Nopember – November 3 806 3 904
- -
- -
Desember – December 4 163 3 290
- -
- -
Jumlah - Total 37 314 38 756
- -
- -
2008 35 787 45 298
- -
- -
2007 14 064 15 269
- -
- -
2006 20 540 21 149
- -
- -
2005 18 014 15 087
- -
- -
Sumber / Source : Divisi Perhubungan Udara, Bandar Udara Tampa Padang Mamuju, Propinsi Sulawesi Barat / Division of Air Transportation, Tampa Padang Airport Mamuju, Province of Sulawesi Barat

TRANSPORTASI DAN KOMUNIKASI
SULAWESI BARAT DALAM ANGKA 2010 324
Tabel 7.1.6 Aktivitas Pelabuhan Sulawesi Barat 2009 Table Seaport Activitie in Sulawesi Barat, 2009
Bulan Month
Pelayaran Nasional
Pelayaran Umum
Non Pelayaran
Pelayaran Rakyat
Pelayaran Luar Negeri
(1) (2) (3) (4) (5) (6)
Januari – January 2 2 84 59 5
Februari – February - 5 88 82 4
Maret – March - 3 125 72 -
April – April - 3 183 63 1
Mei - M a y - 1 189 82 1
Juni – Juny - 2 173 109 2
Juli – July - 4 157 68 7
Agustus – August 1 3 110 76 4
September – September 1 3 170 56 5
Oktober – October 3 3 203 64 7
Nopember – November 2 1 97 75 2
Desember – December 2 - 101 63 5
Jumlah - Total 11 30 1 680 869 43
2008 46 - 1 225 1 031 10
2007 71 18 1 102 1 131 8
2006 73 192 1 011 1 095 12
Sumber / Source : Hasil Pengolahan Simoppel Sulawesi Barat / Result Processing Of Simoppel of se-Sulawesi Barat

TRANSPORTATION AND COMMUNICATION
SULAWESI BARAT IN FIGURES 2010 325
Tabel 7.1.7 Aktivitas Muat Pelabuhan Sulawesi Barat Menurut Je nis Muatan/Komoditi 2007-2009
Table The Activity of Loading Port at Sulawesi Barat by kind Loaded/Komodity, 2007-2009
Jenis Muatan Kinds Loaded
Satuan Metric
2007 2008 2009
(1) (2) (3) (4) (5)
Minyak Sawit – CPO Ton 171 412 186 607 229 368
Biji Sawit – Carnel Ton 42 102 31 484 33 729
Jeruk - Orange Ton 318 3 25
Karang – Coral M3 20 112 6 319 1 934
PKO/Bungkil Ton - 8 090 10 958
Jagung - Popcorn Ton - 3 058 2 465
Mobil – Cars Unit 2 860 2 524 2 208
Motor – Motorcycles Unit 864 961 1 123
Hewan – Animals Ekor 19 323 19 411 17 571
Barang Campuran – Goods Ton 17 588 988 566
Pisang - Banana Batang - 835 337
Sumber / Source : Hasil Pengolahan Simoppel Sulawesi Barat / Result Processing Of Simoppel of se-Sulawesi Barat

TRANSPORTASI DAN KOMUNIKASI
SULAWESI BARAT DALAM ANGKA 2010 326
Tabel 7.1.8
Aktivitas Bongkar Pelabuhan Sulawesi Barat Menurut Jenis Muatan/Komoditi 2007-2009
Table The Activity of Discharging Port in Sulawesi Barat by Kind Loaded/Komodity, 2007-2009
Jenis Muatan Kinds Loaded
Satuan Metric
2007 2008 2009
(1) (2) (3) (4) (5)
BBM Ton - 265 115
Semen - Cement Ton 13 422 19 120 29 660
Kayu – Woods M3 291 - 1 855
Ikan - Fish M3 - 119 134
Tali Bekas Ton - 16 12
Mobil – Cars Batang 2 352 2 332 2 370
Motor – Motorcycles Unit 1 427 1 230 1 352
Hewan – Animals Unit - 494 74
Barang Campuran – Goods Ekor 3 298 624 458
Pupuk - Ton 13 092 17 660 17 456
Sumber / Source : Hasil Pengolahan Simoppel Sulawesi Barat / Result Processing Of Simoppel of se-Sulawesi Barat
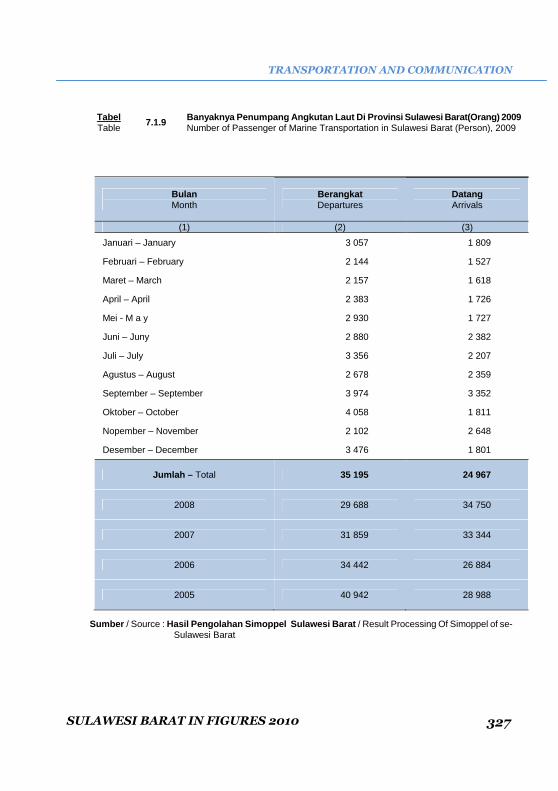
TRANSPORTATION AND COMMUNICATION
SULAWESI BARAT IN FIGURES 2010 327
Tabel 7.1.9 Banyaknya Penumpang Angkutan Laut Di Provinsi Sulaw esi Barat(Orang) 2009 Table Number of Passenger of Marine Transportation in Sulawesi Barat (Person), 2009
Bulan Month
Berangkat Departures
Datang Arrivals
(1) (2) (3)
Januari – January 3 057 1 809
Februari – February 2 144 1 527
Maret – March 2 157 1 618
April – April 2 383 1 726
Mei - M a y 2 930 1 727
Juni – Juny 2 880 2 382
Juli – July 3 356 2 207
Agustus – August 2 678 2 359
September – September 3 974 3 352
Oktober – October 4 058 1 811
Nopember – November 2 102 2 648
Desember – December 3 476 1 801
Jumlah – Total 35 195 24 967
2008 29 688 34 750
2007 31 859 33 344
2006 34 442 26 884
2005 40 942 28 988
Sumber / Source : Hasil Pengolahan Simoppel Sulawesi Barat / Result Processing Of Simoppel of se-Sulawesi Barat

TRANSPORTASI DAN KOMUNIKASI
SULAWESI BARAT DALAM ANGKA 2010 328
Tabel 7.1.10 Banyaknya Kunjungan Kapal Dan Jumlah Dwt/Grt Menuru t Jenis Pelayaran Dan Pelabuhan 2009
Table Number of Call Ships and Tonage by Sea Port and Trips, 2009
Kabupaten Regency
Pelabuhan Port
Pelayaran Nasional National
Pelayaran Asing
International
UNIT DWT/GRT
UNIT DWT/GRT
(1) (2) (3) (4) (5) (6)
01 Polewali Mandar Polewali Mandar 469 5 029
- -
02 Majene Majene 1 102 24 277
- -
03 Mamuju Mamuju 842 475 752
- -
04 Mamuju Utara Mamuju Utara 177 149 402
43 81 956
2009 2 590 654 460
43 81 956
2008 2 302 618 437
10 29 068
2007 2 322 617 991
8 17 974
2006 2 383 572 911
12 44 895
SUMBER : HASIL PENGOLAHAN SIMOPPEL SE SULBAR Source :

TRANSPORTATION AND COMMUNICATION
SULAWESI BARAT IN FIGURES 2010 329
Tabel 7.2.1
Banyaknya Stasiun Pemancar TVRI Serta Kekuatan Daya Pancar Menurut Tempat Kedudukannya Di Sulawesi Barat 2009
Table Number of TVRI Transmitter Station and Broadcasting Power in Sulawesi Barat, 2009
NO Stasiun Pemancar Transmitter Station
Saluran/Kekuatan Channel/Power
Melayani Daerah Area of Service
(1) (2) (3) (4)
01 Bukit Malotong (kab. Polewali Mandar)
Channel 7 / 1 x 300 W dan 1 x 100 W
Kabupaten Mamasa Yang Meliputi Kecamatan Mamasa, Kecamatan Mambi, Kecamatan Aralle, Malotong
02 Majene (Kab. Majene) Channel 4 / 2 x 50 W
Seluruh Kabupaten Mejene dan Sebagian Kabupaten Polewali Mandar Yang Meliputi Kecamatan Tinambung dan Pambusuang
03 Mamuju (Kab. Mamuju) Channel 4 / 1 x 50 W
Seluruh Kabupaten Mamuju dan Sebagian Kabupaten Majene yang Meliputi Kecamatan Malunda
04 Pasangkayu (kab. Mamuju) Channel 12 / 1 x 50 W Kota Pasangkayu
Sumber / Source: TVRI Stasiun Regionalsulawesi Barat / TVRI Regional Station of Sulawesi Barat

TRANSPORTASI DAN KOMUNIKASI
SULAWESI BARAT DALAM ANGKA 2010 330
Tabel 7.2.2
Tingkat Penghunian Kamar (TPK) Hotel Berbintang Dan Akomodasi Lainnya Di Provinsi Sulawesi Barat, 2009
Table Occupancy Rate at The Starry Hotel and Another Accomodation in Sulawesi Barat Province, 2009
Bulan
Hotel Berbintang Akomodasi Lainnya
TPK % Perubahan dari
bulan sebelumnya
TPK %
Perubahan dari bulan
sebelumnya
(1) (2) (3) (4) (5)
Januari – January - - 27,80 -
Februari – February - - 28,13 0,33
Maret – March - - 39,86 11,73
April – April - - 32,92 -6,94
Mei - M a y - - 31,99 ,0,93
Juni – Juny - - 43,88 11,89
Juli – July - - 35,17 ,8,71
Agustus – August - - 33,24 ,1,93
September – September - - 33,91 -0,67
Oktober – October - - 34,08 0,17
Nopember – November - - 35,96 1,88
Desember – December - - 27,17 -8,79
Rata-Rata- Average - - 33,66 0,13
2008 - - 33,79 12,42
2007 - - 46,21 -
Catatan: TPK adalah banyaknya malam kamar yang dihuni (room night occupied) dibagi dengan banyaknya
malam kamar yang tersedia (room night available) dikalikan 100%
Sumber / Source : Badan Pusat Statistik (BPS) Sulawesi Barat / Statistic of Sulawesi Barat Province

TRANSPORTATION AND COMMUNICATION
SULAWESI BARAT IN FIGURES 2010 331
Tabel 7.2.3
Rata-Rata Lama Menginap Tamu Asing Dan Nusantara Pa da Hotel Berbintang Dan Akomodasi Lainnya Di Provinsi Sulawe si Barat, 2009
Table Average of Length Stay of Foreogn and Domestic Guest at The Starry Hotel and Another Accomodation in S Barat Province, 2009
Bulan Hotel Berbintang
Akomodasi Lainnya
Asing Nusantara Asing Nusantara
(1) (2) (3) (4) (5)
Januari – January - - 1,00 1,86
Februari – February - - 1,00 1,85
Maret – March - - 1,40 1,90
April – April - - 1,00 1,80
Mei - M a y - - 2,40 1,79
Juni – Juny - - 1,20 2,15
Juli – July - - 1,55 1,92
Agustus – August - - 1,13 2,13
September – September - - 1,00 2,94
Oktober – October - - 2,00 1,81
Nopember – November - - 1,00 2,58
Desember – December - - 1,75 1,78
Rata-Rata - - 1,44 2,02
2008 - - 1,03 1,51
2007 - - 7,36 1,97
Sumber / Source : Badan Pusat Statistik (BPS) Sulawesi Barat / Statistic of Sulawesi Barat Province

TRANSPORTASI DAN KOMUNIKASI
SULAWESI BARAT DALAM ANGKA 2010 332
Tabel
7.2.4
Rata-Rata Tamu Per Kamar ( Guest Per Room) Pada Hotel Berbintang Dan Akomodasi Lainnya Di Provinsi Sulawesi Barat, 2009 Average of Guest Per Room (GPR) at Starry Hotel And Another Accommodation Sulawesi Barat Province, 2009
Table
Bulan
HOTEL BERBINTANG
Star Hotel
AKOMODASI LAINNYA
Other Accomodation
GPR Perubahan dari bulan
sebelumnya
GPR
Perubahan dari bulan
sebelumnya
(1) (2) (3) (4) (5)
Januari – January - - 1,70 -
Februari – February - - 1,84 0,14
Maret – March - - 1,73 -0,11
April – April - - 1,68 -0,05
Mei - M a y - - 1,73 0,05
Juni – Juny - - 1,66 -0,07
Juli – July - - 1,81 0,16
Agustus – August - - 1,77 -0,05
September – September - - 2,07 0,13
Oktober – October - - 1,71 -0,35
Nopember – November - - 1,82 0,10
Desember – December - - 1,84 -0,02
RATA-RATA - -
1,78 0,07
2008 - - 1,71 0,07
2007 - -
1,64 -
Catatan / Note : GPR adalah perbandingan antara banyaknya malam tamu atau malam tempat tidur (guest
nights or bed nights) dengan banyaknya malam kamar yang dihuni (room night occupied),
Sumber / Source : Badan Pusat Statistik (BPS) Sulawesi Barat / Statistic of Sulawesi Barat Province

8 KEUANGAN DAERAH
Finance

FINANCE
SULAWESI BARAT IN FIGURES 2010
335
8.1 Perbankan Lembaga keuangan yang cukup menggeliat di Sulawesi Barat adalah jasa perbankan. Tugas utama perbankan yang menghimpun dan menyalurkan dana dan bantuan kepada masyarakat, cukup besar pengaruhnya dalam menarik animo mayarakat untuk menggunakan jasa perbankan.
Selama tahun buku 2009, hingga triwulan IV/2009, total dana perbankan yang terparkir di Sulawesi Barat mencapai 1.524,556 milyar upiah, yang tersebar hampir di semua bank pemerintah sekitar 1.400,709 milyar rupiah sedangkan sisanya dikelola oleh perbankan swasta dan BPR.
Simpanan perbankan di Sulawesi Barat, masih didominasi oleh tabungan sekitar 1.151,986 milyar rupiah, sedangkan tabungan berjangka/deposito hanya mendapat jatah sekitar 102,409 milyar rupiah.
8.2 Keuangan Daerah Pengeluaran pemerintah merupakan salah satu aspek penggunaan sumber daya ekonomi yang secara langsung dikuasai dan dimiliki oleh pemerintah dan secara tak langsung dimiliki oleh masyarakat melalui pembayaran pajak.
Rencana Pengeluaran Pemerintah
Provinsi Sulawesi Barat pada tahun 2009 sebelum perubahan sebesar Rp 651,715 milyar rupiah milyar yang terdiri dari Belanja Tidak Langsung sebesar Rp 124,068 milyar dan Belanja Langsung sebesar Rp 527,646 milyar.
8.3. Harga-Harga
Laju inflasi Kota Mamuju selama tahun 2009 sama dengan laju inflasi “year on
year” (Desember 2009 terhadap Desember
2008) sebesar 11,66 persen.
8.1. Banking Financial institutions are quite stretched in Sulawesi Barat is a banking service. The main tasks of banking that raise and distribute funds and assistance to the community, big enough influence in attracting the interest of society to use banking services.
During fiscal year 2009, up IV/2009 quarter, total banking funds parked in Sulawesi Barat reached 1524.556 billion upiah, scattered in almost every state bank of 1400.709 billion rupiah, while the rest are managed by private banks and rural banks.
Savings banks in Sulawesi Barat, is still dominated by the savings of about 1151.986 billion rupiah, while savings deposits / deposit ration only get about 102.409 billion rupiah.
8.2 Regional Goverment Finance
Government spending is one aspect of the use of economic resources which are directly controlled and owned by the government and indirectly owned by the community through tax payments.
Sulawesi Barat Provincial Government Expenditures in the year 2009 before the change amounted to USD 651,715 billion rupiah billion comprising Indirect Expenditures amounted to USD 124,068 billion and the Direct Expenditure amounted to Rp 527,646 billion.
8.3 Prices
Mamuju inflation rate during the year 2009 equal to the rate of inflation "year on year" (December 2009 to December 2007) amounted to 11.66 percent.

KEUANGAN
SULAWESI BARAT DALAM ANGKA 2010
336
Inflasi tersebut secara umum disebabkan oleh kenaikan indeks harga berbagai komoditi pada empat kelompok barang dan jasa berikut: kelompok bahan makanan 6,20 persen; kelompok makanan jadi, minuman, rokok dan tembakau 0,61 persen; kelompok sandang 1,11 persen; dan kelompok pendidikan, rekreasi dan olahraga 0,25 persen. Sedangkan indeks harga pada kelompok perumahan, air, listrik, gas, bahan bakar dan kelompok transpor, komunikasi, jasa keuangan masing-masing turun 0,38 persen dan 2,74 persen.
Inflation is generally caused by an increase in the price index of commodities in the four groups of goods and services as follows: 6.20 percent of the food group, food, beverage, cigarette and tobacco 0.61 percent, 1.11 percent of the clothing group, and group education, recreation and sport 0.25 percent. While the price index on housing, water, electricity, gas, fuel and transport groups, communications, financial services each fell 0.38 percent and 2.74 percent.

FINANCE
SULAWESI BARAT IN FIGURES 2010
337
Grafik 8.1 Jumlah Kredit yang Disalurkan Oleh Pe rbankan di Sulawesi Barat (Juta Rupiah), 2009
Figure Credits Potition By Economi Sector In Sulawesi Barat (Million Rupiahs), 2009

KEUANGAN
SULAWESI BARAT DALAM ANGKA 2010
338
Grafik 8.2 Anggaran Pendapatan dan Belanja Pemer intah Provinsi Sulawesi Barat (Juta Rupiah), 2009
Figure Draft local Revenue and Expenditure of The Government of Sulawesi Barat Province, 2009

FINANCE
SULAWESI BARAT IN FIGURES 2010
339
Grafik 8.3 Nilai Tukar Beberapa Mata Uang Asing Terhadap Rupiah, Selama 2005 – 2010
Figure Foreign Exchange Rate of Foreign Currencies ti The Rupiahs, 2005-2010
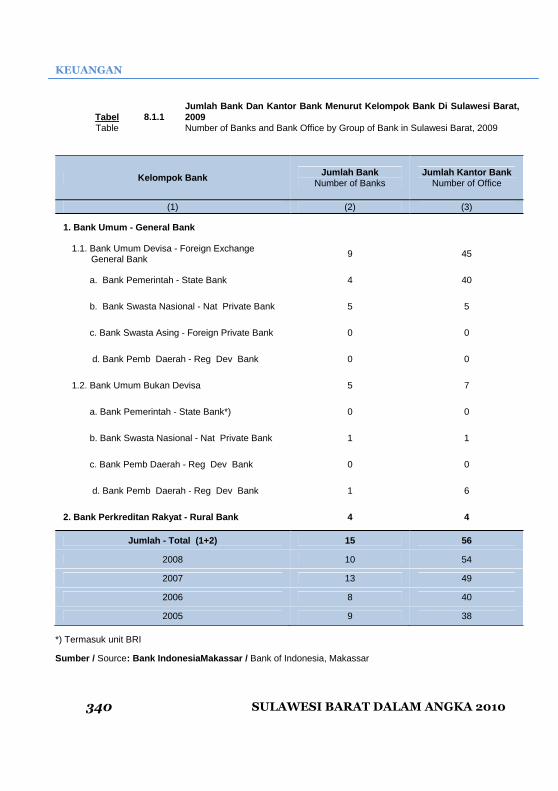
KEUANGAN
SULAWESI BARAT DALAM ANGKA 2010
340
Tabel 8.1.1 Jumlah Bank Dan Kantor Bank Menurut Kelompok Bank D i Sulawesi Barat, 2009
Table Number of Banks and Bank Office by Group of Bank in Sulawesi Barat, 2009
Kelompok Bank Jumlah Bank Number of Banks
Jumlah Kantor Bank Number of Office
(1)
(2)
(3)
1. Bank Umum - General Bank
1.1. Bank Umum Devisa - Foreign Exchange General Bank
9 45
a. Bank Pemerintah - State Bank 4 40
b. Bank Swasta Nasional - Nat Private Bank 5 5
c. Bank Swasta Asing - Foreign Private Bank 0 0
d. Bank Pemb Daerah - Reg Dev Bank 0 0
1.2. Bank Umum Bukan Devisa 5 7
a. Bank Pemerintah - State Bank*) 0 0
b. Bank Swasta Nasional - Nat Private Bank 1 1
c. Bank Pemb Daerah - Reg Dev Bank 0 0
d. Bank Pemb Daerah - Reg Dev Bank 1 6
2. Bank Perkreditan Rakyat - Rural Bank 4 4
Jumlah - Total (1+2) 15 56
2008 10 54
2007 13 49
2006 8 40
2005 9 38
*) Termasuk unit BRI
Sumber / Source : Bank IndonesiaMakassar / Bank of Indonesia, Makassar

FINANCE
SULAWESI BARAT IN FIGURES 2010
341
Tabel 8.1.2 Jumlah Bank Menurut Jenis Dan Status Kantor Di Sula wesi Barat, 2009 Table Number of Banks by Group of Bank and Status of Office in Sulawesi Barat, 2009
Perincian Description
Kantor Pusat Central Office
Kantor Cab.
Branch Office
Kantor Capem
Auxiliary of Branch Office
Kantor Wilayah Inspek. Regional
Inspection Office
Kantor Kas Cash Office
Jumlah Total
(1)
(2)
(3)
(4)
(5)
(6)
(7)
1. Bank Indonesia - Bank of Indonesia - - - - - -
2. Bank Pemerintah - State Bank -
- Bank Rakyat Indonesia*) - 3 23 - 3 29
- Bank Mandiri - 1 1 - 2
- Bank Negara Ind. 1946 - 1 3 - 4
- Bank Tabungan Negara - - 1 - 4 5
3. Bank Usaha Swasta Nas. Private Bank
- 1 3 - 2 6
4. Bank pemb. Daerah Reg.(State) Dev.Bank
- 4 1 - 1 6
5. BPR - Rural Bank 4 - - - - 4
Jumlah - Total 4 10 32 0 10 56
2008 3 10 11 - 30 54
2007 3 9 12 - 25 44
2006 3 8 7 - 22 40
2005 3 12 6 - 4 25
Catatan / Note : Termasuk BRI Unit /Include Unit of Bank Rakyat Indonesia
Sumber / Source : Bank IndonesiaMakassar / Bank of Indonesia, Makassar
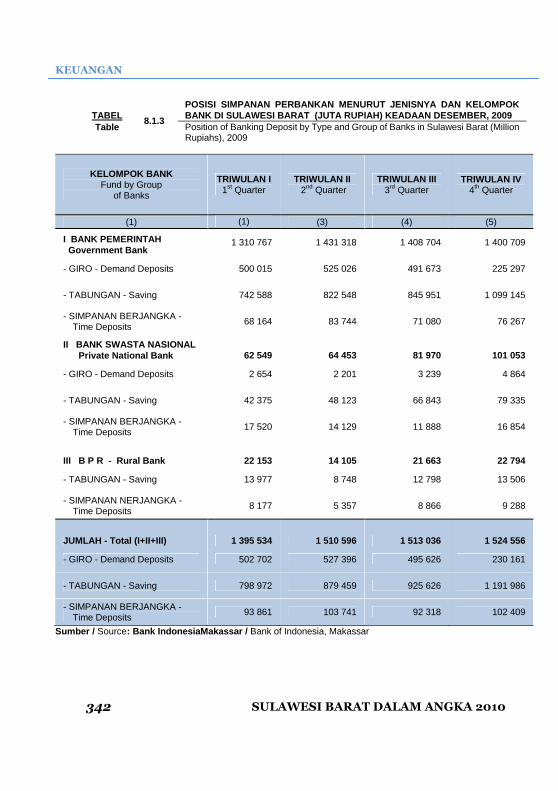
KEUANGAN
SULAWESI BARAT DALAM ANGKA 2010
342
TABEL 8.1.3
POSISI SIMPANAN PERBANKAN MENURUT JENISNYA DAN KELO MPOK BANK DI SULAWESI BARAT (JUTA RUPIAH) KEADAAN DESEM BER, 2009
Table Position of Banking Deposit by Type and Group of Banks in Sulawesi Barat (Million Rupiahs), 2009
KELOMPOK BANK Fund by Group
of Banks
TRIWULAN I 1st Quarter
TRIWULAN II 2nd Quarter
TRIWULAN III 3rd Quarter
TRIWULAN IV 4th Quarter
(1) (1)
(3)
(4)
(5)
I BANK PEMERINTAH Government Bank
1 310 767 1 431 318 1 408 704 1 400 709
- GIRO - Demand Deposits 500 015 525 026 491 673 225 297
- TABUNGAN - Saving 742 588 822 548 845 951 1 099 145
- SIMPANAN BERJANGKA - Time Deposits
68 164 83 744 71 080 76 267
II BANK SWASTA NASIONAL Private National Bank 62 549 64 453 81 970 101 053
- GIRO - Demand Deposits 2 654 2 201 3 239 4 864
- TABUNGAN - Saving 42 375 48 123 66 843 79 335
- SIMPANAN BERJANGKA - Time Deposits
17 520 14 129 11 888 16 854
III B P R - Rural Bank 22 153 14 105 21 663 22 794
- TABUNGAN - Saving 13 977 8 748 12 798 13 506
- SIMPANAN NERJANGKA - Time Deposits
8 177 5 357 8 866 9 288
JUMLAH - Total (I+II+III) 1 395 534 1 510 596 1 513 036 1 524 556
- GIRO - Demand Deposits 502 702 527 396 495 626 230 161
- TABUNGAN - Saving 798 972 879 459 925 626 1 191 986
- SIMPANAN BERJANGKA - Time Deposits
93 861 103 741 92 318 102 409
Sumber / Source : Bank IndonesiaMakassar / Bank of Indonesia, Makassar

FINANCE
SULAWESI BARAT IN FIGURES 2010
343
Tabel 8.1.4 Posisi Kredit Perbankan Menurut Sektor Ekonomi Di S ulawesi Barat (Juta Rupiah), 2006-2009
Table Credits Potition By Economi Sector In Sulawesi Barat (Million Rupiahs), 2006-2009
Penggunaan Bidang Ekonomi Using For Economic Sektor
2006 2007 2008 2009
(1)
(2)
(3)
(4)
(5)
1. Pertanian -Agriculture 129 760 97 214 264 199 306 204
2. Pertambangan – Mining 1 825 3 2 679 376
3. Industri – Industry 2 622 3 300 6 026 6 469
4. Listrik, Gas & Air – Electricity, Gas & Water - 110 - 372
5. Konstruksi – Construction 17 501 47 659 78 916 72 647
6. Perdagangan – Trade 258 519 331 656 640 972 718 845
7. Angkutan – Transportation 677 117 852 2 908
8. Jasa Dunia Usaha – Bussiness Service 4 807 12 289 30 123 23 143
9. Jasa Sosial – Services 782 5 449 9 622 31 751
10. Lainnya – Others 487 434 613 513 923 250 966 336
Jumlah – Total 903 928 1 111 309 1 956 640 2 129 052
Sumber / Source : Bank IndonesiaMakassar / Bank of Indonesia, Makassar

KEUANGAN
SULAWESI BARAT DALAM ANGKA 2010
344
Tabel 8.1.5 Posisi Kredit Perbankan Menurut Jenis Penggunaan Di Sulawesi Barat (Dalam Juta Rupiah), 2006-2009
Table Banking Credits by Group of Bank in Sulawesi Barat ( In Million Rupiah), 2006-2009
Jenis Penggunaan Type For Use
2006 2007 2008 2009
(1) (2) (3) (4) (5)
1. Bank Pemerintah – Government Bank 837 992 1 065 232 1 724 506 1 722 176
- Modal Kerja – Capital 263 732 369 947 675 980 685 129
- Investasi – Investment 96 742 95 968 155 495 170642
- Konsumsi - Consumption 447 518 599 317 893 031 866 405
2. Bank Swasta - Private Bank 50 433 44 231 229 626 404 798
- Modal Kerja - Capital 39 635 21 554 39 236 49 207
- Investasi - Investment 4 208 9 315 161 998 257 281
- Konsumsi - Consumption 6 590 13 362 28 392 98310
3. Bank Perkreditan RAKYAT – People Credit Bank
15 503 1 846 2 508 1 971
- Modal Kerja - Capital 8 469 1 013 681 457
- Investasi - Investment 3 707 - - -
- Konsumsi - Consumption 3 326 834 1 827 1 514
Jumlah - Total 903 928 1 111 309 1 956 640 2 129 052
- Modal Kerja - Capital 311 836 392 514 715 897 734 793
- Investasi - Investment 104 657 105 283 317 493 427 923
- Konsumsi - Consumption 487 434 613 513 923 250 966 336
Sumber / Source : Bank IndonesiaMakassar / Bank of Indonesia, Makassar

FINANCE
SULAWESI BARAT IN FIGURES 2010
345
Tabel 8.1.6 Banyaknya Penabung Dan Nilai Tabungan Dirinci Menur ut Kabupaten Di Sulawesi Barat 2009
Table Number of Depositors and Value of Saving by Regency in Sulawesi Barat 2009
Kode Wilayah
Area Code
Kabupaten Regency
Penabung Number of Depositors
Nilai Tabungan Value of Savings (Juta Rp./Million
Rupiahs))
(1)
(2)
(3)
(4)
01 Majene 28 909 184 476
02 Polewali Mandar 107 022 510 009
04 Mamuju 82 269 497 501
Jumlah - Total 218 200 1 191 986
2008 269 673 1 171 940
2007 189 351 759 577
2006 134 252 579 241
Catatan / Note : Jumlah Penabung dan Nilai Tabungan di Kabupaten Mam asa dan Mamuju Utara Tergabung Kedalam Kabupaten Induk / Number of Depositor and Value of Saving at Mamasa and Mamuju Utara Recorded in to Main Regency
Sumber / Source : Bank Indonesia Makassar / Bank of Indonesia Makassar
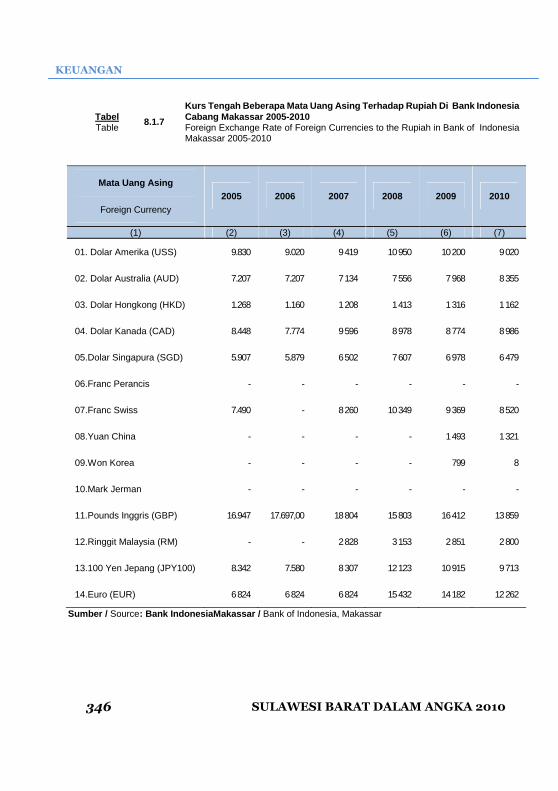
KEUANGAN
SULAWESI BARAT DALAM ANGKA 2010
346
Tabel 8.1.7
Kurs Tengah Beberapa Mata Uang Asing Terhadap Rupia h Di Bank Indonesia Cabang Makassar 2005-2010
Table Foreign Exchange Rate of Foreign Currencies to the Rupiah in Bank of Indonesia Makassar 2005-2010
Mata Uang Asing
Foreign Currency
2005 2006 2007 2008 2009 2010
(1) (2) (3) (4) (5) (6) (7)
01. Dolar Amerika (USS) 9.830 9.020 9 419 10 950 10 200 9 020
02. Dolar Australia (AUD) 7.207 7.207 7 134 7 556 7 968 8 355
03. Dolar Hongkong (HKD) 1.268 1.160 1 208 1 413 1 316 1 162
04. Dolar Kanada (CAD) 8.448 7.774 9 596 8 978 8 774 8 986
05.Dolar Singapura (SGD) 5.907 5.879 6 502 7 607 6 978 6 479
06.Franc Perancis - - - - - -
07.Franc Swiss 7.490 - 8 260 10 349 9 369 8 520
08.Yuan China - - - - 1 493 1 321
09.Won Korea - - - - 799 8
10.Mark Jerman - - - - - -
11.Pounds Inggris (GBP) 16.947 17.697,00 18 804 15 803 16 412 13 859
12.Ringgit Malaysia (RM) - - 2 828 3 153 2 851 2 800
13.100 Yen Jepang (JPY100) 8.342 7.580 8 307 12 123 10 915 9 713
14.Euro (EUR) 6 824 6 824 6 824 15 432 14 182 12 262
Sumber / Source : Bank IndonesiaMakassar / Bank of Indonesia, Makassar

FINANCE
SULAWESI BARAT IN FIGURES 2010
347
Tabel 8.2.1
Rancangan Pendapatan Daerah Pemerintah Provinsi Sul awesi Barat Menurut Jenis Pendapatan (Rupiah) 2009
Table Draft Local Revenue of The Government of Sulawesi Barat Province by Kind of Revenue (Rupiahs) 2009
Uraian Description
Sebelum Perubahan
Before Chaged
Setelah Perubahan
After Hanged
Bertambah / Berkurang Plus/Minus
(1) (2) (3) (4)
Pendapatan Daerah - Revenue of Local Government
574 142 329 436 578 682 329 436 4 540 000 000
Tahun 2009 574 142 329 436 578 682 329 436 4 540 000 000
1. Pendapatan Asli Daerah – Local Government Revenue
64 000 000 000 67 200 000 000 3 200 000 000
Hasil Pajak Daerah – Local Task Revenue 54 586 000 000 56 998 770 525 2 412 770 525
Hasil Retribusi Daerah – Local Retribution 1 371 500 000 1 516 075 000 144 575 000
Lain-Lain Pendapatan Asli Daerah Yang Sah – Other Local Government Legal Revenue
8 042 500 000 8 685 154 475 642 654 475
2. Dana Perimbangan – Balancing Funds 483 913 510 000 485 253 510 000 1 340 000 000
Bagi Hasil Pajak/Bagi Hasil Bukan Pajak – Tax Share and Non Tax Share 26 800 000 000 28 140 000 000 1 340 000 000
Dana Alokasi Umum – General Alocation Funds 391 060 510 000 391 060 510 000 0
Dana Alokasi Khusus – Special Alocation Funds 66 053 000 000 66 053 000 000 0
3. Lain-Lain Pendapatan Yang Sah – Other Legal Revenue
26 228 819 436 26 228 819 436 0
Pendapatan Hibah 26 228 819 436 26 228 819 436 0
Sumber / Source : Biro Keuangan, Kantor Gubernur Sulawesi Barat / Finansial Department of Sulawesi Barat Province

KEUANGAN
SULAWESI BARAT DALAM ANGKA 2010
348
Tabel 8.2.2
Rancangan Pengeluaran Daerah Pemerintah Provinsi Su lawesi Barat Menurut Jenis Pengeluaran (Rupiah) 2009
Table Draft Local Expenditure of The Government of Sulawesi Barat Province by Kind of Expenditure (Rupiahs) 2009
Uraian Description
Sebelum Perubahan
Before Chaged
Setelah Perubahan
After Hanged
Bertambah/ Berkurang Plus/Minus
(1) (2) (3) (4)
Belanja Daerah - Expenditure of Local Government
603 914 185 993 651 715 507 299 47 801 321 306
Tahun 2008 575 931 977 495 614 456 846 020 -6 979 911 484
Tahun 2009
1. Belanja Tidak Langsung 117 722 701 695 124 068 45 788 47 801 321 306
Belanja Pegawai – Expenditure for Government Official
75 913 701 695 75 384 655 315 (529 046 380)
Belanja hibah 6 631 000 000 6 411 000 000 50 000 000
Belanja Subsidi 0 2 248 230 380 2 248 230 380
Belanja Bantuan Sosial – Expenditure for Social Support 12 265 000 000 12 841 760 093 576 760 093
Belanja Bagi Hasil Kepada Provinsi/kab/Kota/Pemerintah Desa – Income Share for Province/Regency/Munacipility/Village Government Expenditure
19 183 000 000 23 183 000 000 4 000 000 000
Belanja Bantuan Keuangan Kepada Provinsi /Kabupaten/Kota dan Pemerintahan Desa
0 0 0
Belanja Tak Terduga – Non Budgeter Expenditure 4 000 000 000 4 000 000 000 0
2. Belanja Langsung 486 191 484 298 527 646 861 51 1 41 455 377 213
Belanja Pegawai - Expenditure for Government Official 5 875 666 580 54 858 572 701 (1 017 093 879)
Belanja Barang Dan Jasa 199 983 087 667 236 451 303 295 36 468 215 628
Belanja Modal 230 332 730 061 236 336 985 515 6 004 255 464
Sumber / Source : Biro Keuangan, Kantor Gubernur Sulawesi Barat / Finansial Department of Sulawesi Barat Province

FINANCE
SULAWESI BARAT IN FIGURES 2010
349
Tabel 8.2.3
Rekapitulasi Pembiayaan Daerah Pemerintah Provinsi Sulawesi Barat (Rupiah) 2009
Table Local Finance Recapitulation of The Government of Sulawesi Barat Province(Rupiahs) 2009
Uraian Description
Sebelum Perubahan
Before Chaged
Setelah Perubahan
After Hanged
Bertambah/ Berkurang Plus/Minus
(1) (2) (3) (4)
Pembiayaan Daerah - Local Government of Finance
1. Penerimaan Pembiayaan Daerah –Revenue of Local Government Finance
30 771 856 557 59 994 555 755 29 222 699 198
Sisa Lebih Perhitungan Anggaran Tahun Anggaran Sebelumnya
30 771 856 557 59 994 555 755 29 222 699 198
Penerimaan Pembiayaan 30 771 856 557 59 994 555 755 29 222 699 198
2. Pengeluaran Pembiayaan Daerah – Expenditure of Local Government Finance
Penyertaan Modal (Investasi) Pemerintah Daerah
1 000 000 000 - (1 000 000 000 )
Pembiayaan Netto– Finance Netto 29 771 856 557 59 994 555 755 30 222 699 198
Sisa Lebih Pembiayaan Anggaran Tahun Anggaran Sebelumnya (SILPA)
- (13 038 622 108) (13 038 622 108
)
Sumber / Source : Biro Keuangan, Kantor Gubernur Sulawesi Barat / Finansial Department of Sulawesi Barat Province

KEUANGAN
SULAWESI BARAT DALAM ANGKA 2010
350
Tabel 8.2.4 Rancangan Anggaran Pendapatan Dan Belanja Daerah Pe merintah Provinsi Sulawesi Barat (Rupiah) 2009
Table Draft of APBD of The Government of Sulawesi Barat Province (Rupiahs) 2009
Uraian Description
Jumlah Total
(1) (2)
Pendapatan Daerah - Revenue of Local Government
574 142 329 436
1. Pendapatan Asli Daerah – Local Government Revenue 64 000 000 000
Hasil Pajak Daerah – Local Task Revenue 54 586 000 000
Hasil Retribusi Daerah – Local Retribution 1 371 500 000
Lain-Lain Pendapatan Asli Daerah Yang Sah – Other Local Government Legal Revenue 8 042 500 000
2. Dana Perimbangan – Balancing Funds 483 913 510 000
Bagi Hasil Pajak/Bagi Hasil Bukan Pajak – Tax Share and Non Tax Share 26 800 000 000
Dana Alokasi Umum – General Alocation Funds 391 060 510 000
Dana Alokasi Khusus – Special Alocation Funds 66 053 000 000
3. Lain-Lain Pendapatan Yang Sah – Other Legal Revenue 26 228 819 436
Pendapatan Hibah 26 228 819 436

FINANCE
SULAWESI BARAT IN FIGURES 2010
351
Lanjutan Tabel/ Table Continued : 8.2.4
Uraian Description
Jumlah Total
(1) (2)
BELANJA DAERAH - Expenditure of Local Government
1. Belanja Tidak Langsung 117 722 701 695
Belanja Pegawai – Expenditure for Government Official 75 913 701 695
Belanja Hibah – Grant Expenditures 6 361 000 000
Belanja Bantuan Sosial – Expenditure for Social Support 12 265 000 000
Belanja Bagi Hasil Kepada Provinsi/kab/Kota/Pemerintah Desa – Income Share for Province/Regency/Munacipility/Village Government Expenditure 19 183 000 000
Belanja Bantuan Keuangan Kepada Provinsi/Kab/Kota dan pemerintah Desa – Expenditure Fund Support for Province/Regency/Munacipility/Village Government
-
Belanja Tak Terduga – Non Budgeter Expenditure 4 000 000 000
2. Belanja Langsung 486 191 484 298
Belanja Pegawai - Expenditure for Government Official 55 875 666 580
Belanja Barang Dan Jasa 199 983 087 667
Belanja Modal 230 332 730 051

KEUANGAN
SULAWESI BARAT DALAM ANGKA 2010
352
Lanjutan Tabel/ Table Continued : 8.2.4
Uraian Description
Jumlah Total
(1) (2)
Pembiayaan Daerah - Local Government of Finance
(29 771 856 557)
1. Penerimaan Pembiayaan Daerah – Revenue of Local Government Finance 30 771 856 557
Sisa Lebih Perhitungan Anggaran Tahun Anggaran Sebelumnya 30 771 856 557
2. Pengeluaran Pembiayaan Daerah – Expenditure of Local Government Finance 1 000 000 000
Penyertaan Modal (Investasi) Pemerintah Daerah 1 000 000 000
Pembiayaan Netto– Finance Netto 29 771 856 557
Sisa Lebih Pembiayaan Anggaran Tahun Anggaran Sebelumnya (SILPA) -
Sumber / Source : Biro Keuangan, Kantor Gubernur Sulawesi Barat / Finansial Department of Sulawesi Barat Province
FINANCE
SULAWESI BARAT IN FIGURES 2010
353
Tabel 8.2.5
Rancangan Pengeluaran Pemerintah Provinsi Sulawesi Barat Menurut Jenis Pengeluaran 2009
Table Draft Government Expenditureof Sulawesi Barat Province by Kind of Expenditure, 2009
Jenis Pengeluaran Expenditures
Aparatur Daerah Government Personnel
(1) (2)
01 BELANJA ADMINISTRASI UMUM – Personnel Expenditures -
. Belanja Pegawai – Pension Expenditures
Belanja Barang dan Jasa - Material Expenditures
Belanja Perjalanan Dinas Repair and Maintenance
Belanja Pemeliharaan – Inspection
02 BELANJA OPERASI DAN PEMELIHARAAN - Grant for Lower Regions -
Belanja Pegawai - Loan and Interest
Belanja Barang dan Jasa -Unpredictable Expenditures
Belanja Perjalanan Dinas – Unclassified
Belanja Pemeliharaan – Others
03 BELANJA MODAL -
JUMLAH – Total -
SUMBER : BIRO KEUANGAN - KANTOR GUBERNUR SULAWESI BARAT Source : Governor Office of Sulawesi Barat

KEUANGAN
SULAWESI BARAT DALAM ANGKA 2010
354
Tabel 8.3.1
APBD Pemerintah Kabupaten Se Provinsi Sulawesi Bara t Menurut Jenis dan Kabupaten (Ribu Rupiah), 2010
Table Budgeted Government Revenues & Expenditures by Kind and Regency (Thousand Rupiahs), 2010
Kabupaten Regency
Penerimaan Revenue
Belanja Expenditure
Penerimaan Pembiayaan
Financing Receipts
Pengeluaran Pembiayaan
Financing Expenditure
(1) (2) (3) (4) (5)
01 Majene 339 241 096 345 720 009 8 000 000 1 500 000
02 Polewali Mandar 485 301 755 428 749 986 5 448 230 12 000 000
03 Mamasa 315 261 666 334 261 666 30 000 000 11 000 000
04 Mamuju 527 842 398 529 047 013 71 242 992 70 038 376
05 Mamuju Utara 291 300 266 308 261 589 47 256 938 28 373 607
Jumlah 1 958 947 181 1 946 040 263 161 948 160 122 911 983
Sumber / Source : Hasil Survei APBD-2 BPS Kabupaten Se-Sulbar & Pemerintah Daerah Provinsi Sulawesi Barat /
Result of APBD-2 Regency Survey BPS-Statistics of Sulbar & Regional Government of Sulawesi Barat Province

FINANCE
SULAWESI BARAT IN FIGURES 2010
355
Tabel 8.3.2 Anggaran Pendapatan Pemerintah Kabupaten Se Provins i Sulawesi Barat Menurut Sumbernya (Ribu Rupiah), Tahun 2010
Table Government revenue Budget by Sources (Thousand Rupiahs),2010
Kabupaten Regency
PAD Dana
perimbangan
Lain-lain Pendapatan Yang Sah
Jumlah
(1) (2) (3) (4) (5)
01 Majene 9 506 390 323 826 338 5 908 367 339 241 096
02 Polewali Mandar 20 944 959 436 632 322 27 724 474 485 301 755
03 Mamasa 5 094 076 281 091 778 29 075 813 315 261 666
04 Mamuju 27 500 000 466 975 389 33 367 008 527 584 398
05 Mamuju Utara 4 645 446 275 321 949 11 332 872 291 300 267
Jumlah - Total 67 690 871 1 783 847 776 107 408 534 1 958 689 182
Sumber / Source : Hasil Survei APBD-2 BPS Kabupaten Se-Sulbar & Pemerintah Daerah Provinsi Sulawesi Barat /
Result of APBD-2 Regency Survey BPS-Statistics of Sulbar & Regional Government of Sulawesi Barat Province

KEUANGAN
SULAWESI BARAT DALAM ANGKA 2010
356
Tabel 8.3.3 Anggaran Belanja Pemerintah Kabupaten Se Provinsi Sulawesi Barat Menurut Jenisnya (Ribu Rupiah), Tahun 2010
Table Budget of Expenditures Government by Kind(Thousand Rupiahs), 2010
Kabupaten Regency
Belanja Tidak Langsung Belanja Langsung Jumlah
(1) (2) (3) (4)
01 Majene 200 742 101 144 977 908 345 720 009
02 Polewali Mandar 312 393 887 116 356 099 428 749 986
03 Mamasa 152 287 620 181 974 046 334 261 666
04 Mamuju 297 804 897 231 242 116 529 047 013
05 Mamuju Utara 93 568 461 214 693 128 308 261 589
Jumlah - Total 1 056 796 966 889 243 297 1 946 040 263
Sumber / Source : Hasil Survei APBD-2 BPS Kabupaten Se-Sulbar & Pemerintah Daerah Provinsi Sulawesi Barat /
Result of APBD-2 Regency Survey BPS-Statistics of Sulbar & Regional Government of Sulawesi Barat Province

FINANCE
SULAWESI BARAT IN FIGURES 2010
357
Tabel 8.3.4 Anggaran Pembiayaan Pemerintah Kabupaten Se Provins i Sulawesi Barat Menurut Jenisnya (Ribu Rupiah), Tahun 2010
Table Budget of Government Expenditure in Sulawesi Barat (000 Rp.), 2010
Kabupaten Regency
Jenis Pembiayaan Sisa Lebih
Pembiayaan Anggaran Tahun Berjalan (SILPA)
Penerimaan Daerah Pengeluaran
Daerah
(1) (2) (3) (4)
01 Majene 8 000 000 1 500 000 21 086 512
02 Polewali Mandar 5 448 230 12 000 000 0
03 Mamasa 30 000 000 11 000 000 19 000 000
04 Mamuju 71 242 992 70 038 376 0
05 Mamuju Utara 47 256 938 28 373 607 1 922 008
Jumlah - Total 161 948 160 122 914 983 42 008 520
Sumber / Source : Hasil Survei APBD-2 BPS Kabupaten Se-Sulbar & Pemerintah Daerah Provinsi Sulawesi Barat /
Result of APBD-2 Regency Survey BPS-Statistics of Sulbar & Regional Government of Sulawesi Barat Province
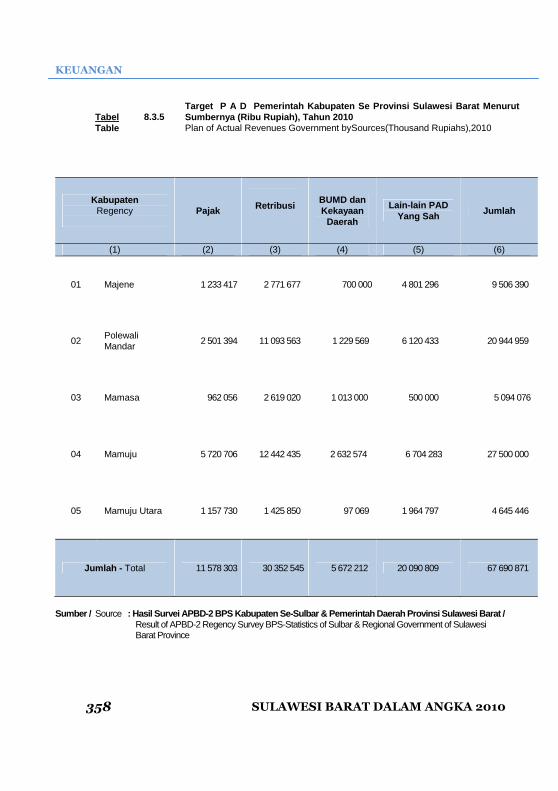
KEUANGAN
SULAWESI BARAT DALAM ANGKA 2010
358
Tabel 8.3.5 Target P A D Pemerintah Kabupaten Se Provinsi Sul awesi Barat Menurut Sumbernya (Ribu Rupiah), Tahun 2010
Table Plan of Actual Revenues Government bySources(Thousand Rupiahs),2010
Kabupaten Regency
Pajak
Retribusi BUMD dan Kekayaan
Daerah
Lain-lain PAD Yang Sah Jumlah
(1) (2) (3) (4) (5) (6)
01 Majene 1 233 417 2 771 677 700 000 4 801 296 9 506 390
02 Polewali Mandar
2 501 394 11 093 563 1 229 569 6 120 433 20 944 959
03 Mamasa 962 056 2 619 020 1 013 000 500 000 5 094 076
04 Mamuju 5 720 706 12 442 435 2 632 574 6 704 283 27 500 000
05 Mamuju Utara 1 157 730 1 425 850 97 069 1 964 797 4 645 446
Jumlah - Total 11 578 303 30 352 545 5 672 212 20 090 809 67 690 871
Sumber / Source : Hasil Survei APBD-2 BPS Kabupaten Se-Sulbar & Pemerintah Daerah Provinsi Sulawesi Barat /
Result of APBD-2 Regency Survey BPS-Statistics of Sulbar & Regional Government of Sulawesi Barat Province

FINANCE
SULAWESI BARAT IN FIGURES 2010
359
Tabel 8.3.6 Target Dana Perimbangan Pemerintah Kabupaten Se P rovinsi Sulawesi Barat Menurut Sumbernya (Ribu Rupiah), Tahun 2010
Table Target of Means Budget Government by Sources(Thousand Rupiahs), 2010
Kabupaten Regency
Bagi Hasil Pajak
Bagi Hasil Bukan
Pajak/SDA Dana Alokasi Umum (DAU)
(1) (2) (3) (4)
01 Majene - - 252 249 643
02 Polman 27 854 692 852 570 342 592 850
03 Mamasa 18 694 878 821 470 227 707 430
04 Mamuju 42 593 453 - 383 109 836
05 Mamuju Utara 32 971 918 810 790 192 512 240
Jumlah - Total 122 114 940 2 484 830 1 398 171 999
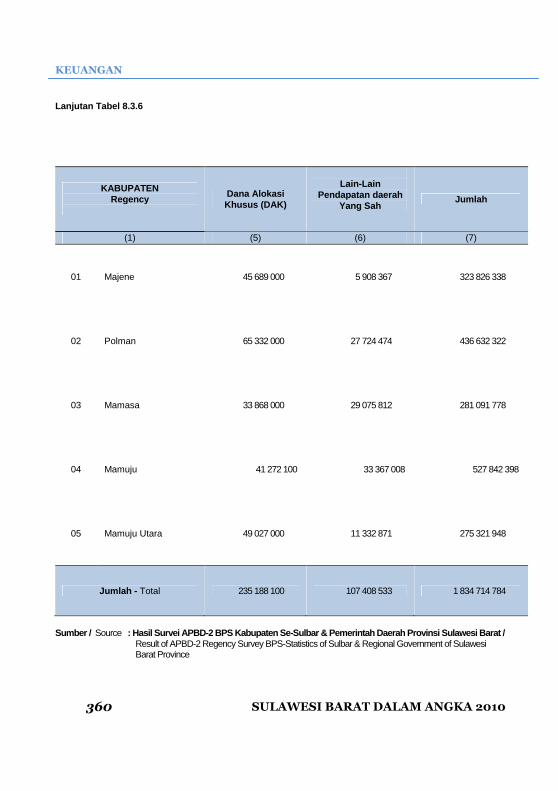
KEUANGAN
SULAWESI BARAT DALAM ANGKA 2010
360
Lanjutan Tabel 8.3.6
KABUPATEN Regency
Dana Alokasi Khusus (DAK)
Lain-Lain
Pendapatan daerah Yang Sah
Jumlah
(1) (5) (6) (7)
01 Majene 45 689 000 5 908 367 323 826 338
02 Polman 65 332 000 27 724 474 436 632 322
03 Mamasa 33 868 000 29 075 812 281 091 778
04 Mamuju 41 272 100 33 367 008 527 842 398
05 Mamuju Utara 49 027 000 11 332 871 275 321 948
Jumlah - Total 235 188 100 107 408 533 1 834 714 784
Sumber / Source : Hasil Survei APBD-2 BPS Kabupaten Se-Sulbar & Pemerintah Daerah Provinsi Sulawesi Barat /
Result of APBD-2 Regency Survey BPS-Statistics of Sulbar & Regional Government of Sulawesi Barat Province

FINANCE
SULAWESI BARAT IN FIGURES 2010
361
Tabel 8.3.7
Rencana Belanja Aparatur Daerah Pemerintah Kabupa ten Se Provinsi Sulawesi Barat Menurut Jenisnya (Ribu Rupiah), Tahu n 2010
Table Draft of Expenditures Tolls Government by Type(Thousand Rupiahs), 2010
Sumber / Source : Hasil Survei APBD-2 BPS Kabupaten Se-Sulbar & Pemerintah Daerah Provinsi Sulawesi Barat /
Result of APBD-2 Regency Survey BPS-Statistics of Sulbar & Regional Government of Sulawesi Barat Province
Kabupaten Regency
Belanja Pegawai
Belanja Barang dan Jasa
Belanja Modal Jumlah
(1) (2) (3) (4) (5)
01 MAJENE 20 470 237 51 514 267 72 993 403 144 977 908
02 POLEWALI MANDAR 15 380 216 45 701 320 105 274 563 116 356 099
03 MAMASA 17 517 157 75 637 132 88 819 756 181 974 045
04 MAMUJU 50 896 023 103 628 405 76 717 687 231 242 116
05 MAMUJU UTARA 19 630 749 79 507 347 115 555 031 214 693 128
Jumlah - Total 123 891 382 355 988 471 459 360 440 1 889 243 296

KEUANGAN
SULAWESI BARAT DALAM ANGKA 2010
362
Tabel 8.3.8
Rencana Belanja Pelayanan Publik Pemerintah Kabup aten Se Provinsi Sulawesi Barat Menurut Jenisnya (Ribu Rupiah), Tahu n 2010
Table Draft of Expenditures Public Services Government by Kind(Thousand Rupiahs), 2010
Kabupaten Regency
Belanja Pegawai Belanja Hibah
Belanja Bantuan Sosial
Belanja Subsidi
(1) (2) (3) (4) (5)
01 Majene 177 329 037 2 460 000 5 144 000 50 000
02 Polman 280 240 698 4 630 000 6 219 900 5 150 000
03 Mamasa 117 086 185 600 000 13 717 500 -
04 Mamuju 231 533 673 38 653 173 13 462 050 -
05 Mamuju Utara 81 894 857 1 665 000 3 908 603 -
Jumlah - Total 888 084 450 48 008 173 42 452 053 5 200 000

FINANCE
SULAWESI BARAT IN FIGURES 2010
363
Lanjutan Tabel 8.3.8
Kabupaten Regency
Belanja Bagi Hasil & Bantuan
Keuangan
Belanja Tidak
Tersangka
Belanja Bunga
Jumlah
(1) (5) (6) (7) (8)
01 Majene 14 259 069 1 500 000 - 200 742 101
02 Polman 15 198 000 955 289 - 312 393 887
03 Mamasa 19 173 935 1 710 000 - 152 287 620
04 Mamuju 13 156 000 1 000 000 - 297 804 897
05 Mamuju Utara 5 600 000 - - 93 568 461
Jumlah - Total 50 131 004 5 165 289 - 1 057 795 966
Sumber / Source : Hasil Survei APBD-2 BPS Kabupaten Se-Sulbar & Pemerintah Daerah Provinsi Sulawesi Barat /
Result of APBD-2 Regency Survey BPS-Statistics of Sulbar & Regional Government of Sulawesi Barat Province

KEUANGAN
SULAWESI BARAT DALAM ANGKA 2010
364
Tabel 8.4.1
Target Dan Realisasi Penerimaan Pajak Bumi Dan Bang unan (PBB) Menurut Kabupaten Di Sulawesi Barat (Ribu Rupiah) 2009
Table Target and Actual Revenues of Land and Housing Tax by Regency in Sulawesi Barat (Thousand Rupiahs) 2009
Kode Wilayah
Area Code
Kabupaten Regency
Pajak Bumi dan Bangunan (PBB) Land and Housing Tax
Target Target
Realisasi Actual
Persentase Percentage
(1) (2) (3) (4) (5)
01 Majene 21 815 682 21 884 386 100,31
02 Polman 21 374 833 21 534 652 100,75
03 Mamasa 18 050 628 18 192 940 100,79
04 Mamuju 28 245 705 27 403 205 97,02
05 Mamuju Utara 32 418 261 32 988 162 101,76
Jumlah - Total 121 905 110 122 003 345 100,08
2008 129 241 387 132 458 929 102,49
2007 109 616 144 127 719 517 116,52
2006 76 840 110 115 004 814 149,67
2005 51 300 991 78 709 781 153,42
FINANCE
SULAWESI BARAT IN FIGURES 2010
365
Lanjutan Tabel/ Table Continued : 8.4.1
Kode Wilayah
Area Code
Kabupaten Regency
Penerimaan SKB
Target Target
Realisasi Actual
Persentase Percentage
(1) (2) (6) (7) (8)
01 Majene 538 542 607 246 112,76
02 Polman 2 766 045 2 925 865 105,78
03 Mamasa 284 311 426 624 150,06
04 Mamuju 1 774 006 2 485 352 140,10
05 Mamuju Utara 685 835 859 888 125,38
Jumlah - Total 6 048 739 7 304 974 120,77
2008 5 663 311 6 705 815 118
2007 5 253 000 5 301 400 101
2006 4 473 959 4 672 256 104
2005 4 082 268 4 349 311 106
Sumber / Source : Kanwil Xii Ditjen Pajak Sulselbatra Di Makassa r / Regional Office of Directorat General of Taxes XII Sulselbatra in Makassar
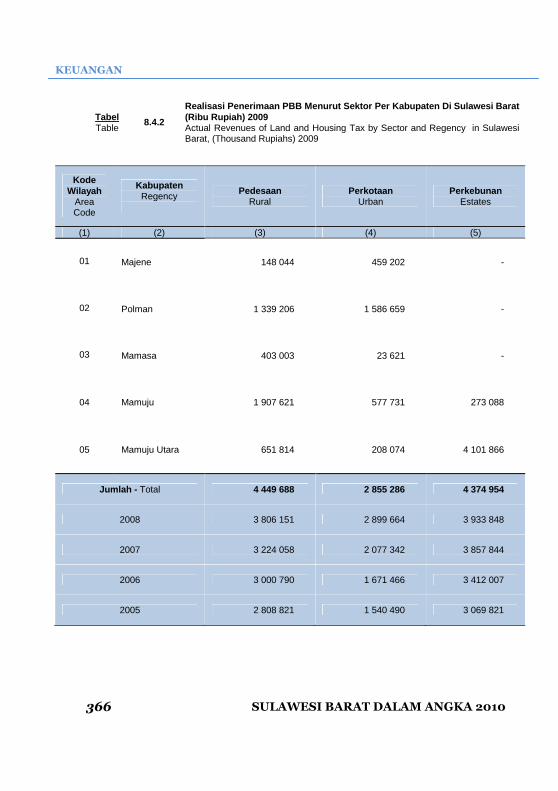
KEUANGAN
SULAWESI BARAT DALAM ANGKA 2010
366
Tabel 8.4.2
Realisasi Penerimaan PBB Menurut Sektor Per Kabupat en Di Sulawesi Barat (Ribu Rupiah) 2009
Table Actual Revenues of Land and Housing Tax by Sector and Regency in Sulawesi Barat, (Thousand Rupiahs) 2009
Kode Wilayah
Area Code
Kabupaten Regency
Pedesaan Rural
Perkotaan Urban
Perkebunan Estates
(1) (2) (3) (4) (5)
01 Majene 148 044 459 202 -
02 Polman 1 339 206 1 586 659 -
03 Mamasa 403 003 23 621 -
04 Mamuju 1 907 621 577 731 273 088
05 Mamuju Utara 651 814 208 074 4 101 866
Jumlah - Total 4 449 688 2 855 286 4 374 954
2008 3 806 151 2 899 664 3 933 848
2007 3 224 058 2 077 342 3 857 844
2006 3 000 790 1 671 466 3 412 007
2005 2 808 821 1 540 490 3 069 821
FINANCE
SULAWESI BARAT IN FIGURES 2010
367
Lanjutan Tabel/ Table Continued : 8.4.2
Kode Wilayah
Area Code
Kabupaten Regency
Perhutanan Forestry
Pertambangan Mining
Jumlah Total
(3+4+5+6+7)
(1) (2) (6) (7) (8)
01 Majene - 21 277 140 21 884 386
02 Polman - 18 608 788 21 534 652
03 Mamasa - 17 766 317 18 192 940
04 Mamuju 50 000 24 594 765 27 403 205
05 Mamuju Utara - 28 026 408 32 988 162
Jumlah - Total 50 000 110 273 417 122 003 345
2008 169 437 121 649 829 132 458 929
2007 537 901 118 022 372 127 719 517
2006 1 676 145 105 244 406 115 004 814
2005 1 023 997 70 266 652 78 709 781
Sumber / Source : Kanwil Xii Ditjen Pajak Sulselbatra Di Makassa r / Regional Office of Directorat General of Taxes XII Sulselbatra in Makassar

KEUANGAN
SULAWESI BARAT DALAM ANGKA 2010
368
Tabel 8.4.3
Realisasi Penerimaan Pajak Penghasilan (PPh) Menuru t Kabupaten dan Jenisnya Di Sulawesi Barat (Ribu Rupiah) 2009
Table Actual Revenues of Income Tax by Regency and Kind of Income Tax in Sulawesi Barat (Thousand) 2009
Kode Wilayah
Area Code
Kabupaten Regency
Perorangan (Personal) PPh Ps. 21
Wajib Pajak Orang
Pribadi Dalam Negeri (PPh Ps. 25/29)
Badan (Private)
(1) (2) (3) (4) (5)
01 Majene 8 177 501 93 076 -
02 Polman 9 68 174 224 478 -
03 Mamasa 5 051 150 7 121 -
04 Mamuju 28 623 526 528 432 -
05 Mamuju Utara 4 929 317 30 950 -
Jumlah – Total 56 649 668 884 057 -
2008 43 775 938 540 907 -
2007 27 229 393 432 558 -
Sumber / Source : Kanwil Xii Ditjen Pajak Sulselbatra Di Makassa r / Regional Office of Directorat General of Taxes XII Sulselbatra in Makassar

FINANCE
SULAWESI BARAT IN FIGURES 2010
369
Tabel 8.5.1
Jumlah Koperasi, Anggota dan Pengurus Menurut Kabup aten Di Provinsi Sulawesi Barat 2009
Table Number of Cooperatives and Cooperative Member by Regency in Sulawesi Barat 2009
Kode Wilayah
Area Code
Kabupaten Regency
Koperasi Cooperatives
Anggota Koperasi Cooperatives
Member
Pengurus
(1) (2) (3) (5) (5)
01 Majene 107 11 007 184
02 Polman 220 25 505 250
03 Mamasa 74 2 242 371
04 Mamuju 230 36 075 404
05 Mamuju Utara 68 2 952 240
Jumlah – Total 699 77 781 1449
2008 616 78 355 …
2007 583 77 675 …
2006 521 77 675 …
2005 544 82.994 …
Sumber : Dinas Koperasi, UKM, Perindag Provinsi Sulawesi Barat / Cooperatives, Small and Medium Enterprises, and Industry and Trade Services in Sulawesi Barat Province

KEUANGAN
SULAWESI BARAT DALAM ANGKA 2010
370
Tabel 8.5.2
Besarnya Modal Koperasi Menurut Kab/Kota Di Sulawes i Barat (Ribu Rupiah) 2009
Table Value of Equity of Cooperatives by Regency in Sulawesi Barat (Thousand Rupiahs),2009
Kode Wilayah
Area Code
Kabupaten Regency
Modal Sendiri Equity
Modal Luar Foreign Capital
Jumlah Total
(1) (2) (3) (4) (5)
01 Majene 8 724 894 948 969 9 673 863
02 Polman 7 689 321 12 876 728 20 566 049
03 Mamasa 210 318 721 587 931 905
04 Mamuju 9 116 903 3 915 214 13 032 117
05 Mamuju Utara 1 882 175 2 217 750 4 099 925
Jumlah - Total 27 623 611 20 680 248 48 303 859
Sumber : Dinas Koperasi, UKM, Perindag Provinsi Sulawesi Barat / Cooperatives, Small and Medium Enterprises, and Industry and Trade Services in Sulawesi Barat Province

FINANCE
SULAWESI BARAT IN FIGURES 2010
371
TABEL 8.5.3
Besarnya Volume Usaha Dan Sisa Hasil Usaha (SHU) Ko perasi Menurut Kabupaten Di Sulawesi Barat (Rp. 000), 2009
Table Number of Volume of Activity and Profit Cooperative by Regency in Sulawesi Barat (Thousand Rupiahs), 2009
Kode Wilayah
Area Code
Kabupaten Regency
Volume Usaha
Volume of Activity
S H U Profit
(1) (2) (3) (4)
01 Majene 17 141 950 910 221
02 Polman 21 997 399 2 692 125
03 Mamasa * *
04 Mamuju 14 994 629 1 101 542
05 Mamuju Utara 3 298 504 263 880
Jumlah - Total 57 432 482 4 967 768
2008 40 303 974 1 264 683
2007 40 303 954 1 264 687
2006 40 445 306 1 264 683
2005 16 192 280 1 378 240
Sumber : Dinas Koperasi, UKM, Perindag Provinsi Sulawesi Barat / Cooperatives, Small and Medium Enterprises, and Industry and Trade Services in Sulawesi Barat Province

KEUANGAN
SULAWESI BARAT DALAM ANGKA 2010
372
Tabel 8.5.4 Jumlah Pusat Perdagangan Menurut Kabupaten Di Sulaw esi Barat 2009 Table Number of Trade Centre by Regency in Sulawesi Barat, 2009
Kabupaten Regency
Pasar Tradisional
Traditional Market
Pasar Modern Modern Market
Eceran Retail
Perkulakan Grosir
(1) (2) (3) (4) (5)
01 Majene 27 - - -
02 Polewali Mandar 23 - - -
03 Mamasa 10 - - -
04 Mamuju 19 - - -
05 Mamuju Utara 18 - - -
Jumlah - Total 97 - - -
2008 95 - - -
2007 90 - - -
Sumber : Dinas Koperasi, UKM, Perindag Provinsi Sulawesi Barat / Cooperatives, Small and Medium Enterprises, and Industry and Trade Services in Sulawesi Barat Province
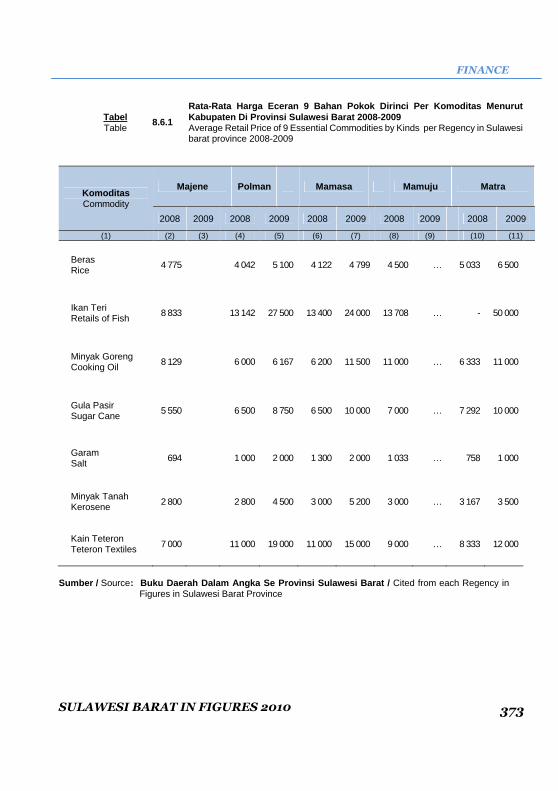
FINANCE
SULAWESI BARAT IN FIGURES 2010
373
Tabel 8.6.1
Rata-Rata Harga Eceran 9 Bahan Pokok Dirinci Per Ko moditas Menurut Kabupaten Di Provinsi Sulawesi Barat 2008-2009
Table Average Retail Price of 9 Essential Commodities by Kinds per Regency in Sulawesi barat province 2008-2009
Komoditas Commodity
Majene Polman Mamasa Mamuju Matra
2008 2009 2008 2009 2008 2009 2008 2009
2008 2009
(1) (2) (3) (4) (5) (6) (7) (8) (9) (10) (11)
Beras Rice
4 775 4 042 5 100 4 122 4 799 4 500 … 5 033 6 500
Ikan Teri Retails of Fish
8 833 13 142 27 500 13 400 24 000 13 708 … - 50 000
Minyak Goreng Cooking Oil
8 129 6 000 6 167 6 200 11 500 11 000 … 6 333 11 000
Gula Pasir Sugar Cane
5 550 6 500 8 750 6 500 10 000 7 000 … 7 292 10 000
Garam Salt
694 1 000 2 000 1 300 2 000 1 033 … 758 1 000
Minyak Tanah Kerosene 2 800 2 800 4 500 3 000 5 200 3 000 … 3 167 3 500
Kain Teteron Teteron Textiles 7 000 11 000 19 000 11 000 15 000 9 000 … 8 333 12 000
Sumber / Source : Buku Daerah Dalam Angka Se Provinsi Sulawesi Ba rat / Cited from each Regency in
Figures in Sulawesi Barat Province

9 PENDAPATAN REGIONAL,
INFLASI, NTP Regional Income, Inflation, NTP

REGIONAL INCOME, INFLATION, NTP
SULAWESI BARAT IN FIGURES 2010 377
9.1. PDRB
Produk Domestik Regional Bruto (PDRB)
merupakan salah satu cerminan kemajuan
ekonomi suatu daerah, yang didefinisikan
sebagai keseluruhan nilai tambah barang dan
jasa yang dihasilkan dalam waktu satu tahun
di wilayah tersebut.
PDRB Sulawesi Barat atas dasar harga
berlaku pada tahun 2009 sekitar 8.671,82
milyar rupiah dengan kontribusi terbesar
diberikan oleh sektor pertanian yakni sebesar
48,39 persen kemudian disusul oleh sektor
jasa dengan sumbangan sebesar 17,37
persen (Tabel 9.2.1). Sektor perdagangan,
hotel dan restoran memberikan kontribusi
yang cukup besar juga sekitar 13,06 persen
dimana subsektor perdagangan besar dan
eceran sebagai penyumbang terbesar sekitar
12,62 persen
PDRB Sulawesi Barat atas dasar harga
konstan 2000 pada tahun 2009 sebesar
4.106,02 milyar rupiah atau meningkat sekitar
6,03 persen, lebih tinggi dibandingkan dengan
tahun 2008 (Tabel 9.1.2).
Pada tahun 2009, semua sector ekonomi
mengalami pertumbuhan positif. Sektor
pertambangan dan penggalian merupakan
sector yang mengalami pertumbuhan tertinggi
sebesar 17,62 persen. Kemudian sector
keuangan, persewaan dan jasa perusahaan
dan sector listrik, gas dan air bersih masing-
masing mengalami pertumbuhan sebesar
13,08 persen dan 10,91 persen; Namun
demikian, karena sektor yang tumbuh tinggi
adalah sektor yang memiliki kontribusi relatif
kecil terhadap PDRB,
9.1. GRDP
Gross Regional Domestic Product
(GRDP) is one of reflection of economic
development that defined as total value
added of the goods and services produces
in the certain period of a region.
In 2009, GRDP at current market prices
of Sulawesi Barat recorded as 7.778,0 billion
rupiahs with agriculture as the largest
contributor (50,40 percent), then it was
followed by services sector with a
contribution of 16,14 percent (Table 9.2.1).
Trade, Hotels and Restaurants provide
substantial contributions also approximately
13.06 percent of the subsector in which the
wholesale and retail trade as the largest
contributor of about 12.62 percent
In the same year, GRDP at 2000
constant market prices recorded 3.872,55
billion rupiahs are increased by 8,54 percent
which compare to data for 2007. (Table
9.1.2).
In the year 2009, all economic sectors
experienced positive growth. Mining and
quarrying sector is the sector that
experienced the highest growth of 17.62
percent. Then the financial sector, renting
and business services sector and electricity,
gas and water supply respectively a growth
of 13.08 percent and 10.91 percent.
Nevertheless, these high growth did not
influence much on the growth of
Sulawesi Barat,

PENDAPATAN REGIONAL, INFLASI, NTP
378 SULAWESI BARAT DALAM ANGKA 2010
maka pertumbuhan ini tidak terlalu
berpengaruh pada pertumbuhan ekonomi
Sulawesi Barat yang masih mengandalkan
sektor pertanian.
9.2. PDRB Perkapita
Angka lainnya yang dapat diturunkan
dari angka PDRB adalah angka PDRB
Perkapita. Indikator ini biasa digunakan untuk
mengukur tingkat kemakmuran penduduk di
suatu daerah. PDRB per kapita atas dasar
harga berlaku penduduk Sulawesi Barat
pada tahun 2009 sebesar 8.276.697 rupiah
sedangkan atas dasar harga konstan sekitar
3.918.931 rupiah
9.3. PDRB Per Kabupaten
Sebagai ibukota provinsi, Kabupaten
Mamuju memiliki kontribusi terhadap PDRB
Sulawesi Barat sebesar 33,41 persen dengan
tingkat pertumbuhan pada tahun 2009 sekitar
8,26 persen. Sedangkan Kabupaten Mamasa
yang merupakan pemekaran dari Kabupaten
Polewali Mandar hanya berkontribusi sekitar
10,53 persen dengan pertumbuhan sebesar
4,33 persen pada tahun 2009.
because these sectors had small
contribution to the total of GRDP and
economics of Sulawesi Barat still relied
on agriculture sector.
9.2. GRDP Percapita
Other indicator can be derived from
GRDP data is GRDP Per capita. This
indicator is usually used to measure
welfare of the people of a certain region.
GRDP per capita prices of Sulawesi Barat
in 2009 recorded 8.276.697 rupiahs.
9.3. PDRB Per Regency
As the provincial capital, Mamuju have
contributed to GDP amounted to 33.41
percent of Sulawesi Barat, with a growth
rate in the year 2009 around 8.26 percent.
While the district which is a division of
Mamasa Polewali Mandar contribute only
about 10.53 percent with a growth of 4.33
percent in 2009.

REGIONAL INCOME, INFLATION, NTP
SULAWESI BARAT IN FIGURES 2010 379
Grafik 9.1 Struktur Perekonomian Sulawesi Barat Tahun 2009 (Persen )
Figure Economic Structure of Sulawesi Barat, 2009
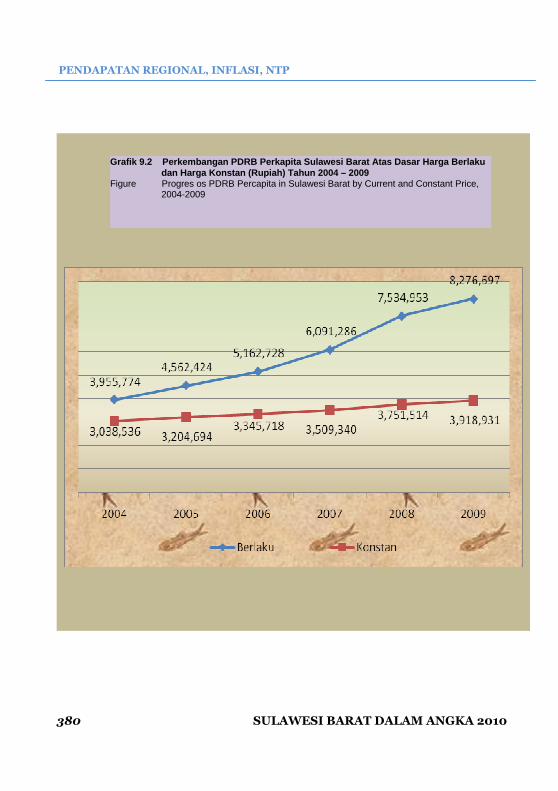
PENDAPATAN REGIONAL, INFLASI, NTP
380 SULAWESI BARAT DALAM ANGKA 2010
Grafik 9.2 Perkembangan PDRB Perkapita Sulawesi Barat Atas Dasar Harga Berlaku dan Harga Konstan (Rupiah) Tahun 2004 – 2009
Figure Progres os PDRB Percapita in Sulawesi Barat by Current and Constant Price, 2004-2009
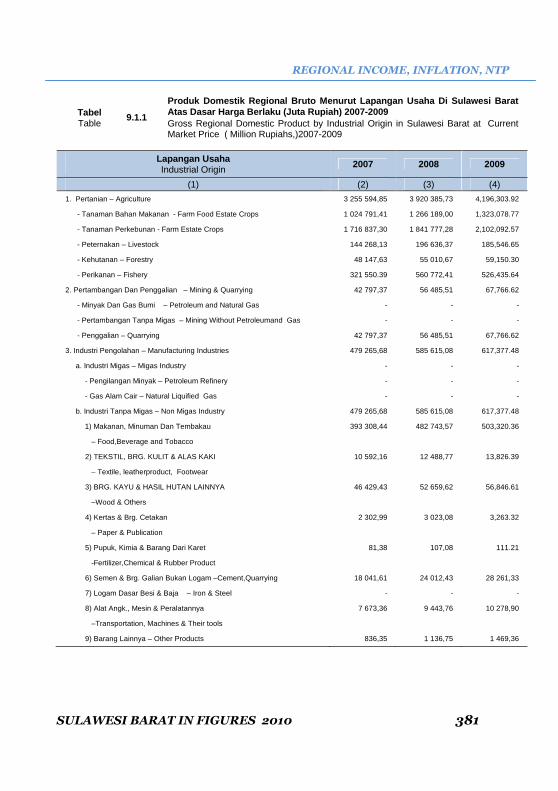
REGIONAL INCOME, INFLATION, NTP
SULAWESI BARAT IN FIGURES 2010 381
9.1.1
Produk Domestik Regional Bruto Menurut Lapangan Usa ha Di Sulawesi Barat Atas Dasar Harga Berlaku (Juta Rupiah) 2007-2009 Tabel
Table Gross Regional Domestic Product by Industrial Origin in Sulawesi Barat at Current Market Price ( Million Rupiahs,)2007-2009
Lapangan Usaha Industrial Origin
2007 2008 2009
(1)
(2)
(3)
(4)
1. Pertanian – Agriculture 3 255 594,85 3 920 385,73 4,196,303.92
- Tanaman Bahan Makanan - Farm Food Estate Crops 1 024 791,41 1 266 189,00 1,323,078.77
- Tanaman Perkebunan - Farm Estate Crops 1 716 837,30 1 841 777,28 2,102,092.57
- Peternakan – Livestock 144 268,13 196 636,37 185,546.65
- Kehutanan – Forestry 48 147,63 55 010,67 59,150.30
- Perikanan – Fishery 321 550.39 560 772,41 526,435.64
2. Pertambangan Dan Penggalian – Mining & Quarrying 42 797,37 56 485,51 67,766.62
- Minyak Dan Gas Bumi – Petroleum and Natural Gas - - -
- Pertambangan Tanpa Migas – Mining Without Petroleumand Gas - - -
- Penggalian – Quarrying 42 797,37 56 485,51 67,766.62
3. Industri Pengolahan – Manufacturing Industries 479 265,68 585 615,08 617,377.48
a. Industri Migas – Migas Industry - - -
- Pengilangan Minyak – Petroleum Refinery - - -
- Gas Alam Cair – Natural Liquified Gas - - -
b. Industri Tanpa Migas – Non Migas Industry 479 265,68 585 615,08 617,377.48
1) Makanan, Minuman Dan Tembakau 393 308,44 482 743,57 503,320.36
– Food,Beverage and Tobacco
2) TEKSTIL, BRG. KULIT & ALAS KAKI 10 592,16 12 488,77 13,826.39
– Textile, leatherproduct, Footwear
3) BRG. KAYU & HASIL HUTAN LAINNYA 46 429,43 52 659,62 56,846.61
–Wood & Others
4) Kertas & Brg. Cetakan 2 302,99 3 023,08 3,263.32
– Paper & Publication
5) Pupuk, Kimia & Barang Dari Karet 81,38 107,08 111.21
-Fertilizer,Chemical & Rubber Product
6) Semen & Brg. Galian Bukan Logam –Cement,Quarrying 18 041,61 24 012,43 28 261,33
7) Logam Dasar Besi & Baja – Iron & Steel - - -
8) Alat Angk., Mesin & Peralatannya 7 673,36 9 443,76 10 278,90
–Transportation, Machines & Their tools
9) Barang Lainnya – Other Products 836,35 1 136,75 1 469,36

PENDAPATAN REGIONAL, INFLASI, NTP
382 SULAWESI BARAT DALAM ANGKA 2010
Lanjutan Tabel / Table Continued : 9.1.1
Lapangan Usaha Industrial Origin
2007 2008 2009*)
(1)
(2)
(3)
(4)
4. Listrik, Gas & Air Bersih 24 144,89 33 222,63 37,164.79
– Electricity, Gas, Water Supply
- Listrik – Electricity 22 580,89 31 066,62 34,056.57
- Gas Kota – City Gas - -
- Air Bersih - Water Supply 1 563,99 2 156,02 3,108.22
5, Bangunan - Construction 226 113,37 356 999,59 402,527.28
6, Perdag, Restoran & Hotel 769 978,20 979 915,04
1,132,952.55
- Trade, Restaurants & Hotel
- perdag. Besar & Eceran - Wholesale and Retail Trade 744 223,95 945 368,27 1,094,187.20
- Hotel - Hotel 2 198,28 3 269,33 3,672.79
- Restoran - Restaurants 23 555,98 31 277,44 35,092.56
7. Angk. Dan komunikasi 149 619,88 200 830,90
237,101.83
– Transportation & Communication
a. Pengangkutan – Transportation 124 445,99 166 614,16
199,184.93
1) Angkutan Rel – Railway Transportation - -
-
2) Angkutan Jalan Raya - Highway Transportation 77 951,36 98 386,21 123,372.95
3) Angkutan Laut – Sea Transportation 38 913,60 58 000,75 64,577.64
4) Angkutan Sungai, Danau & Penyeberangan - -
-
5) Angkutan Udara – Air Transportation 604,77 1 743,55 2,196.53
6) Jasa Penunjang Angkutan – Transport Services 6,976,29 8 483,65 9,037.82
b. Komunikasi – Communication 25 173,87 34 216,73
37,916.89
1) Pos & Telekomunikasi – Post & Telemunication 25 173,87 34 216,73 37,916.89
2) Jasa Penunjang Telekomunikasi – Telecomunication Service Support - -
-
8. Keuangan, Persewaan Dan Jasa Perusahaan 296 098,96 389 513,75
477,287.04
- Finance, Leasing and business Services
a. Bank – Banking 145 883,00 186 972,22 239,539.00
b. Lemb. Keu. Tanpa bank - Non Bank Financial Institution 9 483,87 11 994,99 14,505.68
c. Jasa Penunjang Keuangan - - -
d. Sewa Bangunan - Leasing of Buildings 139 577,16 189 086,30 221,535.45
e. Jasa Perusahaan - Business Services 1 154,91 1 460,23 1,706.91

REGIONAL INCOME, INFLATION, NTP
SULAWESI BARAT IN FIGURES 2010 383
Lanjutan Tabel / Table Continued : 9.1.1
Lapangan Usaha Industrial Origin
2007 2008 2009*)
(1)
(2)
(3)
(4)
9. Jasa-Jasa – Services 949 172,37 1 255 032,37
1,503,336.54
a. Pemerintahan Umum – General Public 927 996,25 1 225 464,67
1,472,297.52
1) Adm Pemerintahan & Pertahanan - Public Administration and Defence 927 996,25 1 225 464,67 1,472,297.52
2) Jasa Pemerintahan Lainnya – Other Services Public - -
-
b. Swasta – Private 21 176,12 29 567,69
31,039.01
1) Sosial Kemasyarakatan – Social Services 9 847,03 13 287,69 13,884.77
2) Hiburan & Rekreasi – Entertainment and Recreational 2 597,11 4 257,71 4,474.92
3) Perorangan & R. Tangga –Personal and Household 8 732,00 12 022,29 12,679.32
Produk Domestik Regional Bruto / GRDP 6 192 785,57 7 778 000,60 8 671 818,05
Catatan / Note : *) Angka Sementara /Preliminary Figure
Sumber / Source : Badan Pusat Statistik (BPS) Provinsi Sulawesi Bar at / BPS of Sulawesi Barat Province

PENDAPATAN REGIONAL, INFLASI, NTP
384 SULAWESI BARAT DALAM ANGKA 2010
Tabel Tabel
9.1.2
Produk Domestik Regional Bruto Menurut Lapangan Usa ha Di Sulawesi Barat Atas Dasar Harga Konstan-2000 (Juta Rupiah) 2007-2009 Table Gross Regional Domestic Product by Industrial Origin in Sulawesi Barat at Constant 2000 Market Price ( Million Rupiahs), 2007-2009
Lapangan Usaha Industrial Origin
2007 2008 2009*)
(1)
(2)
(3)
(4)
1. Pertanian – Agriculture 1 842 233,98 1 916 586,29 1,972,227.40
- Tanaman Bahan Makanan - Farm Food Estate Crops 660 641,71 726 066,19 715,125.66
- Tanaman Perkebunan - Farm Estate Crops 863 209,44 807 959,83 858,618.91
- Peternakan – Livestock 87 827,16 90 544,31 95,632.90
- Kehutanan – Forestry 29 415,33 31 170,24 30,553.07
- Perikanan – Fishery 201 140,34 260 845,73 272,296.86
2. Pertambangan Dan Penggalian – Mining & Quarrying 22 380,32 27 792,35
32,689.36
- Minyak Dan Gas Bumi – Petroleum and Natural Gas
- Pertambangan Tanpa Migas – Mining Without Petroleumand Gas - -
-
- Penggalian – Quarrying - -
-
3. Industri Pengolahan – Manufacturing Industries 22 380,32 27 792,35 32,689.36
a. Industri Migas – Migas Industry 279 038,80 293 038,72 314,345.62
- Pengilangan Minyak – Petroleum Refinery - -
-
- Gas Alam Cair – Natural Liquified Gas - -
-
b. Industri Tanpa Migas – Non Migas Industry - -
-
1) Makanan, Minuman Dan Tembakau 279 038,80 293 038,72 314,345.62
– Food,Beverage and Tobacco 226 286,43 237 942,15 255,691.91
2) TEKSTIL, BRG. KULIT & ALAS KAKI
– Textile, leatherproduct, Footwear 7 683,03 7 789,97 8,220.80
3) BRG. KAYU & HASIL HUTAN LAINNYA
–Wood & Others 28 100,91 28 643,47 30,051.18
4) Kertas & Brg. Cetakan
– Paper & Publication 1 340,07 1 373,72 1,459.29
5) Pupuk, Kimia & Barang Dari Karet 46,87 52,48 54.30
-Fertilizer,Chemical & Rubber Product
6) Semen & Brg. Galian Bukan Logam –Cement,Quarrying 10 271,75 11 792,12 13,216.61
7) Logam Dasar Besi & Baja – Iron & Steel - -
-
8) Alat Angk., Mesin & Peralatannya 4 803,03 4 931,04 5,107.55
–Transportation, Machines & Their tools
9) Barang Lainnya – Other Products 506,69 513,76 543.97

REGIONAL INCOME, INFLATION, NTP
SULAWESI BARAT IN FIGURES 2010 385
lanjutan tabel / Table Continued : 9.1.2
Lapangan Usaha Industrial Origin
2007 2008 2009*)
(1)
(2)
(3)
(4)
4. Listrik, Gas & Air Bersih 12 940,82 16 410,17 18,20.96
– Electricity, Gas, Water Supply
- Listrik – Electricity 12 004,27 15 425,34 16,823.49
- Gas Kota – City Gas - -
-
- Air Bersih - Water Supply 936,54 984,85 1,377.48
5, Bangunan - Construction 121 662,11 176 755,36 191,708.86
6, Perdag, Restoran & Hotel 468 808,39 501 314,28
535,697.81
- Trade, Restaurants & Hotel
- perdag. Besar & Eceran - Wholesale and Retail Trade 453 193,01 481 619,07 515,043.43
- Hotel - Hotel 1 239,42 1 656,60 1,751.71
- Restoran - Restaurants 14 375,97 18 038,62 18,902.67
7. Angk. Dan komunikasi 106 467,58 118 058,05
128,800.52
– Transportation & Communication
a. Pengangkutan – Transportation 90 298,97 99 469,09
107,226.19
1) Angkutan Rel – Railway Transportation - -
-
2) Angkutan Jalan Raya - Highway Transportation 58 921,64 61 710,74 65,746.62
3) Angkutan Laut – Sea Transportation 27 117,81 32 711,41 36,070.87
4) Angkutan Sungai, Danau & Penyeberangan - -
-
5) Angkutan Udara – Air Transportation 291,00 816,23 991.41
6) Jasa Penunjang Angkutan – Transport Services 3 968,49 4 230,73 4,417.29
b. Komunikasi – Communication 16 168,61 18 588,94
21,574.33
1) Pos & Telekomunikasi – Post & Telemunication 16 168,61 18 588,94 21,574.33
2) Jasa Penunjang Telekomunikasi – Telecomunication Service Support - -
-
8. Keuangan, Persewaan Dan Jasa Perusahaan 191 443,86 233 938,38
264,536.33
- Finance, Leasing and business Services
a. Bank – Banking 86 278,30 99 850,99 120,595.00
b. Lemb. Keu. Tanpa bank - Non Bank Financial Institution 6 264,59 7 155,56 8,255.38
c. Jasa Penunjang Keuangan - - -
d. Sewa Bangunan - Leasing of Buildings 98 056,37 125 946,90 134,662.42
e. Jasa Perusahaan - Business Services 844,59 984,90 1,023.52

PENDAPATAN REGIONAL, INFLASI, NTP
386 SULAWESI BARAT DALAM ANGKA 2010
Lanjutan Tabel / Table Continued : 9.1.2
Lapangan Usaha Industrial Origin
2007 2008 2009*)
(1)
(2)
(3)
(4)
9. Jasa-Jasa – Services 522 840,26 588 629,30
647,809.95
a. Pemerintahan Umum – General Public 509 523,70 572 509,69
631,031.63
1) Adm Pemerintahan & Pertahanan - Public Administration and Defence 509 523,70 572 509,69 631,031.63
2) Jasa Pemerintahan Lainnya – Other Services Public - - 0.00
b. Swasta – Private 13 316,56 16 119,62
16,778.32
1) Sosial Kemasyarakatan – Social Services 5 827,28 7 221,88 7,502.81
2) Hiburan & Rekreasi – Entertainment and Recreational 1 552,40 2 260,23 2,306.79
3) Perorangan & R. Tangga –Personal and Household 5 936,89 6 637,51 6,968.72
Produk Domestik Regional Bruto / GRDP 3 567 816,12 3 872 522,90 4 106 016,82
Catatan / Note : *) Angka Sementara /Preliminary Figure
Sumber / Source : Badan Pusat Statistik (BPS) Provinsi Sulawesi Bar at / BPS of Sulawesi Barat Province

REGIONAL INCOME, INFLATION, NTP
SULAWESI BARAT IN FIGURES 2010 387
Tabel
9.2.1
Distribusi Persentase Pdrb Menurut Lapangan Usaha P rovinsi Sulawesi Barat Atas Dasar Harga Berlaku 2007-2009 (Persen) Table Percentage Distribution of GRDP By Industrial Origin In Sulawesi Barat at Current Market Price , 2007-2009 (Percent)
Lapangan Usaha Industrial Origin
2007 2008 2009
(1)
(2)
(3)
(4)
1. Pertanian – Agriculture 52,57 50,40 48.39
- Tanaman Bahan Makanan - Farm Food Estate Crops 16,55 16,28
15.26
- Tanaman Perkebunan - Farm Estate Crops 27,72 23,68
24.24
- Peternakan – Livestock 2,33 2,53
2.14
- Kehutanan – Forestry 0,78 0,71
0.68
- Perikanan – Fishery 5,19 7,21
6.07
2. Pertambangan Dan Penggalian – Mining & Quarrying 0,69 0,73 0.78
- Minyak Dan Gas Bumi – Petroleum and Natural Gas
- Pertambangan Tanpa Migas – Mining Without Petroleumand Gas 0,00 0,00 0,00
- Penggalian – Quarrying 0,00 0,00 0,00
3. Industri Pengolahan – Manufacturing Industries 0,69 0,73 0.78
a. Industri Migas – Migas Industry 7,74 7,53
7.12
- Pengilangan Minyak – Petroleum Refinery 0,00 0,00 0,00
- Gas Alam Cair – Natural Liquified Gas 0,00 0,00 0,00
b. Industri Tanpa Migas – Non Migas Industry 0,00 0,00 0,00
1) Makanan, Minuman Dan Tembakau 7,74 7,53
7.12
– Food,Beverage and Tobacco 6,35 6,21
5.80
2) TEKSTIL, BRG. KULIT & ALAS KAKI
– Textile, leatherproduct, Footwear 0,17 0,16
0.16
3) BRG. KAYU & HASIL HUTAN LAINNYA
–Wood & Others 0,75 0,68
0.66
4) Kertas & Brg. Cetakan 0,04 0,04
0.04
– Paper & Publication 0,00 0,00
0.00
5) Pupuk, Kimia & Barang Dari Karet
-Fertilizer,Chemical & Rubber Product 0,29 0,31
0.33
6) Semen & Brg. Galian Bukan Logam –Cement,Quarrying 0,00 0,00
0,00
7) Logam Dasar Besi & Baja – Iron & Steel 0,12 0,12
0.12
8) Alat Angk., Mesin & Peralatannya
–Transportation, Machines & Their tools 0,01 0,01 0.02

PENDAPATAN REGIONAL, INFLASI, NTP
388 SULAWESI BARAT DALAM ANGKA 2010
Lanjutan Tabel / Table Continued : 9.2.1
Lapangan Usaha Industrial Origin
2007 2008 2009
(1)
(2)
(3)
(4)
4. Listrik, Gas & Air Bersih 0,39 0,43
0.43 – Electricity, Gas, Water Supply
- Listrik – Electricity 0,36 0,40
0.39 - Gas Kota – City Gas 0,00 0,00 0,00
- Air Bersih - Water Supply 0,03 0,03
0.04
5, Bangunan - Construction 3,65 4,59
4.64
6, Perdag, Restoran & Hotel 12,43 12,60
13.06 - Trade, Restaurants & Hotel
- perdag. Besar & Eceran - Wholesale and Retail Trade 12,02 12,15
12.62
- Hotel - Hotel 0,04 0,04
0.04
- Restoran - Restaurants 038 0,40
0.40
7. Angk. Dan komunikasi 2,42 2,58
2.73 – Transportation & Communication
a. Pengangkutan – Transportation 2,01 2,14
2.30 1) Angkutan Rel – Railway Transportation 0,00 0,00 0,00
2) Angkutan Jalan Raya - Highway Transportation 1,26 1,26
1.42
3) Angkutan Laut – Sea Transportation 0,63 0,75
0.74
4) Angkutan Sungai, Danau & Penyeberangan 0,00 0,00
0,00
5) Angkutan Udara – Air Transportation 0,01 0,02
0.03
6) Jasa Penunjang Angkutan – Transport Services 0,11 0,11
0.10
b. Komunikasi – Communication 0,41 0,44
0.44
1) Pos & Telekomunikasi – Post & Telemunication 0,41 0,44
0.44 2) Jasa Penunjang Telekomunikasi – Telecomunication Service Support 0,00 0,00 0,00
8. Keuangan, Persewaan Dan Jasa Perusahaan 4,78 5,01
5.50 - Finance, Leasing and business Services
a. Bank – Banking 2,36 2,40
2.76
b. Lemb. Keu. Tanpa bank - Non Bank Financial Institution 0,15 0,15
0.17 c. Jasa Penunjang Keuangan 0,00 0,00 000
d. Sewa Bangunan - Leasing of Buildings 2,25 2,43
2.55
e. Jasa Perusahaan - Business Services 0,02 0,02
0.02
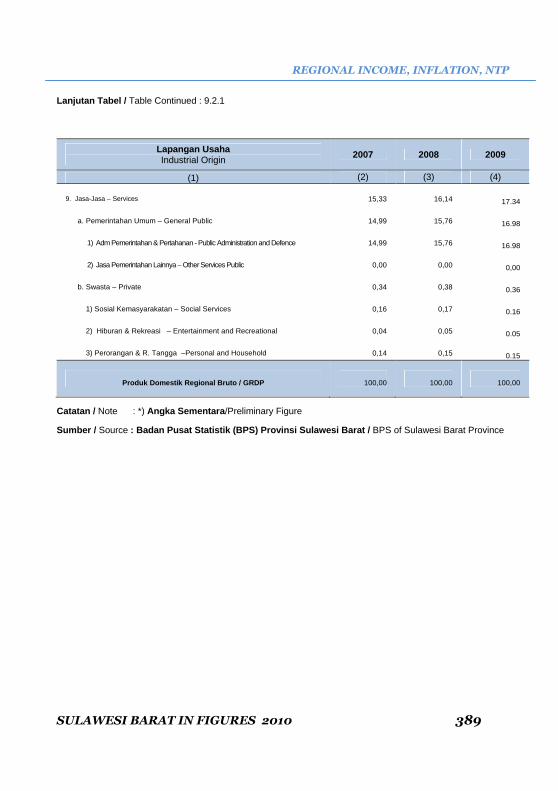
REGIONAL INCOME, INFLATION, NTP
SULAWESI BARAT IN FIGURES 2010 389
Lanjutan Tabel / Table Continued : 9.2.1
Lapangan Usaha Industrial Origin
2007 2008 2009
(1)
(2)
(3)
(4)
9. Jasa-Jasa – Services 15,33 16,14
17.34
a. Pemerintahan Umum – General Public 14,99 15,76
16.98
1) Adm Pemerintahan & Pertahanan - Public Administration and Defence 14,99 15,76
16.98
2) Jasa Pemerintahan Lainnya – Other Services Public 0,00 0,00
0,00
b. Swasta – Private 0,34 0,38
0.36
1) Sosial Kemasyarakatan – Social Services 0,16 0,17
0.16
2) Hiburan & Rekreasi – Entertainment and Recreational 0,04 0,05
0.05
3) Perorangan & R. Tangga –Personal and Household 0,14 0,15
0.15
Produk Domestik Regional Bruto / GRDP 100,00 100,00 100,00
Catatan / Note : *) Angka Sementara /Preliminary Figure
Sumber / Source : Badan Pusat Statistik (BPS) Provinsi Sulawesi Bar at / BPS of Sulawesi Barat Province

PENDAPATAN REGIONAL, INFLASI, NTP
390 SULAWESI BARAT DALAM ANGKA 2010
TABEL 9.2.2
DISTRIBUSI PERSENTASE PDRB MENURUT LAPANGAN USAHA P ROVINSI SULAWESI BARAT ATAS DASAR HARGA KONSTAN 2000, TAHUN 2007-2009 (PERSEN) Table Percentage Distribution of GRDP By Industrial Origin In Sulawesi Barat at Constant 2000 Market Price , 2007-2009 (Percent)
LAPANGAN USAHA Industrial Origin
2007 2008 2009*)
(1)
(2)
(3)
(4)
1. Pertanian – Agriculture 51,63 49,49 48.03
- Tanaman Bahan Makanan - Farm Food Estate Crops 18,52 18,75 17.42
- Tanaman Perkebunan - Farm Estate Crops 24,19 20,86 20.91
- Peternakan – Livestock 2,46 2,34 2.33
- Kehutanan – Forestry 0,82 0,80 0.74
- Perikanan – Fishery 5,64 6,74 6.63
2. Pertambangan Dan Penggalian – Mining & Quarrying 0,63 0,72 0.80
- Minyak Dan Gas Bumi – Petroleum and Natural Gas
- Pertambangan Tanpa Migas – Mining Without Petroleumand Gas - - -
- Penggalian – Quarrying - - -
3. Industri Pengolahan – Manufacturing Industries 0,63 0,72 0.80
a. Industri Migas – Migas Industry 7,82 7,57 7.66
- Pengilangan Minyak – Petroleum Refinery
- Gas Alam Cair – Natural Liquified Gas - - -
b. Industri Tanpa Migas – Non Migas Industry - - -
1) Makanan, Minuman Dan Tembakau 7,82 7,57 7.66
– Food,Beverage and Tobacco 6,34 6,14 6.23
2) TEKSTIL, BRG. KULIT & ALAS KAKI
– Textile, leatherproduct, Footwear 0,22 0,20 0.20
3) BRG. KAYU & HASIL HUTAN LAINNYA
–Wood & Others 0,79 0,74 0.73
4) Kertas & Brg. Cetakan 0,04 0,04 0.04
– Paper & Publication 0,00 0,00 0.00
5) Pupuk, Kimia & Barang Dari Karet
-Fertilizer,Chemical & Rubber Product 0,29 0,30 0.32
6) Semen & Brg. Galian Bukan Logam –Cement,Quarrying 0,00 0,00 0.00
7) Logam Dasar Besi & Baja – Iron & Steel 0,13 0,13 0.12
8) Alat Angk., Mesin & Peralatannya
–Transportation, Machines & Their tools 0,01 0,01 0.01

REGIONAL INCOME, INFLATION, NTP
SULAWESI BARAT IN FIGURES 2010 391
Lanjutan Tabel / Table Continued : 9.2.2
Lapangan Usaha Industrial Origin
2007 2008 2009*)
(1)
(2)
(3)
(4)
4. Listrik, Gas & Air Bersih 0,36 0,42 0.44
– Electricity, Gas, Water Supply
- Listrik – Electricity 0,34 0,40 0.41
- Gas Kota – City Gas - -
-
- Air Bersih - Water Supply 0,03 0,03 0.03
5, Bangunan - Construction 3,41 4,56 4.67
6, Perdag, Restoran & Hotel 13,14 12,95 13.05
- Trade, Restaurants & Hotel
- perdag. Besar & Eceran - Wholesale and Retail Trade 12,70 12,44 12.54
- Hotel - Hotel 0,03 0,04 0.04
- Restoran - Restaurants 0,40 0,47 0.46
7. Angk. Dan komunikasi 2,98 3,05 3.14
– Transportation & Communication
a. Pengangkutan – Transportation 2,53 2,57 2.61
1) Angkutan Rel – Railway Transportation - -
-
2) Angkutan Jalan Raya - Highway Transportation 1,65 1,59 1.60
3) Angkutan Laut – Sea Transportation 0,76 0,84 0.88
4) Angkutan Sungai, Danau & Penyeberangan - -
3.00
5) Angkutan Udara – Air Transportation 0,01 0,02 0.02
6) Jasa Penunjang Angkutan – Transport Services 0,11 0,11 0.11
b. Komunikasi – Communication 0,45 0,48 0.53
1) Pos & Telekomunikasi – Post & Telemunication 0,45 0,48 0.53
2) Jasa Penunjang Telekomunikasi – Telecomunication Service Support
3.00
8. Keuangan, Persewaan Dan Jasa Perusahaan 5,37 6,04 6.44
- Finance, Leasing and business Services
a. Bank – Banking 2,42 2,58 2.94
b. Lemb. Keu. Tanpa bank - Non Bank Financial Institution 0,18 0,18 0.20
c. Jasa Penunjang Keuangan - -
3.00
d. Sewa Bangunan - Leasing of Buildings 2,75 3,25 3.28
e. Jasa Perusahaan - Business Services 0,02 0,03 0.02

PENDAPATAN REGIONAL, INFLASI, NTP
392 SULAWESI BARAT DALAM ANGKA 2010
LANJUTAN TABEL / Table Continued : 9.2.2
LAPANGAN USAHA Industrial Origin
2007 2008 2009*)
(1)
(2)
(3)
(4)
9. Jasa-Jasa – Services 14,65 15,20 15.78
a. Pemerintahan Umum – General Public 14,28 14,78 15.37
1) Adm Pemerintahan & Pertahanan - Public Administration and Defence 14,28 14,78 15.37
2) Jasa Pemerintahan Lainnya – Other Services Public - -
3.00
b. Swasta – Private 0,37 0,42 0.41
1) Sosial Kemasyarakatan – Social Services 0,16 0,19 0.18
2) Hiburan & Rekreasi – Entertainment and Recreational 0,04 0,06 0.06
3) Perorangan & R. Tangga –Personal and Household 0,17 0,17 0.17
Produk Domestik Regional Bruto / GRDP 100,00 100,00 100,00
Catatan / Note : *) Angka Sementara /Preliminary Figure
Sumber / Source : Badan Pusat Statistik (BPS) Provinsi Sulawesi Bar at / BPS of Sulawesi Barat Province

REGIONAL INCOME, INFLATION, NTP
SULAWESI BARAT IN FIGURES 2010 393
Tabel
9.3.1
Produk Domestik Regional Bruto Dan Angka Per Kapita Provinsi Sulawesi Barat Atas Dasar Harga Berlaku 2007-2009 Table Gross Regional Domestic Product and Per Capita Figure in Sulawesi barat at Current Market Price , 2007-2009
Uraian Description
2007 2008 2009*)
(1)
(2)
(3)
(4)
1. PDRB Atas Dasar Harga Pasar (Juta Rp)/GRDP At Market Prices (Millions Rps) 6 192 785,55 7 778 000,60 8,671,818.05
2. Penyusutan (Juta Rp) - Depreciation (Millions Rps) 624 036,80 783 776,30 873,844.82
3. PDRN Atas Dasar Harga Pasar / NRDP At Market Prices ( Millions Rps) 5 568 748,75 6 994 224,28 7,797,973.23
4. Pajak Tak Langsung (Juta Rp) / Net Indirect Taxs 222 506,99 279 463,82 311,578.72
5. PDRN Atas Dasar Biaya Faktor (Juta Rp) / NRDP At Factor Cost (Millions Rps) 5 346 241,76 6 714 760,46 7,486,394.52
6. Penduduk (Jiwa) / Population (People) 1 016 663 1 032 256 1,047,739.00
Angka Perkapita
7. Produk Domestik Regional Bruto (Rupiah) / GRDP (Rp) 6 091 286 7 534 953 8,276,697
8. PDRN Perkapita (Rp) / PDRN Percapita (Rps) 5 258 617 6 504 937 7,145,286
Catatan / Note : *) Angka Sementara /Preliminary Figure
Sumber / Source : Badan Pusat Statistik (BPS) Provinsi Sulawesi Bar at / BPS of Sulawesi Barat Province

PENDAPATAN REGIONAL, INFLASI, NTP
394 SULAWESI BARAT DALAM ANGKA 2010
Tabel
9.3.2
Produk Domestik Regional Bruto Dan Angka Per Kapita Provinsi Sulawesi Barat Atas Dasar Harga Konstan 2000, 2007-2009 Table
Gross Regional Domestic Product and Per Capita Figure in Sulawesi barat Constant 2000 Market Price , 2007-2009
Uraian Description
2007 2008 2009*)
(1)
(2)
(3)
(4)
1. PDRB Atas Dasar Harga Pasar (Juta Rp)/GRDP At Market Prices (Millions Rps)
3 567 816,13 3 872 522,90 4,106,016.82
2. Penyusutan (Juta Rp) - Depreciation (Millions Rps) 367 245,06 398 609,36 422,643.53
3. PDRN Atas Dasar Harga Pasar / NRDP At Market Prices ( Millions Rps)
3 200 571,07 3 473 913,54 3,683,373.29
4. Pajak Tak Langsung (Juta Rp) / Net Indirect Taxs 128 191,75 139 139,88 147,529.32
5. PDRN Atas Dasar Biaya Faktor (Juta Rp) / NRDP At Factor Cost (Millions Rps)
3 072 379,31 3 334 773,66 3,535,843.97
6. Penduduk (Jiwa) / Population (People) 1 016 663 1 032 256 1,047,739
Angka Perkapita
7. Produk Domestik Regional Bruto (Rupiah) / GRDP (Rp) 3 509 340 3 751 514 3,918,931
8. PDRN Perkapita (Rp) / PDRN Percapita (Rps) 3 022 023 3 230 568 3,374,737
Catatan / Note : *) Angka Sementara /Preliminary Figure
Sumber / Source : Badan Pusat Statistik (BPS) Provinsi Sulawesi Bar at / BPS of Sulawesi Barat Province

REGIONAL INCOME, INFLATION, NTP
SULAWESI BARAT IN FIGURES 2010 395
Tabel 9.4 PDRB Perkapita Provinsi Sulawesi Barat ( Juta Rupia h) 2004 – 2009 Table GRDP Percapita In Sulawesi Barat (Million Rupiahs), 2004 – 2009
Tahun Year
Harga Berlaku Current Market Price
Harga Konstan 2000 Constant 2000 Market Price
Pertumbuhan Riil Real Growth
(%)
(1) (2) (3) (4)
2004 3 869 646 2 946 313 5,86
2005 4 422 946 3 120 765 5,92
2006 5 124 812 3 338 754 6,42
2007 6 192 786 3 567 816 7,43
2008 7 534 953 3 751 514 8,54
2009 8,276,696 3,918,930 6.03
Sumber / Source : Badan Pusat Statistik (BPS) Provinsi Sulawesi Bar at / BPS of Sulawesi Barat Province

PENDAPATAN REGIONAL, INFLASI, NTP
396 SULAWESI BARAT DALAM ANGKA 2010
Tabel
9.5.1
Produk Domestik Regional Bruto Menurut Penggunaan A tas Dasar Harga Berlaku (Dalam Juta Rp), 2007-2009 Table Gross Regional Domestic Product By Expenditure at Current Market Prices (Million Rupiahs), 2007 – 2009
Jenis Penggunaan Expenditure Classification
2007 2008 2009*)
(1)
(2)
(3)
(4)
1. Konsumsi Rumah Tangga – Household Consumption 4 356 313,93 5 440 491,10
5,927,809.75
2. Konsumsi Pemerintah – Government Consumption 1 286 623,35 1 719 207,12
2,054,226.71
3. Pembentukan Modal – Capital Formation 853 978,93 1 261 981,90
1,378,189.59
4. Perubahan Stok 66 209,08 (49 563,52)
30,297.79
5. Ekspor Barang Dan Jasa - Export 879 728,23 1 073 478,78
1,265,171.45
6. Dikurangi Impor Barang Dan Jasa - Import 1 250 067,97 1 667 594,79
1,983,877.24
Produk Domestik Regional Bruto - GRDP 6 192 785,55 7 778 000,59
8,671,818.05
Catatan / Note : *) Angka Sementara /Preliminary Figure
Sumber / Source : Badan Pusat Statistik (BPS) Provinsi Sulawesi Bar at / BPS of Sulawesi Barat Province

REGIONAL INCOME, INFLATION, NTP
SULAWESI BARAT IN FIGURES 2010 397
Tabel
9.5.2
PDRB Menurut Penggunaan Atas Dasar Harga Konstan 20 00 (Dalam Juta Rp) 2007 – 2009 Table Gross Regional Domestic Product By Expenditure at Constant 2000 Market Prices (Million Rupiahs), 2007 – 2009
Jenis Penggunaan Expenditure Classification 2007 2008 2009*)
(1)
(2)
(3)
(4)
1. Konsumsi Rumah Tangga – Household Consumption 2 570 476,50 2 822 747,00
2,996,614.31
2. Konsumsi Pemerintah – Government Consumption 731 474,65 850 010,69
954,254.98
3. Pembentukan Modal – Capital Formatio 413 827,46 566 833,87
611,727.84
4.Perubahan Stok 26 868,13 (162 831,05)
(227,719.40)
5. Ekspor Barang Dan Jasa - Export 467 884,74 532 322,14
609,638.36
6. Dikurangi Impor Barang Dan Jasa - Import 642 715,34 736 559,78
838,499.27
PDRB 3 567 816,13 3 872 522,88
4,106,016.82
Catatan / Note : *) Angka Sementara /Preliminary Figure
Sumber / Source : Badan Pusat Statistik (BPS) Provinsi Sulawesi Bar at / BPS of Sulawesi Barat Province

PENDAPATAN REGIONAL, INFLASI, NTP
398 SULAWESI BARAT DALAM ANGKA 2010
Tabel
9.6
PDRB Kabupaten Dan PDRB Provinsi Menurut Harga Kons tan 2000 Dan Harga Berlaku, Pdrb Perkapita Dan Jumlah Penduduk P ertengahan Tahun Se Sulawesi Barat Tahun 2009
Table
Regency Grdp And Province Grdp By Constant Rates And Rates Applicable 2000, Grdp Per Capita And Total Population In The Middle Year In Sulawesi Barat Province, 2009
Kode Wilayah
Area Code
Kabupaten/Provinsi Regency/Province
PDRB Harga Berlaku
GRDP at Current Market Price
(In Million Rp.)
PDRB Harga Konstan
GRDP Constant Market Price
(In Million Rp.)
Pertumbuhan Grwoth
(%)
Penduduk Population
(Jiwa)
(1)
(2)
(3)
(4)
(5)
(6)
01 Majene 1 112 919,81 541 610,76 6,17 133 296
02 Polewali Mandar 2 547 248,96 1 283 751,47 4,92 362 106
03 Mamasa 901 408,93 540 061,50 4,33 126 134
04 Mamuju 2 859 291,55 1 243 844,83 8,26 315 053
05 Mamuju Utara 1 136 969,11 532 465,54 8,67 111 150
76 Sulawesi Barat 8,276,696 3,918,930 6,03 1,047,739
Catatan / Note : *) Angka Sementara /Preliminary Figure
Sumber / Source : Badan Pusat Statistik (BPS) Provinsi Sulawesi Bar at / BPS of Sulawesi Barat Province

REGIONAL INCOME, INFLATION, NTP
SULAWESI BARAT IN FIGURES 2010 399
TABEL 9.7.1
Indeks Harga Konsumen (IHK) Berdasarkan Komoditi/Je nis Barang Dan Jasa Di Kota Mamuju 2009
Table Consumer Rates Price Based Comodity Types Of Goods And Services In The Mamuju City, 2009
Kelompok/sub Kelompok Jan Feb Mar April Mei Juni Juli Agust. Sept. Okt. Nov. Des.
Jenis Barang Dan Jasa
[1] [2] [3] [4] [5] [6] [7] [8] [9] [10] [11] [12] [13]
Umum 118.24 118.42 118.83 118.97 118.80 118.90 118.69 119.40 120.62 120.27 120.36 121.37
Bahan Makanan 135.47 134.09 134.01 133.82 132.87 133.49 132.10 133.16 136.33 134.65 134.58 137.71
Padi-Padian, Umbi-Umbian
Dan Hasilnya 119.14 119.53 118.79 120.95 118.14 118.10 118.03 118.08 118.22 118.37 118.91 125.88
Beras 119.51 119.85 119.05 121.47 118.23 118.23 118.23 118.23 118.23 118.45 119.12 127.35
Ketela Pohon 73.54 73.54 66.86 66.86 66.86 66.86 60.18 56.83 60.18 60.18 60.18 50.15
Mie Kering Instant 116.07 116.07 116.07 116.07 116.07 116.07 116.07 116.07 116.07 116.07 116.07 116.07
Mie Telor 111.11 111.11 111.11 111.11 111.11 114.02 114.02 114.02 114.02 114.02 114.02 114.02
Tepung Terigu 131.18 134.31 134.72 136.33 136.33 134.74 134.33 136.74 139.88 138.73 137.58 135.27
Daging Dan Hasil-Hasilnya 129.95 130.76 126.05 128.63 128.63 133.14 132.24 135.56 139.95 119.33 125.92 125.63
Ayam Hidup 118.46 123.95 117.26 119.53 119.53 123.05 122.02 126.16 133.67 107.14 121.70 123.11
Daging Ayam Ras 170.12 160.12 155.84 155.84 155.84 171.42 169.08 176.73 183.56 150.76 152.90 143.35
Daging Sapi 123.87 124.25 121.89 126.24 126.24 126.24 126.24 126.24 125.27 118.76 117.28 119.63
Ikan Segar 159.21 157.72 155.41 152.73 151.32 152.60 146.65 144.73 152.21 150.89 145.10 149.61
Bandeng 167.19 150.47 139.17 130.31 128.34 130.22 123.90 112.69 114.82 112.70 102.07 89.32
Baronang 109.06 104.78 101.45 100.03 98.62 99.54 98.62 98.62 80.12 61.63 61.63 61.63
Cakalang 138.18 152.91 163.50 161.15 161.34 161.74 152.90 168.58 194.06 189.75 187.60 203.25
Cumi-Cumi 126.40 126.29 123.52 120.75 119.51 117.99 111.05 97.17 72.30 100.59 94.30 100.59
Kakap Putih 127.23 124.09 118.53 120.95 120.95 120.95 120.95 120.95 120.95 120.95 120.95 145.14
Katamba 171.09 159.23 151.42 150.42 150.42 153.42 146.91 135.38 135.39 139.40 142.41 150.44
Kembung/Gembung 108.13 101.50 94.67 92.43 91.87 91.59 91.58 84.02 84.02 84.02 84.02 89.06

PENDAPATAN REGIONAL, INFLASI, NTP
400 SULAWESI BARAT DALAM ANGKA 2010
Lanjutan Tabel / Table Continued 9.7.1
Kelompok/sub Kelompok Jan Feb Mar April Mei Juni Juli Agust. Sept. Okt. Nov. Des.
Jenis Barang Dan Jasa
[1] [2] [3] [4] [5] [6] [7] [8] [9] [10] [11] [12] [13]
Layang 190.87 191.52 190.16 196.73 195.41 197.36 191.89 194.76 191.51 195.42 183.69 199.32
Merah 104.00 109.21 108.68 101.04 100.96 102.40 120.00 120.00 117.60 120.01 120.01 127.21
Teri 135.13 136.09 130.74 123.74 120.72 123.74 118.24 105.86 90.74 82.49 82.49 82.49
Tongkol 274.55 290.17 289.27 300.42 294.62 292.39 292.39 267.83 267.83 267.83 267.83 294.61
Udang Basah 85.42 93.60 95.11 88.01 84.58 85.38 80.19 90.19 132.33 121.61 111.54 108.29
Ikan Diawetkan 156.01 156.11 171.04 179.51 177.12 177.05 156.48 117.64 119.57 127.33 150.52 158.18
Ikan Asin Belah 208.91 207.84 228.42 239.71 229.72 229.72 200.89 147.19 147.19 144.57 180.72 180.72
Ikan Dalam Kaleng 151.96 154.58 154.58 154.58 154.58 154.58 154.58 154.58 154.58 154.58 154.58 154.58
Teri 113.95 115.78 132.21 143.11 147.32 147.32 126.28 84.19 84.19 107.34 128.39 147.34
Ikan Terbang 110.42 105.28 104.49 98.56 98.25 97.46 93.57 93.57 115.01 109.03 109.03 109.03
Telur, Susu Dan Hasil-
Hasilnya 113.21 108.56 111.01 112.76 109.16 107.35 109.80 112.47 114.22 110.42 109.33 111.55
Susu Bubuk 121.49 122.23 123.88 125.52 126.11 124.14 123.63 123.17 125.21 125.34 124.49 126.54
Susu Kental Manis 102.71 104.68 105.71 106.93 107.22 103.61 103.61 104.81 108.38 108.38 107.36 106.48
Susu Untuk Balita 101.98 102.22 102.54 102.54 102.54 103.41 103.41 103.41 103.41 101.39 100.57 100.87
Susu Untuk Bayi 116.10 91.75 91.75 93.31 93.31 93.03 93.54 93.62 93.87 92.90 92.57 92.42
Telur Ayam Kampung 146.16 142.61 145.77 151.44 151.44 151.44 158.14 160.37 160.37 160.37 160.37 153.98
Telur Ayam Ras 114.50 107.90 113.85 117.82 104.73 102.11 109.64 117.82 117.82 106.92 104.74 113.47
Telur Itik 95.03 95.03 101.46 94.64 89.03 86.63 96.26 99.26 117.21 103.13 103.13 93.37
Susu Cair Kemasan 131.51 131.51 131.51 133.12 133.12 133.12 133.12 136.28 136.28 136.28 136.28 136.28
Sayur-Sayuran 149.41 147.55 147.70 138.09 144.37 148.97 144.31 144.53 163.74 165.26 165.84 162.15
Bayam 207.70 203.04 181.28 167.29 183.87 192.15 199.15 194.99 226.18 218.37 218.37 218.37
Daun Kacang Panjang
Muda 198.05 179.99 178.87 166.66 186.10 201.11 200.00 194.42 266.65 266.65 249.98 191.65
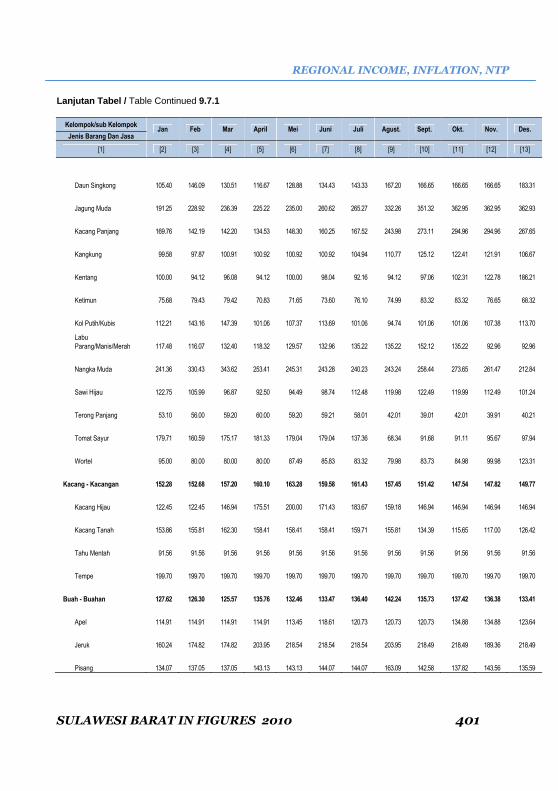
REGIONAL INCOME, INFLATION, NTP
SULAWESI BARAT IN FIGURES 2010 401
Lanjutan Tabel / Table Continued 9.7.1
Kelompok/sub Kelompok Jan Feb Mar April Mei Juni Juli Agust. Sept. Okt. Nov. Des.
Jenis Barang Dan Jasa
[1] [2] [3] [4] [5] [6] [7] [8] [9] [10] [11] [12] [13]
Daun Singkong 105.40 146.09 130.51 116.67 128.88 134.43 143.33 167.20 166.65 166.65 166.65 183.31
Jagung Muda 191.25 228.92 236.39 225.22 235.00 260.62 265.27 332.26 351.32 362.95 362.95 362.93
Kacang Panjang 169.76 142.19 142.20 134.53 148.30 160.25 167.52 243.98 273.11 294.96 294.96 267.65
Kangkung 99.58 97.87 100.91 100.92 100.92 100.92 104.94 110.77 125.12 122.41 121.91 106.67
Kentang 100.00 94.12 96.08 94.12 100.00 98.04 92.16 94.12 97.06 102.31 122.78 186.21
Ketimun 75.68 79.43 79.42 70.83 71.65 73.60 76.10 74.99 83.32 83.32 76.65 68.32
Kol Putih/Kubis 112.21 143.16 147.39 101.06 107.37 113.69 101.06 94.74 101.06 101.06 107.38 113.70
Labu
Parang/Manis/Merah 117.48 116.07 132.40 118.32 129.57 132.96 135.22 135.22 152.12 135.22 92.96 92.96
Nangka Muda 241.36 330.43 343.62 253.41 245.31 243.28 240.23 243.24 258.44 273.65 261.47 212.84
Sawi Hijau 122.75 105.99 96.87 92.50 94.49 98.74 112.48 119.98 122.49 119.99 112.49 101.24
Terong Panjang 53.10 56.00 59.20 60.00 59.20 59.21 58.01 42.01 39.01 42.01 39.91 40.21
Tomat Sayur 179.71 160.59 175.17 181.33 179.04 179.04 137.36 68.34 91.68 91.11 95.67 97.94
Wortel 95.00 80.00 80.00 80.00 87.49 85.83 83.32 79.98 83.73 84.98 99.98 123.31
Kacang - Kacangan 152.28 152.68 157.20 160.10 163.28 159.58 161.43 157.45 151.42 147.54 147.82 149.77
Kacang Hijau 122.45 122.45 146.94 175.51 200.00 171.43 183.67 159.18 146.94 146.94 146.94 146.94
Kacang Tanah 153.86 155.81 162.30 158.41 158.41 158.41 159.71 155.81 134.39 115.65 117.00 126.42
Tahu Mentah 91.56 91.56 91.56 91.56 91.56 91.56 91.56 91.56 91.56 91.56 91.56 91.56
Tempe 199.70 199.70 199.70 199.70 199.70 199.70 199.70 199.70 199.70 199.70 199.70 199.70
Buah - Buahan 127.62 126.30 125.57 135.76 132.46 133.47 136.40 142.24 135.73 137.42 136.38 133.41
Apel 114.91 114.91 114.91 114.91 113.45 118.61 120.73 120.73 120.73 134.88 134.88 123.64
Jeruk 160.24 174.82 174.82 203.95 218.54 218.54 218.54 203.95 218.49 218.49 189.36 218.49
Pisang 134.07 137.05 137.05 143.13 143.13 144.07 144.07 163.09 142.58 137.82 143.56 135.59

PENDAPATAN REGIONAL, INFLASI, NTP
402 SULAWESI BARAT DALAM ANGKA 2010
Lanjutan Tabel / Table Continued 9.7.1
Kelompok/sub Kelompok Jan Feb Mar April Mei Juni Juli Agust. Sept. Okt. Nov. Des.
Jenis Barang Dan Jasa
[1] [2] [3] [4] [5] [6] [7] [8] [9] [10] [11] [12] [13]
Tomat Buah 106.84 80.13 75.68 99.33 70.95 66.23 80.42 75.69 80.43 80.43 80.43 80.43
Bumbu - Bumbuan 147.22 149.53 149.06 137.31 141.69 141.17 145.40 160.40 157.47 156.94 167.68 166.83
Asam 103.72 96.04 96.04 99.89 99.89 99.89 111.41 126.77 130.62 130.62 130.62 121.28
Bawang Merah 125.48 134.53 133.99 123.55 123.53 123.68 151.65 182.75 138.75 108.74 116.77 121.81
Bawang Putih 219.23 197.31 194.74 190.00 190.00 190.00 197.30 274.02 306.88 337.91 347.04 372.59
Penyedap Masakan/Vetsin 122.14 122.14 128.94 141.22 139.36 134.90 134.90 134.90 134.90 134.90 134.90 140.59
Garam 218.75 218.75 218.75 218.75 224.82 239.16 247.49 229.97 248.93 248.93 231.88 221.40
Gula Merah 134.02 131.28 129.92 127.26 124.65 122.11 119.62 117.18 117.18 114.79 112.44 106.20
Jeruk Nipis/Limau 157.53 157.53 157.53 157.53 157.53 157.53 157.53 157.53 175.03 175.03 175.03 175.03
Kecap (Isi) 107.08 109.73 109.73 109.73 118.97 122.91 122.91 124.27 132.04 132.04 125.72 123.20
Lada/Merica 90.05 98.54 98.54 101.31 90.05 95.59 95.59 95.59 95.59 84.33 89.87 101.12
Cabe Merah 97.76 111.90 120.54 97.82 118.76 106.88 97.36 96.47 88.61 93.33 103.42 89.35
Cabe Rawit 261.05 282.43 262.66 187.10 194.16 200.50 202.39 212.97 174.08 163.19 249.98 238.85
Lemak Dan Minyak 126.22 114.20 123.76 128.57 128.14 127.19 127.95 133.58 134.55 134.97 134.19 135.32
Kelapa 150.00 150.00 150.00 150.00 150.00 150.00 142.70 155.80 160.67 165.55 165.55 165.55
Margarine 129.84 129.84 129.84 129.84 127.07 120.01 124.51 124.51 126.44 126.44 125.51 125.51
Minyak Goreng 135.14 139.00 140.76 141.74 144.86 142.69 143.84 144.99 145.24 144.09 141.94 140.94
Minyak Kelapa 109.77 79.83 99.79 109.77 106.45 106.45 109.77 116.42 116.42 116.42 116.42 119.75
Bahan Makanan Lainnya 110.27 110.86 109.15 109.15 109.15 109.15 112.58 110.66 110.66 110.66 110.66 110.29
Bahan Agar-Agar 110.08 110.08 110.08 110.08 110.08 110.08 110.08 110.08 110.08 110.08 110.08 110.08
Kerupuk Udang 106.35 108.06 104.69 104.69 104.69 104.69 111.45 107.67 107.67 107.67 107.67 106.94
Kripik Mentah 122.60 120.95 120.95 120.95 120.95 120.95 120.95 120.95 120.95 120.95 120.95 120.95

REGIONAL INCOME, INFLATION, NTP
SULAWESI BARAT IN FIGURES 2010 403
Lanjutan Tabel / Table Continued 9.7.1
Kelompok/sub Kelompok Jan Feb Mar April Mei Juni Juli Agust. Sept. Okt. Nov. Des.
Jenis Barang Dan Jasa
[1] [2] [3] [4] [5] [6] [7] [8] [9] [10] [11] [12] [13]
Makanan Jadi, Minuman,
Rokok & Tembakau 128.33 129.55 131.57 132.20 132.88 133.02 132.99 134.34 135.24 135.62 135.60 136.23
Makanan Jadi 138.75 139.01 141.32 141.88 141.96 141.98 141.98 143.45 143.75 144.13 144.13 144.13
Ayam Goreng 170.00 170.00 170.00 170.00 170.00 170.00 170.00 170.00 170.00 170.00 170.00 170.00
Biskuit 125.10 125.10 125.10 125.10 125.10 125.10 125.10 125.10 125.10 125.10 125.10 125.10
Gado-Gado 152.40 152.40 152.40 152.40 152.40 152.40 152.40 152.40 152.40 152.40 152.40 152.40
Ikan Bakar 119.33 119.33 119.33 119.33 119.33 119.33 119.33 119.33 119.33 119.33 119.33 119.33
Kembang Gula 113.34 113.34 113.34 113.34 113.34 113.34 113.34 113.34 113.34 113.34 113.34 113.34
Kue Basah 132.75 132.75 178.30 178.30 178.30 178.30 178.30 178.30 178.30 178.30 178.30 178.30
Kue Kering Berminyak 150.00 150.00 150.00 150.00 150.00 150.00 150.00 150.00 150.00 150.00 150.00 150.00
Makanan Ringan/Snack 150.00 150.00 150.00 150.00 150.00 150.00 150.00 155.60 155.60 155.60 155.60 155.60
Martabak 131.72 135.44 135.44 135.44 135.44 135.44 135.44 135.44 135.44 135.44 135.44 135.44
Mie 118.07 118.07 118.07 122.29 122.29 122.29 122.29 122.29 122.29 122.29 122.29 122.29
Nasi 148.45 148.45 148.45 148.45 148.45 148.45 148.45 148.45 148.45 148.45 148.45 148.45
Roti Manis 151.26 151.26 151.26 151.26 151.26 151.26 151.26 162.90 162.90 164.84 164.84 164.84
Roti Tawar 114.96 114.96 114.96 114.96 114.96 115.96 115.96 119.49 119.49 123.57 123.57 123.57
Sate 119.58 121.89 121.89 121.89 121.89 121.89 121.89 121.89 121.89 128.65 128.65 128.65
Soto 130.78 130.78 130.78 130.78 130.78 130.78 130.78 130.78 130.78 130.78 130.78 130.78
Sop 144.06 145.50 145.50 145.50 145.50 145.50 145.50 145.50 145.50 145.50 145.50 145.50
Wafer 138.90 138.90 138.90 138.90 141.67 141.67 141.67 147.10 157.60 157.60 157.60 157.60
Minuman Yang Tidak
Beralkohol 105.23 108.76 108.94 109.69 113.13 113.83 113.70 116.77 120.82 120.82 120.71 122.58
Air Kemasan 128.50 128.50 128.50 128.50 128.50 128.50 128.50 128.50 128.50 128.50 128.50 128.50
Gula Pasir 93.34 102.58 102.58 104.64 112.74 114.25 113.53 121.50 133.54 133.54 133.54 137.50

PENDAPATAN REGIONAL, INFLASI, NTP
404 SULAWESI BARAT DALAM ANGKA 2010
Lanjutan Tabel / Table Continued 9.7.1
Kelompok/sub Kelompok Jan Feb Mar April Mei Juni Juli Agust. Sept. Okt. Nov. Des.
Jenis Barang Dan Jasa
[1] [2] [3] [4] [5] [6] [7] [8] [9] [10] [11] [12] [13]
Ice Cream 107.14 107.14 107.14 107.14 119.39 121.60 121.60 125.41 127.51 127.51 127.51 135.61
Juice Buah 165.69 165.69 165.69 165.69 165.69 165.69 165.69 165.69 165.69 165.69 165.69 165.69
Kopi Bubuk 90.49 93.12 93.12 93.12 93.12 93.12 93.12 93.12 93.12 93.12 92.40 92.40
Minuman Kesegaran 101.20 102.28 102.28 102.28 102.28 102.28 102.28 103.93 103.93 103.93 103.93 103.93
Sirop 118.32 118.32 116.58 118.35 118.35 119.51 121.66 121.66 122.56 122.56 122.65 123.46
Teh 100.00 100.00 104.18 104.18 104.18 104.18 104.18 104.18 104.18 104.18 104.18 104.18
Tembakau Dan Minuman
Beralkohol 123.56 125.12 127.75 128.46 128.46 128.46 128.46 128.46 128.46 129.06 129.06 130.09
Bir 120.70 120.70 120.70 120.70 120.70 120.70 120.70 120.70 120.70 122.38 122.38 127.57
Rokok Kretek 142.81 149.52 152.19 152.19 152.19 152.19 152.19 152.19 152.19 156.58 156.58 158.45
Rokok Kretek Filter 121.93 123.04 126.56 127.75 127.75 127.75 127.75 127.75 127.75 127.75 127.75 127.75
Rokok Putih 117.48 117.48 118.16 118.16 118.16 118.16 118.16 118.16 118.16 118.16 118.16 120.93
Perumahan,air,listrik,gas
& bahan bakar 111.95 112.28 112.12 112.34 112.54 112.77 112.65 113.21 113.76 113.75 113.81 114.05
Biaya tempat tinggal 114.65 114.72 114.17 114.33 114.37 114.29 114.07 114.78 115.10 115.08 115.30 115.68
Batu 123.46 133.33 133.33 133.33 133.33 133.33 133.33 133.33 133.33 133.33 133.33 133.33
Batu Bata/Batu Tela 145.20 149.83 149.83 149.83 149.83 149.83 149.83 149.83 149.83 149.83 149.83 149.83
Besi Beton 149.87 142.74 132.26 138.18 137.98 140.20 139.41 139.41 134.08 134.87 131.45 117.74
Cat Kayu 116.43 119.86 121.55 121.55 121.18 121.18 120.50 120.50 120.50 120.50 120.50 120.50
Cat Tembok 119.03 124.07 124.07 125.11 124.28 124.28 121.70 121.70 122.10 122.10 122.93 123.95
Daun Pintu 127.10 127.10 128.13 128.13 128.13 128.13 128.13 128.13 128.13 128.13 123.72 123.72
Kayu Balokan 102.61 102.61 99.80 99.80 99.80 100.42 100.42 103.21 103.21 103.21 103.21 103.21
Kayu Lapis 97.99 95.80 95.80 93.53 93.13 92.35 92.35 92.35 92.35 92.35 93.48 93.58
Keramik 109.09 109.09 109.09 109.09 109.44 109.44 108.70 108.70 108.70 108.70 108.70 108.70

REGIONAL INCOME, INFLATION, NTP
SULAWESI BARAT IN FIGURES 2010 405
Lanjutan Tabel / Table Continued 9.7.1
Kelompok/sub Kelompok Jan Feb Mar April Mei Juni Juli Agust. Sept. Okt. Nov. Des.
Jenis Barang Dan Jasa
[1] [2] [3] [4] [5] [6] [7] [8] [9] [10] [11] [12] [13]
Kontrak Rumah 101.79 101.79 101.79 101.79 101.79 101.79 101.79 101.79 101.79 101.79 101.79 104.38
Paku 140.00 140.00 131.92 131.92 131.92 130.42 130.42 130.42 130.42 130.42 118.46 118.46
Papan 126.17 126.17 126.17 126.17 126.17 127.20 127.20 127.20 127.20 127.20 127.20 127.20
Pasir 95.66 99.34 99.34 99.34 99.34 99.34 99.34 110.37 110.37 110.37 110.37 110.37
Semen 125.43 123.95 124.98 125.89 126.52 126.42 125.75 125.92 127.70 127.41 127.55 127.85
Seng 111.92 106.10 101.89 101.89 101.89 97.85 96.50 96.50 102.23 102.23 101.75 100.31
Sewa Rumah 121.36 121.36 121.36 121.36 121.36 121.36 121.36 121.36 121.36 121.36 123.90 124.30
Tukang Bukan Mandor 119.34 119.34 119.34 119.34 119.34 119.34 119.34 119.34 119.34 119.34 119.34 119.34
Bahan Bakar, Penerangan
Dan Air 97.65 97.76 97.69 97.70 98.58 99.11 99.11 99.11 99.11 99.11 99.11 99.11
Batu Bateray 100.20 100.20 100.20 100.20 100.20 100.20 100.20 100.20 100.20 100.20 100.20 100.20
Bola Lampu 84.89 93.56 95.28 96.96 96.96 98.83 98.83 98.83 98.83 98.83 98.83 98.83
Lampu TL/Neon 73.86 78.41 78.41 78.41 78.41 78.41 78.41 78.41 78.41 78.41 78.41 78.41
Tarip Air Minum PAM 100.00 100.00 100.00 100.00 100.00 100.00 100.00 100.00 100.00 100.00 100.00 100.00
Tarip Listrik 100.00 100.00 100.00 100.00 100.00 100.00 100.00 100.00 100.00 100.00 100.00 100.00
Korek Api Gas 100.00 100.00 100.00 100.00 100.00 100.00 100.00 100.00 100.00 100.00 100.00 100.00
Bahan Bakar Rumah
tangga 95.15 95.15 94.95 94.95 97.00 98.21 98.21 98.21 98.21 98.21 98.21 98.21
Perlengkapan
Rumahtangga 123.38 124.17 125.22 125.59 125.59 126.63 126.72 127.80 130.10 130.10 129.76 129.69
Air Conditioner (AC) 107.01 107.01 107.01 107.58 107.58 110.52 110.52 110.79 110.79 110.79 110.79 110.79
Gelas Minum 127.20 127.20 127.20 129.96 129.96 129.96 129.96 129.96 129.96 129.96 129.96 129.96
Kasur 100.16 99.25 99.25 99.25 99.25 99.25 99.25 99.25 99.25 99.25 99.25 99.25
Kipas Angin 117.47 117.41 121.44 123.76 123.76 125.87 129.34 129.34 131.06 131.06 131.06 131.06
Kulkas/Lemari Es 109.90 112.76 118.47 118.47 118.47 122.79 122.79 123.42 126.51 126.51 126.51 124.86

PENDAPATAN REGIONAL, INFLASI, NTP
406 SULAWESI BARAT DALAM ANGKA 2010
Lanjutan Tabel / Table Continued 9.7.1
Kelompok/sub Kelompok Jan Feb Mar April Mei Juni Juli Agust. Sept. Okt. Nov. Des.
Jenis Barang Dan Jasa
[1] [2] [3] [4] [5] [6] [7] [8] [9] [10] [11] [12] [13]
Kursi 140.46 140.46 140.46 140.46 140.46 140.46 140.46 140.46 146.56 146.56 146.56 146.56
Lemari Pakaian 127.56 128.70 128.70 128.70 128.70 128.70 128.70 129.82 129.82 129.82 129.82 129.82
Meja Kursi Tamu 169.14 171.88 171.88 171.88 171.88 178.59 174.20 174.59 177.20 177.20 177.20 177.20
Mesin Cuci 143.22 147.41 153.66 154.92 154.92 158.05 158.05 160.13 163.63 163.63 160.24 160.24
Panci 110.31 109.98 109.98 109.98 109.98 109.98 109.98 109.98 111.92 111.92 111.92 111.92
Piring 106.70 105.76 105.76 105.76 105.76 105.76 105.76 105.76 109.50 109.50 109.50 109.50
Sprey 100.00 100.00 100.00 100.00 100.00 100.00 100.00 100.00 105.36 105.36 105.36 105.36
Tempat Tidur 136.54 136.54 136.54 136.54 136.54 136.54 136.54 147.46 147.46 147.46 147.46 147.46
Magic Com 101.51 103.04 103.86 103.60 103.60 103.60 103.60 104.73 105.23 105.23 105.23 105.23
Kompor 109.12 110.56 111.48 112.08 112.08 113.16 115.99 115.99 116.90 116.90 116.90 116.90
Penyelenggaraan
Rumahtangga 109.22 111.17 111.27 112.08 112.04 112.04 111.90 111.85 112.01 112.01 112.01 112.46
Pembasmi Nyamuk
Bakar 110.53 116.34 116.34 119.12 119.12 119.12 119.12 119.12 119.12 119.12 119.12 124.53
Pembasmi Nyamuk Cair 103.15 103.15 103.15 103.89 103.89 103.89 103.89 103.89 105.56 105.56 105.56 105.56
Pengharum
Cucian/Pelembut 94.08 94.08 94.08 94.08 94.08 94.08 94.08 94.08 94.08 94.08 94.08 94.08
Sabun Cair/Cuci Piring 126.19 124.02 124.02 123.30 122.58 122.58 121.85 121.12 122.60 122.60 122.60 122.60
Sabun Cream Detergen 100.00 100.00 100.00 100.00 100.00 100.00 99.77 99.77 99.77 99.77 99.77 99.77
Sabun Detergen Bubuk 114.20 116.98 117.27 118.94 118.94 118.94 118.94 118.94 118.94 118.94 118.94 118.94
Upah Pembantu RT 105.27 107.12 107.12 107.12 107.12 107.12 107.12 107.12 107.12 107.12 107.12 107.12
Jasa Pembuangan
Sampah 100.00 100.00 100.00 100.00 100.00 100.00 100.00 100.00 100.00 100.00 100.00 100.00
Sandang 115.36 118.86 118.54 117.72 116.16 115.96 117.58 117.87 119.20 119.26 120.64 121.91
Sandang laki-laki 112.29 112.88 113.61 114.05 115.08 115.08 116.09 117.26 118.93 118.93 118.93 118.93
Baju Kaos/T-Shirt 102.10 104.33 104.33 104.33 104.33 104.33 104.33 104.33 104.33 104.33 104.33 104.33

REGIONAL INCOME, INFLATION, NTP
SULAWESI BARAT IN FIGURES 2010 407
Lanjutan Tabel / Table Continued 9.7.1
Kelompok/sub Kelompok
Jan Feb Mar April Mei Juni Juli Agust. Sept. Okt. Nov. Des. Jenis Barang Dan Jasa
[1] [2] [3] [4] [5] [6] [7] [8] [9] [10] [11] [12] [13]
Celana Dalam Pria 133.17 125.64 125.64 129.90 129.90 129.90 129.90 129.90 132.85 132.85 132.85 132.85
Celana Panjang Jeans 106.68 108.35 112.49 112.49 113.57 113.57 114.49 118.77 122.49 122.49 122.49 122.49
Celana Panjang Katun 112.61 112.61 112.61 112.61 112.61 112.61 112.61 112.61 118.43 118.43 118.43 118.43
Celana Pendek 106.49 107.79 107.79 107.79 107.79 107.79 112.35 112.35 112.35 112.35 112.35 112.35
Kaos Kaki 126.53 126.53 126.53 126.53 135.57 135.57 135.57 135.57 135.57 135.57 135.57 135.57
Kaos Oblong 103.57 103.57 103.57 103.57 106.10 106.10 108.82 108.82 108.82 108.82 108.82 108.82
Kemeja Panjang Batik 119.70 119.70 119.70 120.71 120.71 120.71 122.73 122.73 122.73 122.73 122.73 122.73
Kemeja Panjang Katun 125.00 125.00 125.00 128.20 128.20 128.20 128.20 128.20 133.78 133.78 133.78 133.78
Kemeja Pendek Katun 150.15 150.15 150.15 150.15 151.52 151.52 153.46 153.46 154.97 154.97 154.97 154.97
Sandal Kulit 112.22 112.22 112.22 112.83 114.86 114.86 116.61 119.67 119.67 119.67 119.67 119.67
Sarung Katun 121.21 121.21 121.21 121.21 123.85 123.85 123.85 123.85 123.85 123.85 123.85 123.85
Sepatu 109.10 109.10 109.10 109.10 109.91 109.91 109.91 109.91 109.91 109.91 109.91 109.91
Seragam Sekolah Pria 112.34 112.34 112.34 112.34 112.34 112.34 117.51 117.51 117.51 117.51 117.51 117.51
Baju Muslim 117.86 117.86 117.86 121.04 121.04 121.04 122.87 122.87 138.86 138.86 138.86 138.86
Sandang Wanita 117.89 117.99 117.99 117.99 118.05 118.05 123.03 123.21 124.72 124.72 124.70 124.70
Bahan Baju Katun 108.21 108.21 108.21 108.21 108.21 108.21 112.54 118.79 118.79 118.79 118.32 118.32
Baju Kaos/T-Shirt 130.19 130.19 130.19 130.19 130.19 130.19 132.61 132.61 141.45 141.45 141.45 141.45
Baju Muslim 104.97 104.97 104.97 104.97 104.97 104.97 104.97 104.97 104.97 104.97 104.97 104.97
Bh Katun 114.34 116.54 116.54 116.54 116.54 116.54 156.20 156.20 156.20 156.20 156.20 156.20
Blus 108.80 108.20 108.20 108.20 108.20 108.20 145.02 145.02 145.02 145.02 145.02 145.02
Celana Dlm Wanita 103.23 103.23 103.23 103.23 103.23 103.23 103.23 103.23 103.23 103.23 103.23 103.23
Celana Panjang Jeans 131.03 131.03 131.03 131.03 131.03 131.03 131.03 131.03 131.03 131.03 131.03 131.03

PENDAPATAN REGIONAL, INFLASI, NTP
408 SULAWESI BARAT DALAM ANGKA 2010
Lanjutan Tabel / Table Continued 9.7.1
Kelompok/sub Kelompok
Jan Feb Mar April Mei Juni Juli Agust. Sept. Okt. Nov. Des. Jenis Barang Dan Jasa
[1] [2] [3] [4] [5] [6] [7] [8] [9] [10] [11] [12] [13]
Daster 154.55 154.55 154.55 154.55 154.55 154.55 154.55 154.55 154.55 154.55 154.55 154.55
Kaos Kaki 100.00 100.00 100.00 100.00 100.00 100.00 100.00 100.00 100.00 100.00 100.00 100.00
Kemeja Pendek 124.44 124.44 124.44 124.44 126.66 126.66 126.66 126.66 126.66 126.66 126.66 126.66
Mukena 114.50 116.40 116.40 116.40 116.40 116.40 116.40 116.40 116.40 116.40 116.40 116.40
Pembalut Wanita 109.41 109.41 109.41 109.41 109.41 109.41 109.41 109.41 109.41 109.41 109.41 109.41
Sandal Kulit 110.57 110.57 110.57 110.57 110.57 110.57 110.57 110.57 110.57 110.57 110.57 110.57
Sepatu 110.82 110.82 110.82 110.82 110.82 110.82 110.82 110.82 110.82 110.82 110.82 110.82
Seragam Sekolah Wnt 102.75 102.75 102.75 102.75 102.75 102.75 115.16 115.16 115.16 115.16 115.16 115.16
Sandang Anak-Anak 98.93 99.06 99.21 99.21 99.27 99.27 100.37 100.37 100.90 100.66 100.66 100.66
Baju Kaos/T-Shirt 100.00 100.00 100.00 100.00 100.00 100.00 100.00 100.00 100.00 100.00 100.00 100.00
Celana Dalam Anak 92.73 95.17 95.17 95.17 95.17 95.17 95.17 95.17 95.17 95.17 95.17 95.17
Celana Panjang Jeans 86.54 87.85 87.85 87.85 87.85 87.85 87.85 87.85 87.85 87.85 87.85 87.85
Celana Pendek 102.07 102.07 102.07 102.07 102.07 102.07 102.07 102.07 102.07 102.07 102.07 102.07
Kaos Oblong 105.88 105.88 110.29 110.29 110.29 110.29 110.29 110.29 110.29 110.29 110.29 110.29
Kemeja Pendek 103.10 103.10 103.10 103.10 103.10 103.10 103.10 103.10 103.10 103.10 103.10 103.10
Pakaian Bayi 106.93 106.93 106.93 106.93 106.93 106.93 110.50 110.50 110.50 110.50 110.50 110.50
Sandal 106.86 106.86 106.86 106.86 106.86 106.86 106.86 106.86 106.86 106.86 106.86 106.86
Sepatu 85.15 85.15 85.15 85.15 85.57 85.57 85.57 85.57 85.57 85.57 85.57 85.57
Seragam Sekolah Anak 110.13 110.13 110.13 110.13 110.13 110.13 121.40 121.40 121.40 121.40 121.40 121.40
Baju Muslim 106.60 106.60 106.60 106.60 106.60 106.60 106.60 106.60 119.92 119.92 119.92 119.92
Pampers 103.22 102.88 102.88 102.88 102.88 102.88 102.88 102.88 104.44 101.27 101.27 101.27

REGIONAL INCOME, INFLATION, NTP
SULAWESI BARAT IN FIGURES 2010 409
Lanjutan Tabel / Table Continued 9.7.1
Kelompok/sub Kelompok Jan Feb Mar April Mei Juni Juli Agust. Sept. Okt. Nov. Des.
Jenis Barang Dan Jasa
[1] [2] [3] [4] [5] [6] [7] [8] [9] [10] [11] [12] [13]
Barang Pribadi Dan
Sandang Lain 128.57 142.35 139.97 135.93 127.95 127.07 125.84 125.38 126.64 127.09 132.90 138.28
Emas Perhiasan 142.84 165.23 160.90 154.03 140.29 138.58 136.19 135.41 137.49 137.94 144.65 153.77
Handuk 116.03 116.03 116.03 116.03 116.03 116.03 121.83 121.83 121.83 121.83 121.83 121.83
Jam Tangan 113.33 113.33 113.33 113.33 113.33 113.33 113.33 113.33 113.33 113.33 113.33 113.33
Ongkos Jahit 108.33 114.20 114.20 114.20 114.20 115.42 115.42 115.42 115.42 117.16 117.16 117.16
Tas Tangan Wanita 117.58 117.58 119.39 119.39 119.39 119.39 119.39 119.39 120.41 120.41 120.41 120.41
Kerundung/Jilbab 108.00 108.00 108.00 108.00 108.00 108.00 108.00 108.00 108.00 108.00 108.00 108.00
Tas 100.00 100.00 100.95 100.95 101.96 101.96 101.96 101.96 101.96 101.96 119.34 119.34
Kesehatan 107.30 108.53 108.66 108.66 108.66 108.75 109.56 110.31 110.42 109.96 109.94 110.02
Jasa kesehatan 100.00 100.00 100.00 100.00 100.00 100.00 100.00 100.00 100.00 100.00 100.00 100.00
Dokter Spesialis 100.00 100.00 100.00 100.00 100.00 100.00 100.00 100.00 100.00 100.00 100.00 100.00
Dokter Umum 100.00 100.00 100.00 100.00 100.00 100.00 100.00 100.00 100.00 100.00 100.00 100.00
Tarip Rumah Sakit 100.00 100.00 100.00 100.00 100.00 100.00 100.00 100.00 100.00 100.00 100.00 100.00
Ongkos Bidan 100.00 100.00 100.00 100.00 100.00 100.00 100.00 100.00 100.00 100.00 100.00 100.00
Obat-Obatan 104.46 107.71 107.71 107.71 107.71 108.11 108.71 108.78 108.78 108.78 108.78 108.78
Jamu 100.00 100.00 100.00 100.00 100.00 111.11 120.37 120.37 120.37 120.37 120.37 120.37
Obat Dengan Resep 100.00 106.06 106.06 106.06 106.06 106.06 106.06 106.18 106.18 106.18 106.18 106.18
Obat Batuk 133.33 133.33 133.33 133.33 133.33 133.33 136.93 136.93 136.93 136.93 136.93 136.93
Obat Sakit Kepala 125.00 125.00 125.00 125.00 125.00 125.00 125.00 125.00 125.00 125.00 125.00 125.00
Obat Flu 100.00 100.00 100.00 100.00 100.00 100.00 101.76 101.76 101.76 101.76 101.76 101.76
Obat Gosok 100.00 100.00 100.00 100.00 100.00 100.00 97.50 97.50 97.50 97.50 97.50 97.50
Vitamin 100.00 100.00 100.00 100.00 100.00 100.00 105.60 105.60 105.60 105.60 105.60 105.60

PENDAPATAN REGIONAL, INFLASI, NTP
410 SULAWESI BARAT DALAM ANGKA 2010
Lanjutan Tabel / Table Continued 9.7.1
Kelompok/sub Kelompok
Jan Feb Mar April Mei Juni Juli Agust. Sept. Okt. Nov. Des. Jenis Barang Dan Jasa
[1] [2] [3] [4] [5] [6] [7] [8] [9] [10] [11] [12] [13]
Jasa Perawatan Jasmani 105.52 105.52 105.52 105.52 105.52 105.52 105.52 115.51 115.51 115.51 115.51 115.51
Creambath 114.29 114.29 114.29 114.29 114.29 114.29 114.29 114.29 114.29 114.29 114.29 114.29
Keriting/Meluruskan
Rambut 102.56 102.56 102.56 102.56 102.56 102.56 102.56 113.67 113.67 113.67 113.67 113.67
Tarip Gunting Rambut
Pria 100.00 100.00 100.00 100.00 100.00 100.00 100.00 100.00 100.00 100.00 100.00 100.00
Tarip Gunting Rambut
Wnt 115.91 115.91 115.91 115.91 115.91 115.91 115.91 140.97 140.97 140.97 140.97 140.97
Tarip Gunting Rambut
Anak 100.00 100.00 100.00 100.00 100.00 100.00 100.00 108.32 108.32 108.32 108.32 108.32
Perawatan Jasmani Dan
Kosmetika 111.23 112.30 112.55 112.55 112.55 112.55 113.85 113.85 114.06 113.22 113.16 113.33
Bedak 100.00 98.33 98.33 98.33 98.33 98.33 106.53 106.53 106.53 106.53 106.53 106.53
Deodorant 121.91 121.91 121.91 121.91 121.91 121.91 121.91 121.91 121.91 114.30 114.30 121.93
Hand body lotion 100.00 106.67 106.67 106.67 106.67 106.67 106.67 106.67 106.67 114.51 114.51 114.51
Lipstik 100.00 100.00 102.45 102.45 102.45 102.45 102.45 102.45 102.45 102.45 102.45 102.45
Minyak rambut 120.21 120.21 121.98 121.98 121.98 121.98 121.98 121.98 128.08 128.08 128.08 128.08
Parfum 103.85 105.08 105.69 105.69 105.69 105.69 105.69 105.69 105.69 105.69 105.69 105.69
Pelembab 118.95 118.95 118.95 118.95 118.95 118.95 118.95 118.95 118.95 117.53 117.53 117.53
Pasta gigi 118.83 118.83 118.83 118.83 118.83 118.83 118.83 118.83 118.83 118.83 118.83 118.83
Sabun mandi cair 134.71 126.38 126.38 126.38 126.38 126.38 122.15 122.15 123.68 112.38 112.38 112.38
Sabun mandi 128.57 135.18 135.18 135.18 135.18 135.18 135.18 135.18 135.18 135.18 134.83 134.83
Shampo 107.14 107.14 107.14 107.14 107.14 107.14 107.14 107.14 107.14 102.49 102.49 102.49
Sikat gigi 100.00 100.00 102.93 102.93 102.93 102.93 102.93 102.93 102.93 102.93 102.93 102.93
Pendidikan, rekreasi dan
olah raga 101.69 101.43 102.04 102.73 102.74 102.93 103.25 104.48 105.07 105.15 105.29 105.30
Pendidikan 100.90 100.90 100.90 100.90 100.90 100.90 100.90 100.90 100.90 100.90 100.90 100.90
Taman Kanak-Kanak 100.00 100.00 100.00 100.00 100.00 100.00 100.00 100.00 100.00 100.00 100.00 100.00

REGIONAL INCOME, INFLATION, NTP
SULAWESI BARAT IN FIGURES 2010 411
Lanjutan Tabel / Table Continued 9.7.1
Kelompok/sub Kelompok
Jan Feb Mar April Mei Juni Juli Agust. Sept. Okt. Nov. Des. Jenis Barang Dan Jasa
[1] [2] [3] [4] [5] [6] [7] [8] [9] [10] [11] [12] [13]
Sekolah Dasar 110.63 110.63 110.63 110.63 110.63 110.63 110.63 110.63 110.63 110.63 110.63 110.63
SLTP 110.63 110.63 110.63 110.63 110.63 110.63 110.63 110.63 110.63 110.63 110.63 110.63
SLTA 100.00 100.00 100.00 100.00 100.00 100.00 100.00 100.00 100.00 100.00 100.00 100.00
Akademi/Perguruan
Tinggi 100.00 100.00 100.00 100.00 100.00 100.00 100.00 100.00 100.00 100.00 100.00 100.00
Kursus-Kursus / Pelatihan 100.00 100.00 100.00 100.00 100.00 100.00 102.43 102.69 102.69 102.69 102.69 102.69
Bimbingan Belajar 100.00 100.00 100.00 100.00 100.00 100.00 107.13 107.13 107.13 107.13 107.13 107.13
Kursus Bahasa Asing 100.00 100.00 100.00 100.00 100.00 100.00 100.00 100.00 100.00 100.00 100.00 100.00
Kursus Komputer 100.00 100.00 100.00 100.00 100.00 100.00 100.00 100.74 100.74 100.74 100.74 100.74
Perlengkapan / Peralatan
Pendidikan 102.51 105.41 105.60 108.02 108.02 108.71 109.35 109.33 110.22 110.20 110.19 110.19
Personal
Komputer/Desktop 99.55 110.11 110.11 111.42 111.42 111.42 109.32 110.63 110.24 109.84 109.84 109.84
Biaya Foto Copy 100.00 100.00 100.00 100.00 100.00 100.00 100.00 100.00 100.00 100.00 100.00 100.00
Buku Tulis Bergaris 105.13 105.98 106.82 115.15 115.15 115.15 121.54 121.54 121.54 121.54 121.54 121.54
Kertas HVS 102.34 100.21 101.64 101.64 101.64 101.64 101.96 101.96 101.96 101.96 101.49 101.49
Pensil Hitam 100.00 97.22 97.22 119.53 119.53 119.53 128.05 128.05 138.72 138.72 138.72 138.72
Pulpen/Bollpoint 133.33 123.87 123.87 120.00 120.00 120.00 124.00 124.00 124.00 124.00 124.00 124.00
Tas Sekolah 100.00 100.00 100.00 100.00 100.00 100.00 102.86 102.86 103.32 103.32 103.32 103.32
Buku Pelajaran SD 100.00 100.00 100.00 100.00 100.00 100.00 100.00 100.00 100.00 100.00 100.00 100.00
Buku Pelajaran SMP 100.00 100.00 100.00 100.00 100.00 100.00 100.00 100.00 113.75 113.75 113.75 113.75
Buku Pelajaran SMA 100.00 100.00 100.00 100.00 100.00 100.00 100.00 100.00 109.76 109.76 109.76 109.76
Buku Pelajaran
Akademi/Universitas 100.00 108.70 108.70 108.70 108.70 108.70 108.70 108.70 108.70 108.70 108.70 108.70
Printer Laser 98.36 91.80 91.80 91.80 91.80 101.64 93.44 86.88 86.88 88.52 88.52 88.52

PENDAPATAN REGIONAL, INFLASI, NTP
412 SULAWESI BARAT DALAM ANGKA 2010
Lanjutan Tabel / Table Continued 9.7.1
Kelompok/sub Kelompok Jan Feb Mar April Mei Juni Juli Agust. Sept. Okt. Nov. Des.
Jenis Barang Dan Jasa
[1] [2] [3] [4] [5] [6] [7] [8] [9] [10] [11] [12] [13]
Rekreasi 101.83 99.56 101.12 101.71 101.71 101.86 102.20 105.52 106.55 106.68 107.06 107.05
CD-Tape-Rec-Radio 100.72 102.40 104.20 105.70 105.70 105.70 105.70 108.79 107.29 107.29 107.29 106.87
Televisi Berwarna 106.41 100.95 104.74 106.10 106.10 106.52 106.52 115.26 118.33 118.33 118.33 118.33
VCD / DVD Player 97.23 94.53 96.78 96.78 96.78 96.78 96.78 96.78 96.78 96.78 96.78 96.78
Playstation 84.67 87.67 87.67 87.87 87.87 87.87 87.87 88.27 87.95 87.95 87.95 87.95
Surat Kabar Harian 100.00 100.00 100.00 100.00 100.00 100.00 100.00 100.00 100.00 100.00 100.00 100.00
Sepeda Anak 120.00 120.00 120.00 120.00 120.00 120.00 129.79 129.79 129.79 132.25 132.25 132.25
Cuci/Cetak Film 97.47 97.47 97.47 97.47 97.47 97.47 97.47 97.47 97.47 97.47 113.65 113.65
Flash Disk 100.00 77.55 75.51 75.51 75.51 75.51 75.51 78.57 78.57 78.57 78.57 78.57
Biaya Jaringan Saluran
TV 100.00 100.00 100.00 100.00 100.00 100.00 100.00 100.00 100.00 100.00 100.00 100.00
Majalah Dewasa 111.08 111.08 112.72 114.75 114.75 114.75 110.37 110.37 110.37 111.44 111.44 111.44
Olahraga 104.80 104.80 104.80 104.84 105.09 105.09 105.30 105.71 106.79 107.60 107.60 108.03
Bola 107.41 107.41 107.41 107.68 109.23 109.23 109.23 109.23 116.06 118.57 118.57 119.79
Raket 102.30 102.30 102.30 102.30 102.30 102.30 102.30 102.30 102.30 102.30 102.30 103.43
Pakaian olah raga pria 110.72 110.72 110.72 110.72 110.72 110.72 110.72 110.72 110.72 110.72 110.72 110.72
Sepatu olah raga pria 100.00 100.00 100.00 100.00 100.00 100.00 100.62 101.87 101.87 103.09 103.09 103.09
Transpor,Komunikasi Dan
Jasa Keuangan 105.14 104.96 105.60 105.83 105.79 105.16 105.16 105.19 105.57 105.50 105.51 105.68
Transpor 108.00 107.94 108.05 108.30 108.24 108.24 108.24 108.28 108.68 108.34 108.34 108.51
Angkutan Sungai,
Danau & Penyebrangan 113.87 113.87 113.87 113.87 113.87 113.87 113.87 113.87 113.87 113.87 113.87 113.87
Angkutan Antar Kota 101.49 99.80 99.80 99.80 99.80 99.80 99.80 99.80 102.46 99.80 99.80 99.80
Angkutan Dalam Kota 100.00 100.00 100.00 100.00 100.00 100.00 100.00 100.00 100.00 100.00 100.00 100.00
Angkutan Udara 143.29 143.29 143.29 143.29 143.29 143.29 143.29 143.29 143.29 143.29 143.29 143.29

REGIONAL INCOME, INFLATION, NTP
SULAWESI BARAT IN FIGURES 2010 413
Lanjutan Tabel / Table Continued 9.7.1
Kelompok/sub Kelompok Jan Feb Mar April Mei Juni Juli Agust. Sept. Okt. Nov. Des.
Jenis Barang Dan Jasa
[1] [2] [3] [4] [5] [6] [7] [8] [9] [10] [11] [12] [13]
Bahan Pelumas/Oli 134.24 135.09 135.09 136.06 136.06 136.06 136.06 131.32 132.34 132.34 132.34 132.34
Bensin 105.02 100.00 100.00 100.00 100.00 100.00 100.00 100.00 100.00 100.00 100.00 100.00
Kendaraan Carter 94.02 92.14 92.14 92.14 92.14 92.14 92.14 92.14 94.44 94.44 94.44 94.44
Mobil 108.28 113.78 113.78 114.48 114.48 114.48 114.48 115.09 115.09 115.09 115.09 115.09
Sepeda Motor 105.07 105.07 105.44 105.67 105.45 105.45 105.45 105.45 105.45 105.45 105.45 106.07
Solar 107.76 104.62 104.62 104.62 104.62 104.62 104.62 104.62 104.62 104.62 104.62 104.62
Tarip Sewa Becak 116.67 116.67 116.67 116.67 116.67 116.67 116.67 116.67 116.67 116.67 116.67 116.67
Komunikasi Dan
Pengiriman 97.35 96.81 99.13 99.20 99.20 96.65 96.65 96.65 96.65 97.22 97.22 97.44
Biaya Kirim Surat 100.00 100.00 100.00 100.00 100.00 100.00 100.00 100.00 100.00 100.00 100.00 100.00
Biaya Pengiriman
Barang 139.13 139.13 139.13 139.13 139.13 139.13 139.13 139.13 139.13 139.13 139.13 139.13
Tarip Telepon 100.00 100.00 100.00 100.00 100.00 100.00 100.00 100.00 100.00 100.00 100.00 100.00
Tarip Pulsa Ponsel 98.52 98.52 98.52 98.52 98.52 98.52 98.52 98.52 98.52 98.52 98.52 98.52
Telepon Seluler 94.20 92.84 98.73 98.90 98.90 92.43 92.43 92.43 92.43 93.88 93.88 94.43
Sarana Dan Penunjang
Transpor 104.31 104.10 104.16 104.85 104.77 104.77 104.77 104.77 106.37 106.83 106.91 106.96
Ban Dalam Mobil 120.34 121.65 121.65 121.65 118.76 118.76 118.76 118.76 118.76 124.76 124.76 124.76
Ban Dalam Motor 102.63 100.07 100.07 102.70 102.70 102.70 102.70 102.70 102.70 102.70 102.70 102.70
Ban Luar Mobil 105.72 103.03 103.03 103.95 103.95 103.95 103.95 103.95 105.94 106.93 109.93 110.33
Ban Luar Motor 111.08 111.08 111.08 113.52 113.52 113.52 113.52 113.52 113.52 113.52 107.88 107.88
Helm 100.70 100.70 100.70 102.72 102.72 102.72 102.72 102.72 102.72 102.72 102.72 102.72
Busi 103.34 100.11 100.11 100.11 100.11 100.11 100.11 100.11 100.11 100.11 116.79 116.79
Pemeliharaan/Service 100.00 100.00 100.00 100.00 100.00 100.00 100.00 100.00 100.00 100.00 100.00 100.00
Perbaikan Ringan
Kendaraan 100.00 100.00 100.00 100.00 100.00 100.00 100.00 100.00 101.59 101.59 101.59 101.59
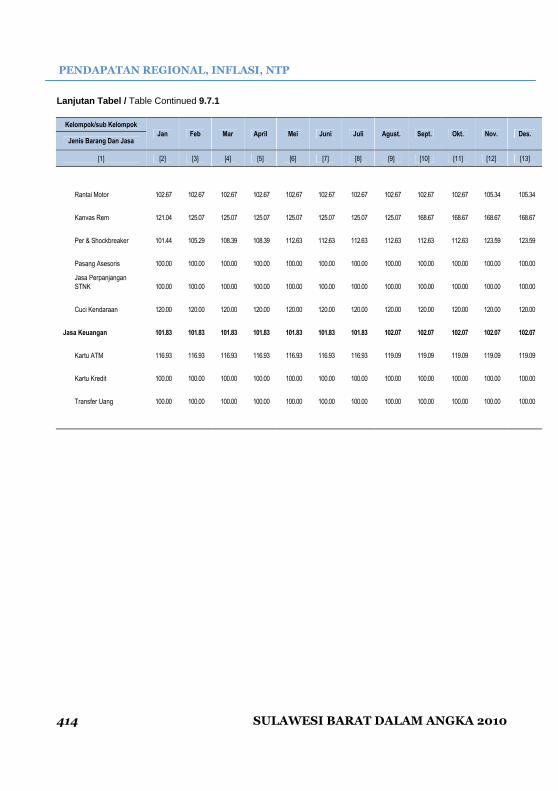
PENDAPATAN REGIONAL, INFLASI, NTP
414 SULAWESI BARAT DALAM ANGKA 2010
Lanjutan Tabel / Table Continued 9.7.1
Kelompok/sub Kelompok
Jan Feb Mar April Mei Juni Juli Agust. Sept. Okt. Nov. Des. Jenis Barang Dan Jasa
[1] [2] [3] [4] [5] [6] [7] [8] [9] [10] [11] [12] [13]
Rantai Motor 102.67 102.67 102.67 102.67 102.67 102.67 102.67 102.67 102.67 102.67 105.34 105.34
Kanvas Rem 121.04 125.07 125.07 125.07 125.07 125.07 125.07 125.07 168.67 168.67 168.67 168.67
Per & Shockbreaker 101.44 105.29 108.39 108.39 112.63 112.63 112.63 112.63 112.63 112.63 123.59 123.59
Pasang Asesoris 100.00 100.00 100.00 100.00 100.00 100.00 100.00 100.00 100.00 100.00 100.00 100.00
Jasa Perpanjangan
STNK 100.00 100.00 100.00 100.00 100.00 100.00 100.00 100.00 100.00 100.00 100.00 100.00
Cuci Kendaraan 120.00 120.00 120.00 120.00 120.00 120.00 120.00 120.00 120.00 120.00 120.00 120.00
Jasa Keuangan 101.83 101.83 101.83 101.83 101.83 101.83 101.83 102.07 102.07 102.07 102.07 102.07
Kartu ATM 116.93 116.93 116.93 116.93 116.93 116.93 116.93 119.09 119.09 119.09 119.09 119.09
Kartu Kredit 100.00 100.00 100.00 100.00 100.00 100.00 100.00 100.00 100.00 100.00 100.00 100.00
Transfer Uang 100.00 100.00 100.00 100.00 100.00 100.00 100.00 100.00 100.00 100.00 100.00 100.00
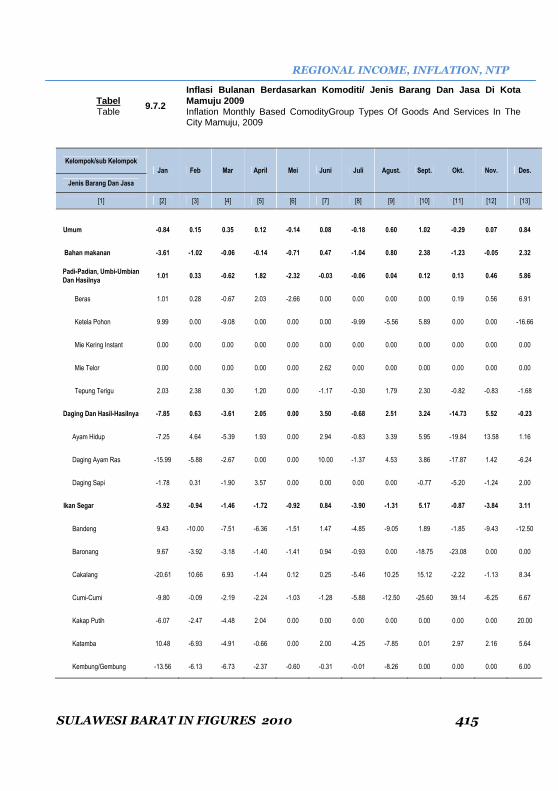
REGIONAL INCOME, INFLATION, NTP
SULAWESI BARAT IN FIGURES 2010 415
Tabel 9.7.2
Inflasi Bulanan Berdasarkan Komoditi/ Jenis Barang Dan Jasa Di Kota Mamuju 2009
Table Inflation Monthly Based ComodityGroup Types Of Goods And Services In The City Mamuju, 2009
Kelompok/sub Kelompok
Jan Feb Mar April Mei Juni Juli Agust. Sept. Okt. Nov. Des.
Jenis Barang Dan Jasa
[1] [2] [3] [4] [5] [6] [7] [8] [9] [10] [11] [12] [13]
Umum -0.84 0.15 0.35 0.12 -0.14 0.08 -0.18 0.60 1.02 -0.29 0.07 0.84
Bahan makanan -3.61 -1.02 -0.06 -0.14 -0.71 0.47 -1.04 0.80 2.38 -1.23 -0.05 2.32
Padi-Padian, Umbi-Umbian
Dan Hasilnya 1.01 0.33 -0.62 1.82 -2.32 -0.03 -0.06 0.04 0.12 0.13 0.46 5.86
Beras 1.01 0.28 -0.67 2.03 -2.66 0.00 0.00 0.00 0.00 0.19 0.56 6.91
Ketela Pohon 9.99 0.00 -9.08 0.00 0.00 0.00 -9.99 -5.56 5.89 0.00 0.00 -16.66
Mie Kering Instant 0.00 0.00 0.00 0.00 0.00 0.00 0.00 0.00 0.00 0.00 0.00 0.00
Mie Telor 0.00 0.00 0.00 0.00 0.00 2.62 0.00 0.00 0.00 0.00 0.00 0.00
Tepung Terigu 2.03 2.38 0.30 1.20 0.00 -1.17 -0.30 1.79 2.30 -0.82 -0.83 -1.68
Daging Dan Hasil-Hasilnya -7.85 0.63 -3.61 2.05 0.00 3.50 -0.68 2.51 3.24 -14.73 5.52 -0.23
Ayam Hidup -7.25 4.64 -5.39 1.93 0.00 2.94 -0.83 3.39 5.95 -19.84 13.58 1.16
Daging Ayam Ras -15.99 -5.88 -2.67 0.00 0.00 10.00 -1.37 4.53 3.86 -17.87 1.42 -6.24
Daging Sapi -1.78 0.31 -1.90 3.57 0.00 0.00 0.00 0.00 -0.77 -5.20 -1.24 2.00
Ikan Segar -5.92 -0.94 -1.46 -1.72 -0.92 0.84 -3.90 -1.31 5.17 -0.87 -3.84 3.11
Bandeng 9.43 -10.00 -7.51 -6.36 -1.51 1.47 -4.85 -9.05 1.89 -1.85 -9.43 -12.50
Baronang 9.67 -3.92 -3.18 -1.40 -1.41 0.94 -0.93 0.00 -18.75 -23.08 0.00 0.00
Cakalang -20.61 10.66 6.93 -1.44 0.12 0.25 -5.46 10.25 15.12 -2.22 -1.13 8.34
Cumi-Cumi -9.80 -0.09 -2.19 -2.24 -1.03 -1.28 -5.88 -12.50 -25.60 39.14 -6.25 6.67
Kakap Putih -6.07 -2.47 -4.48 2.04 0.00 0.00 0.00 0.00 0.00 0.00 0.00 20.00
Katamba 10.48 -6.93 -4.91 -0.66 0.00 2.00 -4.25 -7.85 0.01 2.97 2.16 5.64
Kembung/Gembung -13.56 -6.13 -6.73 -2.37 -0.60 -0.31 -0.01 -8.26 0.00 0.00 0.00 6.00

PENDAPATAN REGIONAL, INFLASI, NTP
416 SULAWESI BARAT DALAM ANGKA 2010
Lanjutan Tabel / Table Continued 9.7.2
Kelompok/sub Kelompok Jan Feb Mar April Mei Juni Juli Agust. Sept. Okt. Nov. Des.
Jenis Barang Dan Jasa
[1] [2] [3] [4] [5] [6] [7] [8] [9] [10] [11] [12] [13]
Layang -3.27 0.34 -0.71 3.46 -0.67 1.00 -2.77 1.49 -1.67 2.04 -6.00 8.51
Merah -33.99 5.00 -0.48 -7.04 -0.08 1.43 17.19 0.00 -2.00 2.04 0.00 6.00
Teri 0.57 0.71 -3.93 -5.36 -2.44 2.50 -4.45 -10.47 -14.28 -9.09 0.00 0.00
Tongkol -28.80 5.69 -0.31 3.85 -1.93 -0.76 0.00 -8.40 0.00 0.00 0.00 10.00
Udang Basah -3.86 9.58 1.62 -7.47 -3.89 0.94 -6.08 12.48 46.72 -8.10 -8.28 -2.92
Ikan Diawetkan 15.24 0.07 9.56 4.95 -1.33 -0.04 -11.62 -24.82 1.64 6.49 18.21 5.09
Ikan Asin Belah 28.74 -0.51 9.90 4.94 -4.17 0.00 -12.55 -26.73 0.00 -1.78 25.00 0.00
Ikan Dalam Kaleng 0.00 1.73 0.00 0.00 0.00 0.00 0.00 0.00 0.00 0.00 0.00 0.00
Teri 3.44 1.60 14.19 8.25 2.94 0.00 -14.28 -33.33 0.00 27.50 19.61 14.76
Ikan Terbang 1.54 -4.66 -0.74 -5.67 -0.32 -0.80 -4.00 0.00 22.92 -5.20 0.00 0.00
Telur, Susu Dan Hasil-
Hasilnya -1.85 -4.11 2.26 1.58 -3.19 -1.66 2.28 2.43 1.56 -3.33 -0.99 2.03
Susu bubuk -0.66 0.61 1.35 1.32 0.48 -1.57 -0.41 -0.37 1.66 0.10 -0.68 1.65
Susu kental manis 0.00 1.92 0.98 1.16 0.28 -3.37 0.00 1.16 3.40 0.00 -0.93 -0.82
Susu untuk balita -0.87 0.23 0.32 0.00 0.00 0.85 0.00 0.00 0.00 -1.96 -0.81 0.30
Susu untuk bayi 0.00 -20.98 0.00 1.70 0.00 -0.30 0.55 0.09 0.26 -1.03 -0.36 -0.16
Telur ayam kampung 9.52 -2.43 2.22 3.89 0.00 0.00 4.43 1.41 0.00 0.00 0.00 -3.99
Telur ayam ras -5.00 -5.76 5.51 3.48 -11.11 -2.50 7.37 7.46 0.00 -9.26 -2.04 8.34
Telur itik -9.92 0.00 6.77 -6.72 -5.93 -2.69 11.12 3.11 18.09 -12.01 0.00 -9.47
Susu cair kemasan 0.00 0.00 0.00 1.23 0.00 0.00 0.00 2.38 0.00 0.00 0.00 0.00
Sayur-sayuran -1.73 -1.24 0.10 -6.51 4.55 3.18 -3.13 0.15 13.29 0.93 0.35 -2.22
Bayam 15.06 -2.25 -10.71 -7.72 9.91 4.50 3.64 -2.09 16.00 -3.45 0.00 0.00
Daun Kacang Panjang
Muda -1.65 -9.11 -0.62 -6.82 11.66 8.06 -0.55 -2.79 37.15 0.00 -6.25 -23.34

REGIONAL INCOME, INFLATION, NTP
SULAWESI BARAT IN FIGURES 2010 417
Lanjutan Tabel / Table Continued 9.7.2
Kelompok/sub Kelompok Jan Feb Mar April Mei Juni Juli Agust. Sept. Okt. Nov. Des.
Jenis Barang Dan Jasa
[1] [2] [3] [4] [5] [6] [7] [8] [9] [10] [11] [12] [13]
Daun Singkong -6.76 38.60 -10.66 -10.61 10.47 4.30 6.62 16.66 -0.33 0.00 0.00 10.00
Jagung Muda 7.74 19.70 3.26 -4.72 4.34 10.90 1.79 25.25 5.74 3.31 0.00 0.00
Kacang Panjang -22.70 -16.24 0.01 -5.39 10.23 8.05 4.54 45.64 11.94 8.00 0.00 -9.26
Kangkung -13.54 -1.72 3.11 0.01 0.00 0.00 3.99 5.55 12.96 -2.17 -0.41 -12.50
Kentang 6.25 -5.88 2.08 -2.04 6.25 -1.96 -6.00 2.13 3.13 5.40 20.01 51.67
Ketimun -7.32 4.95 0.00 -10.82 1.17 2.72 3.40 -1.47 11.11 0.00 -8.00 -10.87
Kol Putih/Kubis 3.29 27.58 2.95 -31.43 6.25 5.88 -11.11 -6.25 6.67 0.00 6.25 5.89
Labu
Parang/Manis/Merah 16.32 -1.20 14.07 -10.63 9.51 2.61 1.70 0.00 12.50 -11.11 -31.25 0.00
Nangka Muda -1.53 36.90 3.99 -26.25 -3.20 -0.83 -1.25 1.25 6.25 5.88 -4.45 -18.60
Sawi Hijau -4.76 -13.65 -8.60 -4.52 2.16 4.50 13.92 6.67 2.09 -2.05 -6.25 -10.00
Terong Panjang -20.63 5.46 5.72 1.35 -1.33 0.01 -2.03 -27.59 -7.14 7.69 -5.00 0.76
Tomat Sayur 2.07 -10.64 9.08 3.51 -1.26 0.00 -23.28 -50.24 34.15 -0.62 5.00 2.38
Wortel 6.55 -15.79 0.00 0.00 9.37 -1.90 -2.93 -4.00 4.69 1.49 17.65 23.33
Kacang - kacangan 2.17 0.26 2.96 1.84 1.98 -2.27 1.16 -2.47 -3.83 -2.56 0.19 1.32
Kacang hijau 0.00 0.00 20.00 19.44 13.95 -14.28 7.14 -13.33 -7.69 0.00 0.00 0.00
Kacang tanah 9.72 1.26 4.17 -2.40 0.00 0.00 0.82 -2.44 -13.75 -13.94 1.16 8.05
Tahu mentah 0.00 0.00 0.00 0.00 0.00 0.00 0.00 0.00 0.00 0.00 0.00 0.00
Tempe 0.52 0.00 0.00 0.00 0.00 0.00 0.00 0.00 0.00 0.00 0.00 0.00
Buah - buahan -0.99 -1.03 -0.59 8.12 -2.44 0.77 2.19 4.28 -4.58 1.25 -0.76 -2.18
Apel 2.59 0.00 0.00 0.00 -1.26 4.54 1.79 0.00 0.00 11.72 0.00 -8.34
Jeruk 4.77 9.10 0.00 16.66 7.15 0.00 0.00 -6.68 7.13 0.00 -13.33 15.38
Pisang 0.00 2.23 0.00 4.44 0.00 0.66 0.00 13.20 -12.58 -3.34 4.17 -5.55
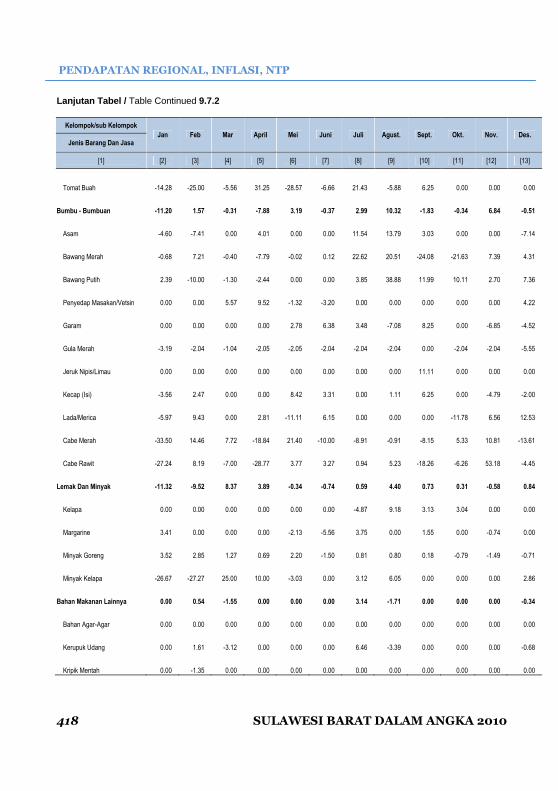
PENDAPATAN REGIONAL, INFLASI, NTP
418 SULAWESI BARAT DALAM ANGKA 2010
Lanjutan Tabel / Table Continued 9.7.2
Kelompok/sub Kelompok
Jan Feb Mar April Mei Juni Juli Agust. Sept. Okt. Nov. Des. Jenis Barang Dan Jasa
[1] [2] [3] [4] [5] [6] [7] [8] [9] [10] [11] [12] [13]
Tomat Buah -14.28 -25.00 -5.56 31.25 -28.57 -6.66 21.43 -5.88 6.25 0.00 0.00 0.00
Bumbu - Bumbuan -11.20 1.57 -0.31 -7.88 3.19 -0.37 2.99 10.32 -1.83 -0.34 6.84 -0.51
Asam -4.60 -7.41 0.00 4.01 0.00 0.00 11.54 13.79 3.03 0.00 0.00 -7.14
Bawang Merah -0.68 7.21 -0.40 -7.79 -0.02 0.12 22.62 20.51 -24.08 -21.63 7.39 4.31
Bawang Putih 2.39 -10.00 -1.30 -2.44 0.00 0.00 3.85 38.88 11.99 10.11 2.70 7.36
Penyedap Masakan/Vetsin 0.00 0.00 5.57 9.52 -1.32 -3.20 0.00 0.00 0.00 0.00 0.00 4.22
Garam 0.00 0.00 0.00 0.00 2.78 6.38 3.48 -7.08 8.25 0.00 -6.85 -4.52
Gula Merah -3.19 -2.04 -1.04 -2.05 -2.05 -2.04 -2.04 -2.04 0.00 -2.04 -2.04 -5.55
Jeruk Nipis/Limau 0.00 0.00 0.00 0.00 0.00 0.00 0.00 0.00 11.11 0.00 0.00 0.00
Kecap (Isi) -3.56 2.47 0.00 0.00 8.42 3.31 0.00 1.11 6.25 0.00 -4.79 -2.00
Lada/Merica -5.97 9.43 0.00 2.81 -11.11 6.15 0.00 0.00 0.00 -11.78 6.56 12.53
Cabe Merah -33.50 14.46 7.72 -18.84 21.40 -10.00 -8.91 -0.91 -8.15 5.33 10.81 -13.61
Cabe Rawit -27.24 8.19 -7.00 -28.77 3.77 3.27 0.94 5.23 -18.26 -6.26 53.18 -4.45
Lemak Dan Minyak -11.32 -9.52 8.37 3.89 -0.34 -0.74 0.59 4.40 0.73 0.31 -0.58 0.84
Kelapa 0.00 0.00 0.00 0.00 0.00 0.00 -4.87 9.18 3.13 3.04 0.00 0.00
Margarine 3.41 0.00 0.00 0.00 -2.13 -5.56 3.75 0.00 1.55 0.00 -0.74 0.00
Minyak Goreng 3.52 2.85 1.27 0.69 2.20 -1.50 0.81 0.80 0.18 -0.79 -1.49 -0.71
Minyak Kelapa -26.67 -27.27 25.00 10.00 -3.03 0.00 3.12 6.05 0.00 0.00 0.00 2.86
Bahan Makanan Lainnya 0.00 0.54 -1.55 0.00 0.00 0.00 3.14 -1.71 0.00 0.00 0.00 -0.34
Bahan Agar-Agar 0.00 0.00 0.00 0.00 0.00 0.00 0.00 0.00 0.00 0.00 0.00 0.00
Kerupuk Udang 0.00 1.61 -3.12 0.00 0.00 0.00 6.46 -3.39 0.00 0.00 0.00 -0.68
Kripik Mentah 0.00 -1.35 0.00 0.00 0.00 0.00 0.00 0.00 0.00 0.00 0.00 0.00

REGIONAL INCOME, INFLATION, NTP
SULAWESI BARAT IN FIGURES 2010 419
Lanjutan Tabel / Table Continued 9.7.2
Kelompok/sub Kelompok Jan Feb Mar April Mei Juni Juli Agust. Sept. Okt. Nov. Des.
Jenis Barang Dan Jasa
[1] [2] [3] [4] [5] [6] [7] [8] [9] [10] [11] [12] [13]
Makanan jadi, minuman,
rokok & tembakau 2.97 0.96 1.56 0.48 0.51 0.10 -0.02 1.02 0.67 0.28 -0.01 0.46
Makanan jadi 3.08 0.19 1.66 0.40 0.06 0.01 0.00 1.04 0.21 0.26 0.00 0.00
Ayam Goreng 6.25 0.00 0.00 0.00 0.00 0.00 0.00 0.00 0.00 0.00 0.00 0.00
Biskuit 0.00 0.00 0.00 0.00 0.00 0.00 0.00 0.00 0.00 0.00 0.00 0.00
Gado-Gado 0.00 0.00 0.00 0.00 0.00 0.00 0.00 0.00 0.00 0.00 0.00 0.00
Ikan Bakar 2.38 0.00 0.00 0.00 0.00 0.00 0.00 0.00 0.00 0.00 0.00 0.00
Kembang Gula 6.26 0.00 0.00 0.00 0.00 0.00 0.00 0.00 0.00 0.00 0.00 0.00
Kue Basah 25.00 0.00 34.31 0.00 0.00 0.00 0.00 0.00 0.00 0.00 0.00 0.00
Kue Kering Berminyak 0.00 0.00 0.00 0.00 0.00 0.00 0.00 0.00 0.00 0.00 0.00 0.00
Makanan Ringan/Snack 0.00 0.00 0.00 0.00 0.00 0.00 0.00 3.73 0.00 0.00 0.00 0.00
Martabak 11.87 2.83 0.00 0.00 0.00 0.00 0.00 0.00 0.00 0.00 0.00 0.00
Mie 0.00 0.00 0.00 3.57 0.00 0.00 0.00 0.00 0.00 0.00 0.00 0.00
Nasi 2.08 0.00 0.00 0.00 0.00 0.00 0.00 0.00 0.00 0.00 0.00 0.00
Roti Manis 0.00 0.00 0.00 0.00 0.00 0.00 0.00 7.69 0.00 1.19 0.00 0.00
Roti Tawar 0.00 0.00 0.00 0.00 0.00 0.87 0.00 3.04 0.00 3.42 0.00 0.00
Sate 4.17 1.93 0.00 0.00 0.00 0.00 0.00 0.00 0.00 5.55 0.00 0.00
Soto 2.17 0.00 0.00 0.00 0.00 0.00 0.00 0.00 0.00 0.00 0.00 0.00
Sop 8.05 1.00 0.00 0.00 0.00 0.00 0.00 0.00 0.00 0.00 0.00 0.00
Wafer 0.00 0.00 0.00 0.00 1.99 0.00 0.00 3.84 7.14 0.00 0.00 0.00
Minuman Yang Tidak
Beralkohol 0.92 3.36 0.17 0.68 3.14 0.61 -0.11 2.70 3.47 0.00 -0.09 1.55
Air Kemasan 3.84 0.00 0.00 0.00 0.00 0.00 0.00 0.00 0.00 0.00 0.00 0.00
Gula Pasir 0.00 9.90 0.00 2.01 7.74 1.34 -0.63 7.03 9.91 0.00 0.00 2.96

PENDAPATAN REGIONAL, INFLASI, NTP
420 SULAWESI BARAT DALAM ANGKA 2010
Lanjutan Tabel / Table Continued 9.7.2
Kelompok/sub Kelompok Jan Feb Mar April Mei Juni Juli Agust. Sept. Okt. Nov. Des.
Jenis Barang Dan Jasa
[1] [2] [3] [4] [5] [6] [7] [8] [9] [10] [11] [12] [13]
Ice Cream 0.00 0.00 0.00 0.00 11.43 1.85 0.00 3.14 1.67 0.00 0.00 6.35
Juice Buah 0.00 0.00 0.00 0.00 0.00 0.00 0.00 0.00 0.00 0.00 0.00 0.00
Kopi Bubuk 0.00 2.91 0.00 0.00 0.00 0.00 0.00 0.00 0.00 0.00 -0.78 0.00
Minuman Kesegaran 1.20 1.07 0.00 0.00 0.00 0.00 0.00 1.62 0.00 0.00 0.00 0.00
Sirop 1.51 0.00 -1.47 1.51 0.00 0.98 1.80 0.00 0.74 0.00 0.07 0.66
Teh 0.00 0.00 4.18 0.00 0.00 0.00 0.00 0.00 0.00 0.00 0.00 0.00
Tembakau Dan Minuman
Beralkohol 3.91 1.26 2.10 0.55 0.00 0.00 0.00 0.00 0.00 0.47 0.00 0.79
Bir 10.82 0.00 0.00 0.00 0.00 0.00 0.00 0.00 0.00 1.39 0.00 4.24
Rokok Kretek 2.78 4.70 1.78 0.00 0.00 0.00 0.00 0.00 0.00 2.89 0.00 1.19
Rokok Kretek Filter 5.86 0.91 2.86 0.94 0.00 0.00 0.00 0.00 0.00 0.00 0.00 0.00
Rokok Putih 0.00 0.00 0.57 0.00 0.00 0.00 0.00 0.00 0.00 0.00 0.00 2.35
Perumahan,air,listrik,gas
& bahan bakar -0.48 0.29 -0.14 0.19 0.18 0.20 -0.11 0.50 0.49 -0.01 0.05 0.22
Biaya tempat tinggal -0.21 0.06 -0.48 0.14 0.03 -0.07 -0.19 0.62 0.28 -0.02 0.19 0.34
Batu 0.00 8.00 0.00 0.00 0.00 0.00 0.00 0.00 0.00 0.00 0.00 0.00
Batu Bata/Batu Tela 0.00 3.19 0.00 0.00 0.00 0.00 0.00 0.00 0.00 0.00 0.00 0.00
Besi Beton -8.86 -4.76 -7.34 4.48 -0.15 1.61 -0.56 0.00 -3.82 0.59 -2.54 -10.43
Cat Kayu 0.00 2.94 1.42 0.00 -0.31 0.00 -0.56 0.00 0.00 0.00 0.00 0.00
Cat Tembok 0.00 4.23 0.00 0.84 -0.66 0.00 -2.08 0.00 0.33 0.00 0.68 0.83
Daun Pintu -0.35 0.00 0.81 0.00 0.00 0.00 0.00 0.00 0.00 0.00 -3.44 0.00
Kayu Balokan -0.15 0.00 -2.74 0.00 0.00 0.63 0.00 2.77 0.00 0.00 0.00 0.00
Kayu Lapis 0.00 -2.24 0.00 -2.37 -0.42 -0.84 0.00 0.00 0.00 0.00 1.22 0.10
Keramik 0.00 0.00 0.00 0.00 0.32 0.00 -0.67 0.00 0.00 0.00 0.00 0.00
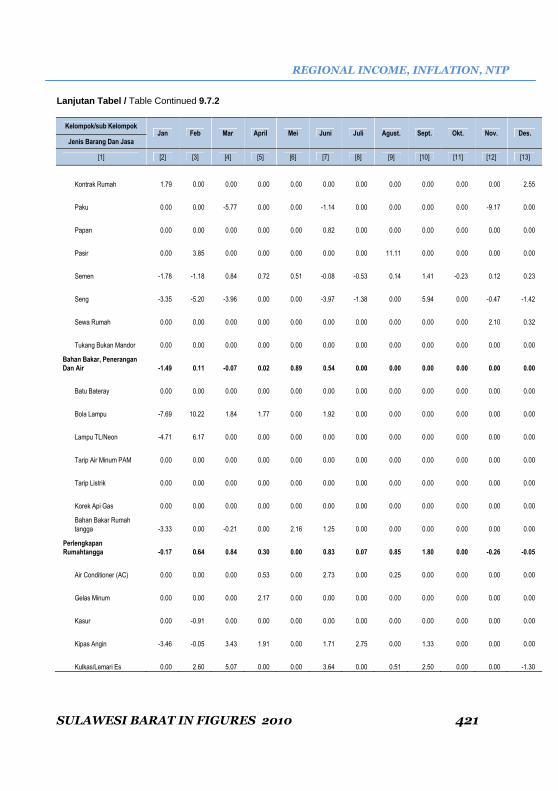
REGIONAL INCOME, INFLATION, NTP
SULAWESI BARAT IN FIGURES 2010 421
Lanjutan Tabel / Table Continued 9.7.2
Kelompok/sub Kelompok Jan Feb Mar April Mei Juni Juli Agust. Sept. Okt. Nov. Des.
Jenis Barang Dan Jasa
[1] [2] [3] [4] [5] [6] [7] [8] [9] [10] [11] [12] [13]
Kontrak Rumah 1.79 0.00 0.00 0.00 0.00 0.00 0.00 0.00 0.00 0.00 0.00 2.55
Paku 0.00 0.00 -5.77 0.00 0.00 -1.14 0.00 0.00 0.00 0.00 -9.17 0.00
Papan 0.00 0.00 0.00 0.00 0.00 0.82 0.00 0.00 0.00 0.00 0.00 0.00
Pasir 0.00 3.85 0.00 0.00 0.00 0.00 0.00 11.11 0.00 0.00 0.00 0.00
Semen -1.78 -1.18 0.84 0.72 0.51 -0.08 -0.53 0.14 1.41 -0.23 0.12 0.23
Seng -3.35 -5.20 -3.96 0.00 0.00 -3.97 -1.38 0.00 5.94 0.00 -0.47 -1.42
Sewa Rumah 0.00 0.00 0.00 0.00 0.00 0.00 0.00 0.00 0.00 0.00 2.10 0.32
Tukang Bukan Mandor 0.00 0.00 0.00 0.00 0.00 0.00 0.00 0.00 0.00 0.00 0.00 0.00
Bahan Bakar, Penerangan
Dan Air -1.49 0.11 -0.07 0.02 0.89 0.54 0.00 0.00 0.00 0.00 0.00 0.00
Batu Bateray 0.00 0.00 0.00 0.00 0.00 0.00 0.00 0.00 0.00 0.00 0.00 0.00
Bola Lampu -7.69 10.22 1.84 1.77 0.00 1.92 0.00 0.00 0.00 0.00 0.00 0.00
Lampu TL/Neon -4.71 6.17 0.00 0.00 0.00 0.00 0.00 0.00 0.00 0.00 0.00 0.00
Tarip Air Minum PAM 0.00 0.00 0.00 0.00 0.00 0.00 0.00 0.00 0.00 0.00 0.00 0.00
Tarip Listrik 0.00 0.00 0.00 0.00 0.00 0.00 0.00 0.00 0.00 0.00 0.00 0.00
Korek Api Gas 0.00 0.00 0.00 0.00 0.00 0.00 0.00 0.00 0.00 0.00 0.00 0.00
Bahan Bakar Rumah
tangga -3.33 0.00 -0.21 0.00 2.16 1.25 0.00 0.00 0.00 0.00 0.00 0.00
Perlengkapan
Rumahtangga -0.17 0.64 0.84 0.30 0.00 0.83 0.07 0.85 1.80 0.00 -0.26 -0.05
Air Conditioner (AC) 0.00 0.00 0.00 0.53 0.00 2.73 0.00 0.25 0.00 0.00 0.00 0.00
Gelas Minum 0.00 0.00 0.00 2.17 0.00 0.00 0.00 0.00 0.00 0.00 0.00 0.00
Kasur 0.00 -0.91 0.00 0.00 0.00 0.00 0.00 0.00 0.00 0.00 0.00 0.00
Kipas Angin -3.46 -0.05 3.43 1.91 0.00 1.71 2.75 0.00 1.33 0.00 0.00 0.00
Kulkas/Lemari Es 0.00 2.60 5.07 0.00 0.00 3.64 0.00 0.51 2.50 0.00 0.00 -1.30

PENDAPATAN REGIONAL, INFLASI, NTP
422 SULAWESI BARAT DALAM ANGKA 2010
Lanjutan Tabel / Table Continued 9.7.2
Kelompok/sub Kelompok
Jan Feb Mar April Mei Juni Juli Agust. Sept. Okt. Nov. Des. Jenis Barang Dan Jasa
[1] [2] [3] [4] [5] [6] [7] [8] [9] [10] [11] [12] [13]
Kursi 0.00 0.00 0.00 0.00 0.00 0.00 0.00 0.00 4.35 0.00 0.00 0.00
Lemari Pakaian 0.00 0.89 0.00 0.00 0.00 0.00 0.00 0.88 0.00 0.00 0.00 0.00
Meja Kursi Tamu -0.18 1.62 0.00 0.00 0.00 3.91 -2.46 0.22 1.49 0.00 0.00 0.00
Mesin Cuci 0.00 2.92 4.24 0.82 0.00 2.02 0.00 1.32 2.18 0.00 -2.07 0.00
Panci 0.00 -0.29 0.00 0.00 0.00 0.00 0.00 0.00 1.76 0.00 0.00 0.00
Piring 0.00 -0.88 0.00 0.00 0.00 0.00 0.00 0.00 3.53 0.00 0.00 0.00
Sprey 0.00 0.00 0.00 0.00 0.00 0.00 0.00 0.00 5.36 0.00 0.00 0.00
Tempat Tidur -1.17 0.00 0.00 0.00 0.00 0.00 0.00 8.00 0.00 0.00 0.00 0.00
Magic Com -1.29 1.51 0.79 -0.25 0.00 0.00 0.00 1.10 0.48 0.00 0.00 0.00
Kompor 0.00 1.32 0.84 0.54 0.00 0.96 2.50 0.00 0.78 0.00 0.00 0.00
Penyelenggaraan
Rumahtangga -0.69 1.79 0.09 0.73 -0.04 0.00 -0.12 -0.04 0.14 0.00 0.00 0.47
Pembasmi Nyamuk
Bakar 0.00 5.26 0.00 2.39 0.00 0.00 0.00 0.00 0.00 0.00 0.00 4.55
Pembasmi Nyamuk Cair -5.91 0.00 0.00 0.71 0.00 0.00 0.00 0.00 1.61 0.00 0.00 0.00
Pengharum
Cucian/Pelembut 0.00 0.00 0.00 0.00 0.00 0.00 0.00 0.00 0.00 0.00 0.00 0.00
Sabun Cair/Cuci Piring -0.56 -1.72 0.00 -0.58 -0.58 0.00 -0.60 -0.60 1.22 0.00 0.00 0.00
Sabun Cream Detergen 0.00 0.00 0.00 0.00 0.00 0.00 -0.23 0.00 0.00 0.00 0.00 0.00
Sabun Detergen Bubuk -1.10 2.44 0.24 1.43 0.00 0.00 0.00 0.00 0.00 0.00 0.00 0.00
Upah Pembantu RT 0.00 1.76 0.00 0.00 0.00 0.00 0.00 0.00 0.00 0.00 0.00 0.00
Jasa Pembuangan
Sampah 0.00 0.00 0.00 0.00 0.00 0.00 0.00 0.00 0.00 0.00 0.00 0.00
Sandang 0.70 3.03 -0.27 -0.70 -1.32 -0.18 1.40 0.25 1.13 0.05 1.15 1.05
Sandang laki-laki 0.47 0.53 0.65 0.39 0.90 0.00 0.88 1.01 1.42 0.00 0.00 0.00
Baju Kaos/T-Shirt 1.16 2.18 0.00 0.00 0.00 0.00 0.00 0.00 0.00 0.00 0.00 0.00

REGIONAL INCOME, INFLATION, NTP
SULAWESI BARAT IN FIGURES 2010 423
Lanjutan Tabel / Table Continued 9.7.2
Kelompok/sub Kelompok Jan Feb Mar April Mei Juni Juli Agust. Sept. Okt. Nov. Des.
Jenis Barang Dan Jasa
[1] [2] [3] [4] [5] [6] [7] [8] [9] [10] [11] [12] [13]
Celana Dalam Pria 0.00 -5.66 0.00 3.39 0.00 0.00 0.00 0.00 2.27 0.00 0.00 0.00
Celana Panjang Jeans 0.00 1.56 3.83 0.00 0.96 0.00 0.80 3.74 3.13 0.00 0.00 0.00
Celana Panjang Katun 2.99 0.00 0.00 0.00 0.00 0.00 0.00 0.00 5.17 0.00 0.00 0.00
Celana Pendek 1.25 1.22 0.00 0.00 0.00 0.00 4.23 0.00 0.00 0.00 0.00 0.00
Kaos Kaki 0.00 0.00 0.00 0.00 7.15 0.00 0.00 0.00 0.00 0.00 0.00 0.00
Kaos Oblong 0.00 0.00 0.00 0.00 2.44 0.00 2.56 0.00 0.00 0.00 0.00 0.00
Kemeja Panjang Batik 0.00 0.00 0.00 0.85 0.00 0.00 1.67 0.00 0.00 0.00 0.00 0.00
Kemeja Panjang Katun 0.00 0.00 0.00 2.56 0.00 0.00 0.00 0.00 4.35 0.00 0.00 0.00
Kemeja Pendek Katun 0.00 0.00 0.00 0.00 0.91 0.00 1.28 0.00 0.98 0.00 0.00 0.00
Sandal Kulit 0.00 0.00 0.00 0.54 1.80 0.00 1.52 2.62 0.00 0.00 0.00 0.00
Sarung Katun 0.00 0.00 0.00 0.00 2.18 0.00 0.00 0.00 0.00 0.00 0.00 0.00
Sepatu 0.98 0.00 0.00 0.00 0.74 0.00 0.00 0.00 0.00 0.00 0.00 0.00
Seragam Sekolah Pria 0.00 0.00 0.00 0.00 0.00 0.00 4.60 0.00 0.00 0.00 0.00 0.00
Baju Muslim 0.00 0.00 0.00 2.70 0.00 0.00 1.52 0.00 13.01 0.00 0.00 0.00
Sandang Wanita 0.70 0.09 0.00 0.00 0.05 0.00 4.22 0.15 1.23 0.00 -0.02 0.00
Bahan Baju Katun 0.00 0.00 0.00 0.00 0.00 0.00 4.00 5.55 0.00 0.00 -0.40 0.00
Baju Kaos/T-Shirt 1.73 0.00 0.00 0.00 0.00 0.00 1.85 0.00 6.67 0.00 0.00 0.00
Baju Muslim 0.00 0.00 0.00 0.00 0.00 0.00 0.00 0.00 0.00 0.00 0.00 0.00
Bh Katun 2.18 1.93 0.00 0.00 0.00 0.00 34.03 0.00 0.00 0.00 0.00 0.00
Blus -0.55 -0.56 0.00 0.00 0.00 0.00 34.03 0.00 0.00 0.00 0.00 0.00
Celana Dlm Wanita 0.00 0.00 0.00 0.00 0.00 0.00 0.00 0.00 0.00 0.00 0.00 0.00
Celana Panjang Jeans 0.00 -5.66 0.00 3.39 0.00 0.00 0.00 0.00 2.27 0.00 0.00 0.00

PENDAPATAN REGIONAL, INFLASI, NTP
424 SULAWESI BARAT DALAM ANGKA 2010
Lanjutan Tabel / Table Continued 9.7.2
Kelompok/sub Kelompok Jan Feb Mar April Mei Juni Juli Agust. Sept. Okt. Nov. Des.
Jenis Barang Dan Jasa
[1] [2] [3] [4] [5] [6] [7] [8] [9] [10] [11] [12] [13]
Daster 0.00 0.00 0.00 0.00 0.00 0.00 0.00 0.00 0.00 0.00 0.00 0.00
Kaos Kaki 0.00 0.00 0.00 0.00 0.00 0.00 0.00 0.00 0.00 0.00 0.00 0.00
Kemeja Pendek 0.00 0.00 0.00 0.00 0.00 0.00 0.00 0.00 0.00 0.00 0.00 0.00
Mukena 0.00 0.00 0.00 0.00 1.78 0.00 0.00 0.00 0.00 0.00 0.00 0.00
Pembalut Wanita 2.45 1.67 0.00 0.00 0.00 0.00 0.00 0.00 0.00 0.00 0.00 0.00
Sandal Kulit 0.00 0.00 0.00 0.00 0.00 0.00 0.00 0.00 0.00 0.00 0.00 0.00
Sepatu 2.17 0.00 0.00 0.00 0.00 0.00 0.00 0.00 0.00 0.00 0.00 0.00
Seragam Sekolah Wnt 0.00 0.00 0.00 0.00 0.00 0.00 0.00 0.00 0.00 0.00 0.00 0.00
Sandang Anak-Anak 0.00 0.00 0.00 0.00 0.00 0.00 12.08 0.00 0.00 0.00 0.00 0.00
Baju Kaos/T-Shirt -0.46 0.13 0.15 0.00 0.07 0.00 1.10 0.00 0.53 -0.24 0.00 0.00
Celana Dalam Anak 0.00 0.00 0.00 0.00 0.00 0.00 0.00 0.00 0.00 0.00 0.00 0.00
Celana Panjang Jeans -7.27 2.62 0.00 0.00 0.00 0.00 0.00 0.00 0.00 0.00 0.00 0.00
Celana Pendek 0.00 1.52 0.00 0.00 0.00 0.00 0.00 0.00 0.00 0.00 0.00 0.00
Kaos Oblong 0.00 0.00 0.00 0.00 0.00 0.00 0.00 0.00 0.00 0.00 0.00 0.00
Kemeja Pendek 0.00 0.00 4.17 0.00 0.00 0.00 0.00 0.00 0.00 0.00 0.00 0.00
Pakaian Bayi 0.00 0.00 0.00 0.00 0.00 0.00 0.00 0.00 0.00 0.00 0.00 0.00
Sandal 0.00 0.00 0.00 0.00 0.00 0.00 3.33 0.00 0.00 0.00 0.00 0.00
Sepatu 0.00 0.00 0.00 0.00 0.00 0.00 0.00 0.00 0.00 0.00 0.00 0.00
Seragam Sekolah Anak 0.00 0.00 0.00 0.00 0.50 0.00 0.00 0.00 0.00 0.00 0.00 0.00
Baju Muslim 0.00 0.00 0.00 0.00 0.00 0.00 10.24 0.00 0.00 0.00 0.00 0.00
Pampers 0.00 0.00 0.00 0.00 0.00 0.00 0.00 0.00 12.50 0.00 0.00 0.00

REGIONAL INCOME, INFLATION, NTP
SULAWESI BARAT IN FIGURES 2010 425
Lanjutan Tabel / Table Continued 9.7.2
Kelompok/sub Kelompok Jan Feb Mar April Mei Juni Juli Agust. Sept. Okt. Nov. Des.
Jenis Barang Dan Jasa
[1] [2] [3] [4] [5] [6] [7] [8] [9] [10] [11] [12] [13]
Barang pribadi dan
sandang lain 1.63 10.71 -1.67 -2.88 -5.87 -0.69 -0.97 -0.37 1.00 0.36 4.57 4.04
Emas perhiasan 2.51 15.67 -2.62 -4.26 -8.92 -1.22 -1.73 -0.57 1.53 0.33 4.86 6.31
Handuk 0.00 0.00 0.00 0.00 0.00 0.00 5.00 0.00 0.00 0.00 0.00 0.00
Jam tangan 0.00 0.00 0.00 0.00 0.00 0.00 0.00 0.00 0.00 0.00 0.00 0.00
Ongkos jahit 0.00 5.42 0.00 0.00 0.00 1.06 0.00 0.00 0.00 1.52 0.00 0.00
Tas tangan wanita 0.00 0.00 1.54 0.00 0.00 0.00 0.00 0.00 0.85 0.00 0.00 0.00
Kerundung/jilbab 0.00 0.00 0.00 0.00 0.00 0.00 0.00 0.00 0.00 0.00 0.00 0.00
Tas 0.00 0.00 0.95 0.00 1.00 0.00 0.00 0.00 0.00 0.00 17.05 0.00
Kesehatan 0.05 1.14 0.12 0.00 0.00 0.08 0.74 0.68 0.10 -0.42 -0.02 0.08
Jasa kesehatan 0.00 0.00 0.00 0.00 0.00 0.00 0.00 0.00 0.00 0.00 0.00 0.00
Dokter spesialis 0.00 0.00 0.00 0.00 0.00 0.00 0.00 0.00 0.00 0.00 0.00 0.00
Dokter umum 0.00 0.00 0.00 0.00 0.00 0.00 0.00 0.00 0.00 0.00 0.00 0.00
Tarip rumah sakit 0.00 0.00 0.00 0.00 0.00 0.00 0.00 0.00 0.00 0.00 0.00 0.00
Ongkos bidan 0.00 0.00 0.00 0.00 0.00 0.00 0.00 0.00 0.00 0.00 0.00 0.00
Obat-obatan 0.00 3.11 0.00 0.00 0.00 0.38 0.56 0.06 0.00 0.00 0.00 0.00
Jamu 0.00 0.00 0.00 0.00 0.00 11.11 8.33 0.00 0.00 0.00 0.00 0.00
Obat dengan resep 0.00 6.06 0.00 0.00 0.00 0.00 0.00 0.11 0.00 0.00 0.00 0.00
Obat batuk 0.00 0.00 0.00 0.00 0.00 0.00 2.70 0.00 0.00 0.00 0.00 0.00
Obat sakit kepala 0.00 0.00 0.00 0.00 0.00 0.00 0.00 0.00 0.00 0.00 0.00 0.00
Obat flu 0.00 0.00 0.00 0.00 0.00 0.00 1.76 0.00 0.00 0.00 0.00 0.00
Obat Gosok 0.00 0.00 0.00 0.00 0.00 0.00 -2.50 0.00 0.00 0.00 0.00 0.00
Vitamin 0.00 0.00 0.00 0.00 0.00 0.00 5.60 0.00 0.00 0.00 0.00 0.00

PENDAPATAN REGIONAL, INFLASI, NTP
426 SULAWESI BARAT DALAM ANGKA 2010
Lanjutan Tabel / Table Continued 9.7.2
Kelompok/sub Kelompok
Jan Feb Mar April Mei Juni Juli Agust. Sept. Okt. Nov. Des. Jenis Barang Dan Jasa
[1] [2] [3] [4] [5] [6] [7] [8] [9] [10] [11] [12] [13]
Jasa perawatan jasmani 0.00 0.00 0.00 0.00 0.00 0.00 0.00 9.47 0.00 0.00 0.00 0.00
Creambath 0.00 0.00 0.00 0.00 0.00 0.00 0.00 0.00 0.00 0.00 0.00 0.00
Keriting/meluruskan
rambut 0.00 0.00 0.00 0.00 0.00 0.00 0.00 10.83 0.00 0.00 0.00 0.00
Tarip gunting rambut
pria 0.00 0.00 0.00 0.00 0.00 0.00 0.00 0.00 0.00 0.00 0.00 0.00
Tarip gunting rambut
wnt 0.00 0.00 0.00 0.00 0.00 0.00 0.00 21.62 0.00 0.00 0.00 0.00
Tarip gunting rambut
anak 0.00 0.00 0.00 0.00 0.00 0.00 0.00 8.32 0.00 0.00 0.00 0.00
Perawatan jasmani dan
kosmetika 0.09 0.96 0.23 0.00 0.00 0.00 1.15 0.00 0.18 -0.74 -0.05 0.14
Bedak 0.00 -1.67 0.00 0.00 0.00 0.00 8.34 0.00 0.00 0.00 0.00 0.00
Deodorant 6.68 0.00 0.00 0.00 0.00 0.00 0.00 0.00 0.00 -6.25 0.00 6.67
Hand Body Lotion 0.00 6.67 0.00 0.00 0.00 0.00 0.00 0.00 0.00 7.35 0.00 0.00
Lipstik 0.00 0.00 2.45 0.00 0.00 0.00 0.00 0.00 0.00 0.00 0.00 0.00
Minyak Rambut 9.88 0.00 1.47 0.00 0.00 0.00 0.00 0.00 5.00 0.00 0.00 0.00
Parfum 0.00 1.19 0.58 0.00 0.00 0.00 0.00 0.00 0.00 0.00 0.00 0.00
Pelembab 0.00 0.00 0.00 0.00 0.00 0.00 0.00 0.00 0.00 -1.19 0.00 0.00
Pasta Gigi 0.00 0.00 0.00 0.00 0.00 0.00 0.00 0.00 0.00 0.00 0.00 0.00
Sabun Mandi Cair 2.00 -6.18 0.00 0.00 0.00 0.00 -3.35 0.00 1.25 -9.14 0.00 0.00
Sabun Mandi 0.00 5.14 0.00 0.00 0.00 0.00 0.00 0.00 0.00 0.00 -0.26 0.00
Shampo -2.18 0.00 0.00 0.00 0.00 0.00 0.00 0.00 0.00 -4.35 0.00 0.00
Sikat Gigi 0.00 0.00 2.93 0.00 0.00 0.00 0.00 0.00 0.00 0.00 0.00 0.00
Pendidikan, rekreasi dan
olah raga -0.13 -0.25 0.60 0.68 0.01 0.18 0.31 1.19 0.56 0.08 0.13 0.01
Pendidikan 0.00 0.00 0.00 0.00 0.00 0.00 0.00 0.00 0.00 0.00 0.00 0.00
Taman Kanak-Kanak 0.00 0.00 0.00 0.00 0.00 0.00 0.00 0.00 0.00 0.00 0.00 0.00

REGIONAL INCOME, INFLATION, NTP
SULAWESI BARAT IN FIGURES 2010 427
Lanjutan Tabel / Table Continued 9.7.2
Kelompok/sub Kelompok Jan Feb Mar April Mei Juni Juli Agust. Sept. Okt. Nov. Des.
Jenis Barang Dan Jasa
[1] [2] [3] [4] [5] [6] [7] [8] [9] [10] [11] [12] [13]
Sekolah Dasar 0.00 0.00 0.00 0.00 0.00 0.00 0.00 0.00 0.00 0.00 0.00 0.00
SLTP 0.00 0.00 0.00 0.00 0.00 0.00 0.00 0.00 0.00 0.00 0.00 0.00
SLTA 0.00 0.00 0.00 0.00 0.00 0.00 0.00 0.00 0.00 0.00 0.00 0.00
Akademi/Perguruan
Tinggi 0.00 0.00 0.00 0.00 0.00 0.00 0.00 0.00 0.00 0.00 0.00 0.00
Kursus-Kursus / Pelatihan 0.00 0.00 0.00 0.00 0.00 0.00 2.43 0.25 0.00 0.00 0.00 0.00
Bimbingan Belajar 0.00 0.00 0.00 0.00 0.00 0.00 7.13 0.00 0.00 0.00 0.00 0.00
Kursus Bahasa Asing 0.00 0.00 0.00 0.00 0.00 0.00 0.00 0.00 0.00 0.00 0.00 0.00
Kursus Komputer 0.00 0.00 0.00 0.00 0.00 0.00 0.00 0.73 0.00 0.00 0.00 0.00
Perlengkapan / Peralatan
Pendidikan -0.28 2.83 0.18 2.29 0.00 0.64 0.59 -0.02 0.81 -0.02 -0.01 0.00
Personal
Komputer/Desktop -0.53 10.61 0.00 1.19 0.00 0.00 -1.89 1.20 -0.36 -0.36 0.00 0.00
Biaya Foto Copy 0.00 0.00 0.00 0.00 0.00 0.00 0.00 0.00 0.00 0.00 0.00 0.00
Buku Tulis Bergaris 0.00 0.81 0.79 7.80 0.00 0.00 5.55 0.00 0.00 0.00 0.00 0.00
Kertas HVS 0.00 -2.08 1.43 0.00 0.00 0.00 0.31 0.00 0.00 0.00 -0.46 0.00
Pensil Hitam 0.00 -2.78 0.00 22.94 0.00 0.00 7.13 0.00 8.33 0.00 0.00 0.00
Pulpen/Bollpoint 0.00 -7.10 0.00 -3.12 0.00 0.00 3.33 0.00 0.00 0.00 0.00 0.00
Tas Sekolah 0.00 0.00 0.00 0.00 0.00 0.00 2.86 0.00 0.45 0.00 0.00 0.00
Buku Pelajaran SD 0.00 0.00 0.00 0.00 0.00 0.00 0.00 0.00 0.00 0.00 0.00 0.00
Buku Pelajaran SMP 0.00 0.00 0.00 0.00 0.00 0.00 0.00 0.00 13.75 0.00 0.00 0.00
Buku Pelajaran SMA 0.00 0.00 0.00 0.00 0.00 0.00 0.00 0.00 9.76 0.00 0.00 0.00
Buku Pelajaran
Akademi/Universitas 0.00 8.70 0.00 0.00 0.00 0.00 0.00 0.00 0.00 0.00 0.00 0.00
Printer Laser -1.64 -6.67 0.00 0.00 0.00 10.71 -8.06 -7.02 0.00 1.89 0.00 0.00

PENDAPATAN REGIONAL, INFLASI, NTP
428 SULAWESI BARAT DALAM ANGKA 2010
Lanjutan Tabel / Table Continued 9.7.2
Kelompok/Sub Kelompok Jan Feb Mar April Mei Juni Juli Agust. Sept. Okt. Nov. Des.
Jenis Barang Dan Jasa
[1] [2] [3] [4] [5] [6] [7] [8] [9] [10] [11] [12] [13]
Rekreasi -0.41 -2.24 1.57 0.58 0.00 0.15 0.34 3.25 0.98 0.12 0.36 -0.01
Cd-Tape-Rec-Radio -1.09 1.67 1.76 1.44 0.00 0.00 0.00 2.92 -1.38 0.00 0.00 -0.39
Televisi Berwarna 0.00 -5.13 3.75 1.30 0.00 0.39 0.00 8.21 2.66 0.00 0.00 0.00
Vcd / Dvd Player -4.00 -2.78 2.38 0.00 0.00 0.00 0.00 0.00 0.00 0.00 0.00 0.00
Playstation -0.48 3.54 0.00 0.23 0.00 0.00 0.00 0.46 -0.37 0.00 0.00 0.00
Surat Kabar Harian 0.00 0.00 0.00 0.00 0.00 0.00 0.00 0.00 0.00 0.00 0.00 0.00
Sepeda Anak 0.00 0.00 0.00 0.00 0.00 0.00 8.16 0.00 0.00 1.89 0.00 0.00
Cuci/Cetak Film -2.53 0.00 0.00 0.00 0.00 0.00 0.00 0.00 0.00 0.00 16.60 0.00
Flash Disk 0.00 -22.45 -2.63 0.00 0.00 0.00 0.00 4.05 0.00 0.00 0.00 0.00
Biaya Jaringan Saluran
Tv 0.00 0.00 0.00 0.00 0.00 0.00 0.00 0.00 0.00 0.00 0.00 0.00
Majalah Dewasa 0.00 0.00 1.48 1.80 0.00 0.00 -3.82 0.00 0.00 0.97 0.00 0.00
Olahraga 1.92 0.00 0.00 0.04 0.23 0.00 0.20 0.39 1.02 0.76 0.00 0.40
Bola 4.43 0.00 0.00 0.25 1.44 0.00 0.00 0.00 6.25 2.17 0.00 1.03
Raket 0.00 0.00 0.00 0.00 0.00 0.00 0.00 0.00 0.00 0.00 0.00 1.10
Pakaian Olah Raga Pria 4.03 0.00 0.00 0.00 0.00 0.00 0.00 0.00 0.00 0.00 0.00 0.00
Sepatu Olah Raga Pria 0.00 0.00 0.00 0.00 0.00 0.00 0.62 1.23 0.00 1.21 0.00 0.00
Transpor,Komunikasi Dan
Jasa Keuangan -1.49 -0.17 0.61 0.22 -0.04 -0.59 0.00 0.03 0.36 -0.07 0.01 0.16
Transpor -2.57 -0.05 0.09 0.23 -0.06 0.00 0.00 0.04 0.37 -0.31 0.00 0.16
Angkutan Sungai,
Danau & Penyebrangan 0.00 0.00 0.00 0.00 0.00 0.00 0.00 0.00 0.00 0.00 0.00 0.00
Angkutan Antar Kota -1.52 -1.67 0.00 0.00 0.00 0.00 0.00 0.00 2.67 -2.60 0.00 0.00
Angkutan Dalam Kota 0.00 0.00 0.00 0.00 0.00 0.00 0.00 0.00 0.00 0.00 0.00 0.00
Angkutan Udara 0.00 0.00 0.00 0.00 0.00 0.00 0.00 0.00 0.00 0.00 0.00 0.00

REGIONAL INCOME, INFLATION, NTP
SULAWESI BARAT IN FIGURES 2010 429
Lanjutan Tabel / Table Continued 9.7.2
Kelompok/sub Kelompok Jan Feb Mar April Mei Juni Juli Agust. Sept. Okt. Nov. Des.
Jenis Barang Dan Jasa
[1] [2] [3] [4] [5] [6] [7] [8] [9] [10] [11] [12] [13]
Bahan Pelumas/Oli 0.00 0.63 0.00 0.71 0.00 0.00 0.00 -3.48 0.78 0.00 0.00 0.00
Bensin -9.57 -4.78 0.00 0.00 0.00 0.00 0.00 0.00 0.00 0.00 0.00 0.00
Kendaraan Carter -5.98 -2.00 0.00 0.00 0.00 0.00 0.00 0.00 2.50 0.00 0.00 0.00
Mobil 0.00 5.08 0.00 0.62 0.00 0.00 0.00 0.53 0.00 0.00 0.00 0.00
Sepeda Motor 0.00 0.00 0.35 0.22 -0.20 0.00 0.00 0.00 0.00 0.00 0.00 0.59
Solar -9.40 -2.91 0.00 0.00 0.00 0.00 0.00 0.00 0.00 0.00 0.00 0.00
Tarip Sewa Becak 0.00 0.00 0.00 0.00 0.00 0.00 0.00 0.00 0.00 0.00 0.00 0.00
Komunikasi Dan
Pengiriman 1.70 -0.55 2.40 0.07 0.00 -2.58 0.00 0.00 0.00 0.59 0.00 0.22
Biaya Kirim Surat 0.00 0.00 0.00 0.00 0.00 0.00 0.00 0.00 0.00 0.00 0.00 0.00
Biaya Pengiriman Barang 0.00 0.00 0.00 0.00 0.00 0.00 0.00 0.00 0.00 0.00 0.00 0.00
Tarip Telepon 0.00 0.00 0.00 0.00 0.00 0.00 0.00 0.00 0.00 0.00 0.00 0.00
Tarip Pulsa Ponsel 0.00 0.00 0.00 0.00 0.00 0.00 0.00 0.00 0.00 0.00 0.00 0.00
Telepon Seluler 4.57 -1.45 6.35 0.18 0.00 -6.54 0.00 0.00 0.00 1.56 0.00 0.59
Sarana Dan Penunjang
Transpor -0.32 -0.20 0.06 0.67 -0.08 0.00 0.00 0.00 1.53 0.43 0.07 0.04
Ban Dalam Mobil -4.58 1.09 0.00 0.00 -2.38 0.00 0.00 0.00 0.00 5.05 0.00 0.00
Ban Dalam Motor 0.00 -2.50 0.00 2.63 0.00 0.00 0.00 0.00 0.00 0.00 0.00 0.00
Ban Luar Mobil 0.00 -2.54 0.00 0.89 0.00 0.00 0.00 0.00 1.92 0.93 2.81 0.36
Ban Luar Motor 0.00 0.00 0.00 2.20 0.00 0.00 0.00 0.00 0.00 0.00 -4.97 0.00
Helm 0.00 0.00 0.00 2.00 0.00 0.00 0.00 0.00 0.00 0.00 0.00 0.00
Busi 0.00 -3.13 0.00 0.00 0.00 0.00 0.00 0.00 0.00 0.00 16.67 0.00
Pemeliharaan/Service 0.00 0.00 0.00 0.00 0.00 0.00 0.00 0.00 0.00 0.00 0.00 0.00
Perbaikan Ringan
Kendaraan 0.00 0.00 0.00 0.00 0.00 0.00 0.00 0.00 1.59 0.00 0.00 0.00
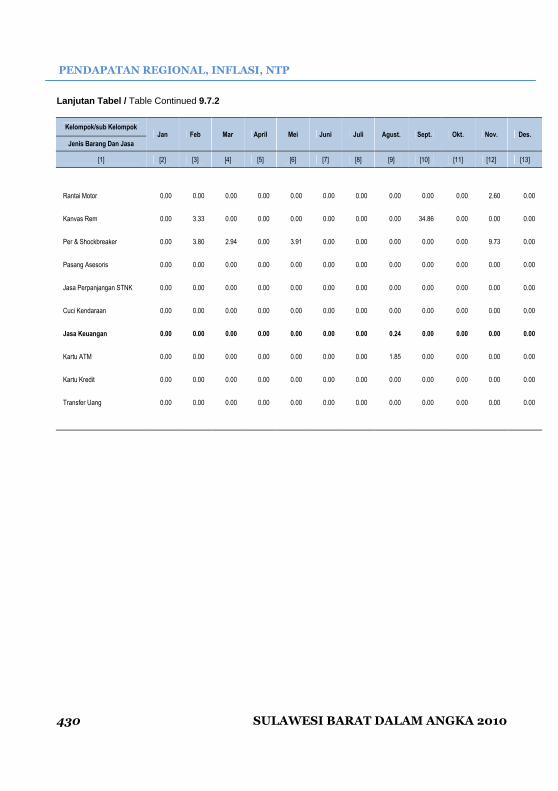
PENDAPATAN REGIONAL, INFLASI, NTP
430 SULAWESI BARAT DALAM ANGKA 2010
Lanjutan Tabel / Table Continued 9.7.2
Kelompok/sub Kelompok Jan Feb Mar April Mei Juni Juli Agust. Sept. Okt. Nov. Des.
Jenis Barang Dan Jasa
[1] [2] [3] [4] [5] [6] [7] [8] [9] [10] [11] [12] [13]
Rantai Motor 0.00 0.00 0.00 0.00 0.00 0.00 0.00 0.00 0.00 0.00 2.60 0.00
Kanvas Rem 0.00 3.33 0.00 0.00 0.00 0.00 0.00 0.00 34.86 0.00 0.00 0.00
Per & Shockbreaker 0.00 3.80 2.94 0.00 3.91 0.00 0.00 0.00 0.00 0.00 9.73 0.00
Pasang Asesoris 0.00 0.00 0.00 0.00 0.00 0.00 0.00 0.00 0.00 0.00 0.00 0.00
Jasa Perpanjangan STNK 0.00 0.00 0.00 0.00 0.00 0.00 0.00 0.00 0.00 0.00 0.00 0.00
Cuci Kendaraan 0.00 0.00 0.00 0.00 0.00 0.00 0.00 0.00 0.00 0.00 0.00 0.00
Jasa Keuangan 0.00 0.00 0.00 0.00 0.00 0.00 0.00 0.24 0.00 0.00 0.00 0.00
Kartu ATM 0.00 0.00 0.00 0.00 0.00 0.00 0.00 1.85 0.00 0.00 0.00 0.00
Kartu Kredit 0.00 0.00 0.00 0.00 0.00 0.00 0.00 0.00 0.00 0.00 0.00 0.00
Transfer Uang 0.00 0.00 0.00 0.00 0.00 0.00 0.00 0.00 0.00 0.00 0.00 0.00

REGIONAL INCOME, INFLATION, NTP
SULAWESI BARAT IN FIGURES 2010 431
Tabel 9.8.1 Nilai Tukar Petani (NTP) Di Provinsi Sulawesi Barat 2009 Table Farmers Exchange Rate In Sulawesi Barat Province , 2009
Periode Period
Indeks Harga Yang Diterima
Petani Indices of
Producer Prices Received by
Farmers
Indeks Harga Yang Dibayar
Petani Indices of
Consumer Prices Paid by Farmers
Nilai Tukar Petani Farmers’ Terms of
Trade
(1) (2) (3) (4)
Januari – January 122,82 119,35 102,90
Februari – February 124,38 119,77 103,85
Maret – March 125,78 120,19 104,65
April – April 126,44 120,26 105,14
Mei - May 126,36 120,23 105,10
Juni – June 127,63 120,63 105,80
Juli – July 127,42 120,92 105,38
Agustus – August 128,95 121,47 106,16
September – September 130,27 122,91 105,99
Oktober – October 132,04 123,62 106,81
November – November 132,55 123,32 107,48
Desember - December 132,26 123,90 106,75
Sumber / Source : Badan Pusat Statistik (BPS) Provinsi Sulawesi Ba rat / Statistics of Sulawesi Barat Province

PENDAPATAN REGIONAL, INFLASI, NTP
432 SULAWESI BARAT DALAM ANGKA 2010
Tabel 9.8.2
Nilai Tukar Petani (NTP) Sub Sektor Tanaman Pangan Di Provinsi Sulawesi Barat 2009
Table Farmers Exchange Rate by Sub Sector Food Crops In Sulawesi Barat Province , 2009
Periode Period
Indeks Harga Yang Diterima
Petani Indices of
Producer Prices Received by
Farmers
Indeks Harga Yang Dibayar
Petani Indices of
Consumer Prices Paid by Farmers
Nilai Tukar Petani Farmers’ Terms of
Trade
(1) (2) (3) (4)
Januari – January 111,91 119,22 93,87
Februari – February 114,98 119,58 96,15
Maret – March 115,35 119,56 96,48
April – April 115,40 119,39 96,66
Mei - May 115,45 119,44 96,66
Juni – June 115,42 119,86 96,30
Juli – July 115,42 120,18 96,04
Agustus – August 115,42 120,67 95,65
September – September 115,49 122,36 94,39
Oktober – October 116,28 123,09 94,46
November – November 116,75 123,68 95,16
Desember - December 116,83 123,29 94,76
Sumber / Source : Badan Pusat Statistik (BPS) Provinsi Sulawesi Ba rat / Statistics of Sulawesi Barat Province

REGIONAL INCOME, INFLATION, NTP
SULAWESI BARAT IN FIGURES 2010 433
Tabel 9.8.3
Nilai Tukar Petani (NTP) Sub Sektor Hortikultura Di Provinsi Sulawesi Barat 2009
Table Farmers Exchange Rate by Sub Sector Horticulture In Sulawesi Barat Province , 2009
Periode Period
Indeks Harga Yang Diterima
Petani Indices of
Producer Prices Received by
Farmers
Indeks Harga Yang Dibayar
Petani Indices of
Consumer Prices Paid by Farmers
Nilai Tukar Petani Farmers’ Terms of
Trade
(1) (2) (3) (4)
Januari – January 108,15 118,67 91,14
Februari – February 109,13 119,49 91,33
Maret – March 107,82 119,60 90,15
April – April 106,80 119,65 89,26
Mei - May 105,85 119,79 88,37
Juni – June 105,23 120,27 87,50
Juli – July 104,77 120,47 86,97
Agustus – August 104,77 120,83 86,71
September – September 107,59 122,63 87,74
Oktober – October 107,87 123,17 87,58
November – November 107,08 123,16 86,94
Desember - December 107,98 123,98 87,09
Sumber / Source : Badan Pusat Statistik (BPS) Provinsi Sulawesi Ba rat / Statistics of Sulawesi Barat Province

PENDAPATAN REGIONAL, INFLASI, NTP
434 SULAWESI BARAT DALAM ANGKA 2010
Tabel 9.8.4
Nilai Tukar Petani (NTP) Sub Sektor Tanaman Perkebu nan Rakyat Di Provinsi Sulawesi Barat 2009
Table Farmers Exchange Rate by Sub Sector Plantation People In Sulawesi Barat Province , 2009
Periode Period
Indeks Harga Yang Diterima
Petani Indices of
Producer Prices Received by
Farmers
Indeks Harga Yang Dibayar
Petani Indices of
Consumer Prices Paid by Farmers
Nilai Tukar Petani Farmers’ Terms of
Trade
(1) (2) (3) (4)
Januari – January 148,66 123,77 120,12
Februari – February 148,26 123,79 119,77
Maret – March 155,63 124,57 124,93
April – April 159,21 124,66 127,71
Mei - May 159,36 124,46 128,04
Juni – June 162,92 124,82 130,52
Juli – July 160,02 125,11 127,91
Agustus – August 165,60 125,70 131,74
September – September 167,34 127,23 131,53
Oktober – October 171,68 127,94 134,19
November – November 172,14 127,74 134,76
Desember - December 107,79 128,07 133,36
Sumber / Source : Badan Pusat Statistik (BPS) Provinsi Sulawesi Ba rat / Statistics of Sulawesi Barat Province

REGIONAL INCOME, INFLATION, NTP
SULAWESI BARAT IN FIGURES 2010 435
Tabel 9.8.5
Nilai Tukar Petani (NTP) Sub Sektor Peternakan Di P rovinsi Sulawesi Barat 2009
Table Farmers Exchange Rate by Sub Sector Livestock In Sulawesi Barat Province , 2009
Periode Period
Indeks Harga Yang Diterima
Petani Indices of
Producer Prices Received by
Farmers
Indeks Harga Yang Dibayar
Petani Indices of
Consumer Prices Paid by Farmers
Nilai Tukar Petani Farmers’ Terms of
Trade
(1) (2) (3) (4)
Januari – January 125,56 118,44 106,02
Februari – February 126,97 118,91 106,78
Maret – March 126,31 119,87 105,37
April – April 126,42 120,18 105,19
Mei - May 126,59 120,06 105,44
Juni – June 129.97 120.34 108.01
Juli – July 131,19 120,74 108,66
Agustus – August 132,27 121,52 108,84
September – September 133,59 122,53 109,02
Oktober – October 134,21 123,32 108,83
November – November 135,65 123,03 110,26
Desember - December 135,44 123,42 109,74
Sumber / Source : Badan Pusat Statistik (BPS) Provinsi Sulawesi Ba rat / Statistics of Sulawesi Barat Province

PENDAPATAN REGIONAL, INFLASI, NTP
436 SULAWESI BARAT DALAM ANGKA 2010
Tabel 9.8.6
Nilai Tukar Petani (NTP) Sub Sektor Perikanan Di Pr ovinsi Sulawesi Barat 2009
Table Farmers Exchange Rate by Sub Sector Fishery In Sulawesi Barat Province , Juni 2009
Periode Period
Indeks Harga Yang Diterima
Petani Indices of
Producer Prices Received by
Farmers
Indeks Harga Yang Dibayar
Petani Indices of
Consumer Prices Paid by Farmers
Nilai Tukar Petani Farmers’ Terms of
Trade
(1) (2) (3) (4)
Januari – January 119,85 115,52 103,75
Februari – February 121,17 116,22 104,26
Maret – March 122,49 116,52 105,12
April – April 122,74 116,73 105,14
Mei - May 122,25 116,77 104,69
Juni – June 121,19 117,37 103,26
Juli – July 122,03 117,44 103,91
Agustus – August 123,56 117,77 104,92
September – September 126,26 118,96 106,14
Oktober – October 130,03 119,60 108,72
November – November 130,10 119,25 109,10
Desember - December 129,33 120,22 107,58
Sumber / Source : Badan Pusat Statistik (BPS) Provinsi Sulawesi Ba rat / Statistics of Sulawesi Barat Province

REGIONAL INCOME, INFLATION, NTP
SULAWESI BARAT IN FIGURES 2010 437
Tabel 9.9
Realisasi Pengadaan Gabah Oleh Perum Bulog Menurut Kabupaten Di Sulawesi Barat (Ton), 2007-2009
Table Actual Shell of Rice Procurement by Regional Logistic Unit Board by Regency in Sulawesi Barat (Tons, 2007-2009
Kabupaten Regency
2007
2008
2009
Gabah Unhulled
Rice
Beras Rice
Gabah Unhulled
Rice
Beras Rice
Gabah Unhulled
Rice
Beras Rice
(1) (5) (6) (5) (6) (7) (8)
01. Majene 0 2 025
0 2 732
- 1 840
02. Polewali Mandar 635 14 901
0 15 752
- 12 038
03. Mamasa 0 0
0 0
- -
04. Mamuju 195 900
0 3 751
- 2 881
05. Mamuju Utara 0 0
0 0
- -
Jumlah - Total 830 17 826
0 22 235
- 16 759
Sumber / Source : Perum Bulog Sub Divre Polman / Warehouse for Logistic Unit Board, Sub Division of Polman

10 KEMISKINAN
Poverty

POVERTY
SULAWESI BARAT IN FIGURES 2010 441
10.1. Kemiskinan
Penduduk miskin adalah penduduk yang memiliki rata-rata pengeluaran per kapita per bulan berada di bawah garis kemiskinan. Pendekatan yang dilakukan oleh BPS adalah konsep kemampuan memenuhi kebutuhan dasar (basic
needs approach). Seseorang yang dianggap
miskin jika tidak mampu memenuhi kebutuhan dasar makanan yang disetarakan 2100 kilokalori serta kebutuhan bukan makanan, yakni kebutuhan minimum perumahan, sandang, pendidikan dan kesehatan.
Jumlah penduduk miskin di Provinsi Sulawesi Barat sejak Maret 2007 sampai Maret 2010 terus mengalami penurunan. Tahun 2007 persentase penduduk miskin mencapai kisaran 19,03 persen atau setara dengan 189,9 ribu orang, kemudian mengalami penurunan yang cukup besar hingga tahun 2010 tinggal berkisar 13,58 persen saja (141,33 ribu orang).
Indikator lain yang mendukung membaiknya kondisi kemiskinan di Sulawesi Barat adalah adanya penurunan indeks kedalaman kemiskinan dan keparahan kemiskinan, sementara garis kemiskinan di Sulawesi Barat mengalami peningkatan yang cukup tinggi. Garis kemiskinan tertinggi berada di Kabupaten Polewali Mandar sebesar Rp. 213.942, kemudian Kabupaten Majene sebesar Rp. 204.699, sementara itu di tingkat Sulawesi Barat hanya berkisar Rp. 184.301,00
10.1. Poverty
Population is poor people who have an
average expenditure per capita per month is
below the poverty line, the approach
undertaken by the BPS is the concept's ability
to meet basic needs (basic needs approach).
ie the inability to meet basic needs of food
equalized 2100 kilocalorie and need not food,
that is, the minimum needs of housing,
clothing, education, and health.
The number of poor people in Sulawesi
Barat province since March 2007 until March
2010 continued to decline. In 2007 the
percentage of poor people reached the range
of 19.03 percent or equivalent to 189.9
thousand people, then experienced a
significant decline until the year 2010 range
from 13.58 percent lived alone (141.33
thousand people).
Another indicator of improved
conditions of poverty in Sulawesi Barat is a
decrease in the index of poverty depth and
severity of poverty, while the poverty line in
Sulawesi Barat increased high enough. The
highest poverty line is in Polewali Mandar Rp.
213 942, then Majene regency Rp. 204 699,
whereas in the Sulawesi Barat level is only
around Rp. 184,301.00
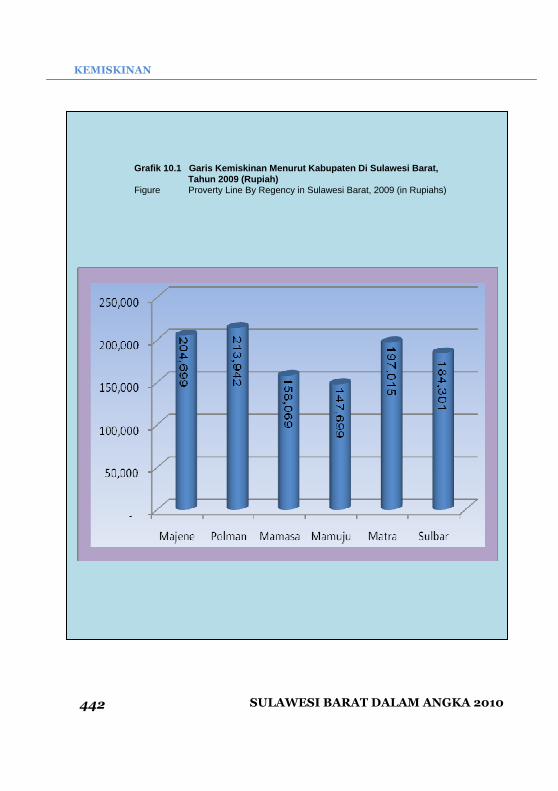
KEMISKINAN
SULAWESI BARAT DALAM ANGKA 2010
442
Grafik 10.1 Garis Kemiskinan Menurut Kabupaten Di Sulawesi Barat, Tahun 2009 (Rupiah)
Figure Proverty Line By Regency in Sulawesi Barat, 2009 (in Rupiahs)

POVERTY
SULAWESI BARAT IN FIGURES 2010 443
Grafik 10.2 Jumlah Penduduk Miskin Menurut Daerah, 2007-2010 (Ribu Jiwa) Figure Number of Poor Population By Region, 2007-2010 (in Thousands Person)

KEMISKINAN
SULAWESI BARAT DALAM ANGKA 2010
444
Tabel 10.1
Jumlah Dan Persentase Penduduk Miskin Menurut Daerah Di Sulawesi Barat, Maret 2007-Maret 2009
Table Number and Percentage of Poor Population by Region in Sulawesi Barat Province, March 2007-March 2009
Periode Period
Kota Urban
Desa Rural
Jumlah
Total
Jumlah (Ribu)
Persentase Jumlah (Ribu)
Persentase Jumlah (Ribu)
Persentase
Maret-07 55,1 16,53
134,8 20,29
189,9 19,03
Maret-08 48,3 14,14
122,8 18,03
171,1 16,73
Maret-09 43,5 12,59
114,7 16,5
158,2 15,29
Sumber / Source : Diolah dari data Susenas Maret 2007 sampai Maret 2009 / Calculated from data Susenas March 2007 to March 2009

POVERTY
SULAWESI BARAT IN FIGURES 2010 445
Tabel 10.2
Garis kemiskinan menurut daerah di sulawesi barat, Maret 2007 -Maret 2009 (Rupiah)
Table According to the Regional Poverty Lines in sulawesi Barat Province, March 2007-March 2009 (in Rupiahs)
Wilayah Area
2007 2008 2009
Kota Urban
144.842 156.041 175.901
Desa Rural
130.428 141.701 156.866
Kota + Desa Urban + Rural
135.242 146.492 163.224
Sumber / Source : Diolah dari data Susenas Maret 2007 sampai Maret 2009 / Calculated from
data Susenas March 2007 to March 2009

KEMISKINAN
SULAWESI BARAT DALAM ANGKA 2010
446
Tabel 10.3
Komponen Garis Kemiskinan Menurut Daerah Di Sulawesi Barat, Maret 2009
Table Components OF Poverty Lines by Regency in Sulawesi Barat Province, March 2009
Wilayah Area
Makanan Food
Bukan Makanan Non Food
Jumlah Total
Jumlah (Rp)
%
Jumlah (Rp)
%
Jumlah (Rp)
%
Kota
Urban 146 099 80,18
36 107 19,82
182 206 100,00
Desa
Rural 137 723 83,01
28 191 16,99
165 914 100,00
Kota + Desa
Urban + Rural 140 521 82,01
30 835 17,99
171 356 100,00
Sumber / Source : Diolah dari data Susenas Maret 2007 sampai Maret 2009 / Calculated from data Susenas March 2007 to March 2009

POVERTY
SULAWESI BARAT IN FIGURES 2010 447
Tabel 10.4
Indeks Kedalaman Kemiskinan (P1) Dan Indeks Keparahan Kemiskinan (P2) Di Sulawesi Barat Menurut Daerah, Maret 2007- Maret 2010
Table Poverty Depth Index (P1) and Illness Poverty Index (P2) According in Sulawesi Barat Province by Region,March 2007 - March 2009
Tahun Year
Kota Urban
Desa Rural
Kota + Desa Urban+Rural
Indeks Kedalaman Kemiskinan (P1) Poverty Depth Index (P1)
Maret 2007 1,73 3,02 2,59
Maret 2008 2,38 2,75 2,63
Maret 2009 2,91 2,25 2,47 Indeks Keparahan Kemiskinan (P2) Illness Poverty Index (P2)
Maret 2007 0,40 0,66 0,57
Maret 2008 0,70 0,63 0,66
Maret 2009 0,95 0,42 0,60
Sumber / Source : Diolah dari data Susenas Maret 2007 sampai Maret 2010 / Calculated from
data Susenas March 2007 to March 2009
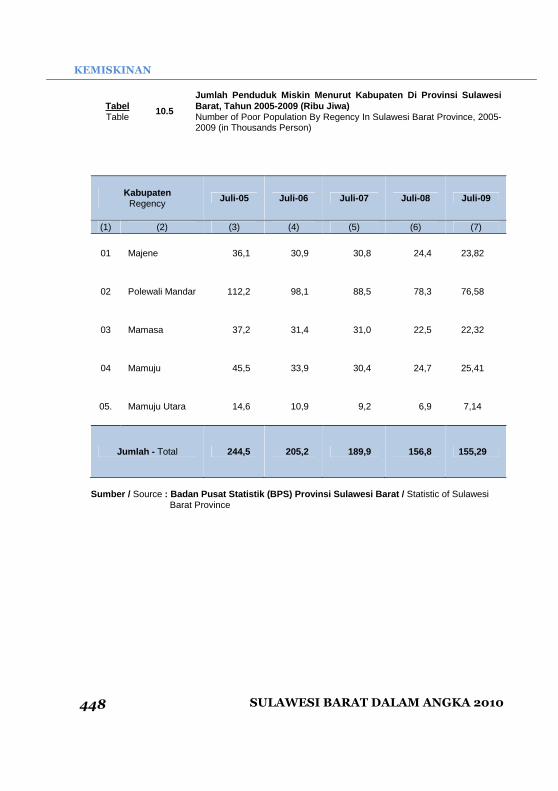
KEMISKINAN
SULAWESI BARAT DALAM ANGKA 2010
448
Tabel 10.5
Jumlah Penduduk Miskin Menurut Kabupaten Di Provinsi Sulawesi Barat, Tahun 2005-2009 (Ribu Jiwa)
Table Number of Poor Population By Regency In Sulawesi Barat Province, 2005-2009 (in Thousands Person)
Kabupaten Regency
Juli-05 Juli-06 Juli-07 Juli-08 Juli-09
(1)
(2)
(3)
(4)
(5)
(6) (7)
01 Majene 36,1 30,9 30,8 24,4 23,82
02 Polewali Mandar 112,2 98,1 88,5 78,3 76,58
03 Mamasa 37,2 31,4 31,0 22,5 22,32
04 Mamuju 45,5 33,9 30,4 24,7 25,41
05. Mamuju Utara 14,6 10,9 9,2 6,9 7,14
Jumlah - Total 244,5 205,2 189,9 156,8 155,29
Sumber / Source : Badan Pusat Statistik (BPS) Provinsi Sulawesi Barat / Statistic of Sulawesi
Barat Province

POVERTY
SULAWESI BARAT IN FIGURES 2010 449
Tabel 10.6
Persentase Penduduk Miskin Menurut Kabupaten Di Provinsi Sulawesi Barat, Tahun 2005-2009
Table Percentage of Poor Population By Regency In Sulawesi Barat Province, 2005-2009
Kabupaten Regency
Juli-05 Juli-06 Juli-07 Juli-08 Juli-09
(1)
(2)
(3)
(4)
(5) (6)
(7)
01 Majene 27,27 23,50 23,55 18,44 18,09
02 Polewali Mandar 30,71 27,65 24,96 21,82 21,37
03 Mamasa 30,43 25,92 25,51 18,06 17,87
04 Mamuju 15,96 11,96 10,43 8,11 8,13
05. Mamuju Utara 14,98 11,04 9,22 6,52 6,47
Jumlah - Total 20,74 19,03 15,27 14,96
Sumber / Source : Badan Pusat Statistik (BPS) Provinsi Sulawesi Barat / Statistic of Sulawesi
Barat Province

KEMISKINAN
SULAWESI BARAT DALAM ANGKA 2010
450
Tabel 10.7 Garis Kemiskinan Menurut Kabupaten Di Provinsi Sulawesi Barat, Tahun 2005-2009 (Rupiah)
Table Poverty Line By Regency In Sulawesi Barat Province, 2005-2009 (in Rupiahs)
Kabupaten Regency
Juli-05 Juli-06 Juli-07 Juli-08 Juli-09
(1) (2) (3) (4) (5) (6) (6)
01 Majene 118 161 130 648 135 568 158 716 204 699
02 Polewali Mandar 120 067 139 724 140 796 179 438 213 942
03 Mamasa 92 667 112 763 121 214 149 221 158 069
04 Mamuju 111 600 118 318 119 031 137 055 147 699
05. Mamuju Utara 139 955 164 668 166 638 170 212 197 015
Jumlah - Total 130 480 135 242 159 585 184 301
Sumber / Source : Badan Pusat Statistik (BPS) Provinsi Sulawesi Barat / Statistic of Sulawesi
Barat Province

POVERTY
SULAWESI BARAT IN FIGURES 2010 451
Tabel 10.8
Jumlah Rumah Tangga Sasaran Program Bantuan Langsung Tunai BLT) Menurut Kabupaten Di Provinsi Sulawesi Barat, Tahun 2008
Table Number of Household Target of BLT Program By Regency In Sulawesi Barat Province, 2008
Kabupaten Regency
Rumah Tangga Household
Rumah tangga sasaran PPLS08
Household Goals PPLS08
(1)
(2)
(3)
(4)
01 Majene 26 895 15 696
02 Polewali Mandar 92 896 22 210
03 Mamasa 28 081 21 155
04 Mamuju 67 787 25 456
05. Mamuju Utara 26 079 6 056
Jumlah - Total 231 738 90 573
Sumber / Source : Badan Pusat Statistik (BPS) Provinsi Sulawesi Barat / Statistic of Sulawesi
Barat Province

11 PERBANDINGAN REGIONAL
Regional Comparison

NATIONAL COMPARISON
SULAWESI BARAT IN FIGURES 2010 455
11. Perbandingan Regional
Statistik perbandingan antar propinsi
disajikan untuk memberikan gambaran
keadaan masing-masing propinsi untuk
data-data penting seperti laju inflasi, neraca
keuangan daerah tingkat I, nilai ekspor -
impor dan data Produk Domestik Regional
Bruto (PDRB).
Laju inflasi menggambarkan stabilitas
ekonomi di suatu daerah. Tingkat inflasi di
setiap ibukota propinsi tampak berfluktuasi
selama Tahun 2009. Pada Agustus 2009,
semua kota di Sulawesi mangalami inflasi.
Inflasi tertinggi terjadi di Kota Palu sekitar
1,56 persen sedangkan ternedah sekitar
0,60 persen yang terjadi di Kota Pare-Pare
dan Kota Mamuju.
Sedangkan dari segi nilai tukar petani,
menutup akhir tahun 2009 hampir semua
kota di Sulawesi sudah berada diatas level
100, kecuali Sulawesi Tengah yang masih
berkisar 98,88.
.
11. Regional Comparison
Statistical comparison among
provinces presented to give a regional
perspective, especially in terms of inflation,
Income and Outlay of First Local
Government, Export and Import, and Gross
Regional Domestic Product.
Describes the rate of inflation to
economic stability in a region. The inflation
rate in each provincial capital seemed
fluctuate during the 2009. In August 2009,
all cities in Sulawesi inflation ultimate
recovery. The highest inflation occurred in
Palu around 1.56 percent of about 0.60
percent while the lowest occurred in Pare-
Pare and Mamuju.
While farmers in terms of the
exchange rate, closing the year 2009
almost all the cities in Sulawesi were
already above level 100, but Sulawesi
Tengah which is still around 98.88.
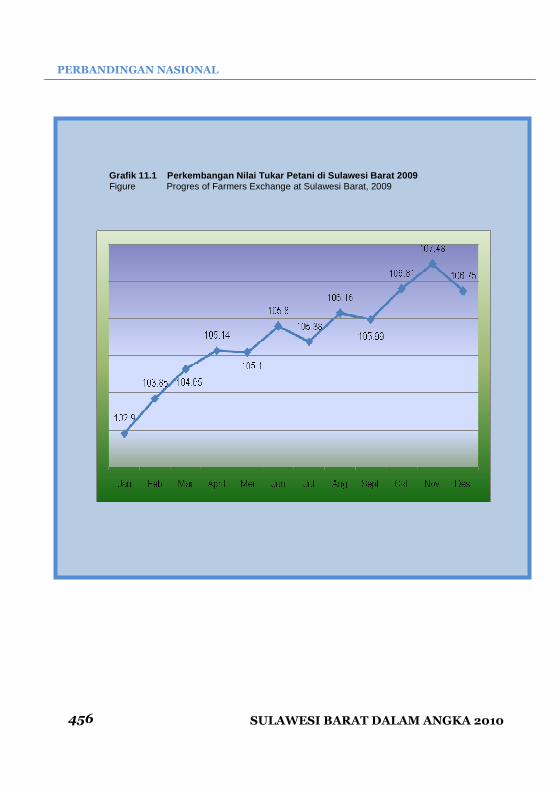
PERBANDINGAN NASIONAL
SULAWESI BARAT DALAM ANGKA 2010 456
Grafik 11.1 Perkembangan Nilai Tukar Petani di Sulawesi Barat 2009 Figure Progres of Farmers Exchange at Sulawesi Barat, 2009

NATIONAL COMPARISON
SULAWESI BARAT IN FIGURES 2010 457
Grafik 11.2 Perkembangan IHK Kota Mamuju 2009 Figure Progress of IKH at Mamuju City, 2009
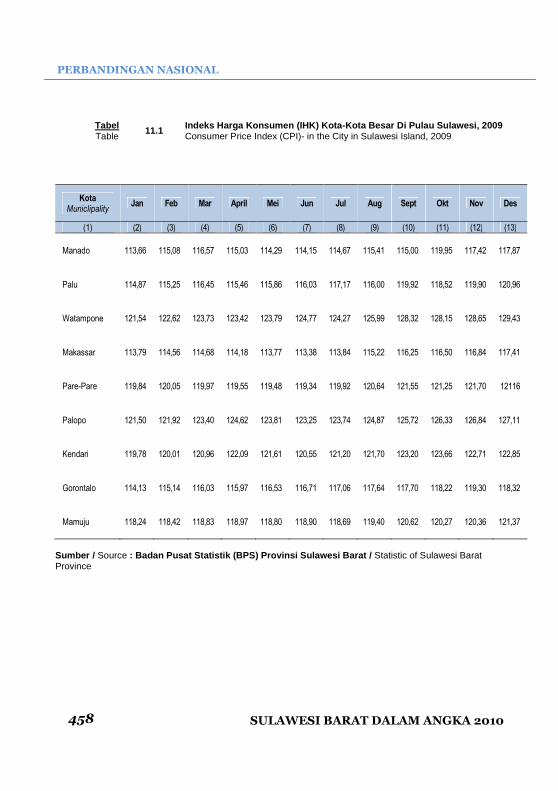
PERBANDINGAN NASIONAL
SULAWESI BARAT DALAM ANGKA 2010 458
Tabel 11.1 Indeks Harga Konsumen (IHK) Kota-Kota Besar Di Pulau Sulawesi, 2009 Table Consumer Price Index (CPI)- in the City in Sulawesi Island, 2009
Kota MunicIipality
Jan Feb Mar April Mei Jun Jul Aug Sept Okt Nov Des
(1) (2) (3) (4) (5) (6) (7) (8) (9) (10) (11) (12) (13)
Manado 113,66 115,08 116,57 115,03 114,29 114,15 114,67 115,41 115,00 119,95 117,42 117,87
Palu 114,87 115,25 116,45 115,46 115,86 116,03 117,17 116,00 119,92 118,52 119,90 120,96
Watampone 121,54 122,62 123,73 123,42 123,79 124,77 124,27 125,99 128,32 128,15 128,65 129,43
Makassar 113,79 114,56 114,68 114,18 113,77 113,38 113,84 115,22 116,25 116,50 116,84 117,41
Pare-Pare 119,84 120,05 119,97 119,55 119,48 119,34 119,92 120,64 121,55 121,25 121,70 12116
Palopo 121,50 121,92 123,40 124,62 123,81 123,25 123,74 124,87 125,72 126,33 126,84 127,11
Kendari 119,78 120,01 120,96 122,09 121,61 120,55 121,20 121,70 123,20 123,66 122,71 122,85
Gorontalo 114,13 115,14 116,03 115,97 116,53 116,71 117,06 117,64 117,70 118,22 119,30 118,32
Mamuju 118,24 118,42 118,83 118,97 118,80 118,90 118,69 119,40 120,62 120,27 120,36 121,37
Sumber / Source : Badan Pusat Statistik (BPS) Provinsi Sulawesi Barat / Statistic of Sulawesi Barat Province

NATIONAL COMPARISON
SULAWESI BARAT IN FIGURES 2010 459
Tabel 11.2 Inflasi Kota-Kota Besar Di Pulau Sulawesi, 2009 Table Inflation in the City in Sulawesi Island, 2009
Kota Municipality
Jan Feb Mar April Mei Jun Jul Aug Sept Okt Nov Des
(1) (2) (3) (4) (5) (6) (7) (8) (9) (10) (11) (12) (13)
Manado -1,35 1,25 1,29 -1,32 -0,64 -0,12 0,46 0,65 -0,36 0,83 1,27 0,38
Palu 0,40 0,33 1,04 -0,85 0,35 0,15 0,98 1,56 0,77 -1,17 1,16 0,88
Watampone 0,33 0,89 0,91 -0,25 0,30 0,79 -0,40 1,38 1,85 -0,13 0,39 0,61
Makassar 0,06 0,68 0,10 -0,44 -0,36 -0,34 0,41 1,21 0,89 0,22 0,29 0,49
Pare-Pare 0,29 0,18 -0,07 -0,35 -0,06 -0,12 0,49 0,60 0,75 -0,25 0,37 -0,44
Palopo -0,42 0,35 1,21 0,99 -0,65 -0,45 0,40 0,91 0,68 0,49 0,40 0,21
Kendari 1,98 0,19 0,79 0,93 -0,39 -0,87 0,54 0,41 1,23 0,37 -0,77 0,11
Gorontalo 0,65 0,88 0,77 -0,05 0,48 0,15 0,30 0,50 0,05 0,44 0,91 -0,82
Mamuju -0,85 0,15 0,35 0,12 -0,14 0,08 -0,18 0,60 1,02 -0,29 0,07 0,84
Sumber / Source : Badan Pusat Statistik (BPS) Provinsi Sulawesi Barat / Statistic of Sulawesi Barat Province

PERBANDINGAN NASIONAL
SULAWESI BARAT DALAM ANGKA 2010 460
Tabel 11.3 Nilai Tukar Petani (NTP) Provinsi Di Pulau Sulawesi, 2009 Table Farmers Exchange Rate (NTP) By Province in Sulawesi Island, 2009
Provinsi Province
Jan Feb Mar April Mei Jun Jul Aug Sept Okt Nov Des
(1) (2) (3) (4) (5) (6) (7) (8) (9) (10) (11) (12) (13)
Sulawesi Utara
101,58 102,54 102,18 102,03 100,97 100,60 100,64 100,31 100,68 101,65 101,71 101,88
Sulawesi Tengah
97,93 97,98 98,45 98,65 98,96 98,32 98,92 99,46 98,96 98,32 98,14 98,88
Sulawesi Selatan
98,49 98,91 99,08 98,81 99,07 100,55 100,93 102,13 103,09 102,61 102,04 101,97
Sulawesi Tenggara
102,63 105,23 105,75 106,52 106,45 106,54 107,36 108,96 108,59 109,74 109,69 109,93
Gorontalo 100,87 100,06 99,10 98,64 99,12 98,40 99,52 98,79 98,81 99,22 100,44 100,70
Sulawesi Barat
102,90 103,85 104,65 105,14 105,10 105,80 105,38 106,16 105,99 106,81 107,48 106,75
Sumber / Source : Badan Pusat Statistik (BPS) Provinsi Sulawesi Barat / Statistic of Sulawesi Barat Province
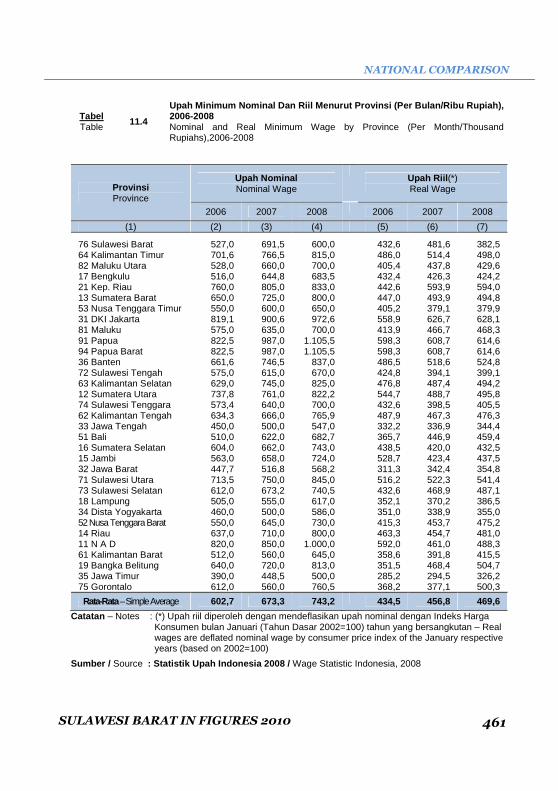
NATIONAL COMPARISON
SULAWESI BARAT IN FIGURES 2010 461
Tabel 11.4
Upah Minimum Nominal Dan Riil Menurut Provinsi (Per Bulan/Ribu Rupiah), 2006-2008
Table Nominal and Real Minimum Wage by Province (Per Month/Thousand Rupiahs),2006-2008
Provinsi Province
Upah Nominal Nominal Wage
Upah Riil(*) Real Wage
2006 2007 2008 2006 2007 2008
(1) (2) (3) (4) (5) (6) (7)
76 Sulawesi Barat 527,0 691,5 600,0 432,6 481,6 382,5 64 Kalimantan Timur 701,6 766,5 815,0 486,0 514,4 498,0 82 Maluku Utara 528,0 660,0 700,0 405,4 437,8 429,6 17 Bengkulu 516,0 644,8 683,5 432,4 426,3 424,2 21 Kep. Riau 760,0 805,0 833,0 442,6 593,9 594,0 13 Sumatera Barat 650,0 725,0 800,0 447,0 493,9 494,8 53 Nusa Tenggara Timur 550,0 600,0 650,0 405,2 379,1 379,9 31 DKI Jakarta 819,1 900,6 972,6 558,9 626,7 628,1 81 Maluku 575,0 635,0 700,0 413,9 466,7 468,3 91 Papua 822,5 987,0 1.105,5 598,3 608,7 614,6 94 Papua Barat 822,5 987,0 1.105,5 598,3 608,7 614,6 36 Banten 661,6 746,5 837,0 486,5 518,6 524,8 72 Sulawesi Tengah 575,0 615,0 670,0 424,8 394,1 399,1 63 Kalimantan Selatan 629,0 745,0 825,0 476,8 487,4 494,2 12 Sumatera Utara 737,8 761,0 822,2 544,7 488,7 495,8 74 Sulawesi Tenggara 573,4 640,0 700,0 432,6 398,5 405,5 62 Kalimantan Tengah 634,3 666,0 765,9 487,9 467,3 476,3 33 Jawa Tengah 450,0 500,0 547,0 332,2 336,9 344,4 51 Bali 510,0 622,0 682,7 365,7 446,9 459,4 16 Sumatera Selatan 604,0 662,0 743,0 438,5 420,0 432,5 15 Jambi 563,0 658,0 724,0 528,7 423,4 437,5 32 Jawa Barat 447,7 516,8 568,2 311,3 342,4 354,8 71 Sulawesi Utara 713,5 750,0 845,0 516,2 522,3 541,4 73 Sulawesi Selatan 612,0 673,2 740,5 432,6 468,9 487,1 18 Lampung 505,0 555,0 617,0 352,1 370,2 386,5 34 Dista Yogyakarta 460,0 500,0 586,0 351,0 338,9 355,0 52 Nusa Tenggara Barat 550,0 645,0 730,0 415,3 453,7 475,2 14 Riau 637,0 710,0 800,0 463,3 454,7 481,0 11 N A D 820,0 850,0 1.000,0 592,0 461,0 488,3 61 Kalimantan Barat 512,0 560,0 645,0 358,6 391,8 415,5 19 Bangka Belitung 640,0 720,0 813,0 351,5 468,4 504,7 35 Jawa Timur 390,0 448,5 500,0 285,2 294,5 326,2 75 Gorontalo 612,0 560,0 760,5 368,2 377,1 500,3
Rata-Rata – Simple Average 602,7 673,3 743,2 434,5 456,8 469,6
Catatan – Notes : (*) Upah riil diperoleh dengan mendeflasikan upah nominal dengan Indeks Harga Konsumen bulan Januari (Tahun Dasar 2002=100) tahun yang bersangkutan – Real wages are deflated nominal wage by consumer price index of the January respective years (based on 2002=100)
Sumber / Source : Statistik Upah Indonesia 2008 / Wage Statistic Indonesia, 2008
SEKILAS TENTANG BPS
Sekilas Tentang BPS
Badan Pusat Statistik adalah lembaga pemerintah dan non departemen yang berada di bawah dan bertanggung jawab kepada Presiden. Sesuai dengan UU No. 16 Tahun 1997 tentang Statistik, BPS adalah lembaga vertikal dan memiliki perwakilan di setiap ibukota Propinsi/Kabupaten/Kota. Sedangkan di setiap Kecamatan paling tidak terdapat seorang Koordinator Statistik yang bertanggung jawab dalam pengumpulan data statistik di wilayahnya.
Meurut UU tentang Statistik, Statistik dikelompokkan menjadi 3 jenis :
1. Statistik Dasar, adalah statistik yang pemanfaatannya ditujukan untuk keperluan yang bersifat luas, baik bagi pemerintah maupun masyarakat, yang memiliki ciri-ciri lintas sektoral, berskala nasional, makro dan yang penyelenggaraannya menjadi tanggung jawab BPS.
2. Statistik Sektoral, adalah statistik yang pemanfaatannya ditujukanuntuk memenuhi kebutuhan instansi tertentu dalam rangka penyelenggaraan tugas-tugas pemarintahan dan pembangunan yang merupakan tugas pokok instansi yang bersangkutan.
3. Statistik Khusus, adalah statistik yang pemanfaatannya ditujukan untuk memenuhi kebutuhan spesifikm dunia usaha, pendidikan, sosial budaya dan kepentingan lain dalam kehidupan masyarakat, yang penyelenggaraannya dilakukan oleh lembaga, organisasi, perorangan dan atau unsur masyarakat lainnya.
About BPS
Badan Pusat Statistik (BPS-Statistics Indonesia) is a Non-Departemental Goverment Institution which directly responsible to the President. As satted in Law number 16,1997 on statistics BPS is a vertical institution, with its branches spread out in all province/regencies/ municipalities. In each sub-district, there is at least one Statistics Coordinator who responsible for collecting and gathering statistical data from that area.
Based on law on statistics, statistical data are classified into the following types:
1. Basic Statistics, are statistic utilised for a broad range of both government and community purposes, which have cross sectoral characteristics, on a national and macro scale, and will be the responsibility of BPS for collecting the data.
2. Sectoral Statistics, are statistics utilised to satisfy the needs of particular institution in an effort to perform the duties of the administration and development, as the primary duty of the related institution.
3. Special Statistics, are statistics utilised to fulfil the specific needs of business, education, socioculture and community interests, undertaken by non government institutions, organizations, individual and/or other parts of the community.

SEKILAS TENTANG BPS
Data BPS
BPS sebagai badan penyedia informasi statistik untuk keperluan pemerintah, swasta dan masyarakat, berusaha memenuhi kebutuhan data tersebut. Data yang tersedia di BPS meliputi data pertanian, komunikasi, indeks harga konsumen, pengeluaran dan konsumsi, konstruksi, energi, perdagangan luar negeri, pertambangan, keuangan, penduduk, pariwisata, transportasi, pendapatan dan indeks harga. Layanan BPS BPS menghasilkan keragaman data statistik baik sosial maupun ekonomi, yang dimanfaatkan baik oleh pemerintah, dunia usaha maupun masyarakat umum. Informasi dikemas baik dalam bentuk media cetak seperti buku, maupun media elektronik seperti publikasi elektronik dan internet. Untuk memenuhi kebutuhan statistik yang amat beragam, BPS dapat menyediakan informasi yang disesuaikan dengan kebutuhan pengguna data.
Selain itu, beberapa ragam layanan lainnya yang dapat diberikan antara lain : 1. Perencanaan survey, sampling maupun
perancangan kuisioner 2. Pelatihan statistik dan komputer 3. Konsultasi statistik Kontak BPS Produk BPS dapat diperoleh baik di BPS Pusat maupun perwakilan BPS di setiap ibukota Propinsi/Kabupaten/Kota di seluruh Indonesia.
BPS Data BPS as a statistical information provider for government, private institurtions and community has been trying to fulfil those information needs. Various statistical data are available at BPS, such as data on agriculture, communication, consumption expenditure, construction, energy, foreign trade, mining, finance, population, tourism, transportation, income, consumer price index and other price indiches. BPS Services BPS produces various statistical data on social and economic, which has been used widely by government, private institution and community. The data are presented in both hard copy such as regular publication books, and soft copy such as soft copy publications and internet. In order to fulfil a various range of statistical data requirement BPS could provide the information in any format (which is not available in the standard publication), as required by data users (as long as the required information is available in the raw data set).
Besides that, BPS provides other services, such as undertaking: 1. survey planning, sampling methodology
or requestionnaire design 2. traning on computer and statistics 3. consultations on statistic
BPS Contacts All product of BPS could be obtained at BPS central office or BPS branches at all provinces/Regencies/Municipalities in Indonesia