kathmandu, nepal, september 23-26, 2009 - iariw neto.pdf · analysis of the system of national...
TRANSCRIPT

Session Number: Session 5a (Parallel)
Time: Thursday, September 24, 16:00-17:30
Paper Prepared for the Special IARIW-SAIM Conference on
―Measuring the Informal Economy in Developing Countries‖
Kathmandu, Nepal, September 23-26, 2009
Sector and Informal Employment in Brazil
João Hallak Neto; Katia Namir; Luciene Rodrigues Kozovits, Instituto Brasileiro de
Geograhia e Estatisgticas – IBGE, Rio de Janeiro
This paper is posted on the following website: http://www.iariw.org

2
Sector and Informal Employment in Brazil:
Analysis of the System of National Accounts New Series Results (2000/2006)
João Hallak Neto ([email protected])
Katia Namir ([email protected])*
Luciene Kozovits ([email protected])*
Introduction
In March 2007, the Brazilian Institute of Geography and Statistics (in Portuguese:
Instituto Brasileiro de Geografia e Estatística - IBGE) released the results of the new series
of the Brazilian System of National Accounts (in Portuguese, Sistema de Contas Nacionais do
Brasil - SCN) - reference 2000. The new reformulation of the Brazilian National Accounts
was not motivated by a conceptual change in the system in contrast to the earlier one released
in late 1997. Its main purpose was to incorporate all available data from the new statistics
system together with some methodological improvement and a new classification of products
and activities. The system continues being calculated with basis on a sequence of
interconnected accounts and supply and use tables.
The main change to then current series was the introduction of new statistical sources
such as IBGE‗s annual economic surveys comprising Mining and Manufacturing Industries,
Construction, Wholesale and Retail Trade, and Services. Also incorporated into the system
are household surveys such as the Consumer Expenditure Survey, the National Household
Sample Survey, and the Urban Informal Economy.1 Additionally, the annual information from
Analysts of the National Accounts Coordination of Brazilian Institute of Geography and Statistics (Instituto
Brasileiro de Geografia e Estatísticas - IBGE). The authors would like to thank Roberto Olinto for his valuable
comments and criticism. The views presented in the paper are those of the authors, and remaining errors are their
responsibility. 1 The National Household Sample Survey has an annual periodicity. The Consumer Expenditure Survey and the
Urban Informal Economy have an irregular periodicity of around five years. The latest ones available that were
used in the new series of the Brazilian System of National Accounts were both from 2003.

3
other institutions started to integrate the system database such as the Declaration of
Economic-Legal Information of Corporations obtained from the Federal Revenue Secretariat
and companies‘ yearly statements provided by regulatory agencies. This set of information
enhances the quality of the SNA as it allows the existence of yearly structural benchmarks for
its results encompassing not only the base year but also current years.
One other consideration about the changes incorporated into the SCN refers to the
update of concepts and definitions in accordance with the latest recommendations of
international organisms2. The introduction of new data sources and methodological changes in
the Brazilian System of National Accounts allows a greater detailing of the gross domestic
product components with a view to both goods and services produced by economic activities
and the allocation and distribution of income by institutional sectors.
Regarding this segment, the advances made in measuring the institutional sector
households in the identification and the disaggregation of Non-profit Institutions Serving
Households (NPISHs) and the transfer of agriculture corporations and micro-enterprises to the
Non-financial Corporations Sector made it possible to improve the analysis of the Households
sector as a whole, and its subdivisions, mainly the informal sector.
The main goal of this paper is to initially measure the Brazilian informal sector in
view of the new opportunities for analysis that formed the basis of this review series, which
being itself new, is still rather little explored. The proposed measurement of the informal
sector, in turn, makes it an indispensable preliminary discussion of the conceptual differences
between the production sector and informal employment, thus presenting the main
methodological aspects of the discussions within the range of the International Labor
Organization (ILO), and also considering the recently published review of the international
handbook of national accounts, held by the United Nations Organization together with the
International Commission of European Communities, the International Monetary Fund, the
Organization for Economic Cooperation and Development, and the World Bank at the end of
last year (SNA, 2008).
Thus the results concerning the generation of value added and number of jobs by
production sector and type of employment in Brazil are presented between the years 2000 and
2 Some new tax classifications, the change in volume indices for public administration activity and for financial
activities, and the measuring of labor factor by jobs instead of by occupied persons. Details about specific
revisions of the SNA new series are found in the 25 methodological notes available on the IBGE website:
www.ibge.gov.br/home/estatistica/economia/contasnacionais/referencia2000/2005/default_SCN.shtm.

4
2006. The database used was the new series of the Brazilian SNA, the reference year is 2000
and the available data cover the period noted.
The study is divided into four sections besides this introduction. The first section
focuses on the theoretical concept of the informal sector and informal employment in the
context of the discussions held in the ILO since the 1970s. Following, in Section 2, a brief
description of the concepts of productive sector and employment adopted by the Brazilian
SNA is made to support the analysis of results presented in Section 3. Final considerations are
found in the last section.
1. The concept of informal sector and its relationship with informal employment
The term informal sector was first identified in studies aimed at the World
Employment Program conducted by the ILO since the early seventies. The report on
employment, income and equality to Kenya has become a touchstone for discussions of the
concept of the informal sector and had great influence on subsequent works carried out by the
ILO in African and Asian countries (ILO, 1972). The debate continued with works carried out
for the Regional Employment Program for Latin America and the Caribbean and other
missions, being considered that from this framework a wide academic and technical
production has highlighted the issue (Cacciamali, 1983).
The report on employment for Kenya was pioneer in recognizing the informal sector
as a source of job opportunities and income for many people, despite often being regarded as
unproductive and stagnant and not obtaining the government support that is traditionally
allocated to various firms in the formal sector. Taking these aspects into account, the report
proposes a positive attitude of the government in order to promote public policies directed to
this sector3. Therefore, the term informal sector was first linked to the mode of organization of
the production unit in a program that had among its main objectives ―the proposal for research
on strategies for economic development that had as the key variable the creation of jobs
instead of a rapid product growth.‖ (Cacciamali, 1983).
The different objectives and characteristics of each country contributed to not having
an agreement on the concept of informal economy. According to Rocha (1989), this fact led to
the development of other approaches during the seventies such as the production structure and
3 With this regard, see recommendations for reaching this goal in ILO (1972).

5
the labor market. Cacciamalli (2000) moves on to recognize that the use of the term for
describing informal sector workers and owners of micro and small production units presenting
work and capital relations precariously bounded also allowed multiple approaches and
different objects of study such as micro enterprises and own-account jobs, among others.
From the perspective of the production structure there are two different concepts of
informal sector. One ―arises from the notion of a company as regards its legal and
administrative structure and it assumes that there is an intrinsic relationship between the non-
registration and the notion of informality‖ (OECD, 2002). The other recognizes the informal
sector as a particular way of production and defines it as the way in which businesses are
organized and run their activities. This concept ensures that the informal sector is not the
unregistered sector and assumes non-registration as a characteristic of the informal sector and
not as a criterion to define it (OECD, 2002).
In 1993, during the Fifteenth International Conference of Labor Statisticians (15th
ICLS), the ILO adopted an international definition for the informal sector from the operation
and organization of production units. The Statistics Resolution on Employment in the
Informal Sector (ILO, 1993) recommended that countries where this sector played an
important role as source of employment and income and as a factor of economic and social
development should introduce an employment information system to the informal sector4. The
improvement of these statistics was considered strategic enough to render the development of
public policies more effective to the informal sector.
Furthermore, the resolution incorporated the concept of the informal sector as part of
the institutional sector households in the SNA and classified the production units of the
informal sector into two components. The first includes the informal business of self-
employed people. The second refers to the enterprises of informal employers5. Subsequently,
this ILO document was included in the International Handbook of National Accounts -
System of National Accounts, published in 1993 (SNA-93) - Chapter 4, encompassing units
and institutional sectors. According to Hussmanns (2004), the inclusion of the definition of
the informal sector in the SNA-93, ―was considered essential as it would make it possible to
identify the informal sector separately in the accounts and, hence, to quantify the contribution
of the informal sector to the gross domestic product."
4 It must be highlighted that the question of labor in this resolution had its allocation limited to the production
sector. Thus labor in the informal sector refers to people who were employed in production units of that sector. 5 These enterprises are household production units which belong to and are managed by individual employers or
in association with others and who hire one or more workers in a continuous mode. The household production
units are in turn recognized by the SNA as distinct from incorporated firms. They undertake the production of
goods and services and do not constitute legal entities seen as distinct and independent from household members.

6
This definition of informal sector in the 15th ICLS admitted both dimensions
considered in the production structure approach by allowing that both the non-registration and
the size of the business be used as a criterion for distinguishing enterprises in the informal
sector from all others.
As to the questions concerning the labor market specifically, as it limits itself to
employment in the informal sector, the 1993 ILO resolution introduces further discussions
regarding the construction of an analytical category for the issue of informality in the labor
market6.
In Brazil, for example, Ramos (2001) explored labor market evolution in the period
between 1991 and 2001, whereby he presented an indicator named ―the degree of informality‖
to describe the rate of ―workers who are employed without legal contracts or self-employed
out of the total of employees‖ in six Brazilian metropolitan regions. On the other hand,
Menezes-Filho, Mendes, and Almeida (2004) investigating differences in wages between
formal and informal sectors considered the contribution to the welfare office or the legal
hiring as a criterion to define these sectors. Saboia (2004) also uses a similar definition for a
regional analysis of informal employment based on Population Census 2000.
In 2003, during the 17th ICLS, the ILO released new guidelines that complemented
the 1993 resolution on employment in the informal sector, including the notion of informal
economy and the adoption of a definition of informal employment. Thus, once more it was
agreed that when it regards the informal sector the perspective of production units is
considered (enterprise approach) whereas employment is associated with the characteristics of
either the persons involved in the activities or of their jobs (labor approach).
According to the 17th ICLS, the types of link to work that are considered in informal
employment are: own-account workers and employers owning unincorporated enterprises
with employees; family members contributing labor to enterprise without a formal contract of
employment; employees in the same circumstances, i.e. the employment relationship is not
under national labor legislation and social protection; members of informal producers
cooperatives; and own-account workers engaged in the production of goods exclusively for
own final household use.
The definition of informal labor presented by the 17th ICLS represents a considerable
advance inasmuch as it includes as informal employment all the types of link to work
6 See Mata Greenwood (2002) and Hussmanns (2004).

7
described above, irrespective of the type of production unit where they are found, whether
formal, informal or other household units (ILO, 2003).
The Employment Matrix reproduced below illustrates the possibilities of employment
in the sectors and their classification as either formal or informal employment. This table was
originally presented by the ILO for publication in 2002, Decent Work and the Informal
Economy (ILO, 2002) and it is also present in the aforementioned revision of the Manual of
National Accounts (SNA 2008).
FIGURE 1
Employment matrix proposed by the 17th ICLS
(*) Excluding households employing paid domestic workers.
(**) Households producing goods exclusively for their own final use and families who employ paid domestic workers.
Cells 1 to 6 and 8 to 10: informal employment;
Cells 3 to 8: employment in the informal sector;
Cells 1, 2, 9 and10: informal employment outside the informal sector;
Cells hatched: formal employment;
Cells in gray: there are no jobs in the production units.
Source: Hussmanns (2004), "Statistical definition of informal employment: Guidelines endorsed by the 17th ICLS (2003)
Therefore, according to the 17th ICLS recommendations, employment in the informal
sector includes the cases represented in cells 3 to 8 above, i.e. in the row referring to informal
sector enterprises. Informal employment, in turn, covers cells 3 to 6 and 8. Cells 1, 2, 9 and 10
represent arrangements in informal labor in production units other than the informal ones.
Contributing
family
workers
Informal Formal Informal Formal Informal Informal Formal Informal Formal
Formal sector
units1 2
Informal sector
units*3 4 5 6 7 8
Other household
units **9 10
Production units
by type
Members of
producers’
cooperatives
EmployeesOwn-account
workersEmployers

8
2. Sector and employment in the Brazilian System of National Accounts
The methodology adopted by the Brazilian System of National Accounts incorporates
the new international recommendations for calculation of aggregates for both production
sector and employment. The classification of sector is related to the organizational form of
production units whereas labor approach is concerned with the qualifications of the job link.
The value added according to the production sectors (formal, informal and other
household units) is based on the classification of the SNA by institutional sector. SNA-93
(and also SNA-2008) defines each institutional sector as a set of institutional units that have
similar key functions, behavior and objectives. These in turn are defined as economic entities
that are capable, in their own right, of owning assets, incurring liabilities and engaging in
economic activities and in transactions with other entities. For SNA purposes, such units are
organized into five main institutional sectors: non-financial corporations, financial
corporations, non-profit institutions serving households (NPISHs), general government, and
households.
The first four institutional sectors are specific social or legal entities which are
recognized by law. In the case of Brazil, the units that make up these institutional sectors have
registration in the National Register of Legal Entities, the official public revenue organ, and
may be considered constituents of the formal sector of the economy.
Although the SNA does not use the term "formal sector," it is not difficult to conceive
of all units in the Corporations sector, General Government, and NPISHs as being part of it,
as mentioned in the recent revision of the manual in paragraph 25.53 (SNA, 2008).
The Households institutional sector includes units of consumption and production.
SNA-93 defines household as a small group of persons who share the same living
accommodation, who pool some, or all, of their income and wealth and who consume certain
types of goods and services collectively, mainly housing and food. This sector includes
production units consisting of self-employed workers and employers of unincorporated
enterprises. The expression "unincorporated enterprises‖ underlines the fact that the
production unit is not a independent legal entity separated from the household members who
own them.
The owner has a dual role, acting as both an entrepreneur responsible for creating the
enterprise and as an employee that can be engaged in any kind of productive activity, namely:
agriculture, mining, manufacturing, construction, retail distribution or the production of other
9
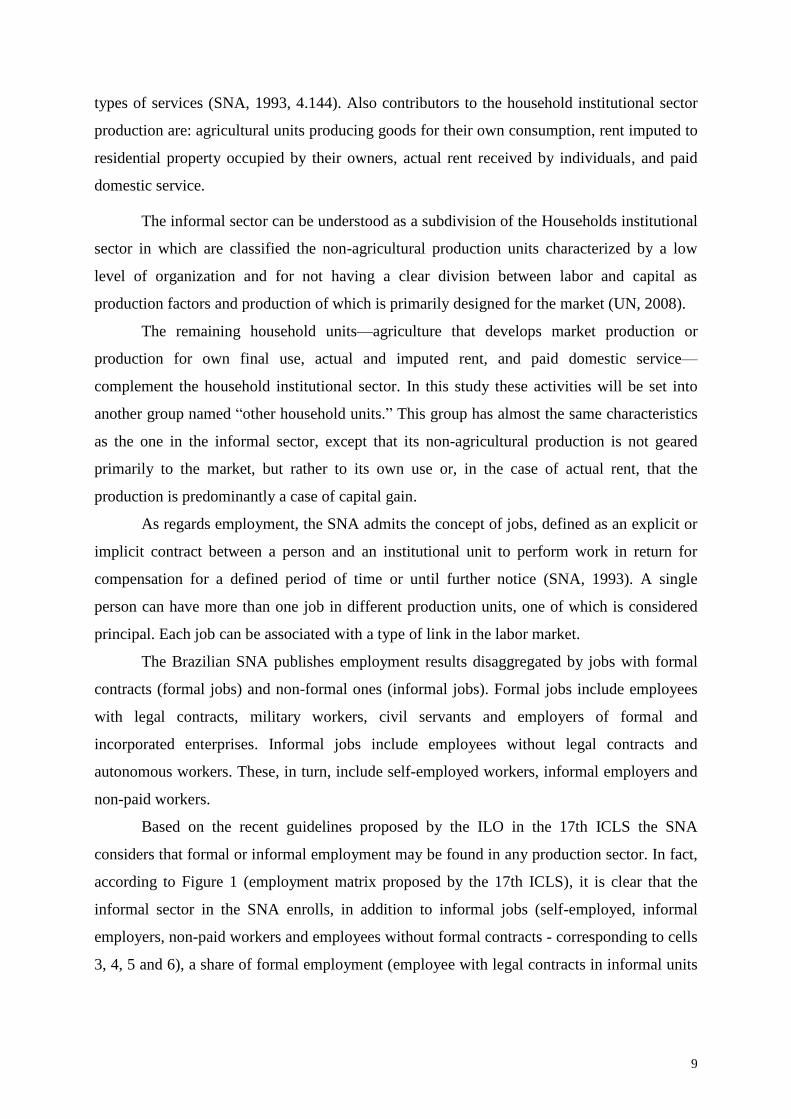
types of services (SNA, 1993, 4.144). Also contributors to the household institutional sector
production are: agricultural units producing goods for their own consumption, rent imputed to
residential property occupied by their owners, actual rent received by individuals, and paid
domestic service.
The informal sector can be understood as a subdivision of the Households institutional
sector in which are classified the non-agricultural production units characterized by a low
level of organization and for not having a clear division between labor and capital as
production factors and production of which is primarily designed for the market (UN, 2008).
The remaining household units—agriculture that develops market production or
production for own final use, actual and imputed rent, and paid domestic service—
complement the household institutional sector. In this study these activities will be set into
another group named ―other household units.‖ This group has almost the same characteristics
as the one in the informal sector, except that its non-agricultural production is not geared
primarily to the market, but rather to its own use or, in the case of actual rent, that the
production is predominantly a case of capital gain.
As regards employment, the SNA admits the concept of jobs, defined as an explicit or
implicit contract between a person and an institutional unit to perform work in return for
compensation for a defined period of time or until further notice (SNA, 1993). A single
person can have more than one job in different production units, one of which is considered
principal. Each job can be associated with a type of link in the labor market.
The Brazilian SNA publishes employment results disaggregated by jobs with formal
contracts (formal jobs) and non-formal ones (informal jobs). Formal jobs include employees
with legal contracts, military workers, civil servants and employers of formal and
incorporated enterprises. Informal jobs include employees without legal contracts and
autonomous workers. These, in turn, include self-employed workers, informal employers and
non-paid workers.
Based on the recent guidelines proposed by the ILO in the 17th ICLS the SNA
considers that formal or informal employment may be found in any production sector. In fact,
according to Figure 1 (employment matrix proposed by the 17th ICLS), it is clear that the
informal sector in the SNA enrolls, in addition to informal jobs (self-employed, informal
employers, non-paid workers and employees without formal contracts - corresponding to cells
3, 4, 5 and 6), a share of formal employment (employee with legal contracts in informal units

10
- cell 7). On the other hand, parts of informal employment are also found both in formal sector
and other household units.
In line with the conceptual framework approached, below are presented the results
related to production sectors and kinds of employment found in the Brazilian economy.
3. Results
This section presents the results of the gross value added disaggregated by the three
production sectors proposed above, namely: formal, informal, and other household units as
well as the employment composition in Brazil in recent years.
The selected data were obtained from the Brazilian SNA (SCN) publication which
allows calculating the informal sector contribution in terms of value output or gross value
added7 in relation to other economic sectors and also the employment by types of links in the
labor market. The informal employment measurement could also be obtained from other
sources such as household surveys. However, the use of SCN is preferable because it presents
a series with both annual periodicity and national coverage. Moreover, it enables crossing data
by production sectors and type of employment, in compliance with the ILO recommendation.8
The Brazilian informal sector analysis vis a vis other sectors was performed in the
period between 2000 and 2006. The evolution of these three sectors indicates that since the
start of the new series a reduction tendency has been observed in the rates of both informal
and other household units sectors in relation to the total economy gross value added (Table 1).
These sectors, which respectively represented 12.7% and 14.5% of the gross value added in
2000, have in a likewise manner fallen to 9.9% and 11.7% in 2006. Thus, the Households
institutional sector as a whole experienced a decrease from 27.2% to 21.6% in participation in
the economy‘s gross value added. Consequently, in the same period, the share of gross value
added in the formal sector rose from 72.8% to 78.4%.
Incentives like general credit expansion, especially to micro and small-sized
businesses, and measures to simplify and reduce taxes for these, must have contributed to the
7 Value added is the value of output less the value of intermediate consumption. It is a measure of contribution to
GDP made by an individual producer, industry or sector. 8 IBGE‘s Urban Informal Economy Survey, which aims at delimiting informal sector by using production units
as a starting point, is conducted at intervals of about five years and is restricted to urban regions alone.
Conversely, the National Household Sample Survey gives out labor data by types of job links although not
permitting their association with production units.
11
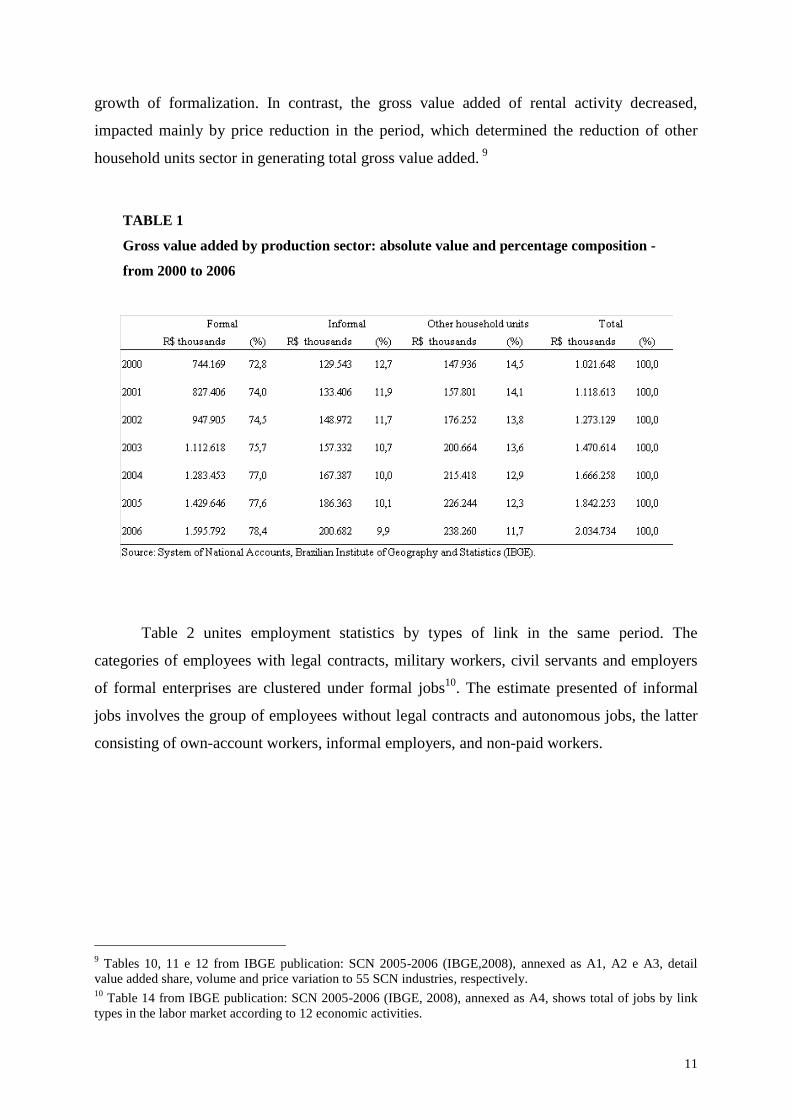
growth of formalization. In contrast, the gross value added of rental activity decreased,
impacted mainly by price reduction in the period, which determined the reduction of other
household units sector in generating total gross value added. 9
TABLE 1
Gross value added by production sector: absolute value and percentage composition -
from 2000 to 2006
Table 2 unites employment statistics by types of link in the same period. The
categories of employees with legal contracts, military workers, civil servants and employers
of formal enterprises are clustered under formal jobs10
. The estimate presented of informal
jobs involves the group of employees without legal contracts and autonomous jobs, the latter
consisting of own-account workers, informal employers, and non-paid workers.
9 Tables 10, 11 e 12 from IBGE publication: SCN 2005-2006 (IBGE,2008), annexed as A1, A2 e A3, detail
value added share, volume and price variation to 55 SCN industries, respectively. 10
Table 14 from IBGE publication: SCN 2005-2006 (IBGE, 2008), annexed as A4, shows total of jobs by link
types in the labor market according to 12 economic activities.
12
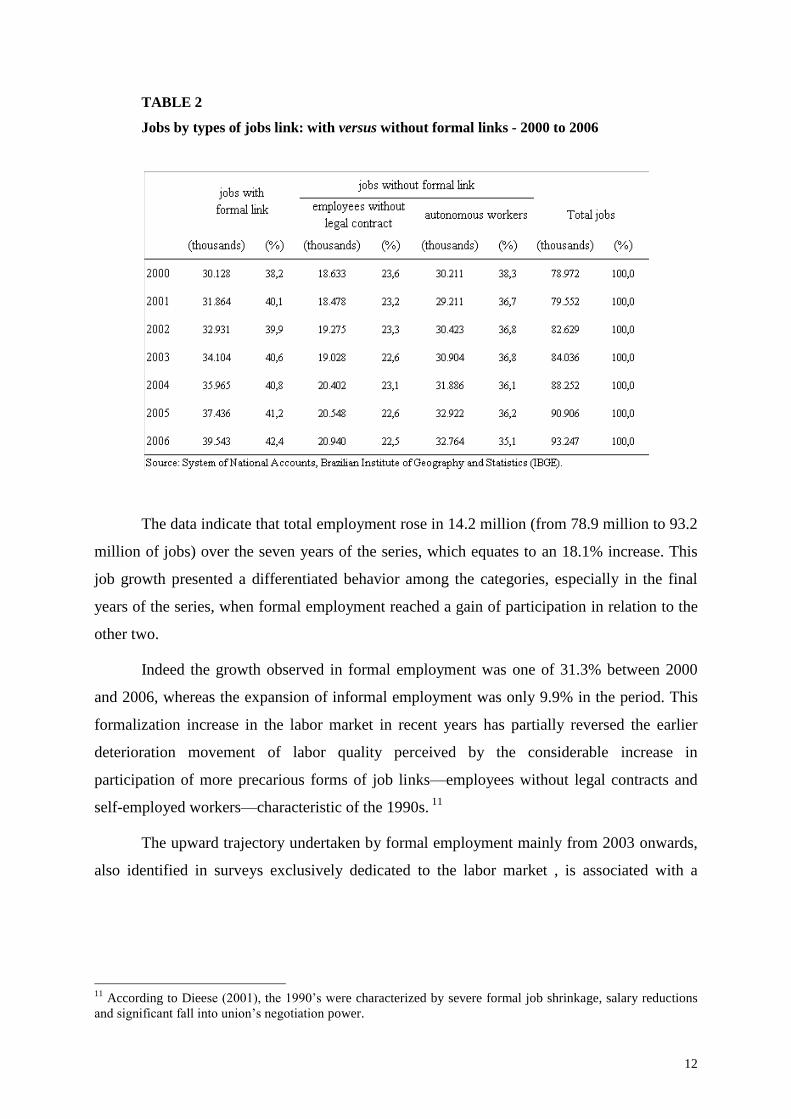
TABLE 2
Jobs by types of jobs link: with versus without formal links - 2000 to 2006
The data indicate that total employment rose in 14.2 million (from 78.9 million to 93.2
million of jobs) over the seven years of the series, which equates to an 18.1% increase. This
job growth presented a differentiated behavior among the categories, especially in the final
years of the series, when formal employment reached a gain of participation in relation to the
other two.
Indeed the growth observed in formal employment was one of 31.3% between 2000
and 2006, whereas the expansion of informal employment was only 9.9% in the period. This
formalization increase in the labor market in recent years has partially reversed the earlier
deterioration movement of labor quality perceived by the considerable increase in
participation of more precarious forms of job links—employees without legal contracts and
self-employed workers—characteristic of the 1990s. 11
The upward trajectory undertaken by formal employment mainly from 2003 onwards,
also identified in surveys exclusively dedicated to the labor market , is associated with a
11
According to Dieese (2001), the 1990‘s were characterized by severe formal job shrinkage, salary reductions
and significant fall into union‘s negotiation power.

13
relative increase in the use of labor force under legal contracts owing to the positive evolution
of the Brazilian economic activity in these years.12
The value added and employment results according to production sectors in 2006 are
presented in table 3. The simultaneous analysis of these data indicates that the informal sector
contributed 9.9% to value added generation and responded by using 27.2% of labor force in
Brazil. This figure shows the informal sector relevance in terms of labor absorption, a rather
common feature of developing countries. The other household units sector participation in
value added was 11.7% whereas in terms of jobs it was 22.3%. It was up to the formal sector
to account for almost half the existing jobs in the country (50.4%), despite the fact that it
showed much more significant weight in the generation of total value added (78.4%).
Table 3
Gross value added and employment according to production sector - 2006
The explanation for this significant share of the formal sector in value added, with less
use of jobs in relative terms, is related to the predominance of more productive capital and
labor factors in these units. This is so because the most dynamic industrial activities and the
ones that employ better skilled workers, such as some kinds of mining, metallurgic, chemical,
electricity, gas and water industries, are totally or mostly incorporated into the formal sector.
The value added distribution by jobs, a productivity proxy option (third column of
Table 3), shows that the outcome of the formal sector exceeds by more than four times the
one of informal sector (R$ 34.0 thousand to R$ 7.9 thousand for job, in 2006). The presented
12
According to the Labor Ministry, formal employment expansion reached 36.5% between 2000 and 2006.
According to IBGE‘s National Household Sample Survey, formal employment rose by 25,0% between 2001 and
2006. Cardoso Jr (2007) attributed this recent increase in formal jobs to the change in exchange policy in 1999.

14
lower result for informal units does not cause surprise. Firstly, the difference between the
economic activities incorporated in each sector must be considered. Secondly, it is broadly
recognized that informal enterprises owners have, in general, low education and very limited
access to credit, which considerably reduces potential production gains.13
Table 4 below is a simplification of the employment matrix as proposed by the 17th
ICLS, referred to in section 1. It allows a better visualization of the relationships among
variables and it consists an interesting resource for understanding different approaches by
production sector and types of jobs. The crossing adopted occurs among the three production
sectors and the three labor categories mentioned— jobs with legal contracts, jobs of
employees without legal contracts and autonomous workers. The first corresponds to formal
jobs whereas the other two correspond to informal jobs. The year chosen for the presentation
was 2006 because it is the last one available in the series.
TABLE 4
Distribution of the employment by types of job links according production
sectors - 2006
The bottom row of table 4 shows that out of the total 93 million jobs in 2006, 42.4%
was formal ones, 22.5% was related to jobs of employees without legal contracts, and 35.1%
to autonomous workers. The disaggregation of these job categories among production sectors
13
For characterizing the Brazilian urban informal sector, including disaggregation by economic activities, see
IBGE (2003). For analyzing the determinants to Brazilian micro-entrepreneurs results, see Fontes (2009).

15
revealed that almost all of the 25.4 million jobs in the informal sector (97.8%) did not have
legal contracts14
while only 2.2% had a formal job link.
This small share is represented by employees with legal contracts in informal units.
These data were obtained from the national social security that has a special register which
allows the employer to hire employees and collect social contributions without having a
corporate enterprise. The group is composed largely of workers in construction activities and
others related to health.
Unlike the informal sector where the vast majority of workers traditionally have
informal jobs, employment distribution by type of links in formal sector showed different
rates. In this sector, 21.7% of jobs were informal, and in most cases consisted of work of
employees without legal contracts and a small portion of autonomous work, specifically for
non-paid family members who pursued their activities in formally constituted companies. In
turn, the other household units sector that has the lowest number of jobs, registered 10.5% of
formal jobs, most of them consisting of paid domestic workers. As expected, other job
categories that correspond to self-employed individuals and informal employees pursued
activities in informal sector enterprises or other household units.
Final considerations
This study is mainly aimed at measuring the informal sector using as reference the
Brazilian SNA new series. It also discusses the differences between production sectors and
employment, from the conceptual and methodological approaches in the context of the ILO
discussions that were incorporated into a recent international review of the SNA (UN, 2008).
It must be understood that the sector classification regards the form of organization of
production units (enterprise approach) whereas the employment concept refers to the
characteristics of job links (labor approach). Understanding these conceptual distinctions has
enabled measuring these aggregates for the country using the system of national accounts new
series database for the period between 2000 and 2006.
The informal sector annual share results in value added were compared with those
obtained for the formal sector and for the remaining household institutional sector, herein
14
A greater number of these jobs are in activities involving construction, retail trade, and road transport, IBGE
(2008).

16
named other household units. The employment data, in turn, were disaggregated by type of
job links in the labor market in the same period.
The relations between production sectors and employment types, however, were
presented only for the last available year (2006), from a simplified model of employment
matrix proposed by the ILO. This choice was made in view of no major changes having been
detected in its composition along the series.
Firstly it was concluded that the informal sector had a gradual loss in gross value
added share in the economy along the series, moving from 12.7% to 9.9% between the years
2000 and 2006. The contrary movement was observed in the formal sector, which gained a
more significant participation in the same period (from 72.8% to 78.4% of gross value added).
From the employment viewpoint, it was confirmed the advance of the formal jobs in
relation to informal ones. The results showed that more than 9 million formal job links were
created between 2000 and 2006, which corresponded to an increase share from 38.2% to
42.4% in this category in total jobs.
As expected, analyzing the relationship between output and employment according
selected sectors in 2006 showed a reduced efficiency of work in informal sector due to its
small contribution in the value added generation (9.9%) in comparison with a significant
demand in labor—25 million jobs, i.e. 27.2% of total jobs in the economy. It was also verified
that 97.8% of employment in the informal sector is composed of jobs of employees without
legal contracts or by autonomous workers (informal jobs). On the other hand, formal sector
which accounts for about 47 million jobs had an employment distribution by less
homogeneous types of link, registering a significant frequency of informal employment,
expressed by 10.2 million jobs, or 21, 7% of jobs in the sector.
References
CACCIAMALI, M. C. (1983). Setor informal urbano e formais de participação na produção.
São Paulo, USP/IPE/FEA (Tese de doutorado).
CACCIAMALI, M. C. (2000). Globalização e processo de informalidade. Economia e
Sociedade, Campinas, (14): 153-174, jun, 2000.

17
CARDOSO Jr., J. C. (2007). De volta para o futuro? As fontes de recuperação do emprego
formal no Brasil e as condições para sua sustentabilidade temporal. Texto para
Discussão, nº 1310, IPEA, Brasília, nov.
DIEESE (2001). Mercado de trabalho no Brasil. In: A situação do trabalho no Brasil. São
Paulo.
FONTES, A.; PERO, V. (2009). Determinantes do desempenho dos microempreendedores no
Brasil. Seminário de Pesquisa, IE/UFRJ, jun.
HUSSMANNS, R. (2001). Informal sector and informal employment: elements of a
conceptual framework; Paper presented at the Fifth Meeting of the Expert Group on
Informal Sector Statistics (Delhi Group), New Delhi, 19-21 September.
HUSSMANNS, R. (2004). Measuring the informal economy: from employment in the
informal sector to informal employment. Working paper n 53. Geneva.
IBGE (2003). Economia Informal Urbana 2003. IBGE Rio de Janeiro: Instituto Brasileiro de
Geografia e Estatística, 2005.
IBGE (2006). Sistema de Contas Nacionais – Brasil – referência 2000. Rio de Janeiro: IBGE.
Nota metodológica nº 8: Setores institucionais. Disponível em:
http://www.ibge.gov.br/home/estatistica/economia/contasnacionais/referencia2000/2005
/default_SCN.shtm.
IBGE (2006). Sistema de Contas Nacionais – Brasil – referência 2000. Rio de Janeiro: IBGE.
Nota metodológica nº 23: Expansão da Produção. Disponível em:
http://www.ibge.gov.br/home/estatistica/economia/contasnacionais/referencia2000/2005
/default_SCN.shtm.
IBGE (2008). Sistema de Contas Nacionais – Brasil 2005-2006 / IBGE. Coordenação de
Contas Nacionais. Rio de Janeiro.
ILO (1972). Employment, incomes and equality in Kenya. International Labour Office,
Geneva.
ILO (2000). Resolution concerning statistics of employment in the informal sector, adopted
by the Fifteenth International Conference of Labour Statisticians (January 1993); in:
Current International Recommendations on Labour Statistics, 2000 Edition;
International Labour Office, Geneva.

18
ILO (2002). Decent Work and the Informal Economy; Report of the Director-General;
International Labour Conference, 90th Session; Report VI; International Labour Office,
Geneva.
ILO (2003). Guidelines concerning a statistical definition of informal employment, endorsed
by the Seventeenth International Conference of Labour Statisticians (November-
December 2003) in: Seventeenth International Conference of Labour Statisticians
(Geneva, 24 November - 3 December 2003), Report of the Conference.
MATA-GREENWOOD. A.; HOFFMANN, E. (2002). Developing a conceptual framework
for a typology of atypical forms of employment: Outline of a strategy; Invited paper
prepared for the Joint UNECE-Eurostat-ILO Seminar on Measurement of the Quality of
Employment, Geneva, 27-29 May.
MENEZES FILHO, N. A.; MENDES, M.; ALMEIDA, E. S. (2004). O diferencial de salários
formal-informal no Brasil: segmentação ou viés de seleção? Revista Brasileira de
Economia, vol. 58, nº 2. Rio de Janeiro, Abril-Junho de 2004.
SABOIA, J.; SABOIA, A. L. (2004). Caracterização do Setor Informal a partir dos Dados do
Censo Demográfico do Brasil de 2000. In: Política Geral de Emprego: Necessidades,
Opções, Prioridades, Brasilia. Trabalho Decente. Brasilia : OIT, 2004. v. 1.
United Nations (2007). System of National Accounts 1993 [SNA-93]. Rev. 4. New York:
United Nations. Disponível em: http://unstats.un.org/unsd/sna1993/introduction.asp
United Nations (2008). System of National Accounts 2008 [SNA-2008]. Pre-edit white-cover
version of the 2008 SNA. New York: United Nations. Disponível em:
http://unstats.un.org/unsd/sna1993/draftingphase/volume1and2.asp
19
Appendix
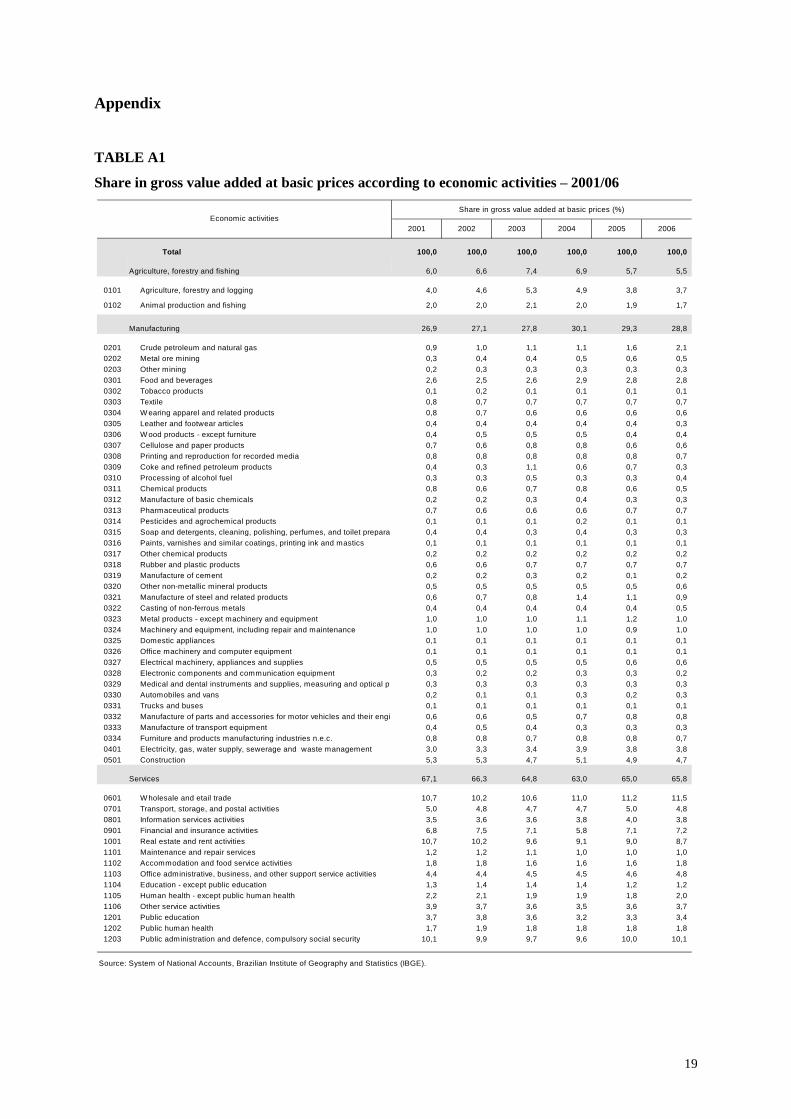
TABLE A1
Share in gross value added at basic prices according to economic activities – 2001/06
Share in gross value added at basic prices (%)
2001 2002 2003 2004 2005 2006
Total 100,0 100,0 100,0 100,0 100,0 100,0
Agriculture, forestry and fishing 6,0 6,6 7,4 6,9 5,7 5,5
0101 Agriculture, forestry and logging 4,0 4,6 5,3 4,9 3,8 3,7
0102 Animal production and fishing 2,0 2,0 2,1 2,0 1,9 1,7
Manufacturing 26,9 27,1 27,8 30,1 29,3 28,8
0201 Crude petroleum and natural gas 0,9 1,0 1,1 1,1 1,6 2,1
0202 Metal ore mining 0,3 0,4 0,4 0,5 0,6 0,5
0203 Other mining 0,2 0,3 0,3 0,3 0,3 0,3
0301 Food and beverages 2,6 2,5 2,6 2,9 2,8 2,8
0302 Tobacco products 0,1 0,2 0,1 0,1 0,1 0,1
0303 Textile 0,8 0,7 0,7 0,7 0,7 0,7
0304 W earing apparel and related products 0,8 0,7 0,6 0,6 0,6 0,6
0305 Leather and footwear articles 0,4 0,4 0,4 0,4 0,4 0,3
0306 W ood products - except furniture 0,4 0,5 0,5 0,5 0,4 0,4
0307 Cellulose and paper products 0,7 0,6 0,8 0,8 0,6 0,6
0308 Printing and reproduction for recorded media 0,8 0,8 0,8 0,8 0,8 0,7
0309 Coke and refined petroleum products 0,4 0,3 1,1 0,6 0,7 0,3
0310 Processing of alcohol fuel 0,3 0,3 0,5 0,3 0,3 0,4
0311 Chemical products 0,8 0,6 0,7 0,8 0,6 0,5
0312 Manufacture of basic chemicals 0,2 0,2 0,3 0,4 0,3 0,3
0313 Pharmaceutical products 0,7 0,6 0,6 0,6 0,7 0,7
0314 Pesticides and agrochemical products 0,1 0,1 0,1 0,2 0,1 0,1
0315 Soap and detergents, cleaning, polishing, perfumes, and toilet preparations 0,4 0,4 0,3 0,4 0,3 0,3
0316 Paints, varnishes and similar coatings, printing ink and mastics 0,1 0,1 0,1 0,1 0,1 0,1
0317 Other chemical products 0,2 0,2 0,2 0,2 0,2 0,2
0318 Rubber and plastic products 0,6 0,6 0,7 0,7 0,7 0,7
0319 Manufacture of cement 0,2 0,2 0,3 0,2 0,1 0,2
0320 Other non-metallic mineral products 0,5 0,5 0,5 0,5 0,5 0,6
0321 Manufacture of steel and related products 0,6 0,7 0,8 1,4 1,1 0,9
0322 Casting of non-ferrous metals 0,4 0,4 0,4 0,4 0,4 0,5
0323 Metal products - except machinery and equipment 1,0 1,0 1,0 1,1 1,2 1,0
0324 Machinery and equipment, including repair and maintenance 1,0 1,0 1,0 1,0 0,9 1,0
0325 Domestic appliances 0,1 0,1 0,1 0,1 0,1 0,1
0326 Office machinery and computer equipment 0,1 0,1 0,1 0,1 0,1 0,1
0327 Electrical machinery, appliances and supplies 0,5 0,5 0,5 0,5 0,6 0,6
0328 Electronic components and communication equipment 0,3 0,2 0,2 0,3 0,3 0,2
0329 Medical and dental instruments and supplies, measuring and optical products 0,3 0,3 0,3 0,3 0,3 0,3
0330 Automobiles and vans 0,2 0,1 0,1 0,3 0,2 0,3
0331 Trucks and buses 0,1 0,1 0,1 0,1 0,1 0,1
0332 Manufacture of parts and accessories for motor vehicles and their engines 0,6 0,6 0,5 0,7 0,8 0,8
0333 Manufacture of transport equipment 0,4 0,5 0,4 0,3 0,3 0,3
0334 Furniture and products manufacturing industries n.e.c. 0,8 0,8 0,7 0,8 0,8 0,7
0401 Electricity, gas, water supply, sewerage and waste management 3,0 3,3 3,4 3,9 3,8 3,8
0501 Construction 5,3 5,3 4,7 5,1 4,9 4,7
Services 67,1 66,3 64,8 63,0 65,0 65,8
0601 W holesale and etail trade 10,7 10,2 10,6 11,0 11,2 11,5
0701 Transport, storage, and postal activities 5,0 4,8 4,7 4,7 5,0 4,8
0801 Information services activities 3,5 3,6 3,6 3,8 4,0 3,8
0901 Financial and insurance activities 6,8 7,5 7,1 5,8 7,1 7,2
1001 Real estate and rent activities 10,7 10,2 9,6 9,1 9,0 8,7
1101 Maintenance and repair services 1,2 1,2 1,1 1,0 1,0 1,0
1102 Accommodation and food service activities 1,8 1,8 1,6 1,6 1,6 1,8
1103 Office administrative, business, and other support service activities 4,4 4,4 4,5 4,5 4,6 4,8
1104 Education - except public education 1,3 1,4 1,4 1,4 1,2 1,2
1105 Human health - except public human health 2,2 2,1 1,9 1,9 1,8 2,0
1106 Other service activities 3,9 3,7 3,6 3,5 3,6 3,7
1201 Public education 3,7 3,8 3,6 3,2 3,3 3,4
1202 Public human health 1,7 1,9 1,8 1,8 1,8 1,8
1203 Public administration and defence, compulsory social security 10,1 9,9 9,7 9,6 10,0 10,1
Source: System of National Accounts, Brazilian Institute of Geography and Statistics (IBGE).
Economic activities

20

21
TABLE A2
Gross value added at basic prices volume variation according to economic activities – 2001/06
Gross value added at basic prices volume variation (%)
2001 2002 2003 2004 2005 2006
Total 1,4 3,1 1,2 5,6 3,0 3,7
Agriculture, forestry and fishing 6,1 6,6 5,8 2,3 0,3 4,5
0101 Agriculture, forestry and logging 7,8 8,6 6,9 2,4 (-) 0,5 5,3
0102 Animal production and fishing 2,9 2,7 3,3 2,2 2,3 2,9
Manufacturing (-) 0,6 2,1 1,3 7,9 2,1 2,3
0201 Crude petroleum and natural gas 5,5 16,5 3,9 (-) 1,9 11,7 3,6
0202 Metal ore mining (-) 2,0 1,3 8,5 15,3 12,5 9,1
0203 Other mining (-) 4,7 4,8 2,3 13,4 (-) 3,8 (-) 0,3
0301 Food and beverages 7,8 5,9 (-) 0,0 4,9 0,4 2,9
0302 Tobacco products (-) 6,1 30,4 (-) 5,3 19,9 (-) 0,1 3,3
0303 Textile 2,4 (-) 4,9 (-) 1,4 11,5 2,1 (-) 2,5
0304 W earing apparel and related products (-) 13,2 1,9 (-) 9,0 (-) 0,3 (-) 4,7 (-) 5,3
0305 Leather and footwear articles 5,8 1,4 (-) 1,1 2,7 (-) 2,7 (-) 2,8
0306 W ood products - except furniture (-) 5,9 0,3 6,8 12,4 (-) 2,7 (-) 0,3
0307 Cellulose and paper products 8,6 (-) 1,4 8,2 13,6 7,1 3,5
0308 Printing and reproduction for recorded media 3,6 6,4 1,2 1,7 8,4 2,4
0309 Coke and refined petroleum products 27,3 (-) 16,6 (-) 1,1 (-) 2,0 (-) 0,7 (-) 7,6
0310 Processing of alcohol fuel (-) 3,7 7,8 17,3 (-) 5,9 3,1 6,4
0311 Chemical products (-) 11,1 11,9 8,8 (-) 1,3 (-) 3,8 0,7
0312 Manufacture of basic chemicals 18,3 19,4 16,8 1,8 (-) 13,2 (-) 4,4
0313 Pharmaceutical products (-) 0,6 (-) 0,2 (-) 2,2 3,5 12,6 2,8
0314 Pesticides and agrochemical products (-) 6,0 11,2 14,4 6,7 10,5 (-) 2,7
0315 Soap and detergents, cleaning, polishing, perfumes, and toilet preparations 1,9 8,8 0,8 11,8 3,6 1,7
0316 Paints, varnishes and similar coatings, printing ink and mastics (-) 25,8 (-) 0,5 3,3 10,3 3,5 7,7
0317 Other chemical products (-) 22,1 (-) 1,6 (-) 0,6 15,1 2,1 (-) 10,6
0318 Rubber and plastic products (-) 6,5 (-) 3,7 (-) 3,5 9,9 3,0 1,1
0319 Manufacture of cement (-) 1,6 (-) 1,3 (-) 6,7 12,6 9,4 5,4
0320 Other non-metallic mineral products (-) 2,9 0,5 4,1 8,0 (-) 0,2 1,7
0321 Manufacture of steel and related products (-) 1,5 2,3 2,5 10,3 (-) 3,3 (-) 3,0
0322 Casting of non-ferrous metals (-) 3,6 (-) 3,2 7,0 8,5 0,9 3,1
0323 Metal products - except machinery and equipment 12,5 (-) 2,8 1,5 15,9 (-) 0,3 0,9
0324 Machinery and equipment, including repair and maintenance 6,4 1,0 5,2 17,7 (-) 0,9 2,5
0325 Domestic appliances (-) 16,9 7,8 3,7 13,1 (-) 4,6 10,0
0326 Office machinery and computer equipment (-) 41,7 10,9 19,3 63,5 11,1 56,7
0327 Electrical machinery, appliances and supplies 3,0 (-) 8,0 1,7 14,4 5,6 3,7
0328 Electronic components and communication equipment (-) 32,7 2,7 (-) 1,9 7,0 4,9 (-) 2,6
0329 Medical and dental instruments and supplies, measuring and optical products (-) 2,9 5,9 0,4 9,5 (-) 0,2 5,2
0330 Automobiles and vans 13,6 1,5 5,7 21,5 14,2 8,3
0331 Trucks and buses 0,7 (-) 2,9 21,3 46,7 14,1 (-) 7,3
0332 Manufacture of parts and accessories for motor vehicles and their engines 0,1 2,0 5,1 24,7 (-) 0,6 0,5
0333 Manufacture of transport equipment 19,0 18,9 3,7 4,4 3,2 (-) 1,7
0334 Furniture and products manufacturing industries n.e.c. (-) 1,6 3,7 (-) 5,5 10,4 1,0 6,1
0401 Electricity, gas, water supply, sewerage and waste management (-) 6,2 2,9 4,0 8,4 3,0 3,5
0501 Construction (-) 2,1 (-) 2,2 (-) 3,3 6,6 1,8 4,7
Services 1,9 3,2 0,8 5,0 3,7 4,2
0601 W holesale and etail trade (-) 0,0 (-) 0,0 (-) 0,5 7,5 3,5 6,0
0701 Transport, storage, and postal activities 2,4 2,8 (-) 3,1 5,9 3,5 2,1
0801 Information services activities 5,3 5,0 4,4 5,5 4,0 1,6
0901 Financial and insurance activities 1,2 2,3 (-) 4,8 3,7 5,3 8,4
1001 Real estate and rent activities 4,5 4,4 3,4 3,9 4,7 3,0
1101 Maintenance and repair services (-) 3,9 (-) 1,8 2,9 1,6 1,6 5,6
1102 Accommodation and food service activities 0,1 4,9 3,4 5,1 6,3 6,0
1103 Office administrative, business, and other support service activities (-) 3,3 6,4 (-) 0,3 7,4 7,2 4,3
1104 Education - except public education 5,1 6,7 1,7 6,4 3,1 0,4
1105 Human health - except public human health 2,3 (-) 0,1 0,7 3,9 4,7 3,9
1106 Other service activities (-) 0,5 6,1 (-) 0,6 4,7 4,1 3,7
1201 Public education 1,3 2,1 3,3 4,7 (-) 1,1 (-) 0,2
1202 Public human health 7,6 4,6 3,5 (-) 0,0 4,1 6,8
1203 Public administration and defence, compulsory social security 3,1 3,9 2,7 4,2 1,2 3,9
Source: System of National Accounts, Brazilian Institute of Geography and Statistics (IBGE).
Economic activities
22
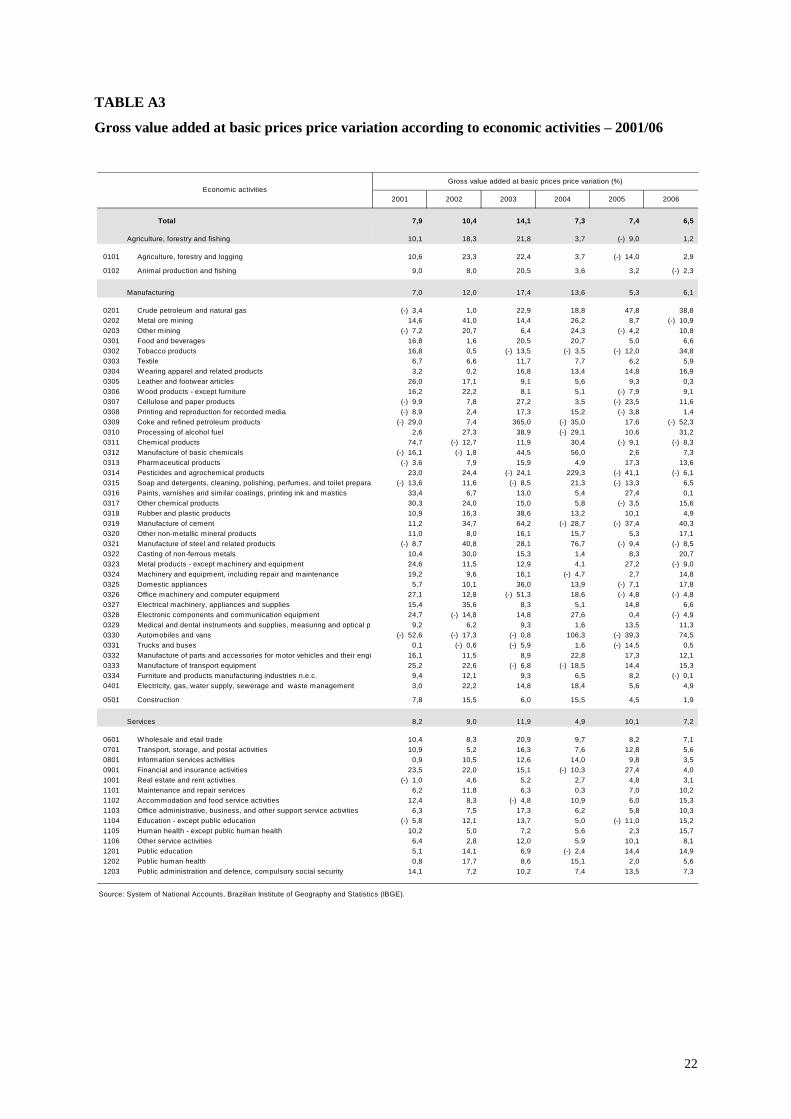
TABLE A3
Gross value added at basic prices price variation according to economic activities – 2001/06
Gross value added at basic prices price variation (%)
2001 2002 2003 2004 2005 2006
Total 7,9 10,4 14,1 7,3 7,4 6,5
Agriculture, forestry and fishing 10,1 18,3 21,8 3,7 (-) 9,0 1,2
0101 Agriculture, forestry and logging 10,6 23,3 22,4 3,7 (-) 14,0 2,9
0102 Animal production and fishing 9,0 8,0 20,5 3,6 3,2 (-) 2,3
Manufacturing 7,0 12,0 17,4 13,6 5,3 6,1
0201 Crude petroleum and natural gas (-) 3,4 1,0 22,9 18,8 47,8 38,8
0202 Metal ore mining 14,6 41,0 14,4 26,2 8,7 (-) 10,9
0203 Other mining (-) 7,2 20,7 6,4 24,3 (-) 4,2 10,8
0301 Food and beverages 16,8 1,6 20,5 20,7 5,0 6,6
0302 Tobacco products 16,8 0,5 (-) 13,5 (-) 3,5 (-) 12,0 34,8
0303 Textile 6,7 6,6 11,7 7,7 6,2 5,9
0304 W earing apparel and related products 3,2 0,2 16,8 13,4 14,8 16,9
0305 Leather and footwear articles 26,0 17,1 9,1 5,6 9,3 0,3
0306 W ood products - except furniture 16,2 22,2 8,1 5,1 (-) 7,9 9,1
0307 Cellulose and paper products (-) 9,9 7,8 27,2 3,5 (-) 23,5 11,6
0308 Printing and reproduction for recorded media (-) 8,9 2,4 17,3 15,2 (-) 3,8 1,4
0309 Coke and refined petroleum products (-) 29,0 7,4 365,0 (-) 35,0 17,6 (-) 52,3
0310 Processing of alcohol fuel 2,6 27,3 38,9 (-) 29,1 10,6 31,2
0311 Chemical products 74,7 (-) 12,7 11,9 30,4 (-) 9,1 (-) 8,3
0312 Manufacture of basic chemicals (-) 16,1 (-) 1,8 44,5 56,0 2,6 7,3
0313 Pharmaceutical products (-) 3,6 7,9 15,9 4,9 17,3 13,6
0314 Pesticides and agrochemical products 23,0 24,4 (-) 24,1 229,3 (-) 41,1 (-) 6,1
0315 Soap and detergents, cleaning, polishing, perfumes, and toilet preparations (-) 13,6 11,6 (-) 8,5 21,3 (-) 13,3 6,5
0316 Paints, varnishes and similar coatings, printing ink and mastics 33,4 6,7 13,0 5,4 27,4 0,1
0317 Other chemical products 30,3 24,0 15,0 5,8 (-) 3,5 15,6
0318 Rubber and plastic products 10,9 16,3 38,6 13,2 10,1 4,9
0319 Manufacture of cement 11,2 34,7 64,2 (-) 28,7 (-) 37,4 40,3
0320 Other non-metallic mineral products 11,0 8,0 16,1 15,7 5,3 17,1
0321 Manufacture of steel and related products (-) 8,7 40,8 28,1 76,7 (-) 9,4 (-) 8,5
0322 Casting of non-ferrous metals 10,4 30,0 15,3 1,4 8,3 20,7
0323 Metal products - except machinery and equipment 24,6 11,5 12,9 4,1 27,2 (-) 9,0
0324 Machinery and equipment, including repair and maintenance 19,2 9,6 16,1 (-) 4,7 2,7 14,8
0325 Domestic appliances 5,7 10,1 36,0 13,9 (-) 7,1 17,8
0326 Office machinery and computer equipment 27,1 12,8 (-) 51,3 18,6 (-) 4,8 (-) 4,8
0327 Electrical machinery, appliances and supplies 15,4 35,6 8,3 5,1 14,8 6,6
0328 Electronic components and communication equipment 24,7 (-) 14,8 14,8 27,6 0,4 (-) 4,9
0329 Medical and dental instruments and supplies, measuring and optical products 9,2 6,2 9,3 1,6 13,5 11,3
0330 Automobiles and vans (-) 52,6 (-) 17,3 (-) 0,8 106,3 (-) 39,3 74,5
0331 Trucks and buses 0,1 (-) 0,6 (-) 5,9 1,6 (-) 14,5 0,5
0332 Manufacture of parts and accessories for motor vehicles and their engines 16,1 11,5 8,9 22,8 17,3 12,1
0333 Manufacture of transport equipment 25,2 22,6 (-) 6,8 (-) 18,5 14,4 15,3
0334 Furniture and products manufacturing industries n.e.c. 9,4 12,1 9,3 6,5 8,2 (-) 0,1
0401 Electricity, gas, water supply, sewerage and waste management 3,0 22,2 14,8 18,4 5,6 4,9
0501 Construction 7,8 15,5 6,0 15,5 4,5 1,9
Services 8,2 9,0 11,9 4,9 10,1 7,2
0601 W holesale and etail trade 10,4 8,3 20,9 9,7 8,2 7,1
0701 Transport, storage, and postal activities 10,9 5,2 16,3 7,6 12,8 5,6
0801 Information services activities 0,9 10,5 12,6 14,0 9,8 3,5
0901 Financial and insurance activities 23,5 22,0 15,1 (-) 10,3 27,4 4,0
1001 Real estate and rent activities (-) 1,0 4,6 5,2 2,7 4,8 3,1
1101 Maintenance and repair services 6,2 11,8 6,3 0,3 7,0 10,2
1102 Accommodation and food service activities 12,4 8,3 (-) 4,8 10,9 6,0 15,3
1103 Office administrative, business, and other support service activities 6,3 7,5 17,3 6,2 5,8 10,3
1104 Education - except public education (-) 5,8 12,1 13,7 5,0 (-) 11,0 15,2
1105 Human health - except public human health 10,2 5,0 7,2 5,6 2,3 15,7
1106 Other service activities 6,4 2,8 12,0 5,9 10,1 8,1
1201 Public education 5,1 14,1 6,9 (-) 2,4 14,4 14,9
1202 Public human health 0,8 17,7 8,6 15,1 2,0 5,6
1203 Public administration and defence, compulsory social security 14,1 7,2 10,2 7,4 13,5 7,3
Source: System of National Accounts, Brazilian Institute of Geography and Statistics (IBGE).
Economic activities

23
TABLE A4
Total of Jobs by types of link in labor market according to economic activities— 2001/06
Total of Jobs
jobs without formal link
employees without legal
contractautonomous workers
2001
Total 79 544 414 31 856 056 18 477 753 29 210 605
01 Agriculture, hunting, forestry and fishing 16 902 498 1 893 073 3 366 802 11 642 623
Mining, manufacturing, electricity, gas and water supply, and construction 15 302 635 6 449 237 3 539 958 5 313 440
02 Mining and quarrying 234 885 119 366 63 147 52 372
03 Manufacturing 9 352 258 4 983 580 1 753 734 2 614 944
04 Electricity, gas and water supply 357 267 260 866 96 401 -
05 Construction 5 358 225 1 085 425 1 626 676 2 646 124
Services 47 339 281 23 513 746 11 570 993 12 254 542
06 W holesale and retail trade; repair of motor vehicles; hotels and restaurants 12 766 045 5 807 071 1 989 541 4 969 433
07 Transport, storage and communication 3 337 218 1 444 488 591 658 1 301 072
08 Information service activities 1 248 402 389 922 424 796 433 684
09 Financing and insurance activities 856 978 663 145 147 039 46 794
10 Real estate and renting activities 551 053 206 714 136 049 208 290
11 Other services 20 218 615 7 736 762 7 240 170 5 241 683
12 Public administration, health and education; compulsory social security 8 360 970 7 265 644 1 041 740 53 586
2002
Total 82 629 067 32 931 074 19 274 531 30 423 462
01 Agriculture, hunting, forestry and fishing 17 353 605 1 853 109 3 335 544 12 164 952
Mining, manufacturing, electricity, gas and water supply, and construction 15 850 088 6 552 191 3 582 069 5 715 828
02 Mining and quarrying 248 402 123 963 61 497 62 942
03 Manufacturing 9 650 550 5 055 444 1 887 643 2 707 463
04 Electricity, gas and water supply 342 419 279 946 62 473 -
05 Construction 5 608 717 1 092 838 1 570 456 2 945 423
Services 49 425 374 24 525 774 12 356 918 12 542 682
06 W holesale and retail trade; repair of motor vehicles; hotels and restaurants 13 545 847 6 087 778 2 197 871 5 260 198
07 Transport, storage and communication 3 528 838 1 488 907 598 798 1 441 133
08 Information service activities 1 315 897 371 790 486 967 457 140
09 Financing and insurance activities 886 177 680 298 156 791 49 088
10 Real estate and renting activities 544 114 240 649 124 524 178 941
11 Other services 21 021 546 8 100 477 7 811 953 5 109 116
12 Public administration, health and education; compulsory social security 8 582 955 7 555 875 980 014 47 066
2003
Total 84 034 981 34 102 742 19 028 362 30 903 877
01 Agriculture, hunting, forestry and fishing 17 660 548 1 942 650 3 431 783 12 286 115
Mining, manufacturing, electricity, gas and water supply, and construction 16 002 247 6 755 310 3 433 288 5 813 649
02 Mining and quarrying 252 584 128 428 57 932 66 224
03 Manufacturing 9 984 712 5 285 760 1 822 285 2 876 667
04 Electricity, gas and water supply 355 649 288 069 67 580 -
05 Construction 5 409 302 1 053 053 1 485 491 2 870 758
Services 50 372 186 25 404 782 12 163 291 12 804 113
06 W holesale and retail trade; repair of motor vehicles; hotels and restaurants 13 944 252 6 228 147 2 212 131 5 503 974
07 Transport, storage and communication 3 570 817 1 520 700 624 470 1 425 647
08 Information service activities 1 399 560 428 775 478 943 491 842
09 Financing and insurance activities 919 422 705 903 161 653 51 866
10 Real estate and renting activities 545 467 241 123 117 918 186 426
11 Other services 21 195 531 8 481 675 7 611 085 5 102 771
12 Public administration, health and education; compulsory social security 8 797 137 7 798 459 957 091 41 587
Source: System of National Accounts, Brazilian Institute of Geography and Statistics (IBGE).
Economic activities
Total
Types of link in labor market
jobs with
formal link

24
TABLE A4 (continued)
Total of Jobs by types of link in labor market according to economic activities— 2001/06
Total of Jobs
jobs without formal link
employees without legal
contractautonomous workers
2004
Total 88 252 473 35 964 746 20 401 954 31 885 773
01 Agriculture, hunting, forestry and fishing 18 873 744 2 199 921 3 567 033 13 106 790
Mining, manufacturing, electricity, gas and water supply, and construction 17 067 388 7 724 412 3 639 314 5 703 662
02 Mining and quarrying 274 130 142 393 58 225 73 512
03 Manufacturing 10 809 822 6 031 648 1 937 925 2 840 249
04 Electricity, gas and water supply 369 777 290 252 79 525 -
05 Construction 5 613 659 1 260 119 1 563 639 2 789 901
Services 52 311 341 26 040 413 13 195 607 13 075 321
06 W holesale and retail trade; repair of motor vehicles; hotels and restaurants 14 189 080 6 325 406 2 327 833 5 535 841
07 Transport, storage and communication 3 658 359 1 572 532 623 747 1 462 080
08 Information service activities 1 444 505 476 142 491 450 476 913
09 Financing and insurance activities 906 909 711 649 147 272 47 988
10 Real estate and renting activities 534 466 238 185 117 444 178 837
11 Other services 22 441 899 8 663 135 8 435 804 5 342 960
12 Public administration, health and education; compulsory social security 9 136 123 8 053 364 1 052 057 30 702
2005
Total 90 905 673 37 436 349 20 547 657 32 921 667
01 Agriculture, hunting, forestry and fishing 18 980 620 2 204 714 3 575 237 13 200 669
Mining, manufacturing, electricity, gas and water supply, and construction 18 194 779 8 179 462 3 583 525 6 431 792
02 Mining and quarrying 275 704 154 530 44 088 77 086
03 Manufacturing 11 673 764 6 395 345 1 891 548 3 386 871
04 Electricity, gas and water supply 372 432 302 770 69 662 -
05 Construction 5 872 879 1 326 817 1 578 227 2 967 835
Services 53 730 274 27 052 173 13 388 895 13 289 206
06 W holesale and retail trade; repair of motor vehicles; hotels and restaurants 14 799 874 6 726 238 2 399 090 5 674 546
07 Transport, storage and communication 3 791 040 1 726 025 615 094 1 449 921
08 Information service activities 1 558 030 506 173 531 135 520 722
09 Financing and insurance activities 919 809 708 667 161 924 49 218
10 Real estate and renting activities 568 907 256 030 123 838 189 039
11 Other services 22 792 031 9 034 003 8 396 776 5 361 252
12 Public administration, health and education; compulsory social security 9 300 583 8 095 037 1 161 038 44 508
2006
Total 93 246 963 39 542 509 20 940 113 32 764 341
01 Agriculture, hunting, forestry and fishing 18 400 802 2 200 927 3 379 556 12 820 319
Mining, manufacturing, electricity, gas and water supply, and construction 18 226 920 8 250 443 3 681 370 6 295 107
02 Mining and quarrying 271 077 162 431 44 299 64 347
03 Manufacturing 11 643 049 6 481 586 1 920 831 3 240 632
04 Electricity, gas and water supply 380 027 303 400 76 627 -
05 Construction 5 932 767 1 303 026 1 639 613 2 990 128
Services 56 619 241 29 091 139 13 879 187 13 648 915
06 W holesale and retail trade; repair of motor vehicles; hotels and restaurants 15 480 735 7 466 500 2 371 931 5 642 304
07 Transport, storage and communication 3 924 013 1 804 400 653 180 1 466 433
08 Information service activities 1 684 699 576 428 545 639 562 632
09 Financing and insurance activities 931 230 716 670 150 802 63 758
10 Real estate and renting activities 604 527 273 100 136 221 195 206
11 Other services 24 211 167 9 681 562 8 838 626 5 690 979
12 Public administration, health and education; compulsory social security 9 782 870 8 572 479 1 182 788 27 603
Source: System of National Accounts, Brazilian Institute of Geography and Statistics (IBGE).
Economic activities
Total
Types of link in labor market
jobs with
formal link