kawa stream tmdl report
TRANSCRIPT
TOTAL MAXIMUMDAILY LOADS
KAWA STREAMKANEOHE, HI
Final Technical ReportMarch 2002
Total Maximum Daily Loads of Total Suspended Solids, Nitrogen and Phosphorus for
Kawa Stream Kaneohe, Hawaii
Prepared by:
Oceanit Laboratories, Inc. 1001 Bishop Street
Pacific Tower, Suite 2970 Honolulu, Hawaii 96813
With:
AECOS, Inc.
970 N. Kalaheo Ave., Suite C300
Kailua, Hawaii 96813
And:
Environmental Planning Office Department of Health
State of Hawaii
March 2002
i
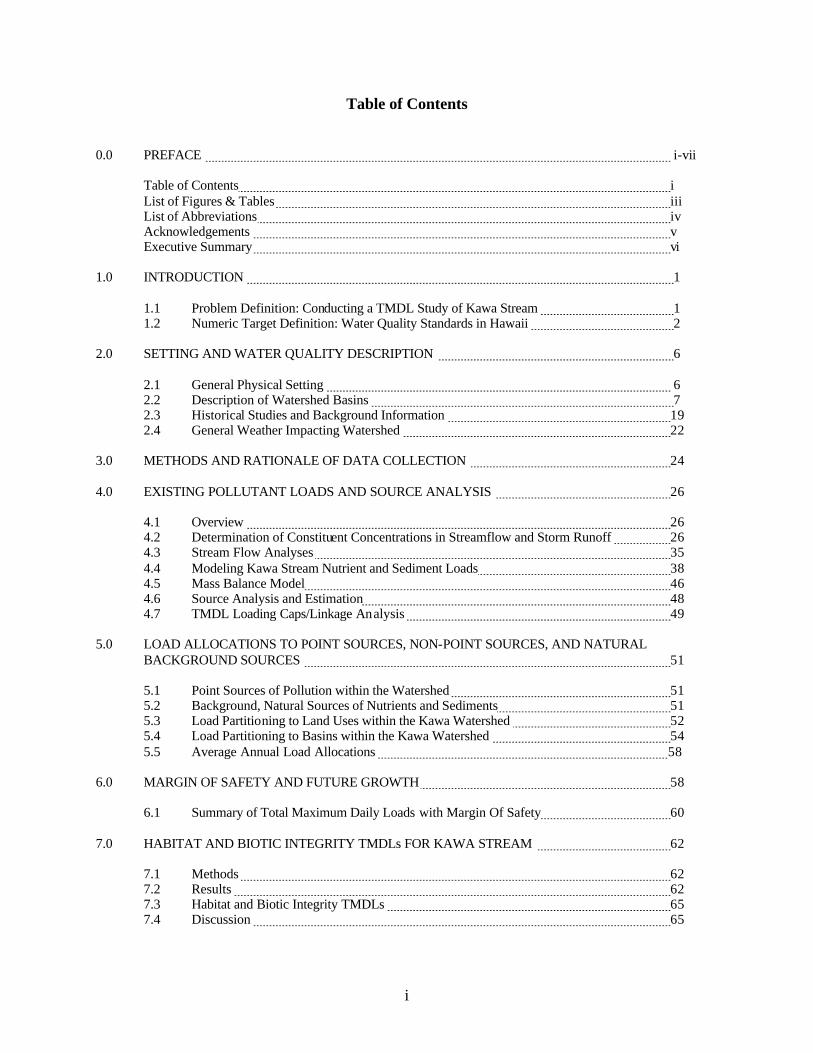
Table of Contents 0.0 PREFACE i-vii
Table of Contents i List of Figures & Tables iii List of Abbreviations iv Acknowledgements v Executive Summary vi
1.0 INTRODUCTION 1
1.1 Problem Definition: Conducting a TMDL Study of Kawa Stream 1 1.2 Numeric Target Definition: Water Quality Standards in Hawaii 2
2.0 SETTING AND WATER QUALITY DESCRIPTION 6
2.1 General Physical Setting 6 2.2 Description of Watershed Basins 7 2.3 Historical Studies and Background Information 19 2.4 General Weather Impacting Watershed 22
3.0 METHODS AND RATIONALE OF DATA COLLECTION 24 4.0 EXISTING POLLUTANT LOADS AND SOURCE ANALYSIS 26
4.1 Overview 26 4.2 Determination of Constituent Concentrations in Streamflow and Storm Runoff 26 4.3 Stream Flow Analyses 35 4.4 Modeling Kawa Stream Nutrient and Sediment Loads 38 4.5 Mass Balance Model 46 4.6 Source Analysis and Estimation 48 4.7 TMDL Loading Caps/Linkage Analysis 49
5.0 LOAD ALLOCATIONS TO POINT SOURCES, NON-POINT SOURCES, AND NATURAL
BACKGROUND SOURCES 51
5.1 Point Sources of Pollution within the Watershed 51 5.2 Background, Natural Sources of Nutrients and Sediments 51 5.3 Load Partitioning to Land Uses within the Kawa Watershed 52 5.4 Load Partitioning to Basins within the Kawa Watershed 54 5.5 Average Annual Load Allocations 58
6.0 MARGIN OF SAFETY AND FUTURE GROWTH 58
6.1 Summary of Total Maximum Daily Loads with Margin Of Safety 60 7.0 HABITAT AND BIOTIC INTEGRITY TMDLs FOR KAWA STREAM 62
7.1 Methods 62 7.2 Results 62 7.3 Habitat and Biotic Integrity TMDLs 65 7.4 Discussion 65
ii
8.0 ASSURANCE OF IMPLEMENTATION 67 9.0 PUBLIC PARTICIPATION PROCESS 68 10.0 REFERENCES 71 Appendix A: Stream Flow / Rainfall Correlation 73 Appendix B: Water Quality Data 74
iii
List of Figures & Tables
Figure 1.1: Location Map of the Kawa Stream Watershed 2 Figure 2.1: Geographic Distribution of Land Uses 5 Figure 2.2: Distribution of Kawa Watershed Land Use 6 Figure 2.3: Basins 1 & 2 7 Figure 2.4: The central branch of Kawa Stream rises near a water tank above the Veteran’s Cemetery 8 Figure 2.5: Upper cataract on Kawa Stream (central branch) 9 Figure 2.6: Central and upper west branches of Kawa Stream 9 Figure 2.7: Basins 3 & 4 11 Figure 2.8: Concrete culvert along the lower portion of the Parkway subdivision 12 Figure 2.9: Kawa Stream view upstream from Namoku Street bridge 13 Figure 2.10: Drain inlet at the top of Lipalu Street in Pikoiloa subdivision 13 Figure 2.11: Basins 5, 6 & 7 15 Figure 2.12: Basins 8 & 9 17 Figure 2.13: Kawa Stream above the transition to an estuary below Station 005 18 Figure 2.14: Comparison of monthly average base flows (ft3/sec) at the Upper Kawa Stream gauging station in 1997 and 1998 20 Figure 2.15: Annual rainfall at Akimala Place, Kaneohe 21 Figure 2.16: 10-day moving average rainfall at Kaneohe Civic Center gauge, 1997 21 Figure 2.17: Cumulative frequency of daily rainfall at Kaneohe Civic Center, 1997 23 Figure 4.1: Turbidity vs. Total Suspended Solids in Kawa Stream 29 Figure 4.2: Regression of Total Suspended Solids against runoff-influenced Total Phosphorous concentration 33 Figure 4.3: Rainfall / runoff relation in Kawa Stream 36 Figure 4.4: Peak Streamflows at USGS Crest Stage Station 1965-1994 38 Figure 4.5: HEC-HMS Model Schematic 41 Figure 4.6: Station 007 TSS Loading 43 Figure 4.7: Station 022 TSS Loading 45 Figure 4.8: Station 022 Nitrogen and Phosphorous Loading 45 Figure 7.1: Map of Kawa Watershed 63 Figure 7.2: Observed, Expected (TMDLs), and Reference Values for Habitat and Biotic Integrity 63
Table 1.1: Hawaii State Water Quality Standards for Streams 3 Table 2.1: Relative Percentages of Land Uses in Basins 5 Table 4.1: Baseline Turbidity and Total Suspended Solids 27 Table 4.2: Wet and Dry Season Turbidity and Total Suspended Solids Compared with State Water Quality
Standards criteria 27 Table 4.3: Storm Condition. Suspended Particulate Measurements in Kawa Stream 27 Table 4.4: Baseline Nutrient Concentrations, 1999-2000 30 Table 4.5: Wet and Dry Season Nutrient Concentrations 31 Table 4.6: Dissolved Inorganic Nutrient Concentrations 31 Table 4.7: Total and Organic Nutrient Concentrations 32 Table 4.8: Peak Discharge at USGS Crest Stage Station 38 Table 4.9: Pollutant Loading at Kawa Stream Outlet 44 Table 4.10: Water Balance Calculations 47 Table 4.11: Existing Pollutant Load Calculations, Year 2000 48 Table 4.12: Total Maximum Daily Loads Based on State Water Quality Standards Criteria 49 Table 4.13: Pollutant Load Reduction Targets 50 Table 4.14: Total Maximum Daily Loads by Season and Storm Conditions 50 Table 5.1: Water Quality from Other Hawaii Stream Systems 52 Table 5.2: Geometric Mean Values for Nutrients from U.S. Shallow Groundwater Sites 52 Table 5.3: Relative Loading Factors for Land Use Categories 53 Table 5.4: Calculation of Annual Load Reduction Targets for Total Suspended Solids 55 Table 5.5: Calculation of Annual Load Reduction Targets for Total Nitrogen 56 Table 5.6: Calcula tion of Annual Load Reduction Targets for Total Phosphorous 57 Table 5.7: Average Annual Load Allocations 58 Table 6.1: Explicit Margins of Safety (MOS) 59 Table 7.1: Kawa Stream Habitat and Biotic Integrity TMDLs 62 Table 7.2: Current Versus Expected TMDLs for Kawa Stream 64
iv
List of Abbreviations BMP Best Management Practice BOD Biochemical Oxygen Demand CWA Clean Water Act DO Dissolved Oxygen DOH State of Hawaii Department of Health EPO DOH Environmental Planning Office EPA United States Environmental Protection Agency LA Load Allocation MOS Margin of Safety NH3 Ammonia NO2,3 Nitrate + Nitrite (NO3 + NO2) NPS Non-Point Source TN Total Nitrogen (TON + NH3 +NO2 + NO3) TP Total Phosphorous (TOP + PO4) TON Total Organic Nitrogen TOP Organic Phosphorus TSS Total Suspended Solids PO4 Ortho-Phosphate SOD Sediment Oxygen Demand TMDL Total Maximum Daily Load USGS United States Geological Survey WLA Waste Load Allocation WQLS Water Quality Limited Segment WQS State of Hawaii Water Quality Standards

v
ACKNOWLEDGEMENTS
Many areas of expertise are required to complete a TMDL to standards acceptable by the U.S. Environmental Protection Agency (EPA), the State of Hawaii Department of Health (DOH), scientists, and the public. Oceanit’s project coordinator, Mr. Robert Bourke, relied heavily on the input of several key professionals to accomplish this work. The principal of AECOS, Mr. Eric Guinther, and his staff (especially Dr. S. Allen Cattell) were primarily responsible for water sample collections, laboratory analyses, and interpretation of water quality data. DOH Clean Water Branch staff, supervised by Mr. Eugene Akazawa, collected and analyzed water samples critical to the establishment of baseline stream water quality. Mr. Tom Nance is to be thanked for permission to use stream height data from a previous study. Mr. David Takeyama and Mr. Phillip Lui of Oceanit accomplished GIS data inputs, translations, and interpretations with assistance from Mr. Glen Fukunaga of the DOH Environmental Planning Office. The effort to create a mathematical model of the watershed from the physical, chemical, and GIS databases was headed by Mr. Travis Hylton with assistance from Mr. Marty Yuen and Mr. Jason Apostol from Oceanit. The document was organized, formatted, and edited with the assistance of Ms. Lara Hutto (Oceanit) and Dr. David C. Penn (DOH Environmental Planning Office).
vi
EXECUTIVE SUMMARY
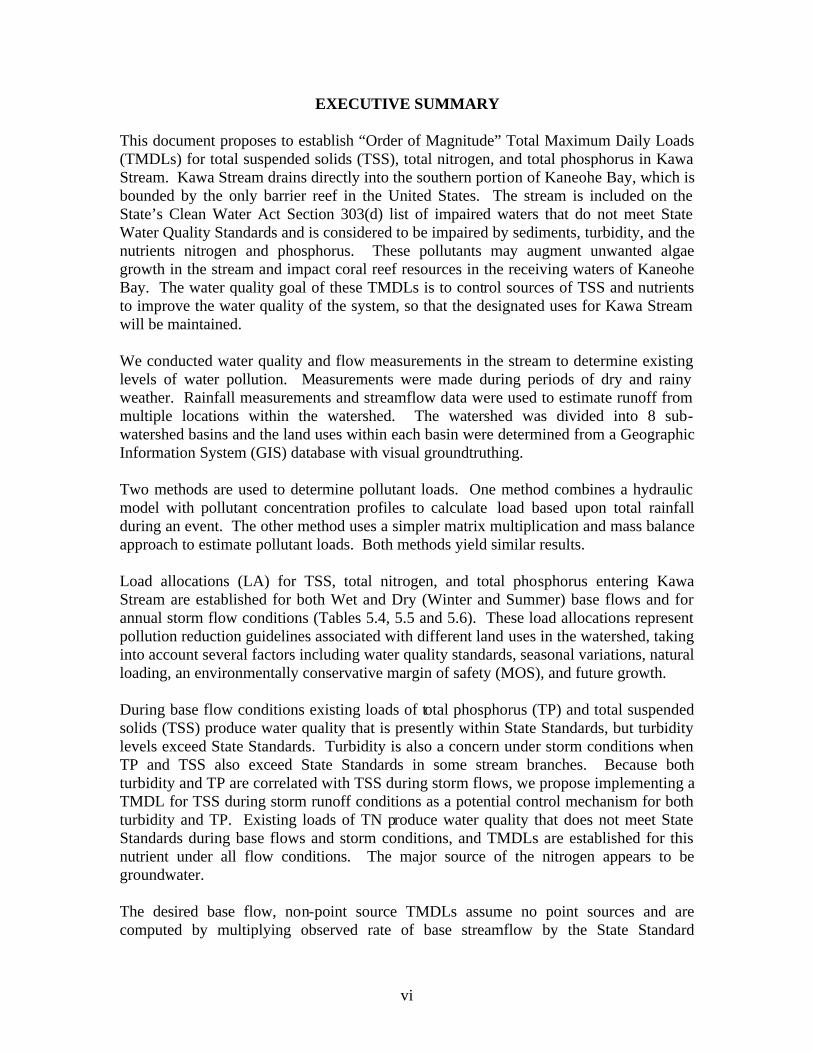
This document proposes to establish “Order of Magnitude” Total Maximum Daily Loads (TMDLs) for total suspended solids (TSS), total nitrogen, and total phosphorus in Kawa Stream. Kawa Stream drains directly into the southern portion of Kaneohe Bay, which is bounded by the only barrier reef in the United States. The stream is included on the State’s Clean Water Act Section 303(d) list of impaired waters that do not meet State Water Quality Standards and is considered to be impaired by sediments, turbidity, and the nutrients nitrogen and phosphorus. These pollutants may augment unwanted algae growth in the stream and impact coral reef resources in the receiving waters of Kaneohe Bay. The water quality goal of these TMDLs is to control sources of TSS and nutrients to improve the water quality of the system, so that the designated uses for Kawa Stream will be maintained. We conducted water quality and flow measurements in the stream to determine existing levels of water pollution. Measurements were made during periods of dry and rainy weather. Rainfall measurements and streamflow data were used to estimate runoff from multiple locations within the watershed. The watershed was divided into 8 sub-watershed basins and the land uses within each basin were determined from a Geographic Information System (GIS) database with visual groundtruthing. Two methods are used to determine pollutant loads. One method combines a hydraulic model with pollutant concentration profiles to calculate load based upon total rainfall during an event. The other method uses a simpler matrix multiplication and mass balance approach to estimate pollutant loads. Both methods yield similar results. Load allocations (LA) for TSS, total nitrogen, and total phosphorus entering Kawa Stream are established for both Wet and Dry (Winter and Summer) base flows and for annual storm flow conditions (Tables 5.4, 5.5 and 5.6). These load allocations represent pollution reduction guidelines associated with different land uses in the watershed, taking into account several factors including water quality standards, seasonal variations, natural loading, an environmentally conservative margin of safety (MOS), and future growth. During base flow conditions existing loads of total phosphorus (TP) and total suspended solids (TSS) produce water quality that is presently within State Standards, but turbidity levels exceed State Standards. Turbidity is also a concern under storm conditions when TP and TSS also exceed State Standards in some stream branches. Because both turbidity and TP are correlated with TSS during storm flows, we propose implementing a TMDL for TSS during storm runoff conditions as a potential control mechanism for both turbidity and TP. Existing loads of TN produce water quality that does not meet State Standards during base flows and storm conditions, and TMDLs are established for this nutrient under all flow conditions. The major source of the nitrogen appears to be groundwater. The desired base flow, non-point source TMDLs assume no point sources and are computed by multiplying observed rate of base streamflow by the State Standard
vii
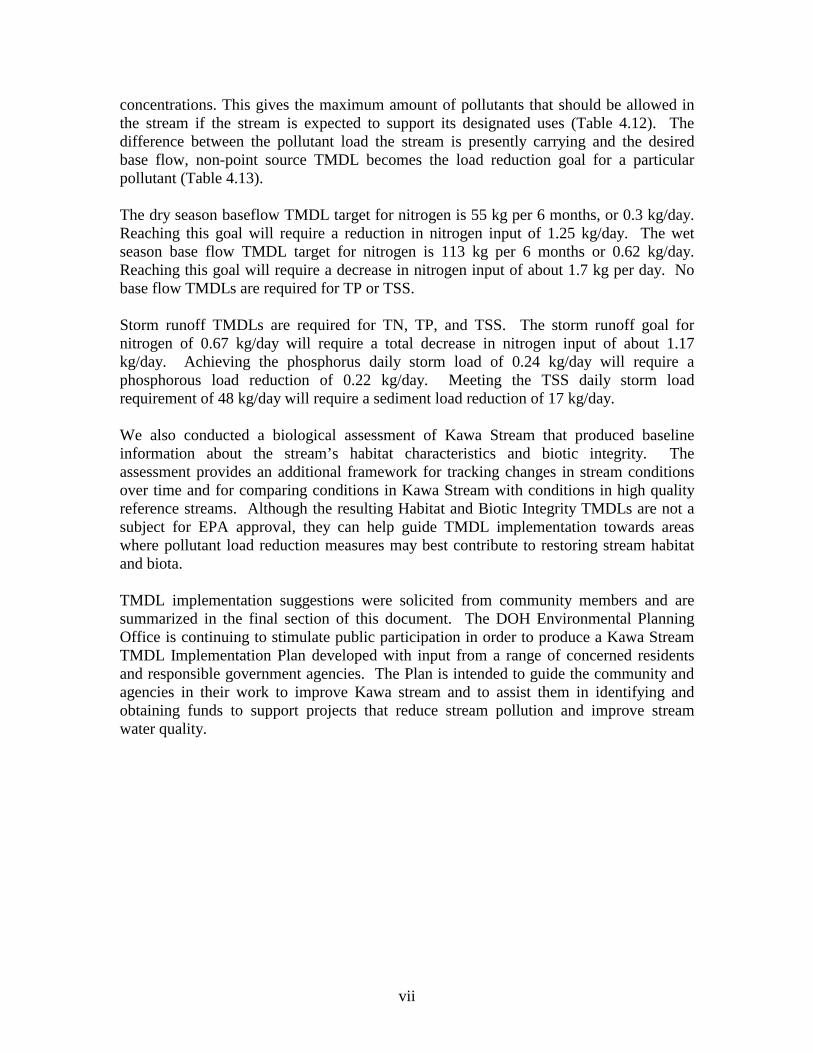
concentrations. This gives the maximum amount of pollutants that should be allowed in the stream if the stream is expected to support its designated uses (Table 4.12). The difference between the pollutant load the stream is presently carrying and the desired base flow, non-point source TMDL becomes the load reduction goal for a particular pollutant (Table 4.13). The dry season baseflow TMDL target for nitrogen is 55 kg per 6 months, or 0.3 kg/day. Reaching this goal will require a reduction in nitrogen input of 1.25 kg/day. The wet season base flow TMDL target for nitrogen is 113 kg per 6 months or 0.62 kg/day. Reaching this goal will require a decrease in nitrogen input of about 1.7 kg per day. No base flow TMDLs are required for TP or TSS. Storm runoff TMDLs are required for TN, TP, and TSS. The storm runoff goal for nitrogen of 0.67 kg/day will require a total decrease in nitrogen input of about 1.17 kg/day. Achieving the phosphorus daily storm load of 0.24 kg/day will require a phosphorous load reduction of 0.22 kg/day. Meeting the TSS daily storm load requirement of 48 kg/day will require a sediment load reduction of 17 kg/day. We also conducted a biological assessment of Kawa Stream that produced baseline information about the stream’s habitat characteristics and biotic integrity. The assessment provides an additional framework for tracking changes in stream conditions over time and for comparing conditions in Kawa Stream with conditions in high quality reference streams. Although the resulting Habitat and Biotic Integrity TMDLs are not a subject for EPA approval, they can help guide TMDL implementation towards areas where pollutant load reduction measures may best contribute to restoring stream habitat and biota. TMDL implementation suggestions were solicited from community members and are summarized in the final section of this document. The DOH Environmental Planning Office is continuing to stimulate public participation in order to produce a Kawa Stream TMDL Implementation Plan developed with input from a range of concerned residents and responsible government agencies. The Plan is intended to guide the community and agencies in their work to improve Kawa stream and to assist them in identifying and obtaining funds to support projects that reduce stream pollution and improve stream water quality.
1
1.0 INTRODUCTION 1.1 Problem Definition: Conducting a TMDL Study of Kawa Stream
Section 303(d)(1)(C) of the Federal Clean Water Act directs each State to develop a list of water bodies that do not meet State water quality standards. These 303(d)-listed water bodies are termed “water quality limited segments" (WQLS) for one or more specific substances or pollutants. The State is further directed to determine, for each WQLS, the capacity of the water body to receive the listed substance and still meet water quality standards. This quantity is termed the total maximum daily load (TMDL) and must take into account seasonal variations and a protective margin of safety (MOS) to account for uncertainty. The TMDL study must also determine the origin of the listed substance within the watershed and discuss preliminary mechanisms for controlling pollutant levels that will eventually improve stream water quality to meet State Standards.
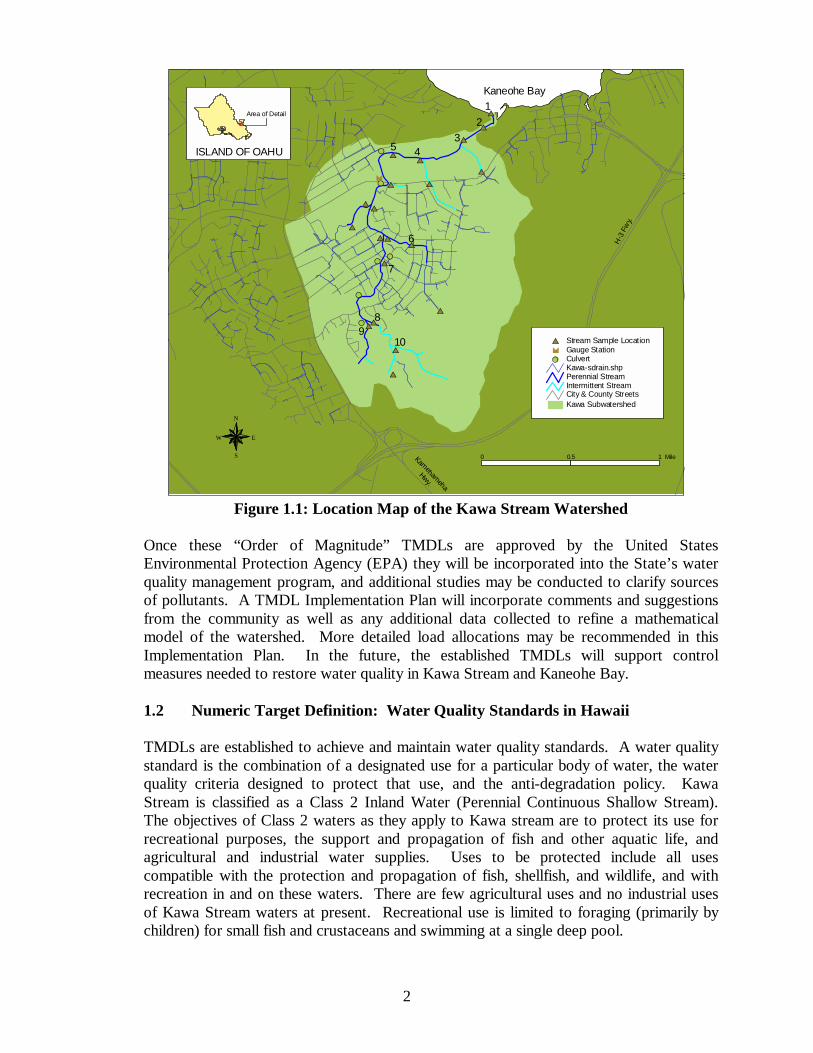
Kawa Stream was identified on the State’s 1999 list of WQLS as impaired by total suspended solids (TSS), turbidity, and nutrients - compounds of nitrogen and phosphorus. These specific substances were investigated as potential pollutants of Kawa Stream that limit beneficial uses of these and adjacent waters. The Kawa Stream watershed is a small, largely urban basin on the windward side of Oahu (Figure 1.1). Lessons learned in this TMDL study can be applied to larger, more complex watersheds during future TMDL studies. Kawa Stream was also selected for early study because of the concern that pollutants carried by the stream could impact its receiving waters in Kaneohe Bay. Kaneohe Bay supports coral reef growth and is designated as Class "AA" coastal waters, but also contains a WQLS where coastal waters do not meet the water quality standards for the class designation.
This report investigates the levels of TSS, turbidity, and nutrients under low flow (base flow) and storm flow conditions and incorporates this information into two mathematical models of the watershed. The first creates a detailed hydrological model of the watershed that is combined with pollutant concentrations at different stages of a rainfall event. The second, simpler model uses a mass balance approach with matrix multiplication. The models assist in predicting the source, transport, and fate of water and pollutants in the watershed. We propose the establishment of wet and dry season base flow TMDLs for total nitrogen (TN) in Kawa Stream. During the course of the study, measurements of TSS and total phosphorous (TP) were within limits established by the State during base flow conditions. However, turbidity was found to be out of compliance. It is difficult to establish a TMDL for turbidity because this measurement is not a mass and cannot be computed as a load without reference and transformation to a mass-based measurement such as TSS. However, turbidity is directly related to TSS and probably also to TP associated with runoff. We propose therefore to establish TMDLs for both TSS and TP at the level of existing State water quality standards to assist in the control of turbidity. Under storm flow conditions TP slightly exceeds State standards, and both turbidity and TN are significantly above desired levels. Because of the direct relationship between TSS and turbidity/TP under storm conditions, a TMDL should also be established for TSS during storm runoff conditions.
2
#S
#S
#S#S
#S
#S
£
$T
$T
$T$T$T
$T
$T$T$T
$T
$T $T
$T
$T
$T
$T$T
$T
$T
$T
Kawa SubwatershedCity & County StreetsIntermittent StreamPerennial StreamKawa-sdrain.shp
#S Culvert£ Gauge Station$T Stream Sample Location
N
EW
S
ISLAND OF OAHU
#
Area of Detail
Kaneohe Bay
H-3
Fw
y.
Kamehameha
Hwy.
0 0.5 1 Mile
12
345
6
7
89
10
Figure 1.1: Location Map of the Kawa Stream Watershed
Once these “Order of Magnitude” TMDLs are approved by the United States Environmental Protection Agency (EPA) they will be incorporated into the State’s water quality management program, and additional studies may be conducted to clarify sources of pollutants. A TMDL Implementation Plan will incorporate comments and suggestions from the community as well as any additional data collected to refine a mathematical model of the watershed. More detailed load allocations may be recommended in this Implementation Plan. In the future, the established TMDLs will support control measures needed to restore water quality in Kawa Stream and Kaneohe Bay.
1.2 Numeric Target Definition: Water Quality Standards in Hawaii
TMDLs are established to achieve and maintain water quality standards. A water quality standard is the combination of a designated use for a particular body of water, the water quality criteria designed to protect that use, and the anti-degradation policy. Kawa Stream is classified as a Class 2 Inland Water (Perennial Continuous Shallow Stream). The objectives of Class 2 waters as they apply to Kawa stream are to protect its use for recreational purposes, the support and propagation of fish and other aquatic life, and agricultural and industrial water supplies. Uses to be protected include all uses compatible with the protection and propagation of fish, shellfish, and wildlife, and with recreation in and on these waters. There are few agricultural uses and no industrial uses of Kawa Stream waters at present. Recreational use is limited to foraging (primarily by children) for small fish and crustaceans and swimming at a single deep pool.
3
Kawa Stream, like most perennial Hawaiian streams, is characterized by periods of relatively steady base flow and short periods of higher flow resulting from heavy rains in the watershed. Physical and chemical properties of the stream water can vary between these two types of flow, as well as between storms of different magnitudes and at different times during storm flow. The study approach requires making water quality measurements at specified locations, which permits linkage of substances carried by the flow with sources in the watershed. Historical and ongoing water quality monitoring data are used to indicate which parameters are out of compliance with their respective water quality standards. Ideally, monitoring should distribute samples across wet and dry seasons (for which different criteria may apply) and be unbiased with respect to hydrologic and polluting events occurring in the watershed.
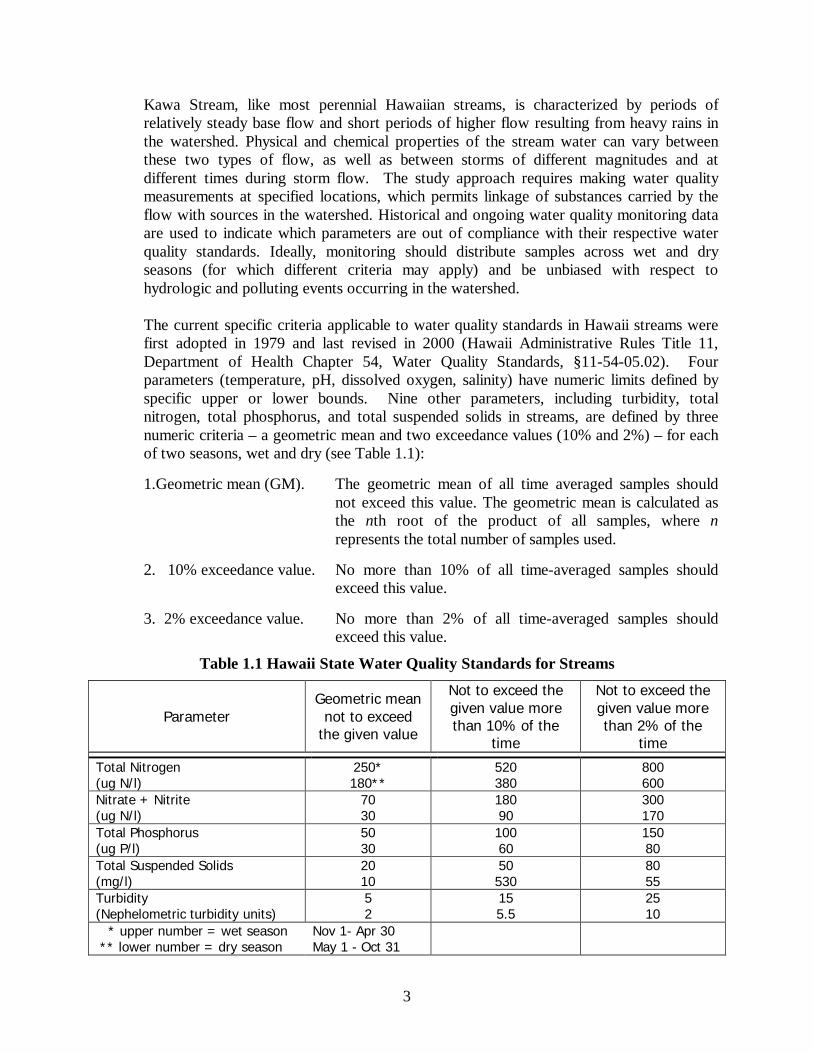
The current specific criteria applicable to water quality standards in Hawaii streams were first adopted in 1979 and last revised in 2000 (Hawaii Administrative Rules Title 11, Department of Health Chapter 54, Water Quality Standards, §11-54-05.02). Four parameters (temperature, pH, dissolved oxygen, salinity) have numeric limits defined by specific upper or lower bounds. Nine other parameters, including turbidity, total nitrogen, total phosphorus, and total suspended solids in streams, are defined by three numeric criteria – a geometric mean and two exceedance values (10% and 2%) – for each of two seasons, wet and dry (see Table 1.1):
1.Geometric mean (GM). The geometric mean of all time averaged samples should
not exceed this value. The geometric mean is calculated as the nth root of the product of all samples, where n represents the total number of samples used.
2. 10% exceedance value. No more than 10% of all time-averaged samples should
exceed this value.
3. 2% exceedance value. No more than 2% of all time-averaged samples should exceed this value.
Table 1.1 Hawaii State Water Quality Standards for Streams
Parameter Geometric mean
not to exceed the given value
Not to exceed the given value more than 10% of the
time
Not to exceed the given value more than 2% of the
time
Total Nitrogen (ug N/l)
250* 180**
520 380
800 600
Nitrate + Nitrite (ug N/l)
70 30
180 90
300 170
Total Phosphorus (ug P/l)
50 30
100 60
150 80
Total Suspended Solids (mg/l)
20 10
50 530
80 55
Turbidity (Nephelometric turbidity units)
5 2
15 5.5
25 10
* upper number = wet season ** lower number = dry season
Nov 1- Apr 30 May 1 - Oct 31
4
The objective of the TMDLs established in this document is to assure that water quality standards will be attained in Kawa Stream when pollutant loads are reduced to the prescribed levels. TMDL-driven improvements in water quality will support aquatic life and recreational uses within Kawa Stream and control plankton blooms, eutrophication and sedimentation in the receiving waters of Kaneohe Bay. Specifically, the TMDL for nitrogen for Kawa Stream is intended to assure that a geometric mean level of 250 µg/l (wet season) and 180 µg/l (dry season) is not exceeded throughout the Kawa Stream system. The goal of the TSS TMDL is to reduce suspended sediment loads, primarily during storm induced flows, to within state standards as these waters enter the Kawa Stream estuary. The TMDL for TSS will limit total suspended solids to a mean of 10 mg/l during the dry season, and 20 mg/l during the wet season and storm flows.
5
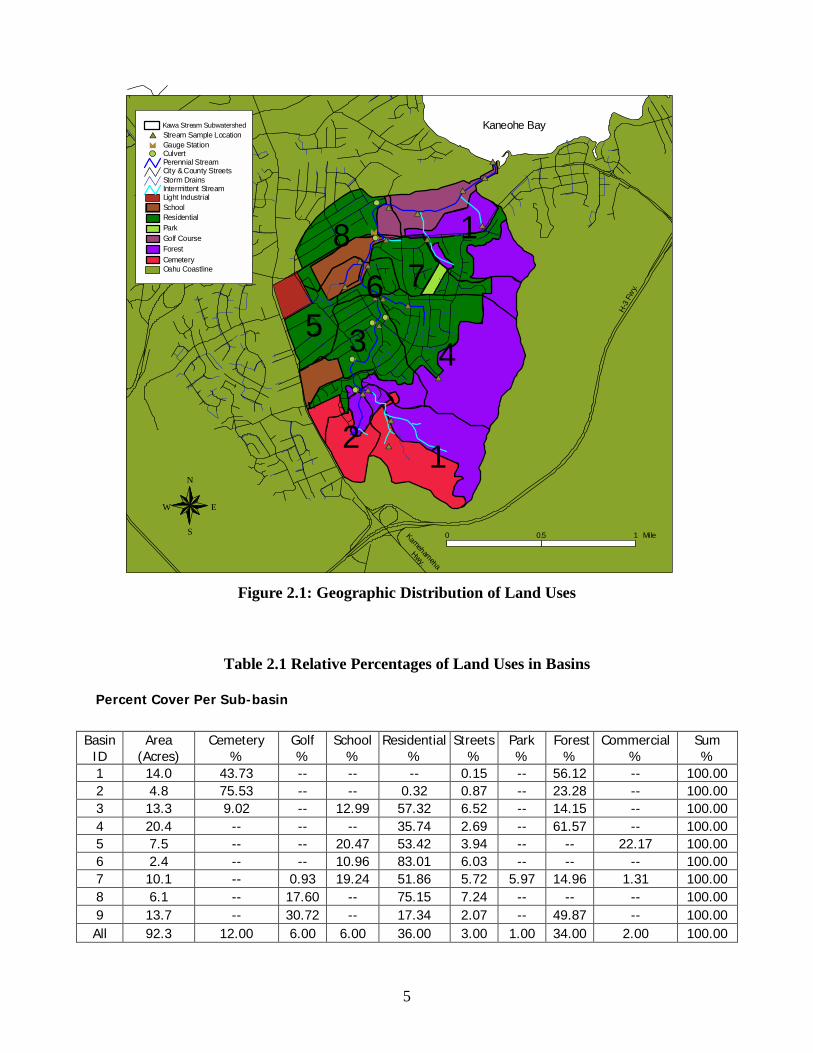
Figure 2.1: Geographic Distribution of Land Uses
Table 2.1 Relative Percentages of Land Uses in Basins
Percent Cover Per Sub-basin
Basin ID
Area (Acres)
Cemetery %
Golf %
School%
Residential %
Streets %
Park %
Forest %
Commercial %
Sum %
1 14.0 43.73 -- -- -- 0.15 -- 56.12 -- 100.00 2 4.8 75.53 -- -- 0.32 0.87 -- 23.28 -- 100.00 3 13.3 9.02 -- 12.99 57.32 6.52 -- 14.15 -- 100.00 4 20.4 -- -- -- 35.74 2.69 -- 61.57 -- 100.00 5 7.5 -- -- 20.47 53.42 3.94 -- -- 22.17 100.00 6 2.4 -- -- 10.96 83.01 6.03 -- -- -- 100.00 7 10.1 -- 0.93 19.24 51.86 5.72 5.97 14.96 1.31 100.00 8 6.1 -- 17.60 -- 75.15 7.24 -- -- -- 100.00 9 13.7 -- 30.72 -- 17.34 2.07 -- 49.87 -- 100.00 All 92.3 12.00 6.00 6.00 36.00 3.00 1.00 34.00 2.00 100.00
(X
(X
(X(X
(X
(X
£
$T
$T
$T$T$T
$T
$T$T$T
$T
$T$T
$T
$T
$T
$T$T
$T
$T
$T
N
EW
S
Kaneohe Bay
H-3
Fwy.
Kamehameha
Hwy.
1
1
4
2
356
87
0 0.5 1 Mile
Oahu CoastlineCemeteryForestGolf CourseParkResidentialSchoolLight IndustrialIntermittent StreamStorm DrainsCity & County StreetsPerennial Stream
(X Culvert£ Gauge Station$T Stream Sample Location
Kawa Stream Subwatershed
6
2.0 SETTING AND WATER QUALITY DESCRIPTION
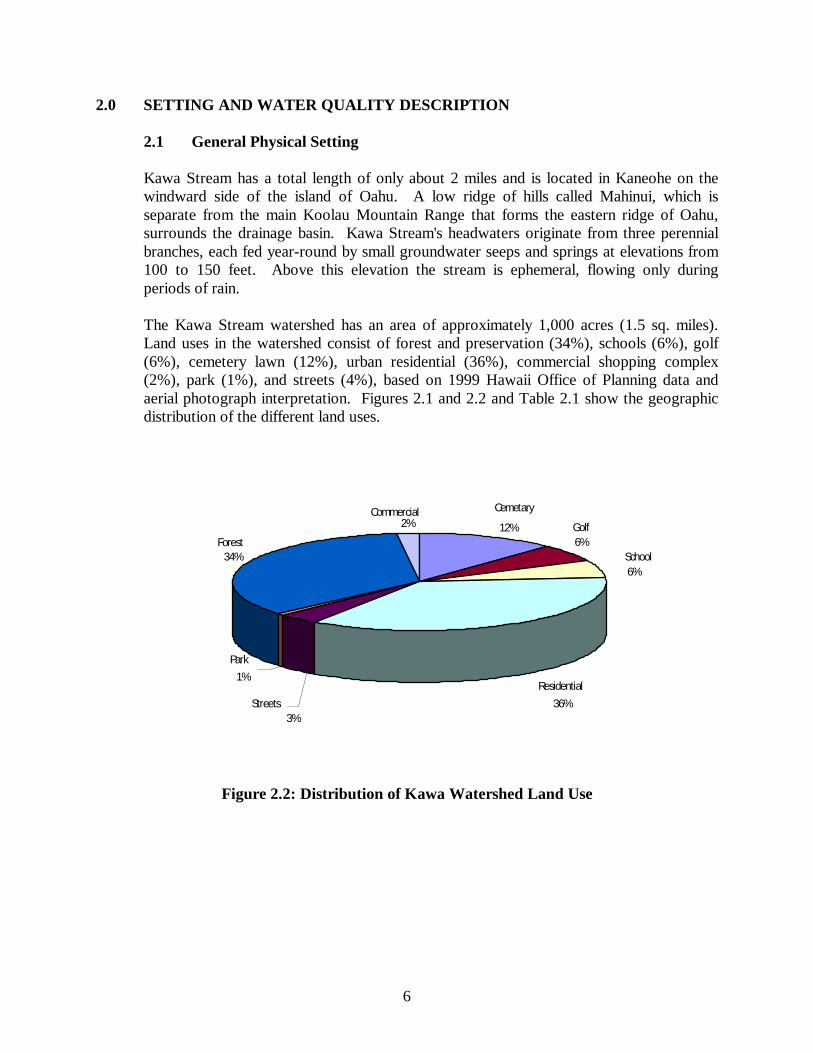
2.1 General Physical Setting Kawa Stream has a total length of only about 2 miles and is located in Kaneohe on the windward side of the island of Oahu. A low ridge of hills called Mahinui, which is separate from the main Koolau Mountain Range that forms the eastern ridge of Oahu, surrounds the drainage basin. Kawa Stream's headwaters originate from three perennial branches, each fed year-round by small groundwater seeps and springs at elevations from 100 to 150 feet. Above this elevation the stream is ephemeral, flowing only during periods of rain. The Kawa Stream watershed has an area of approximately 1,000 acres (1.5 sq. miles). Land uses in the watershed consist of forest and preservation (34%), schools (6%), golf (6%), cemetery lawn (12%), urban residential (36%), commercial shopping complex (2%), park (1%), and streets (4%), based on 1999 Hawaii Office of Planning data and aerial photograph interpretation. Figures 2.1 and 2.2 and Table 2.1 show the geographic distribution of the different land uses.
Figure 2.2: Distribution of Kawa Watershed Land Use
Cemetary
12% Golf 6%
School 6%
Residential 36% Streets
3%
Park 1%
Forest 34%
Commercial2%

7
Figure 2.3: Basins 1 & 2
2.2 Description of Watershed Basins
For purposes of this study, the watershed was divided into eight sub-watershed basins. The location of each basin is noted in Figure 2.1. Physical descriptions of each basin and the associated stream reaches are as follows: Basin 1 Basins 1, 4, 7, and 9 include the forested crest of the watershed bordering the low hills to the east of Pikoiloa subdivision. Within Basin 1 this forest (0.13 mi2) and two cemeteries (Veterans and Hawaiian Memorial Park; 0.10 mi2) occupy all of the land (Figure 2.1). Paved roadways within the cemeteries comprise the only other land use category present. This subwatershed includes the main or central branch of Kawa Stream and other intermittent branches draining forested lands down to the confluence with the upper west branch. Water flowing out of this basin is sampled at water quality Station 08R. Stations 009 and 010A (see Figure 2.3) are further up in the basin, and samples from Station 010A mostly represent cemetery runoff collected in underground drains. The upper east branch of Kawa Stream drains the forested slopes immediately east of the cemetery (see Figure 2.4). This forest is dominated by large and small albizia trees (Paraserianthes falcataria) which provide the backdrop for the Hawaii Veterans
#S
$T
$T
$T$T
$T
008L
08R
010A
009
LELEUA PL
KUMAKUA PL
N
EW
S
Oahu CoastKawa Subwatershed Boundary5 ft. ContoursCity & County StreetsIntermittent StreamPerennial StreamStorm Drain
#S Culvert$T Stream Sample Location
1
4
2
H-3 FWY.
KAM HWY.
Underground CemeteryDrainage
8
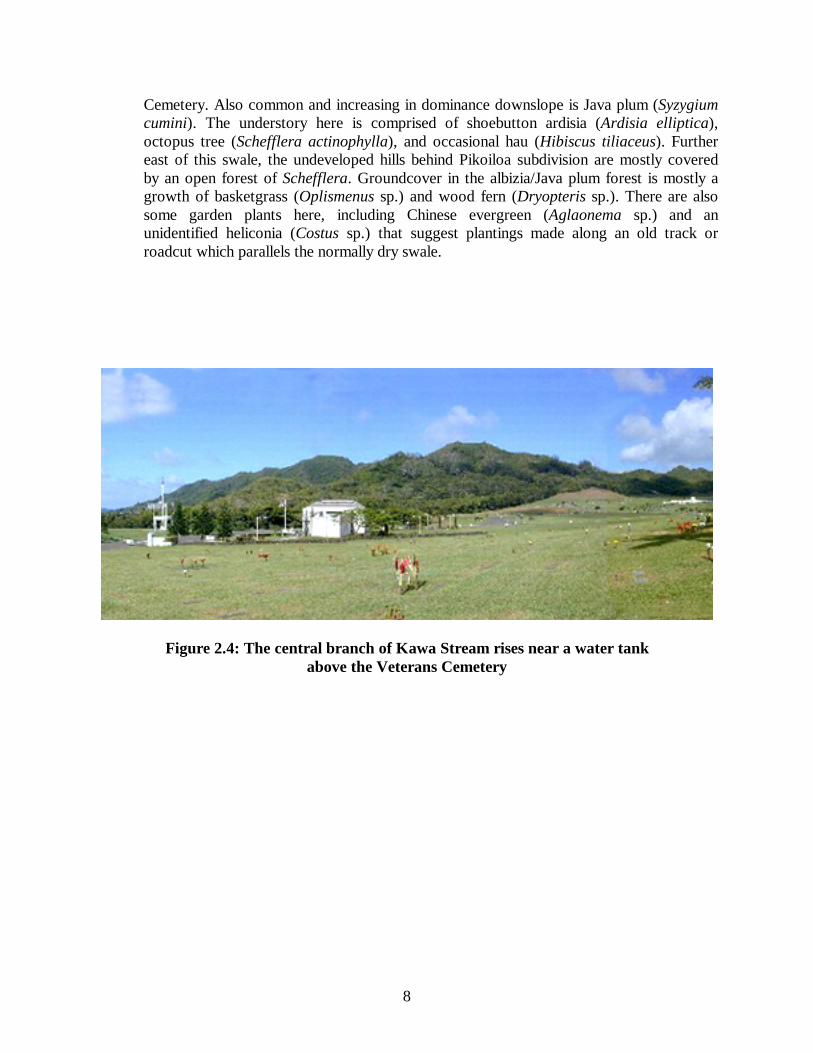
Cemetery. Also common and increasing in dominance downslope is Java plum (Syzygium cumini). The understory here is comprised of shoebutton ardisia (Ardisia elliptica), octopus tree (Schefflera actinophylla), and occasional hau (Hibiscus tiliaceus). Further east of this swale, the undeveloped hills behind Pikoiloa subdivision are mostly covered by an open forest of Schefflera. Groundcover in the albizia/Java plum forest is mostly a growth of basketgrass (Oplismenus sp.) and wood fern (Dryopteris sp.). There are also some garden plants here, including Chinese evergreen (Aglaonema sp.) and an unidentified heliconia (Costus sp.) that suggest plantings made along an old track or roadcut which parallels the normally dry swale.
Figure 2.4: The central branch of Kawa Stream rises near a water tank above the Veterans Cemetery
9
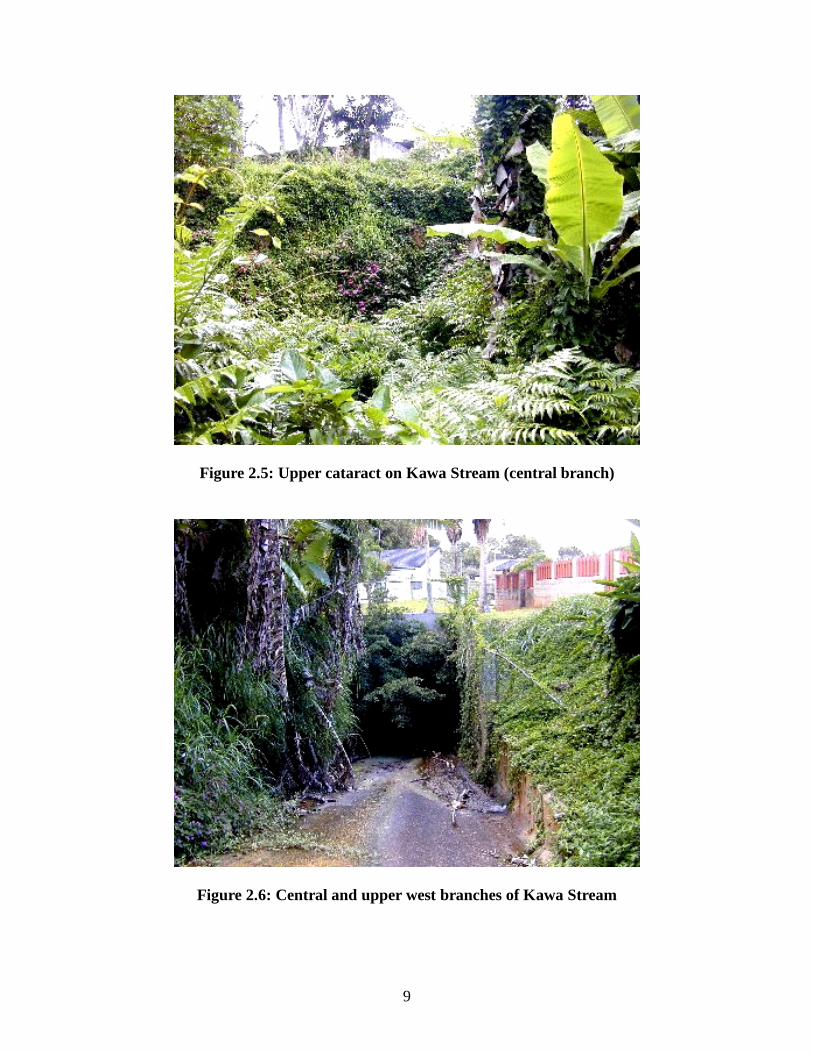
Figure 2.5: Upper cataract on Kawa Stream (central branch)
Figure 2.6: Central and upper west branches of Kawa Stream
10
Although the incision of a channel is evident in the forest floor, it lacks a distinct bed and is completely covered with basket grass. This swale is joined by at least one other from the east, then joins the central branch just above a new culvert crossing constructed for the expansion of Hawaiian Memorial Park. The historical central branch of Kawa Stream arises near the water tank above the Veterans Cemetery. The stream channel through the small valley below the water tank is now buried beneath the cemetery lawn (Figure 2.4). Grated drains collect sheet flow from the upper parts of the lawn and roadways, directing this flow into pipe culverts and eventually to an outlet structure located just inside the Veterans Cemetery entrance. This part of Kawa Stream may be perennial and seeps out into an open concrete box-culvert discharging vertically onto a concrete-rubble-masonry (CRM) lined channel where a pond forms behind a debris dam of mostly California grass (Brachiaria mutica). The "pond" is inhabited by melanid and apple snails (Melanoides tuberculata and Pomacea canaliculata). Streamflow is discontinuous (interrupted) downstream of this pool. Scattered, small pools of water inhabited by melanid snails are present just above the new cemetery annex road and box culvert. The forest here is mostly Java plum with occasional mango (Mangifera indica). Again, only small, isolated pools are present below the box culvert. The channel of the stream is clearly evident as a steep-sided incision 0.5 to 1.0 m deep. Downslope this channel disappears into a grove of hau just above Kumakua Place in Parkway subdivision. Streamflow emerging from the hau is directed around the houses on Kumakua Place between two parallel hollow-tile walls. Here, the normally dry streambed is overgrown with California grass. This "channel" terminates above a basalt rock face some 8-10 m high, partly covered by arabian balsam or busy lizzy (Impatiens wallerana) (Figure 2.5). A cataract (or intermittent waterfall) below Kumakua Place marks the reestablishment of uninterrupted perennial streamflow. More or less permanent seeps contribute to small pools among boulders at the base of the cliff and the streambed is over-grown with neke fern (Cyclosorus interruptus). Streamflow from below the cataract is small but steady through a steep-sided gulch covered in Java plum and numerous juvenile cinnamon trees (Cinnamomum sp.) on one side and mostly banana (Musa x paradisiaca) behind houses and yards on the other. Streamflow is directed into a concrete collection chute (Figure 2.6) just behind Parkway Community Center. It is at this point that the central branch is joined by the upper west branch (Basin 2). Visual observation over a number of years suggests that base flow in the upper west branch is sometimes greater than that in the central branch.
11
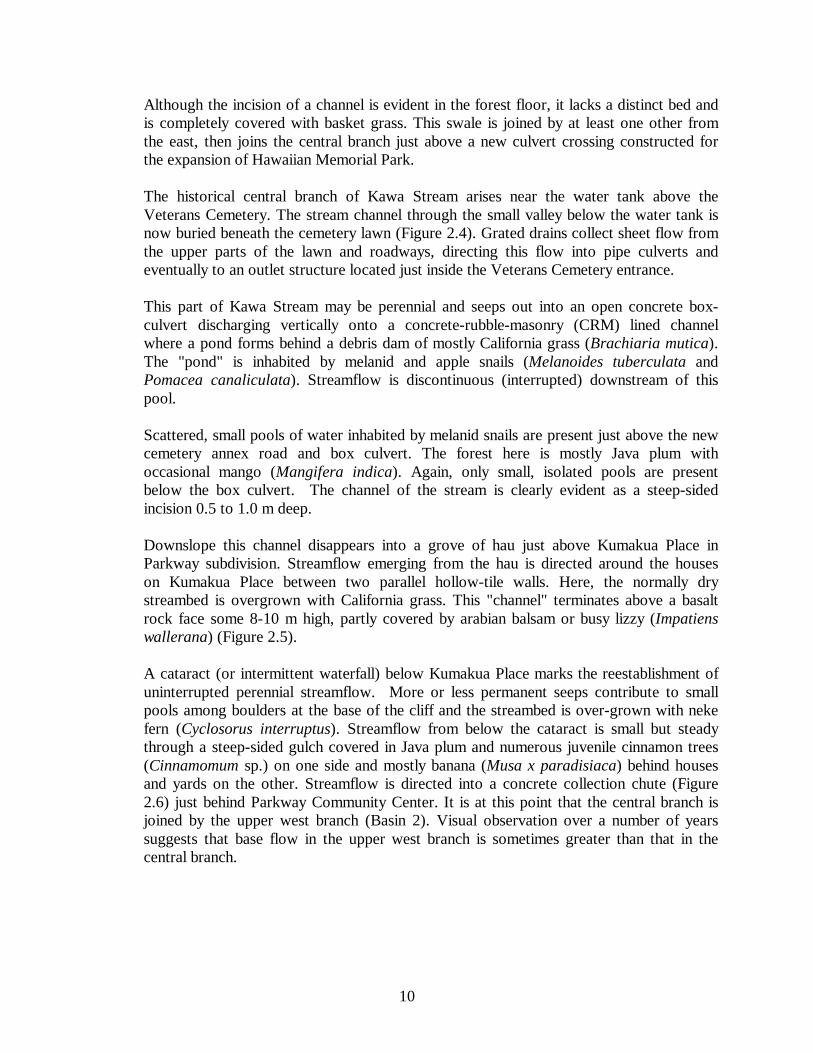
Basin 2 The upper boundaries of Basins 2, 3, and 5 follow Kamehameha Highway and border the Kaneohe Stream watershed. Basin 2 is almost entirely cemetery (Hawaiian Memorial Park, 0.06 mi2) except for the forested gulch (0.02 mi2) of the upper west branch of Kawa Stream (Figure 2.2). Outflow from this basin is sampled at Station 08L (DOH Station 8). A smaller tributary of the upper west branch arises in a swale behind the Hawaiian Memorial Park baseyard (behind the upper end of Leleua Place). The margins of the ravine at the head end are quite high and steep. This tributary joins with the branch described above at the recently constructed culvert where the cemetery road crosses to the newly opened portion of the cemetery.
Figure 2.7: Basins 3 & 4
#S
#S
#S#S
$T
$T
$T$T
$T
$T
$T$T$T
$T
006R006L
008L
007
08R
016
018
009
LELEUA PL
KUMAKUA PL
NAMOKU ST
PUAHUULA PL
MOKULELE DR
MIKIHILINA ST
Oahu CoastKawa Subwatershed Boundary5 ft. ContoursCity & County StreetsIntermittent StreamPerennial StreamStorm Drain
#S Culvert$T Stream Sample Location
2
N
EW
S
5
3
6
4
12
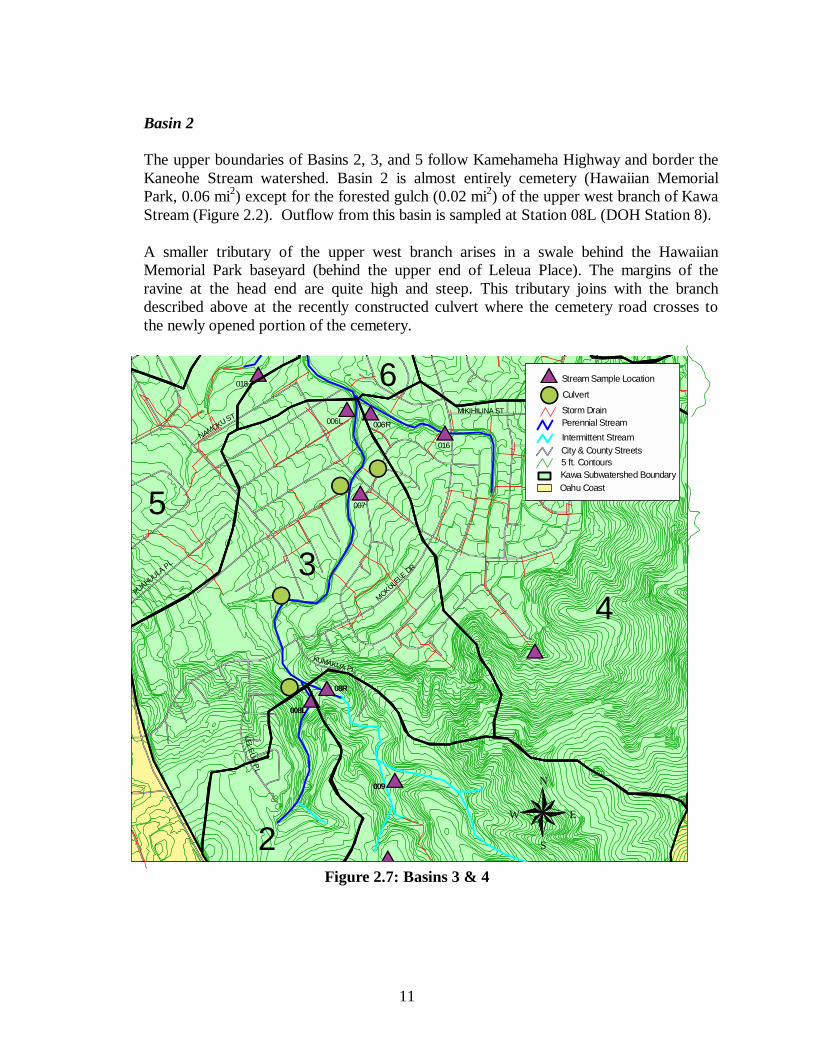
Basin 3 Basin 3 straddles the upper reach of Kawa Stream’s central branch between its upstream confluence with the upper branches and its downstream confluence with the east branch (see Figure 2.7). Although some forested area is included (0.03 mi2), the majority of Basin 3 is residential housing and streets (0.13 mi2) (see Figure 2.1). The area also includes Kaneohe Elementary School (0.07 mi2). Water quality in this segment of Kawa Stream is monitored at Station 007, although Station 06L marks the lowest point in the subwatershed. Runoff water quality during storms was measured at culverts C1, C3, and C4, all of which collect drainage from residential areas. The concrete chute behind the Parkway Community Recreation Center (Figure 2.5) directs flow into a large box culvert that sits beneath the lawn adjacent to the Center and under Mokulele Drive. The culvert emerges uncovered around a broad turn that carries flow through the Parkway subdivision between concrete, vertical walls some 4-5 meters high (Figure 2.8). This structure can be viewed from Mokulele Street in Parkway subdivision or the end of Koa Kahiko Street in Pikoiloa subdivision.
Figure 2.8: Concrete culvert along the lower portion of the Parkway subdivision
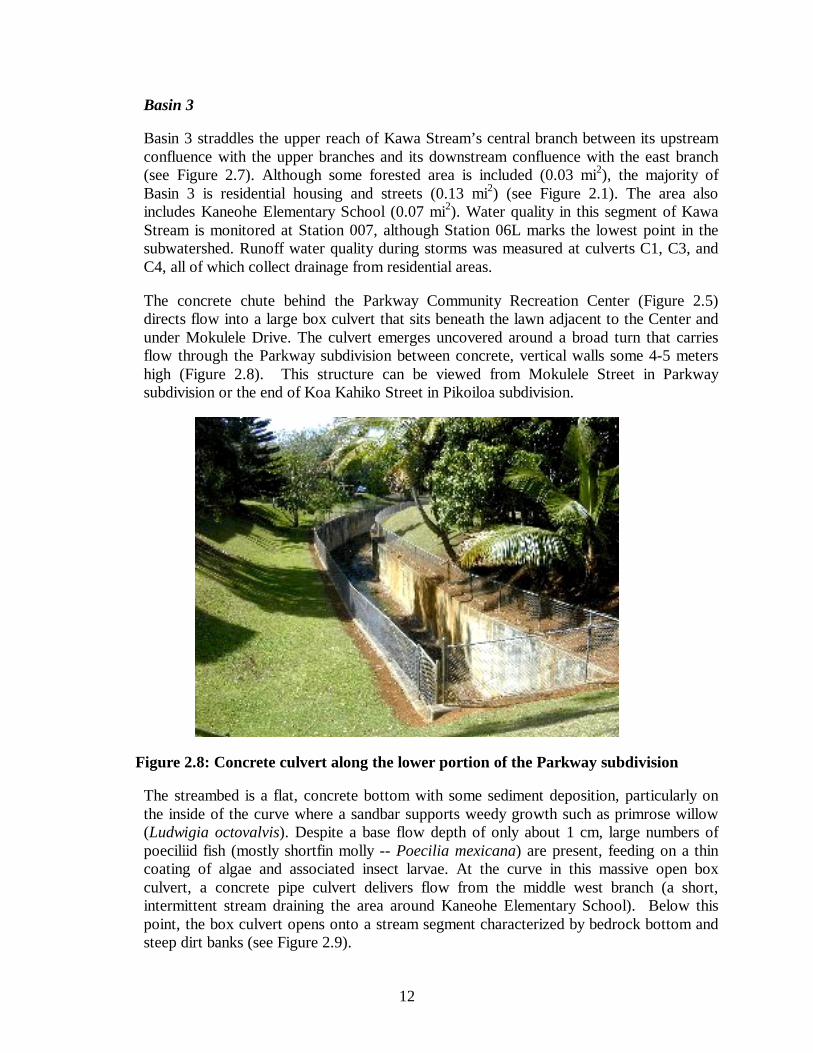
The streambed is a flat, concrete bottom with some sediment deposition, particularly on the inside of the curve where a sandbar supports weedy growth such as primrose willow (Ludwigia octovalvis). Despite a base flow depth of only about 1 cm, large numbers of poeciliid fish (mostly shortfin molly -- Poecilia mexicana) are present, feeding on a thin coating of algae and associated insect larvae. At the curve in this massive open box culvert, a concrete pipe culvert delivers flow from the middle west branch (a short, intermittent stream draining the area around Kaneohe Elementary School). Below this point, the box culvert opens onto a stream segment characterized by bedrock bottom and steep dirt banks (see Figure 2.9).
13
Figure 2.9: Kawa Stream view upstream from Namoku Street Bridge
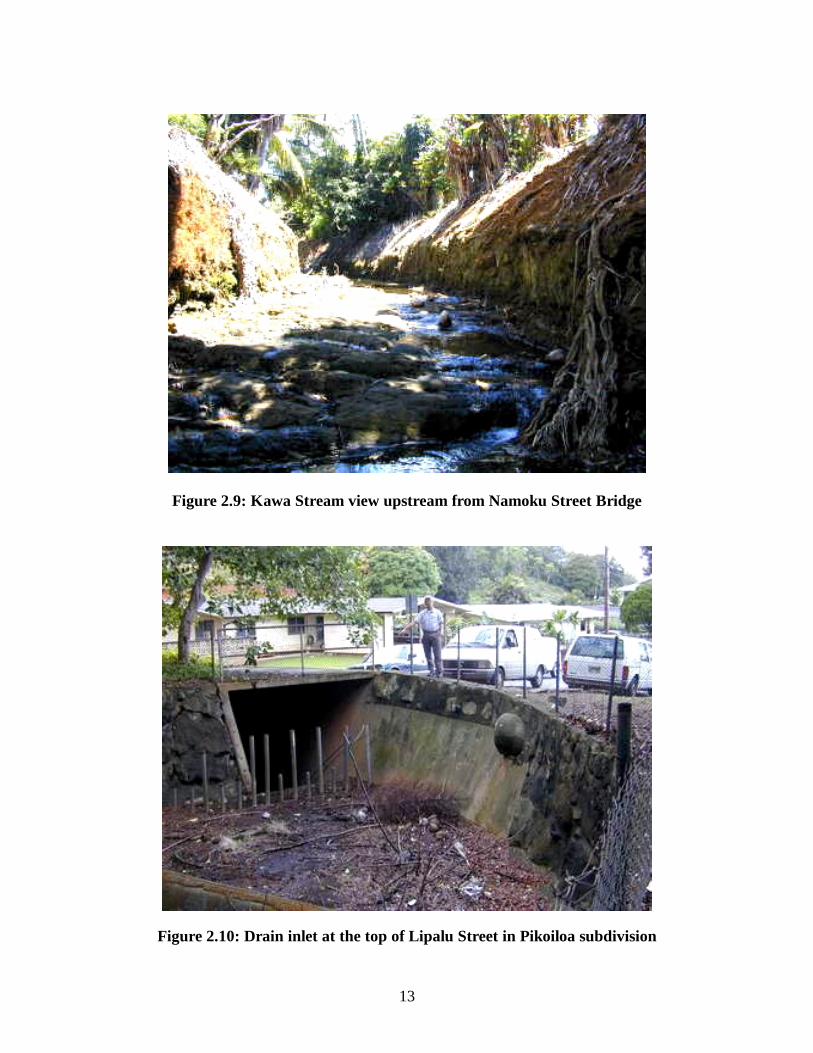
Figure 2.10: Drain inlet at the top of Lipalu Street in Pikoiloa subdivision
14
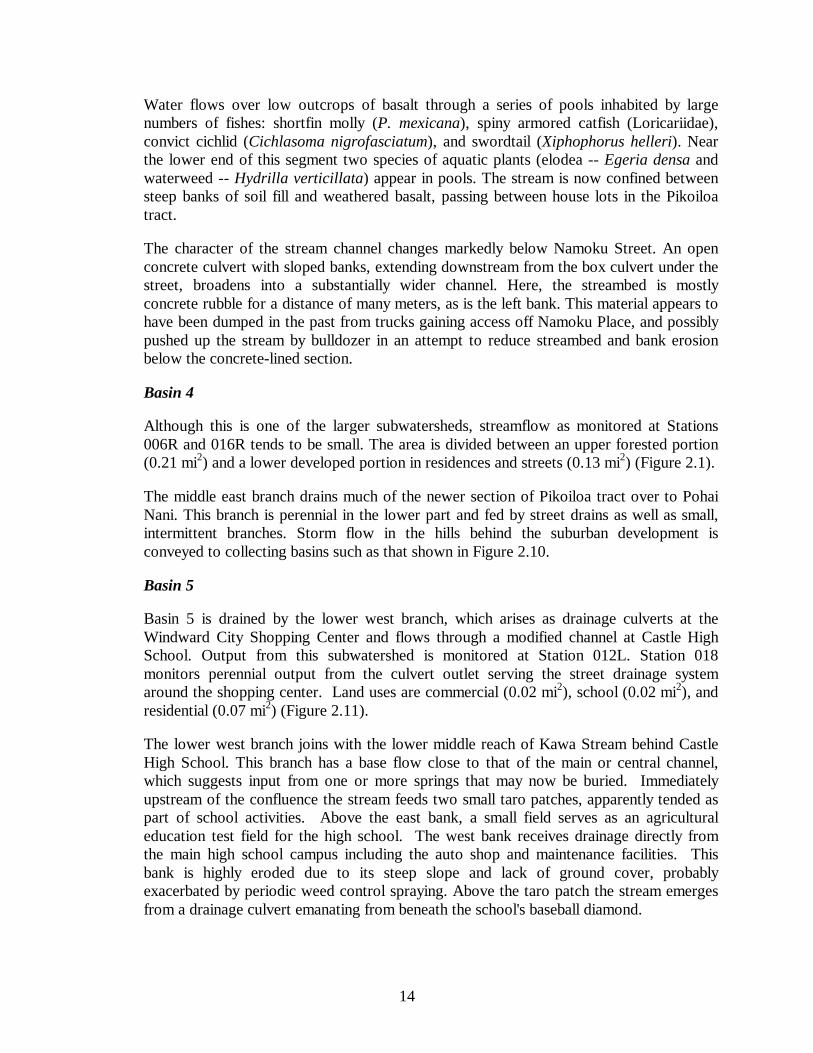
Water flows over low outcrops of basalt through a series of pools inhabited by large numbers of fishes: shortfin molly (P. mexicana), spiny armored catfish (Loricariidae), convict cichlid (Cichlasoma nigrofasciatum), and swordtail (Xiphophorus helleri). Near the lower end of this segment two species of aquatic plants (elodea -- Egeria densa and waterweed -- Hydrilla verticillata) appear in pools. The stream is now confined between steep banks of soil fill and weathered basalt, passing between house lots in the Pikoiloa tract. The character of the stream channel changes markedly below Namoku Street. An open concrete culvert with sloped banks, extending downstream from the box culvert under the street, broadens into a substantially wider channel. Here, the streambed is mostly concrete rubble for a distance of many meters, as is the left bank. This material appears to have been dumped in the past from trucks gaining access off Namoku Place, and possibly pushed up the stream by bulldozer in an attempt to reduce streambed and bank erosion below the concrete-lined section. Basin 4 Although this is one of the larger subwatersheds, streamflow as monitored at Stations 006R and 016R tends to be small. The area is divided between an upper forested portion (0.21 mi2) and a lower developed portion in residences and streets (0.13 mi2) (Figure 2.1). The middle east branch drains much of the newer section of Pikoiloa tract over to Pohai Nani. This branch is perennial in the lower part and fed by street drains as well as small, intermittent branches. Storm flow in the hills behind the suburban development is conveyed to collecting basins such as that shown in Figure 2.10. Basin 5
Basin 5 is drained by the lower west branch, which arises as drainage culverts at the Windward City Shopping Center and flows through a modified channel at Castle High School. Output from this subwatershed is monitored at Station 012L. Station 018 monitors perennial output from the culvert outlet serving the street drainage system around the shopping center. Land uses are commercial (0.02 mi2), school (0.02 mi2), and residential (0.07 mi2) (Figure 2.11). The lower west branch joins with the lower middle reach of Kawa Stream behind Castle High School. This branch has a base flow close to that of the main or central channel, which suggests input from one or more springs that may now be buried. Immediately upstream of the confluence the stream feeds two small taro patches, apparently tended as part of school activities. Above the east bank, a small field serves as an agricultural education test field for the high school. The west bank receives drainage directly from the main high school campus including the auto shop and maintenance facilities. This bank is highly eroded due to its steep slope and lack of ground cover, probably exacerbated by periodic weed control spraying. Above the taro patch the stream emerges from a drainage culvert emanating from beneath the school's baseball diamond.
15
Figure 2.11: Basins 5, 6, & 7 Old topographic maps suggest that this swale was filled and leveled to create the baseball diamond and a portion of the adjacent football field. Beyond the school bounds this drain pipe receives storm runoff from the Pikoiloa Street residential community and the Windward City Shopping Center. Basin 6 This subwatershed borders both sides of a short segment of the middle reach of Kawa Stream between stations 06L and 012R. Nearly all of the area is developed as residential neighborhood and streets (0.04 mi2). A small area (<0.01 mi2) in agricultural use at Castle High School is included and could be a potential source of nutrients. The lower middle reach extends from the confluence with the east branch to the confluence with the lower west branch emanating from behind Castle High School. This segment is characterized by a series of natural and man-made drops and, in places, shows evidence of substantial bed erosion. Water flows through long pools separated by run and riffle zones, or else drops over concrete culvert structures. Much of the rocky rip-rap streambed is composed of broken and eroded concrete rocks.
£
#S
#S#S
#S
$T
$T$T$T
$T
$T$T
$T
$T
$T
$T
006R006L
012R012L
022
005
004
007
016
018
Unsampled
NAMOKU ST
PUAHUULA PL
MOKULELE D
R
MIKIHILINA ST
PUAAE RD
MO
KULELE D
R
NAKULUAI STKOA KAHIKO ST
AUMOKU ST
PUOHALA ST
KANEOHE BAY DR
Oahu CoastKawa Subwatershed Boundary5 ft. ContoursCity & County StreetsIntermittent StreamPerennial StreamStorm Drain
#S Culvert$T Stream Sample Location
Gauge Station£
N
EW
S
35
6
7
89
16
Basin 7 Like the previous subwatershed, this basin consists of two areas bordering a short segment of Kawa Stream, here between stations 012R and 022 (Kaneohe Bay Drive bridge). However, street drains bring runoff in from some distance on both sides - as far away as McDonalds at Kaneohe Shopping Center to the west and the crest of the eastern hills above Pohai Nani to the east. Land uses are park (0.01 mi2), school (0.03 mi2), residential (0.09 mi2), and forest (0.02 mi2) (Figure 2.11). This short reach begins at the junction of the lower middle reach and the Castle High School branch and flows under Kaneohe Bay Drive to an abandoned stream gauging about 100 feet below the highway. A concrete spillway opposite the Ron L. Bright Theater dumps flow onto a bedrock segment of increasing steepness as the stream turns east then north and flows under Kaneohe Bay Drive. This segment receives runoff from the urban neighborhood on its east bank, the high school and the Kaneohe Bay Drive on its west bank. The west bank adjacent to Castle High School consists of steep, bare slopes and terraces covered with low, weedy vegetation including beggar's tick (Bidens pilosa), sow thistle (Sonchus oleraceus), and prostrate spurge (Chamaesyce prostrata). The east bank along this segment is mostly protected by a sloped concrete wall protecting the yards of Pahikaua Estates residential lots on Puaae Place and Pouhanuu Place and Way.
17
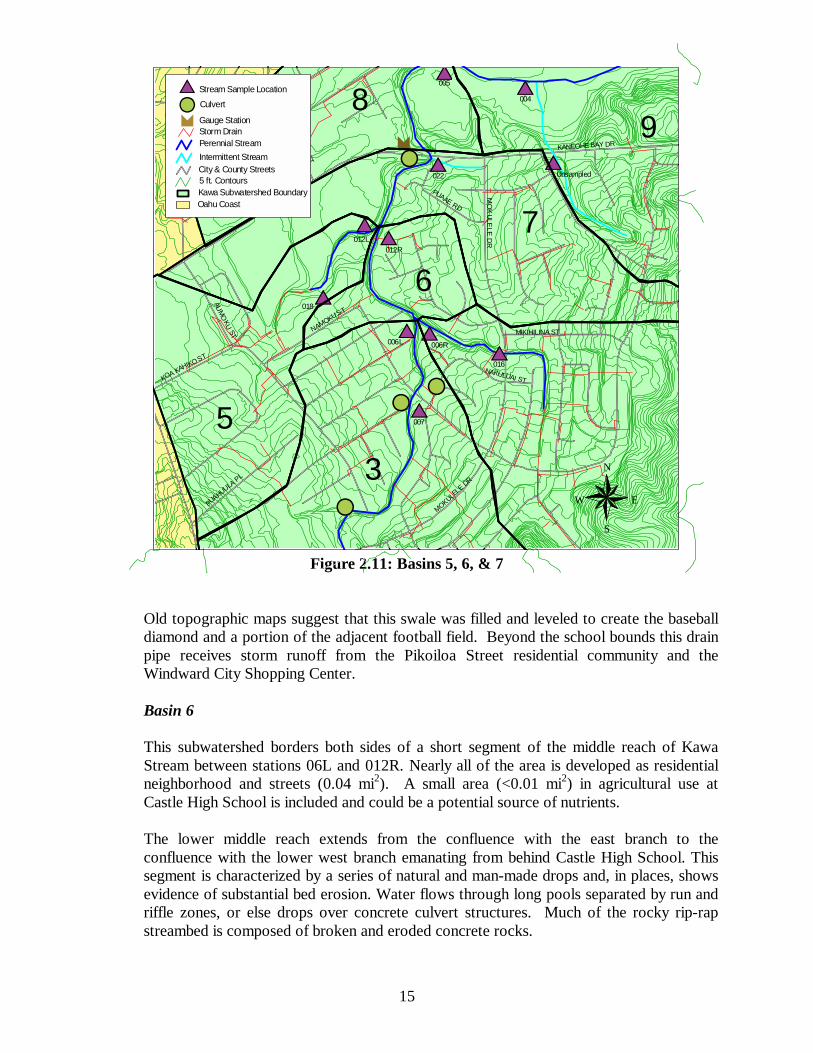
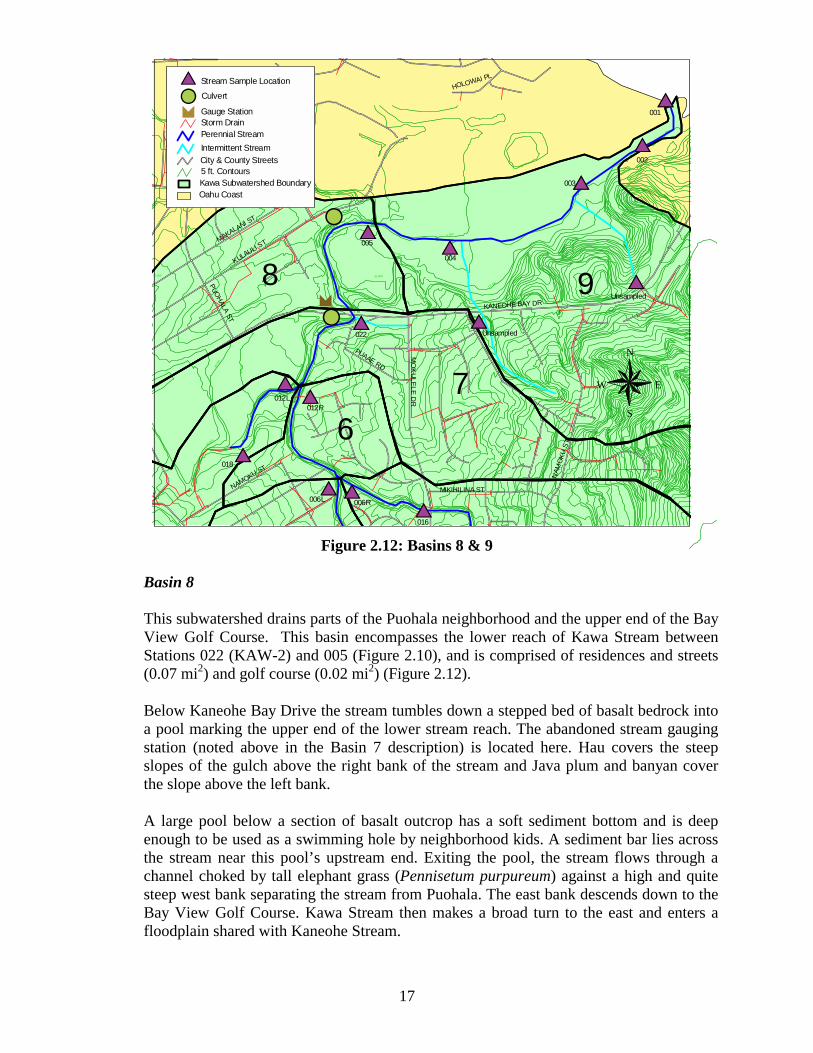
Figure 2.12: Basins 8 & 9 Basin 8
This subwatershed drains parts of the Puohala neighborhood and the upper end of the Bay View Golf Course. This basin encompasses the lower reach of Kawa Stream between Stations 022 (KAW-2) and 005 (Figure 2.10), and is comprised of residences and streets (0.07 mi2) and golf course (0.02 mi2) (Figure 2.12). Below Kaneohe Bay Drive the stream tumbles down a stepped bed of basalt bedrock into a pool marking the upper end of the lower stream reach. The abandoned stream gauging station (noted above in the Basin 7 description) is located here. Hau covers the steep slopes of the gulch above the right bank of the stream and Java plum and banyan cover the slope above the left bank. A large pool below a section of basalt outcrop has a soft sediment bottom and is deep enough to be used as a swimming hole by neighborhood kids. A sediment bar lies across the stream near this pool’s upstream end. Exiting the pool, the stream flows through a channel choked by tall elephant grass (Pennisetum purpureum) against a high and quite steep west bank separating the stream from Puohala. The east bank descends down to the Bay View Golf Course. Kawa Stream then makes a broad turn to the east and enters a floodplain shared with Kaneohe Stream.
£#S
#S
$T$T$T
$T
$T$T
$T
$T
$T
$T
$T
$T
$T
$T
006R006L
012R012L
022
005
004
Unsampled
001
016
018
002
003
Unsampled
NAMOKU ST
MIKIHILINA ST
PUAAE RD
MO
KULELE D
R
T
PUOHALA ST
KANEOHE BAY DR
MAKALANI ST
KULAULI ST
HOLOWAI PL
NAM
OKU
ST
5.000
10. 000
65. 000
70.000
75.0 00
15. 000
10. 000
85.000
105.
000
80.0
00
85.000
90. 000
95.
0 00
0
75. 000
Oahu CoastKawa Subwatershed Boundary5 ft. ContoursCity & County StreetsIntermittent StreamPerennial StreamStorm Drain
#S Culvert$T Stream Sample Location
Gauge Station£
8
N
EW
S
67
9
18
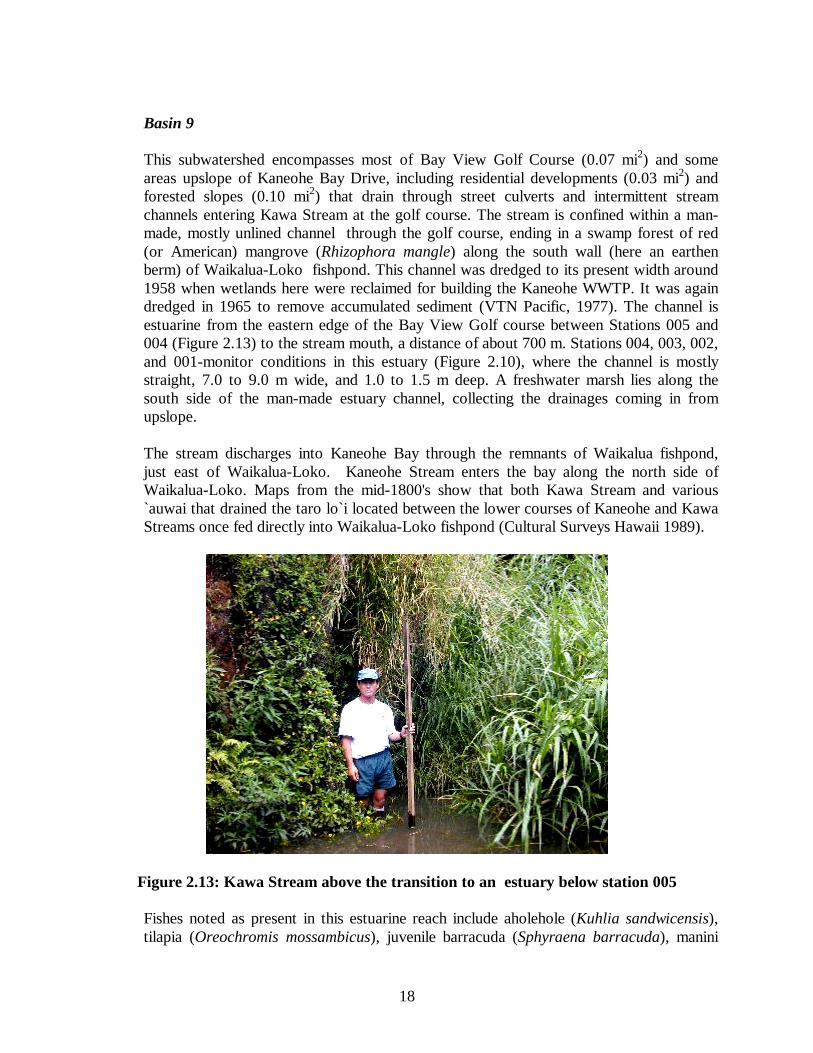
Basin 9 This subwatershed encompasses most of Bay View Golf Course (0.07 mi2) and some areas upslope of Kaneohe Bay Drive, including residential developments (0.03 mi2) and forested slopes (0.10 mi2) that drain through street culverts and intermittent stream channels entering Kawa Stream at the golf course. The stream is confined within a man-made, mostly unlined channel through the golf course, ending in a swamp forest of red (or American) mangrove (Rhizophora mangle) along the south wall (here an earthen berm) of Waikalua-Loko fishpond. This channel was dredged to its present width around 1958 when wetlands here were reclaimed for building the Kaneohe WWTP. It was again dredged in 1965 to remove accumulated sediment (VTN Pacific, 1977). The channel is estuarine from the eastern edge of the Bay View Golf course between Stations 005 and 004 (Figure 2.13) to the stream mouth, a distance of about 700 m. Stations 004, 003, 002, and 001-monitor conditions in this estuary (Figure 2.10), where the channel is mostly straight, 7.0 to 9.0 m wide, and 1.0 to 1.5 m deep. A freshwater marsh lies along the south side of the man-made estuary channel, collecting the drainages coming in from upslope. The stream discharges into Kaneohe Bay through the remnants of Waikalua fishpond, just east of Waikalua-Loko. Kaneohe Stream enters the bay along the north side of Waikalua-Loko. Maps from the mid-1800's show that both Kawa Stream and various `auwai that drained the taro lo`i located between the lower courses of Kaneohe and Kawa Streams once fed directly into Waikalua-Loko fishpond (Cultural Surveys Hawaii 1989).
Figure 2.13: Kawa Stream above the transition to an estuary below station 005 Fishes noted as present in this estuarine reach include aholehole (Kuhlia sandwicensis), tilapia (Oreochromis mossambicus), juvenile barracuda (Sphyraena barracuda), manini

19
(Acanthurus triostegus), and jack (Caranx sp.), as well as several native gobies and blennies (Eleotris sandwicensis, Stenogobius hawaiiensis, & Awaous guamensis). Invertebrates include oysters, barnacles (Balanus sp.), grapsid crab (Metopograpsus thukuhar), blue-pincher crab (Thalamita sp.) and `opae oeha`a (Macrobrachium grandimanus). One is likely to see red-eared slider (Trachemys scripta elegans) turtles in the lower and estuarine reaches of Kawa Stream. In addition to the central branch and tributaries discussed above, an additional 4 or 5 small tributaries drain into the Kawa Stream estuary. In these intermittent streams, as in the middle east branch, swales in the hills behind Pikoiloa subdivision drain to culvert inlets at the forest/suburban boundary during storms. These freshets are then diverted through pipe culverts that discharge to channels on the seaward side of Kaneohe Bay Drive (except for the open swale forming the back boundary of the Nohonani Place subdividision between Namoku Street and Kaneohe Bay Drive at Keana Road). To the west, these small streams drain into grass-dominated wetlands that are remnants of formerly more extensive lowland marshes now surrounded by Bay View Golf Course. Drainages further east are all intermittent, with some entering a narrow mangrove belt along the southern shore of Kaneohe Bay that begins near Kokokahi YWCA.
2.3 Historical Studies and Background Information
Historical data for Kawa Stream includes water quality monitoring at several locations in the lower part of the watershed in 1991-92 (AECOS 1992) and 1996 (Marine Research Consultants 1997) and streamflow monitoring in 1999 (Nance 1999). Biological surveys were conducted by Brewer/Brandman Associates (1989) and Filbert & Englund (1995). A one-year monitoring effort (September 1999 through September 2000) by the State of Hawaii Department of Health (DOH) included stations ranging from the mouth of Kawa Stream, through the estuary, and upstream to just above the residential district. In this program, samples were collected twice a month on predetermined dates (i.e., sampling was not biased with respect to events, such as rain storms). These samples define the general, or baseline, water quality conditions in this stream system during the period of study. Samples were analyzed at the State DOH laboratory for total dissolved nutrients, TSS, and turbidity. Because total dissolved nutrients is a fraction of the total nutrients component, we assume for the purposes of this report that the DOH data represent total nutrients, with any differences between the two adding to the margin of safety. Samples obtained by AECOS and Oceanit as part of this study typically represent storm event samples and were analyzed and reported by AECOS as total nutrients, TSS, and turbidity.
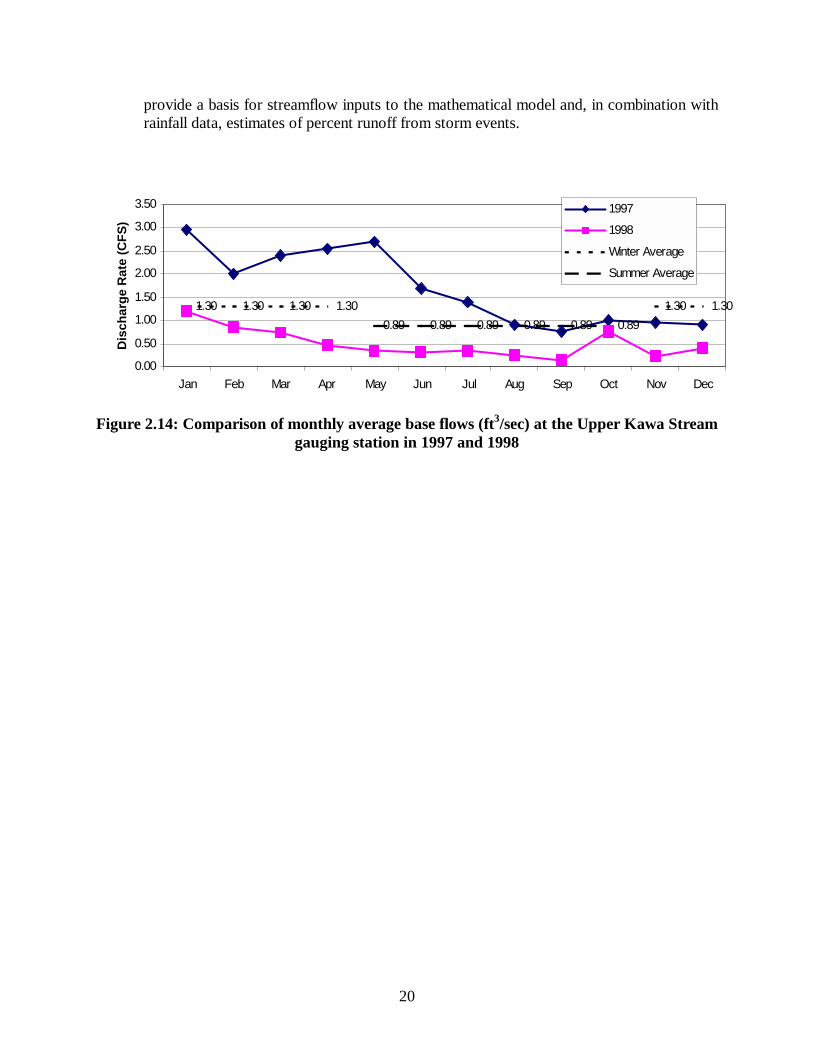
A hydrologic study of the lower stream reach was conducted in association with an application for a well pumping permit for the Bay View Golf Course (Nance 1999). Nance recorded water levels in the stream at two weirs for a period of two years, 1997 and 1998. The report provides documentation of the base flow of Kawa Stream over two winter and two summer seasons (Figure 2.14), and additional data for three events showing the stream response to small, medium and large storm events. These data
20
provide a basis for streamflow inputs to the mathematical model and, in combination with rainfall data, estimates of percent runoff from storm events.
1.30 1.30 1.30 1.30 1.30 1.300.89 0.89 0.89 0.89 0.89 0.89
0.00
0.50
1.00
1.50
2.00
2.50
3.00
3.50
Jan Feb Mar Apr May Jun Jul Aug Sep Oct Nov Dec
Dis
char
ge R
ate
(CFS
)
1997
1998
Winter Average
Summer Average
Figure 2.14: Comparison of monthly average base flows (ft3/sec) at the Upper Kawa Stream gauging station in 1997 and 1998
21
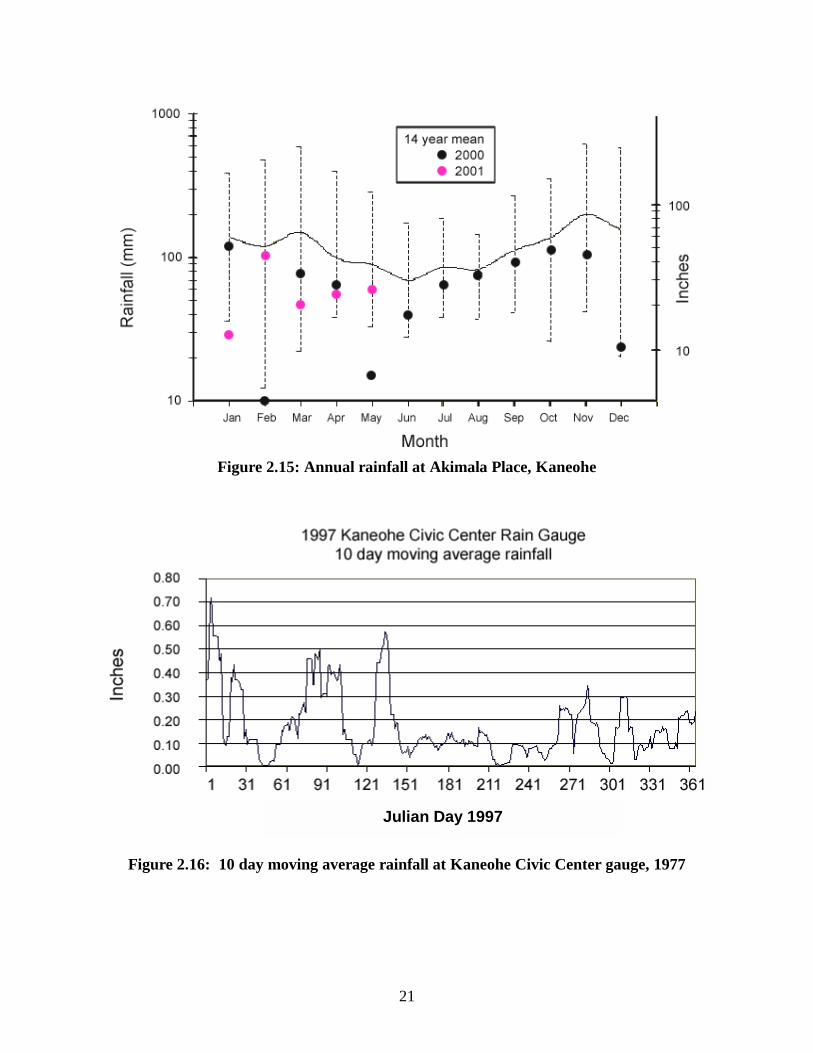
Figure 2.15: Annual rainfall at Akimala Place, Kaneohe
Figure 2.16: 10 day moving average rainfall at Kaneohe Civic Center gauge, 1977
Julian Day 1997

22
2.4 General Weather Impacting Watershed
Rainfall in Hawaii is the result of five primary phenomena: 1) oceanic tradewind showers; 2) orographic lifting and thermal trapping of moisture-laden tradewinds against high mountain peaks (tradewind inversion); 3) island-wide storm fronts associated with North Pacific low pressure systems; 4) subtropical storms (Kona storms, roughly 1/yr); and 5) hurricanes (roughly 1/10yr). Of these five the subtropical storms and hurricanes are the most intense and most rare. According to the National Weather Service, Oahu typically receives four to eight major island-wide frontal system storms per winter, with each storm producing an average of 1 to 5 inches of rain over a 1 to 3 day period. Most of Oahu's rainfall is the result of daily orographic lift along the central mountain ranges. The steep windward slope of the Koolau range (to about 2,400 feet) causes uplift of the approaching tradewind clouds, resulting in significant rainfall within about a mile of the ridge. The Kawa Stream watershed, which is no more than 900 feet high and about 3 miles away from the central island ridge, is thus beyond the effect of these typical showers and is primarily subject to rainfall resulting from oceanic tradewind showers and from large weather systems causing rainfall over the entire island. These showers tend to be most frequent in the morning and evening. They and are often intense, short-duration, and spatially limited. For example, a typical tradewind rain shower might have a diameter of a mile or two and be moving with the tradewinds at 5 to 15 mph. This event, from the perspective of a single point on land, will have a duration of 4 to 20 minutes during which time 0.1 to 0.5 inches of rain may fall. Rainfall was measured during the entire period of the TMDL study. Data are available from three automated rain gauges - one at the center of the watershed and two outside, but near, the watershed boundary. Between November 4, 1999 and January 9, 2000, rainfall was manually recorded twice daily (7 am and 7 pm) using a TruCheck gauge located near Kawa Stream on Akimala Place in Kaneohe at the center of the watershed. Gauge elevation was approximately 30 m (100 ft) above sea level. However, during selected storms in concert with stream freshet monitoring, readings were made at 15 or 30-minute intervals. After January 9, 2000 an automated, tipping-bucket rain gauge (Onset Computer) was set up at the same location to record total rainfall at 15-minute intervals. Total annual rainfall averages about 52 inches but can vary widely from year to year. For modeling purposes, rainfall data for 1997 and 1998 were utilized to corresponded with the stream flow data collected during this period by Nance (1999). Figure 2.15 compares mean monthly rainfall recorded at Akimala Place, Kaneohe over the past 14 years (solid line is the mean for 1985 -1999) with the monthly totals for 2000 and 2001. Vertical bars show the range of monthly totals recorded for each month of the year. The logarithmic scale on the vertical axis tends to smooth out differences between wet and dry seasons. However, the higher average rainfall and much greater variability in total rainfall during wet season months (September through April in Kaneohe) as compared with dry season months (May - August) are evident. Monthly rainfall was below average for the project period (2000-2001) at this location and at Kaneohe Civic
23
Center. February 2000, May 2000, and January 2001 set new records for lowest monthly rainfall since 1985.
Figure 2.16 shows the variation in daily rainfall for 1997 at the Kaneohe Civic Center using a 10-day moving average daily. 1997 was a relatively wet year with a total of 66 inches of precipitation (average = 52 in/yr). Even using the 10-day moving average to smooth the data, rainfall appears to be sporadic but corresponds well with base streamflow for this period as measured by Nance (1999).
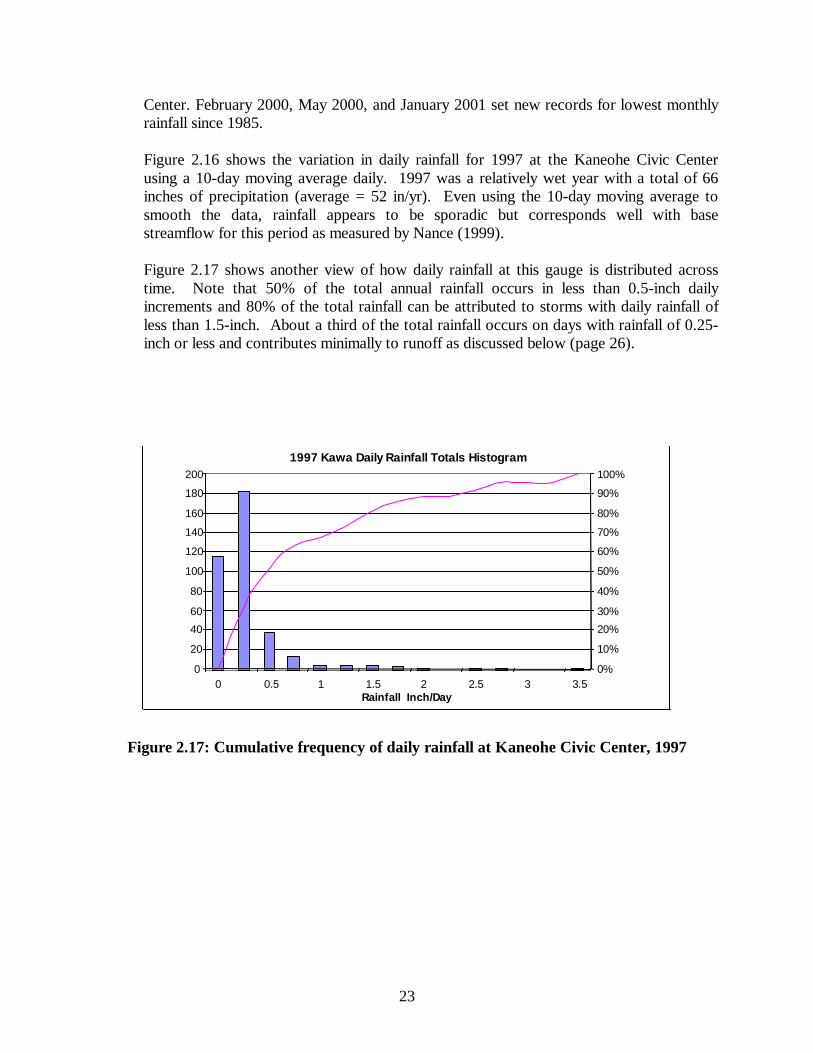
Figure 2.17 shows another view of how daily rainfall at this gauge is distributed across time. Note that 50% of the total annual rainfall occurs in less than 0.5-inch daily increments and 80% of the total rainfall can be attributed to storms with daily rainfall of less than 1.5-inch. About a third of the total rainfall occurs on days with rainfall of 0.25-inch or less and contributes minimally to runoff as discussed below (page 26).
Figure 2.17: Cumulative frequency of daily rainfall at Kaneohe Civic Center, 1997
1997 Kawa Daily Rainfall Totals Histogram
0 20 40 60 80
100 120 140 160 180 200
0 0.5 1 1.5 2 2.5 3 3.5 Rainfall Inch/Day
0% 10% 20% 30% 40% 50% 60% 70% 80% 90% 100%
24
3.0 METHODS AND RATIONALE OF DATA COLLECTION Kawa Stream has three major water sources that separately influence its water quality:
1) ground water that flows in from springs or seeps in along the stream channel; 2) overland flow that runs off of the ground during and after rainfall; and 3) human-induced overland flow that occurs independent of rainfall.
As water flows over the surface and through the soils of the watershed, it picks up numerous substances (like nutrients and sediments), dissolves some of them (e.g. nitrates), and carries the substances into the open stream channel or down to the groundwater sources. As the stream flows through the channel it erodes the streambed and stream banks, adding to the load of particulate and dissolved pollutants transported downstream. As streamflow increases, so does its capacity to pick-up and carry pollutants. However, because a heavy rain (as compared with a drier baseflow period) may contribute a volume of water that is relatively larger than the available mass of dissolvable pollutant, the actual concentration of dissolved pollutants in the stream might decrease (although the pollutant load is actually increasing) until runoff subsides. Sources of streamflow and stream pollutants that are not directly associated with rainfall further complicate the situation. Public and private groundwater sources are used for irrigation and maintenance of school, park, and cemetery facilities, sometimes in conjunction with fertilizer applications. Runoff from these activities and from domestic water uses - such as landscape irrigation, car washing, and swimming pool maintenance - may enter storm drains and stream channels and can even return to groundwater sources. Because the entire community is sewered, there should be negligible nutrient input from cesspools. The main sewer line does cross under the stream bed in at least two locations and the possibility of occasional leakage and overflow events should be considered in the future. Ideally we can track each substance back along its flow path to find out where excess pollutants were introduced. However, even in a small watershed like the Kawa Stream basin, this is a practical impossibility and we must resort to a sampling protocol and analytical methods to segregate pollutant sources within the watershed. Our approach was to divide the watershed into sub-basins based upon stream and watershed morphology. Essentially each basin is its own watershed, with multiple environmental characteristics, land uses, and zoning. Our primary sampling stations were aligned at the base of each watershed to determine the impacts to stream water quality from each individual basin. Data from stations at the base of basins 1, 2, 4, and 5 characterize water quality emanating only from these specific areas, whereas data from stations at the base of basins 3, 6, 7, 8, and 9 show the cumulative effects of water quality impacts from all areas upstream, including other basins. The State of Hawaii Department of Health (DOH) conducted twice-monthly sampling at 8 to 10 locations on Kawa Stream (the stream is intermittent at the uppermost stations) between September 1999 and September 2000 (25 events). None of these samples were collected during storm event periods when runoff would influence water quality. The DOH data are divided into two sets representing Wet Season (November-April) and Dry Season (May-October) samples.

25
Water quality results from regular monitoring at these stations are posted on the World Wide Web at http://www.aecos.com/jobs/kawatmdl.html. The following DOH sampling locations are shown in Figure 1.1: Station 001 - Kaneohe Bay at mouth of Kawa Stream (Basin 9) Station 002 - Kawa Stream estuary in mangrove upstream of mouth (Basin 9) Station 003 - Kawa Stream estuary upstream of Waikalua-Loko (Basin 9) Station 004 - Kawa Stream estuary at Bayview, lower golf cart bridge (Basin 9) Station 005 - Kawa Stream at Bayview, upper golf cart bridge (Basin 8) Station 006 - Middle east branch down from Mokulele Street bridge (Basin 4) Station 007 - Kawa Stream just upstream of Namoku Street bridge (Basin 3) Station 008 - Upper west branch above Parkway Community Center (Basin 2) Station 009 - Kawa Stream above new culvert at Hawaiian Memorial Park (Basin 1) Station 010 - Kawa Stream above confluence with upper west branch (Basin 1) The station numbers assigned by the DOH (1 through 10) were maintained in our subsequent sampling plan. Additional stations sampled only by the Oceanit/AECOS team. Oceanit/AECOS samples were collected during storm events (“runoff influenced”) and periods of non-storm baseflow (“non-runoff influenced”). Interpretation of whether a sample was taken during runoff influenced or non-runoff influenced conditions was a subjective judgment based upon local rainfall data and the on-site observations of professional scientists and water quality monitoring technicians. Data in tables labeled “HDOH” are from the DOH monthly sampling protocol only. Data labeled “non-runoff influenced” are a combination of the DOH data and Oceanit/AECOS data collected when there was no storm runoff to the stream.
26
4.0 EXISTING POLLUTANT LOADS AND SOURCE ANALYSIS
4.1 Overview This section describes how the existing nutrient and TSS loads in the stream were determined and how TMDLs and load allocations were developed to guide Kawa Stream into compliance with State Water Quality Standards. The first section reviews and summarizes the water quality data collected and interprets this information in terms of loadings from the watershed. Then we describe how flow rates in the stream were obtained and interpreted. The next section describes the modeling framework for simulating nutrient loads, hydrology, and water quality responses. The assessment investigates water quality responses assuming different stream flow and nutrient loading conditions. The final section presents the modeling results in terms of TMDLs and load allocations.
4.2 Determination of Constituent Concentrations in Streamflow and Storm
Runoff
Hawaii's water quality standards (Chapter 54 of Title 11 of the Hawaii Administrative Rules – see Table 1.1) provide numeric concentration criteria against which actual conditions in Kawa Stream can be assessed. These conditions were characterized by measurements obtained during a regular monitoring program that is unbiased about conditions influencing stream flow (i.e., the DOH 1999-2000 monthly monitoring program) and by measurements obtained during an event-driven monitoring program emphasizing rainy periods (AECOS stormwater monitoring). Results from both monitoring programs contribute to our understanding of where and how pollutants reach Kawa Stream. Data summaries are presented here for:
• = Baseline – samples collected and analyzed by DOH • = Wet and Dry Seasonal - DOH and AECOS data obtained during periods of no rainfall
and partitioned into winter wet season (wet) and summer dry season (dry) • = Storm Conditions - AECOS data collected during rain storm and runoff events 4.2.1 Water Quality Characterization
• = Suspended Solids
Streams accomplish work in the watershed: they erode the land and move the loosened material downslope and, eventually, into the sea. This solid material is carried by the stream as bed load, suspended particles, and floating debris. Measurement of suspended particulates is usually expressed as TSS (total suspended solids). Turbidity is often used as a substitute for TSS as turbidity methods, based on light reflectance off suspended particles, agree well with visual perceptions of water clarity. However, turbidity can vary for a given TSS (weight of particulate load per unit volume of water) depending upon the size, reflectance, and color of the suspended particles. The mix of particle types may be further complicated by biological activities, which may vary with daily periodicity. For a given stream corridor, turbidity and TSS will typically vary together but the linear correlation between these measurements is often poor.

27
Table 4. 1 Baseline Turbidity and Total Suspended Solids (Geometric Means)
Station HDOH Station Number
Turbidity (ntu)
TSS (mg/l)
Turbidity/ TSS ratio
Station 10 (= 008R) 1.8 1.8 1.0 Station 8 (= 008L) 5.7 3.9 1.5 Station 007 10.1 5.6 1.7 Station 6 (= 016) 8.9 5.6 1.5 Station 005 6.2 2.8 2.1 Grand means 6.8 4.1 1.7 State dry season criteria State wet season criteria
2.0 5.0
10.0 20.0
std. dev. 2.9 - 16 1.6 - 10 n (data set) = 98 106 98
NOTE: Station 10 means based upon only 7 events (June-September 2000)
Table 4.2 Wet and Dry Season Turbidity and Total Suspended Solids Compared with State Water Quality Standards Criteria
Turbidity (ntu)
TSS (mg/l)
Turbidity/ TSS ratio
wet season geometric mean 7.3 4.4 1.9 State criteria 5.0 20 dry season geometric mean 6.4 3.9 1.5 State criteria 2.0 10
a 13 dry period events and 12 wet period events, HDOH Stations 5, 6,7, 8, and 10
Table 4.3 Storm Condition. Suspended Particulate Measurements in Kawa Stream (Geometric Means)
Turbidity (NTU) TSS (mg/l) Station Runoff
Influenced Non- Runoff
Runoff Influenced
Non- Runoff
Sta. 010A 26 (4)* ---- 13 (4) ---- Sta. 009 29 (5) ---- 19 (5) ---- Sta. 08R 53 (6) 2 (7) 35 (6) 2 (6) Sta. 08L 31 (6) 5 (25) 18 (6) 4 (25) Sta. 007 73 (32) 9 (29) 53 (30) 5 (28) Sta. 016L 52 (4) 9 (1) 34 (4) 5 (1) Sta. 016R + 006 32 (7) 8 (24) 19 (7) 5 (26) Sta. 012R 60 (6) 7 (3) 47 (5) ---- Sta. 012L 43 (7) 7 (3) 39 (6) ---- Sta. 022 47 (4) 9 (2) 30 (4) 6 (2) Sta. 005 ---- 5 (25) ---- 2 (26) GRAND MEANS 50.7 (81) 6.3 (118) 34 (77) 4 (115) Comparable State criteria
25.0 wet season 2% exceedance
5.5 dry season 10% exceedance
30.0 dry season 10% exceedance
10.0 dry season geom. mean
* sample sizes (n)
28
At stations on Kawa Stream where turbidity and TSS have been monitored regularly over time, baseline values for both tend to increase with distance downstream, peaking in the middle reach around Station 007 (Table 4.1). Somewhere below Station 007, the values tend to decrease as shown by data from Station 005 at the upper end of Bay View Golf Course. Particulates could be expected to increase as one moves down gradient in the watershed due to increased competence of the stream; that is, the volume and velocity of stream water increases as a result of increasing drainage area, resulting in the stream's ability to maintain greater amounts of particulate matter in suspension. The marked decrease in both turbidity and TSS at Station 005 in the lower reach of Kawa Stream likely results from deeper, slow moving pool areas in the downstream waters where stream velocity is retarded and particulates settle out. Note that TSS between Station 007 and Station 005 decreases by about 50 percent, whereas turbidity levels decrease by only about 30 percent. These facts indicate that larger and heavier particles are settling out more readily than the very smallest particles that make the water turbid.
Table 4.2 compares the DOH turbidity and TSS data collected during wet and dry seasons with their respective state water quality standard criteria. Geometric mean turbidity levels for the stream as a whole exceed both wet and dry season criteria, while TSS concentrations are well below the State criteria. These differences raise questions about the synchronicity of State criteria for turbidity and TSS; i.e., shouldn't both parameters either be in compliance with State criteria or not? The answer is "not necessarily".
TSS and nephelometric turbidity are totally different approaches contrived to measure the “dirtiness” of water. TSS directly measures the weight of all suspended particles in the water and relates well to estimates of physical load or land erosion. Turbidity, on the other hand, is a standardized way to measure the reflectance of light by particles suspended in the water and relates well to what the human eye visualizes as the “dirtiness”, or opacity, of water. Waters with identical TSS values can exhibit very different turbidity values depending upon particle size, density, color, and reflectance. Even for a single stream passing through uniform substrate, the turbidity:TSS ratio would be expected to vary with current speed (which changes particle size distribution) and time of day (assuming photosynthetic effects). Laboratory Standard Methods for measurement of turbidity require the technician to wait until a stable reading has been achieved – thereby allowing heavier particles to fall out of the field of measurement.
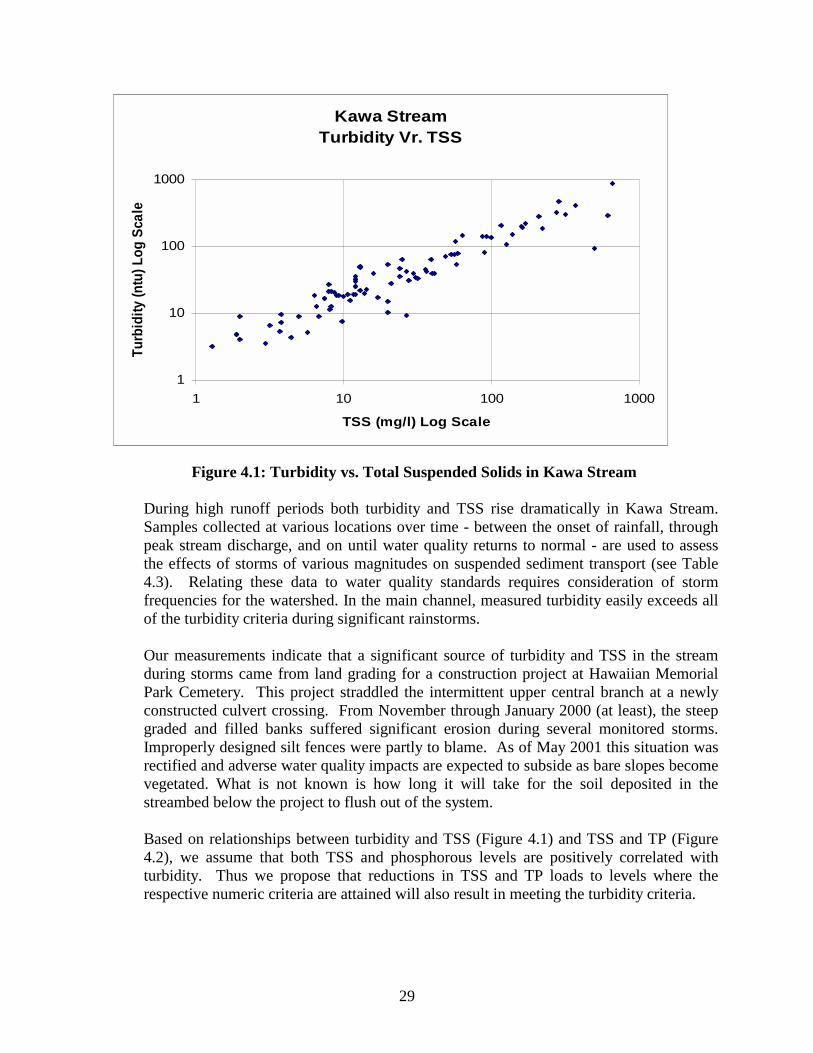
Table 4.1 (DOH and AECOS data) and Figure 4.1 (AECOS data only) show the relationship between TSS and turbidity in Kawa Stream - one can only be used to predict the other to within about half an order of magnitude. A sample (from Kawa Stream) with measured TSS of 10 mg/L (the geometric mean criteria for dry season) would be expected to have a turbidity of about 18 NTU, which could actually be as low as about 8 NTU or as high as 40 NTU. Unfortunately, in either case the turbidity would be significantly above the geometric mean criteria for dry season (2 NTU). Thus in general it appears that the water quality standard for turbidity is much more stringent than that for TSS.
29
Kawa StreamTurbidity Vr. TSS
1
10
100
1000
1 10 100 1000
TSS (mg/l) Log Scale
Turb
idity
(ntu
) Log
Sca
le
Figure 4.1: Turbidity vs. Total Suspended Solids in Kawa Stream
During high runoff periods both turbidity and TSS rise dramatically in Kawa Stream. Samples collected at various locations over time - between the onset of rainfall, through peak stream discharge, and on until water quality returns to normal - are used to assess the effects of storms of various magnitudes on suspended sediment transport (see Table 4.3). Relating these data to water quality standards requires consideration of storm frequencies for the watershed. In the main channel, measured turbidity easily exceeds all of the turbidity criteria during significant rainstorms.
Our measurements indicate that a significant source of turbidity and TSS in the stream during storms came from land grading for a construction project at Hawaiian Memorial Park Cemetery. This project straddled the intermittent upper central branch at a newly constructed culvert crossing. From November through January 2000 (at least), the steep graded and filled banks suffered significant erosion during several monitored storms. Improperly designed silt fences were partly to blame. As of May 2001 this situation was rectified and adverse water quality impacts are expected to subside as bare slopes become vegetated. What is not known is how long it will take for the soil deposited in the streambed below the project to flush out of the system. Based on relationships between turbidity and TSS (Figure 4.1) and TSS and TP (Figure 4.2), we assume that both TSS and phosphorous levels are positively correlated with turbidity. Thus we propose that reductions in TSS and TP loads to levels where the respective numeric criteria are attained will also result in meeting the turbidity criteria.
30
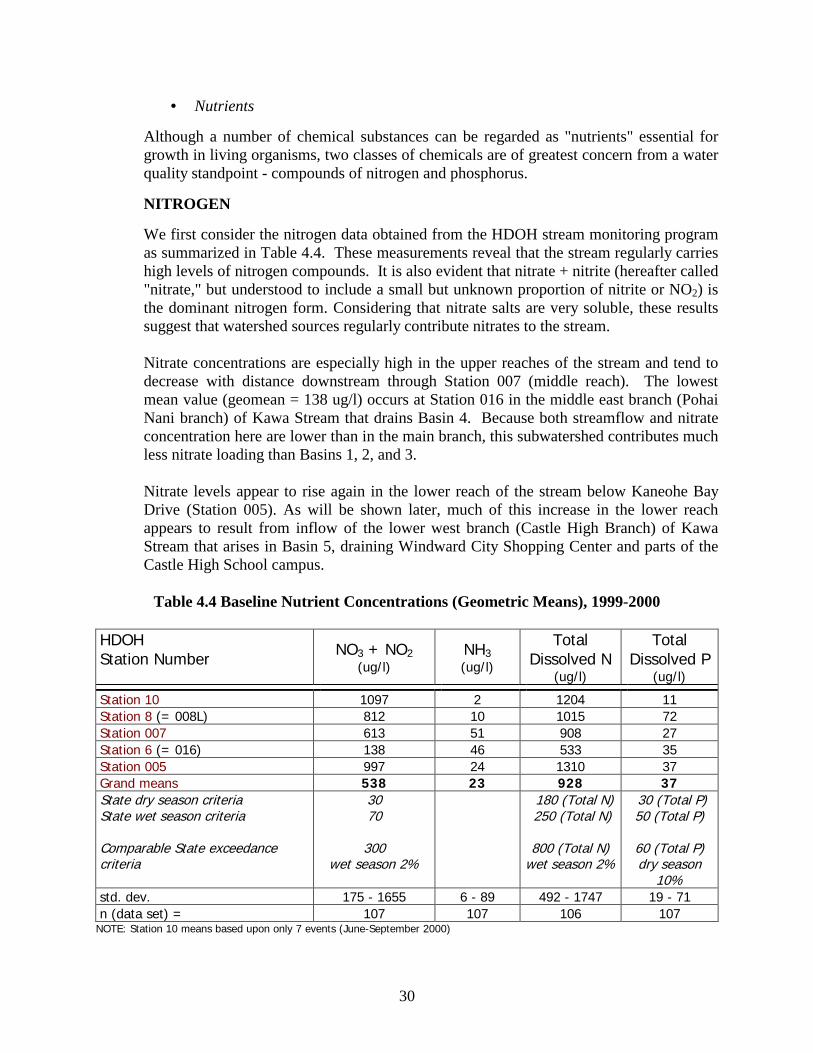
• = Nutrients Although a number of chemical substances can be regarded as "nutrients" essential for growth in living organisms, two classes of chemicals are of greatest concern from a water quality standpoint - compounds of nitrogen and phosphorus.
NITROGEN We first consider the nitrogen data obtained from the HDOH stream monitoring program as summarized in Table 4.4. These measurements reveal that the stream regularly carries high levels of nitrogen compounds. It is also evident that nitrate + nitrite (hereafter called "nitrate," but understood to include a small but unknown proportion of nitrite or NO2) is the dominant nitrogen form. Considering that nitrate salts are very soluble, these results suggest that watershed sources regularly contribute nitrates to the stream. Nitrate concentrations are especially high in the upper reaches of the stream and tend to decrease with distance downstream through Station 007 (middle reach). The lowest mean value (geomean = 138 ug/l) occurs at Station 016 in the middle east branch (Pohai Nani branch) of Kawa Stream that drains Basin 4. Because both streamflow and nitrate concentration here are lower than in the main branch, this subwatershed contributes much less nitrate loading than Basins 1, 2, and 3.
Nitrate levels appear to rise again in the lower reach of the stream below Kaneohe Bay Drive (Station 005). As will be shown later, much of this increase in the lower reach appears to result from inflow of the lower west branch (Castle High Branch) of Kawa Stream that arises in Basin 5, draining Windward City Shopping Center and parts of the Castle High School campus.
Table 4.4 Baseline Nutrient Concentrations (Geometric Means), 1999-2000
HDOH Station Number NO3 + NO2
(ug/l) NH3 (ug/l)
Total Dissolved N
(ug/l)
Total Dissolved P
(ug/l)
Station 10 1097 2 1204 11 Station 8 (= 008L) 812 10 1015 72 Station 007 613 51 908 27 Station 6 (= 016) 138 46 533 35 Station 005 997 24 1310 37 Grand means 538 23 928 37 State dry season criteria State wet season criteria Comparable State exceedance criteria
30 70
300 wet season 2%
180 (Total N) 250 (Total N)
800 (Total N)
wet season 2%
30 (Total P) 50 (Total P)
60 (Total P) dry season
10% std. dev. 175 - 1655 6 - 89 492 - 1747 19 - 71 n (data set) = 107 107 106 107
NOTE: Station 10 means based upon only 7 events (June-September 2000)
31
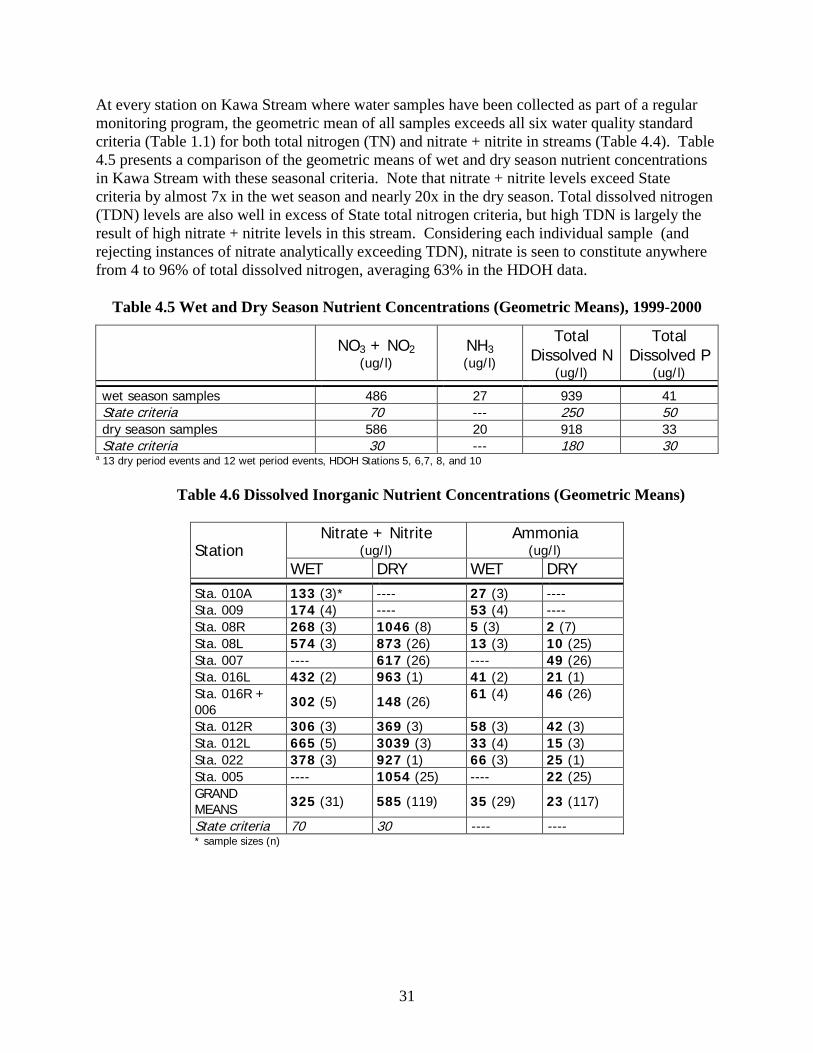
At every station on Kawa Stream where water samples have been collected as part of a regular monitoring program, the geometric mean of all samples exceeds all six water quality standard criteria (Table 1.1) for both total nitrogen (TN) and nitrate + nitrite in streams (Table 4.4). Table 4.5 presents a comparison of the geometric means of wet and dry season nutrient concentrations in Kawa Stream with these seasonal criteria. Note that nitrate + nitrite levels exceed State criteria by almost 7x in the wet season and nearly 20x in the dry season. Total dissolved nitrogen (TDN) levels are also well in excess of State total nitrogen criteria, but high TDN is largely the result of high nitrate + nitrite levels in this stream. Considering each individual sample (and rejecting instances of nitrate analytically exceeding TDN), nitrate is seen to constitute anywhere from 4 to 96% of total dissolved nitrogen, averaging 63% in the HDOH data.
Table 4.5 Wet and Dry Season Nutrient Concentrations (Geometric Means), 1999-2000
NO3 + NO2 (ug/l)
NH3 (ug/l)
Total Dissolved N
(ug/l)
Total Dissolved P
(ug/l)
wet season samples 486 27 939 41 State criteria 70 --- 250 50 dry season samples 586 20 918 33 State criteria 30 --- 180 30
a 13 dry period events and 12 wet period events, HDOH Stations 5, 6,7, 8, and 10
Table 4.6 Dissolved Inorganic Nutrient Concentrations (Geometric Means)
Nitrate + Nitrite (ug/l)
Ammonia (ug/l) Station
WET DRY WET DRY Sta. 010A 133 (3)* ---- 27 (3) ---- Sta. 009 174 (4) ---- 53 (4) ---- Sta. 08R 268 (3) 1046 (8) 5 (3) 2 (7) Sta. 08L 574 (3) 873 (26) 13 (3) 10 (25) Sta. 007 ---- 617 (26) ---- 49 (26) Sta. 016L 432 (2) 963 (1) 41 (2) 21 (1) Sta. 016R + 006 302 (5) 148 (26) 61 (4) 46 (26)
Sta. 012R 306 (3) 369 (3) 58 (3) 42 (3) Sta. 012L 665 (5) 3039 (3) 33 (4) 15 (3) Sta. 022 378 (3) 927 (1) 66 (3) 25 (1) Sta. 005 ---- 1054 (25) ---- 22 (25) GRAND MEANS 325 (31) 585 (119) 35 (29) 23 (117)
State criteria 70 30 ---- ---- * sample sizes (n)

32
Table 4.7 Total and Organic Nutrient Concentrations (Geometric Means)
Total N1 (ug-N/l)
TON1 (ug-N/l)
Total P1 (ug-P/l)
Station Runoff
Influenced Non-
Runoff Runoff
Influenced Non-
Runoff Runoff
Influenced Non-
Runoff
Sta. 010A 711 (3)* ---- 528 (3) ---- 292 (3) ---- Sta. 009 832 (4) ---- 532 (4) ---- 361 (4) ---- Sta. 08R 599 (3) 1134 (8) 313 (3) 81 (7) 145 (3) 13 (8) Sta. 08L1 883 (3) 1487 (22) 277 (3) 142 (21) 164 (3) 76 (26) Sta. 0071 ---- 954 (25) ---- 220 (25) ---- 26 (24) Sta. 016L 1426 (2) 981 (2) 849 (2) 352 (2) 362 (2) 57 (2) Sta. 016R + 0061 858 (5) 559 (26) 499 (4) 291 (25) 200 (5) 35 (27) Sta. 012R 1165 (3) 627 (3) 669 (3) 205 (3) 309 (3) 89 (3) Sta. 012L 1314 (5) 3243 (3) 584 (4) 4 (3) 208 (5) 65 (3) Sta. 022 1184 (3) 1120 (1) 649 (3) 168 (1) 259 (3) 57 (1) Sta. 0051 ---- 1417 (25) ---- 271 (25) ---- 36 (25) GRAND MEANS 956 (31) 1038 (115) 493 (29) 191 (112) 238 (31) 39 (119) Comparable State exceedance criteria
800 wet season 2%
800 wet season 2%
150 wet season 2%
60 and 80 dry season 10% and 2%
* sample sizes (n) 1 Includes TDN and TDP data from HDOH which are considered as TN and TP for purposes of this analysis
In Tables 4.6 and 4.7, a division between runoff and non-runoff influenced events (see page 25) is used to compare concentrations of dissolved inorganic nitrogen (nitrate + nitrite and ammonia), total organic nitrogen, and total nitrogen. Dilution effects are suggested for nitrates – the highest nitrate values occur under conditions of no runoff into Kawa Stream, leading to a conclusion that ground water is the primary source of nitrates to the system. The middle east branch (Stations 016R and 006) appears to be an exception to this pattern. This branch is concrete lined from Station 006 to the intermittent reach. Flow declines substantially during the dry season and may not be well connected with groundwater. As an indicator of ground water quality, a sample was collected from a small seep flowing into Kawa Stream on the east bank some 10 m upstream of Station 007 (May 8, 2000). Water was allowed to flow into the pre-cleaned bottle and frozen immediately. Results obtained were: nitrate + nitrite 1240 ug-N/l and ammonia < 1 ug-N/l (AECOS Log No. 13068). This high nitrogen level may be representative of that found in shallow groundwater in the watershed. The pattern for ammonia (Table 4.6) is less clear, although there is a tendency for all stations to show enhanced ammonia values during runoff-influenced events. Ammonia concentrations are relatively low in the upper reaches of Kawa Stream and increase to a geometric mean maximum of 51 ug/l at Station 007 near the Namoku Street bridge before decreasing further downstream. State water quality standards do not include a specific criterion for ammonia in streams. Total N values (Table 4.7) follow the nitrate pattern (Table 4.6), which is not surprising given the fact that dissolved nitrate is a significant proportion of almost every total N
33
measurement. Nitrate and ammonia values are subtracted from total N to derive total organic nitrogen (TON). Table 4.7 shows how TON increases during runoff-influenced periods, reflecting the additional loads of organic matter carried into the stream by runoff.
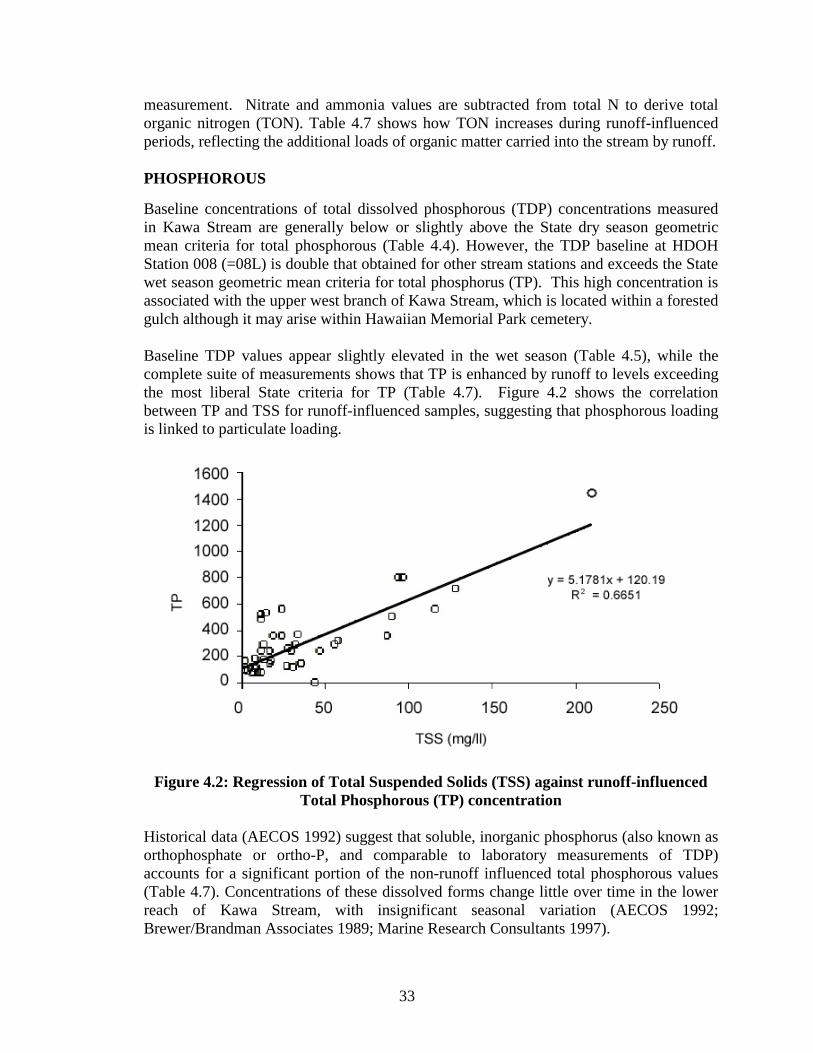
PHOSPHOROUS Baseline concentrations of total dissolved phosphorous (TDP) concentrations measured in Kawa Stream are generally below or slightly above the State dry season geometric mean criteria for total phosphorous (Table 4.4). However, the TDP baseline at HDOH Station 008 (=08L) is double that obtained for other stream stations and exceeds the State wet season geometric mean criteria for total phosphorus (TP). This high concentration is associated with the upper west branch of Kawa Stream, which is located within a forested gulch although it may arise within Hawaiian Memorial Park cemetery. Baseline TDP values appear slightly elevated in the wet season (Table 4.5), while the complete suite of measurements shows that TP is enhanced by runoff to levels exceeding the most liberal State criteria for TP (Table 4.7). Figure 4.2 shows the correlation between TP and TSS for runoff-influenced samples, suggesting that phosphorous loading is linked to particulate loading.
Figure 4.2: Regression of Total Suspended Solids (TSS) against runoff-influenced
Total Phosphorous (TP) concentration
Historical data (AECOS 1992) suggest that soluble, inorganic phosphorus (also known as orthophosphate or ortho-P, and comparable to laboratory measurements of TDP) accounts for a significant portion of the non-runoff influenced total phosphorous values (Table 4.7). Concentrations of these dissolved forms change little over time in the lower reach of Kawa Stream, with insignificant seasonal variation (AECOS 1992; Brewer/Brandman Associates 1989; Marine Research Consultants 1997).
34
Soluble phosphates tend to bind with the iron-rich soil particles, and thus are not readily transported to the ground water. Therefore ortho-P is not nearly as abundant in springs and seeps as soluble nitrates, even where use of both in yard fertilizers might be considerable.
ESTUARINE WATERS Nutrient levels in the Kawa Stream estuary are well established by numerous sampling campaigns conducted there since 1991 (AECOS 1992; Marine Research Consultants 1997; DOH monthly monitoring program 1999-2000). As Kawa Stream enters the estuary, exceedance of estuarine (not stream) geometric mean criteria for ammonia, nitrate + nitrite, and total N is the norm with DOH data showing a trend of steadily decreasing TDN in the seaward direction within the estuary. Inorganic nitrogen also appears to decrease along this gradient. These data have been evaluated for the influence of dilution with Kaneohe Bay water within the estuary (see website at http://www.aecos.com/jobs/kawa_estuary.html). When assessed against the criteria for embayments, Kawa Stream at the stream mouth (DOH Station 001) exceeds nitrate + nitrite and ammonia criteria only.
Note that because of their higher salinity, these lower estuarine stations are technically outside the boundary of this TMDL study. Pollutant loads in the estuary and bay will be the subject of future water quality management efforts following the establishment of TMDLs for other streams flowing into south Kaneohe Bay.
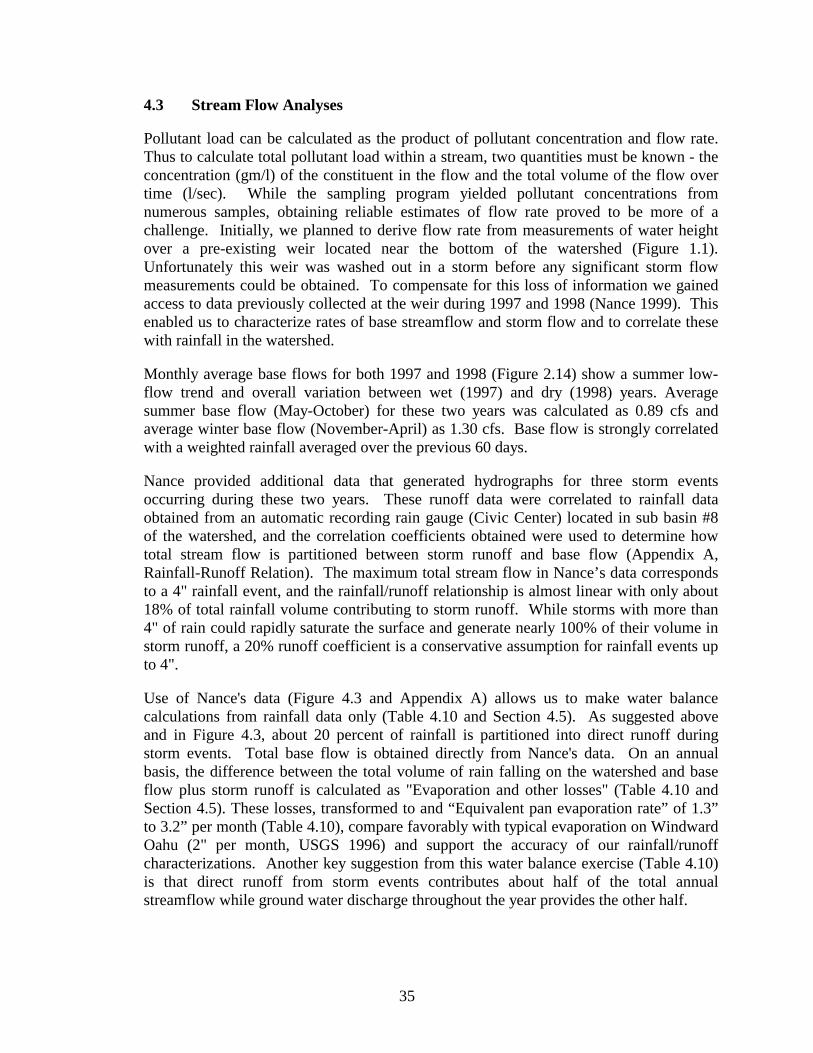
35
4.3 Stream Flow Analyses
Pollutant load can be calculated as the product of pollutant concentration and flow rate. Thus to calculate total pollutant load within a stream, two quantities must be known - the concentration (gm/l) of the constituent in the flow and the total volume of the flow over time (l/sec). While the sampling program yielded pollutant concentrations from numerous samples, obtaining reliable estimates of flow rate proved to be more of a challenge. Initially, we planned to derive flow rate from measurements of water height over a pre-existing weir located near the bottom of the watershed (Figure 1.1). Unfortunately this weir was washed out in a storm before any significant storm flow measurements could be obtained. To compensate for this loss of information we gained access to data previously collected at the weir during 1997 and 1998 (Nance 1999). This enabled us to characterize rates of base streamflow and storm flow and to correlate these with rainfall in the watershed.
Monthly average base flows for both 1997 and 1998 (Figure 2.14) show a summer low-flow trend and overall variation between wet (1997) and dry (1998) years. Average summer base flow (May-October) for these two years was calculated as 0.89 cfs and average winter base flow (November-April) as 1.30 cfs. Base flow is strongly correlated with a weighted rainfall averaged over the previous 60 days.
Nance provided additional data that generated hydrographs for three storm events occurring during these two years. These runoff data were correlated to rainfall data obtained from an automatic recording rain gauge (Civic Center) located in sub basin #8 of the watershed, and the correlation coefficients obtained were used to determine how total stream flow is partitioned between storm runoff and base flow (Appendix A, Rainfall-Runoff Relation). The maximum total stream flow in Nance’s data corresponds to a 4" rainfall event, and the rainfall/runoff relationship is almost linear with only about 18% of total rainfall volume contributing to storm runoff. While storms with more than 4" of rain could rapidly saturate the surface and generate nearly 100% of their volume in storm runoff, a 20% runoff coefficient is a conservative assumption for rainfall events up to 4". Use of Nance's data (Figure 4.3 and Appendix A) allows us to make water balance calculations from rainfall data only (Table 4.10 and Section 4.5). As suggested above and in Figure 4.3, about 20 percent of rainfall is partitioned into direct runoff during storm events. Total base flow is obtained directly from Nance's data. On an annual basis, the difference between the total volume of rain falling on the watershed and base flow plus storm runoff is calculated as "Evaporation and other losses" (Table 4.10 and Section 4.5). These losses, transformed to and “Equivalent pan evaporation rate” of 1.3” to 3.2” per month (Table 4.10), compare favorably with typical evaporation on Windward Oahu (2" per month, USGS 1996) and support the accuracy of our rainfall/runoff characterizations. Another key suggestion from this water balance exercise (Table 4.10) is that direct runoff from storm events contributes about half of the total annual streamflow while ground water discharge throughout the year provides the other half.
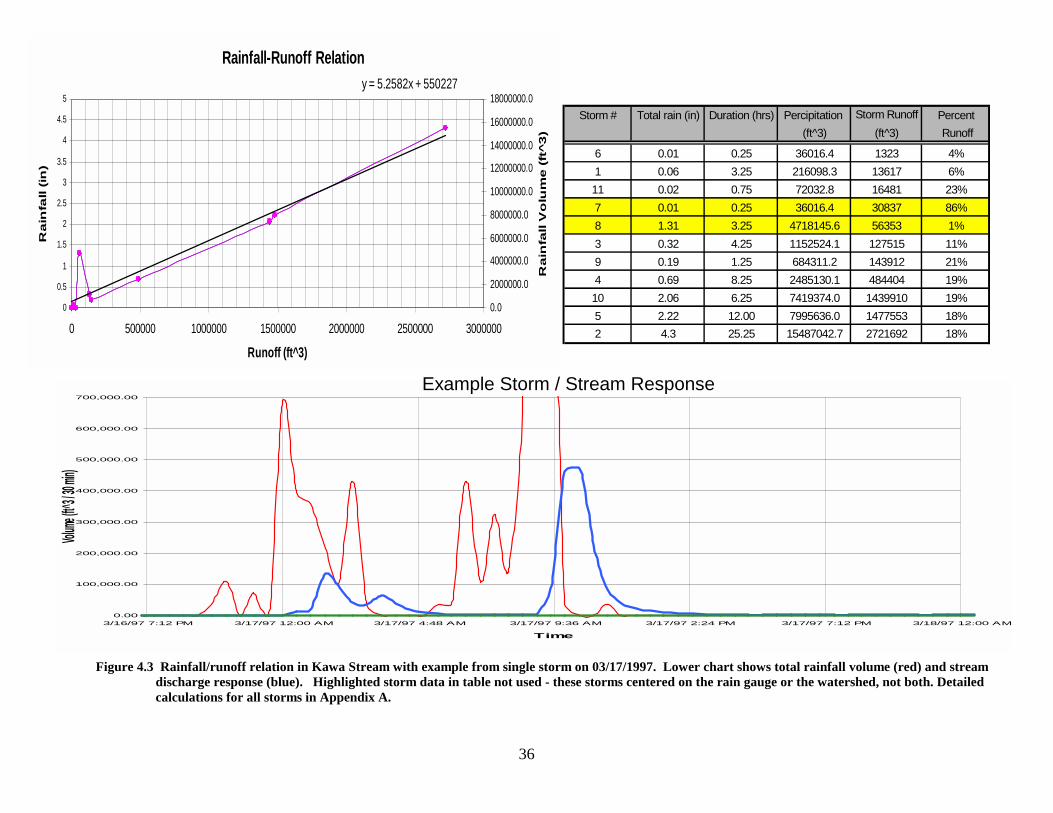
36
0.00
100,000.00
200,000.00
300,000.00
400,000.00
500,000.00
600,000.00
700,000.00
3/16/97 7:12 PM 3/17/97 12:00 AM 3/17/97 4:48 AM 3/17/97 9:36 AM 3/17/97 2:24 PM 3/17/97 7:12 PM 3/18/97 12:00 AM
Time
Volume (
ft^3 / 30
min)
Rainfall-Runoff Relationy = 5.2582x + 550227
0
0.5
1
1.5
2
2.5
3
3.5
4
4.5
5
0 500000 1000000 1500000 2000000 2500000 3000000
Runoff (ft^3)
Ra
infa
ll (in
)
0.0
2000000.0
4000000.0
6000000.0
8000000.0
10000000.0
12000000.0
14000000.0
16000000.0
18000000.0
Rain
fall V
olu
me (
ft^3
)
Storm # Total rain (in) Duration (hrs) Percipitation Storm Runoff Percent(ft^3) (ft^3) Runoff
6 0.01 0.25 36016.4 1323 4%1 0.06 3.25 216098.3 13617 6%11 0.02 0.75 72032.8 16481 23%7 0.01 0.25 36016.4 30837 86%8 1.31 3.25 4718145.6 56353 1%3 0.32 4.25 1152524.1 127515 11%9 0.19 1.25 684311.2 143912 21%4 0.69 8.25 2485130.1 484404 19%10 2.06 6.25 7419374.0 1439910 19%5 2.22 12.00 7995636.0 1477553 18%2 4.3 25.25 15487042.7 2721692 18%
Figure 4.3 Rainfall/runoff relation in Kawa Stream with example from single storm on 03/17/1997. Lower chart shows total rainfall volume (red) and stream discharge response (blue). Highlighted storm data in table not used - these storms centered on the rain gauge or the watershed, not both. Detailed calculations for all storms in Appendix A.
Example Storm / Stream Response

37
The U.S. Geological Survey (USGS) previously maintained a “crest stage” gauging station at the Kaneohe Bay Drive bridge over Kawa Stream, just upstream from the weir installed by Nance. This type of gauge consists of a long chalked marker hung inside a metal pipe. The chalked marker is occasionally removed and the height to which the chalk dissolved is noted as the peak since the prior reading date (Table 4.8). The bridge culvert acted as a very large (and somewhat imprecise) discharge rating control section, allowing stream flow calculations based on peak flow height, or “crest stage.” Because there is no overlap between the USGS and Nance data sets, there is little chance of establishing valid correlations between the two. However, comparison of USGS annual peak discharge data (Table 4.8) with Nance’s data and associated rainfall data may suggest that the USGS methods overestimate streamflow. For example, USGS estimated streamflow at about 450 cfs when peak flow height was about 6 feet (Table 4.8 entry for 10/19/85). In 1997, a 4.3" rainfall event produced a stream height 6 feet above the weir and a total discharge of 2.7 million cubic feet for a comparative streamflow of only 250 cfs. Note that this analysis is compromised by the fact that the two gauging stations are in different locations with different channel geometries, and therefore we would not expect flow heights to be the same at both stations for a given rate of streamflow.
USGS data also reveal that peak flow heights of 6 to 10 feet above datum encompass 90 percent of the recorded peak flows (Figure 4.4). Unfortunately, on very rare occasions (twice in 20 years, which is approximately the return rate for hurricanes and other extreme weather events in Hawaii) the peak height is about double this figure - 17 feet. The USGS estimates a flow rate of about 5,000 cfs at this stream height, but without time-series data it is difficult to estimate the total flow volume discharged during such events.
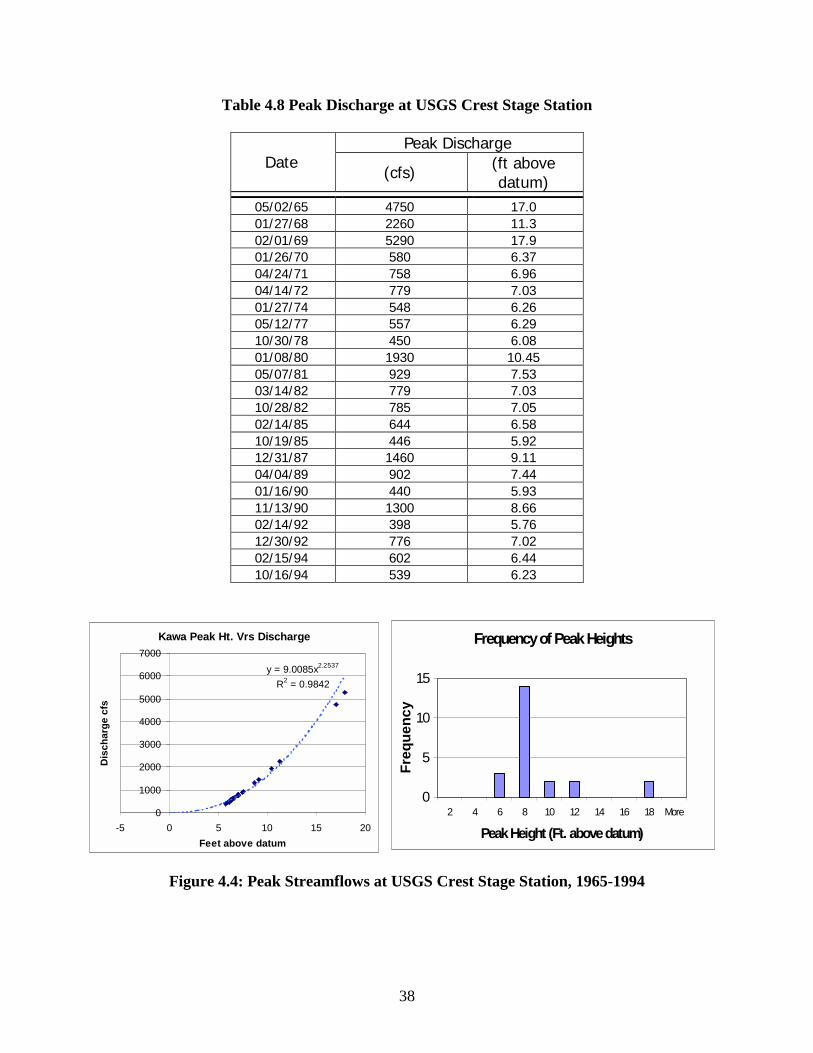
38
Table 4.8 Peak Discharge at USGS Crest Stage Station
Peak Discharge Date
(cfs) (ft above datum)
05/02/65 4750 17.0 01/27/68 2260 11.3 02/01/69 5290 17.9 01/26/70 580 6.37 04/24/71 758 6.96 04/14/72 779 7.03 01/27/74 548 6.26 05/12/77 557 6.29 10/30/78 450 6.08 01/08/80 1930 10.45 05/07/81 929 7.53 03/14/82 779 7.03 10/28/82 785 7.05 02/14/85 644 6.58 10/19/85 446 5.92 12/31/87 1460 9.11 04/04/89 902 7.44 01/16/90 440 5.93 11/13/90 1300 8.66 02/14/92 398 5.76 12/30/92 776 7.02 02/15/94 602 6.44 10/16/94 539 6.23
Figure 4.4: Peak Streamflows at USGS Crest Stage Station, 1965-1994
Kawa Peak Ht. Vrs Discharge
y = 9.0085x2.2537
R2 = 0.9842
0
1000
2000
3000
4000
5000
6000
7000
-5 0 5 10 15 20Feet above datum
Dis
char
ge c
fs
Frequency of Peak Heights
0
5
10
15
2 4 6 8 10 12 14 16 18 More
Peak Height (Ft. above datum)
Freq
uenc
y
39
4.4 Modeling Kawa Stream Nutrient and Sediment Loads 4.4.1 Introduction There are no universally accepted models for predicting sediment transport and nutrient loading in Hawaii’s varied and unique watersheds. Environmental conditions within the islands are significantly different than anywhere in the continental U.S., where many models have been developed. In addition, climatic, topographic, and geologic conditions vary significantly from watershed to watershed on individual islands. Previous studies (e.g. Freeman 1993) suggest that that average annual discharge of sediments per unit of watershed area varies greatly in Hawaii, with no apparent correlation to location. In order to determine loading of TSS, total N, and total P from Kawa Stream to its receiving water, Kaneohe Bay, a local pollutant-loading model was created.
Sediment loading in streams is a function of a number of physical processes such as rainfall; runoff; erosion of hillslopes, gullies and stream channels; and the subsequent transport and deposition of eroded sediment. Sediment can be considered a conservative element within the watershed system. It follows the law of conservation of mass, and this mass of sediment is neither created nor destroyed within the system. The above-mentioned physical processes, modified by land use patterns and human activities within the watershed, influence the stream water column concentration profiles for sediments. While not a direct measurement of total sediment load in streams, total suspended solids (TSS) is used here as an indicator of total load.
Sediment-loading curves can be developed specific to particular stream locations. In general, pollutant concentrations rise and fall rapidly during storm events, and the concentration peak usually occurs before the stormwater discharge peak. This is mainly due to the flushing effect of the stormwater runoff, through which most pollutants are flushed out of a watershed during the early part of a storm event. 4.4.2 Pollutant-Loading Model Description The following modeling effort relies on the combination of a deterministic hydrologic model and a pollutant-loading model based on measured pollutant concentration profiles. Coupled, these components provide a predictive model. This model is designed to accurately estimate pollutant concentration profiles throughout the watershed based on input from a streamlined scientific sampling effort.
• = Hydrologic Model
The hydrologic model used in this study is HEC-HMS Version 2.1.1 (Hydrologic Engineering Center-Hydrologic Modeling System). It is distributed, along with a User’s Manual and Technical Reference Manual, by the U.S. Army Corps of Engineers (http://www.hec.usace.army.mil) and has found widespread use and acceptance by hydrologists and engineers. It is based on established principles of watershed modeling and is simple yet complete in its analysis.

40
HEC-HMS has three input modules used to determine rainfall-runoff relationships - a basin model, a meteorological model, and a control specification module.
The basin model characterizes the watershed in terms of sub-basin areas, land uses, soil groups, cover types, slopes, and stream reach lengths (See Figure 4.5). All of these characteristics are combined and transformed into rainfall-runoff curves. For Kawa Stream, a standard Soil Conservation Service (SCS) runoff curve transform was used. This transform requires a lag time that is based on the above-mentioned watershed characteristics. The basin model also allows for input of base flow and loss rate. Base flow was assumed to be constant at the rate measured by Nance in 1997 and 1998. Loss rate is an additional infiltration component that can be coupled with infiltration rates calculated from soil types. For simplicity’s sake the loss rate was assumed to be negligible, eliminating the need to select SCS curves for loss rate calculation. The meteorological model allows for input of weather events. Rainfall data for storm events that occurred during the project period (1999-2001) were obtained from Oceanit rain gauges on either side of the watershed and used as model input. The control specification allows the used to define the timeframe to be analyzed. Target dates were entered for storm events that coincided with water quality sampling during the project period (1999-2001).
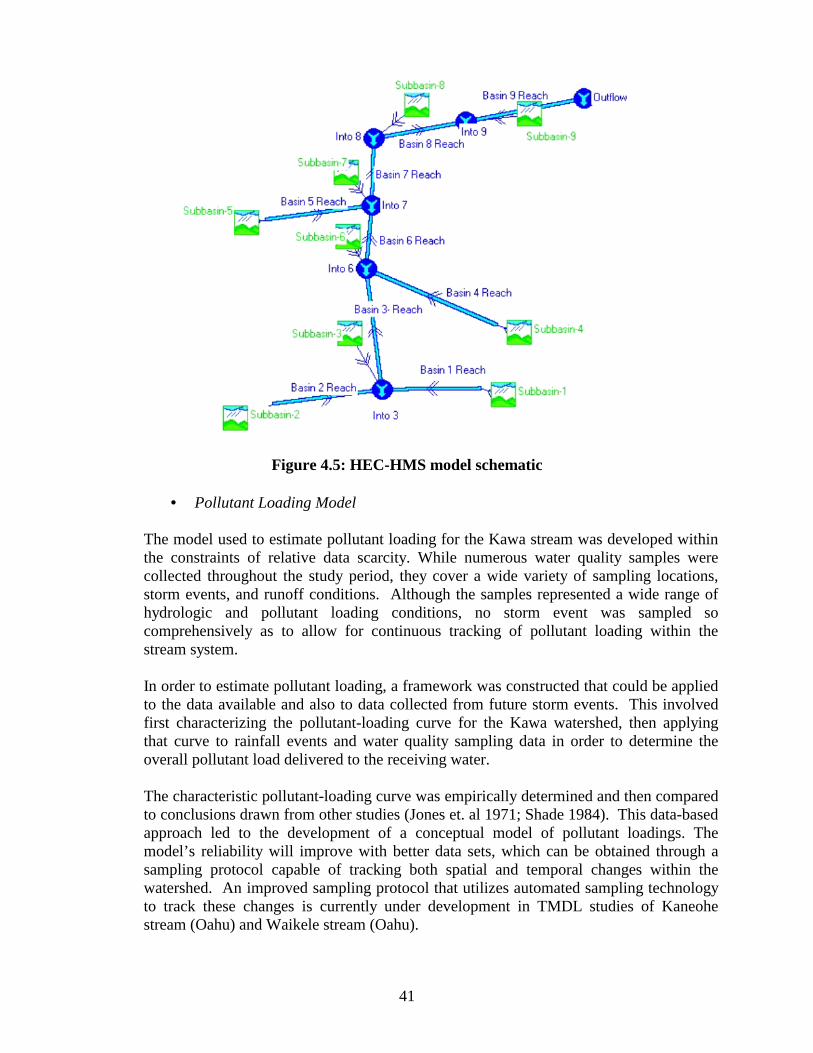
41
Figure 4.5: HEC-HMS model schematic
• = Pollutant Loading Model
The model used to estimate pollutant loading for the Kawa stream was developed within the constraints of relative data scarcity. While numerous water quality samples were collected throughout the study period, they cover a wide variety of sampling locations, storm events, and runoff conditions. Although the samples represented a wide range of hydrologic and pollutant loading conditions, no storm event was sampled so comprehensively as to allow for continuous tracking of pollutant loading within the stream system.
In order to estimate pollutant loading, a framework was constructed that could be applied to the data available and also to data collected from future storm events. This involved first characterizing the pollutant-loading curve for the Kawa watershed, then applying that curve to rainfall events and water quality sampling data in order to determine the overall pollutant load delivered to the receiving water.
The characteristic pollutant-loading curve was empirically determined and then compared to conclusions drawn from other studies (Jones et. al 1971; Shade 1984). This data-based approach led to the development of a conceptual model of pollutant loadings. The model’s reliability will improve with better data sets, which can be obtained through a sampling protocol capable of tracking both spatial and temporal changes within the watershed. An improved sampling protocol that utilizes automated sampling technology to track these changes is currently under development in TMDL studies of Kaneohe stream (Oahu) and Waikele stream (Oahu).

42
• = Calibration
Calibration of model parameters refines the accuracy of the results generated. Hydrologic model predictions of total streamflow at the base of the watershed (in the vicinity of Station 005) were calibrated against actual stream flow data by first comparing the computer generated hydrograph to the hydrograph derived from field measurements obtained there during storm events. Streamflow data obtained from upstream sampling stations were compared on an order-of-magnitude basis to model generated hydrographs for the pertinent sub-basins. Hydrologic model inputs were then evaluated and modified to bring the modeled and measured results into better agreement.
Hydrograph calibration can also be aimed at improving our ability to sample and model the peaks of basin pollutant loading curves. To properly schedule storm event sampling, water quality monitoring analysts must predict the water level and lag time (time elapsed since the beginning of a storm event) at which the concentration curve will peak. Comparing field data with model output and adjusting both field sampling protocols and hydrologic model parameters to converge on the peak of interest can improve these predictions. Also, as the curve is calibrated for a particular location (e.g. at the base of the watershed), its shape can serve as a template for other locations where more limited concentration data are available (see Section 4.4.3 below). 4.4.3 Results for Kawa Stream Watershed
In order to characterize Kawa stream pollutant concentration curves, the water quality data archive was searched for occasions when multiple water quality samples were collected at any specific sampling location during a continuous storm event. Two were found, both at Station Number 007. Six samples were collected there during the January 19-20, 2000 storm event and four samples were collected during the February 8-9, 2001 storm event (5 cm total rainfall). When plotted out over the duration of both storm events, the TSS concentration curves rose and fell more quickly than the Station 007 storm flow hydrographs. The concentration curves also peaked earlier and exhibited shorter peak duration times than the hydrographs, further supporting the idea that sediments are quickly flushed from the watershed system (see example for February 8-9, 2001 in Figure 4.6).
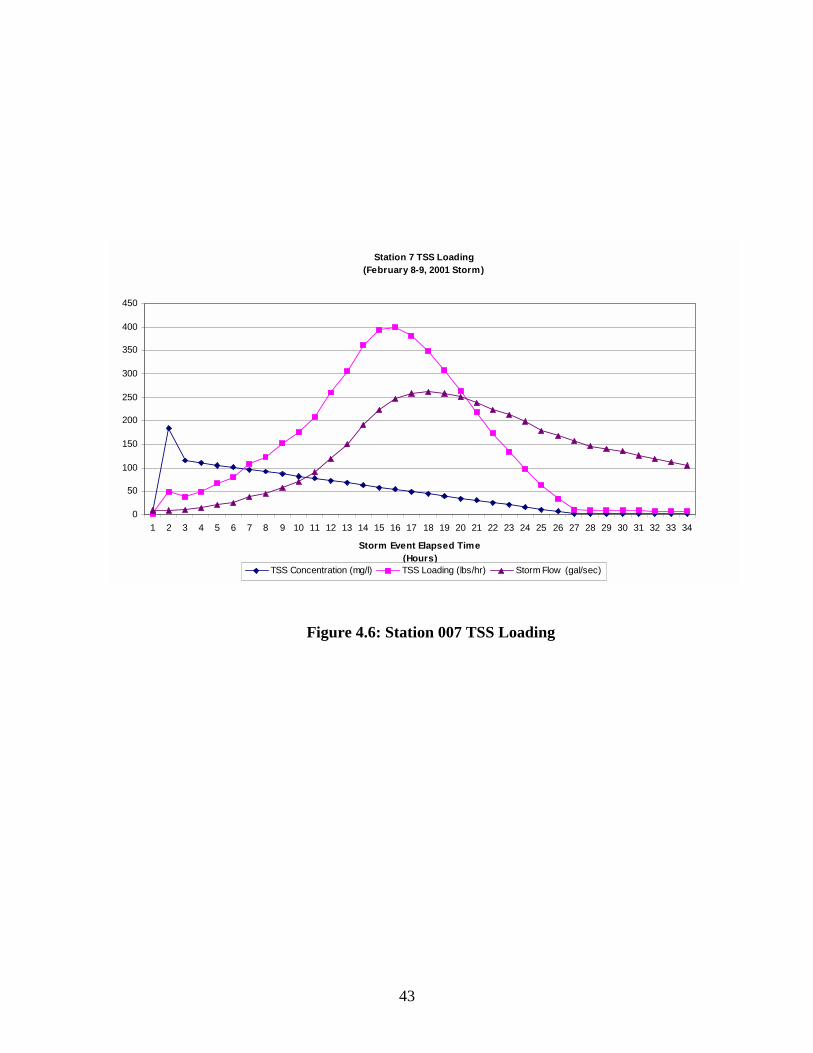
43
Figure 4.6: Station 007 TSS Loading
Station 7 TSS Loading (February 8-9, 2001 Storm)
0
50
100
150
200
250
300
350
400
450
1 2 3 4 5 6 7 8 9 10 11 12 13 14 15 16 17 18 19 20 21 22 23 24 25 26 27 28 29 30 31 32 33 34
Storm Event Elapsed Time(Hours)
TSS Concentration (mg/l) TSS Loading (lbs/hr) Storm Flow (gal/sec)

44
However, this scenario varies from the sampling protocol scenario developed for Station 007, where the pollutant load concentration curves were plotted from available Kawa Stream data. Station 007 lies near the lower end of the upper middle reach, well above the base of the watershed near Station 005. For the purposes of this discussion, Station022 - just upstream from Station 005 - provides a location at the base of the watershed where multiple samples were collected. In order to estimate stream pollutant loading to the estuarine receiving water, the shape of the pollutant concentration curve from Station 007 was scaled to fit the data collected at Station 022. For example, the February 8-9, 2001 storm event yielded a single measurement of TSS at Station 22 (94 mg/l). At the corresponding point in time on the Station 007 concentration curve, measured TSS was 184 mg/l. In order to preserve the shape of the Station 007 TSS concentration curve at Station 022, its values were then scaled down for Station 022 by a factor of 184/94. The resulting concentrations were then multiplied by the hydrologic model-generated streamflow values for Station 022 to create a sediment loading curve that was integrated to determine the total sediment load delivered to the estuary for the storm event in question (See Figure 4.7). This scaling and integration process was then repeated for total nitrogen and total phosphorus (See Figure 4.8). Table 4.9 shows the results of using this method to derive total pollutant loading for the February 8-9, 2001 storm event (5 cm total rainfall).
Table 4.9. Pollutant Loading at Kawa Stream Outlet
Pollutant Model Output
Mass Balance Calculations
Sediments 2,300 kg 1,348 kg Nitrogen 42 kg 38 kg Phosphorus 13 kg 9 kg
The peak streamflow predicted by the hydrologic model for the Kawa stream outlet during this storm was 2.7 cubic meters per second with a total predicted discharge of 40,000 cubic meters of water. The predicted sediment load (2,300 kg) translates to an erosion rate of about 5 lbs of sediment per acre throughout the watershed. Model output for all pollutants is well within order-of-magnitude agreement with mass balance calculations for this storm. In the mass balance calculation, runoff-influenced storm water concentrations of TN and TP from Table 4.7 (TN = 956 ug/l, TP = 238 ug/l) and of TSS from Table 4.3 (TSS = 34 mg/l) are multiplied by the total stream discharge for the event (3.96 x 10⁷ l of water).
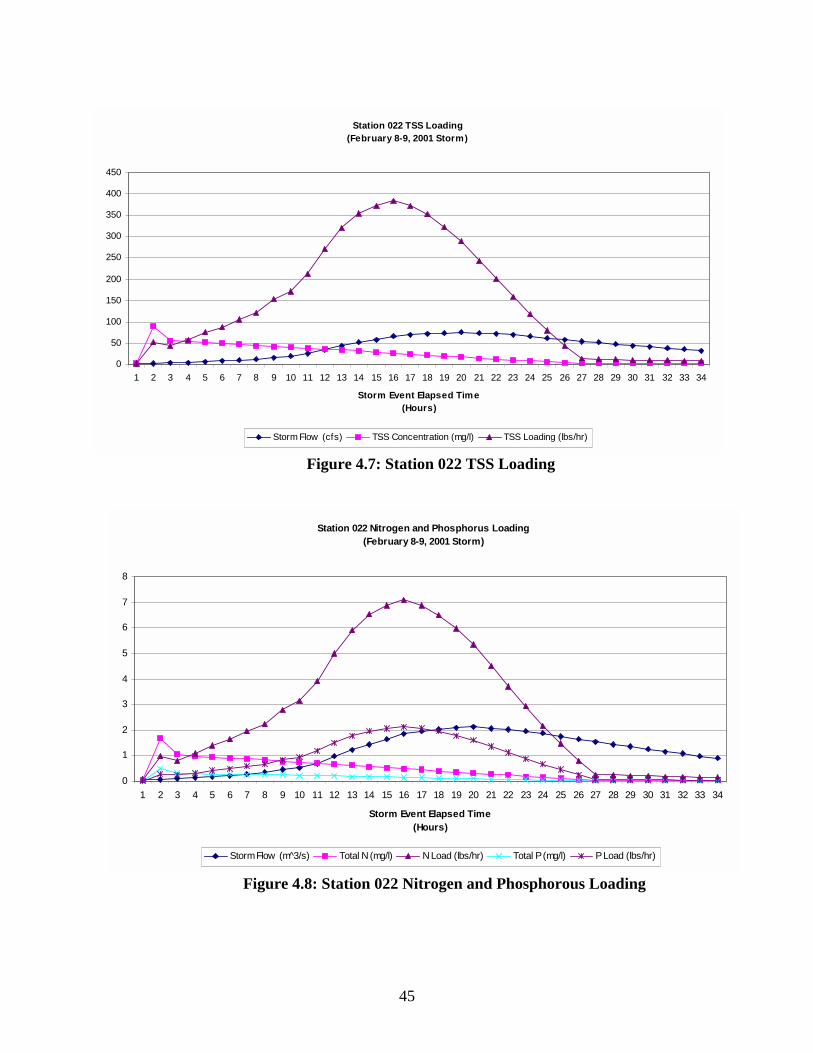
45
Figure 4.7: Station 022 TSS Loading
Figure 4.8: Station 022 Nitrogen and Phosphorous Loading
Station 022 Nitrogen and Phosphorus Loading (February 8-9, 2001 Storm)
0
1
2
3
4
5
6
7
8
1 2 3 4 5 6 7 8 9 10 11 12 13 14 15 16 17 18 19 20 21 22 23 24 25 26 27 28 29 30 31 32 33 34
Storm Event Elapsed Time (Hours)
Storm Flow (m̂ 3/s) Total N (mg/l) N Load (lbs/hr) Total P (mg/l) P Load (lbs/hr)
Station 022 TSS Loading (February 8-9, 2001 Storm)
0
50
100
150
200
250
300
350
400
450
1 2 3 4 5 6 7 8 9 10 11 12 13 14 15 16 17 18 19 20 21 22 23 24 25 26 27 28 29 30 31 32 33 34
Storm Event Elapsed Time (Hours)
Storm Flow (cfs) TSS Concentration (mg/l) TSS Loading (lbs/hr)

46
• = Pollutant Sources Within Watershed
Pollutant concentrations at each of the sampling locations varied with different storm events in a way that precludes any statistically significant conclusions from the model as to the relative contribution of various basins to the overall pollutant load. However, pollutant contributions from particular basins can be suggested through areally weighted averaging of pollutant contributions typically associated with different land uses and land cover types (see Section 5.0, Load Allocations).
4.4.4 Model Strengths and Limitations
A pollutant load-estimating model as described above requires that the loading for storm events be well documented at the base of the watershed. Redundant sampling at other strategic points throughout the watershed enables accurate estimation of load allocations for various sub-basins. Coordination of the sampling procedure allows patterns within the watershed to emerge and be accounted for in the model. This approach allows us to overcome data scarcity limitations through a targeted yet comprehensive water quality data collection protocol. The model also allows for exploration of how changes to pollutant loading scenarios may be triggered by changes in land use practices or other activities.
The model has a number of limitations as well. Hydrologic model calibration relies upon considerable professional judgment. Pollutant concentration curve calibration is strictly empirical and depends upon accurate sampling of concentration peaks. The model assumes that all pollutants are conservative, which is not necessarily the case for nutrients. A related concern is that the model does not consider how pollutants accumulate in the watershed between storm events.
4.5 Mass Balance Model As a rational check on the hydrologic pollutant-loading model, we also developed a simpler pollutant mass balance model using a basic annual water balance (Section 4.3 and Table 4.10). The water balance utilizes streamflow data from 1997-1998 and a 20% rainfall/runoff coefficient derived from streamflow and rainfall data. Ignoring any groundwater inflow (from the Koolau mountains) or outflow (to the ocean), the total rainfall over the watershed is roughly accounted for by the sum of base streamflow, stormflow, and evaporation. In Table 4.10, “Evaporation and other losses” is calculated as total rainfall volume minus total streamflow. The result - about 72.5 mcf (million cubic feet) - is equivalent to 21 inches of rain over the watershed in a year, and agrees with published pan evaporation rates of about 2 inches per month (U.S. Geological Survey 1996). Based on relationships among entries in the “Average (’97-’98)” data column (Table 4.10), we use the same percentages to calculate the total base streamflow (15.9 mcf wet season, 10.9 mcf dry season), storm runoff (24.8 mcf), and total evaporation (72.5 mcf) in the watershed during 2000 based solely on measured rainfall.
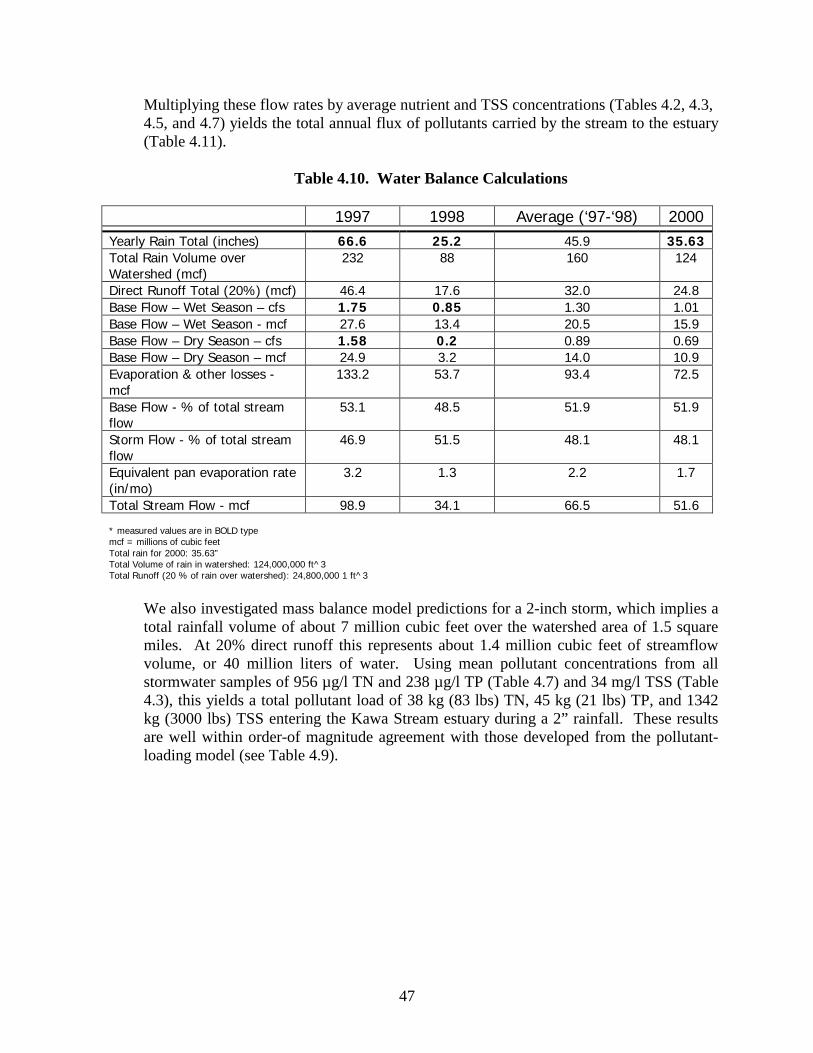
47
Multiplying these flow rates by average nutrient and TSS concentrations (Tables 4.2, 4.3, 4.5, and 4.7) yields the total annual flux of pollutants carried by the stream to the estuary (Table 4.11).
Table 4.10. Water Balance Calculations
1997 1998 Average (‘97-‘98) 2000Yearly Rain Total (inches) 66.6 25.2 45.9 35.63Total Rain Volume over Watershed (mcf)
232 88 160 124
Direct Runoff Total (20%) (mcf) 46.4 17.6 32.0 24.8 Base Flow – Wet Season – cfs 1.75 0.85 1.30 1.01 Base Flow – Wet Season - mcf 27.6 13.4 20.5 15.9 Base Flow – Dry Season – cfs 1.58 0.2 0.89 0.69 Base Flow – Dry Season – mcf 24.9 3.2 14.0 10.9 Evaporation & other losses - mcf
133.2 53.7 93.4 72.5
Base Flow - % of total stream flow
53.1 48.5 51.9 51.9
Storm Flow - % of total stream flow
46.9 51.5 48.1 48.1
Equivalent pan evaporation rate (in/mo)
3.2 1.3 2.2 1.7
Total Stream Flow - mcf 98.9 34.1 66.5 51.6 * measured values are in BOLD type mcf = millions of cubic feet Total rain for 2000: 35.63” Total Volume of rain in watershed: 124,000,000 ft^3 Total Runoff (20 % of rain over watershed): 24,800,000 1 ft^3
We also investigated mass balance model predictions for a 2-inch storm, which implies a total rainfall volume of about 7 million cubic feet over the watershed area of 1.5 square miles. At 20% direct runoff this represents about 1.4 million cubic feet of streamflow volume, or 40 million liters of water. Using mean pollutant concentrations from all stormwater samples of 956 µg/l TN and 238 µg/l TP (Table 4.7) and 34 mg/l TSS (Table 4.3), this yields a total pollutant load of 38 kg (83 lbs) TN, 45 kg (21 lbs) TP, and 1342 kg (3000 lbs) TSS entering the Kawa Stream estuary during a 2” rainfall. These results are well within order-of magnitude agreement with those developed from the pollutant-loading model (see Table 4.9).
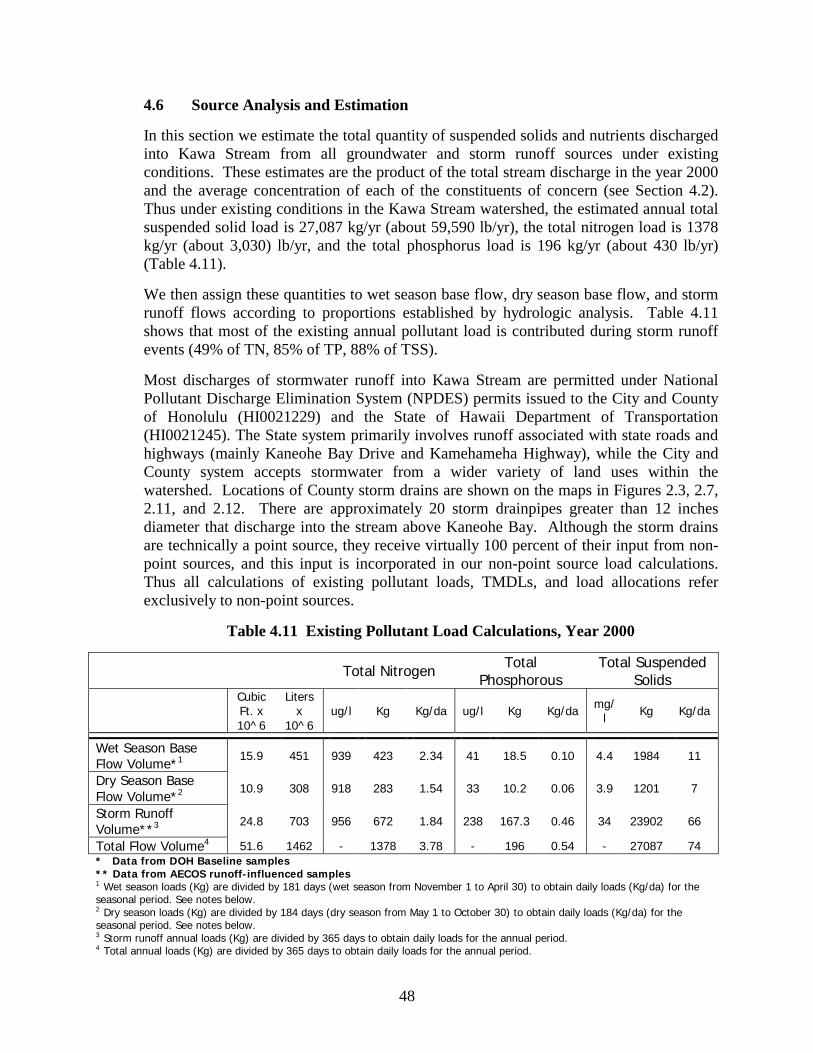
48
4.6 Source Analysis and Estimation In this section we estimate the total quantity of suspended solids and nutrients discharged into Kawa Stream from all groundwater and storm runoff sources under existing conditions. These estimates are the product of the total stream discharge in the year 2000 and the average concentration of each of the constituents of concern (see Section 4.2). Thus under existing conditions in the Kawa Stream watershed, the estimated annual total suspended solid load is 27,087 kg/yr (about 59,590 lb/yr), the total nitrogen load is 1378 kg/yr (about 3,030) lb/yr, and the total phosphorus load is 196 kg/yr (about 430 lb/yr) (Table 4.11). We then assign these quantities to wet season base flow, dry season base flow, and storm runoff flows according to proportions established by hydrologic analysis. Table 4.11 shows that most of the existing annual pollutant load is contributed during storm runoff events (49% of TN, 85% of TP, 88% of TSS).
Most discharges of stormwater runoff into Kawa Stream are permitted under National Pollutant Discharge Elimination System (NPDES) permits issued to the City and County of Honolulu (HI0021229) and the State of Hawaii Department of Transportation (HI0021245). The State system primarily involves runoff associated with state roads and highways (mainly Kaneohe Bay Drive and Kamehameha Highway), while the City and County system accepts stormwater from a wider variety of land uses within the watershed. Locations of County storm drains are shown on the maps in Figures 2.3, 2.7, 2.11, and 2.12. There are approximately 20 storm drainpipes greater than 12 inches diameter that discharge into the stream above Kaneohe Bay. Although the storm drains are technically a point source, they receive virtually 100 percent of their input from non-point sources, and this input is incorporated in our non-point source load calculations. Thus all calculations of existing pollutant loads, TMDLs, and load allocations refer exclusively to non-point sources.
Table 4.11 Existing Pollutant Load Calculations, Year 2000
* Data from DOH Baseline samples ** Data from AECOS runoff-influenced samples 1 Wet season loads (Kg) are divided by 181 days (wet season from November 1 to April 30) to obtain daily loads (Kg/da) for the seasonal period. See notes below. 2 Dry season loads (Kg) are divided by 184 days (dry season from May 1 to October 30) to obtain daily loads (Kg/da) for the seasonal period. See notes below. 3 Storm runoff annual loads (Kg) are divided by 365 days to obtain daily loads for the annual period. 4 Total annual loads (Kg) are divided by 365 days to obtain daily loads for the annual period.
Total Nitrogen Total Phosphorous
Total Suspended Solids
Cubic Ft. x 10^6
Liters x
10^6 ug/l Kg Kg/da ug/l Kg Kg/da mg/
l Kg Kg/da
Wet Season Base Flow Volume*1
15.9 451 939 423 2.34 41 18.5 0.10 4.4 1984 11
Dry Season Base Flow Volume*2
10.9 308 918 283 1.54 33 10.2 0.06 3.9 1201 7
Storm Runoff Volume**3
24.8 703 956 672 1.84 238 167.3 0.46 34 23902 66
Total Flow Volume4 51.6 1462 - 1378 3.78 - 196 0.54 - 27087 74

49
4.7 TMDL Loading Caps / Linkage Analysis
This section estimates the seasonal and annual capacity of Kawa Stream to receive TP, TN, and TSS loads without exceeding specific concentration criteria established in the State of Hawaii water quality standards. Given the existing conditions shown in Table 4.11, Table 4.12 presents clean water goals for the future when pollutant loads have been reduced. These goals are presented as load targets for each pollutant under various streamflow regimes - wet and dry season base flow, storm runoff, and total annual streamflow. The base flow targets were computed by multiplying the seasonal geometric mean criteria for each pollutant (Table 1.1) by the total stream discharge for the corresponding six month base flow time period. Storm runoff targets were calculated by first constructing log-normal cumulative probability distributions fitted to the State wet season concentration criteria for each pollutant (geometric mean, 10% exceedance and 2% exceedance). We then selected the 70% cumulative probability value for TN and TP computations and the 55% cumulative probability value for TSS, and multiplied these by a representative storm runoff discharge to obtain storm runoff load targets. These selections were based on analysis of rainfall-runoff data for 1997 (Figure 2.17) in which 0.5 inches of rain per day defines the storm runoff threshold. There were 65 days of the year (82nd percentile) with rainfall above this threshold, and we assumed that this runoff did not persist over each hour of each day. Thus the 82nd percentile of the wet season criteria served as an upper limit for storm runoff criteria. Using the 80th percentile of the wet season criteria to generate storm runoff load targets raised the acceptable TP concentration to about 80 mg/l and the TN concentration to about 430 mg/l. Because this would decrease the criteria exceedance level and lower the nutrient load reduction target, we use a more conservative (70th percentile) assumption as a contribution to Total Maximum Daily Load Margin of Safety.
Table 4.12 Total Maximum Daily Loads Based on State Water Quality Standards Criteria
Total Nitrogen Total Phosphorous Total Suspended
Solids Cubic
Ft. x 10^6
Liters x
10^6 ug/l Kg Kg/da ug/l Kg Kg/da ug/l Kg Kg/da
Wet Season Base Flow Volume*1
15.9 451 250 113 0.62 50 22.6 0.12 20 9020 50
Dry Season Base Flow Volume*2
10.9 308 180 55 0.30 30 9.2 0.05 10 3080 17
Storm Runoff Volume**3
24.8 703 350 246 0.67 125 87.9 0.24 25 17575 48
Total Flow Volume4
51.6 1462 - 414 1.13 - 120 0.33 - 29675 81
* Wet and Dry Season calculations utilize State geometric mean concentration criteria ** Storm Flow calculations utilize concentrations obtained at 70% (TN and TP) and 55% (TSS) on a cumulative probability curve fitted to State wet season concentration criteria. 1 Wet season loads (Kg) are divided by 181 days (wet season from November 1 to April 30) to obtain daily loads (Kg/da) for the seasonal period. See notes below. 2 Dry season loads (Kg) are divided by 184 days (dry season from May 1 to October 30) to obtain daily loads (Kg/da) for the seasonal period. See notes below. 3 Storm runoff annual loads (Kg) are divided by 365 days to obtain daily loads for the annual period. 4 Total annual loads (Kg) are divided by 365 days to obtain daily loads for the annual period.
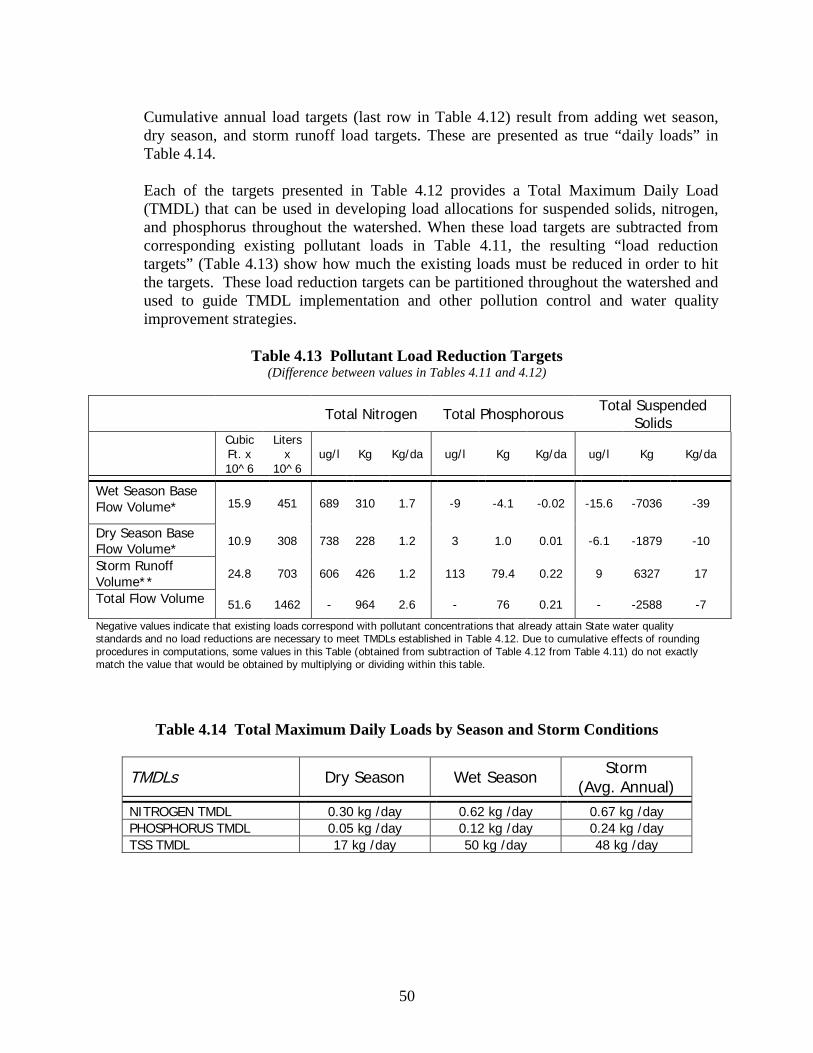
50
Cumulative annual load targets (last row in Table 4.12) result from adding wet season, dry season, and storm runoff load targets. These are presented as true “daily loads” in Table 4.14. Each of the targets presented in Table 4.12 provides a Total Maximum Daily Load (TMDL) that can be used in developing load allocations for suspended solids, nitrogen, and phosphorus throughout the watershed. When these load targets are subtracted from corresponding existing pollutant loads in Table 4.11, the resulting “load reduction targets” (Table 4.13) show how much the existing loads must be reduced in order to hit the targets. These load reduction targets can be partitioned throughout the watershed and used to guide TMDL implementation and other pollution control and water quality improvement strategies.
Table 4.13 Pollutant Load Reduction Targets
(Difference between values in Tables 4.11 and 4.12)
Total Nitrogen Total Phosphorous Total Suspended Solids
Cubic Ft. x 10^6
Liters x
10^6 ug/l Kg Kg/da ug/l Kg Kg/da ug/l Kg Kg/da
Wet Season Base Flow Volume* 15.9 451 689 310 1.7 -9 -4.1 -0.02 -15.6 -7036 -39
Dry Season Base Flow Volume*
10.9 308 738 228 1.2 3 1.0 0.01 -6.1 -1879 -10
Storm Runoff Volume**
24.8 703 606 426 1.2 113 79.4 0.22 9 6327 17
Total Flow Volume 51.6 1462 - 964 2.6 - 76 0.21 - -2588 -7
Negative values indicate that existing loads correspond with pollutant concentrations that already attain State water quality standards and no load reductions are necessary to meet TMDLs established in Table 4.12. Due to cumulative effects of rounding procedures in computations, some values in this Table (obtained from subtraction of Table 4.12 from Table 4.11) do not exactly match the value that would be obtained by multiplying or dividing within this table.
Table 4.14 Total Maximum Daily Loads by Season and Storm Conditions
TMDLs Dry Season Wet Season Storm (Avg. Annual)
NITROGEN TMDL 0.30 kg /day 0.62 kg /day 0.67 kg /day PHOSPHORUS TMDL 0.05 kg /day 0.12 kg /day 0.24 kg /day TSS TMDL 17 kg /day 50 kg /day 48 kg /day
51
5.0 LOAD ALLOCATIONS TO POINT SOURCES, NON-POINT SOURCES, AND NATURAL BACKGROUND SOURCES
In this section we allocate pollutant loads for the entire Kawa Stream watershed to point sources, non-point anthropogenic sources, and natural background sources. We then partition these allocations based upon land use and divide them among the basins within the watershed.
5.1 Point Sources of Pollution within the Watershed
There are two permitted point source dischargers contributing stormwater runoff to Kawa Stream – the State of Hawaii Department of Transportation (NPDES Permit HI0021229) and the City and County of Honolulu Department of Environmental Services (NPDES Permit HI0021245) (see Section 4.6). Each of these stormwater discharges may contribute significant loads of pollutants to the stream, but sufficient information to distinguish between them is not available. Moreover, we have yet to distinguish between these stormwater inputs to the stream and other storm runoff that bypasses the storm drains to flow directly into the stream channel. Because virtually all of the known inputs to these storm drain systems have non-point source origins, the entire point source load allocation for all TMDLs is established at net zero. This means that the pollutant load exiting a storm drain system should not exceed the load entering that system, and the pollutant load entering the system is allocated, for now, entirely to natural background and non-point sources. As part of the TMDL implementation process, we will work with the DOH NPDES permitting office and the permit holders to quantify and revise waste load allocations to these two point sources over the next two years. Anticipated tasks include strategic stormwater sampling and more detailed delineation of storm drain contributing areas. This will give the permit holders clearer targets as they focus greater attention on pollution control issues in the context of approaching NPDES permit expiration dates (September 08, 2004).
5.2 Natural Background Sources of Nutrients and Sediments The uppermost branches of the Kawa Stream system drain undeveloped, forested lands regarded as natural sources, and the output of nutrients and sediments from these lands can be defined as background. Unfortunately, these branches are ephemeral and did not provide enough flow during the study period to allow for water quality sampling. While groundwater has been identified as a possible source of nitrates in the watershed, no wells or groundwater discharges for characterizing the chemistry of natural background groundwater inputs could be found within the forested lands. In the absence of information about natural background sources specific to the Kawa Stream watershed, we computed geometric mean values for nutrient concentrations sampled above anthropogenic influences in other windward Hawaiian streams (Table 5.1).

52
Table 5.1 Water Quality from Other Hawaii Stream Systems
Stream Name Elev. (m)
DIN µg N/L
TON µg N/L
TN µg N/L
TP µg P/L
Source
Kilauea, Windward Kauai
90 11 (2)* 138 (2)* 149 (2)* 52 (2)* AECOS
Waihee, Windward Oahu
52 85 (9)* 92 (14)* 177 (9)* 47 (9)* USGS
Pahehee, Hamakua Hawaii
400 8 (2)* 97 (2)* 105 (2)* 6 (2)* AECOS
Kolekole, Hamakua Hawaii
Var. 72 (2)* < 1 (2)* < 1 (2)* 5 (2)* AECOS
Waikane, Windward Oahu
~ ~ ~ 145 45 Young (1976)
*Number of data points given in parentheses Based upon these observations and a total annual stream discharge of 51.6 million cubic feet (1.46 x 10⁹ l), nutrient loads from natural background sources in the Kawa Stream watershed are estimated at approximately 219 kg/year for TN (150 ug/l) and 36.5 kg/year for TP (25 ug/l). This represents about 67 percent of the TP and about 16 percent of the TN measured in Kawa Stream during base flow conditions. Although the watershed is urbanized it contains several areas (particularly bare stream banks) of extensive, erosion-prone surfaces. Comparisons of sediment load calculations with observed sub-basin erosion potential were used to determine natural erosion rates. Steep, forested lands showed almost no runoff response during heavy rainfall, and therefore no erosion was occurring in these areas. Thus natural background erosion is assumed to be 10 percent of the existing 27,094 kg (or about 2709 kg/year for the entire 1000-acre watershed) as a conservative background estimate that contributes to the TMDL Margin of Safety. No records were available for determination of background nutrient or TSS loads under stormflow conditions. Under stormflow conditions the total load is assumed, for the purpose of this report, to be anthropogenic.
5.3 Load Partitioning to Land Uses within the Kawa Watershed
In order to determine nutrient loading factors for land uses within the Kawa watershed, we utilized nutrient data for groundwater under various land use influences collected by the U.S. Geological Survey’s National Water Quality Assessment program (NAWQA).
Table 5.2 Geometric Mean Values for Nutrients from U.S. Shallow Ground Water Sites (NAWQA water-quality data collected 1992-1996. Units are ug-N/L and ug-P/L.)
Land Use NH3 NO3+NO2 TN TP Forest 25 (39)* 217 (31)* 517 (6)* 30 (15)*
Agriculture 36 (753)* 3313 (772)* 3739 (228)* 42 (547)* Urban 63 (232)* 1900 (216)* 2399 (92)* 54 (158)*
*Number of data points given in parentheses
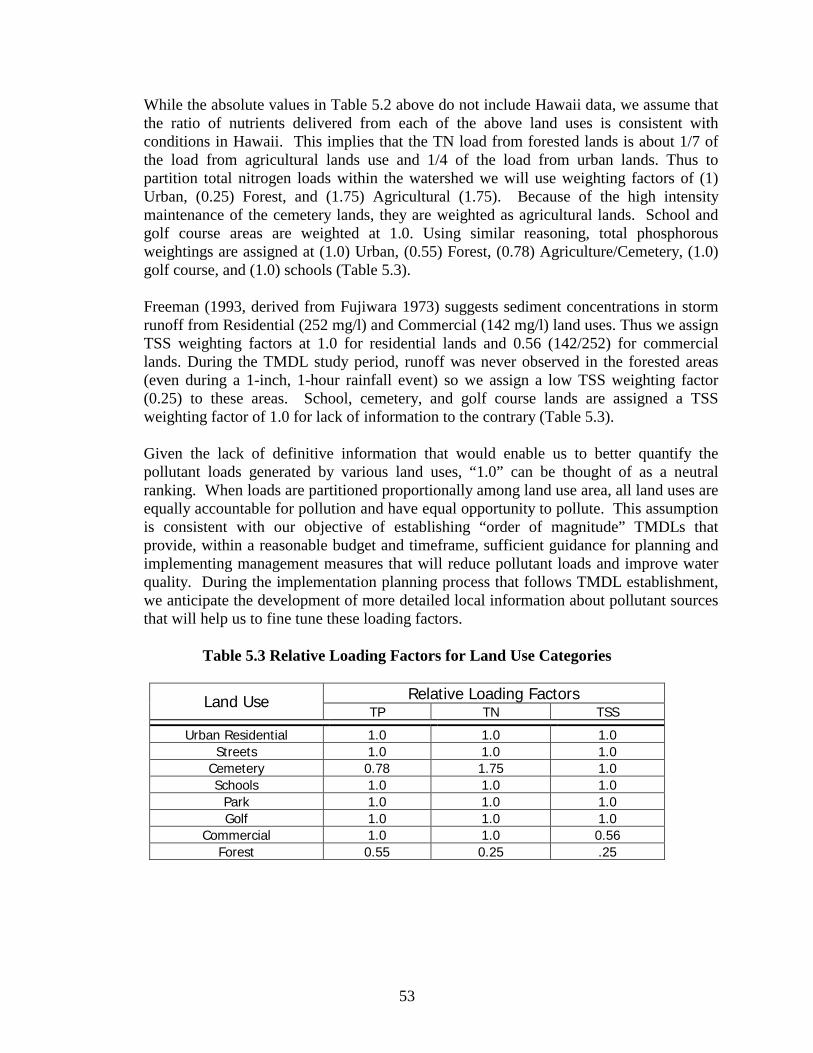
53
While the absolute values in Table 5.2 above do not include Hawaii data, we assume that the ratio of nutrients delivered from each of the above land uses is consistent with conditions in Hawaii. This implies that the TN load from forested lands is about 1/7 of the load from agricultural lands use and 1/4 of the load from urban lands. Thus to partition total nitrogen loads within the watershed we will use weighting factors of (1) Urban, (0.25) Forest, and (1.75) Agricultural (1.75). Because of the high intensity maintenance of the cemetery lands, they are weighted as agricultural lands. School and golf course areas are weighted at 1.0. Using similar reasoning, total phosphorous weightings are assigned at (1.0) Urban, (0.55) Forest, (0.78) Agriculture/Cemetery, (1.0) golf course, and (1.0) schools (Table 5.3). Freeman (1993, derived from Fujiwara 1973) suggests sediment concentrations in storm runoff from Residential (252 mg/l) and Commercial (142 mg/l) land uses. Thus we assign TSS weighting factors at 1.0 for residential lands and 0.56 (142/252) for commercial lands. During the TMDL study period, runoff was never observed in the forested areas (even during a 1-inch, 1-hour rainfall event) so we assign a low TSS weighting factor (0.25) to these areas. School, cemetery, and golf course lands are assigned a TSS weighting factor of 1.0 for lack of information to the contrary (Table 5.3). Given the lack of definitive information that would enable us to better quantify the pollutant loads generated by various land uses, “1.0” can be thought of as a neutral ranking. When loads are partitioned proportionally among land use area, all land uses are equally accountable for pollution and have equal opportunity to pollute. This assumption is consistent with our objective of establishing “order of magnitude” TMDLs that provide, within a reasonable budget and timeframe, sufficient guidance for planning and implementing management measures that will reduce pollutant loads and improve water quality. During the implementation planning process that follows TMDL establishment, we anticipate the development of more detailed local information about pollutant sources that will help us to fine tune these loading factors.
Table 5.3 Relative Loading Factors for Land Use Categories
Relative Loading Factors Land Use
TP TN TSS
Urban Residential 1.0 1.0 1.0 Streets 1.0 1.0 1.0
Cemetery 0.78 1.75 1.0 Schools 1.0 1.0 1.0
Park 1.0 1.0 1.0 Golf 1.0 1.0 1.0
Commercial 1.0 1.0 0.56 Forest 0.55 0.25 .25
54
5.4 Load Partitioning to Basins within the Kawa Watershed
Table 4.11 provides existing annual pollutant loads for the entire Kawa Stream watershed:
Total N 1,378 kg/yr Total P 196 kg/yr TSS 27,087 kg/yr
Section 6.1 shows the hydro-temporal (wet season baseflow, dry season baseflow, storm runoff) allocation of these existing annual loads and load reductions to point and non-point sources, including an explicit Margin of Safety (see Section 6.0). Note that all of the TSS load reductions and almost all of the total phosphorous load reductions are allocated to storm runoff events, while 70% of the total nitrogen load reductions are allocated to base streamflow throughout the year. With this schedule in mind, partitioning the annual load reductions to distinct basins and land uses within the watershed provides a more detailed spatial framework for TMDL implementation. Using land use loading factors from Table 5.3 and the total area and proportional area of land use types within each basin, a weighting matrix spreadsheet was created to compute the matrix multiplication results shown in Tables 5.4, 5.5, and 5.6 for TSS, TN, and TP, respectively. There are three sub-tables for each exercise representing the annualized a) Existing Loads, b) TMDLs or Load Targets, and c) Pollutant Load Reduction Targets for hitting TMDL Targets in specific basins and/or for specific land uses.
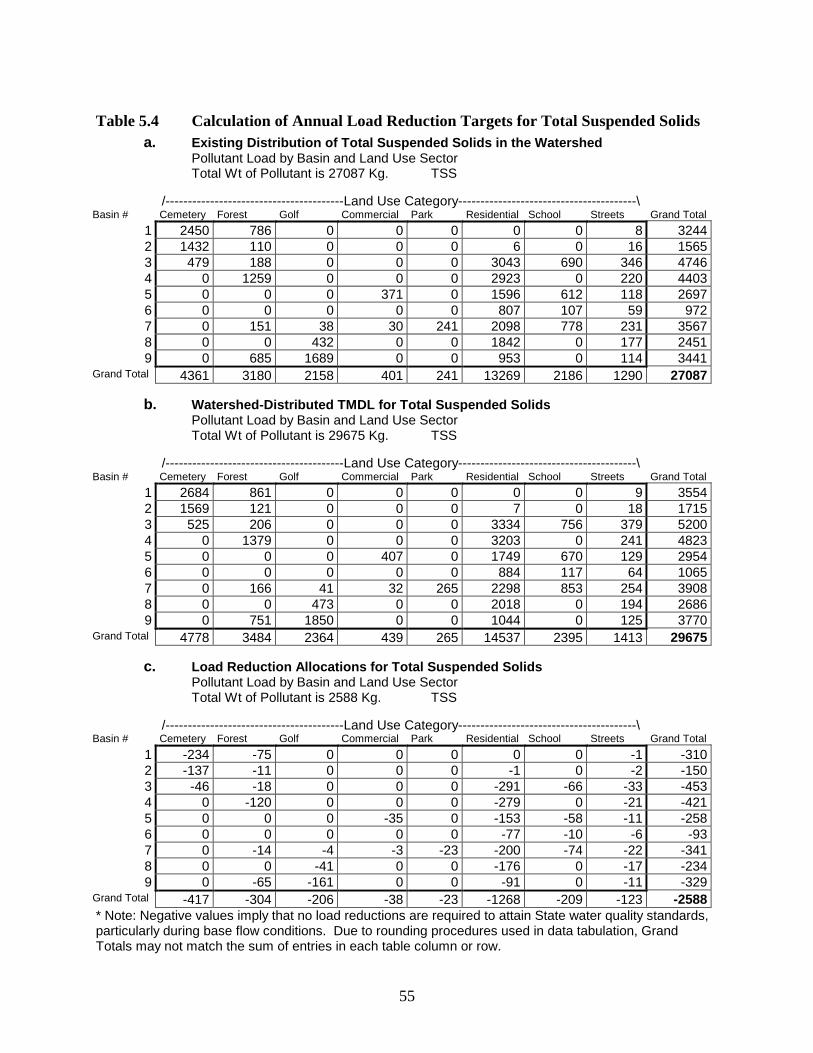
55
Table 5.4 Calculation of Annual Load Reduction Targets for Total Suspended Solids
a. Existing Distribution of Total Suspended Solids in the Watershed Pollutant Load by Basin and Land Use Sector Total Wt of Pollutant is 27087 Kg. TSS
/----------------------------------------Land Use Category----------------------------------------\ Basin # Cemetery Forest Golf Commercial Park Residential School Streets Grand Total
1 2450 786 0 0 0 0 0 8 32442 1432 110 0 0 0 6 0 16 15653 479 188 0 0 0 3043 690 346 47464 0 1259 0 0 0 2923 0 220 44035 0 0 0 371 0 1596 612 118 26976 0 0 0 0 0 807 107 59 9727 0 151 38 30 241 2098 778 231 35678 0 0 432 0 0 1842 0 177 24519 0 685 1689 0 0 953 0 114 3441
Grand Total 4361 3180 2158 401 241 13269 2186 1290 27087
b. Watershed-Distributed TMDL for Total Suspended Solids Pollutant Load by Basin and Land Use Sector Total Wt of Pollutant is 29675 Kg. TSS
/----------------------------------------Land Use Category----------------------------------------\ Basin # Cemetery Forest Golf Commercial Park Residential School Streets Grand Total
1 2684 861 0 0 0 0 0 9 35542 1569 121 0 0 0 7 0 18 17153 525 206 0 0 0 3334 756 379 52004 0 1379 0 0 0 3203 0 241 48235 0 0 0 407 0 1749 670 129 29546 0 0 0 0 0 884 117 64 10657 0 166 41 32 265 2298 853 254 39088 0 0 473 0 0 2018 0 194 26869 0 751 1850 0 0 1044 0 125 3770
Grand Total 4778 3484 2364 439 265 14537 2395 1413 29675
c. Load Reduction Allocations for Total Suspended Solids Pollutant Load by Basin and Land Use Sector Total Wt of Pollutant is 2588 Kg. TSS
/----------------------------------------Land Use Category----------------------------------------\ Basin # Cemetery Forest Golf Commercial Park Residential School Streets Grand Total
1 -234 -75 0 0 0 0 0 -1 -3102 -137 -11 0 0 0 -1 0 -2 -1503 -46 -18 0 0 0 -291 -66 -33 -4534 0 -120 0 0 0 -279 0 -21 -4215 0 0 0 -35 0 -153 -58 -11 -2586 0 0 0 0 0 -77 -10 -6 -937 0 -14 -4 -3 -23 -200 -74 -22 -3418 0 0 -41 0 0 -176 0 -17 -2349 0 -65 -161 0 0 -91 0 -11 -329
Grand Total -417 -304 -206 -38 -23 -1268 -209 -123 -2588* Note: Negative values imply that no load reductions are required to attain State water quality standards, particularly during base flow conditions. Due to rounding procedures used in data tabulation, Grand Totals may not match the sum of entries in each table column or row.
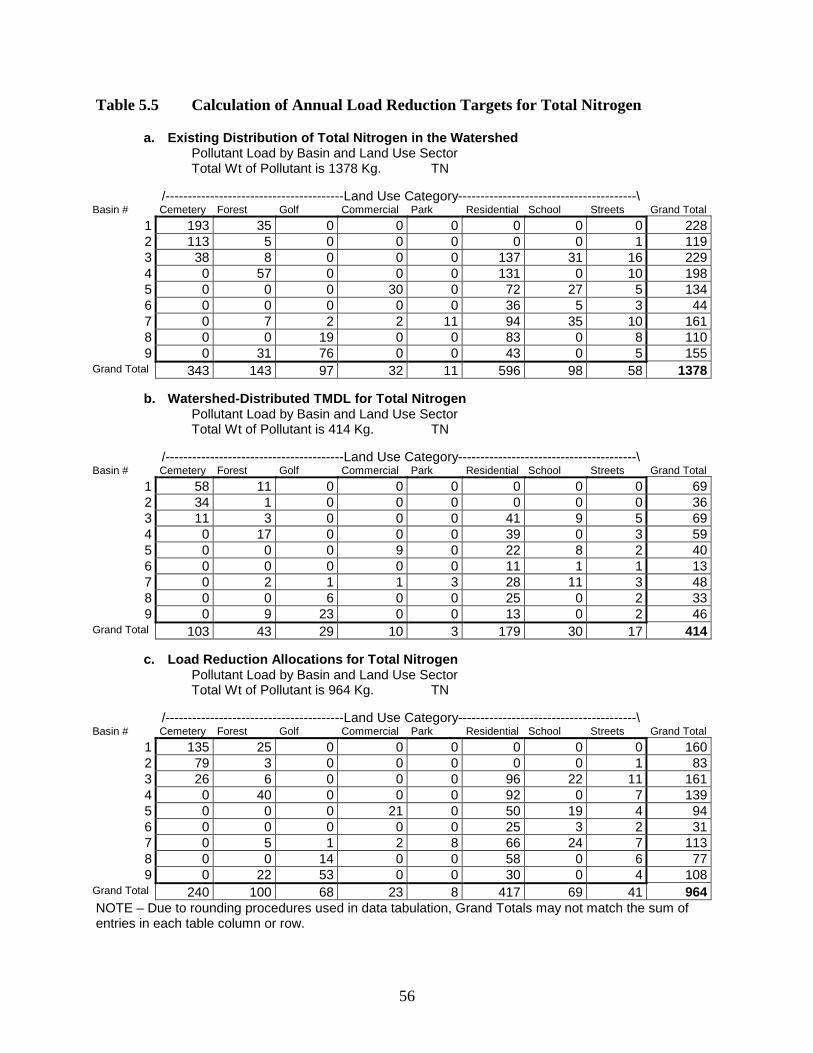
56
Table 5.5 Calculation of Annual Load Reduction Targets for Total Nitrogen
a. Existing Distribution of Total Nitrogen in the Watershed Pollutant Load by Basin and Land Use Sector Total Wt of Pollutant is 1378 Kg. TN
/----------------------------------------Land Use Category----------------------------------------\ Basin # Cemetery Forest Golf Commercial Park Residential School Streets Grand Total
1 193 35 0 0 0 0 0 0 2282 113 5 0 0 0 0 0 1 1193 38 8 0 0 0 137 31 16 2294 0 57 0 0 0 131 0 10 1985 0 0 0 30 0 72 27 5 1346 0 0 0 0 0 36 5 3 447 0 7 2 2 11 94 35 10 1618 0 0 19 0 0 83 0 8 1109 0 31 76 0 0 43 0 5 155
Grand Total 343 143 97 32 11 596 98 58 1378
b. Watershed-Distributed TMDL for Total Nitrogen Pollutant Load by Basin and Land Use Sector Total Wt of Pollutant is 414 Kg. TN
/----------------------------------------Land Use Category----------------------------------------\ Basin # Cemetery Forest Golf Commercial Park Residential School Streets Grand Total
1 58 11 0 0 0 0 0 0 692 34 1 0 0 0 0 0 0 363 11 3 0 0 0 41 9 5 694 0 17 0 0 0 39 0 3 595 0 0 0 9 0 22 8 2 406 0 0 0 0 0 11 1 1 137 0 2 1 1 3 28 11 3 488 0 0 6 0 0 25 0 2 339 0 9 23 0 0 13 0 2 46
Grand Total 103 43 29 10 3 179 30 17 414
c. Load Reduction Allocations for Total Nitrogen Pollutant Load by Basin and Land Use Sector Total Wt of Pollutant is 964 Kg. TN
/----------------------------------------Land Use Category----------------------------------------\ Basin # Cemetery Forest Golf Commercial Park Residential School Streets Grand Total
1 135 25 0 0 0 0 0 0 1602 79 3 0 0 0 0 0 1 833 26 6 0 0 0 96 22 11 1614 0 40 0 0 0 92 0 7 1395 0 0 0 21 0 50 19 4 946 0 0 0 0 0 25 3 2 317 0 5 1 2 8 66 24 7 1138 0 0 14 0 0 58 0 6 779 0 22 53 0 0 30 0 4 108
Grand Total 240 100 68 23 8 417 69 41 964NOTE – Due to rounding procedures used in data tabulation, Grand Totals may not match the sum of entries in each table column or row.
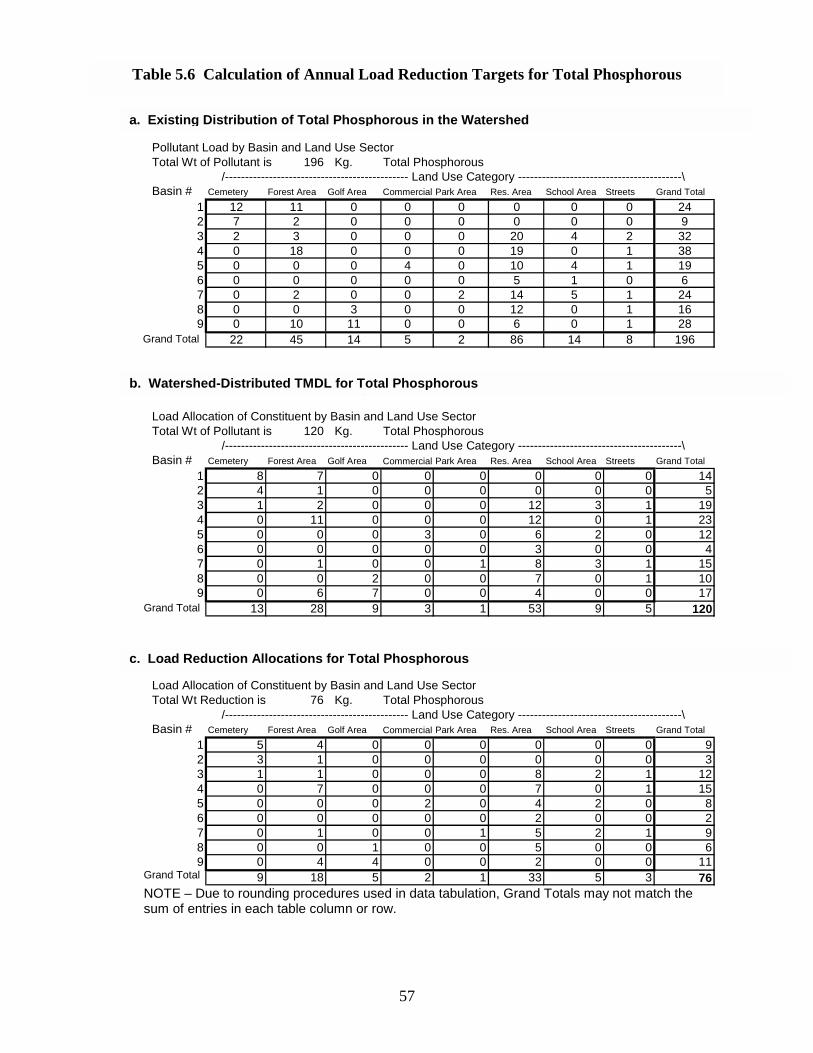
57
NOTE – Due to rounding procedures used in data tabulation, Grand Totals may not match the sum of entries in each table column or row.
Table 5.6 Calculations of Load Reduction Allocations for Total Phosphorous
a. Existing Distribution of Total Phosphorous in the Watershed
Pollutant Load by Basin and Land Use SectorTotal Wt of Pollutant is 196 Kg. Total Phosphorous
/---------------------------------------------- Land Use Category -----------------------------------------\Basin # Cemetery Forest Area Golf Area Commercial Park Area Res. Area School Area Streets Grand Total
1 12 11 0 0 0 0 0 0 242 7 2 0 0 0 0 0 0 93 2 3 0 0 0 20 4 2 324 0 18 0 0 0 19 0 1 385 0 0 0 4 0 10 4 1 196 0 0 0 0 0 5 1 0 67 0 2 0 0 2 14 5 1 248 0 0 3 0 0 12 0 1 169 0 10 11 0 0 6 0 1 28
Grand Total 22 45 14 5 2 86 14 8 196
b. Allocation Goal for Total Phosphorous Distributed in the Watershed
Load Allocation of Constituent by Basin and Land Use SectorTotal Wt of Pollutant is 120 Kg. Total Phosphorous
/---------------------------------------------- Land Use Category -----------------------------------------\Basin # Cemetery Forest Area Golf Area Commercial Park Area Res. Area School Area Streets Grand Total
1 8 7 0 0 0 0 0 0 142 4 1 0 0 0 0 0 0 53 1 2 0 0 0 12 3 1 194 0 11 0 0 0 12 0 1 235 0 0 0 3 0 6 2 0 126 0 0 0 0 0 3 0 0 47 0 1 0 0 1 8 3 1 158 0 0 2 0 0 7 0 1 109 0 6 7 0 0 4 0 0 17
Grand Total 13 28 9 3 1 53 9 5 120
c. Allocation of Load Reductions for Total Phosphorous Distributed in the Watershed
Load Allocation of Constituent by Basin and Land Use SectorTotal Wt Reduction is 76 Kg. Total Phosphorous
/---------------------------------------------- Land Use Category -----------------------------------------\Basin # Cemetery Forest Area Golf Area Commercial Park Area Res. Area School Area Streets Grand Total
1 5 4 0 0 0 0 0 0 92 3 1 0 0 0 0 0 0 33 1 1 0 0 0 8 2 1 124 0 7 0 0 0 7 0 1 155 0 0 0 2 0 4 2 0 86 0 0 0 0 0 2 0 0 27 0 1 0 0 1 5 2 1 98 0 0 1 0 0 5 0 0 69 0 4 4 0 0 2 0 0 11
Grand Total 9 18 5 2 1 33 5 3 76
Table 5.6 Calculation of Annual Load Reduction Targets for Total Phosphorous
a. Existing Distribution of Total Phosphorous in the Watershed
b. Watershed-Distributed TMDL for Total Phosphorous
c. Load Reduction Allocations for Total Phosphorous
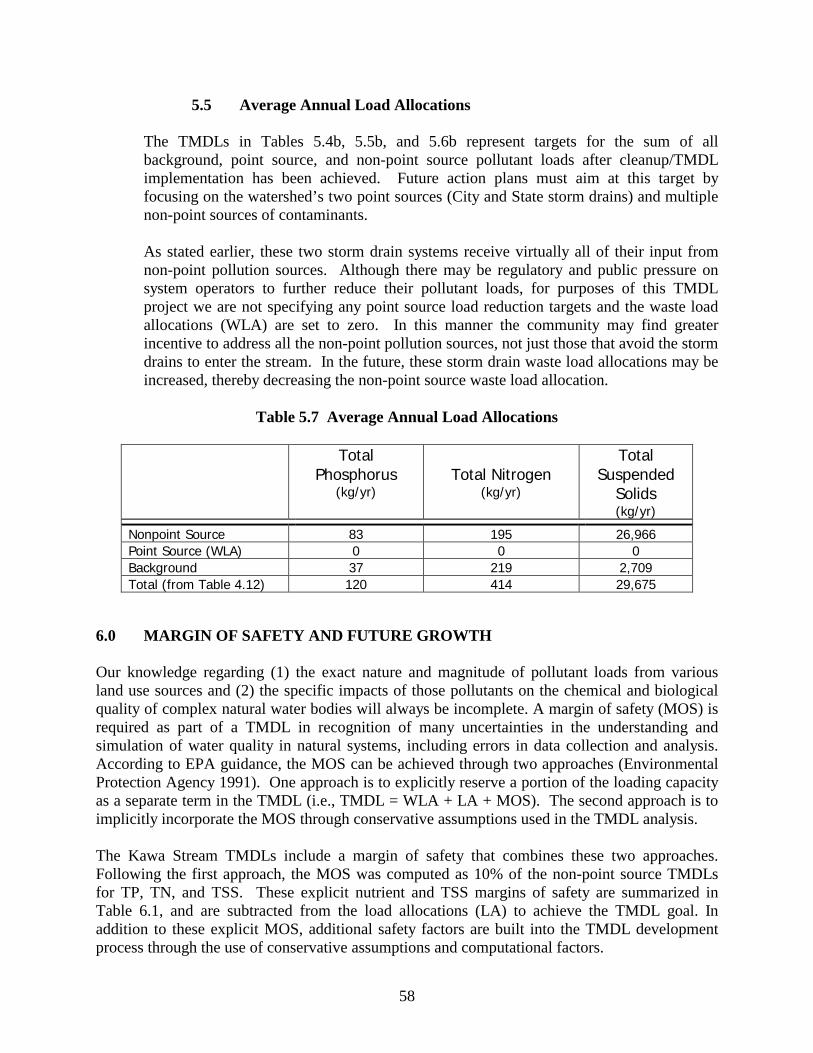
58
5.5 Average Annual Load Allocations
The TMDLs in Tables 5.4b, 5.5b, and 5.6b represent targets for the sum of all background, point source, and non-point source pollutant loads after cleanup/TMDL implementation has been achieved. Future action plans must aim at this target by focusing on the watershed’s two point sources (City and State storm drains) and multiple non-point sources of contaminants. As stated earlier, these two storm drain systems receive virtually all of their input from non-point pollution sources. Although there may be regulatory and public pressure on system operators to further reduce their pollutant loads, for purposes of this TMDL project we are not specifying any point source load reduction targets and the waste load allocations (WLA) are set to zero. In this manner the community may find greater incentive to address all the non-point pollution sources, not just those that avoid the storm drains to enter the stream. In the future, these storm drain waste load allocations may be increased, thereby decreasing the non-point source waste load allocation.
Table 5.7 Average Annual Load Allocations
Total Phosphorus
(kg/yr) Total Nitrogen
(kg/yr)
Total Suspended
Solids (kg/yr)
Nonpoint Source 83 195 26,966 Point Source (WLA) 0 0 0 Background 37 219 2,709 Total (from Table 4.12) 120 414 29,675
6.0 MARGIN OF SAFETY AND FUTURE GROWTH Our knowledge regarding (1) the exact nature and magnitude of pollutant loads from various land use sources and (2) the specific impacts of those pollutants on the chemical and biological quality of complex natural water bodies will always be incomplete. A margin of safety (MOS) is required as part of a TMDL in recognition of many uncertainties in the understanding and simulation of water quality in natural systems, including errors in data collection and analysis. According to EPA guidance, the MOS can be achieved through two approaches (Environmental Protection Agency 1991). One approach is to explicitly reserve a portion of the loading capacity as a separate term in the TMDL (i.e., TMDL = WLA + LA + MOS). The second approach is to implicitly incorporate the MOS through conservative assumptions used in the TMDL analysis. The Kawa Stream TMDLs include a margin of safety that combines these two approaches. Following the first approach, the MOS was computed as 10% of the non-point source TMDLs for TP, TN, and TSS. These explicit nutrient and TSS margins of safety are summarized in Table 6.1, and are subtracted from the load allocations (LA) to achieve the TMDL goal. In addition to these explicit MOS, additional safety factors are built into the TMDL development process through the use of conservative assumptions and computational factors.

59
Kawa Stream watershed is quite small with an excellent record of rainfall and streamflow, allowing us to compute a water balance used in re-calibrating the HEC hydrologic model runoff coefficients. This suggested that the initially assumed runoff coefficients were off by at least a factor of two for the watershed as a whole. If the loading coefficients are even this inaccurate they become meaningless in multivariate modeling of nutrient fluxes. Therefore, we based our TMDL calculations on geometric grand means of our entire water quality data set. Examination of geometric standard deviation in these data suggests a greater degree of accuracy, to within 25 percent of actual values. The MOS is intended to account for such uncertainties in a manner that is conservative from the standpoint of environmental protection. Our data indicate that phosphorus concentrations hover around attainment of State water quality standards in base flows, but greatly exceed concentration criteria during storm runoff events. TSS concentrations attain State water quality standards in base flows with a significant margin of safety and only slightly exceed concentration criteria during storm flows (Table 5.1). However, because (1) phosphorus and turbidity are both highly correlated with sediment-laden runoff during storm events, and (2) both exceed State criteria, particularly during storm events, we lowered the storm runoff TSS load target level to correspond with the wet season geometric mean concentration criterion. Initially we set the storm runoff TSS TMDL using concentrations obtained at 70% (35 mg/l) on a cumulative probability curve fitted to State wet season concentration criteria (parallel with the TN and TP method, see Section 4.7). However, to control TP and turbidity during storm events, it is important to also control TSS. Therefore we lowered the concentration used to that obtained at the 55% cumulative probability level (25 mg/l). This reduction generates a small exceedance of the TSS concentration criteria calculated for storm runoff events and allows us to assign meaningful TSS TMDLs for them. Because this is a relatively old, well-established community with little developable land, the load allocations for future growth are set to zero. Despite these known sources of uncertainty, the TMDLs establish a reasonable starting point for implementation. Subsequent monitoring during the implementation phase may be used to refine the TMDLs and should indicate whether BMPs are helping achieve better water quality.
Table 6.1 Explicit Margins of Safety (MOS)
MOS Total Phosphorus Total Nitrogen
Total Suspended
Solids Wet Season Base Flow 1.5 kg 5.1 kg 819.5 kg Dry Season Base Flow 0.8 kg 2.8 kg 279.8 kg Storm Runoff 6.0 kg 11.6 kg 1597.3 kg Annual Total 8.3 kg 19.5 kg 2696.6 kg
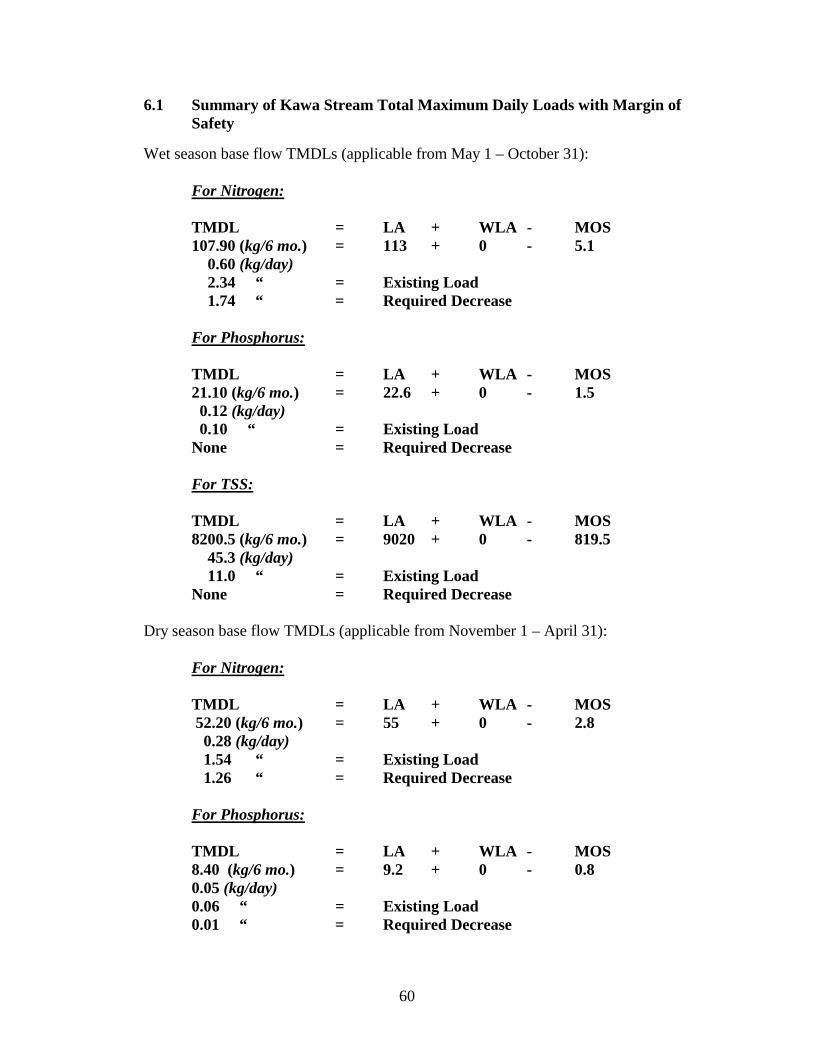
60
6.1 Summary of Kawa Stream Total Maximum Daily Loads with Margin of Safety
Wet season base flow TMDLs (applicable from May 1 – October 31):
For Nitrogen:
TMDL = LA + WLA - MOS 107.90 (kg/6 mo.) = 113 + 0 - 5.1 0.60 (kg/day) 2.34 “ = Existing Load 1.74 “ = Required Decrease For Phosphorus: TMDL = LA + WLA - MOS 21.10 (kg/6 mo.) = 22.6 + 0 - 1.5 0.12 (kg/day) 0.10 “ = Existing Load None = Required Decrease For TSS: TMDL = LA + WLA - MOS 8200.5 (kg/6 mo.) = 9020 + 0 - 819.5 45.3 (kg/day) 11.0 “ = Existing Load None = Required Decrease
Dry season base flow TMDLs (applicable from November 1 – April 31):
For Nitrogen: TMDL = LA + WLA - MOS 52.20 (kg/6 mo.) = 55 + 0 - 2.8 0.28 (kg/day) 1.54 “ = Existing Load 1.26 “ = Required Decrease For Phosphorus: TMDL = LA + WLA - MOS 8.40 (kg/6 mo.) = 9.2 + 0 - 0.8 0.05 (kg/day) 0.06 “ = Existing Load 0.01 “ = Required Decrease
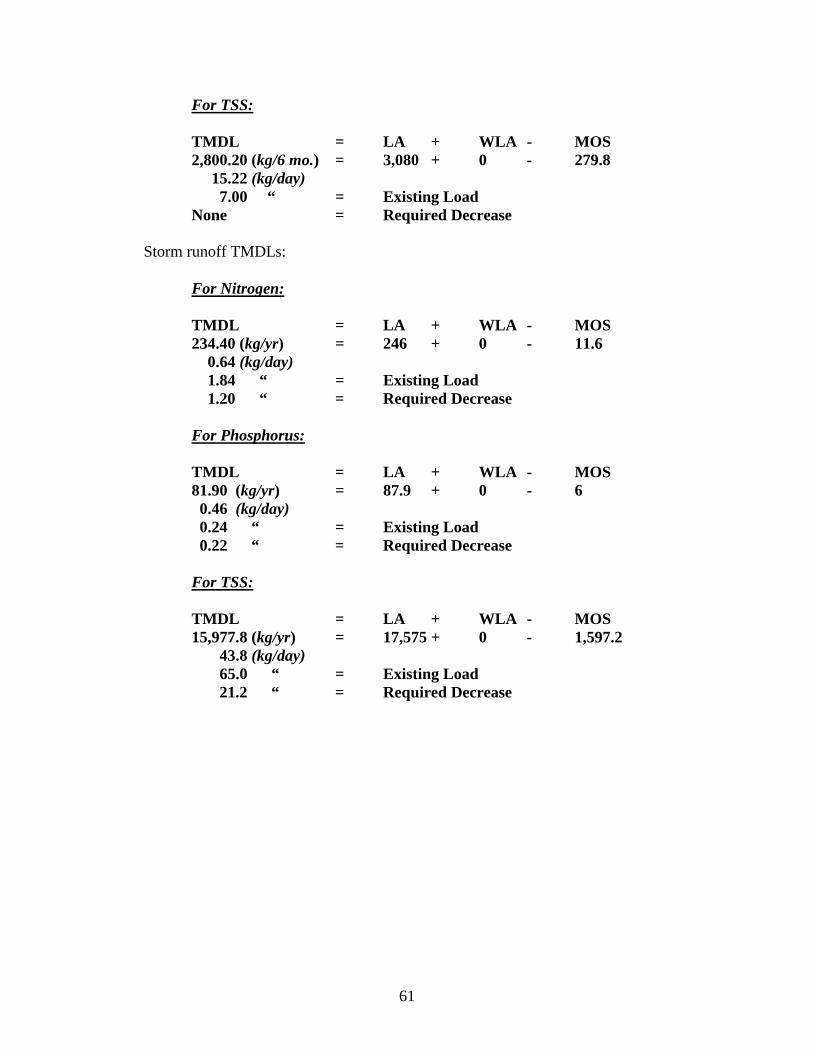
61
For TSS: TMDL = LA + WLA - MOS 2,800.20 (kg/6 mo.) = 3,080 + 0 - 279.8 15.22 (kg/day) 7.00 “ = Existing Load None = Required Decrease
Storm runoff TMDLs:
For Nitrogen: TMDL = LA + WLA - MOS 234.40 (kg/yr) = 246 + 0 - 11.6 0.64 (kg/day) 1.84 “ = Existing Load 1.20 “ = Required Decrease
For Phosphorus: TMDL = LA + WLA - MOS 81.90 (kg/yr) = 87.9 + 0 - 6 0.46 (kg/day) 0.24 “ = Existing Load 0.22 “ = Required Decrease For TSS: TMDL = LA + WLA - MOS 15,977.8 (kg/yr) = 17,575 + 0 - 1,597.2 43.8 (kg/day) 65.0 “ = Existing Load 21.2 “ = Required Decrease
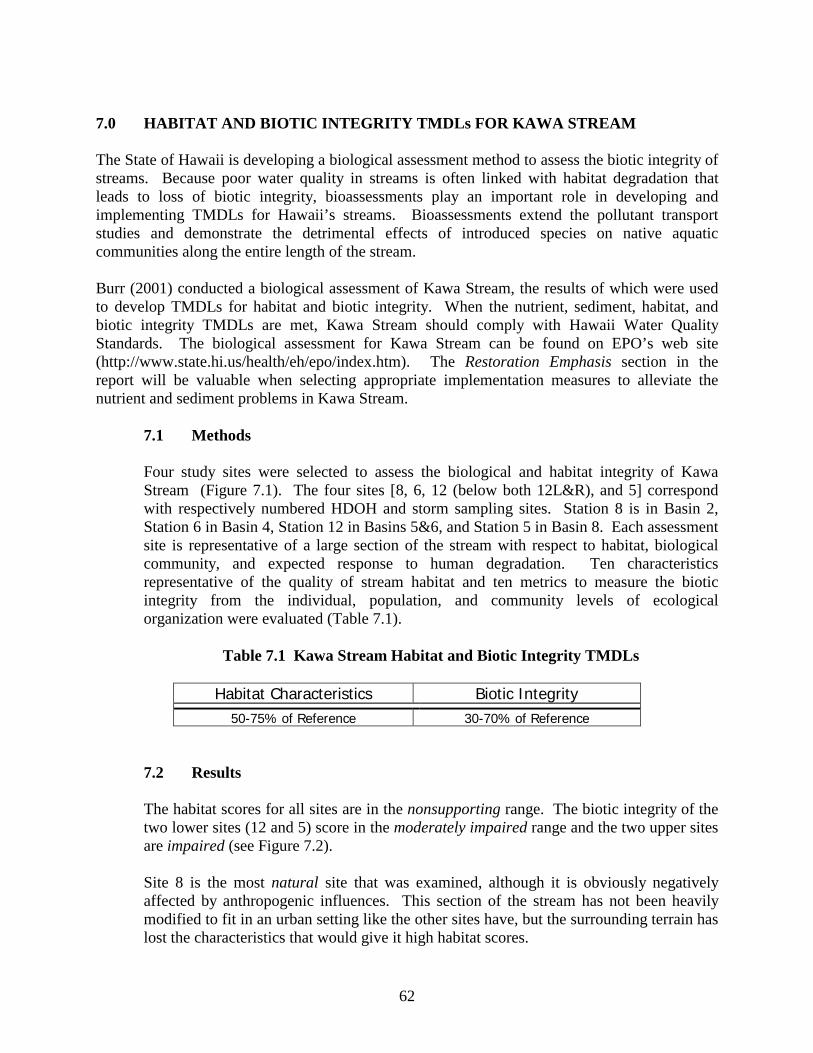
62
7.0 HABITAT AND BIOTIC INTEGRITY TMDLs FOR KAWA STREAM The State of Hawaii is developing a biological assessment method to assess the biotic integrity of streams. Because poor water quality in streams is often linked with habitat degradation that leads to loss of biotic integrity, bioassessments play an important role in developing and implementing TMDLs for Hawaii’s streams. Bioassessments extend the pollutant transport studies and demonstrate the detrimental effects of introduced species on native aquatic communities along the entire length of the stream. Burr (2001) conducted a biological assessment of Kawa Stream, the results of which were used to develop TMDLs for habitat and biotic integrity. When the nutrient, sediment, habitat, and biotic integrity TMDLs are met, Kawa Stream should comply with Hawaii Water Quality Standards. The biological assessment for Kawa Stream can be found on EPO’s web site (http://www.state.hi.us/health/eh/epo/index.htm). The Restoration Emphasis section in the report will be valuable when selecting appropriate implementation measures to alleviate the nutrient and sediment problems in Kawa Stream.
7.1 Methods
Four study sites were selected to assess the biological and habitat integrity of Kawa Stream (Figure 7.1). The four sites [8, 6, 12 (below both 12L&R), and 5] correspond with respectively numbered HDOH and storm sampling sites. Station 8 is in Basin 2, Station 6 in Basin 4, Station 12 in Basins 5&6, and Station 5 in Basin 8. Each assessment site is representative of a large section of the stream with respect to habitat, biological community, and expected response to human degradation. Ten characteristics representative of the quality of stream habitat and ten metrics to measure the biotic integrity from the individual, population, and community levels of ecological organization were evaluated (Table 7.1).
Table 7.1 Kawa Stream Habitat and Biotic Integrity TMDLs
Habitat Characteristics Biotic Integrity 50-75% of Reference 30-70% of Reference
7.2 Results
The habitat scores for all sites are in the nonsupporting range. The biotic integrity of the two lower sites (12 and 5) score in the moderately impaired range and the two upper sites are impaired (see Figure 7.2).
Site 8 is the most natural site that was examined, although it is obviously negatively affected by anthropogenic influences. This section of the stream has not been heavily modified to fit in an urban setting like the other sites have, but the surrounding terrain has lost the characteristics that would give it high habitat scores.

63
Figure 7.1 Map of Kawa Watershed
0
20
40
60
80
100
0 20 40 60 80 100Habitat
Biol
ogic
al
Kawa Stream
TMDL
State Reference Streams
Non-impaired
ModeratelyImpaired
ImpairedNon-
supportingPartially-
supporting Supporting
8
12
6
ee5
Figure 7.2 Observed, Expected (TMDLs), and Reference Values for Habitat
and Biotic Integrity
H3 F
WY
KANEOHE B
AY D
R
MOKULELE DR
KAM HWY
N
Environmental Sampling Locations#
Kawa StreamWatershed Boundary
KANEOHE BAY
Kaw
a S
tream
#
#
#
#Station #5
Station #12
Station #6
Station #8
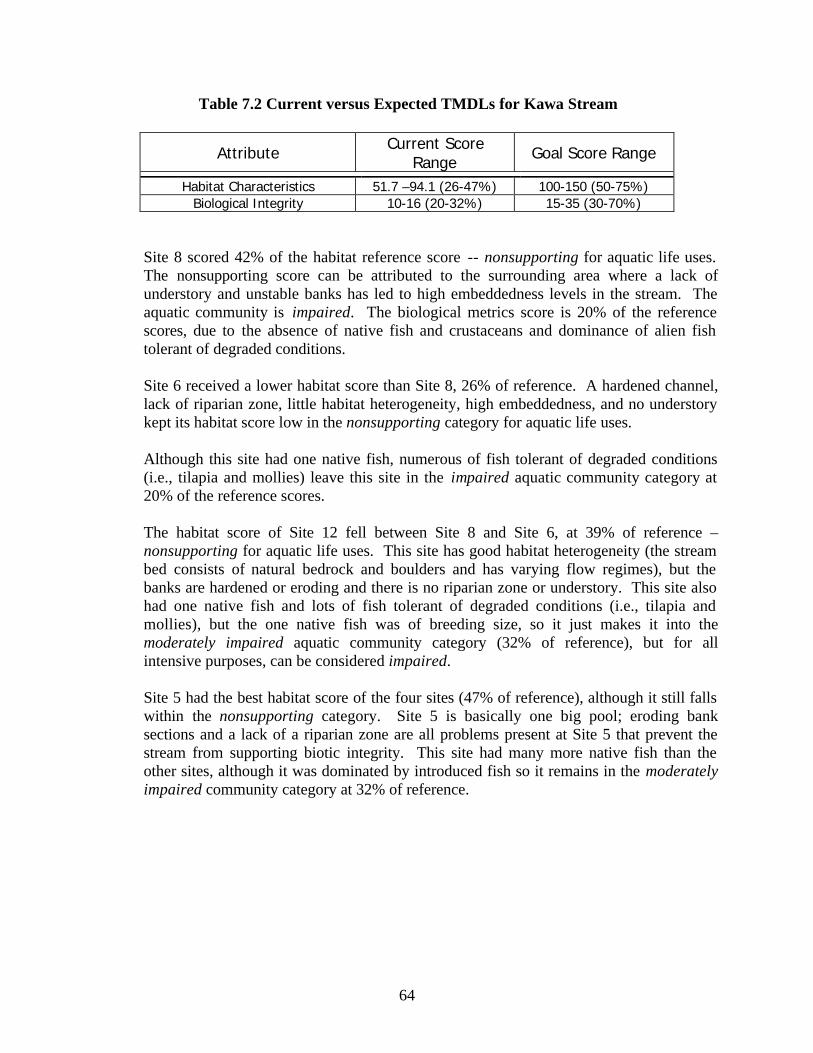
64
Table 7.2 Current versus Expected TMDLs for Kawa Stream
Attribute Current Score Range Goal Score Range
Habitat Characteristics 51.7 –94.1 (26-47%) 100-150 (50-75%) Biological Integrity 10-16 (20-32%) 15-35 (30-70%)
Site 8 scored 42% of the habitat reference score -- nonsupporting for aquatic life uses. The nonsupporting score can be attributed to the surrounding area where a lack of understory and unstable banks has led to high embeddedness levels in the stream. The aquatic community is impaired. The biological metrics score is 20% of the reference scores, due to the absence of native fish and crustaceans and dominance of alien fish tolerant of degraded conditions. Site 6 received a lower habitat score than Site 8, 26% of reference. A hardened channel, lack of riparian zone, little habitat heterogeneity, high embeddedness, and no understory kept its habitat score low in the nonsupporting category for aquatic life uses. Although this site had one native fish, numerous of fish tolerant of degraded conditions (i.e., tilapia and mollies) leave this site in the impaired aquatic community category at 20% of the reference scores.
The habitat score of Site 12 fell between Site 8 and Site 6, at 39% of reference – nonsupporting for aquatic life uses. This site has good habitat heterogeneity (the stream bed consists of natural bedrock and boulders and has varying flow regimes), but the banks are hardened or eroding and there is no riparian zone or understory. This site also had one native fish and lots of fish tolerant of degraded conditions (i.e., tilapia and mollies), but the one native fish was of breeding size, so it just makes it into the moderately impaired aquatic community category (32% of reference), but for all intensive purposes, can be considered impaired.
Site 5 had the best habitat score of the four sites (47% of reference), although it still falls within the nonsupporting category. Site 5 is basically one big pool; eroding bank sections and a lack of a riparian zone are all problems present at Site 5 that prevent the stream from supporting biotic integrity. This site had many more native fish than the other sites, although it was dominated by introduced fish so it remains in the moderately impaired community category at 32% of reference.
65
7.3 Habitat and Biotic Integrity TMDLs
The biological and habitat scores for Kawa Stream can be compared with expected scores representing reference conditions, and a parallel can be drawn with the definition of a TMDL as the sum of wasteload and load allocations plus a margin of safety (Table 1). If the biological and habitat target score ranges are defined as the expected load allocation, the actual stream scores as the observed sediment and nutrient-caused degradation, and the margin of error is identified by the use of target score ranges, then a TMDL model may be written in biological assessment terms as: TMDL = expected scores (load allocation) + expected score range (margin of safety). The expected scores can be inferred from the habitat and biotic criteria for perennial streams currently proposed in the Department of Health’s New Proposed Revisions to Water Quality Standards (Environmental Planning Office 2001, http://www.hawaii.gov/health/eh/epo/wqrev.htm). As a class 2a stream, Kawa would be expected to achieve a habitat score between 50% and 75% of reference condition (“partially supporting”) and a biotic integrity score between 30% and 70% of reference condition (“moderately impaired”).
7.4 Discussion Kawa Stream does not meet the TMDL for habitat characteristics and only two sites achieve only the lower end of the TMDL goal score range for the biotic integrity TMDL (Table 7.2 and Figure 7.2).
Kawa Stream is a short, connected stream; upstream events are felt downstream and the ramifications of downstream conditions are felt upstream. The effect of high sediment loads entering the upper reaches of Kawa Stream can be seen throughout the entire stream in the water quality data, habitat characteristics, and ultimately, the biotic integrity. TSS levels are low in the upper reaches of Kawa Stream, although high embeddedness levels demonstrate that the large particles have settled out early. Total Phosphorus levels are also elevated in the upper reaches, corresponding with the additional sediment load in the stream. These nutrients tend to bind to the iron-rich sediments present in the stream and are available to be transported downstream during a storm event. TSS levels in the water column increase further down the stream, resulting in lower embeddedness levels. In the lowest reach of Kawa Stream, TSS levels drop again while embeddedness levels rise because the flowing water has slowed down sufficiently for the larger particles to settle out.
Poor water quality and unfavorable habitat characteristics impede the migration of native aquatic animals to and from the upper reaches, resulting in lower scores for biotic integrity at stations 6 and 8 than 5 and 12. If the middle reaches of Kawa Stream were restored, it would be likely that native aquatic macrofauna could be found throughout the stream because they are relatively abundant in the lowest reach and simple habitat improvements in the upper reaches should provide adequate habitat to support a viable native community.
66
The end result of implementing the habitat and biotic integrity TMDLs will be an improvement of stream channels, reduction of sediment and nutrient loads, and reduction of introduced species impacts; similar results as are also expected through implementation of the flux-based TMDLs.
Kawa Stream is the second windward Oahu stream for which TMDLs have been calculated – the first being Waimanalo Stream (Harrigan and Burr 2001). The water quality, habitat characteristics, and biological metrics are for both streams are very similar. For example, existing loads of TSS and phosphorous were below the TMDLs for both Waimanalo Stream and Kawa Stream (Waimanalo Stream: TSS – 87% and TDP – 98% and Kawa Stream: TSS – 75% and TP – 93%) but both streams exceeded allowable nitrate loads (Waimanalo Stream: 110% and Kawa Stream: 216%). Habitat characteristics and biological metrics were also similar (Waimanalo Stream: Habitat – 33% and Biological metrics – 33% and Kawa Stream: Habitat – 39% and Biological metrics – 26%). Implementation measures determined to be effective at reducing the loads and restoring the habitat for Waimanalo Stream will most likely be effective in Kawa Stream as well.
67
8.0 ASSURANCE OF IMPLEMENTATION This section provides the basis for reasonable assurances that the nitrogen and TSS TMDLs will be achieved and maintained. For both TMDLs, Hawaii has several well-established programs that will be drawn upon. The EPA-sponsored Clean Water Action Plan of 1998 (CWAP) may also be utilized to assist in the implementation of these TMDLs. The State has given a higher priority for funding assessment and restoration activities to watersheds with 303(d) listed impaired waters. It is reasonable to expect that non-point source loads can be reduced during conditions of low streamflow and small storm flows. Low flow events associated with rainfall of one inch or less account for 95% of all the rainfall events and about 75% of the total rainfall volume. While it is difficult to partition the low flow loads among specific contributing sources, the sources themselves can be identified. These include dissolved forms of nitrogen in groundwater, grading projects, pets and feral animals in the watershed, yard fertilizers, seasonal fruit fall, leaky sewers, and deposition of sediments and organic matter in the streambed from higher flow events. When these sources are controlled in combination, non-point source reductions of the magnitude identified by this TMDL allocation may be achieved. Several activities could lead to reduced TSS, and therefore reduced turbidity and TP in the watershed. In the upper watershed, recent grading projects led to excessive sediment loads entering the stream channel. Efforts to educate landowners concerning available and effective erosion control BMPs could help reduce the sediment load to the system. Some of this loading occurs due to scouring and the highly eroded condition of the stream banks, particularly where concrete hardened banks have been undermined. Stream restoration techniques that use porous buffers and stream bank stabilization methods to cut erosion, slow the flow of storm waters, and create stream habitat would be appropriate remedies. Control of nutrients, particularly those linked to groundwater nitrates, will involve further investigations to identify specific significant sources. These sources could include pets, feral animals, fertilizers, fruit fall and leaky sewers. While the TMDL implementation planning process and subsequent activities may include efforts to pinpoint and manage these sources, reduction of nutrient loading will require significant public education to alter behaviors that have historically led to nutrient pollution. The City and County of Honolulu (Department of Environmental Services) and the State of Hawaii (Department of Transportation) operate storm drain systems that convey substantial portions of the existing pollutant loads entering Kawa Stream. As the NPDES permits for these systems approach their expiration date (September 08, 2004), waste load allocations for the point sources they represent will be revised, and public involvement will help these agencies find and implement solutions that reduce the pollutant loads introduced to their storm drain systems and improve the quality of water subsequently discharged into Kawa Stream. During the TMDL development process, the City & County of Honolulu resubmitted various applications for approval of a stream channel alteration project in the middle east branch of Kawa Stream. DOH provided written comments on the proposal to the State of Hawaii

68
Commission on Water Resource Management, noting that “While the proposed stream channel alteration project would reduce sediment loading in the newly-lined stream channel segment, it also (1) could increase scouring and sediment loading downstream; (2) would further degrade stream habitat quality; and (3) could further impair the biotic integrity of Kawa Stream. Such changes have not been considered in the establishment of Kawa Stream TMDLs” (Department of Health 2001). In response to these and other comments, the Water Commission required that “The applicant shall coordinate with the University of Hawaii Environmental Center, the Department of Health (TMDL Program), and the Division of Aquatic Resources to discuss the merits, additional time and costs needed, flood concerns, and feasibility of installing a low flow channel in Kawa Stream. The applicant shall provide the Commission with written findings of the information obtained from the discussion within 60 days of the receipt of the permit” (Commission on Water Resource Management 2002). An initial meeting of this discussion group was held on February 25, 2002, resulting in a proposed recommendation that “a concrete low flow channel is not likely to be a feasible consideration for the Kawa Ditch channel lining project. Public safety and flood management (meeting drainage standards) outweigh the need for a ‘fish-friendly’ environment, since the proposed project site is located in an urbanized area with few remaining native species. While a concrete low flow channel may concentrate the base flow in a smaller cross section, there is still the potential concern for water chemistry and a physical environment that is not entirely conducive to aquatic life in the stream.” Although this alone may not be a positive result for achieving TMDLs in Kawa Stream, the group also identified related questions and issues for further discussion (e.g. design parameters, drainage project funding, public education partnerships, and use of stream assessment data). As we continue opening lines of communication and information exchange about these issues in general, assurances that achieving and maintaining TMDLs in Kawa and other streams are expected to strengthen. 9.0 PUBLIC PARTICIPATION PROCESS The middle branch of Kawa Stream, which borders and runs through the Castle High School campus, is one of the most highly polluted stream segments. During April 2001, a representative of Oceanit and a representative of the DOH gave presentations to four high school science classes at the school. We discussed summarized data from this report, gave the students a home survey to complete, and challenged them to conduct studies to more closely identify specific sources of nutrient and sediment pollution in "their" branch of the stream. The science teachers set up a more formal approach to this problem as part of their class curriculum beginning during the fall of 2001, and results from their efforts can be viewed on their Hawaii Department of Education website at http://www.k12.hi.us/~scyboron/ahupuaa/. Based on field and laboratory activities, students determined that “Castle High School is adding nitrate to Kawa Stream, so my hypothesis is correct. But I can’t say where exactly that nitrate is coming from,” and suggested that “If I had more time and plenty of nitrate test kits, I would send

69
people to sample different parts of the Ag Stream on many different days. Then we could tell whether the nitrate is coming from the athletic fields, or the ag fields, or someplace else.” During the TMDL development process, public information about the project is disseminated in numerous ways. Websites maintained by Oceanit, AECOS, and DOH provide updates about project activities, post water quality sampling and assessment results, and house electronically accessible copies of the public review document:
http://www.oceanit.com/customer_links/community/Kawa%20Stream/Default.htm http://www.pixi.com/~isd/KawaWQ.html http://www.state.hi.us/health/eh/epo
DOH staff held discussions with and gave presentations to numerous stakeholders including:
Kaneohe Neighborhood Board Kaneohe Community and Family Center Kaneohe Business Group Koolau News State of Hawaii Department of Transportation (Highways Division) State of Hawaii Commission on Water Resource Management Hawaiian Memorial Park Cemetery Hawaii Veterans Cemetery Windward City Shopping Center Bay View Golf Course Waikalua Loko Fishpond Preservation Society Ho`omaluhia Botanical Garden Kailua Bay Advisory Council Ahupua`a Action Alliance
A public information meeting on the final draft of this TMDL report was held at the Kaneohe Civic Center on October 23, 2001. The meeting was attended by members of the local community and the press, and included a brainstorming exercise for Kawa Stream TMDL Implementation (results below). DOH staff is currently promoting ongoing public participation to develop a TMDL implementation plan that utilizes these results. During the ensuing public review period, DOH received three public comment letters on the draft TMDL report. A coordinated response to these comments was mailed out and the comments and responses are incorporated in this final edition of the TMDL technical report.

70
Results of Brainstorming Exercise for Kawa Stream TMDL Implementation Kawa Stream TMDL Public Information Meeting
10/30/2001
Idea Votes Educate people about alternative landscaping and construction methods. Develop residential and commercial BMPs
7
Explore alternative bank stabilization measures 5 Castle High School/Community – Pollution prevention project: Erosion, nutrients (Agriculture curriculum)
5
Fish-friendly low flow channels 4 Riparian planting demonstration/Plant sources 4 Rip out all the concrete 3 City and County of Honolulu/Castle High School - Bank stabilization 3 Reduce slope of banks 3 Alternative ways to control overgrowth of vegetation in channel/on banks 3 Public awareness campaign at Windward City Shopping Center 3 Tell the story of the stream 2 Establish erosion control and siltation basins along periphery 2 Eradicate armored catfish and other alien fishes 2 Treat street runoff 2 Appreciation through education, access, and improvement 1 Recycling of nutrient-laden water 1 Identify/advertise public access locations 0 Pathway/Greenway through stream 0 Investigate gasoline sources and reduce 0 More native species 0 Educate about new introductions of alien species 0 Reintroduce native species 0 TOTAL VOTES AVAILABLE (4 votes per person, 18 signed in to meeting) 72 TOTAL VOTES CAST 50 Ideas listed first by votes cast, then by order of submission. Participants also noted the existence of a related City and County of Honolulu Vision project in process for Kaneohe (contact Steve Kubota) and an overriding engineering and government service mandate to maintain public health and safety.
71
10.0 REFERENCES AECOS Inc. 1992. Impacts to the natural environment from proposed Bayview Golf Course expansion plan revisions. Prepared for Pacific Atlas (Hawaii), Inc. 11 p.
Burr, S. 2001. Kawa Stream Bioassessment. State of Hawaii Department, Environmental Planning Office.
Brewer/Brandman Associates. 1989. Baseline marine, estuarine and stream surveys: Bayview Golf Course Expansion, South Kaneohe Bay, Oahu, Hawaii. Appendix B. In: Pacific Atlas (Hawaii), Inc. nd. Final Environmental Impact Statement – Bayview Golf Course Expansion, Kaneohe, Oahu, Hawaii. Cultural Surveys Hawaii. 1989. Archaeological survey and assessme nt of a 90-acre parcel for the proposed expansion of Bayview Golf Course. In: Pacific Atlas (Hawaii), Inc. nd. Final Environmental Impact Statement – Bayview Golf Course Expansion, Kaneohe, Oahu, Hawaii.
Commission on Water Resource Management. 2002. Letter dated January 8, 2002 from G.S. Coloma-Agaran (Chair) to R.M. Loui (Director, City 7 County of Honolulu Department of Design and Construction), re: Stream Channel Alteration Permit (SCAP-OA-328).
Department of Health. 2001. Letter dated November 30, 2001 from G. Gill (Deputy Director, Environmental Health Administration) to G.S. Coloma-Agaran (Chair, Commission on Water Resource Management), Subject: Kawa Ditch SCAP-OA-328.
Filbert, R. and R. Englund. 1995. Petition to amend instream flow standards of Kawa Stream, Oahu biological assessment. Pacific Aquatic Environmental Pacific Aquatic Environmental: Honolulu for Tom Nance Water Resource Engineering. 22 pp.
Environmental Planning Office. 2001. New Proposed Revisions to Water Quality Standards – as of December 14, 2001. State of Hawaii Department of Health. http://www.hawaii.gov/health/eh/epo/wqrev.htm
Freeman, W. 1993. Revised total maximum daily load estimates for six water quality limited segments, Island of Oahu, Hawaii. Prepared for Environmental Planning Office, Hawaii State Department of Health. Pacific Environmental Research, Honolulu, HI.
Fujiwara, T. O. 1973. Characterization of urban stormwater discharges from separate storm sewers. Master's Thesis (Civil Engineering), University of Hawaii. Guinther, E. AECOS, Inc. [email protected]
Harrigan, J. and S. Burr. 2001. Total Maximum Daily Loads Estimated for Waimanalo Stream – Island of Oahu, Hawaii. State of Hawaii Department of Health, Environmental Planning Office. Pp. 35.
Jones, B.L., R. H. Nakahara, and S. S. W. Chinn. 1971. Reconnaissance study of sediment transported by streams, island of Oahu. Circular C33. Prepared by the U.S. Geological Survey in cooperation with the City and County of Honolulu Department of Public Works and State of Hawaii Department of Land and Natural Resources Division of Water and Land Development. Honolulu, Hawaii. November 1971.
72
Marine Research Consultants. 1997. Surface water and groundwater monitoring program for the Bay View Golf Links, Kaneohe, Hawaii. Prepared for Pacific Atlas (Hawaii) Inc.
Nance, T. 1999. Hydrological study of Kawa Stream. Prepared for Bayview Golf Course. Tom Nance Water Resource Engineering.
Shade, Patricia J. 1984. Hydrology and sediment transport, Moanalua Valley, Oahu, Hawaii. U.S. Geological Survey Water-Resources Investigations Report 84-4156. Prepared in cooperation with the State of Hawaii Department of Transportation Highways Division. September 1984.
U.S. Environmental Protection Agency. 1997. Technical Guidance Manual for Developing Total Maximum Daily Loads, Book 2: Streams and Rivers, Part 1: Biochemical Oxygen Demand/ Dissolved Oxygen and Nutrients/ Eutrophication. Office of Water, Washington D.C.
U.S. Environmental Protection Agency, Chesapeake Bay Program. 1996. Chesapeake Bay Program: Watershed Model Application to Calculate Bay Nutrient Loadings: Final Findings and Recommendations (and Appendices).
U.S. Geological Survey. 1996. Summary of the Oahu Hawaii, Regional Aquifer-System Analysis. U.S. Geological Survey Professional Paper 1412-A
Wong, Michael F. 1994. Estimation of Magnitude and Frequency of Floods for Streams on the Island of Oahu, Hawaii. USGS Water Resources Report #94-4052.
Yim, S. K., and G. L. Dugan. 1975. Quality and quantity of nonpoint pollution sources in rural surface water runoff on Oahu, Hawaii. University of Hawaii, Water Resources Research Center. Tech. Rept. No. 93: 60 pp.

73
Appendix A: Stream Flow / Rainfall Correlation
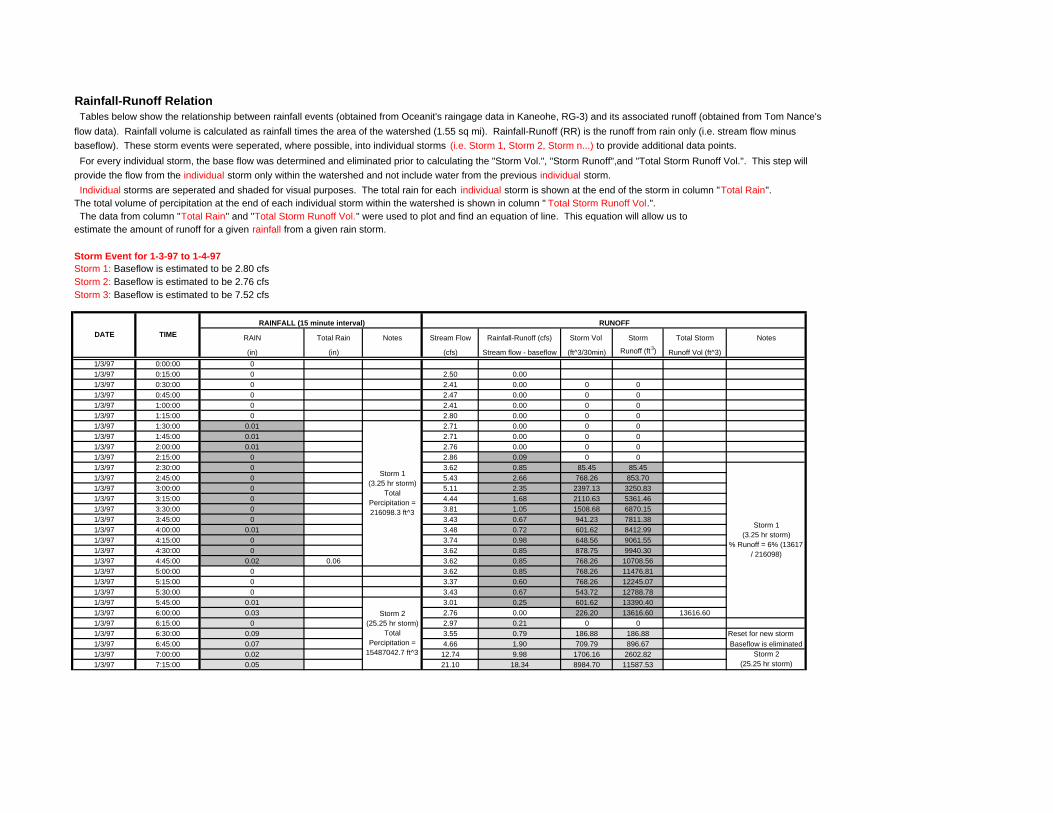
Rainfall-Runoff Relation Tables below show the relationship between rainfall events (obtained from Oceanit's raingage data in Kaneohe, RG-3) and its associated runoff (obtained from Tom Nance'sflow data). Rainfall volume is calculated as rainfall times the area of the watershed (1.55 sq mi). Rainfall-Runoff (RR) is the runoff from rain only (i.e. stream flow minusbaseflow). These storm events were seperated, where possible, into individual storms (i.e. Storm 1, Storm 2, Storm n...) to provide additional data points. For every individual storm, the base flow was determined and eliminated prior to calculating the "Storm Vol.", "Storm Runoff",and "Total Storm Runoff Vol.". This step will provide the flow from the individual storm only within the watershed and not include water from the previous individual storm. Individual storms are seperated and shaded for visual purposes. The total rain for each individual storm is shown at the end of the storm in column "Total Rain". The total volume of percipitation at the end of each individual storm within the watershed is shown in column " Total Storm Runoff Vol.". The data from column "Total Rain" and "Total Storm Runoff Vol." were used to plot and find an equation of line. This equation will allow us to estimate the amount of runoff for a given rainfall from a given rain storm.
Storm Event for 1-3-97 to 1-4-97Storm 1: Baseflow is estimated to be 2.80 cfsStorm 2: Baseflow is estimated to be 2.76 cfsStorm 3: Baseflow is estimated to be 7.52 cfs
RAIN Total Rain Notes Stream Flow Rainfall-Runoff (cfs) Storm Vol Storm Total Storm Notes
(in) (in) (cfs) Stream flow - baseflow (ft^3/30min) Runoff (ft 3) Runoff Vol (ft^3)1/3/97 0:00:00 01/3/97 0:15:00 0 2.50 0.001/3/97 0:30:00 0 2.41 0.00 0 01/3/97 0:45:00 0 2.47 0.00 0 01/3/97 1:00:00 0 2.41 0.00 0 01/3/97 1:15:00 0 2.80 0.00 0 01/3/97 1:30:00 0.01 2.71 0.00 0 01/3/97 1:45:00 0.01 2.71 0.00 0 01/3/97 2:00:00 0.01 2.76 0.00 0 01/3/97 2:15:00 0 2.86 0.09 0 01/3/97 2:30:00 0 3.62 0.85 85.45 85.451/3/97 2:45:00 0 5.43 2.66 768.26 853.701/3/97 3:00:00 0 5.11 2.35 2397.13 3250.831/3/97 3:15:00 0 4.44 1.68 2110.63 5361.461/3/97 3:30:00 0 3.81 1.05 1508.68 6870.151/3/97 3:45:00 0 3.43 0.67 941.23 7811.381/3/97 4:00:00 0.01 3.48 0.72 601.62 8412.991/3/97 4:15:00 0 3.74 0.98 648.56 9061.551/3/97 4:30:00 0 3.62 0.85 878.75 9940.301/3/97 4:45:00 0.02 0.06 3.62 0.85 768.26 10708.561/3/97 5:00:00 0 3.62 0.85 768.26 11476.811/3/97 5:15:00 0 3.37 0.60 768.26 12245.071/3/97 5:30:00 0 3.43 0.67 543.72 12788.781/3/97 5:45:00 0.01 3.01 0.25 601.62 13390.401/3/97 6:00:00 0.03 2.76 0.00 226.20 13616.60 13616.601/3/97 6:15:00 0 2.97 0.21 0 01/3/97 6:30:00 0.09 3.55 0.79 186.88 186.88 Reset for new storm1/3/97 6:45:00 0.07 4.66 1.90 709.79 896.67 Baseflow is eliminated1/3/97 7:00:00 0.02 12.74 9.98 1706.16 2602.821/3/97 7:15:00 0.05 21.10 18.34 8984.70 11587.53
TIMEDATE
Storm 2 (25.25 hr storm)
Total Percipitation =
15487042.7 ft^3
RUNOFFRAINFALL (15 minute interval)
Storm 1 (3.25 hr storm)
% Runoff = 6% (13617 / 216098)
Storm 1 (3.25 hr storm)
Total Percipitation = 216098.3 ft^3
Storm 2 (25.25 hr storm)
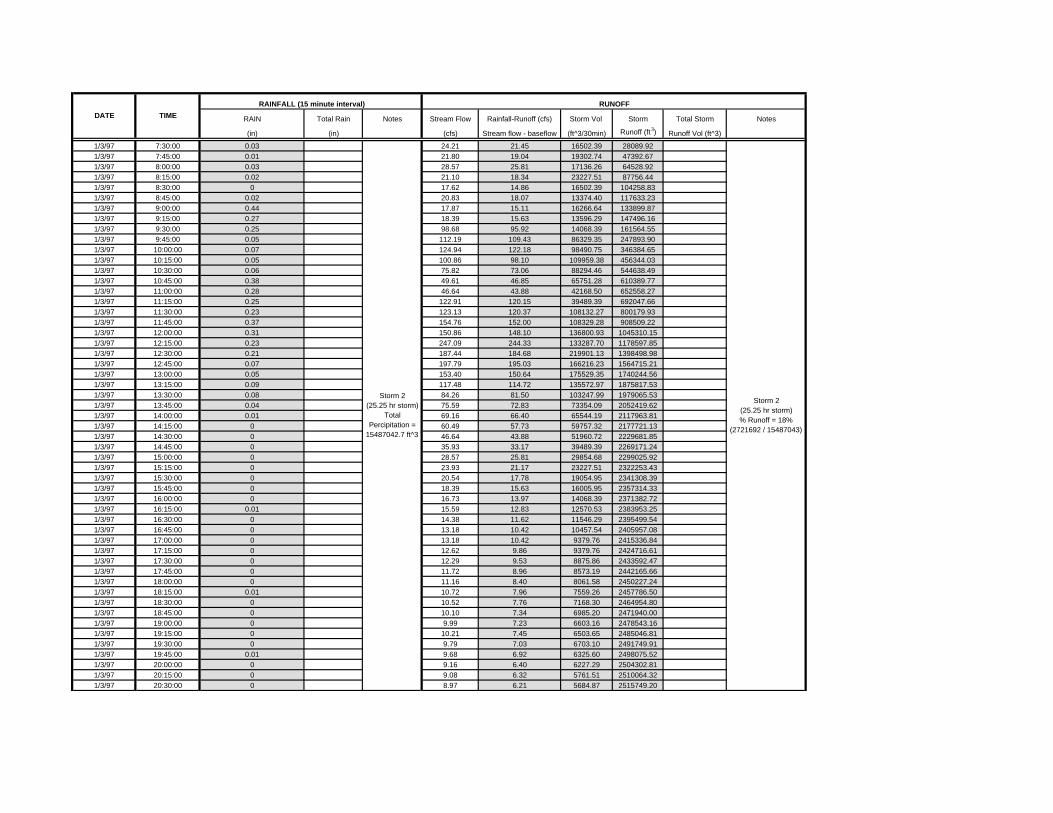
RAIN Total Rain Notes Stream Flow Rainfall-Runoff (cfs) Storm Vol Storm Total Storm Notes
(in) (in) (cfs) Stream flow - baseflow (ft^3/30min) Runoff (ft 3) Runoff Vol (ft^3)
TIMEDATERUNOFFRAINFALL (15 minute interval)
1/3/97 7:30:00 0.03 24.21 21.45 16502.39 28089.921/3/97 7:45:00 0.01 21.80 19.04 19302.74 47392.671/3/97 8:00:00 0.03 28.57 25.81 17136.26 64528.921/3/97 8:15:00 0.02 21.10 18.34 23227.51 87756.441/3/97 8:30:00 0 17.62 14.86 16502.39 104258.831/3/97 8:45:00 0.02 20.83 18.07 13374.40 117633.231/3/97 9:00:00 0.44 17.87 15.11 16266.64 133899.871/3/97 9:15:00 0.27 18.39 15.63 13596.29 147496.161/3/97 9:30:00 0.25 98.68 95.92 14068.39 161564.551/3/97 9:45:00 0.05 112.19 109.43 86329.35 247893.901/3/97 10:00:00 0.07 124.94 122.18 98490.75 346384.651/3/97 10:15:00 0.05 100.86 98.10 109959.38 456344.031/3/97 10:30:00 0.06 75.82 73.06 88294.46 544638.491/3/97 10:45:00 0.38 49.61 46.85 65751.28 610389.771/3/97 11:00:00 0.28 46.64 43.88 42168.50 652558.271/3/97 11:15:00 0.25 122.91 120.15 39489.39 692047.661/3/97 11:30:00 0.23 123.13 120.37 108132.27 800179.931/3/97 11:45:00 0.37 154.76 152.00 108329.28 908509.221/3/97 12:00:00 0.31 150.86 148.10 136800.93 1045310.151/3/97 12:15:00 0.23 247.09 244.33 133287.70 1178597.851/3/97 12:30:00 0.21 187.44 184.68 219901.13 1398498.981/3/97 12:45:00 0.07 197.79 195.03 166216.23 1564715.211/3/97 13:00:00 0.05 153.40 150.64 175529.35 1740244.561/3/97 13:15:00 0.09 117.48 114.72 135572.97 1875817.531/3/97 13:30:00 0.08 84.26 81.50 103247.99 1979065.531/3/97 13:45:00 0.04 75.59 72.83 73354.09 2052419.621/3/97 14:00:00 0.01 69.16 66.40 65544.19 2117963.811/3/97 14:15:00 0 60.49 57.73 59757.32 2177721.131/3/97 14:30:00 0 46.64 43.88 51960.72 2229681.851/3/97 14:45:00 0 35.93 33.17 39489.39 2269171.241/3/97 15:00:00 0 28.57 25.81 29854.68 2299025.921/3/97 15:15:00 0 23.93 21.17 23227.51 2322253.431/3/97 15:30:00 0 20.54 17.78 19054.95 2341308.391/3/97 15:45:00 0 18.39 15.63 16005.95 2357314.331/3/97 16:00:00 0 16.73 13.97 14068.39 2371382.721/3/97 16:15:00 0.01 15.59 12.83 12570.53 2383953.251/3/97 16:30:00 0 14.38 11.62 11546.29 2395499.541/3/97 16:45:00 0 13.18 10.42 10457.54 2405957.081/3/97 17:00:00 0 13.18 10.42 9379.76 2415336.841/3/97 17:15:00 0 12.62 9.86 9379.76 2424716.611/3/97 17:30:00 0 12.29 9.53 8875.86 2433592.471/3/97 17:45:00 0 11.72 8.96 8573.19 2442165.661/3/97 18:00:00 0 11.16 8.40 8061.58 2450227.241/3/97 18:15:00 0.01 10.72 7.96 7559.26 2457786.501/3/97 18:30:00 0 10.52 7.76 7168.30 2464954.801/3/97 18:45:00 0 10.10 7.34 6985.20 2471940.001/3/97 19:00:00 0 9.99 7.23 6603.16 2478543.161/3/97 19:15:00 0 10.21 7.45 6503.65 2485046.811/3/97 19:30:00 0 9.79 7.03 6703.10 2491749.911/3/97 19:45:00 0.01 9.68 6.92 6325.60 2498075.521/3/97 20:00:00 0 9.16 6.40 6227.29 2504302.811/3/97 20:15:00 0 9.08 6.32 5761.51 2510064.321/3/97 20:30:00 0 8.97 6.21 5684.87 2515749.20
Storm 2 (25.25 hr storm)
Total Percipitation =
15487042.7 ft^3
Storm 2 (25.25 hr storm) % Runoff = 18%
(2721692 / 15487043)

RAIN Total Rain Notes Stream Flow Rainfall-Runoff (cfs) Storm Vol Storm Total Storm Notes
(in) (in) (cfs) Stream flow - baseflow (ft^3/30min) Runoff (ft 3) Runoff Vol (ft^3)
TIMEDATERUNOFFRAINFALL (15 minute interval)
1/3/97 20:45:00 0 8.68 5.92 5589.48 2521338.671/3/97 21:00:00 0 8.57 5.81 5324.76 2526663.431/3/97 21:15:00 0 8.37 5.61 5231.08 2531894.521/3/97 21:30:00 0 7.70 4.94 5045.11 2536939.621/3/97 21:45:00 0 7.70 4.94 4444.64 2541384.261/3/97 22:00:00 0.02 7.62 4.86 4444.64 2545828.901/3/97 22:15:00 0 7.32 4.56 4373.26 2550202.161/3/97 22:30:00 0 7.70 4.94 4108.37 2554310.531/3/97 22:45:00 0 7.42 4.66 4444.64 2558755.161/3/97 23:00:00 0.02 7.42 4.66 4196.18 2562951.341/3/97 23:15:00 0.01 7.70 4.94 4196.18 2567147.521/3/97 23:30:00 0 7.62 4.86 4444.64 2571592.161/3/97 23:45:00 0 7.80 5.04 4373.26 2575965.421/4/97 0:00:00 0.02 7.98 5.22 4534.29 2580499.711/4/97 0:15:00 0 7.80 5.04 4696.87 2585196.581/4/97 0:30:00 0.01 7.70 4.94 4534.29 2589730.871/4/97 0:45:00 0 7.62 4.86 4444.64 2594175.511/4/97 1:00:00 0 7.98 5.22 4373.26 2598548.771/4/97 1:15:00 0.01 7.98 5.22 4696.87 2603245.641/4/97 1:30:00 0 7.62 4.86 4696.87 2607942.511/4/97 1:45:00 0 7.42 4.66 4373.26 2612315.771/4/97 2:00:00 0 7.32 4.56 4196.18 2616511.951/4/97 2:15:00 0 7.25 4.49 4108.37 2620620.311/4/97 2:30:00 0 6.88 4.12 4038.47 2624658.791/4/97 2:45:00 0 6.88 4.12 3710.84 2628369.621/4/97 3:00:00 0 6.79 4.03 3710.84 2632080.461/4/97 3:15:00 0 6.53 3.77 3625.83 2635706.291/4/97 3:30:00 0 6.69 3.93 3390.53 2639096.811/4/97 3:45:00 0 7.32 4.56 3541.33 2642638.141/4/97 4:00:00 0 7.25 4.49 4108.37 2646746.511/4/97 4:15:00 0 6.96 4.20 4038.47 2650784.981/4/97 4:30:00 0 7.25 4.49 3779.21 2654564.191/4/97 4:45:00 0 7.32 4.56 4038.47 2658602.671/4/97 5:00:00 0 7.52 4.76 4108.37 2662711.031/4/97 5:15:00 0 7.52 4.76 4284.48 2666995.511/4/97 5:30:00 0 7.42 4.66 4284.48 2671279.991/4/97 5:45:00 0 7.25 4.49 4196.18 2675476.161/4/97 6:00:00 0 7.15 4.39 4038.47 2679514.641/4/97 6:15:00 0 7.42 4.66 3951.55 2683466.191/4/97 6:30:00 0 7.52 4.76 4196.18 2687662.371/4/97 6:45:00 0 7.25 4.49 4284.48 2691946.841/4/97 7:00:00 0.01 4.3 7.52 4.76 4038.47 2695985.321/4/97 7:15:00 0 7.52 4.76 4284.48 2700269.791/4/97 7:30:00 0 7.52 4.76 4284.48 2704554.271/4/97 7:45:00 0.01 7.52 4.76 4284.48 2708838.751/4/97 8:00:00 0.02 7.52 4.76 4284.48 2713123.221/4/97 8:15:00 0.06 7.52 4.76 4284.48 2717407.701/4/97 8:30:00 0.1 8.97 1.45 4284.48 2721692.18 2721692.181/4/97 8:45:00 0.02 21.80 14.28 1305.48 1305.48 Reset for new storm1/4/97 9:00:00 0.01 27.47 19.95 12852.26 14157.73 Baseflow is eliminated1/4/97 9:15:00 0.03 25.23 17.71 17955.01 32112.741/4/97 9:30:00 0 19.74 12.22 15935.99 48048.731/4/97 9:45:00 0 16.73 9.21 10999.06 59047.80
Storm 2 (25.25 hr storm) % Runoff = 18%
(2721692 / 15487043)
Storm 2 (25.25 hr storm)
Total Percipitation =
15487042.7 ft^3
Storm 3 (4.25 hr storm)
Total Percipitation = 1152524.1 ft^3
Storm 3 (4.25 hr storm)
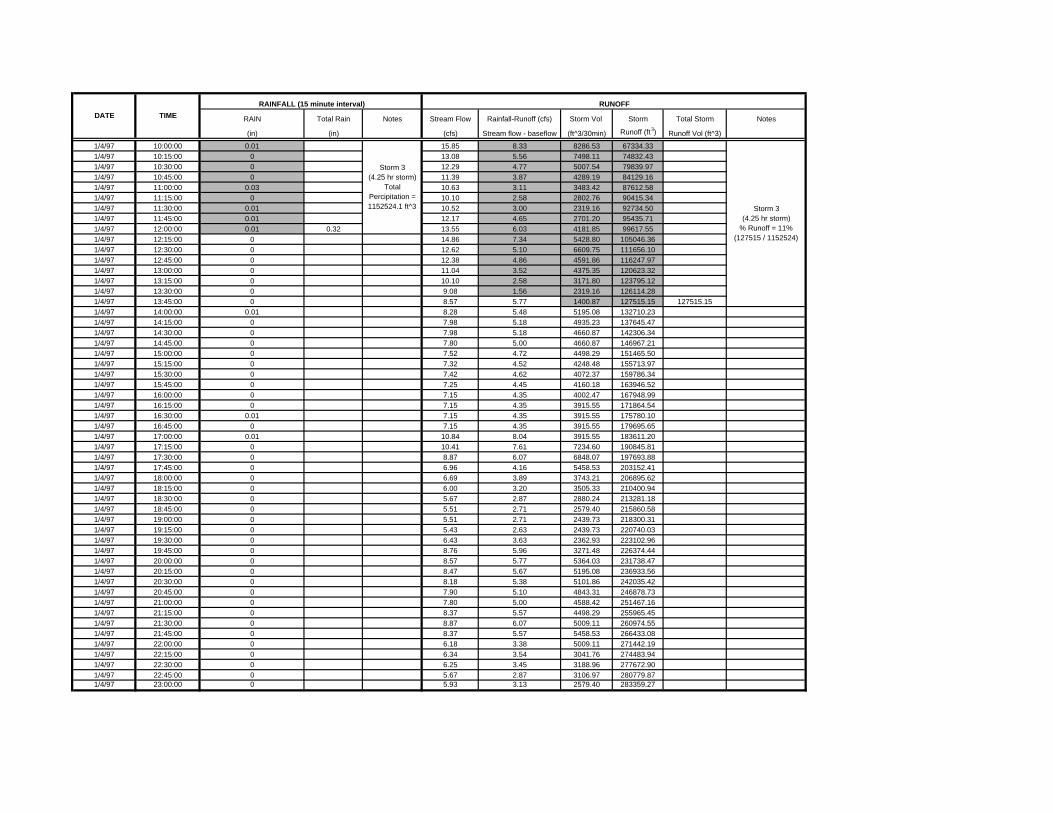
RAIN Total Rain Notes Stream Flow Rainfall-Runoff (cfs) Storm Vol Storm Total Storm Notes
(in) (in) (cfs) Stream flow - baseflow (ft^3/30min) Runoff (ft 3) Runoff Vol (ft^3)
TIMEDATERUNOFFRAINFALL (15 minute interval)
1/4/97 10:00:00 0.01 15.85 8.33 8286.53 67334.331/4/97 10:15:00 0 13.08 5.56 7498.11 74832.431/4/97 10:30:00 0 12.29 4.77 5007.54 79839.971/4/97 10:45:00 0 11.39 3.87 4289.19 84129.161/4/97 11:00:00 0.03 10.63 3.11 3483.42 87612.581/4/97 11:15:00 0 10.10 2.58 2802.76 90415.341/4/97 11:30:00 0.01 10.52 3.00 2319.16 92734.501/4/97 11:45:00 0.01 12.17 4.65 2701.20 95435.711/4/97 12:00:00 0.01 0.32 13.55 6.03 4181.85 99617.551/4/97 12:15:00 0 14.86 7.34 5428.80 105046.361/4/97 12:30:00 0 12.62 5.10 6609.75 111656.101/4/97 12:45:00 0 12.38 4.86 4591.86 116247.971/4/97 13:00:00 0 11.04 3.52 4375.35 120623.321/4/97 13:15:00 0 10.10 2.58 3171.80 123795.121/4/97 13:30:00 0 9.08 1.56 2319.16 126114.281/4/97 13:45:00 0 8.57 5.77 1400.87 127515.15 127515.151/4/97 14:00:00 0.01 8.28 5.48 5195.08 132710.231/4/97 14:15:00 0 7.98 5.18 4935.23 137645.471/4/97 14:30:00 0 7.98 5.18 4660.87 142306.341/4/97 14:45:00 0 7.80 5.00 4660.87 146967.211/4/97 15:00:00 0 7.52 4.72 4498.29 151465.501/4/97 15:15:00 0 7.32 4.52 4248.48 155713.971/4/97 15:30:00 0 7.42 4.62 4072.37 159786.341/4/97 15:45:00 0 7.25 4.45 4160.18 163946.521/4/97 16:00:00 0 7.15 4.35 4002.47 167948.991/4/97 16:15:00 0 7.15 4.35 3915.55 171864.541/4/97 16:30:00 0.01 7.15 4.35 3915.55 175780.101/4/97 16:45:00 0 7.15 4.35 3915.55 179695.651/4/97 17:00:00 0.01 10.84 8.04 3915.55 183611.201/4/97 17:15:00 0 10.41 7.61 7234.60 190845.811/4/97 17:30:00 0 8.87 6.07 6848.07 197693.881/4/97 17:45:00 0 6.96 4.16 5458.53 203152.411/4/97 18:00:00 0 6.69 3.89 3743.21 206895.621/4/97 18:15:00 0 6.00 3.20 3505.33 210400.941/4/97 18:30:00 0 5.67 2.87 2880.24 213281.181/4/97 18:45:00 0 5.51 2.71 2579.40 215860.581/4/97 19:00:00 0 5.51 2.71 2439.73 218300.311/4/97 19:15:00 0 5.43 2.63 2439.73 220740.031/4/97 19:30:00 0 6.43 3.63 2362.93 223102.961/4/97 19:45:00 0 8.76 5.96 3271.48 226374.441/4/97 20:00:00 0 8.57 5.77 5364.03 231738.471/4/97 20:15:00 0 8.47 5.67 5195.08 236933.561/4/97 20:30:00 0 8.18 5.38 5101.86 242035.421/4/97 20:45:00 0 7.90 5.10 4843.31 246878.731/4/97 21:00:00 0 7.80 5.00 4588.42 251467.161/4/97 21:15:00 0 8.37 5.57 4498.29 255965.451/4/97 21:30:00 0 8.87 6.07 5009.11 260974.551/4/97 21:45:00 0 8.37 5.57 5458.53 266433.081/4/97 22:00:00 0 6.18 3.38 5009.11 271442.191/4/97 22:15:00 0 6.34 3.54 3041.76 274483.941/4/97 22:30:00 0 6.25 3.45 3188.96 277672.901/4/97 22:45:00 0 5.67 2.87 3106.97 280779.871/4/97 23:00:00 0 5.93 3.13 2579.40 283359.27
Storm 3 (4.25 hr storm)
% Runoff = 11% (127515 / 1152524)
Storm 3 (4.25 hr storm)
Total Percipitation = 1152524.1 ft^3
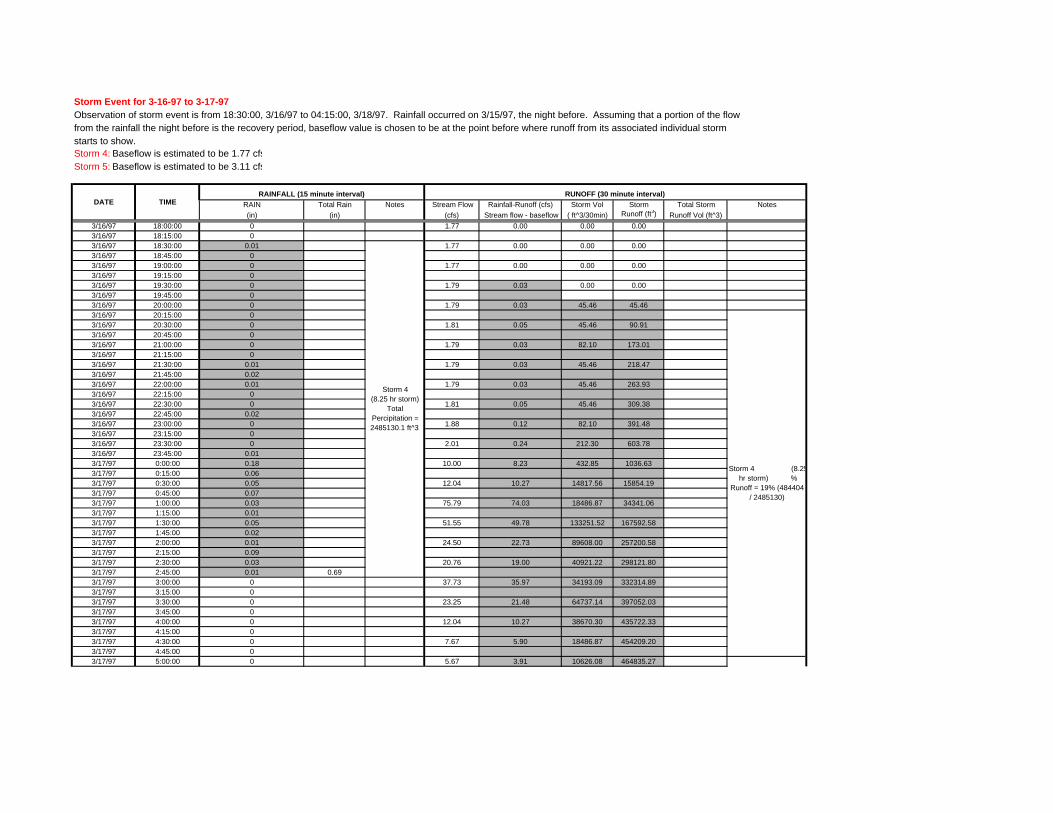
Storm Event for 3-16-97 to 3-17-97Observation of storm event is from 18:30:00, 3/16/97 to 04:15:00, 3/18/97. Rainfall occurred on 3/15/97, the night before. Assuming that a portion of the flowfrom the rainfall the night before is the recovery period, baseflow value is chosen to be at the point before where runoff from its associated individual storm starts to show.Storm 4: Baseflow is estimated to be 1.77 cfsStorm 5: Baseflow is estimated to be 3.11 cfs
RAIN Total Rain Notes Stream Flow Rainfall-Runoff (cfs) Storm Vol Storm Total Storm Notes(in) (in) (cfs) Stream flow - baseflow ( ft^3/30min) Runoff (ft3) Runoff Vol (ft^3)
3/16/97 18:00:00 0 1.77 0.00 0.00 0.003/16/97 18:15:00 03/16/97 18:30:00 0.01 1.77 0.00 0.00 0.003/16/97 18:45:00 03/16/97 19:00:00 0 1.77 0.00 0.00 0.003/16/97 19:15:00 03/16/97 19:30:00 0 1.79 0.03 0.00 0.003/16/97 19:45:00 03/16/97 20:00:00 0 1.79 0.03 45.46 45.463/16/97 20:15:00 03/16/97 20:30:00 0 1.81 0.05 45.46 90.913/16/97 20:45:00 03/16/97 21:00:00 0 1.79 0.03 82.10 173.013/16/97 21:15:00 03/16/97 21:30:00 0.01 1.79 0.03 45.46 218.473/16/97 21:45:00 0.023/16/97 22:00:00 0.01 1.79 0.03 45.46 263.933/16/97 22:15:00 03/16/97 22:30:00 0 1.81 0.05 45.46 309.383/16/97 22:45:00 0.023/16/97 23:00:00 0 1.88 0.12 82.10 391.483/16/97 23:15:00 03/16/97 23:30:00 0 2.01 0.24 212.30 603.783/16/97 23:45:00 0.013/17/97 0:00:00 0.18 10.00 8.23 432.85 1036.633/17/97 0:15:00 0.063/17/97 0:30:00 0.05 12.04 10.27 14817.56 15854.193/17/97 0:45:00 0.073/17/97 1:00:00 0.03 75.79 74.03 18486.87 34341.063/17/97 1:15:00 0.013/17/97 1:30:00 0.05 51.55 49.78 133251.52 167592.583/17/97 1:45:00 0.023/17/97 2:00:00 0.01 24.50 22.73 89608.00 257200.583/17/97 2:15:00 0.093/17/97 2:30:00 0.03 20.76 19.00 40921.22 298121.803/17/97 2:45:00 0.01 0.693/17/97 3:00:00 0 37.73 35.97 34193.09 332314.893/17/97 3:15:00 03/17/97 3:30:00 0 23.25 21.48 64737.14 397052.033/17/97 3:45:00 03/17/97 4:00:00 0 12.04 10.27 38670.30 435722.333/17/97 4:15:00 03/17/97 4:30:00 0 7.67 5.90 18486.87 454209.203/17/97 4:45:00 03/17/97 5:00:00 0 5.67 3.91 10626.08 464835.27
RUNOFF (30 minute interval)RAINFALL (15 minute interval)DATE TIME
Storm 4 (8.25 hr storm)
Total Percipitation = 2485130.1 ft^3
Storm 4 (8.25hr storm) %
Runoff = 19% (484404 / 2485130)
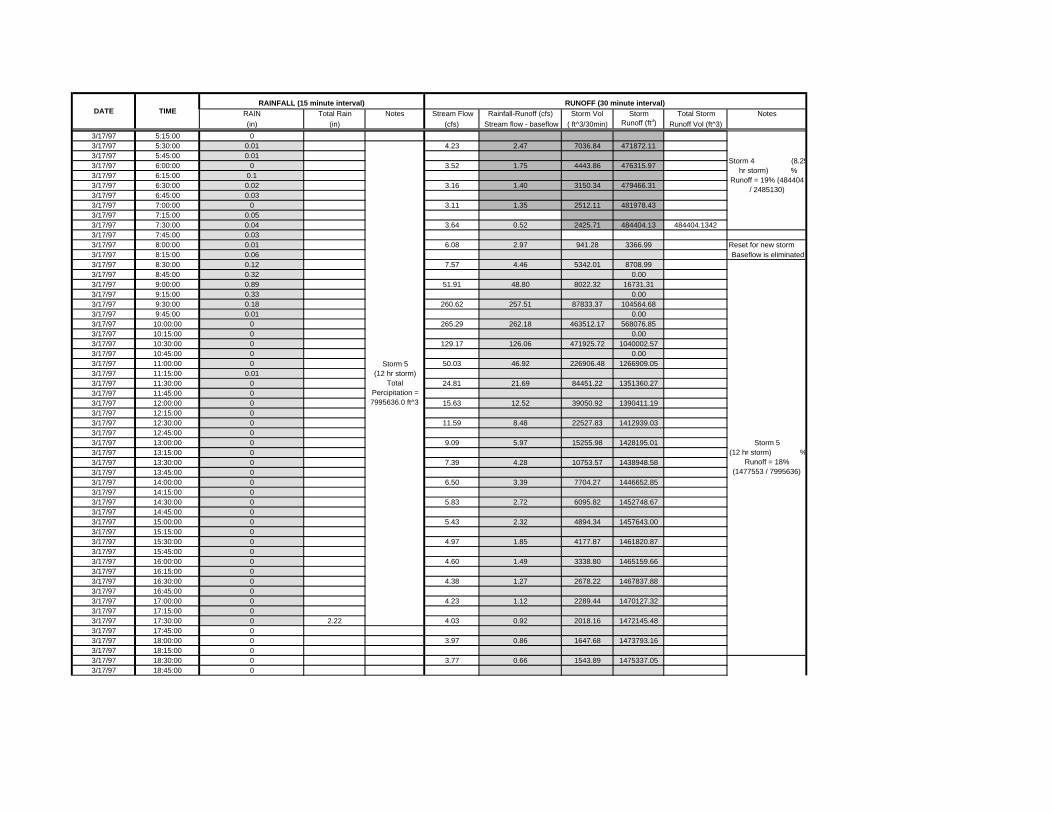
RAIN Total Rain Notes Stream Flow Rainfall-Runoff (cfs) Storm Vol Storm Total Storm Notes(in) (in) (cfs) Stream flow - baseflow ( ft^3/30min) Runoff (ft3) Runoff Vol (ft^3)
RUNOFF (30 minute interval)RAINFALL (15 minute interval)DATE TIME
3/17/97 5:15:00 03/17/97 5:30:00 0.01 4.23 2.47 7036.84 471872.113/17/97 5:45:00 0.013/17/97 6:00:00 0 3.52 1.75 4443.86 476315.973/17/97 6:15:00 0.13/17/97 6:30:00 0.02 3.16 1.40 3150.34 479466.313/17/97 6:45:00 0.033/17/97 7:00:00 0 3.11 1.35 2512.11 481978.433/17/97 7:15:00 0.053/17/97 7:30:00 0.04 3.64 0.52 2425.71 484404.13 484404.13423/17/97 7:45:00 0.033/17/97 8:00:00 0.01 6.08 2.97 941.28 3366.99 Reset for new storm3/17/97 8:15:00 0.06 Baseflow is eliminated3/17/97 8:30:00 0.12 7.57 4.46 5342.01 8708.993/17/97 8:45:00 0.32 0.003/17/97 9:00:00 0.89 51.91 48.80 8022.32 16731.313/17/97 9:15:00 0.33 0.003/17/97 9:30:00 0.18 260.62 257.51 87833.37 104564.683/17/97 9:45:00 0.01 0.003/17/97 10:00:00 0 265.29 262.18 463512.17 568076.853/17/97 10:15:00 0 0.003/17/97 10:30:00 0 129.17 126.06 471925.72 1040002.573/17/97 10:45:00 0 0.003/17/97 11:00:00 0 50.03 46.92 226906.48 1266909.053/17/97 11:15:00 0.013/17/97 11:30:00 0 24.81 21.69 84451.22 1351360.273/17/97 11:45:00 03/17/97 12:00:00 0 15.63 12.52 39050.92 1390411.193/17/97 12:15:00 03/17/97 12:30:00 0 11.59 8.48 22527.83 1412939.033/17/97 12:45:00 03/17/97 13:00:00 0 9.09 5.97 15255.98 1428195.013/17/97 13:15:00 03/17/97 13:30:00 0 7.39 4.28 10753.57 1438948.583/17/97 13:45:00 03/17/97 14:00:00 0 6.50 3.39 7704.27 1446652.853/17/97 14:15:00 03/17/97 14:30:00 0 5.83 2.72 6095.82 1452748.673/17/97 14:45:00 03/17/97 15:00:00 0 5.43 2.32 4894.34 1457643.003/17/97 15:15:00 03/17/97 15:30:00 0 4.97 1.85 4177.87 1461820.873/17/97 15:45:00 03/17/97 16:00:00 0 4.60 1.49 3338.80 1465159.663/17/97 16:15:00 03/17/97 16:30:00 0 4.38 1.27 2678.22 1467837.883/17/97 16:45:00 03/17/97 17:00:00 0 4.23 1.12 2289.44 1470127.323/17/97 17:15:00 03/17/97 17:30:00 0 2.22 4.03 0.92 2018.16 1472145.483/17/97 17:45:00 03/17/97 18:00:00 0 3.97 0.86 1647.68 1473793.163/17/97 18:15:00 03/17/97 18:30:00 0 3.77 0.66 1543.89 1475337.053/17/97 18:45:00 0
Storm 5 (12 hr storm) %
Runoff = 18% (1477553 / 7995636)
Storm 4 (8.25hr storm) %
Runoff = 19% (484404 / 2485130)
Storm 5 (12 hr storm)
Total Percipitation = 7995636.0 ft^3
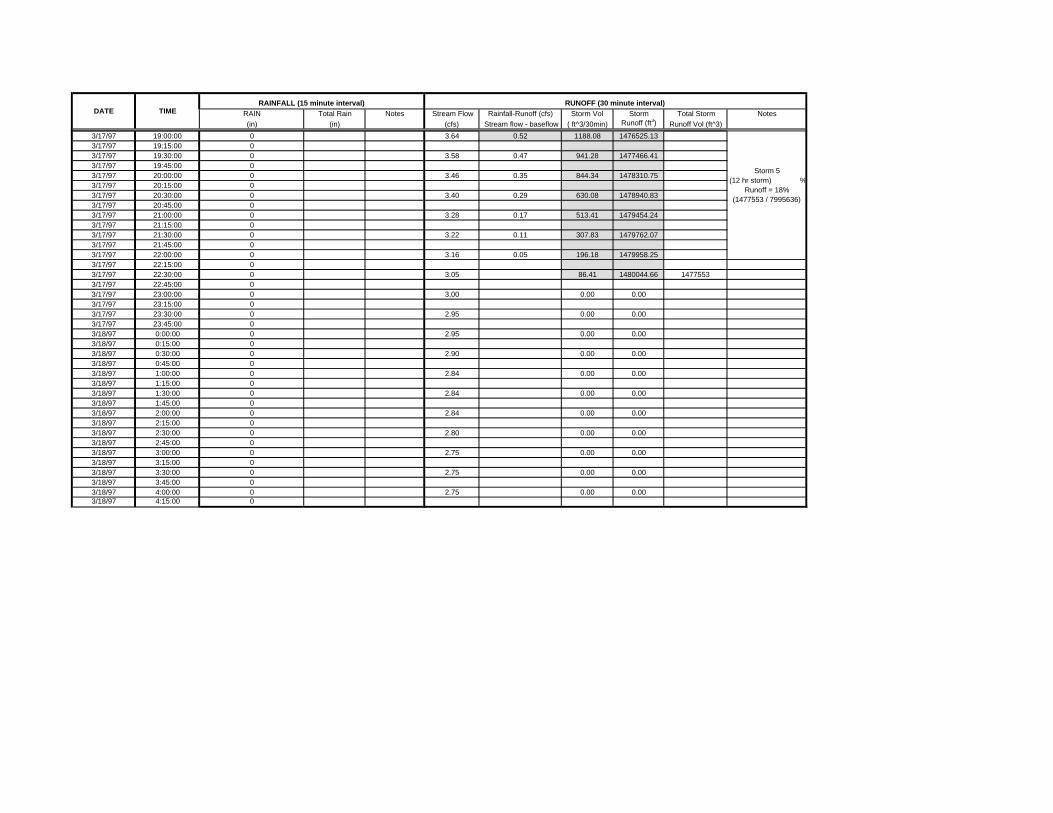
RAIN Total Rain Notes Stream Flow Rainfall-Runoff (cfs) Storm Vol Storm Total Storm Notes(in) (in) (cfs) Stream flow - baseflow ( ft^3/30min) Runoff (ft3) Runoff Vol (ft^3)
RUNOFF (30 minute interval)RAINFALL (15 minute interval)DATE TIME
3/17/97 19:00:00 0 3.64 0.52 1188.08 1476525.133/17/97 19:15:00 03/17/97 19:30:00 0 3.58 0.47 941.28 1477466.413/17/97 19:45:00 0 3/17/97 20:00:00 0 3.46 0.35 844.34 1478310.753/17/97 20:15:00 0 3/17/97 20:30:00 0 3.40 0.29 630.08 1478940.833/17/97 20:45:00 0 3/17/97 21:00:00 0 3.28 0.17 513.41 1479454.243/17/97 21:15:00 0 3/17/97 21:30:00 0 3.22 0.11 307.83 1479762.073/17/97 21:45:00 0 3/17/97 22:00:00 0 3.16 0.05 196.18 1479958.253/17/97 22:15:00 0 3/17/97 22:30:00 0 3.05 86.41 1480044.66 14775533/17/97 22:45:00 0 3/17/97 23:00:00 0 3.00 0.00 0.003/17/97 23:15:00 0 3/17/97 23:30:00 0 2.95 0.00 0.003/17/97 23:45:00 0 3/18/97 0:00:00 0 2.95 0.00 0.003/18/97 0:15:00 0 3/18/97 0:30:00 0 2.90 0.00 0.003/18/97 0:45:00 0 3/18/97 1:00:00 0 2.84 0.00 0.003/18/97 1:15:00 0 3/18/97 1:30:00 0 2.84 0.00 0.003/18/97 1:45:00 0 3/18/97 2:00:00 0 2.84 0.00 0.003/18/97 2:15:00 0 3/18/97 2:30:00 0 2.80 0.00 0.003/18/97 2:45:00 0 3/18/97 3:00:00 0 2.75 0.00 0.003/18/97 3:15:00 0 3/18/97 3:30:00 0 2.75 0.00 0.003/18/97 3:45:00 0 3/18/97 4:00:00 0 2.75 0.00 0.003/18/97 4:15:00 0
Storm 5 (12 hr storm) %
Runoff = 18% (1477553 / 7995636)
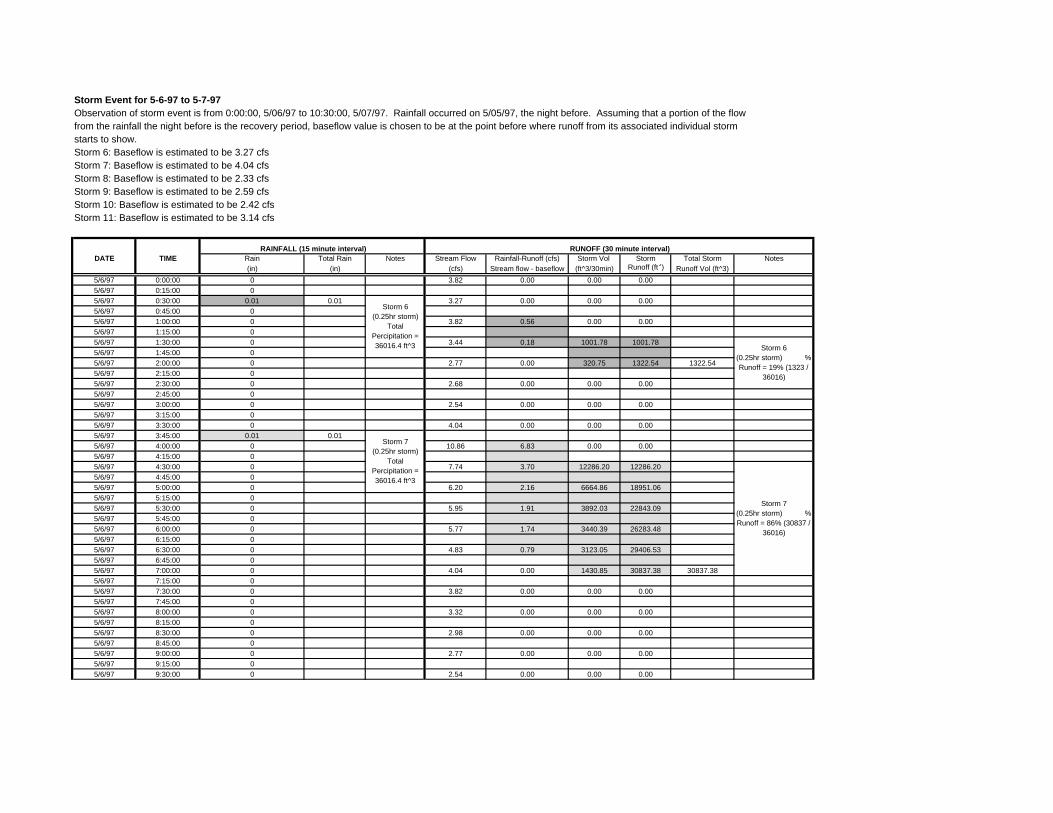
Storm Event for 5-6-97 to 5-7-97Observation of storm event is from 0:00:00, 5/06/97 to 10:30:00, 5/07/97. Rainfall occurred on 5/05/97, the night before. Assuming that a portion of the flowfrom the rainfall the night before is the recovery period, baseflow value is chosen to be at the point before where runoff from its associated individual storm starts to show.Storm 6: Baseflow is estimated to be 3.27 cfsStorm 7: Baseflow is estimated to be 4.04 cfsStorm 8: Baseflow is estimated to be 2.33 cfsStorm 9: Baseflow is estimated to be 2.59 cfsStorm 10: Baseflow is estimated to be 2.42 cfsStorm 11: Baseflow is estimated to be 3.14 cfs
DATE TIME Rain Total Rain Notes Stream Flow Rainfall-Runoff (cfs) Storm Vol Storm Total Storm Notes(in) (in) (cfs) Stream flow - baseflow (ft^3/30min) Runoff (ft 3) Runoff Vol (ft^3)
5/6/97 0:00:00 0 3.82 0.00 0.00 0.005/6/97 0:15:00 05/6/97 0:30:00 0.01 0.01 3.27 0.00 0.00 0.005/6/97 0:45:00 05/6/97 1:00:00 0 3.82 0.56 0.00 0.005/6/97 1:15:00 05/6/97 1:30:00 0 3.44 0.18 1001.78 1001.785/6/97 1:45:00 05/6/97 2:00:00 0 2.77 0.00 320.75 1322.54 1322.545/6/97 2:15:00 05/6/97 2:30:00 0 2.68 0.00 0.00 0.005/6/97 2:45:00 05/6/97 3:00:00 0 2.54 0.00 0.00 0.005/6/97 3:15:00 05/6/97 3:30:00 0 4.04 0.00 0.00 0.005/6/97 3:45:00 0.01 0.015/6/97 4:00:00 0 10.86 6.83 0.00 0.005/6/97 4:15:00 05/6/97 4:30:00 0 7.74 3.70 12286.20 12286.205/6/97 4:45:00 05/6/97 5:00:00 0 6.20 2.16 6664.86 18951.065/6/97 5:15:00 05/6/97 5:30:00 0 5.95 1.91 3892.03 22843.095/6/97 5:45:00 05/6/97 6:00:00 0 5.77 1.74 3440.39 26283.485/6/97 6:15:00 05/6/97 6:30:00 0 4.83 0.79 3123.05 29406.535/6/97 6:45:00 05/6/97 7:00:00 0 4.04 0.00 1430.85 30837.38 30837.385/6/97 7:15:00 05/6/97 7:30:00 0 3.82 0.00 0.00 0.005/6/97 7:45:00 05/6/97 8:00:00 0 3.32 0.00 0.00 0.005/6/97 8:15:00 05/6/97 8:30:00 0 2.98 0.00 0.00 0.005/6/97 8:45:00 05/6/97 9:00:00 0 2.77 0.00 0.00 0.005/6/97 9:15:00 05/6/97 9:30:00 0 2.54 0.00 0.00 0.00
RUNOFF (30 minute interval)RAINFALL (15 minute interval)
Storm 7 (0.25hr storm) % Runoff = 86% (30837 /
36016)
Storm 7 (0.25hr storm)
Total Percipitation = 36016.4 ft^3
Storm 6 (0.25hr storm) % Runoff = 19% (1323 /
36016)
Storm 6 (0.25hr storm)
Total Percipitation = 36016.4 ft^3
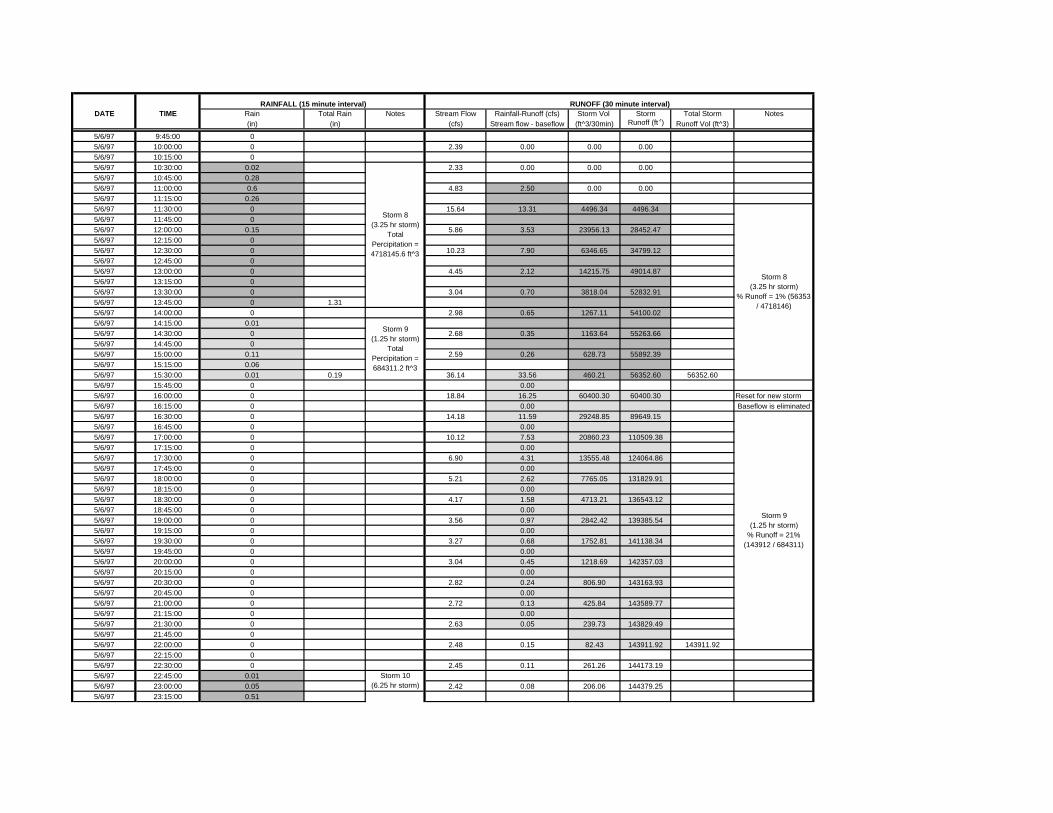
DATE TIME Rain Total Rain Notes Stream Flow Rainfall-Runoff (cfs) Storm Vol Storm Total Storm Notes(in) (in) (cfs) Stream flow - baseflow (ft^3/30min) Runoff (ft 3) Runoff Vol (ft^3)
RUNOFF (30 minute interval)RAINFALL (15 minute interval)
5/6/97 9:45:00 05/6/97 10:00:00 0 2.39 0.00 0.00 0.005/6/97 10:15:00 05/6/97 10:30:00 0.02 2.33 0.00 0.00 0.005/6/97 10:45:00 0.285/6/97 11:00:00 0.6 4.83 2.50 0.00 0.005/6/97 11:15:00 0.265/6/97 11:30:00 0 15.64 13.31 4496.34 4496.345/6/97 11:45:00 05/6/97 12:00:00 0.15 5.86 3.53 23956.13 28452.475/6/97 12:15:00 05/6/97 12:30:00 0 10.23 7.90 6346.65 34799.125/6/97 12:45:00 05/6/97 13:00:00 0 4.45 2.12 14215.75 49014.875/6/97 13:15:00 05/6/97 13:30:00 0 3.04 0.70 3818.04 52832.915/6/97 13:45:00 0 1.315/6/97 14:00:00 0 2.98 0.65 1267.11 54100.025/6/97 14:15:00 0.015/6/97 14:30:00 0 2.68 0.35 1163.64 55263.665/6/97 14:45:00 05/6/97 15:00:00 0.11 2.59 0.26 628.73 55892.395/6/97 15:15:00 0.065/6/97 15:30:00 0.01 0.19 36.14 33.56 460.21 56352.60 56352.605/6/97 15:45:00 0 0.005/6/97 16:00:00 0 18.84 16.25 60400.30 60400.30 Reset for new storm5/6/97 16:15:00 0 0.00 Baseflow is eliminated5/6/97 16:30:00 0 14.18 11.59 29248.85 89649.155/6/97 16:45:00 0 0.005/6/97 17:00:00 0 10.12 7.53 20860.23 110509.385/6/97 17:15:00 0 0.005/6/97 17:30:00 0 6.90 4.31 13555.48 124064.865/6/97 17:45:00 0 0.005/6/97 18:00:00 0 5.21 2.62 7765.05 131829.915/6/97 18:15:00 0 0.005/6/97 18:30:00 0 4.17 1.58 4713.21 136543.125/6/97 18:45:00 0 0.005/6/97 19:00:00 0 3.56 0.97 2842.42 139385.545/6/97 19:15:00 0 0.005/6/97 19:30:00 0 3.27 0.68 1752.81 141138.345/6/97 19:45:00 0 0.005/6/97 20:00:00 0 3.04 0.45 1218.69 142357.035/6/97 20:15:00 0 0.005/6/97 20:30:00 0 2.82 0.24 806.90 143163.935/6/97 20:45:00 0 0.005/6/97 21:00:00 0 2.72 0.13 425.84 143589.775/6/97 21:15:00 0 0.005/6/97 21:30:00 0 2.63 0.05 239.73 143829.495/6/97 21:45:00 05/6/97 22:00:00 0 2.48 0.15 82.43 143911.92 143911.925/6/97 22:15:00 05/6/97 22:30:00 0 2.45 0.11 261.26 144173.195/6/97 22:45:00 0.015/6/97 23:00:00 0.05 2.42 0.08 206.06 144379.255/6/97 23:15:00 0.51
Storm 9 (1.25 hr storm)
% Runoff = 21% (143912 / 684311)
Storm 10 (6.25 hr storm)
Storm 8 (3.25 hr storm)
% Runoff = 1% (56353 / 4718146)
Storm 8 (3.25 hr storm)
Total Percipitation = 4718145.6 ft^3
Storm 9 (1.25 hr storm)
Total Percipitation = 684311.2 ft^3
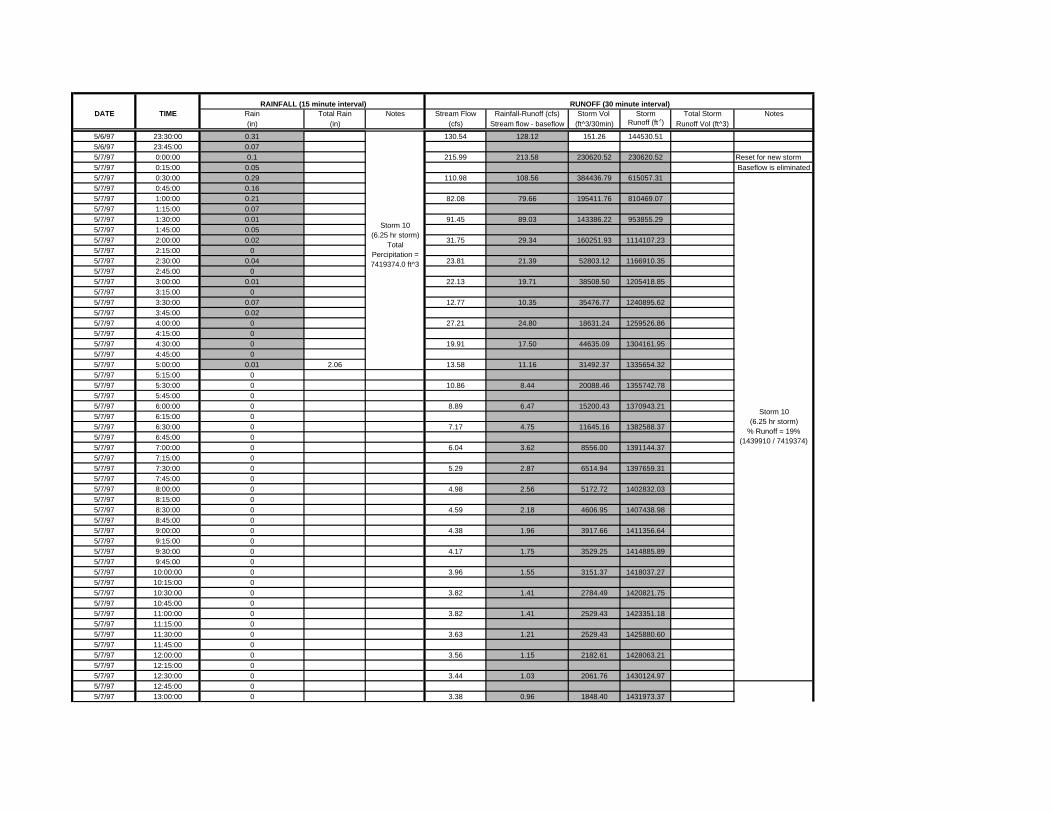
DATE TIME Rain Total Rain Notes Stream Flow Rainfall-Runoff (cfs) Storm Vol Storm Total Storm Notes(in) (in) (cfs) Stream flow - baseflow (ft^3/30min) Runoff (ft 3) Runoff Vol (ft^3)
RUNOFF (30 minute interval)RAINFALL (15 minute interval)
5/6/97 23:30:00 0.31 130.54 128.12 151.26 144530.515/6/97 23:45:00 0.075/7/97 0:00:00 0.1 215.99 213.58 230620.52 230620.52 Reset for new storm5/7/97 0:15:00 0.05 Baseflow is eliminated5/7/97 0:30:00 0.29 110.98 108.56 384436.79 615057.315/7/97 0:45:00 0.165/7/97 1:00:00 0.21 82.08 79.66 195411.76 810469.075/7/97 1:15:00 0.075/7/97 1:30:00 0.01 91.45 89.03 143386.22 953855.295/7/97 1:45:00 0.055/7/97 2:00:00 0.02 31.75 29.34 160251.93 1114107.235/7/97 2:15:00 05/7/97 2:30:00 0.04 23.81 21.39 52803.12 1166910.355/7/97 2:45:00 05/7/97 3:00:00 0.01 22.13 19.71 38508.50 1205418.855/7/97 3:15:00 05/7/97 3:30:00 0.07 12.77 10.35 35476.77 1240895.625/7/97 3:45:00 0.025/7/97 4:00:00 0 27.21 24.80 18631.24 1259526.865/7/97 4:15:00 05/7/97 4:30:00 0 19.91 17.50 44635.09 1304161.955/7/97 4:45:00 05/7/97 5:00:00 0.01 2.06 13.58 11.16 31492.37 1335654.325/7/97 5:15:00 05/7/97 5:30:00 0 10.86 8.44 20088.46 1355742.785/7/97 5:45:00 05/7/97 6:00:00 0 8.89 6.47 15200.43 1370943.215/7/97 6:15:00 05/7/97 6:30:00 0 7.17 4.75 11645.16 1382588.375/7/97 6:45:00 05/7/97 7:00:00 0 6.04 3.62 8556.00 1391144.375/7/97 7:15:00 05/7/97 7:30:00 0 5.29 2.87 6514.94 1397659.315/7/97 7:45:00 05/7/97 8:00:00 0 4.98 2.56 5172.72 1402832.035/7/97 8:15:00 05/7/97 8:30:00 0 4.59 2.18 4606.95 1407438.985/7/97 8:45:00 05/7/97 9:00:00 0 4.38 1.96 3917.66 1411356.645/7/97 9:15:00 05/7/97 9:30:00 0 4.17 1.75 3529.25 1414885.895/7/97 9:45:00 05/7/97 10:00:00 0 3.96 1.55 3151.37 1418037.275/7/97 10:15:00 05/7/97 10:30:00 0 3.82 1.41 2784.49 1420821.755/7/97 10:45:00 05/7/97 11:00:00 0 3.82 1.41 2529.43 1423351.185/7/97 11:15:00 05/7/97 11:30:00 0 3.63 1.21 2529.43 1425880.605/7/97 11:45:00 05/7/97 12:00:00 0 3.56 1.15 2182.61 1428063.215/7/97 12:15:00 05/7/97 12:30:00 0 3.44 1.03 2061.76 1430124.975/7/97 12:45:00 05/7/97 13:00:00 0 3.38 0.96 1848.40 1431973.37
Storm 10 (6.25 hr storm)
Total Percipitation = 7419374.0 ft^3
Storm 10 (6.25 hr storm)
% Runoff = 19% (1439910 / 7419374)

DATE TIME Rain Total Rain Notes Stream Flow Rainfall-Runoff (cfs) Storm Vol Storm Total Storm Notes(in) (in) (cfs) Stream flow - baseflow (ft^3/30min) Runoff (ft 3) Runoff Vol (ft^3)
RUNOFF (30 minute interval)RAINFALL (15 minute interval)
5/7/97 13:15:00 05/7/97 13:30:00 0 3.27 0.85 1732.25 1433705.625/7/97 13:45:00 05/7/97 14:00:00 0 3.27 0.85 1527.64 1435233.265/7/97 14:15:00 0.025/7/97 14:30:00 0.01 3.38 0.96 1527.64 1436760.915/7/97 14:45:00 05/7/97 15:00:00 0 3.20 0.79 1732.25 1438493.155/7/97 15:15:00 05/7/97 15:30:00 0 3.14 0.81 1416.55 1439909.70 1439909.705/7/97 15:45:00 05/7/97 16:00:00 0 3.14 0.81 1458.62 1441368.325/7/97 16:15:00 05/7/97 16:30:00 0 3.14 0.81 1458.62 1442826.945/7/97 16:45:00 05/7/97 17:00:00 0 3.14 0.81 1458.62 1444285.565/7/97 17:15:00 05/7/97 17:30:00 0 3.14 0.81 1458.62 1445744.185/7/97 17:45:00 0.025/7/97 18:00:00 0 3.20 0.87 1458.62 1447202.805/7/97 18:15:00 0 0.025/7/97 18:30:00 0 3.27 0.93 1567.81 1567.81 Reset for new storm5/7/97 18:45:00 0 Baseflow is eliminated5/7/97 19:00:00 0 4.38 2.04 1678.90 3246.715/7/97 19:15:00 05/7/97 19:30:00 0 4.30 1.97 3680.51 6927.215/7/97 19:45:00 05/7/97 20:00:00 0 3.56 1.23 3544.32 10471.535/7/97 20:15:00 05/7/97 20:30:00 0 3.51 1.18 2213.02 12684.555/7/97 20:45:00 05/7/97 21:00:00 0 3.27 0.93 2117.52 14802.085/7/97 21:15:00 05/7/97 21:30:00 0 3.08 0.75 1678.90 16480.98 16480.985/7/97 21:45:00 05/7/97 22:00:00 0 3.04 0.70 1351.41 17832.395/7/97 22:15:00 05/7/97 22:30:00 0 2.98 0.65 1267.11 19099.495/7/97 22:45:00 05/7/97 23:00:00 0 2.98 0.65 1163.64 20263.145/7/97 23:15:00 0.015/7/97 23:30:00 0.07 2.92 0.59 1163.64 21426.785/7/97 23:45:00 0.06
Storm 11 (0.75 hr storm)
% Runoff = 23% (16481 / 72033)
Storm 10 (6.25 hr storm)
% Runoff = 19% (1439910 / 7419374)
Storm 11 (0.75 hr storm)
Total Percipitation = 72032.8 ft^3
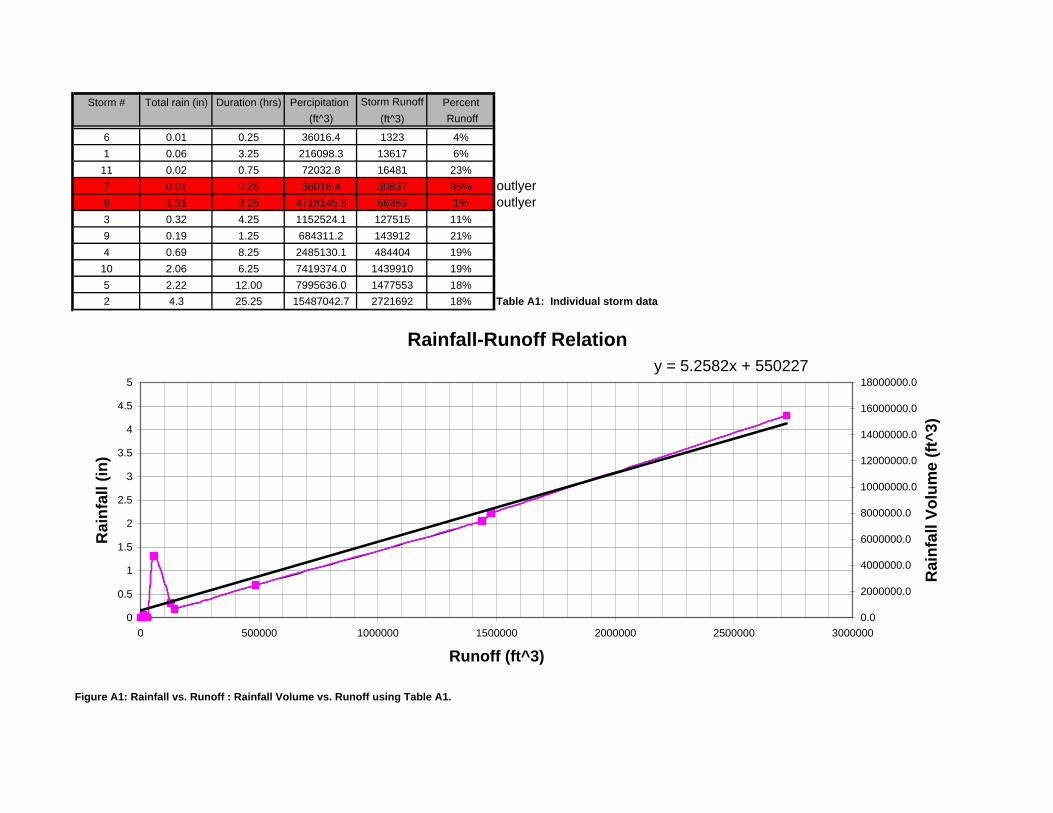
Storm # Total rain (in) Duration (hrs) Percipitation Storm Runoff Percent(ft^3) (ft^3) Runoff
6 0.01 0.25 36016.4 1323 4%1 0.06 3.25 216098.3 13617 6%
11 0.02 0.75 72032.8 16481 23%7 0.01 0.25 36016.4 30837 86% outlyer8 1.31 3.25 4718145.6 56353 1% outlyer3 0.32 4.25 1152524.1 127515 11%9 0.19 1.25 684311.2 143912 21%4 0.69 8.25 2485130.1 484404 19%
10 2.06 6.25 7419374.0 1439910 19%5 2.22 12.00 7995636.0 1477553 18%2 4.3 25.25 15487042.7 2721692 18% Table A1: Individual storm data
Figure A1: Rainfall vs. Runoff : Rainfall Volume vs. Runoff using Table A1.
Rainfall-Runoff Relationy = 5.2582x + 550227
0
0.5
1
1.5
2
2.5
3
3.5
4
4.5
5
0 500000 1000000 1500000 2000000 2500000 3000000
Runoff (ft^3)
Rai
nfal
l (in
)
0.0
2000000.0
4000000.0
6000000.0
8000000.0
10000000.0
12000000.0
14000000.0
16000000.0
18000000.0
Rai
nfal
l Vol
ume
(ft^3
)
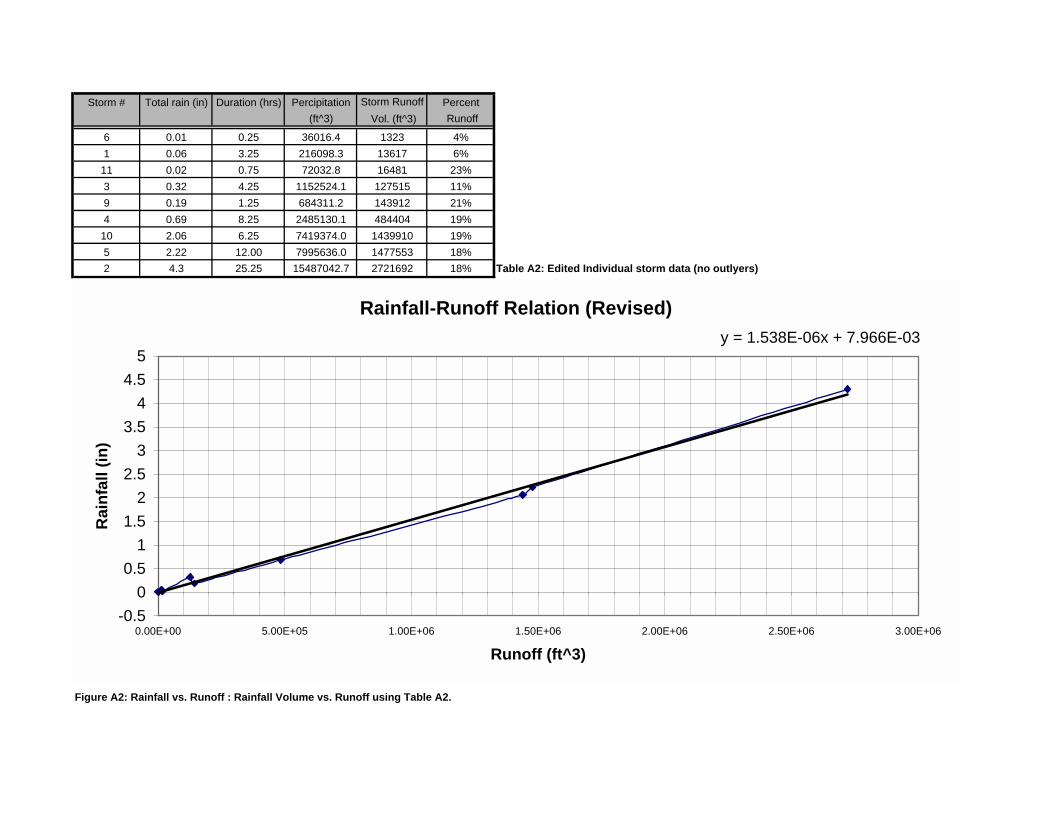
Storm # Total rain (in) Duration (hrs) Percipitation Storm Runoff Percent(ft^3) Vol. (ft^3) Runoff
6 0.01 0.25 36016.4 1323 4%1 0.06 3.25 216098.3 13617 6%
11 0.02 0.75 72032.8 16481 23%3 0.32 4.25 1152524.1 127515 11%9 0.19 1.25 684311.2 143912 21%4 0.69 8.25 2485130.1 484404 19%
10 2.06 6.25 7419374.0 1439910 19%5 2.22 12.00 7995636.0 1477553 18%2 4.3 25.25 15487042.7 2721692 18% Table A2: Edited Individual storm data (no outlyers)
Figure A2: Rainfall vs. Runoff : Rainfall Volume vs. Runoff using Table A2.
Rainfall-Runoff Relation (Revised)y = 1.538E-06x + 7.966E-03
-0.50
0.51
1.52
2.53
3.54
4.55
0.00E+00 5.00E+05 1.00E+06 1.50E+06 2.00E+06 2.50E+06 3.00E+06
Runoff (ft^3)
Rai
nfal
l (in
)
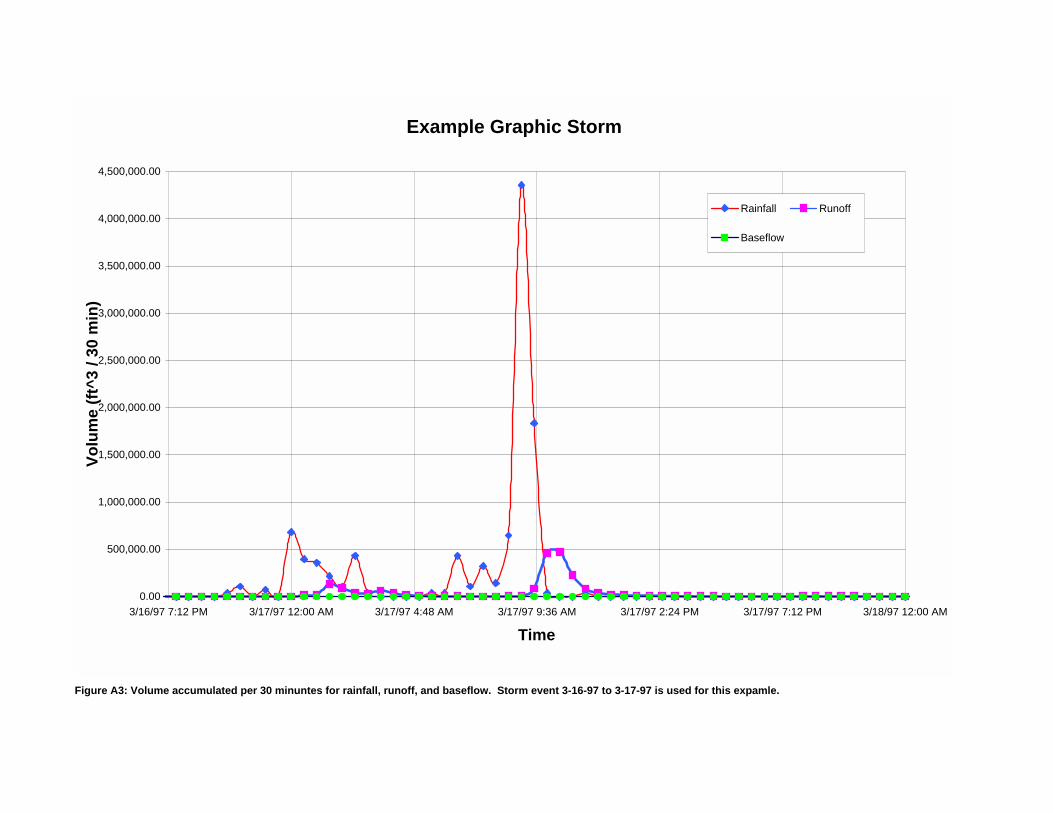
Figure A3: Volume accumulated per 30 minuntes for rainfall, runoff, and baseflow. Storm event 3-16-97 to 3-17-97 is used for this expamle.
Example Graphic Storm
0.00
500,000.00
1,000,000.00
1,500,000.00
2,000,000.00
2,500,000.00
3,000,000.00
3,500,000.00
4,000,000.00
4,500,000.00
3/16/97 7:12 PM 3/17/97 12:00 AM 3/17/97 4:48 AM 3/17/97 9:36 AM 3/17/97 2:24 PM 3/17/97 7:12 PM 3/18/97 12:00 AM
Time
Volu
me
(ft^3
/ 30
min
)
0
1000000
2000000
3000000
4000000
3/16/9712:00 PM
3/17/9712:00 AM
3/17/9712:00 PM
3/18/9712:00 AM
3/18/9712:00 PM
Rainfall Runoff
Baseflow
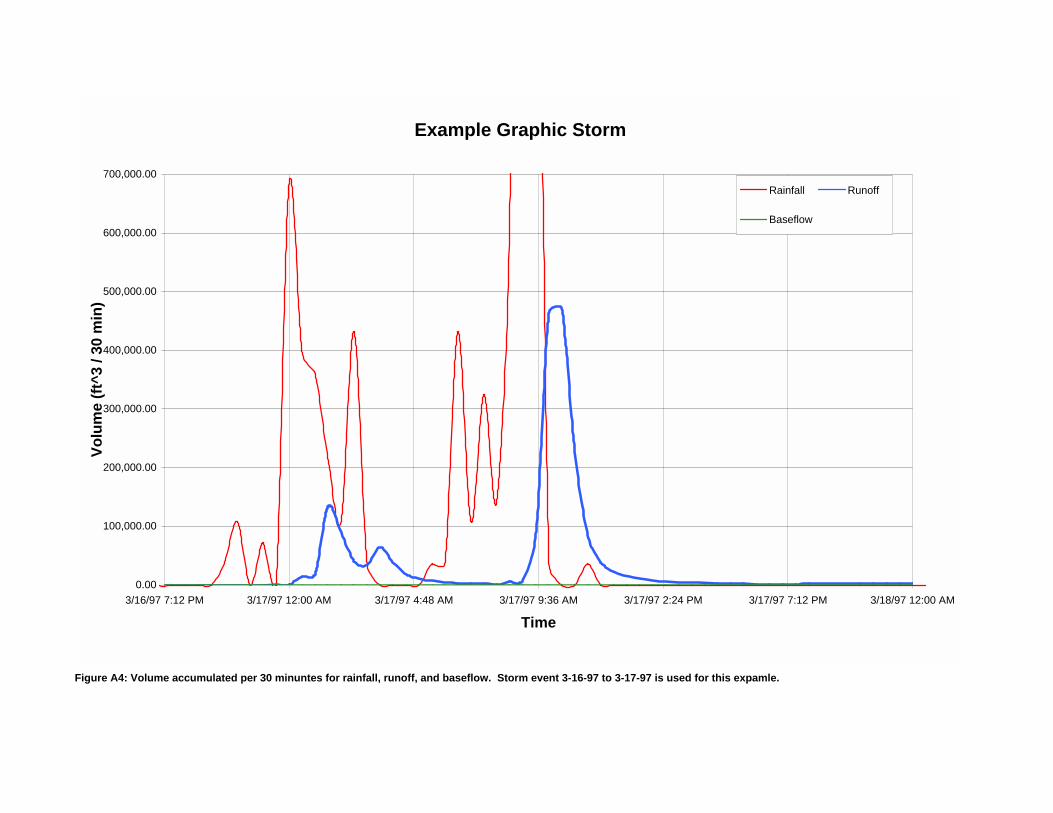
Figure A4: Volume accumulated per 30 minuntes for rainfall, runoff, and baseflow. Storm event 3-16-97 to 3-17-97 is used for this expamle.
Example Graphic Storm
0.00
100,000.00
200,000.00
300,000.00
400,000.00
500,000.00
600,000.00
700,000.00
3/16/97 7:12 PM 3/17/97 12:00 AM 3/17/97 4:48 AM 3/17/97 9:36 AM 3/17/97 2:24 PM 3/17/97 7:12 PM 3/18/97 12:00 AM
Time
Volu
me
(ft^3
/ 30
min
)
01000000200000030000004000000
3/16/9712:00PM
3/17/9712:00AM
3/17/9712:00PM
3/18/9712:00AM
3/18/9712:00PM
Rainfall Runoff
Baseflow
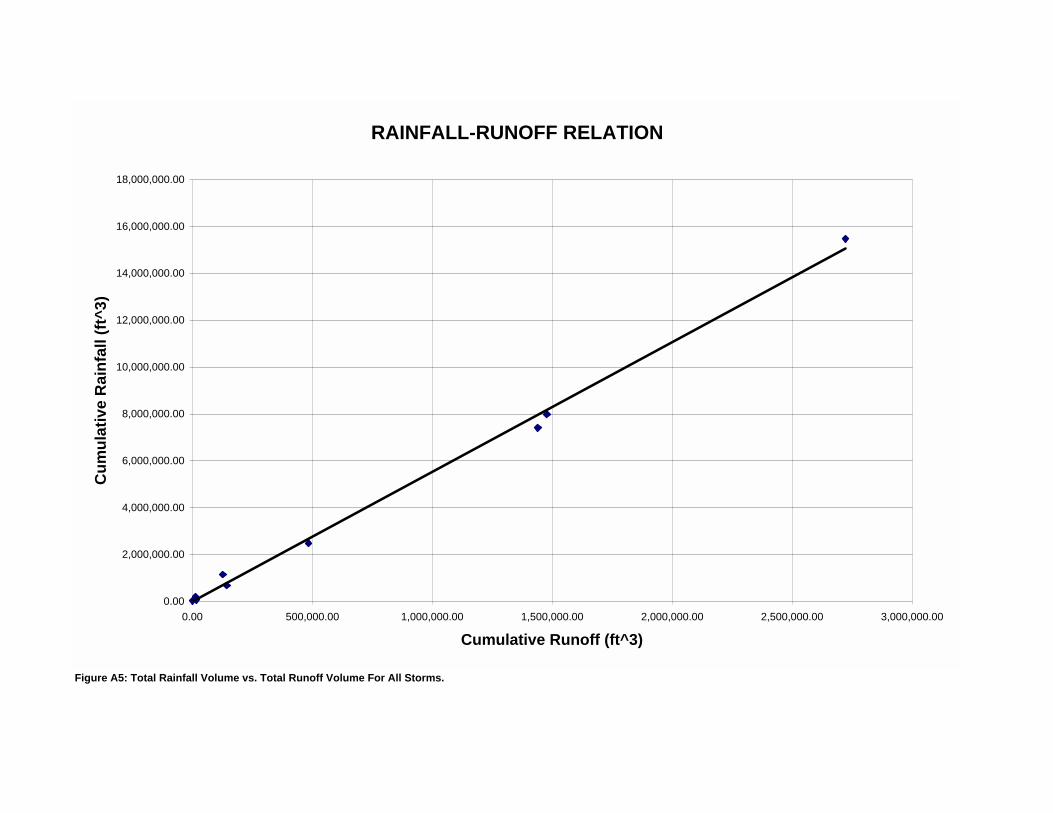
Figure A5: Total Rainfall Volume vs. Total Runoff Volume For All Storms.
RAINFALL-RUNOFF RELATION
0.00
2,000,000.00
4,000,000.00
6,000,000.00
8,000,000.00
10,000,000.00
12,000,000.00
14,000,000.00
16,000,000.00
18,000,000.00
0.00 500,000.00 1,000,000.00 1,500,000.00 2,000,000.00 2,500,000.00 3,000,000.00
Cumulative Runoff (ft^3)
Cum
ulat
ive
Rai
nfal
l (ft^
3)
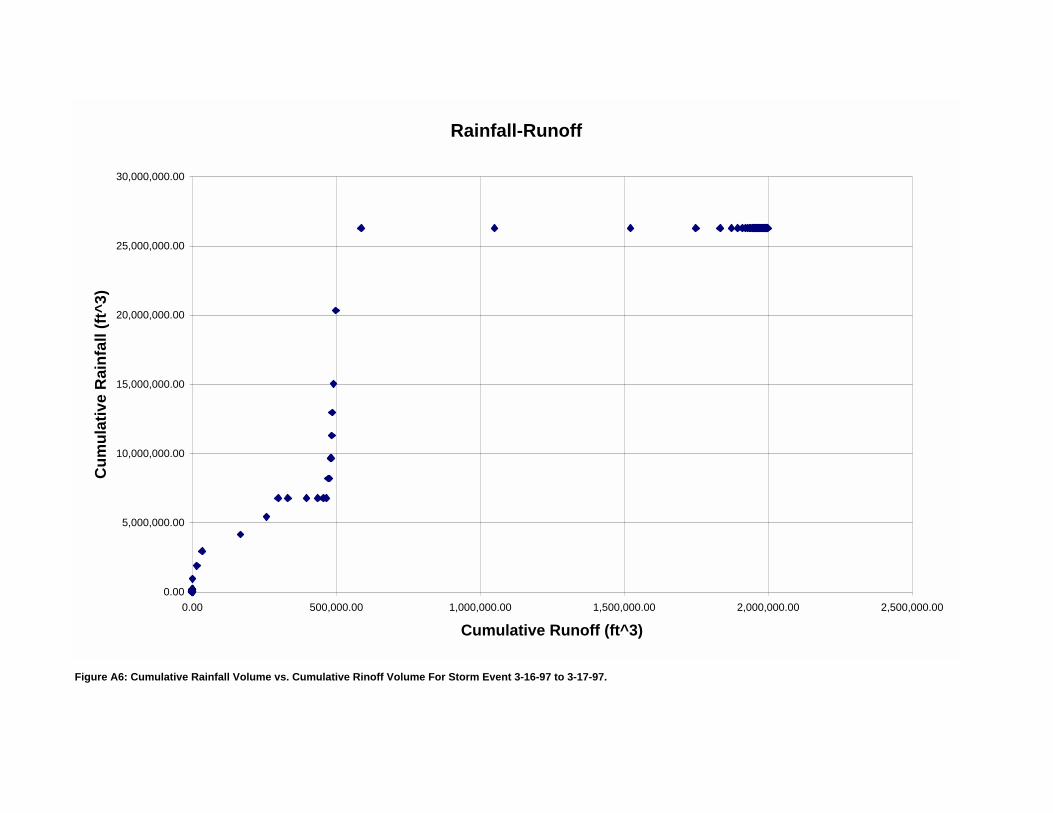
Figure A6: Cumulative Rainfall Volume vs. Cumulative Rinoff Volume For Storm Event 3-16-97 to 3-17-97.
Rainfall-Runoff
0.00
5,000,000.00
10,000,000.00
15,000,000.00
20,000,000.00
25,000,000.00
30,000,000.00
0.00 500,000.00 1,000,000.00 1,500,000.00 2,000,000.00 2,500,000.00
Cumulative Runoff (ft^3)
Cum
ulat
ive
Rai
nfal
l (ft^
3)

74
Appendix B: Water Quality Data
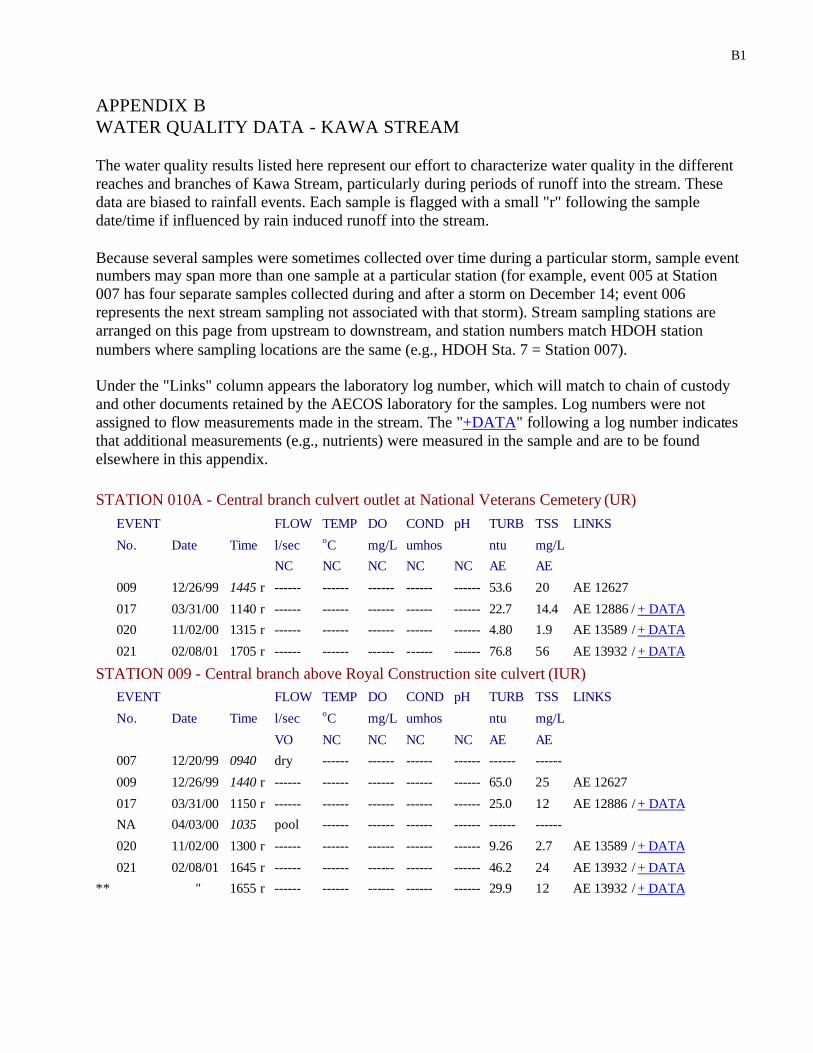
B1
APPENDIX B WATER QUALITY DATA - KAWA STREAM The water quality results listed here represent our effort to characterize water quality in the different reaches and branches of Kawa Stream, particularly during periods of runoff into the stream. These data are biased to rainfall events. Each sample is flagged with a small "r" following the sample date/time if influenced by rain induced runoff into the stream.
Because several samples were sometimes collected over time during a particular storm, sample event numbers may span more than one sample at a particular station (for example, event 005 at Station 007 has four separate samples collected during and after a storm on December 14; event 006 represents the next stream sampling not associated with that storm). Stream sampling stations are arranged on this page from upstream to downstream, and station numbers match HDOH station numbers where sampling locations are the same (e.g., HDOH Sta. 7 = Station 007).
Under the "Links" column appears the laboratory log number, which will match to chain of custody and other documents retained by the AECOS laboratory for the samples. Log numbers were not assigned to flow measurements made in the stream. The "+DATA" following a log number indicates that additional measurements (e.g., nutrients) were measured in the sample and are to be found elsewhere in this appendix. STATION 010A - Central branch culvert outlet at National Veterans Cemetery (UR) EVENT FLOW TEMP DO COND pH TURB TSS LINKS
No. Date Time l/sec oC mg/L umhos ntu mg/L
NC NC NC NC NC AE AE
009 12/26/99 1445 r ------ ------ ------ ------ ------ 53.6 20 AE 12627
017 03/31/00 1140 r ------ ------ ------ ------ ------ 22.7 14.4 AE 12886 / + DATA
020 11/02/00 1315 r ------ ------ ------ ------ ------ 4.80 1.9 AE 13589 / + DATA
021 02/08/01 1705 r ------ ------ ------ ------ ------ 76.8 56 AE 13932 / + DATA
STATION 009 - Central branch above Royal Construction site culvert (IUR) EVENT FLOW TEMP DO COND pH TURB TSS LINKS
No. Date Time l/sec oC mg/L umhos ntu mg/L
VO NC NC NC NC AE AE
007 12/20/99 0940 dry ------ ------ ------ ------ ------ ------
009 12/26/99 1440 r ------ ------ ------ ------ ------ 65.0 25 AE 12627
017 03/31/00 1150 r ------ ------ ------ ------ ------ 25.0 12 AE 12886 / + DATA
NA 04/03/00 1035 pool ------ ------ ------ ------ ------ ------
020 11/02/00 1300 r ------ ------ ------ ------ ------ 9.26 2.7 AE 13589 / + DATA
021 02/08/01 1645 r ------ ------ ------ ------ ------ 46.2 24 AE 13932 / + DATA
** " 1655 r ------ ------ ------ ------ ------ 29.9 12 AE 13932 / + DATA
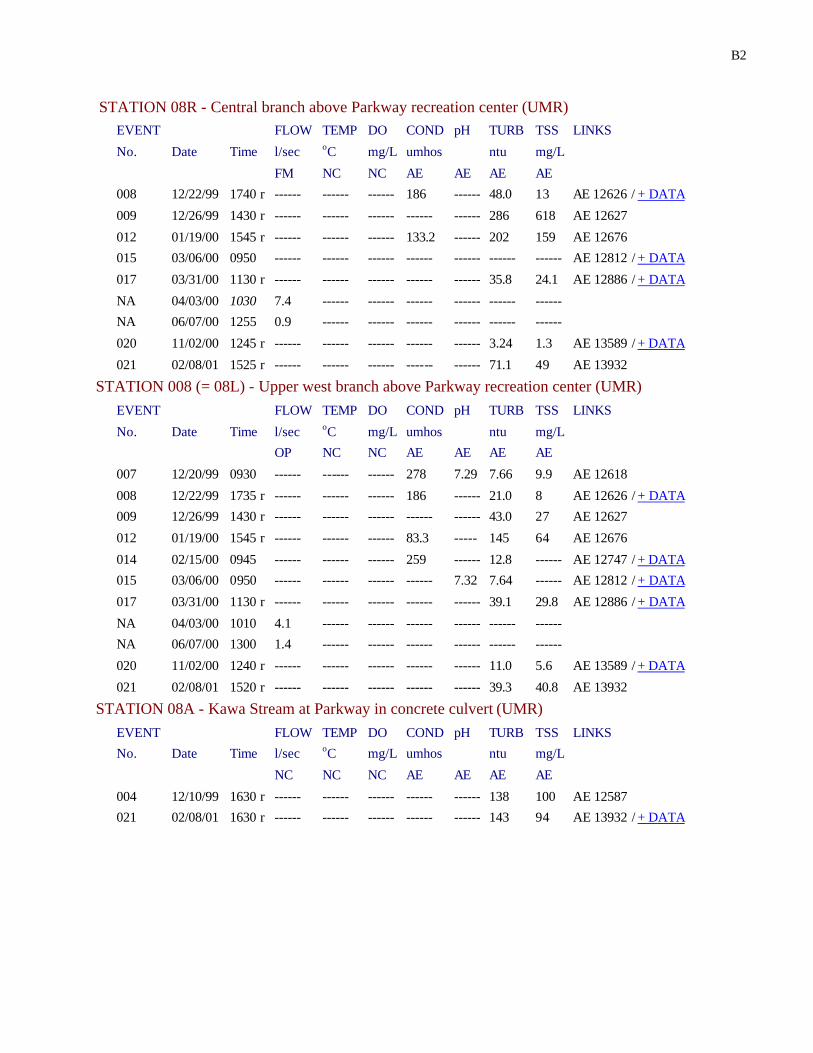
B2
STATION 08R - Central branch above Parkway recreation center (UMR) EVENT FLOW TEMP DO COND pH TURB TSS LINKS
No. Date Time l/sec oC mg/L umhos ntu mg/L
FM NC NC AE AE AE AE
008 12/22/99 1740 r ------ ------ ------ 186 ------ 48.0 13 AE 12626 / + DATA
009 12/26/99 1430 r ------ ------ ------ ------ ------ 286 618 AE 12627
012 01/19/00 1545 r ------ ------ ------ 133.2 ------ 202 159 AE 12676
015 03/06/00 0950 ------ ------ ------ ------ ------ ------ ------ AE 12812 / + DATA
017 03/31/00 1130 r ------ ------ ------ ------ ------ 35.8 24.1 AE 12886 / + DATA
NA 04/03/00 1030 7.4 ------ ------ ------ ------ ------ ------
NA 06/07/00 1255 0.9 ------ ------ ------ ------ ------ ------
020 11/02/00 1245 r ------ ------ ------ ------ ------ 3.24 1.3 AE 13589 / + DATA
021 02/08/01 1525 r ------ ------ ------ ------ ------ 71.1 49 AE 13932
STATION 008 (= 08L) - Upper west branch above Parkway recreation center (UMR) EVENT FLOW TEMP DO COND pH TURB TSS LINKS
No. Date Time l/sec oC mg/L umhos ntu mg/L
OP NC NC AE AE AE AE
007 12/20/99 0930 ------ ------ ------ 278 7.29 7.66 9.9 AE 12618
008 12/22/99 1735 r ------ ------ ------ 186 ------ 21.0 8 AE 12626 / + DATA
009 12/26/99 1430 r ------ ------ ------ ------ ------ 43.0 27 AE 12627
012 01/19/00 1545 r ------ ------ ------ 83.3 ----- 145 64 AE 12676
014 02/15/00 0945 ------ ------ ------ 259 ------ 12.8 ------ AE 12747 / + DATA
015 03/06/00 0950 ------ ------ ------ ------ 7.32 7.64 ------ AE 12812 / + DATA
017 03/31/00 1130 r ------ ------ ------ ------ ------ 39.1 29.8 AE 12886 / + DATA
NA 04/03/00 1010 4.1 ------ ------ ------ ------ ------ ------
NA 06/07/00 1300 1.4 ------ ------ ------ ------ ------ ------
020 11/02/00 1240 r ------ ------ ------ ------ ------ 11.0 5.6 AE 13589 / + DATA
021 02/08/01 1520 r ------ ------ ------ ------ ------ 39.3 40.8 AE 13932
STATION 08A - Kawa Stream at Parkway in concrete culvert (UMR) EVENT FLOW TEMP DO COND pH TURB TSS LINKS
No. Date Time l/sec oC mg/L umhos ntu mg/L
NC NC NC AE AE AE AE
004 12/10/99 1630 r ------ ------ ------ ------ ------ 138 100 AE 12587
021 02/08/01 1630 r ------ ------ ------ ------ ------ 143 94 AE 13932 / + DATA
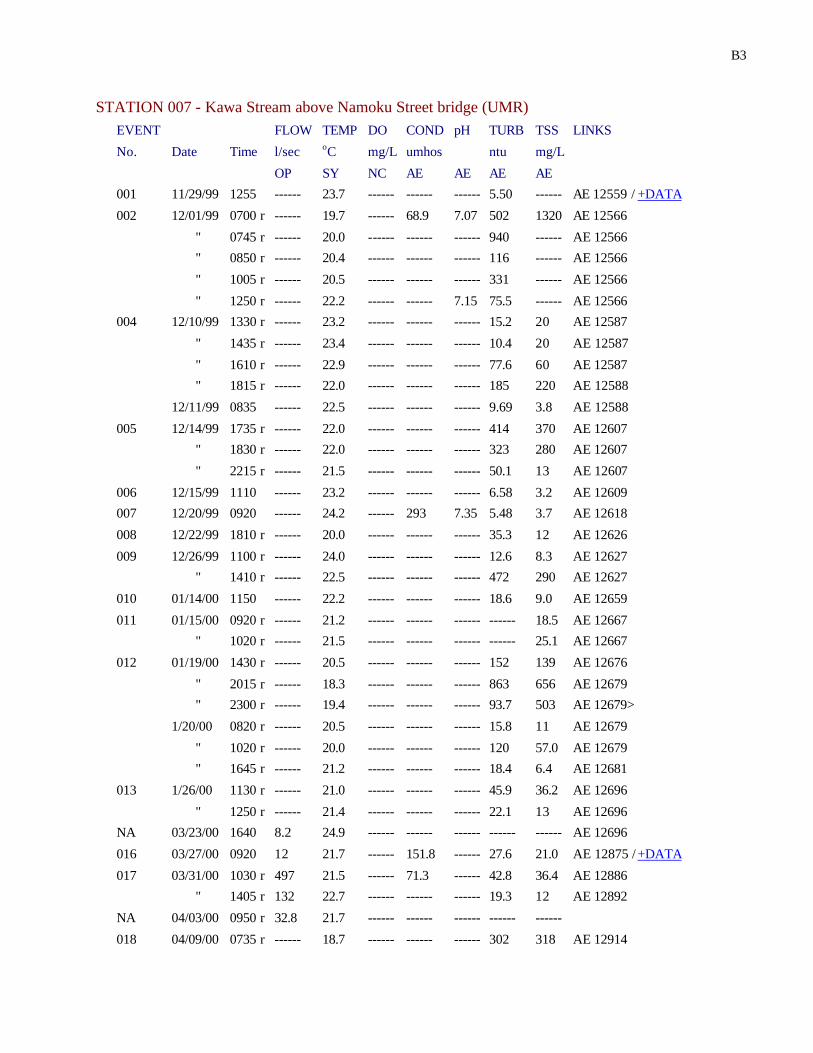
B3
STATION 007 - Kawa Stream above Namoku Street bridge (UMR)
EVENT FLOW TEMP DO COND pH TURB TSS LINKS
No. Date Time l/sec oC mg/L umhos ntu mg/L
OP SY NC AE AE AE AE
001 11/29/99 1255 ------ 23.7 ------ ------ ------ 5.50 ------ AE 12559 / +DATA
002 12/01/99 0700 r ------ 19.7 ------ 68.9 7.07 502 1320 AE 12566
" 0745 r ------ 20.0 ------ ------ ------ 940 ------ AE 12566
" 0850 r ------ 20.4 ------ ------ ------ 116 ------ AE 12566
" 1005 r ------ 20.5 ------ ------ ------ 331 ------ AE 12566
" 1250 r ------ 22.2 ------ ------ 7.15 75.5 ------ AE 12566
004 12/10/99 1330 r ------ 23.2 ------ ------ ------ 15.2 20 AE 12587
" 1435 r ------ 23.4 ------ ------ ------ 10.4 20 AE 12587
" 1610 r ------ 22.9 ------ ------ ------ 77.6 60 AE 12587
" 1815 r ------ 22.0 ------ ------ ------ 185 220 AE 12588
12/11/99 0835 ------ 22.5 ------ ------ ------ 9.69 3.8 AE 12588
005 12/14/99 1735 r ------ 22.0 ------ ------ ------ 414 370 AE 12607
" 1830 r ------ 22.0 ------ ------ ------ 323 280 AE 12607
" 2215 r ------ 21.5 ------ ------ ------ 50.1 13 AE 12607
006 12/15/99 1110 ------ 23.2 ------ ------ ------ 6.58 3.2 AE 12609
007 12/20/99 0920 ------ 24.2 ------ 293 7.35 5.48 3.7 AE 12618
008 12/22/99 1810 r ------ 20.0 ------ ------ ------ 35.3 12 AE 12626
009 12/26/99 1100 r ------ 24.0 ------ ------ ------ 12.6 8.3 AE 12627
" 1410 r ------ 22.5 ------ ------ ------ 472 290 AE 12627
010 01/14/00 1150 ------ 22.2 ------ ------ ------ 18.6 9.0 AE 12659
011 01/15/00 0920 r ------ 21.2 ------ ------ ------ ------ 18.5 AE 12667
" 1020 r ------ 21.5 ------ ------ ------ ------ 25.1 AE 12667
012 01/19/00 1430 r ------ 20.5 ------ ------ ------ 152 139 AE 12676
" 2015 r ------ 18.3 ------ ------ ------ 863 656 AE 12679
" 2300 r ------ 19.4 ------ ------ ------ 93.7 503 AE 12679>
1/20/00 0820 r ------ 20.5 ------ ------ ------ 15.8 11 AE 12679
" 1020 r ------ 20.0 ------ ------ ------ 120 57.0 AE 12679
" 1645 r ------ 21.2 ------ ------ ------ 18.4 6.4 AE 12681
013 1/26/00 1130 r ------ 21.0 ------ ------ ------ 45.9 36.2 AE 12696
" 1250 r ------ 21.4 ------ ------ ------ 22.1 13 AE 12696
NA 03/23/00 1640 8.2 24.9 ------ ------ ------ ------ ------ AE 12696
016 03/27/00 0920 12 21.7 ------ 151.8 ------ 27.6 21.0 AE 12875 / +DATA
017 03/31/00 1030 r 497 21.5 ------ 71.3 ------ 42.8 36.4 AE 12886
" 1405 r 132 22.7 ------ ------ ------ 19.3 12 AE 12892
NA 04/03/00 0950 r 32.8 21.7 ------ ------ ------ ------ ------
018 04/09/00 0735 r ------ 18.7 ------ ------ ------ 302 318 AE 12914
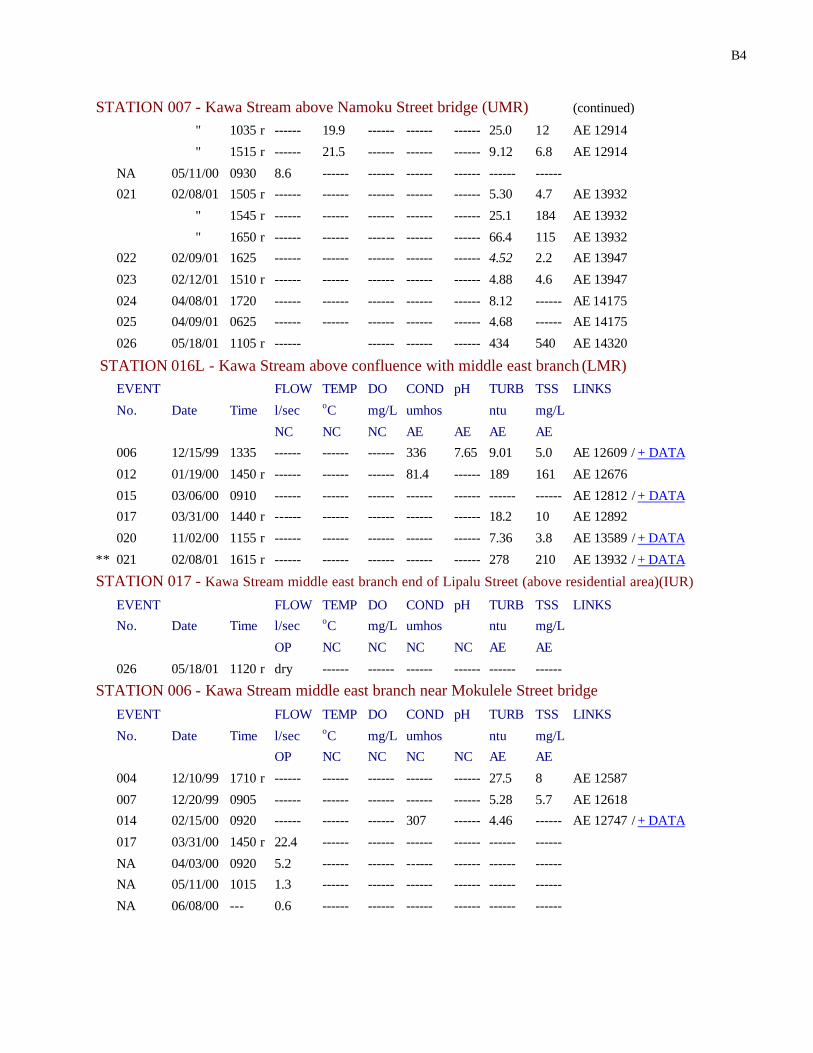
B4
STATION 007 - Kawa Stream above Namoku Street bridge (UMR) (continued)
" 1035 r ------ 19.9 ------ ------ ------ 25.0 12 AE 12914
" 1515 r ------ 21.5 ------ ------ ------ 9.12 6.8 AE 12914
NA 05/11/00 0930 8.6 ------ ------ ------ ------ ------ ------
021 02/08/01 1505 r ------ ------ ------ ------ ------ 5.30 4.7 AE 13932
" 1545 r ------ ------ ------ ------ ------ 25.1 184 AE 13932
" 1650 r ------ ------ ------ ------ ------ 66.4 115 AE 13932
022 02/09/01 1625 ------ ------ ------ ------ ------ 4.52 2.2 AE 13947
023 02/12/01 1510 r ------ ------ ------ ------ ------ 4.88 4.6 AE 13947
024 04/08/01 1720 ------ ------ ------ ------ ------ 8.12 ------ AE 14175
025 04/09/01 0625 ------ ------ ------ ------ ------ 4.68 ------ AE 14175
026 05/18/01 1105 r ------ ------ ------ ------ 434 540 AE 14320
STATION 016L - Kawa Stream above confluence with middle east branch (LMR)
EVENT FLOW TEMP DO COND pH TURB TSS LINKS
No. Date Time l/sec oC mg/L umhos ntu mg/L
NC NC NC AE AE AE AE
006 12/15/99 1335 ------ ------ ------ 336 7.65 9.01 5.0 AE 12609 / + DATA
012 01/19/00 1450 r ------ ------ ------ 81.4 ------ 189 161 AE 12676
015 03/06/00 0910 ------ ------ ------ ------ ------ ------ ------ AE 12812 / + DATA
017 03/31/00 1440 r ------ ------ ------ ------ ------ 18.2 10 AE 12892
020 11/02/00 1155 r ------ ------ ------ ------ ------ 7.36 3.8 AE 13589 / + DATA
** 021 02/08/01 1615 r ------ ------ ------ ------ ------ 278 210 AE 13932 / + DATA
STATION 017 - Kawa Stream middle east branch end of Lipalu Street (above residential area)(IUR)
EVENT FLOW TEMP DO COND pH TURB TSS LINKS
No. Date Time l/sec oC mg/L umhos ntu mg/L
OP NC NC NC NC AE AE
026 05/18/01 1120 r dry ------ ------ ------ ------ ------ ------
STATION 006 - Kawa Stream middle east branch near Mokulele Street bridge
EVENT FLOW TEMP DO COND pH TURB TSS LINKS
No. Date Time l/sec oC mg/L umhos ntu mg/L
OP NC NC NC NC AE AE
004 12/10/99 1710 r ------ ------ ------ ------ ------ 27.5 8 AE 12587
007 12/20/99 0905 ------ ------ ------ ------ ------ 5.28 5.7 AE 12618
014 02/15/00 0920 ------ ------ ------ 307 ------ 4.46 ------ AE 12747 / + DATA
017 03/31/00 1450 r 22.4 ------ ------ ------ ------ ------ ------
NA 04/03/00 0920 5.2 ------ ------ ------ ------ ------ ------
NA 05/11/00 1015 1.3 ------ ------ ------ ------ ------ ------
NA 06/08/00 --- 0.6 ------ ------ ------ ------ ------ ------
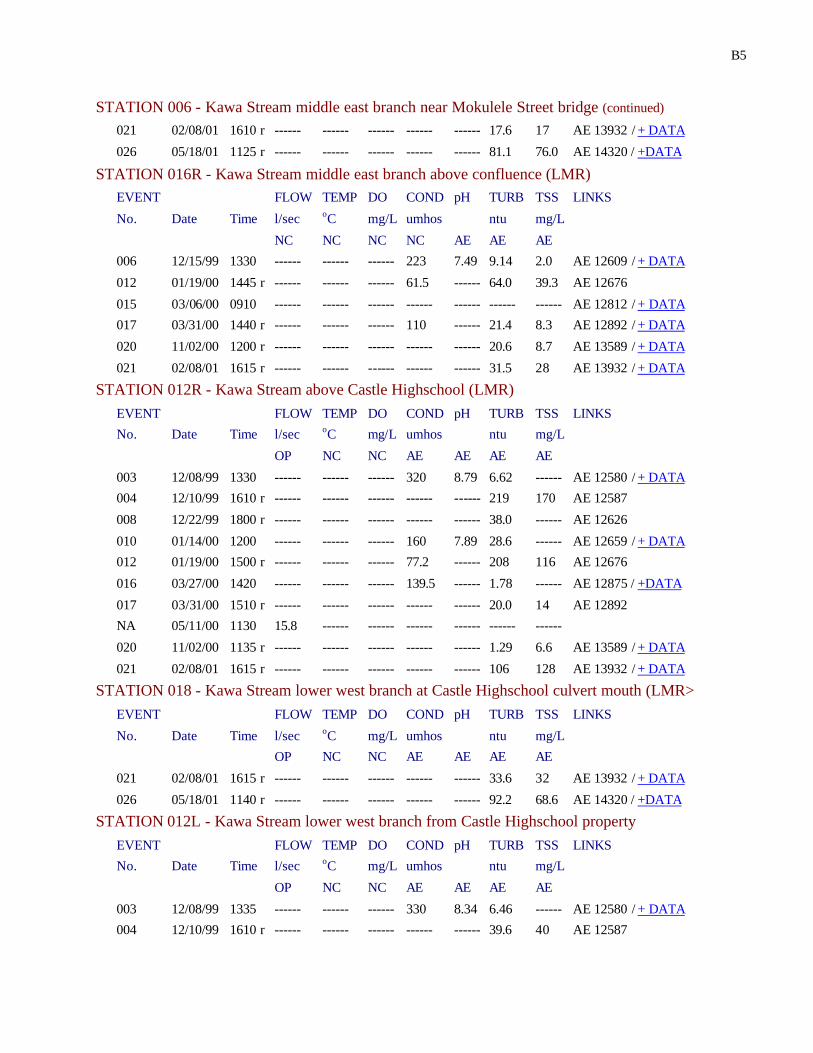
B5
STATION 006 - Kawa Stream middle east branch near Mokulele Street bridge (continued)
021 02/08/01 1610 r ------ ------ ------ ------ ------ 17.6 17 AE 13932 / + DATA
026 05/18/01 1125 r ------ ------ ------ ------ ------ 81.1 76.0 AE 14320 / +DATA
STATION 016R - Kawa Stream middle east branch above confluence (LMR)
EVENT FLOW TEMP DO COND pH TURB TSS LINKS
No. Date Time l/sec oC mg/L umhos ntu mg/L
NC NC NC NC AE AE AE
006 12/15/99 1330 ------ ------ ------ 223 7.49 9.14 2.0 AE 12609 / + DATA
012 01/19/00 1445 r ------ ------ ------ 61.5 ------ 64.0 39.3 AE 12676
015 03/06/00 0910 ------ ------ ------ ------ ------ ------ ------ AE 12812 / + DATA
017 03/31/00 1440 r ------ ------ ------ 110 ------ 21.4 8.3 AE 12892 / + DATA
020 11/02/00 1200 r ------ ------ ------ ------ ------ 20.6 8.7 AE 13589 / + DATA
021 02/08/01 1615 r ------ ------ ------ ------ ------ 31.5 28 AE 13932 / + DATA
STATION 012R - Kawa Stream above Castle Highschool (LMR)
EVENT FLOW TEMP DO COND pH TURB TSS LINKS
No. Date Time l/sec oC mg/L umhos ntu mg/L
OP NC NC AE AE AE AE
003 12/08/99 1330 ------ ------ ------ 320 8.79 6.62 ------ AE 12580 / + DATA
004 12/10/99 1610 r ------ ------ ------ ------ ------ 219 170 AE 12587
008 12/22/99 1800 r ------ ------ ------ ------ ------ 38.0 ------ AE 12626
010 01/14/00 1200 ------ ------ ------ 160 7.89 28.6 ------ AE 12659 / + DATA
012 01/19/00 1500 r ------ ------ ------ 77.2 ------ 208 116 AE 12676
016 03/27/00 1420 ------ ------ ------ 139.5 ------ 1.78 ------ AE 12875 / +DATA
017 03/31/00 1510 r ------ ------ ------ ------ ------ 20.0 14 AE 12892
NA 05/11/00 1130 15.8 ------ ------ ------ ------ ------ ------
020 11/02/00 1135 r ------ ------ ------ ------ ------ 1.29 6.6 AE 13589 / + DATA
021 02/08/01 1615 r ------ ------ ------ ------ ------ 106 128 AE 13932 / + DATA
STATION 018 - Kawa Stream lower west branch at Castle Highschool culvert mouth (LMR>
EVENT FLOW TEMP DO COND pH TURB TSS LINKS
No. Date Time l/sec oC mg/L umhos ntu mg/L
OP NC NC AE AE AE AE
021 02/08/01 1615 r ------ ------ ------ ------ ------ 33.6 32 AE 13932 / + DATA
026 05/18/01 1140 r ------ ------ ------ ------ ------ 92.2 68.6 AE 14320 / +DATA
STATION 012L - Kawa Stream lower west branch from Castle Highschool property
EVENT FLOW TEMP DO COND pH TURB TSS LINKS
No. Date Time l/sec oC mg/L umhos ntu mg/L
OP NC NC AE AE AE AE
003 12/08/99 1335 ------ ------ ------ 330 8.34 6.46 ------ AE 12580 / + DATA
004 12/10/99 1610 r ------ ------ ------ ------ ------ 39.6 40 AE 12587
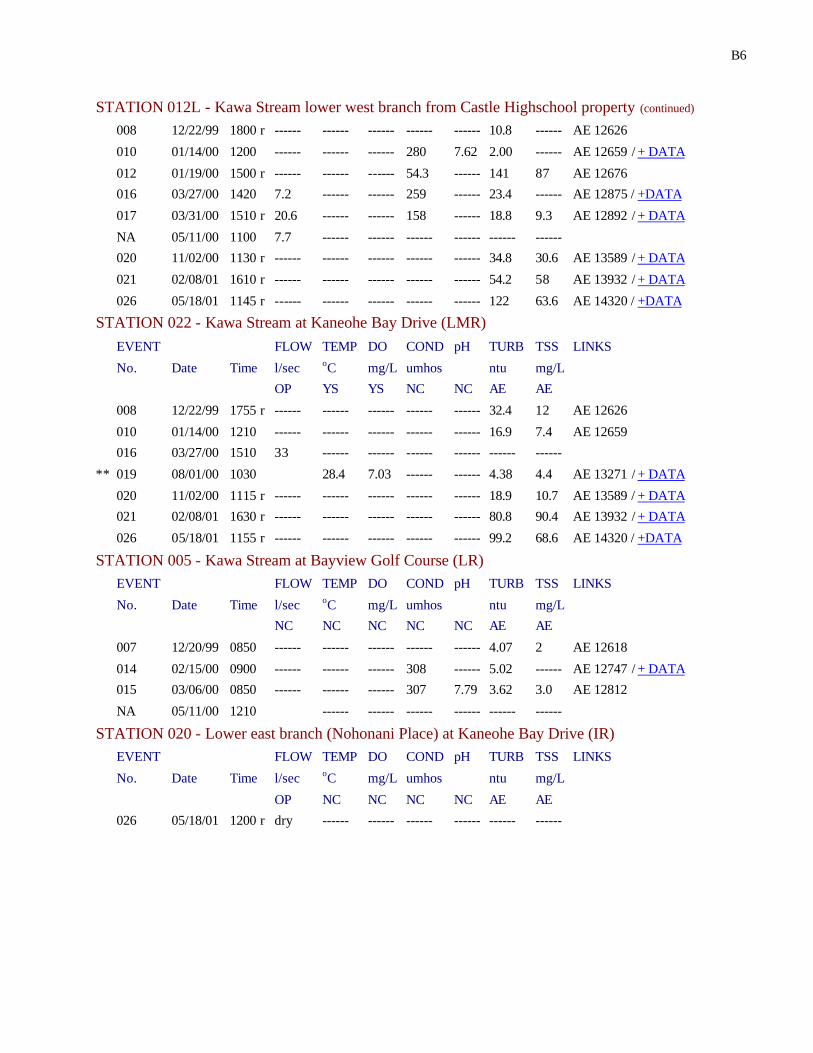
B6
STATION 012L - Kawa Stream lower west branch from Castle Highschool property (continued)
008 12/22/99 1800 r ------ ------ ------ ------ ------ 10.8 ------ AE 12626
010 01/14/00 1200 ------ ------ ------ 280 7.62 2.00 ------ AE 12659 / + DATA
012 01/19/00 1500 r ------ ------ ------ 54.3 ------ 141 87 AE 12676
016 03/27/00 1420 7.2 ------ ------ 259 ------ 23.4 ------ AE 12875 / +DATA
017 03/31/00 1510 r 20.6 ------ ------ 158 ------ 18.8 9.3 AE 12892 / + DATA
NA 05/11/00 1100 7.7 ------ ------ ------ ------ ------ ------
020 11/02/00 1130 r ------ ------ ------ ------ ------ 34.8 30.6 AE 13589 / + DATA
021 02/08/01 1610 r ------ ------ ------ ------ ------ 54.2 58 AE 13932 / + DATA
026 05/18/01 1145 r ------ ------ ------ ------ ------ 122 63.6 AE 14320 / +DATA
STATION 022 - Kawa Stream at Kaneohe Bay Drive (LMR)
EVENT FLOW TEMP DO COND pH TURB TSS LINKS
No. Date Time l/sec oC mg/L umhos ntu mg/L
OP YS YS NC NC AE AE
008 12/22/99 1755 r ------ ------ ------ ------ ------ 32.4 12 AE 12626
010 01/14/00 1210 ------ ------ ------ ------ ------ 16.9 7.4 AE 12659
016 03/27/00 1510 33 ------ ------ ------ ------ ------ ------
** 019 08/01/00 1030 28.4 7.03 ------ ------ 4.38 4.4 AE 13271 / + DATA
020 11/02/00 1115 r ------ ------ ------ ------ ------ 18.9 10.7 AE 13589 / + DATA
021 02/08/01 1630 r ------ ------ ------ ------ ------ 80.8 90.4 AE 13932 / + DATA
026 05/18/01 1155 r ------ ------ ------ ------ ------ 99.2 68.6 AE 14320 / +DATA
STATION 005 - Kawa Stream at Bayview Golf Course (LR)
EVENT FLOW TEMP DO COND pH TURB TSS LINKS
No. Date Time l/sec oC mg/L umhos ntu mg/L
NC NC NC NC NC AE AE
007 12/20/99 0850 ------ ------ ------ ------ ------ 4.07 2 AE 12618
014 02/15/00 0900 ------ ------ ------ 308 ------ 5.02 ------ AE 12747 / + DATA
015 03/06/00 0850 ------ ------ ------ 307 7.79 3.62 3.0 AE 12812
NA 05/11/00 1210 ------ ------ ------ ------ ------ ------
STATION 020 - Lower east branch (Nohonani Place) at Kaneohe Bay Drive (IR)
EVENT FLOW TEMP DO COND pH TURB TSS LINKS
No. Date Time l/sec oC mg/L umhos ntu mg/L
OP NC NC NC NC AE AE
026 05/18/01 1200 r dry ------ ------ ------ ------ ------ ------
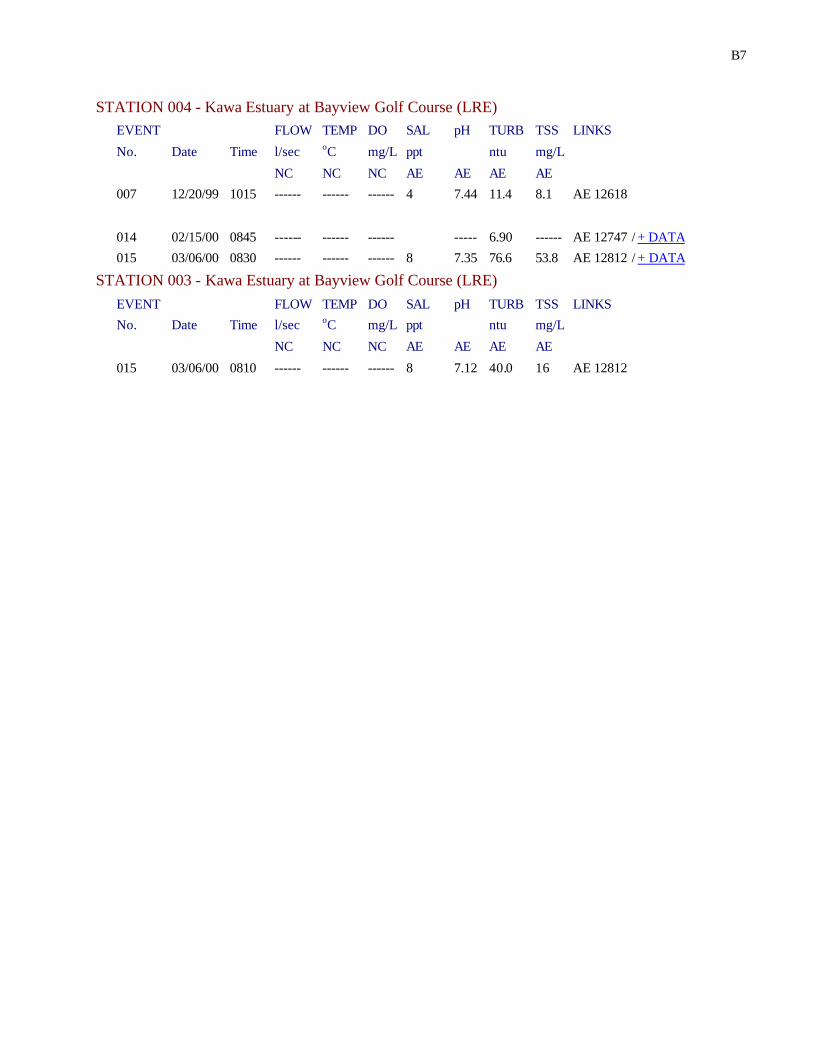
B7
STATION 004 - Kawa Estuary at Bayview Golf Course (LRE)
EVENT FLOW TEMP DO SAL pH TURB TSS LINKS
No. Date Time l/sec oC mg/L ppt ntu mg/L
NC NC NC AE AE AE AE
007 12/20/99 1015 ------ ------ ------ 4 7.44 11.4 8.1 AE 12618
014 02/15/00 0845 ------ ------ ------ ----- 6.90 ------ AE 12747 / + DATA
015 03/06/00 0830 ------ ------ ------ 8 7.35 76.6 53.8 AE 12812 / + DATA
STATION 003 - Kawa Estuary at Bayview Golf Course (LRE)
EVENT FLOW TEMP DO SAL pH TURB TSS LINKS
No. Date Time l/sec oC mg/L ppt ntu mg/L
NC NC NC AE AE AE AE
015 03/06/00 0810 ------ ------ ------ 8 7.12 40.0 16 AE 12812
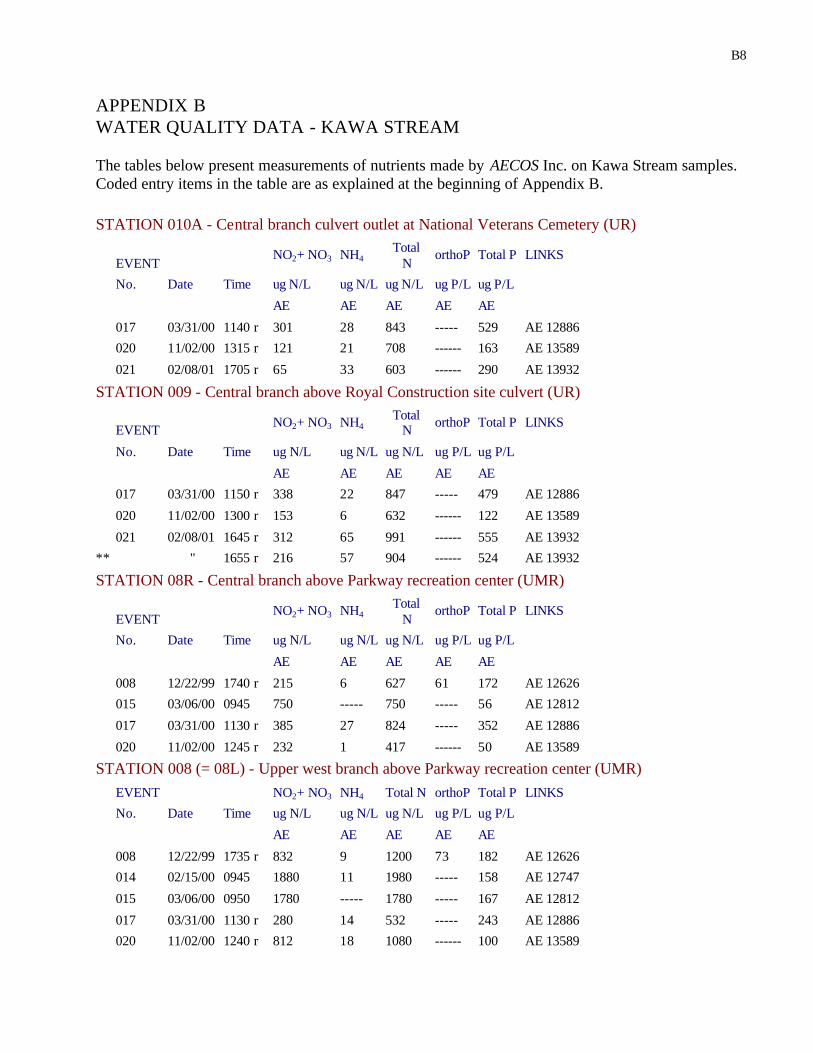
B8
APPENDIX B WATER QUALITY DATA - KAWA STREAM The tables below present measurements of nutrients made by AECOS Inc. on Kawa Stream samples. Coded entry items in the table are as explained at the beginning of Appendix B. STATION 010A - Central branch culvert outlet at National Veterans Cemetery (UR)
EVENT
NO2+ NO3 NH4 Total N
orthoP Total P LINKS
No. Date Time ug N/L ug N/L ug N/L ug P/L ug P/L
AE AE AE AE AE
017 03/31/00 1140 r 301 28 843 ----- 529 AE 12886
020 11/02/00 1315 r 121 21 708 ------ 163 AE 13589
021 02/08/01 1705 r 65 33 603 ------ 290 AE 13932
STATION 009 - Central branch above Royal Construction site culvert (UR)
EVENT NO2+ NO3 NH4 Total
N orthoP Total P LINKS
No. Date Time ug N/L ug N/L ug N/L ug P/L ug P/L
AE AE AE AE AE
017 03/31/00 1150 r 338 22 847 ----- 479 AE 12886
020 11/02/00 1300 r 153 6 632 ------ 122 AE 13589
021 02/08/01 1645 r 312 65 991 ------ 555 AE 13932
** " 1655 r 216 57 904 ------ 524 AE 13932
STATION 08R - Central branch above Parkway recreation center (UMR)
EVENT
NO2+ NO3 NH4 Total N
orthoP Total P LINKS
No. Date Time ug N/L ug N/L ug N/L ug P/L ug P/L
AE AE AE AE AE
008 12/22/99 1740 r 215 6 627 61 172 AE 12626
015 03/06/00 0945 750 ----- 750 ----- 56 AE 12812
017 03/31/00 1130 r 385 27 824 ----- 352 AE 12886
020 11/02/00 1245 r 232 1 417 ------ 50 AE 13589
STATION 008 (= 08L) - Upper west branch above Parkway recreation center (UMR)
EVENT NO2+ NO3 NH4 Total N orthoP Total P LINKS
No. Date Time ug N/L ug N/L ug N/L ug P/L ug P/L
AE AE AE AE AE
008 12/22/99 1735 r 832 9 1200 73 182 AE 12626
014 02/15/00 0945 1880 11 1980 ----- 158 AE 12747
015 03/06/00 0950 1780 ----- 1780 ----- 167 AE 12812
017 03/31/00 1130 r 280 14 532 ----- 243 AE 12886
020 11/02/00 1240 r 812 18 1080 ------ 100 AE 13589
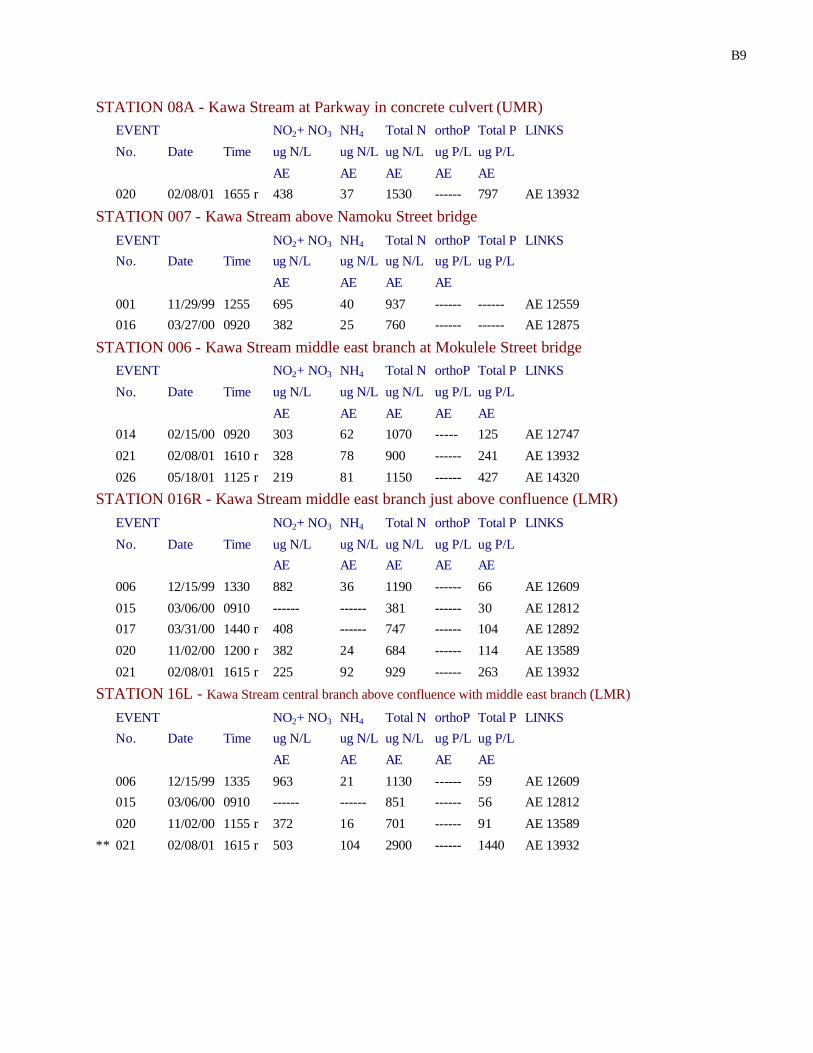
B9
STATION 08A - Kawa Stream at Parkway in concrete culvert (UMR) EVENT NO2+ NO3 NH4 Total N orthoP Total P LINKS
No. Date Time ug N/L ug N/L ug N/L ug P/L ug P/L
AE AE AE AE AE
020 02/08/01 1655 r 438 37 1530 ------ 797 AE 13932
STATION 007 - Kawa Stream above Namoku Street bridge
EVENT NO2+ NO3 NH4 Total N orthoP Total P LINKS
No. Date Time ug N/L ug N/L ug N/L ug P/L ug P/L
AE AE AE AE
001 11/29/99 1255 695 40 937 ------ ------ AE 12559
016 03/27/00 0920 382 25 760 ------ ------ AE 12875
STATION 006 - Kawa Stream middle east branch at Mokulele Street bridge
EVENT NO2+ NO3 NH4 Total N orthoP Total P LINKS
No. Date Time ug N/L ug N/L ug N/L ug P/L ug P/L
AE AE AE AE AE
014 02/15/00 0920 303 62 1070 ----- 125 AE 12747
021 02/08/01 1610 r 328 78 900 ------ 241 AE 13932
026 05/18/01 1125 r 219 81 1150 ------ 427 AE 14320
STATION 016R - Kawa Stream middle east branch just above confluence (LMR)
EVENT NO2+ NO3 NH4 Total N orthoP Total P LINKS
No. Date Time ug N/L ug N/L ug N/L ug P/L ug P/L
AE AE AE AE AE
006 12/15/99 1330 882 36 1190 ------ 66 AE 12609
015 03/06/00 0910 ------ ------ 381 ------ 30 AE 12812
017 03/31/00 1440 r 408 ------ 747 ------ 104 AE 12892
020 11/02/00 1200 r 382 24 684 ------ 114 AE 13589
021 02/08/01 1615 r 225 92 929 ------ 263 AE 13932
STATION 16L - Kawa Stream central branch above confluence with middle east branch (LMR)
EVENT NO2+ NO3 NH4 Total N orthoP Total P LINKS
No. Date Time ug N/L ug N/L ug N/L ug P/L ug P/L
AE AE AE AE AE
006 12/15/99 1335 963 21 1130 ------ 59 AE 12609
015 03/06/00 0910 ------ ------ 851 ------ 56 AE 12812
020 11/02/00 1155 r 372 16 701 ------ 91 AE 13589
** 021 02/08/01 1615 r 503 104 2900 ------ 1440 AE 13932
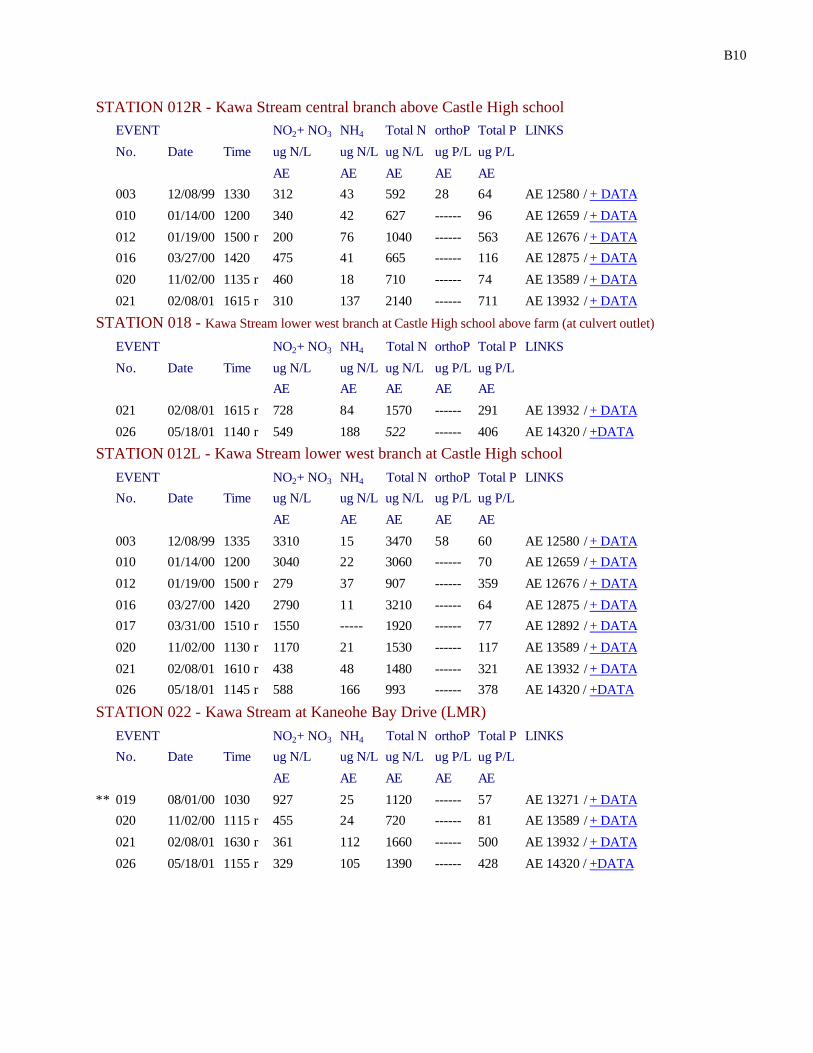
B10
STATION 012R - Kawa Stream central branch above Castle High school
EVENT NO2+ NO3 NH4 Total N orthoP Total P LINKS
No. Date Time ug N/L ug N/L ug N/L ug P/L ug P/L
AE AE AE AE AE
003 12/08/99 1330 312 43 592 28 64 AE 12580 / + DATA
010 01/14/00 1200 340 42 627 ------ 96 AE 12659 / + DATA
012 01/19/00 1500 r 200 76 1040 ------ 563 AE 12676 / + DATA
016 03/27/00 1420 475 41 665 ------ 116 AE 12875 / + DATA
020 11/02/00 1135 r 460 18 710 ------ 74 AE 13589 / + DATA
021 02/08/01 1615 r 310 137 2140 ------ 711 AE 13932 / + DATA
STATION 018 - Kawa Stream lower west branch at Castle High school above farm (at culvert outlet)
EVENT NO2+ NO3 NH4 Total N orthoP Total P LINKS
No. Date Time ug N/L ug N/L ug N/L ug P/L ug P/L
AE AE AE AE AE
021 02/08/01 1615 r 728 84 1570 ------ 291 AE 13932 / + DATA
026 05/18/01 1140 r 549 188 522 ------ 406 AE 14320 / +DATA
STATION 012L - Kawa Stream lower west branch at Castle High school
EVENT NO2+ NO3 NH4 Total N orthoP Total P LINKS
No. Date Time ug N/L ug N/L ug N/L ug P/L ug P/L
AE AE AE AE AE
003 12/08/99 1335 3310 15 3470 58 60 AE 12580 / + DATA
010 01/14/00 1200 3040 22 3060 ------ 70 AE 12659 / + DATA
012 01/19/00 1500 r 279 37 907 ------ 359 AE 12676 / + DATA
016 03/27/00 1420 2790 11 3210 ------ 64 AE 12875 / + DATA
017 03/31/00 1510 r 1550 ----- 1920 ------ 77 AE 12892 / + DATA
020 11/02/00 1130 r 1170 21 1530 ------ 117 AE 13589 / + DATA
021 02/08/01 1610 r 438 48 1480 ------ 321 AE 13932 / + DATA
026 05/18/01 1145 r 588 166 993 ------ 378 AE 14320 / +DATA
STATION 022 - Kawa Stream at Kaneohe Bay Drive (LMR)
EVENT NO2+ NO3 NH4 Total N orthoP Total P LINKS
No. Date Time ug N/L ug N/L ug N/L ug P/L ug P/L
AE AE AE AE AE
** 019 08/01/00 1030 927 25 1120 ------ 57 AE 13271 / + DATA
020 11/02/00 1115 r 455 24 720 ------ 81 AE 13589 / + DATA
021 02/08/01 1630 r 361 112 1660 ------ 500 AE 13932 / + DATA
026 05/18/01 1155 r 329 105 1390 ------ 428 AE 14320 / +DATA
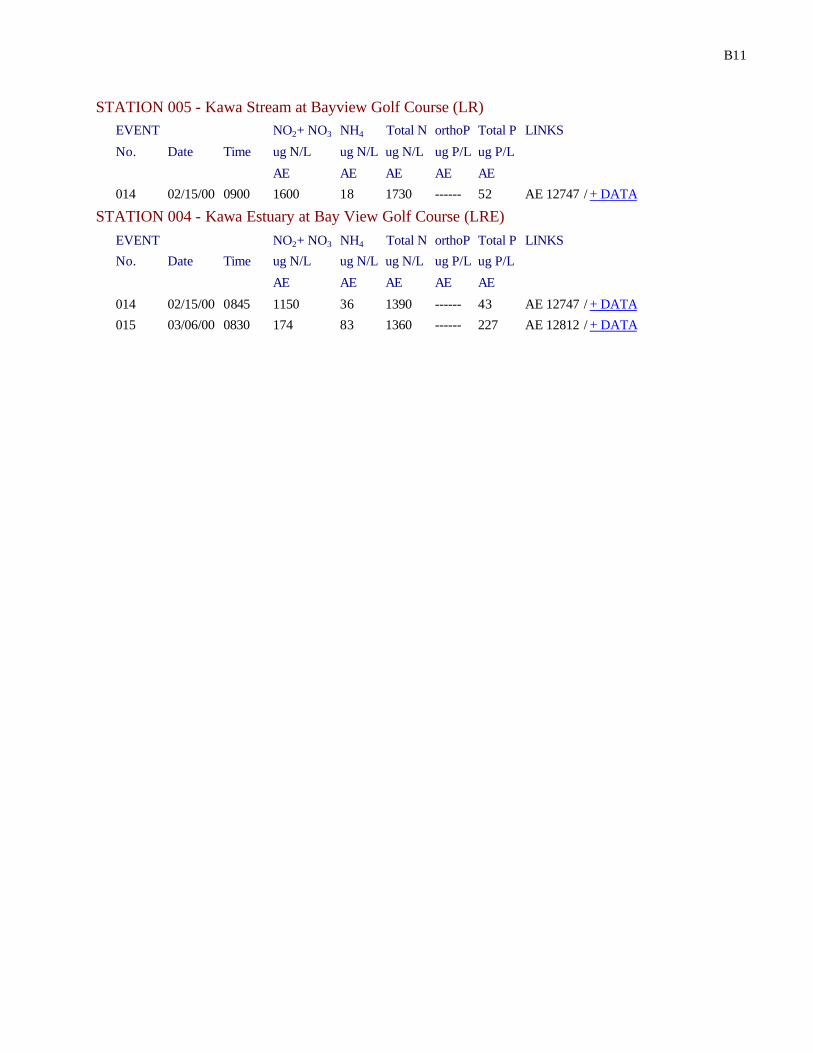
B11
STATION 005 - Kawa Stream at Bayview Golf Course (LR)
EVENT NO2+ NO3 NH4 Total N orthoP Total P LINKS
No. Date Time ug N/L ug N/L ug N/L ug P/L ug P/L
AE AE AE AE AE
014 02/15/00 0900 1600 18 1730 ------ 52 AE 12747 / + DATA
STATION 004 - Kawa Estuary at Bay View Golf Course (LRE)
EVENT NO2+ NO3 NH4 Total N orthoP Total P LINKS
No. Date Time ug N/L ug N/L ug N/L ug P/L ug P/L
AE AE AE AE AE
014 02/15/00 0845 1150 36 1390 ------ 43 AE 12747 / + DATA
015 03/06/00 0830 174 83 1360 ------ 227 AE 12812 / + DATA
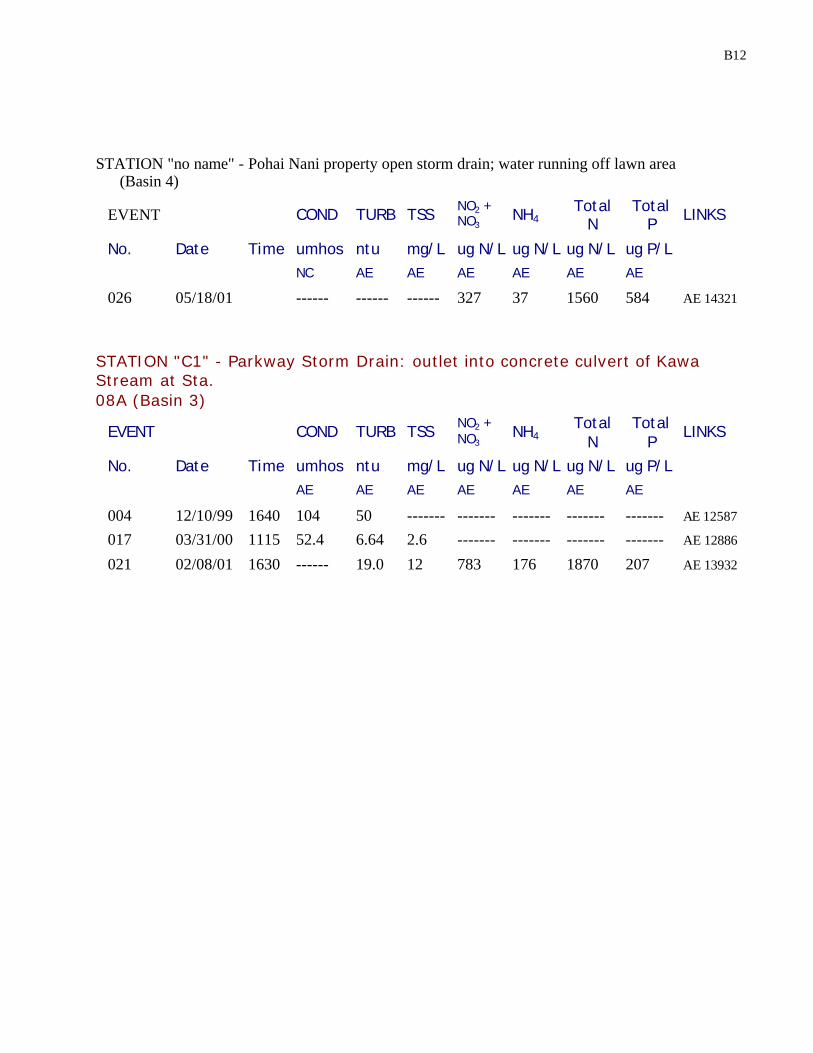
B12
STATION "no name" - Pohai Nani property open storm drain; water running off lawn area (Basin 4)
EVENT COND TURB TSS NO2 + NO3 NH4
Total N
Total P LINKS
No. Date Time umhos ntu mg/L ug N/L ug N/L ug N/L ug P/L
NC AE AE AE AE AE AE
026 05/18/01 ------ ------ ------ 327 37 1560 584 AE 14321
STATION "C1" - Parkway Storm Drain: outlet into concrete culvert of Kawa Stream at Sta. 08A (Basin 3)
EVENT COND TURB TSS NO2 + NO3 NH4
Total N
Total P
LINKS
No. Date Time umhos ntu mg/L ug N/L ug N/L ug N/L ug P/L
AE AE AE AE AE AE AE
004 12/10/99 1640 104 50 ------- ------- ------- ------- ------- AE 12587 017 03/31/00 1115 52.4 6.64 2.6 ------- ------- ------- ------- AE 12886
021 02/08/01 1630 ------ 19.0 12 783 176 1870 207 AE 13932
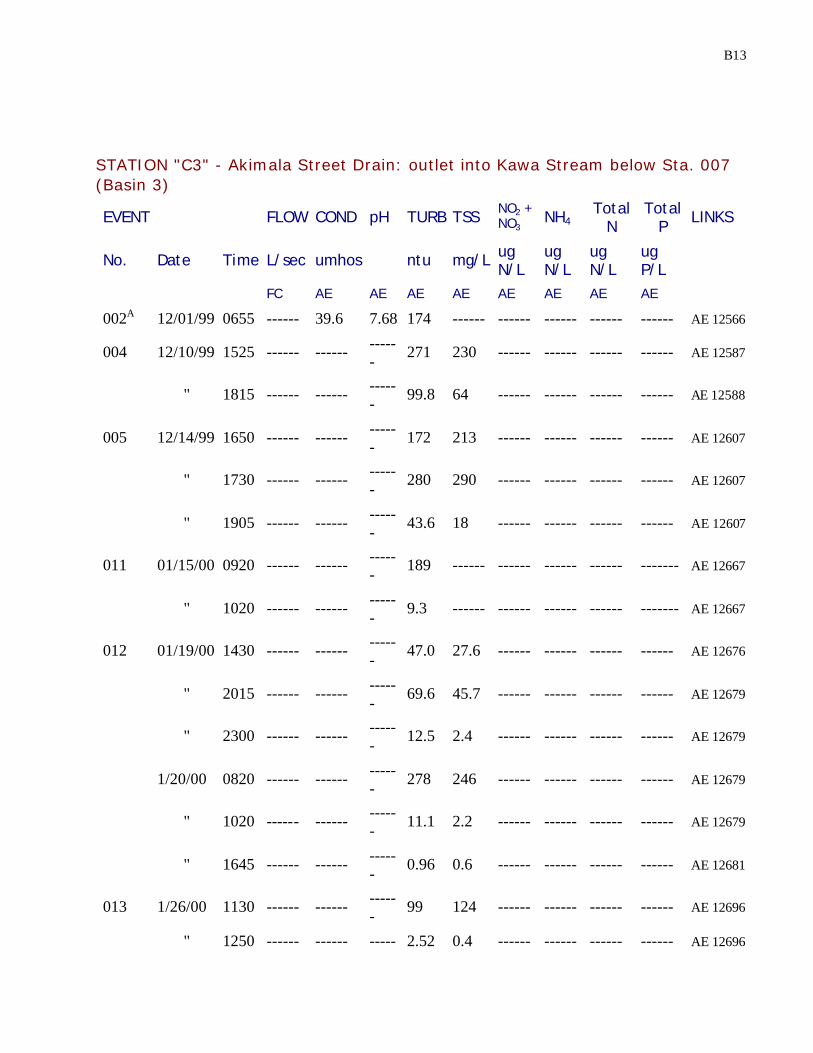
B13
STATION "C3" - Akimala Street Drain: outlet into Kawa Stream below Sta. 007 (Basin 3)
EVENT FLOW COND pH TURB TSS NO2 + NO3 NH4
Total N
Total P LINKS
No. Date Time L/sec umhos ntu mg/L ug N/L
ug N/L
ug N/L
ug P/L
FC AE AE AE AE AE AE AE AE
002A 12/01/99 0655 ------ 39.6 7.68 174 ------ ------ ------ ------ ------ AE 12566
004 12/10/99 1525 ------ ------ ------ 271 230 ------ ------ ------ ------ AE 12587
" 1815 ------ ------ ------ 99.8 64 ------ ------ ------ ------ AE 12588
005 12/14/99 1650 ------ ------ ------ 172 213 ------ ------ ------ ------ AE 12607
" 1730 ------ ------ ------ 280 290 ------ ------ ------ ------ AE 12607
" 1905 ------ ------ ------ 43.6 18 ------ ------ ------ ------ AE 12607
011 01/15/00 0920 ------ ------ ------ 189 ------ ------ ------ ------ ------- AE 12667
" 1020 ------ ------ ------ 9.3 ------ ------ ------ ------ ------- AE 12667
012 01/19/00 1430 ------ ------ ------ 47.0 27.6 ------ ------ ------ ------ AE 12676
" 2015 ------ ------ ------ 69.6 45.7 ------ ------ ------ ------ AE 12679
" 2300 ------ ------ ------ 12.5 2.4 ------ ------ ------ ------ AE 12679
1/20/00 0820 ------ ------ ------ 278 246 ------ ------ ------ ------ AE 12679
" 1020 ------ ------ ------ 11.1 2.2 ------ ------ ------ ------ AE 12679
" 1645 ------ ------ ------ 0.96 0.6 ------ ------ ------ ------ AE 12681
013 1/26/00 1130 ------ ------ ------ 99 124 ------ ------ ------ ------ AE 12696
" 1250 ------ ------ ----- 2.52 0.4 ------ ------ ------ ------ AE 12696

B14
-
017 3/31/00 1030 32.4 41.7 ------ 8.39 5.8 ------ ------ ------ ------ AE 12886
" 1405 4.5 ------ ------ 22.5 13 ------ ------ ------ ------ AE 12892
021 02/08/01 1540 12.5 ------ ------ 24.0 51.6 408 117 1410 697 AE 13932
023 02/12/01 1510 44.3 ------ ------ 120 216 ------ ------ ------ ------ AE 13947
" 1535 7.2 ------ ------ 41.0 17 ------ ------ ------ ------ AE 13947
026 05/18/01 1105 ------ ------ ------ 96.2 68.6 176 79 1390 711 AE 14320

B15
STATION "C4" - Nakuluai Street Drain: outlet into Kawa Stream below Sta. 007 (Basin 3)
EVENT COND TURB TSS NO2 + NO3 NH4
Total N
Total P LINKS
No. Date Time umhos ntu mg/L ug N/L
ug N/L ug N/L ug P/L
NC AE AE NC NC NC NC
023 02/12/01 1540 ------ 31.6 17 ------ ------ ------ ------ AE 13947
STATION "C5" - Kaneohe Bay Drive open culvert north of Castle High School (Basin 7)
EVENT COND TURB TSS NO2 + NO3 NH4
Total N
Total P LINKS
No. Date Time umhos ntu mg/L ug N/L
ug N/L ug N/L ug P/L
AE AE AE NC NC NC NC
004A 12/10/99 1600 ------- 209 160 ------ ------ ------ ------ AE 12587
012A 01/19/00 1510 34.5 88.4 53.0 ------ ------ ------ ------ AE 12676
026A 05/18/01 1130 ------ 131 105 142 67 1270 395 AE 14320
A Sample from off the street before entering a storm drain.
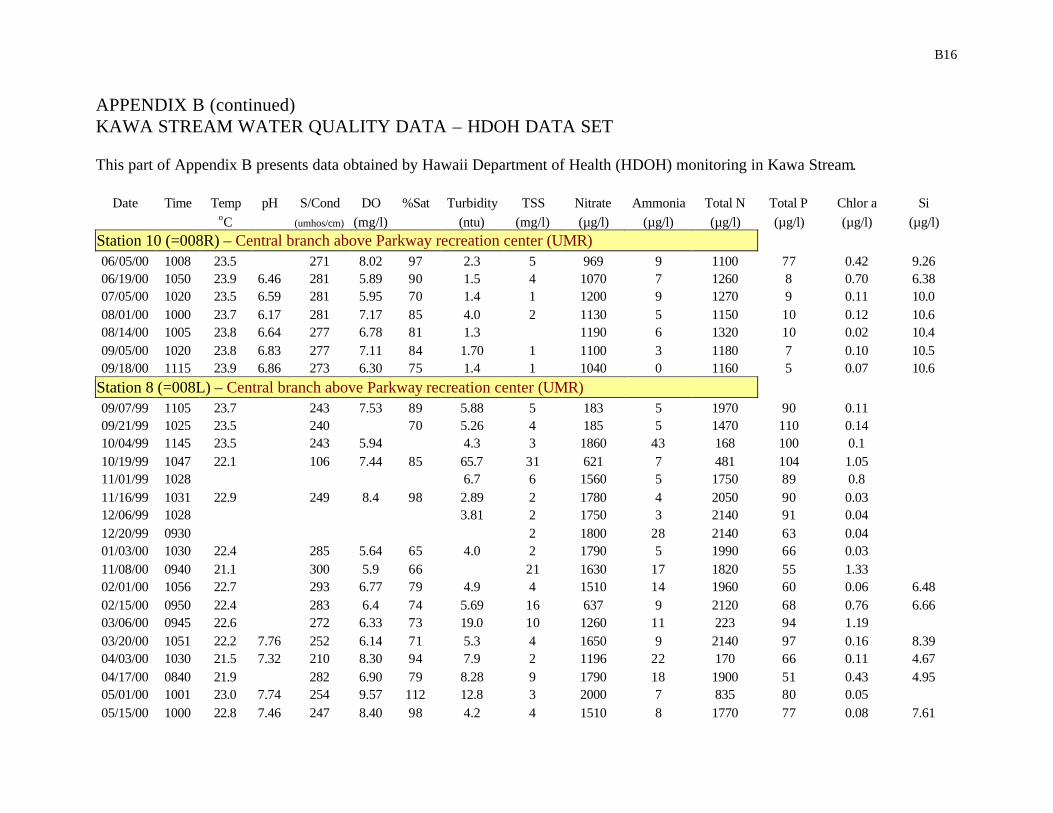
B16
APPENDIX B (continued) KAWA STREAM WATER QUALITY DATA – HDOH DATA SET This part of Appendix B presents data obtained by Hawaii Department of Health (HDOH) monitoring in Kawa Stream.
Date Time Temp pH S/Cond DO %Sat Turbidity TSS Nitrate Ammonia Total N Total P Chlor a Si oC (umhos/cm) (mg/l) (ntu) (mg/l) (µg/l) (µg/l) (µg/l) (µg/l) (µg/l) (µg/l)
Station 10 (=008R) – Central branch above Parkway recreation center (UMR) 06/05/00 1008 23.5 271 8.02 97 2.3 5 969 9 1100 77 0.42 9.26 06/19/00 1050 23.9 6.46 281 5.89 90 1.5 4 1070 7 1260 8 0.70 6.38 07/05/00 1020 23.5 6.59 281 5.95 70 1.4 1 1200 9 1270 9 0.11 10.0 08/01/00 1000 23.7 6.17 281 7.17 85 4.0 2 1130 5 1150 10 0.12 10.6 08/14/00 1005 23.8 6.64 277 6.78 81 1.3 1190 6 1320 10 0.02 10.4 09/05/00 1020 23.8 6.83 277 7.11 84 1.70 1 1100 3 1180 7 0.10 10.5 09/18/00 1115 23.9 6.86 273 6.30 75 1.4 1 1040 0 1160 5 0.07 10.6
Station 8 (=008L) – Central branch above Parkway recreation center (UMR) 09/07/99 1105 23.7 243 7.53 89 5.88 5 183 5 1970 90 0.11 09/21/99 1025 23.5 240 70 5.26 4 185 5 1470 110 0.14 10/04/99 1145 23.5 243 5.94 4.3 3 1860 43 168 100 0.1 10/19/99 1047 22.1 106 7.44 85 65.7 31 621 7 481 104 1.05 11/01/99 1028 6.7 6 1560 5 1750 89 0.8 11/16/99 1031 22.9 249 8.4 98 2.89 2 1780 4 2050 90 0.03 12/06/99 1028 3.81 2 1750 3 2140 91 0.04 12/20/99 0930 2 1800 28 2140 63 0.04 01/03/00 1030 22.4 285 5.64 65 4.0 2 1790 5 1990 66 0.03 11/08/00 0940 21.1 300 5.9 66 21 1630 17 1820 55 1.33 02/01/00 1056 22.7 293 6.77 79 4.9 4 1510 14 1960 60 0.06 6.48 02/15/00 0950 22.4 283 6.4 74 5.69 16 637 9 2120 68 0.76 6.66 03/06/00 0945 22.6 272 6.33 73 19.0 10 1260 11 223 94 1.19 03/20/00 1051 22.2 7.76 252 6.14 71 5.3 4 1650 9 2140 97 0.16 8.39 04/03/00 1030 21.5 7.32 210 8.30 94 7.9 2 1196 22 170 66 0.11 4.67 04/17/00 0840 21.9 282 6.90 79 8.28 9 1790 18 1900 51 0.43 4.95 05/01/00 1001 23.0 7.74 254 9.57 112 12.8 3 2000 7 835 80 0.05 05/15/00 1000 22.8 7.46 247 8.40 98 4.2 4 1510 8 1770 77 0.08 7.61
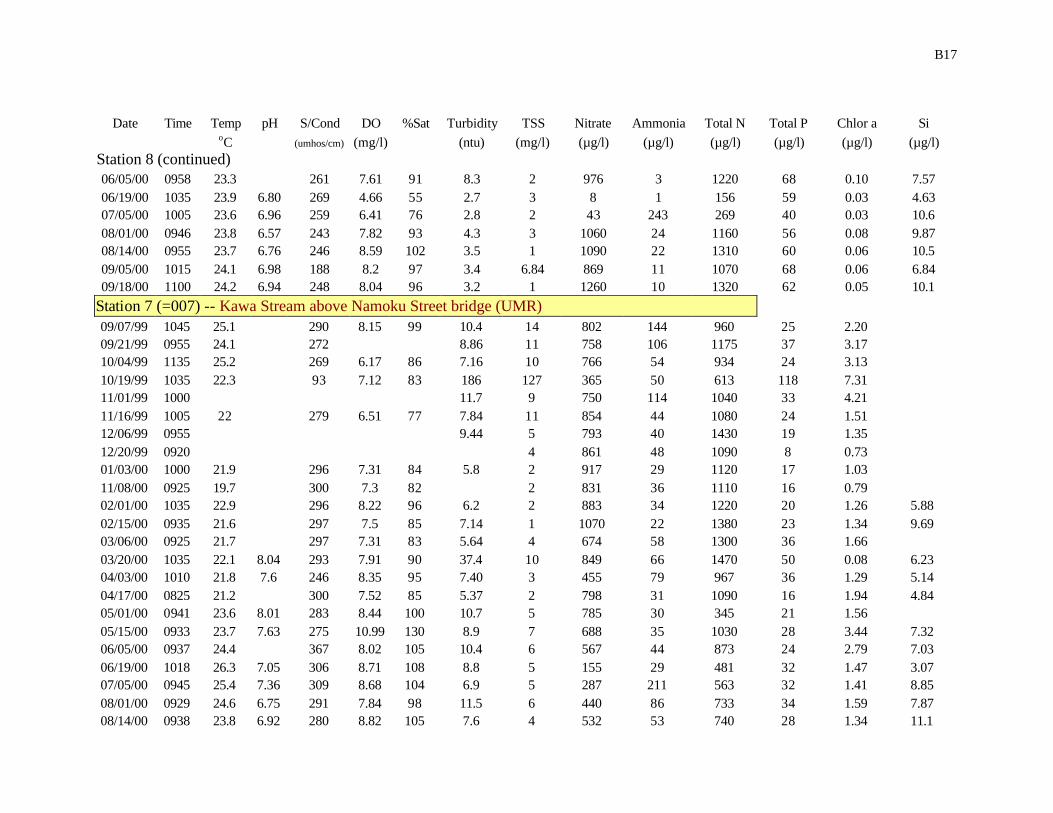
B17
Date Time Temp pH S/Cond DO %Sat Turbidity TSS Nitrate Ammonia Total N Total P Chlor a Si
oC (umhos/cm) (mg/l) (ntu) (mg/l) (µg/l) (µg/l) (µg/l) (µg/l) (µg/l) (µg/l) Station 8 (continued) 06/05/00 0958 23.3 261 7.61 91 8.3 2 976 3 1220 68 0.10 7.57 06/19/00 1035 23.9 6.80 269 4.66 55 2.7 3 8 1 156 59 0.03 4.63 07/05/00 1005 23.6 6.96 259 6.41 76 2.8 2 43 243 269 40 0.03 10.6 08/01/00 0946 23.8 6.57 243 7.82 93 4.3 3 1060 24 1160 56 0.08 9.87 08/14/00 0955 23.7 6.76 246 8.59 102 3.5 1 1090 22 1310 60 0.06 10.5 09/05/00 1015 24.1 6.98 188 8.2 97 3.4 6.84 869 11 1070 68 0.06 6.84 09/18/00 1100 24.2 6.94 248 8.04 96 3.2 1 1260 10 1320 62 0.05 10.1
Station 7 (=007) -- Kawa Stream above Namoku Street bridge (UMR) 09/07/99 1045 25.1 290 8.15 99 10.4 14 802 144 960 25 2.20 09/21/99 0955 24.1 272 8.86 11 758 106 1175 37 3.17 10/04/99 1135 25.2 269 6.17 86 7.16 10 766 54 934 24 3.13 10/19/99 1035 22.3 93 7.12 83 186 127 365 50 613 118 7.31 11/01/99 1000 11.7 9 750 114 1040 33 4.21 11/16/99 1005 22 279 6.51 77 7.84 11 854 44 1080 24 1.51 12/06/99 0955 9.44 5 793 40 1430 19 1.35 12/20/99 0920 4 861 48 1090 8 0.73 01/03/00 1000 21.9 296 7.31 84 5.8 2 917 29 1120 17 1.03 11/08/00 0925 19.7 300 7.3 82 2 831 36 1110 16 0.79 02/01/00 1035 22.9 296 8.22 96 6.2 2 883 34 1220 20 1.26 5.88 02/15/00 0935 21.6 297 7.5 85 7.14 1 1070 22 1380 23 1.34 9.69 03/06/00 0925 21.7 297 7.31 83 5.64 4 674 58 1300 36 1.66 03/20/00 1035 22.1 8.04 293 7.91 90 37.4 10 849 66 1470 50 0.08 6.23 04/03/00 1010 21.8 7.6 246 8.35 95 7.40 3 455 79 967 36 1.29 5.14 04/17/00 0825 21.2 300 7.52 85 5.37 2 798 31 1090 16 1.94 4.84 05/01/00 0941 23.6 8.01 283 8.44 100 10.7 5 785 30 345 21 1.56 05/15/00 0933 23.7 7.63 275 10.99 130 8.9 7 688 35 1030 28 3.44 7.32 06/05/00 0937 24.4 367 8.02 105 10.4 6 567 44 873 24 2.79 7.03 06/19/00 1018 26.3 7.05 306 8.71 108 8.8 5 155 29 481 32 1.47 3.07 07/05/00 0945 25.4 7.36 309 8.68 104 6.9 5 287 211 563 32 1.41 8.85 08/01/00 0929 24.6 6.75 291 7.84 98 11.5 6 440 86 733 34 1.59 7.87 08/14/00 0938 23.8 6.92 280 8.82 105 7.6 4 532 53 740 28 1.34 11.1
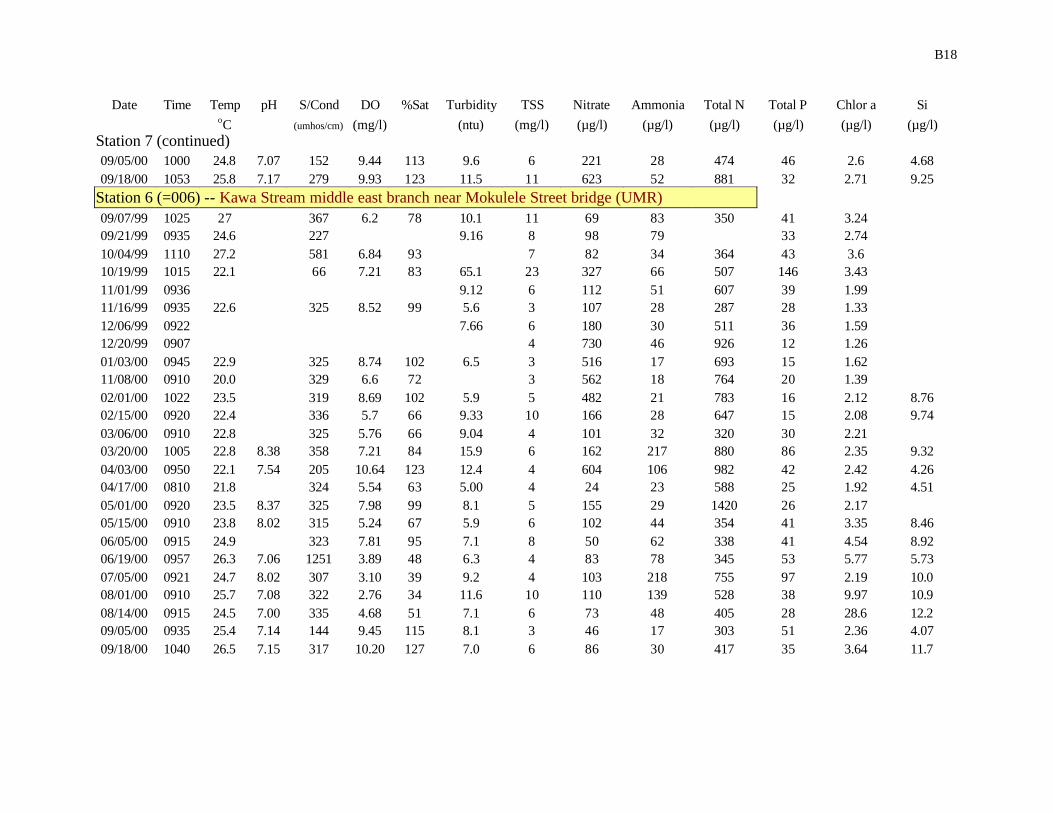
B18
Date Time Temp pH S/Cond DO %Sat Turbidity TSS Nitrate Ammonia Total N Total P Chlor a Si oC (umhos/cm) (mg/l) (ntu) (mg/l) (µg/l) (µg/l) (µg/l) (µg/l) (µg/l) (µg/l)
Station 7 (continued) 09/05/00 1000 24.8 7.07 152 9.44 113 9.6 6 221 28 474 46 2.6 4.68 09/18/00 1053 25.8 7.17 279 9.93 123 11.5 11 623 52 881 32 2.71 9.25
Station 6 (=006) -- Kawa Stream middle east branch near Mokulele Street bridge (UMR) 09/07/99 1025 27 367 6.2 78 10.1 11 69 83 350 41 3.24 09/21/99 0935 24.6 227 9.16 8 98 79 33 2.74 10/04/99 1110 27.2 581 6.84 93 7 82 34 364 43 3.6 10/19/99 1015 22.1 66 7.21 83 65.1 23 327 66 507 146 3.43 11/01/99 0936 9.12 6 112 51 607 39 1.99 11/16/99 0935 22.6 325 8.52 99 5.6 3 107 28 287 28 1.33 12/06/99 0922 7.66 6 180 30 511 36 1.59 12/20/99 0907 4 730 46 926 12 1.26 01/03/00 0945 22.9 325 8.74 102 6.5 3 516 17 693 15 1.62 11/08/00 0910 20.0 329 6.6 72 3 562 18 764 20 1.39 02/01/00 1022 23.5 319 8.69 102 5.9 5 482 21 783 16 2.12 8.76 02/15/00 0920 22.4 336 5.7 66 9.33 10 166 28 647 15 2.08 9.74 03/06/00 0910 22.8 325 5.76 66 9.04 4 101 32 320 30 2.21 03/20/00 1005 22.8 8.38 358 7.21 84 15.9 6 162 217 880 86 2.35 9.32 04/03/00 0950 22.1 7.54 205 10.64 123 12.4 4 604 106 982 42 2.42 4.26 04/17/00 0810 21.8 324 5.54 63 5.00 4 24 23 588 25 1.92 4.51 05/01/00 0920 23.5 8.37 325 7.98 99 8.1 5 155 29 1420 26 2.17 05/15/00 0910 23.8 8.02 315 5.24 67 5.9 6 102 44 354 41 3.35 8.46 06/05/00 0915 24.9 323 7.81 95 7.1 8 50 62 338 41 4.54 8.92 06/19/00 0957 26.3 7.06 1251 3.89 48 6.3 4 83 78 345 53 5.77 5.73 07/05/00 0921 24.7 8.02 307 3.10 39 9.2 4 103 218 755 97 2.19 10.0 08/01/00 0910 25.7 7.08 322 2.76 34 11.6 10 110 139 528 38 9.97 10.9 08/14/00 0915 24.5 7.00 335 4.68 51 7.1 6 73 48 405 28 28.6 12.2 09/05/00 0935 25.4 7.14 144 9.45 115 8.1 3 46 17 303 51 2.36 4.07 09/18/00 1040 26.5 7.15 317 10.20 127 7.0 6 86 30 417 35 3.64 11.7

B19
Date Time Temp pH S/Cond DO %Sat Turbidity TSS Nitrate Ammonia Total N Total P Chlor a Si
oC (umhos/cm) (mg/l) (ntu) (mg/l) (µg/l) (µg/l) (µg/l) (µg/l) (µg/l) (µg/l) Station 5 (=005) -- Kawa Stream at Bayview Golf Course (LR) 09/07/99 0955 25 358 4.75 58 6.78 4 1020 47 1190 34 1.79 09/21/99 0920 24.4 229 4.34 2 787 29 1056 40 1.53 10/04/99 1045 23.8 272 6.16 73 4.33 2 1080 24 1240 35 1.91 10/19/99 0950 22.2 134 7.45 87 291 262 397 110 734 106 26.6 11/01/99 0912 5.13 3 987 20 1370 49 1.69 11/16/99 0910 22.2 352 5.91 70 4 2 1250 19 1370 39 0.66 12/06/99 0840 4.17 2 975 26 1420 43 0.53 12/20/99 0850 1 1580 36 1720 23 0.26 01/03/00 0917 21.9 338 6.28 71 5.1 1 1520 12 1740 36 0.68 11/08/00 0855 20.0 330 7.3 80 2 1480 20 1680 33 0.46 02/01/00 1005 23.3 335 6.67 78 6.2 2 1510 20 1830 29 0.76 7.86 02/15/00 0905 22.2 341 6.7 77 6.56 2 995 15 2070 30 1.16 11 03/06/00 0850 22.8 340 6.47 75 4.50 2 1230 25 1920 43 1.02 03/20/00 0940 22.1 8.87 312 6.53 75 4.8 3 1440 20 2130 33 0.92 8.56 04/03/00 0935 21.8 7.84 211 8.07 92 13.4 3 815 44 1190 42 1.05 4.94 04/17/00 0752 21.9 323 6.44 70 4.21 2 1440 18 1770 33 0.81 5.9 05/01/00 0900 23.4 8.58 324 4.63 54 4.4 2 1500 17 1630 31 1.57 05/15/00 0848 24.0 8.58 321 7.60 90 5.2 2 1280 19 1600 31 1.22 8.52 06/05/00 0900 24.8 301 7.74 93 23.6 12 1140 18 1590 60 1.57 7.32 06/19/00 0931 26.0 7.02 318 6.0 74 2.7 2 752 24 1310 27 1.03 4.38 07/05/00 0900 24.6 8.05 319 5.53 27 4.2 2 927 34 1250 37 0.81 9.92 08/01/00 0857 26.0 7.85 314 4.85 60 3.4 2 743 26 985 28 0.77 9.12 08/14/00 0837 24.9 7.30 322 4.94 52 3.5 2 650 43 993 26 0.83 8.93 09/05/00 0912 24.8 7.28 225 8.37 101 7.2 3 332 6 643 43 1.42 6.76 09/18/00 1025 25.8 7.34 331 5.37 66 4.5 3 821 18 1210 36 0.92 8.75