kbcm q4 2014 junior debt newsletter - copy
TRANSCRIPT

Disclosure : KeyBanc Capital Markets is a trade name under which corporate and investment banking products and services of KeyCorp and its subsidiaries, KeyBanc Capital Markets Inc., MemberNYSE/FINRA/SIPC, and KeyBank National Association (“KeyBank N.A.”), are marketed. Securities products and services are offered by KeyBanc Capital Markets Inc. and its licensed securities representatives, whomay also be employees of KeyBank N.A. Banking products and services are offered by KeyBank N.A. This report was not issued by our research department. The information contained in this report has beenobtained from sources deemed to be reliable but is not represented to be complete, and it should not be relied upon as such. This report does not purport to be a complete analysis of any security, issuer, or industryand is not an offer or a solicitation of an offer to buy or sell any securities. This report is prepared for general information purposes only and does not consider the specific investment objectives, financial situation andparticular needs of any individual person or entity.
KBCM Junior Debt Quarterly NewsletterFourth Quarter 2014
Executive Summary
� Overall, transaction dynamics and return expectations con tinue to reflect a very competitivemarketplace
� However, much like the current senior debt market, the junio r debt market is bifurcated
– At the smaller end of the market (transactions < $50 million), the competitive landscape is robust andissuers are able to push on price and terms
– The larger market (transactions > $50 million) has experienced substantial dislocation and the cost ofcapital is rising quickly, driven by
– Volatility in second lien market
– Larger BDCs have traded down in December and January
� Q4 2014 transaction activity was good but not great
– ~63% of respondents reviewed more than 50 transactions, but a substantial percentage did not close atransaction (19%) or closed just one transaction (22%)
� The vast majority of respondents (73%) indicated total retu rn expectations in the 12%-15% range
– Historically, total return expectations have been slightly higher at 15% to 18%
– There continues to be pricing pressure on the cash pay component of return
KeyBanc Capital Markets conducts a quarterly survey of juni or debt participants to measure market conditionsand transaction terms. In this newsletter, we share with you the results of the survey and provide otheranecdotal observations to bring you our state-of-the-mark et perspective.
KeyBanc Capital Markets’ Debt Capital Markets
The KeyBanc Capital Markets® Debt Capital Markets team represents oneof the strongest full-service debt-side investment banking, sales, tradingand distribution platforms in the nation. We use a blend of real worldperspectives, backed by robust capabilities and relationships, to help ourclients use leverage to grow, make acquisitions, and enhance operations.
For additional information regarding KeyBanc Capital Markets or this newsletter, please contact
the individual listed below:
Andrew Frawley216.689.4288
JUNIOR DEBT MARKET OVERVIEW

2
Source: KeyBanc Capital Markets Junior Debt Survey
KBCM Junior Debt Quarterly NewsletterFourth Quarter 2014
Industry Breakdown Q3 2014 Q4 2014
OVERVIEW OF FUNDS
Fund Profile
Junior debt providers continue to consider a broad range of industries as the economic cycle expands and issuers seek additional capital. Current industries of note include industrial manufacturing, business services, consumer, transportation & logistics, health care and information services
Significant capital remains available to issuers seeking junior debt; 93% of the funds that responded have more than $50 million of available capital and 78% have more than $100 million available
Available Capital Typical Investment Size
Time Needed to Raise New Fund NTM New Fund RaiseFundraising sentiment appears to be slightly down from Q3’14. More than 72% of respondents feel a fund can be raised in ~ 6 – 12 months
<$5M $5M - $10M
4%
$11M - $25M 39%
$26M - $50M 32%
>$50M25%
Yes52%
No44%
Undecided4%
7%
15%
41%
19% 19%
0%
10%
20%
30%
40%
50%
<$50M $50M - $99M $100M - $250M $251M - $500M > $500M
% o
f R
esp
on
den
ts
29%
43%
29%
0%
10%
20%
30%
40%
50%
<6 months 6 - 12 months 13 - 18 months
% o
f R
esp
on
den
ts
50%
38%
28%
25%
25%
25%
22%
19%
16%
13%
13%
9%
9%
9%
6%
0%
0%
59%
50%
42%
35%
39%
39%
27%
35%
27%
31%
19%
12%
23%
15%
23%
19%
0%
0%
39%
Industrial Manufacturing
Business Services
Consumer
Health Care
Transportation and Logistics
Information Services
Education
Energy and Utilities
Finance and Insurance
Professional, Scientific, and Technical Services
Hospitality
Technology
Basic Materials
Construction, Engineering and Infrastructure Services
Real Estate
Other
Waste Management
Do not have any industry specialization

3
Source: KeyBanc Capital Markets Junior Debt Survey
KBCM Junior Debt Quarterly NewsletterFourth Quarter 2014
Sponsored vs. Non-Sponsored Deals
JUNIOR DEBT DEAL FLOWScreening (10/1/2014 – 12/31/2014)
Transactions Reviewed LOIs Submitted
Closed transaction activity was slightly down this quarter as the number of respondents that closed at least one transaction decreased to 82% in Q4’14, compared to 89% in Q3’14 and 79% in Q2’14
Portfolio Investment Sources
Junior debt providers reviewed slightly more transactions in Q4’14 - 89% of respondents reviewed more than 25 opportunities (versus 82% and 84% in the prior two quarters), and all respondents submitted at least one LOI during the fourth quarter (flat from the prior three quarters)
Transactions Closed
Sponsored66%
Non-Sponsored34%
1-5 LOIs52%
6-10 LOIs15%
10+ LOIs33%
19%
22%
19% 19%
7%
15%
0 1 2 3 4 ≥5
1-5 transactions7%
11-25 transactions4%
26-50 transactions26%
>50 transactions63%
Investment Banks27%
PE Sponsor Groups
46%
Other Mezzanine Funds
8%
Other19%

4
Source: KeyBanc Capital Markets Junior Debt Survey
KBCM Junior Debt Quarterly NewsletterFourth Quarter 2014
Realization
Equity (On a % Basis) That Must Be Below the Junior Debt
Junior Debt as a Percentage of Overall Capital Stru cture
Market Average Multiples
Debt/EBITDARatios
<1.5 1.5-1.9 2.0-2.5 2.6-3.0 3.1-3.5 3.6-4.0 4.1-4.5 4.6-5.0 >5.0
Senior Debt - 4% 12% 39% 19% 19% 7% - -
Total Debt - - - - 15% 30% 15% 30% 11%
77% of transactions in the last twelve months got done at 2.6x – 4.0x senior leverage
Total leverage is down slightly in Q4’14, with 11.1% of transactions levered >5.0x from 12% in Q3’14
Consistent with prior surveys, junior debt funds continue to realize exits through M&A and recapitalizations / refinancings
FUND INVESTMENTS
Mezz Debt as a % of Total
Capital Structure
<5% 5%-10% 11%-15% 16%-20% 21%-25% >25%
Respondents - - 33% 33% 30% 4%
% of Equity Below Junior
Debt< 20% 20-29% 30-39% 40-50% >50%
Respondents 4% 26% 56% 15% -
Nearly all respondents indicated that there needs to be 20% -50% of equity below junior debt, with 55.6% in the 30% - 39% range (consistent with prior quarters)
Junior debt investment continues to occupy 11% - 25% of the total capital structure
Internal Cash Flow13%
Refinancing34%
Sale of Company46%
IPO5%
Other1%

5
Source: KeyBanc Capital Markets Junior Debt Survey
KBCM Junior Debt Quarterly NewsletterFourth Quarter 2014
PIK
Equity
Equity as a Percentage of Fully-Diluted Equity
TRANSACTION SPECIFICS
Interestingly, 42% of respondents are at a 11% cash pay and 8% are <10%
~73% of respondents aim for a base-case, all-in IRR of 12% - 15%
Base Case Averages
IRR
<10% 10% 11% 12% 13% 14% 15% 16% 17% 18% 19% 20% >20%
Cash Pay 8% 23% 42% 27% - - - - - - - - -
All-in IRR - 4% 4% 12% 19% 27% 15% 12% 4% 4% - - -
The pressure on cash pay and total returns is seen in the PIK component
PIK has moved from 3% to 2%
PIK Rate
Rarely or Never Have PIK Rate
≤1% 2% 3% 4% 5% >5%
4% 12% 73% 8% - - 4%
% of Transactions with Warrants / Equity Participation Approximately 54% of
respondents reported over half of their transactions have warrants or other equity upside (including purchased equity), including 12% that have warrants on all transactions (up from 6% in Q3’14)
Approximately 48% of respondents reported warrants were ≥4% of fully diluted equity, lower than 56% in Q3’14
Returns
We rarely or never make an equity co-investment
4%
≤10%19%
11% - 25% 11%
26% - 50%12%
51% - 99% 42%
100%12% 2%
20%
3%32%
4%4%
5%8%
>5%36%

6
Source: KeyBanc Capital Markets Junior Debt Survey
KBCM Junior Debt Quarterly NewsletterFourth Quarter 2014
No-Call Provision
Percentage of Transactions with No-Call Periods
Average Length of No-Call Periods
TRANSACTION SPECIFICS (CONTINUED)
Respondents indicated 42% of transactions do not have call protection, down from 47% in Q3’14
Another 19% of respondents indicated all of their transactions have no-call periods
Average length of no-call periods is 1-2 years
42%
12%
4%8%
15%19%
-10%
5%
20%
35%
50%
0% 1% - 10% 11% - 25% 26% - 50% 51% - 99% 100%
% o
f R
esp
on
den
ts
47% 47%
6%0%
20%
40%
60%
1 Year 2 Years >3 Years
% o
f R
esp
on
den
ts
Equity (CONTINUED)
Equity co-investment or
purchased equity%
72%
Warrants issued as a result of
providng junior debt 28%
Origin
Almost 75% of equity participation is in the form of purchased equity (as opposed to warrants)

7
Source: KeyBanc Capital Markets Junior Debt Survey
KBCM Junior Debt Quarterly NewsletterFourth Quarter 2014
TRANSACTION SPECIFICS (CONTINUED)
Percentage of Transactions with Prepayment Penaltie s
Average Prepayment Penalty for First Year Debt
Most transactions have some form of prepayment penalty
The majority of prepayment penalties is typically 3% of the principal amount in year 1
Prepayment
0.0% 0.0%
0.0%
8%
19%
73%
0%
16%
32%
48%
64%
80%
0% 1% - 10% 11% - 25% 26% - 50% 51% - 99% 100%
% o
f R
esp
on
den
ts
19%
54%
19%
8%
0.0%0%
20%
40%
60%
≤2% 3% 4% 5% >5%
% o
f R
esp
on
den
ts
8
Source: KeyBanc Capital Markets Junior Debt Survey
KBCM Junior Debt Quarterly NewsletterFourth Quarter 2014
Second Lien Providers are Active Market Participant s
Willingness to do a Second Lien Deal
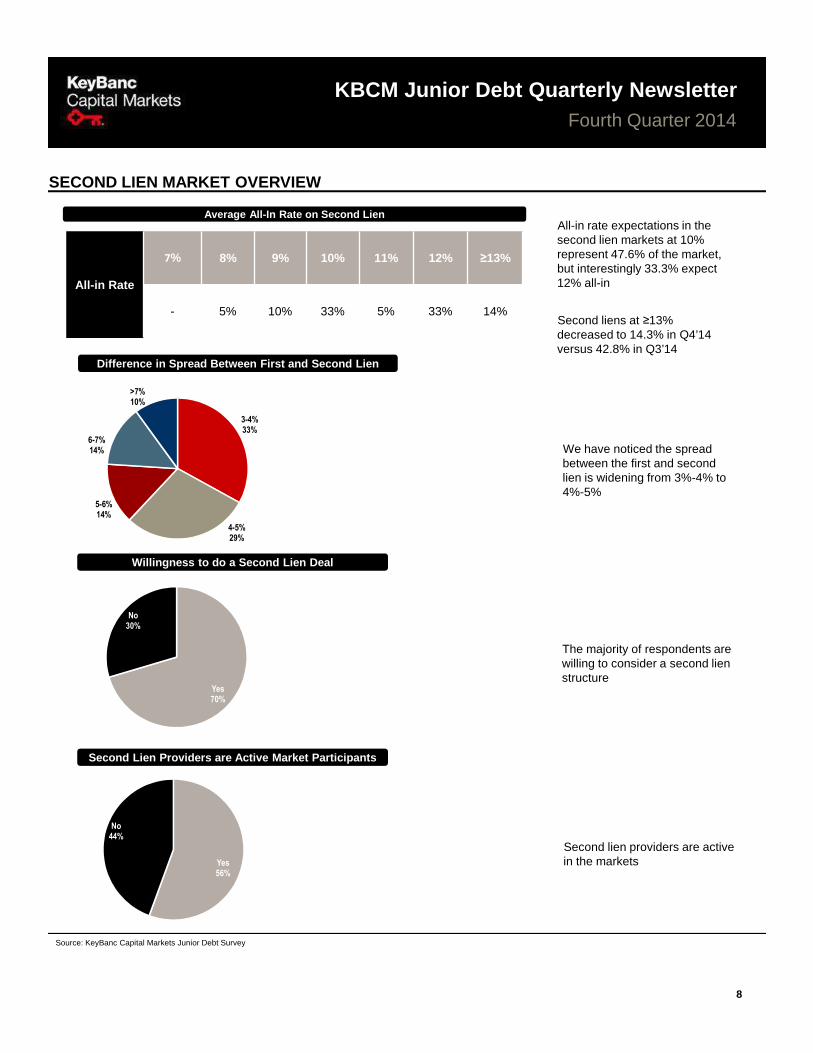
SECOND LIEN MARKET OVERVIEW
Average All-In Rate on Second Lien
All-in Rate
7% 8% 9% 10% 11% 12% ≥13%
- 5% 10% 33% 5% 33% 14%
All-in rate expectations in the second lien markets at 10% represent 47.6% of the market, but interestingly 33.3% expect 12% all-in
Second liens at ≥13% decreased to 14.3% in Q4’14 versus 42.8% in Q3’14
The majority of respondents are willing to consider a second lien structure
Second lien providers are active in the markets
Yes70%
No30%
Yes56%
No44%
Difference in Spread Between First and Second Lien
3-4%33%
4-5%29%
5-6%14%
6-7%14%
>7%10%
We have noticed the spread between the first and second lien is widening from 3%-4% to 4%-5%

9
Source: KeyBanc Capital Markets Junior Debt Survey
KBCM Junior Debt Quarterly NewsletterFourth Quarter 2014
Unitranche Overview
12%6%
11%24%
14%12%
<=10%59%
Willingness to Provide a Unitranche Structure
Yes63%
No37%
Unitranche structures are becoming more widely accepted, 63% of respondents will consider it, up from Q3’14 (59%)
Average All-In Rate on Unitranche
We have seen a proliferation of capital providers willing to do an entire capital structure
We have seen the all-in rate on unitranche structures in the 8% range
We intend to revise the scale on future surveys to provide more detail on sub 10% pricing

10
Source: KeyBanc Capital Markets Junior Debt Survey
KBCM Junior Debt Quarterly NewsletterFourth Quarter 2014
Covenants and Defaults
Market Perspective on Ratios
Biggest Challenge Facing Junior Debt Providers
Junior debt providers anticipate the market to be consistent as leverage levels are expected to stay the same compared to the previous quarter…
…67% of respondents believe that enterprise valuations will remain the same…
…with a decrease in the number of expected realizations (48% expect an increase in activity, down from 72% in Q3’14)
MARKET EXPECTATIONS
Respondents remain relatively evenly split regarding challenges facing the current junior debt market; however, having a unitranche structure that combines senior debt and junior debt into one layer of capital, competition from other junior capital providers and aggressive senior debt markets are the top concerns
Aggressive Senior Debt Market
22%
A Unitranche Structure that
Combines Senior Debt and Junior Debt Into One
Layer of Capital24%
Competition from Other Junior
Capital Providers22%
Uncertainty Regarding
Companies' Current / Future
Performance16%
Volatile Macroeconomic
Environment11%
Other5%
19% 15%22%
48%11%11%
11%
11%
70% 74%67%
41%
0%
25%
50%
75%
100%
Senior Debt/EBITDA Total Debt/EBITDA EV/EBITDA Realizations
% o
f Res
po
nden
ts
Increase Decrease Stay the Same
37%
11%
30%
7%
11%
15%
56%
78%
56%
0%
25%
50%
75%
100%
Covenant defaults Monetary defaults Portfolio companies needing to'amend and extend'
% o
f Res
pond
ents
Increase Decrease Stay the Same