keller group plc full year results 2011 february 2012
TRANSCRIPT

Keller Group plcFull Year Results 2011February 2012

Overview
• 2011 results in line with previous guidance, in a challenging year
•Year-end net debt better than expected at £102.5m (1.4x EBITDA)
•Recent major project awards, including:– £120m Wheatstone contract awarded in Australia, starting late 2012
– £30m Vale contract awarded in Malaysia, starting March 2012
•All-time high order book up 40% on last year– up 10% excluding 2013/14 work
•Business improvement initiatives in progress
2

3
Group Income Statement
£m 2011 2010*%
changeRevenue up 7% on a constant currency basis- up 6% ex acquisitions
Average exchange rates- US$1.60 (2010: $1.55)- €1.15 (2010: €1.17)- A$1.55 (2010: A$1.68)
Higher finance costs reflect- 2010 refinancing- higher non-cash charges
Effective tax rate 25% (2010: 28%)- 28% expected in 2012
Revenue 1,154.3 1,068.9 +8%
EBITDA
71.4 85.0 -16%
Operating profit 28.9 43.3 -33%
Net finance costs (7.0) (3.7)
Profit before tax 21.9 39.6 -45%
Tax (5.5) (11.0)
Profit after tax* 16.4 28.6 -43%
*2010 before goodwill impairment

4
Group Income Statement (continued)
£m 2011 2010%
change2010 goodwill impairment relates to Suncoast and Keller-Terra- £21.8m before tax
Unchanged dividend- 1.1x covered by underlying earnings (2010: 1.9x)
Profit after tax 16.4 28.6 -43%
Goodwill impairment(post tax) - (17.1)
16.4 11.5
Minority interests (0.5) (0.3)
Attributable to shareholders 15.9 11.2
Earnings per share before goodwill impairment 24.8p 44.0p -44%
Earnings per share 24.8p 17.3p +43%
Dividends per share 22.8p 22.8p
5
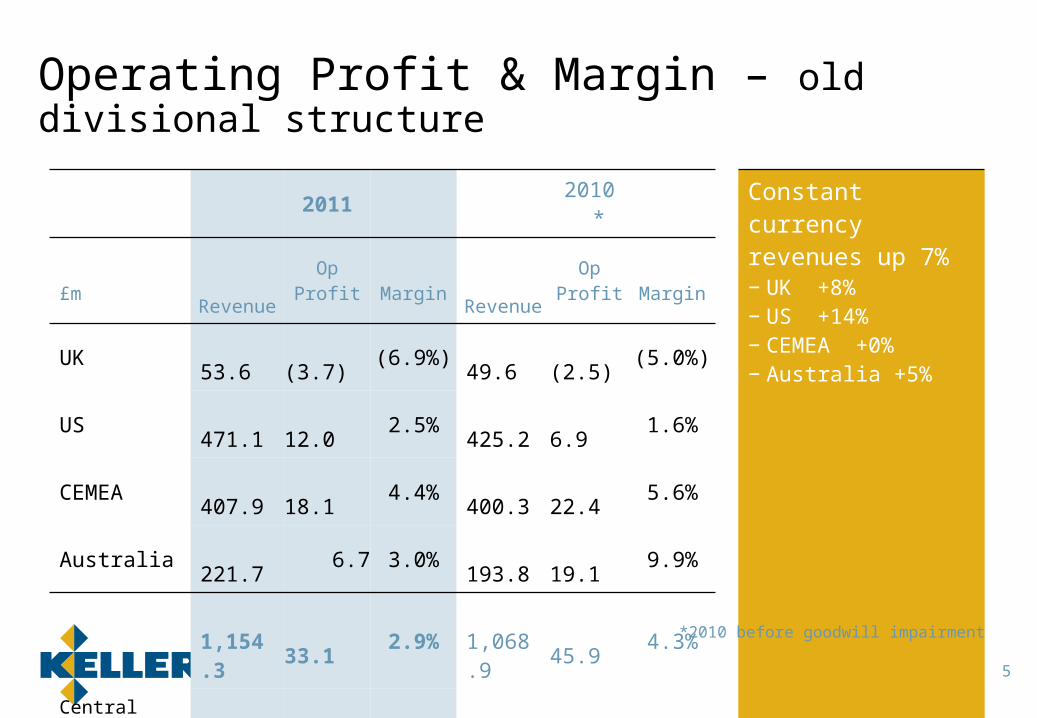
Operating Profit & Margin – old divisional structure
2011 2010* Constant currency revenues up 7%− UK +8%− US +14%− CEMEA +0%− Australia +5%
£mRevenue
OpProfit Margin
Revenue
OpProfit Margin
UK 53.6 (3.7) (6.9%) 49.6 (2.5) (5.0%)
US 471.1 12.0 2.5% 425.2 6.9 1.6%
CEMEA 407.9 18.1 4.4% 400.3 22.4 5.6%
Australia 221.7 6.7 3.0% 193.8 19.1 9.9%
1,154.3 33.1 2.9% 1,068.9 45.9 4.3%
Central costs- (4.2) - (2.6)
1,154.3 28.9 2.5% 1,068.9 43.3 4.1%
*2010 before goodwill impairment

6
Operating Profit & Margin – new divisional structure
2011 2010* Suncoast broke even in 2011
EMEA result- excellent in Poland- eastern Europe
difficult- Middle East very quiet
Australia impacted by Q1 floods and loss at Piling Contractors
£mRevenue
OpProfit Margin
Revenue
OpProfit Margin
N America 471.1 12.0 2.5% 425.2 6.9 1.6%
EMEA 384.8 8.4 2.2% 357.8 8.1 2.3%
Asia 76.7 6.0 7.8% 92.1 11.8 12.8%
Australia 221.7 6.7 3.0% 193.8 19.1 9.9%
1,154.3 33.1 2.9% 1,068.9 45.9 4.3%
Central costs- (4.2) - (2.6)
1,154.3 28.9 2.5% 1,068.9 43.3 4.1%
*2010 before goodwill impairment

7
Group Balance Sheet£m 2011 2010 Year-end exchange
rates very similar− US$1.55 (2010: $1.55)− €1.19 (2010: €1.17)− A$1.52 (2010: A$1.52)
Gearing of 31% (2010: 28%)
Goodwill/intangibles 100.6 106.8
Property, plant & equipment 266.1 275.0
Other non-current assets 15.8 16.1
382.5 397.9
Inventories 37.3 32.9
Receivables 334.7 334.6
Payables (252.2) (260.8)
Working capital 119.8 106.7
Capital employed 502.3 504.6
Other liabilities/provisions (43.2) (50.4)
Retirement benefits (17.7) (20.1)
Tax (12.1) (9.3)
Net debt (102.5) (94.0)
Net assets 326.8 330.8
8
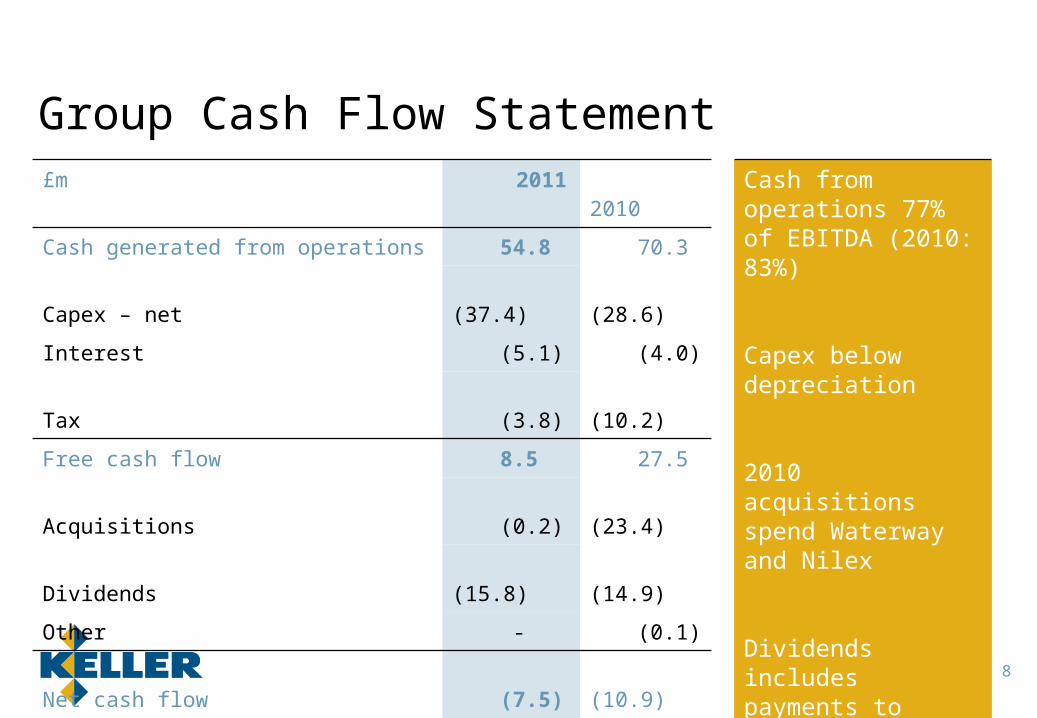
Group Cash Flow Statement£m 2011 2010 Cash from operations
77% of EBITDA (2010: 83%)
Capex below depreciation
2010 acquisitions spend Waterway and Nilex
Dividends includes payments to minorities
Cash generated from operations 54.8 70.3
Capex – net (37.4) (28.6)
Interest (5.1) (4.0)
Tax (3.8) (10.2)
Free cash flow 8.5 27.5
Acquisitions (0.2) (23.4)
Dividends (15.8) (14.9)
Other - (0.1)
Net cash flow (7.5) (10.9)
Opening net debt (94.0) (78.8)
Exchange movements (1.0) (4.3)
Closing net debt (102.5) (94.0)

Group Financing Position
• £230m of committed facilities, mainly:– £170m bank facility expiring April 2015– US$70m private placement, payable October 2014
•Comfortably within all financial covenants
•A further £82m of uncommitted facilities
9
Key Financial Covenants
Test Status*
Net debt < 3x EBITDA 1.8x
EBITDA interest cover > 4x 15x
Net assets > £200m £327m
* Calculated on a covenant basis

Group Order IntakeRecent order intake boosted by a number of significant projects
Jan order book 40% up from last year in constant currency- excludes February Vale
award
Excluding 2013/4 work, order book up 10%
10*at 2011 average exchange rates
Monthly orders(rolling 3 month average at constant currency*)£m
0
20
40
60
80
100
120
140
Wheatstone
Crossrail; Victoria station; AP LNG MOF

11
Keller operates across all sectors of the construction industry
Infrastructure/Public Buildings by far the largest sector in all four divisions
Split broadly consistent year on year
Group Analysis of Revenue
2011 Revenue by End Market Total revenue £1,154m
2010 Revenue by End MarketTotal revenue £1,069m
53%
17%
14%
16%
Infrastructure/Public BuildingsPower/Industrial/ManufacturingOffice/CommercialResidential
51%
18%
14%
17%
Infrastructure/Public BuildingsPower/Industrial/ManufacturingOffice/CommercialResidential

US Non-residential Construction Market
12
$bn
Source: US Census Bureau, February 2012
Total US non-residential construction market down 2% in 2011 (14% down in 2010)
Infrastructure/Public Buildings down 4%- second year of decline
Office/Commercial/Leisure down 4% - > 60% off the peak, but appears to have stabilised
Power/Industrial/Manufacturing up 8%- driven by power sector
Dec-0
7
Jun-
08
Dec-0
8
Jun-
09
Dec-0
9
Jun-
10
Dec-1
0
Jun-
11
Dec-1
1
0
50
100
150
200
250
300
350
400
Infrastructure/Public Buildings Office/Commercial/Leisure
Power/Industrial/Manufacturing
US Construction Put-in-Place

13
North America Analysis of Revenue
2011 Revenue by End Market Total revenue $754m
2010 Revenue by End MarketTotal revenue $659m
50%
19%
11%
20%
Infrastructure/Public BuildingsPower/Industrial/ManufacturingOffice/CommercialResidential
Infrastructure/Public Buildings remains the largest sector
Year on year changes reflect movements in the overall US construction market
Significant mix change in recent years- Commercial/Residential
together used to represent > 50%
45%
22%
13%
20%
Infrastructure/Public BuildingsPower/Industrial/ManufacturingOffice/CommercialResidential

14
North America FoundationsDouble digit revenue growth- foundation market earlier cycle than total
construction market
Margins remain under pressure- some small signs of over capacity reducing
Good performance from Hayward Baker- national footprint gives supportive regional balance
Actions taken to improve performance- Anderson business merged into Western Region of
Hayward Baker- management change at Southern Region of
McKinney
Post year end implementation of ERP system in Case
Piling
Oil refinery, Indiana
,

15
North America Case Studies
Piling
Three Nations Bridge, Ontario Ground improvement
Fuel storage tanks, California

North America Suncoast
US housing starts have stabilised− 500k – 600k range for 30 months− April 2010 peak due to first-time buyer tax
credit− slight uptick in last quarter
Overhang of foreclosed properties remains an issue
Suncoast broke even in 2011 after significant loss in 2010
Source: US Census Bureau Housing Starts
16
Jan-09
Mar
May
July
Sept
Nov Jan
Mar
May
July
Sept
Nov Jan
Mar
May
July
Sept
Nov
Jan-12
0
100
200
300
400
500
600
700
800
US Housing Starts (000s)

17
EMEA¹ Analysis of Revenue
2011 Revenue by End Market Total revenue €443m
2010 Revenue by End MarketTotal revenue €419m
¹EMEA =Europe, Middle East & Africa
46%
19%
20%
15%
Infrastructure/Public Buildings
Power/Industrial/Manufacturing
Office/Commercial
Residential
No major movements in revenue from end markets
Infrastructure/Public Building proportion remains high
Residential traditionally the smallest sector
49%
16%
20%
15%
Infrastructure/Public Buildings
Power/Industrial/Manufacturing
Office/Commercial
Residential

18
Another strong year in Poland- signs of market cooling
Good performance from Germany
Further cost cutting in UK, France and Spain
Work progressing at Victoria Station and Crossrail
Middle East had a disappointing year
Further progress in Brazil
EMEA¹ Regional Split 2011 Revenue by RegionTotal revenue €443m
2010 Revenue by RegionTotal revenue €419m
¹EMEA = Europe, Middle East & Africa
20%
17%
14%11%
10%
8%
5%14%
Poland Germany UK
Austria France Spain
Middle East Other
15%
14%
14%10%8%
10%
7%
22%
Poland Germany UK
Austria France Spain
Middle East Other

19
EMEA Case Studies
Excavation pit
State Opera House, Berlin
Minipiles
Lord Hill’s Bridge, London

20
Asia HighlightsStrong performance from ground improvement in Singapore
Difficult year for Resource Piling with tight pricing- order book and market activity now up
Small but profitable contribution from Vietnam
Recent award of circa £30m foundation contract for iron ore facility- repeat client, design and construct
Delays on two significant projects in India - now underway- underlying profitability still good
Ground improvement
Power plant, Singapore

21
Australia HighlightsThe “two speed” economy continues- resource and related sectors remain very strong- commercial and infrastructure markets are much weaker
Q1 adversely impacted by flooding in Queensland
Disappointing year for Piling Contractors- action taken to refocus business and cut A$4m of costs
- benefits now being seen in improved results
Other Australian businesses performed better
Keller Australia now has record work in hand, boosted by LNG projects
Dynamic replacement & soil mixing
Newcastle, NSW

22
Australia – Wheatstone
Contract value in excess of A$180m- Keller Australia has good track record on complex projects
Remote location at Onslow, Western Australia
Scope of work 20,000 driven piles for the main onshore facilities
Work requires the collective resources of Keller Australia
Preparatory work underway with production late 2012 to early 2014
Location of Wheatstone project

23
Review of Strategy
•Fundamental review following unprecedented changes in our markets
•After significant cost reductions, still a need to improve performance
•Externally-facilitated review initiated Q2, completed Q4
•Global exercise involving many senior managers from all divisions
•Reaffirmed the Group’s existing strategy and strengths
• Identified a number of business improvement initiatives

Strategy and StrengthsReview reaffirmed the Group’s existing strategy
• To extend our global leadership in specialist ground engineering
Strengths of the Group
•Market positioning– global footprint– clear market leader in US, Australia and Poland– growing in developing markets
•Technical leader and excellence in design– widest range of techniques– leading positions in ground improvement and grouting
•Well-balanced business– strong local presence– most contracts short duration and sub £500k; major project capability– across the construction spectrum
• Good track record of acquisitions
24

Business Improvement Initiatives
25
Group wide initiatives• Increase revenue and profit from large projects
– growing market segment– leverage experience and knowledge in the Group– further develop large project expertise and global client management
•Reinforce risk management– new central, independent technical team– global roll-out of refreshed risk management procedures
•Accelerate technology transfer through more proactive management
•New role of Director Technology & Best Practice
Regional initiatives, e.g:•Sector focus on US transmission lines; expansion in Brazil, Canada, India

Case Study – Vale Project
• £30m contract in Malaysia awarded in February
•Ground improvement market leader in Malaysia
•Global capabilities exploited– technical support from Europe
– operational input from Australia
– equipment transfers from Europe /Middle East
•Re-design capability and range of techniques a competitive advantage
•Repeat client from Brazil, demonstrates benefits of global footprint
26

27
Outlook
•Recent data indicate that US construction markets may be turning the corner
•European construction markets will remain very difficult– significant economic uncertainty– slow start to the year
•Asia and Australian businesses well positioned for a better year
• January order book up 40% on previous year– up 10% ex 2013/14 work
•Overall, 2012 expected to be a year of progress

Appendix

Introduction to Keller
• The world’s largest independent ground engineering contractor– ground engineering is a small, niche sub-sector of construction– growing faster than construction, reflecting:
− more pressure to build on brownfield and marginal land− more ambitious development and infrastructure projects
• Unrivalled geographic coverage, working in over 30 countries– clear market leader in US, Australia and Poland– well established businesses in most West European countries– growing in developing markets
• Generally work as a subcontractor for main contractors
• Typical contracts are– short duration and less than £500k– across the construction spectrum
29

30
Ground Engineering Worldwide
Activities% of 2011 revenue Regions of use Applications
Piling 38% NA/UKEastern EuropeMiddle East Asia & Australia
Foundation supportEarth retention
Ground improvement 26% North AmericaEMEAAsiaAustralia
Foundation supportSeismic risk protection
Speciality Grouting 15% North AmericaEuropeAsiaAustralia
Control of building settlementGroundwater control
Anchors, Nails, Minipiles 15% North AmericaEuropeAsia
Excavation supportSlope protectionUnderpinning
Post-tension concrete 6% North America Slab-on-grade foundationsHigh rise structures

31
History of Keller
1958 1960’s 1974 1984 1990 1994 2001 2002 2006 NOW
Expansion into a UK national
piling & ground improvement
company
Est. 1958Ground test
services
Acquired Johann Keller
in Germany marking
international expansion
Management buyout from
GKN plcAcquired
McKinney (US)
Acquired 51% of Keller-Terra
(Spain)Acquired Hayward Baker
(US)
Acquired Case (US)
IPO on London Stock
Exchange
Acquired Suncoast
(US)
Acquired Phi (UK)
Acquired Piling Contractors (Australia)
Acquired Anderson
Drilling (US)
>6,000 employees
Offices in >30 countries
Revenue >£1bn
2007
Acquired Systems
Geotechnique (UK)
1860
Acquired HJ Foundation (US)
Only larger and most recent acquisitions shown
2008
Acquired Olden (US)
Acquired Boreta (Czech Rep)
2010
Acquired Waterway
Constructions(Australia)
2009
Acquired Resource
Piling(Singapore)
32
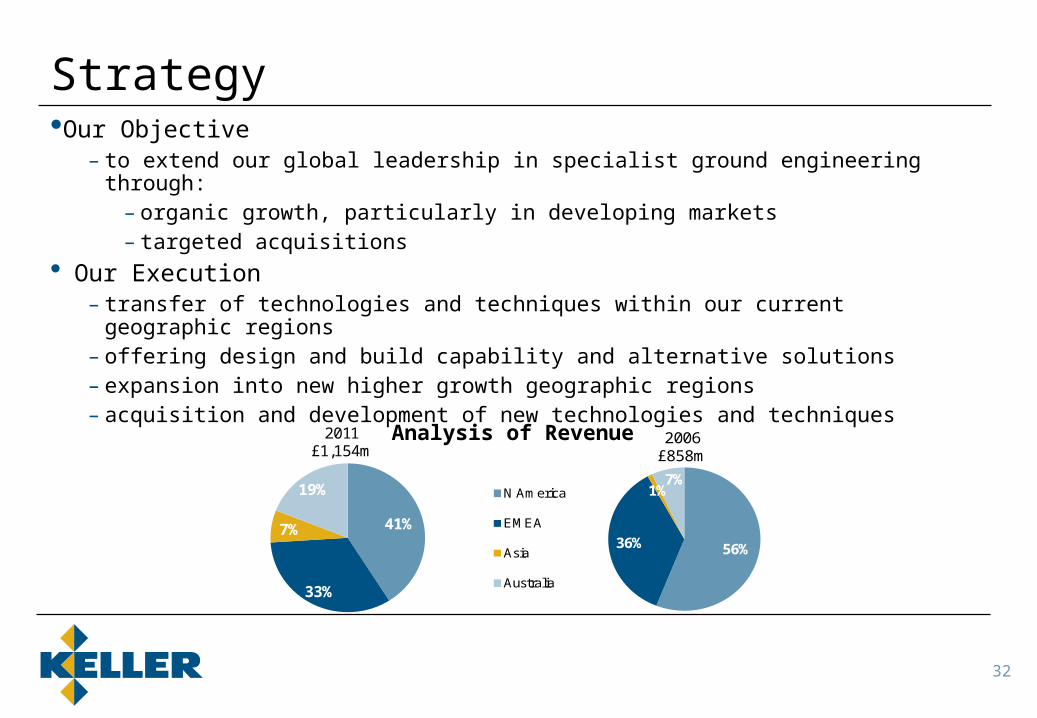
Strategy•Our Objective
– to extend our global leadership in specialist ground engineering through:– organic growth, particularly in developing markets– targeted acquisitions
• Our Execution– transfer of technologies and techniques within our current geographic regions– offering design and build capability and alternative solutions– expansion into new higher growth geographic regions– acquisition and development of new technologies and techniques
41%
33%
7%
19%
2011£1,154m
Analysis of Revenue
56%36%
1%7%
2006£858m
N America
EMEA
Asia
Australia

33
US Geographic Coverage
AndersonCaseMcKinneyHayward BakerFLORIDA
ALABAMA
MARYLAND
CALIFORNIA
COLORADO
CONNECTICUT
DELAWARE
ARKANSAS
GEORGIA
IDAHO
IOWA
KANSAS KENTUCKY
LOUISIANA
MAINE
MASSACHUSETTS
MICHIGAN
MINNESOTA
MISSISSIPPI
MISSOURI
MONTANA
NEBRASKA
NEVADA
NEW HAMPSHIRE
NEW YORK
NORTHDAKOTA
OHIO
OKLAHOMA
OREGON
PENNSYLVANIA
RHODE ISLAND
SOUTHCAROLINA
SOUTHDAKOTA
TENNESSEE
TEXAS
UTAH
VERMONT
VIRGINIA
WASHINGTON
WASHINGTON D.C.
WISCONSIN
WYOMING
INDIANAILLINOIS
NEW MEXICO
MEXICO
ARIZONA
NORTHCAROLINA
NEW JERSEY
WESTVIRGINIA
SuncoastHJ Foundation

34
Europe Geographic Coverage
FRANCE
NETHERLANDS
GERMANY POLAND
CZECH REP.
SLOVAKIA
SWITZERLANDHUNGARY
CROATIA
PORTUGAL
SPAIN
SWEDEN
ITALY
AUSTRIA
UK
SLOVENIA
UKRAINE
ROMANIA
SERBIA
HUNGARY

35
2002 2003 2004 2005 2006 2007 2008 2009 2010 20110
200
400
600
800
1000
1200
1400
North America EMEA Asia Australia
Ten Year Track Record
Revenue 2002 – 2011(Continuing Operations)
1,068.9
447.5505.4
526.2
685.2
857.7
955.1
1,196.6
1,037.9
£m
1,154.3

36
2002 2003 2004 2005 2006 2007 2008 2009 2010 2011
-20
0
20
40
60
80
100
120
140
Head Office Costs North America EMEA Asia Australia
Ten Year Track Record
Operating Profit 2002 – 2011(Continuing Operations)
31.533.8 * 33.4
55.3
107.4
*pre-exceptionals
89.3
119.4
77.3
£m
43.3
28.9

37
02 03 04 05 06 07 08 09 10 11
-2%
0%
2%
4%
6%
8%
10%
12%
Operating margin* Operating margin at historic low
Dividend increased every year since 1994 flotation until 2011
Dividend per share (pence)
Financial Performance
*from continuing operations
02 03 04 05 06 07 08 09 10 110.00
0.05
0.10
0.15
0.20
0.25