keller group plc full year results 2016/media/files/k/keller-v2/investor/presentations/...keller...
TRANSCRIPT
Keller Group plc
Full year results 2016
27 February 2017
Caspian regionNorth East Europe Business Unit
22
Agenda
• Summary and
business update
• Financial results
• Strategic progress
• Outlook
• Questions and answers
Summary and
business update
Entergy power project, Louisiana, US
Hayward BakerWick Drains Division
44
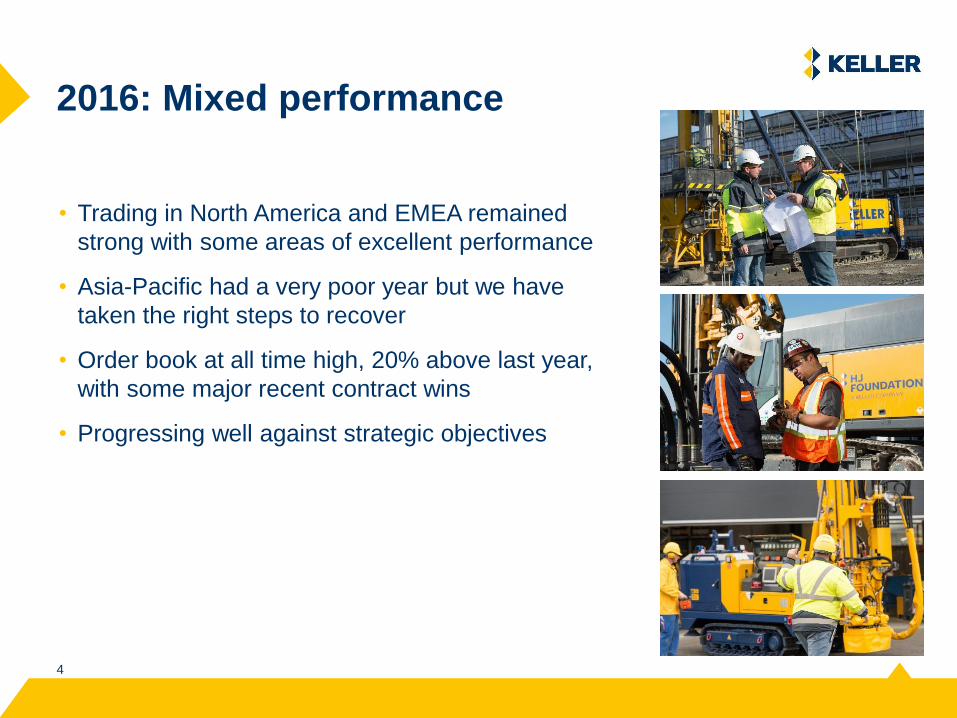
2016: Mixed performance
• Trading in North America and EMEA remained
strong with some areas of excellent performance
• Asia-Pacific had a very poor year but we have
taken the right steps to recover
• Order book at all time high, 20% above last year,
with some major recent contract wins
• Progressing well against strategic objectives
55
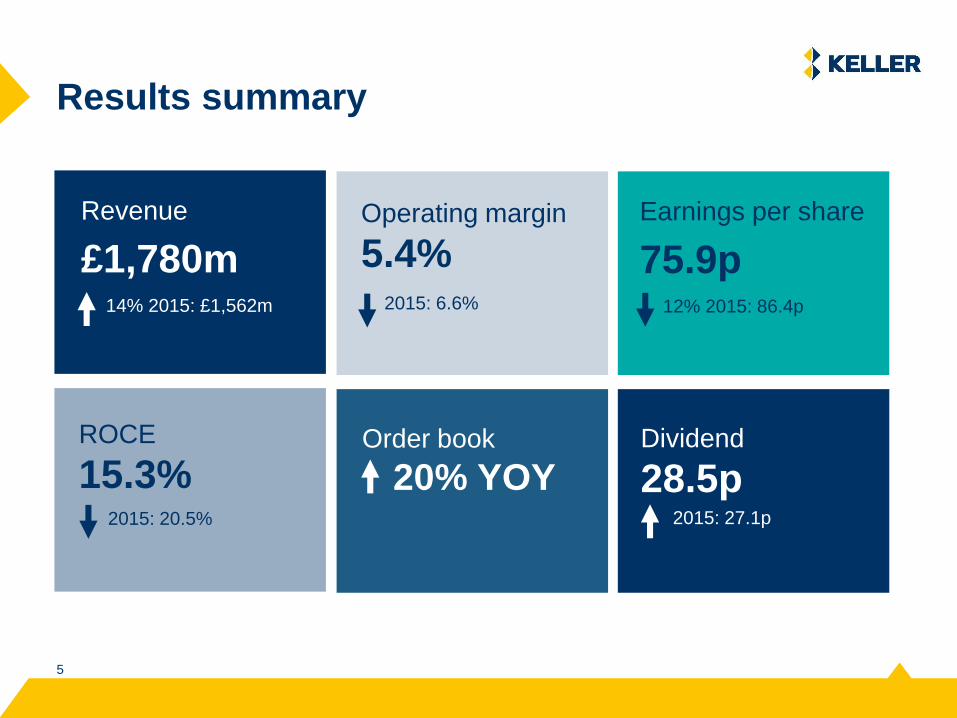
Results summary
Revenue
£1,780m
Operating margin
5.4%
Dividend
28.5p Order book
20% YOY
ROCE
15.3%
14% 2015: £1,562m 2015: 6.6%
2015: 27.1p
Earnings per share
75.9p12% 2015: 86.4p
2015: 20.5%

66
Markets in 2016
Asia-PacificEurope, Middle East
and AfricaNorth America
• Steady growth in US
• Total construction spend
up 4% on 2015
• Canada difficult,
especially Western
• Steady growth in Northern and Western Europe
• Southern Europe steady
with some weak spots
• Middle East steady
• South Africa challenging
• Brazil difficult
• South East Asia difficult, especially Singapore, heavy foundation demand and ground improvement margins
• Australia difficult
• Some pricing down 20% year-on-year
• India continuing to grow
77
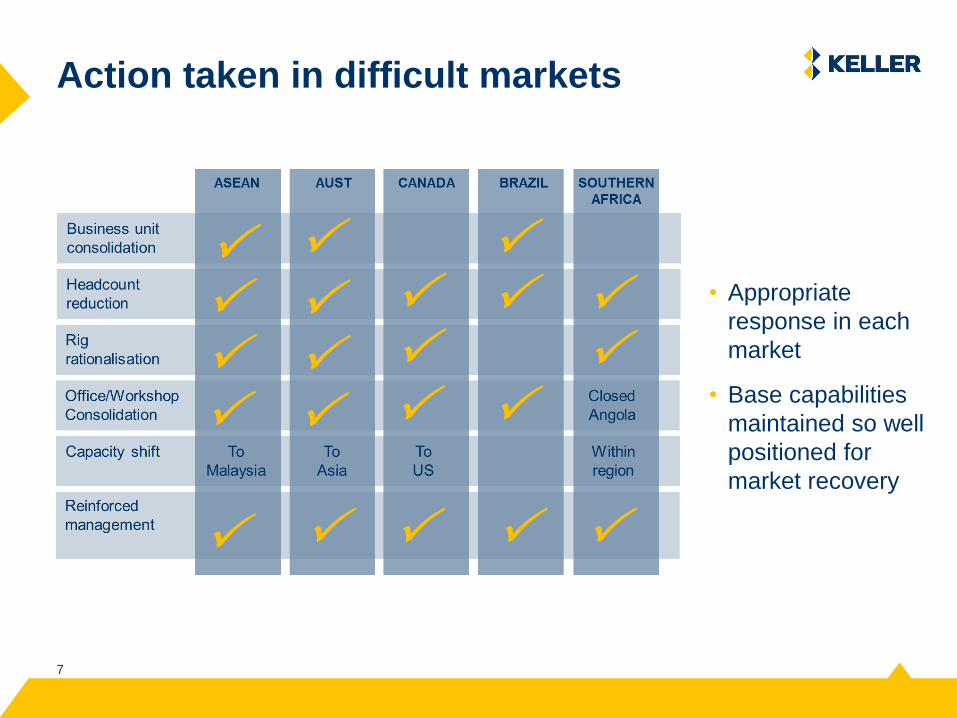
Action taken in difficult markets
• Appropriate
response in each
market
• Base capabilities
maintained so well
positioned for
market recovery
88
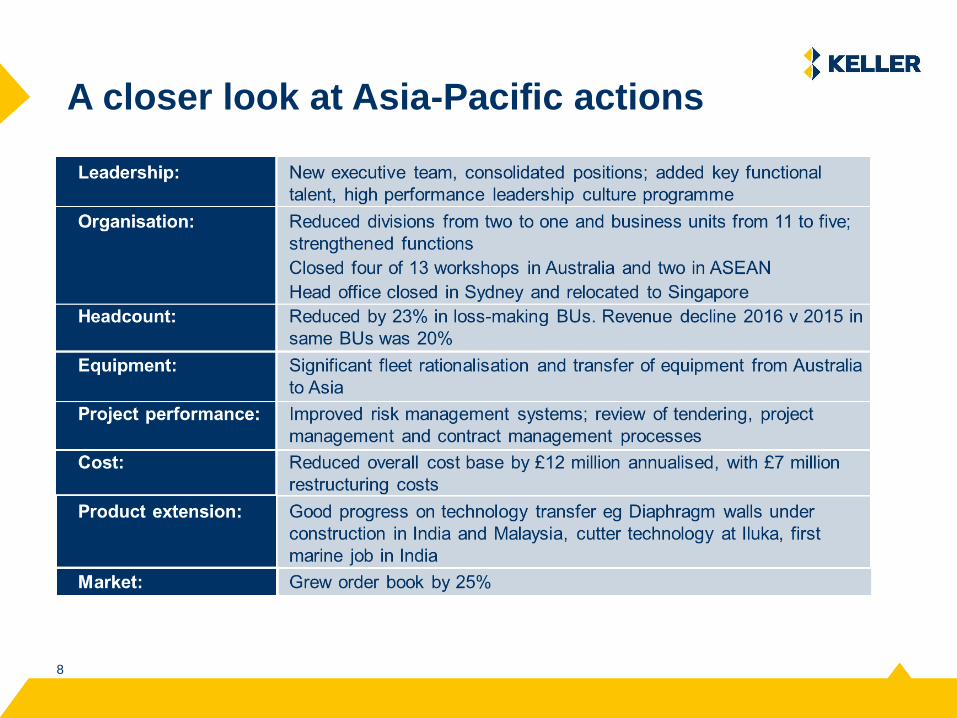
A closer look at Asia-Pacific actions
Financial results
Ritz Carlton residences, Miami
HJ Foundation

1010
Group income statement*
Record revenue
- 3% up on a constant
currency basis
£m 2016 2015 %
Change
Revenue 1,780.0 1,562.4 +14%
EBITDA 158.6 155.5 +2%
Operating profit 95.3 103.4 -8%
Net finance cost (10.2) (7.7)
Profit before tax 85.1 95.7 -11%
Tax (29.8) (33.0)
Profit after tax 55.3 62.7 -12%
EBITDA % 8.9% 10.0% -1.1bps
Operating profit % 5.4% 6.6% -1.2bps
Effective tax rate 35%
(2015: 34.5%)
Strong performances from
North America and EMEA
- Offset by APAC loss
* Before non-underlying items
1111
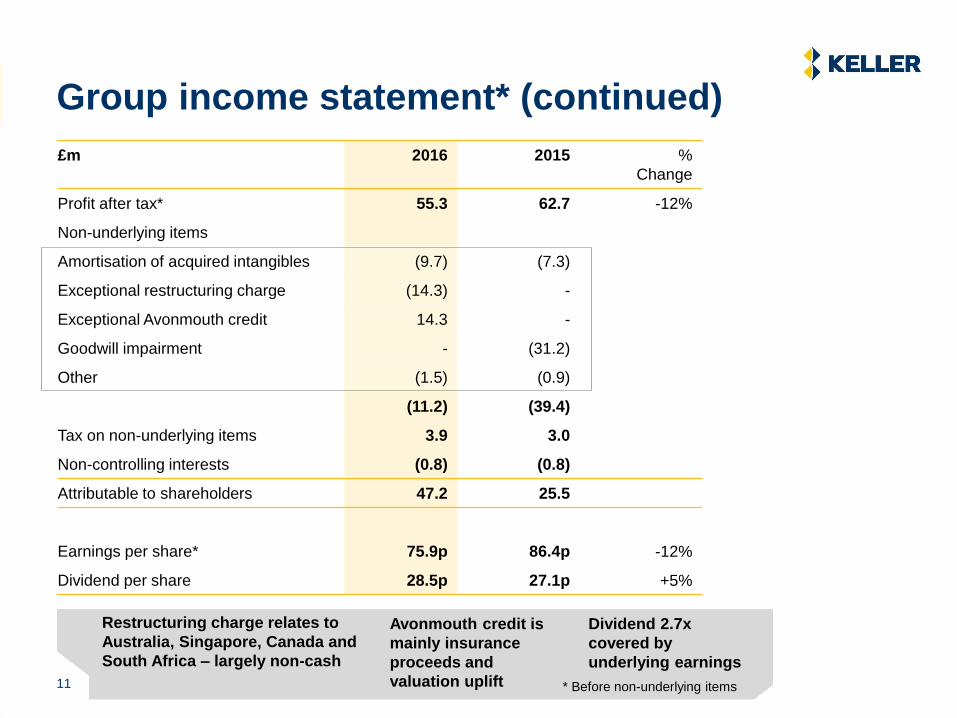
Group income statement* (continued)
£m 2016 2015 %
Change
Profit after tax* 55.3 62.7 -12%
Non-underlying items
Amortisation of acquired intangibles (9.7) (7.3)
Exceptional restructuring charge (14.3) -
Exceptional Avonmouth credit 14.3 -
Goodwill impairment - (31.2)
Other (1.5) (0.9)
(11.2) (39.4)
Tax on non-underlying items 3.9 3.0
Non-controlling interests (0.8) (0.8)
Attributable to shareholders 47.2 25.5
Earnings per share* 75.9p 86.4p -12%
Dividend per share 28.5p 27.1p +5%
Restructuring charge relates to
Australia, Singapore, Canada and
South Africa – largely non-cash
* Before non-underlying items
Avonmouth credit is
mainly insurance
proceeds and
valuation uplift
Dividend 2.7x
covered by
underlying earnings
11
1212
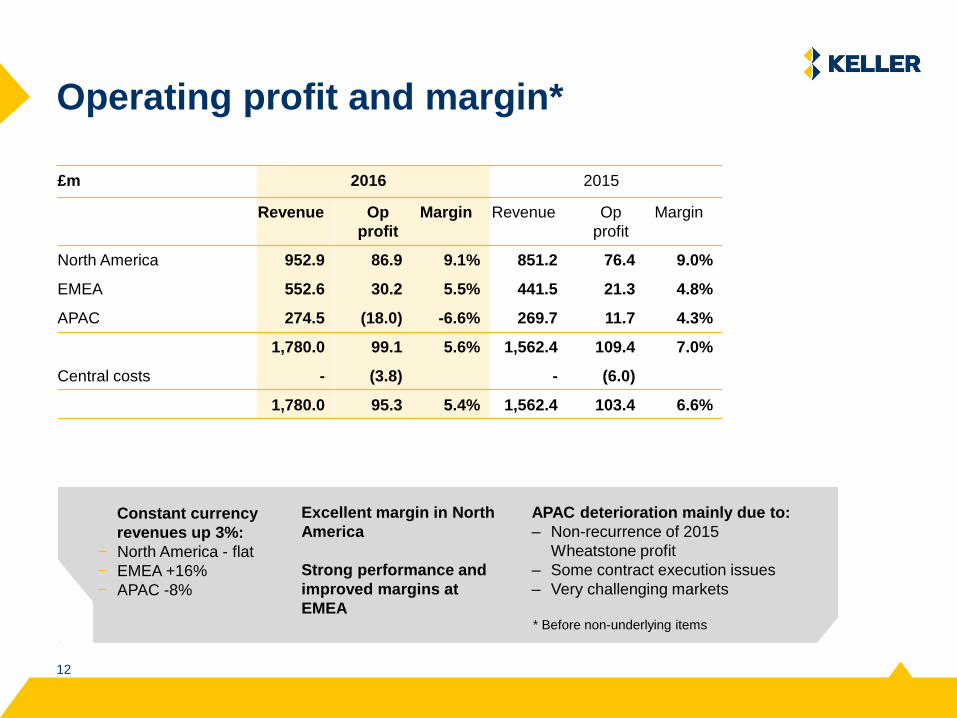
Operating profit and margin*
Constant currency
revenues up 3%:
− North America - flat
− EMEA +16%
− APAC -8%
£m 2016 2015
Revenue Op
profit
Margin Revenue Op
profit
Margin
North America 952.9 86.9 9.1% 851.2 76.4 9.0%
EMEA 552.6 30.2 5.5% 441.5 21.3 4.8%
APAC 274.5 (18.0) -6.6% 269.7 11.7 4.3%
1,780.0 99.1 5.6% 1,562.4 109.4 7.0%
Central costs - (3.8) - (6.0)
1,780.0 95.3 5.4% 1,562.4 103.4 6.6%
* Before non-underlying items
Excellent margin in North
America
Strong performance and
improved margins at
EMEA
APAC deterioration mainly due to:
– Non-recurrence of 2015
Wheatstone profit
– Some contract execution issues
– Very challenging markets
1313
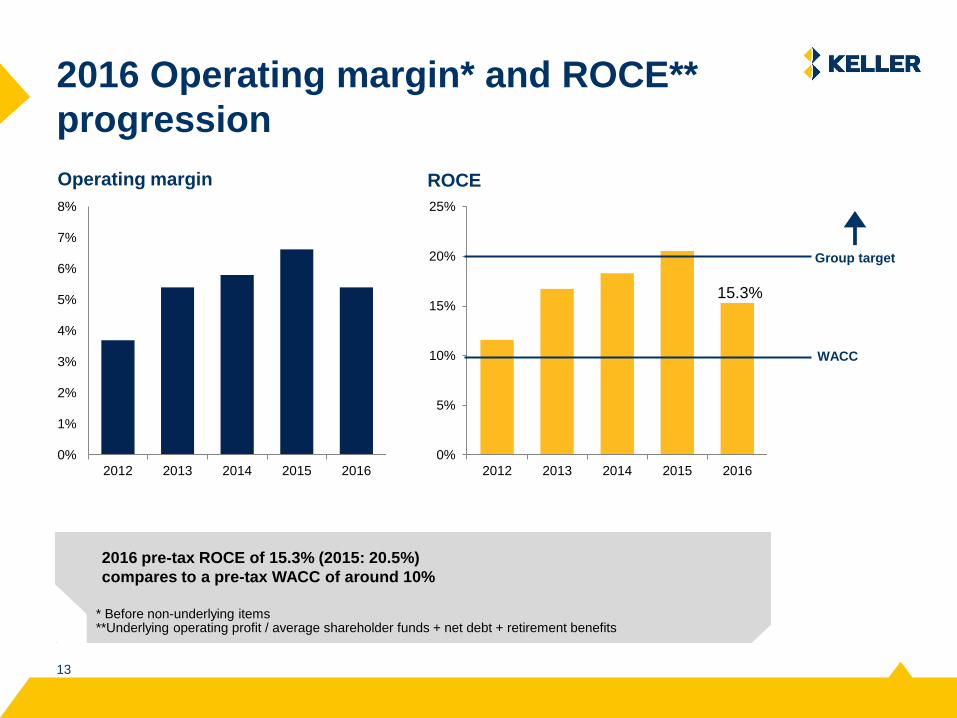
2016 Operating margin* and ROCE**
progression
0%
1%
2%
3%
4%
5%
6%
7%
8%
2012 2013 2014 2015 2016
**Underlying operating profit / average shareholder funds + net debt + retirement benefits
0%
5%
10%
15%
20%
25%
2012 2013 2014 2015 2016
Operating margin ROCE
* Before non-underlying items
2016 pre-tax ROCE of 15.3% (2015: 20.5%)
compares to a pre-tax WACC of around 10%
Group target
WACC
15.3%
1414
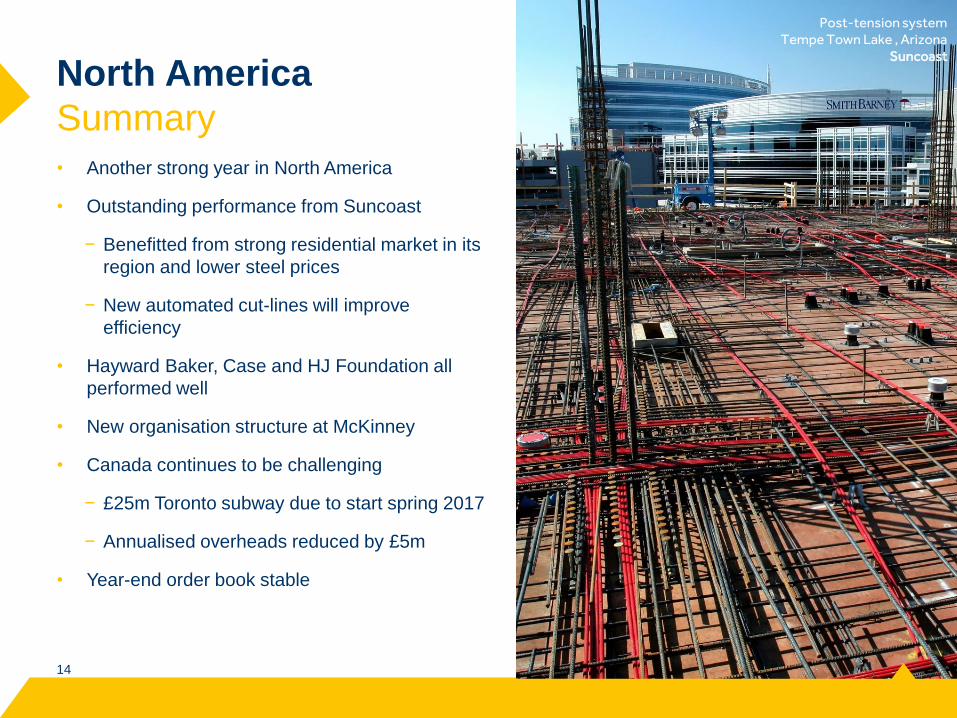
North America
Summary
• Another strong year in North America
• Outstanding performance from Suncoast
− Benefitted from strong residential market in its
region and lower steel prices
− New automated cut-lines will improve
efficiency
• Hayward Baker, Case and HJ Foundation all
performed well
• New organisation structure at McKinney
• Canada continues to be challenging
− £25m Toronto subway due to start spring 2017
− Annualised overheads reduced by £5m
• Year-end order book stable
Post-tension systemTempe Town Lake , Arizona
Suncoast
1515
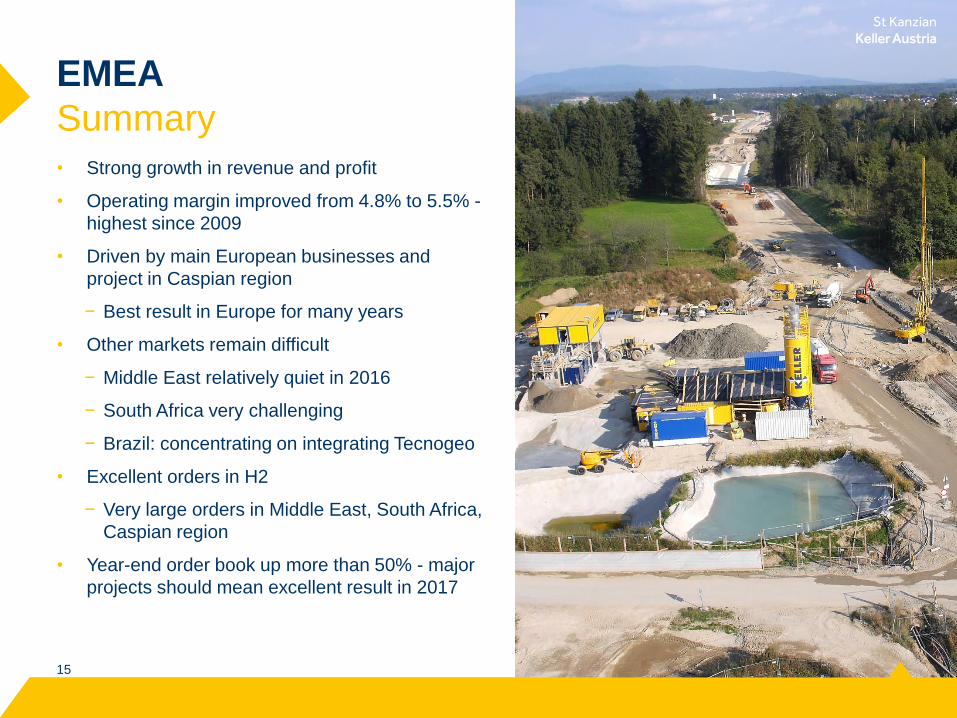
EMEA
Summary• Strong growth in revenue and profit
• Operating margin improved from 4.8% to 5.5% -
highest since 2009
• Driven by main European businesses and
project in Caspian region
− Best result in Europe for many years
• Other markets remain difficult
− Middle East relatively quiet in 2016
− South Africa very challenging
− Brazil: concentrating on integrating Tecnogeo
• Excellent orders in H2
− Very large orders in Middle East, South Africa,
Caspian region
• Year-end order book up more than 50% - major
projects should mean excellent result in 2017
St KanzianKeller Austria
1616
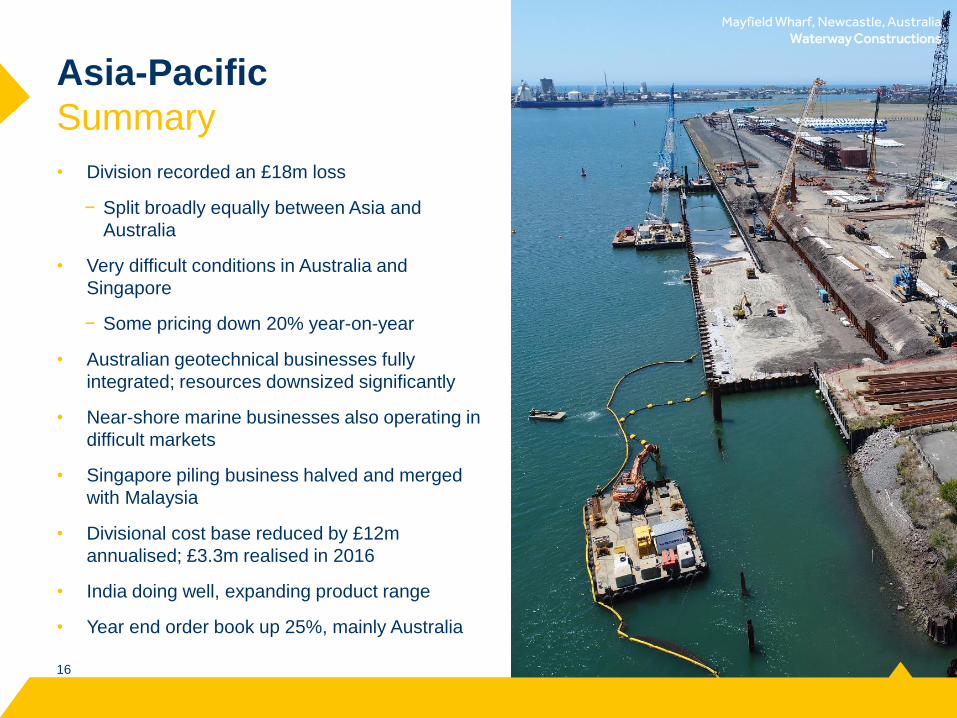
Asia-Pacific
Summary
16
• Division recorded an £18m loss
− Split broadly equally between Asia and
Australia
• Very difficult conditions in Australia and
Singapore
− Some pricing down 20% year-on-year
• Australian geotechnical businesses fully
integrated; resources downsized significantly
• Near-shore marine businesses also operating in
difficult markets
• Singapore piling business halved and merged
with Malaysia
• Divisional cost base reduced by £12m
annualised; £3.3m realised in 2016
• India doing well, expanding product range
• Year end order book up 25%, mainly Australia
Mayfield Wharf, Newcastle, AustraliaWaterway Constructions
1717
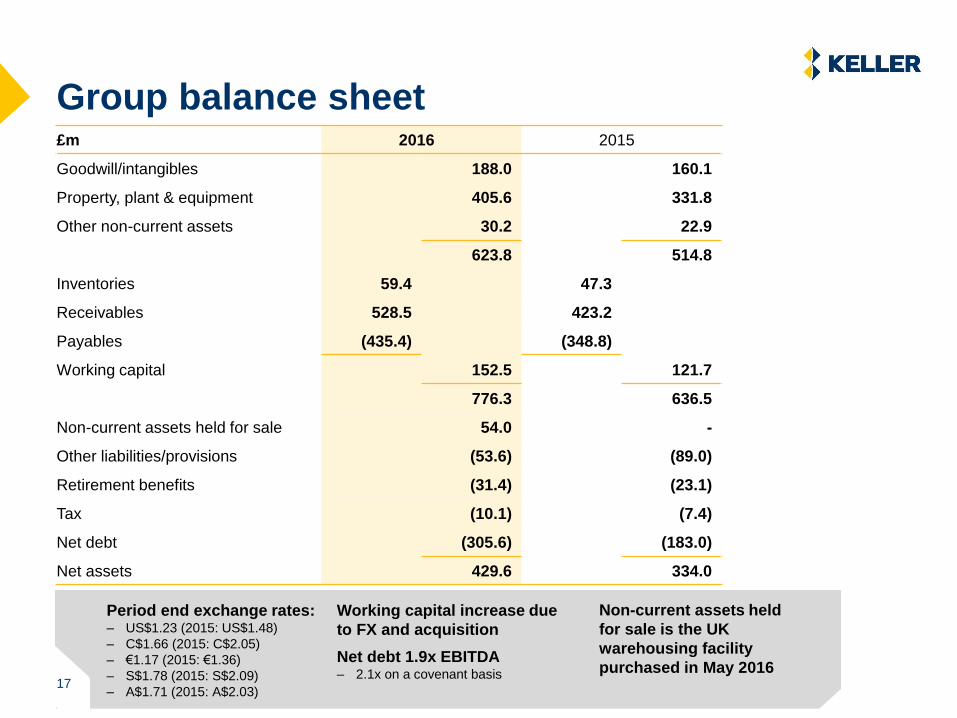
Group balance sheet£m 2016 2015
Goodwill/intangibles 188.0 160.1
Property, plant & equipment 405.6 331.8
Other non-current assets 30.2 22.9
623.8 514.8
Inventories 59.4 47.3
Receivables 528.5 423.2
Payables (435.4) (348.8)
Working capital 152.5 121.7
776.3 636.5
Non-current assets held for sale 54.0 -
Other liabilities/provisions (53.6) (89.0)
Retirement benefits (31.4) (23.1)
Tax (10.1) (7.4)
Net debt (305.6) (183.0)
Net assets 429.6 334.0
Period end exchange rates:– US$1.23 (2015: US$1.48)
– C$1.66 (2015: C$2.05)
– €1.17 (2015: €1.36)
– S$1.78 (2015: S$2.09)
– A$1.71 (2015: A$2.03)
Working capital increase due
to FX and acquisition
Net debt 1.9x EBITDA– 2.1x on a covenant basis
Non-current assets held
for sale is the UK
warehousing facility
purchased in May 201617
1818
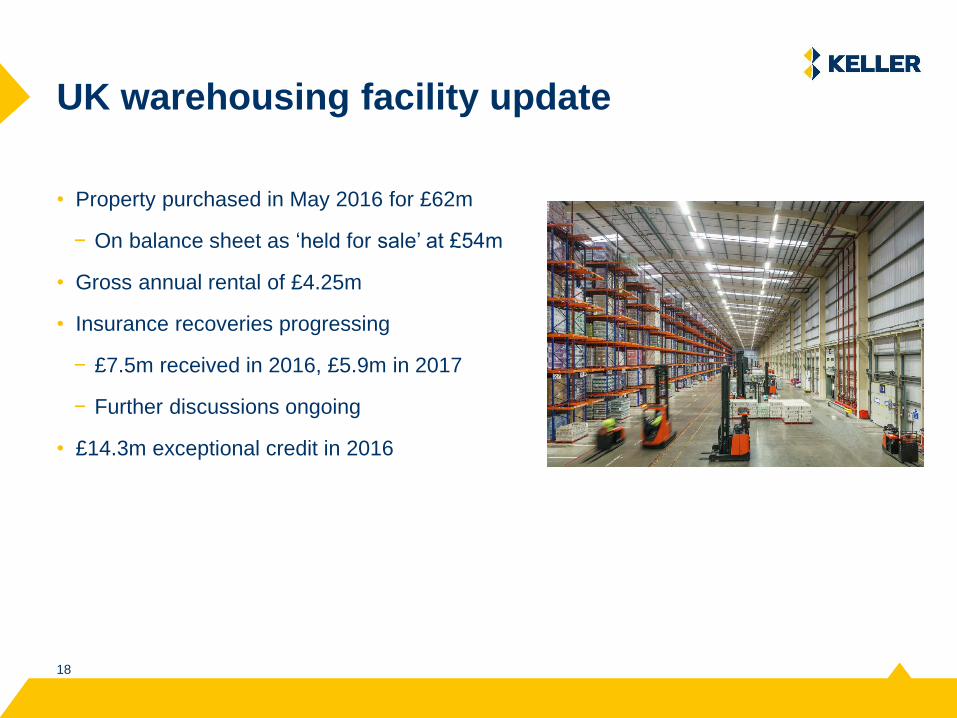
UK warehousing facility update
• Property purchased in May 2016 for £62m
− On balance sheet as ‘held for sale’ at £54m
• Gross annual rental of £4.25m
• Insurance recoveries progressing
− £7.5m received in 2016, £5.9m in 2017
− Further discussions ongoing
• £14.3m exceptional credit in 2016
1919
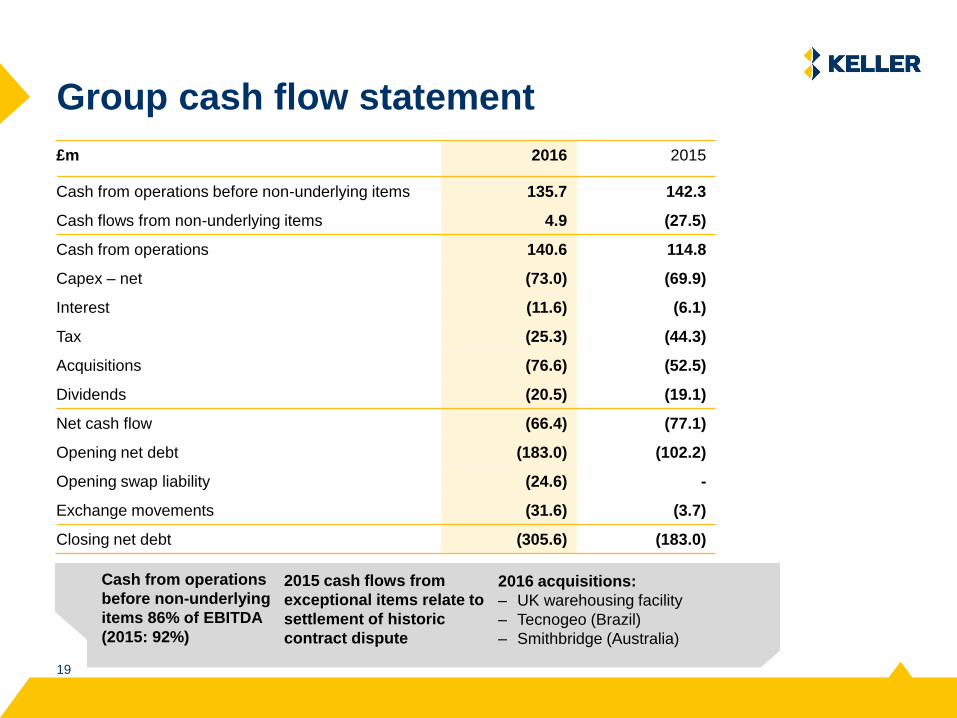
Group cash flow statement
Cash from operations
before non-underlying
items 86% of EBITDA
(2015: 92%)
£m 2016 2015
Cash from operations before non-underlying items 135.7 142.3
Cash flows from non-underlying items 4.9 (27.5)
Cash from operations 140.6 114.8
Capex – net (73.0) (69.9)
Interest (11.6) (6.1)
Tax (25.3) (44.3)
Acquisitions (76.6) (52.5)
Dividends (20.5) (19.1)
Net cash flow (66.4) (77.1)
Opening net debt (183.0) (102.2)
Opening swap liability (24.6) -
Exchange movements (31.6) (3.7)
Closing net debt (305.6) (183.0)
2016 acquisitions:
– UK warehousing facility
– Tecnogeo (Brazil)
– Smithbridge (Australia)
2015 cash flows from
exceptional items relate to
settlement of historic
contract dispute
2020
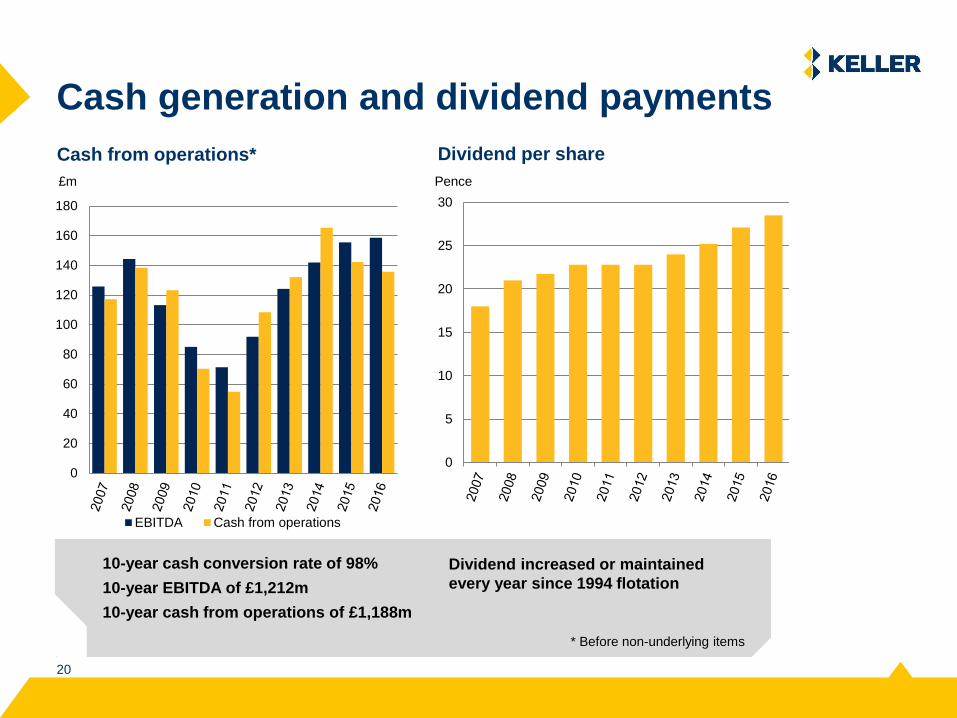
Cash generation and dividend payments
0
5
10
15
20
25
30
Cash from operations* Dividend per share
0
20
40
60
80
100
120
140
160
180
EBITDA Cash from operations
10-year cash conversion rate of 98%
10-year EBITDA of £1,212m
10-year cash from operations of £1,188m
Dividend increased or maintained
every year since 1994 flotation
* Before non-underlying items
£m Pence
Strategic progress
2222
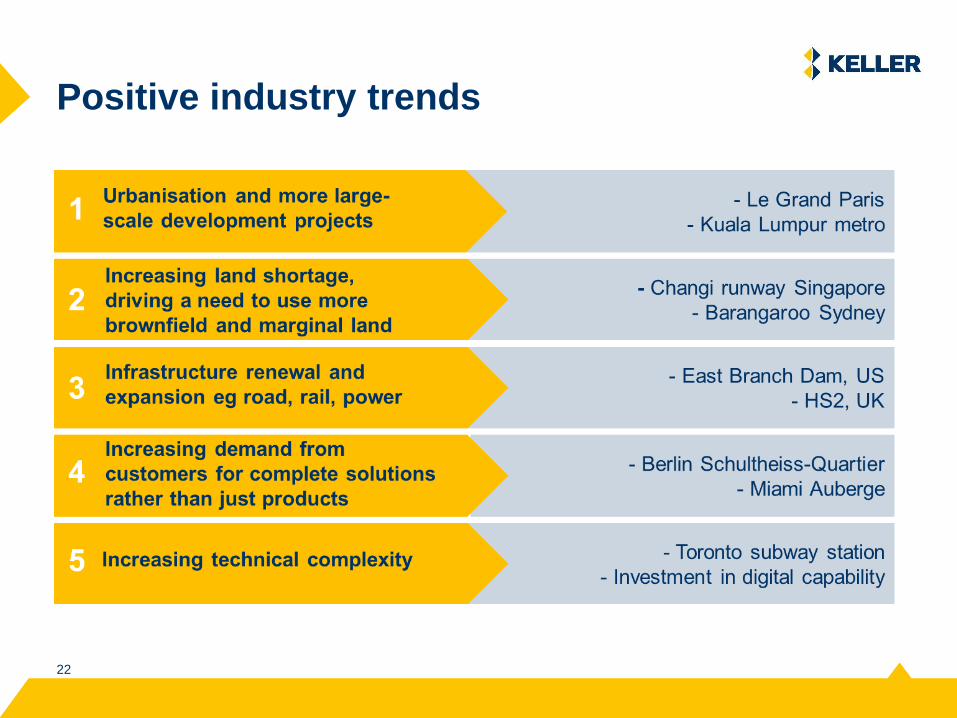
Positive industry trends
2323
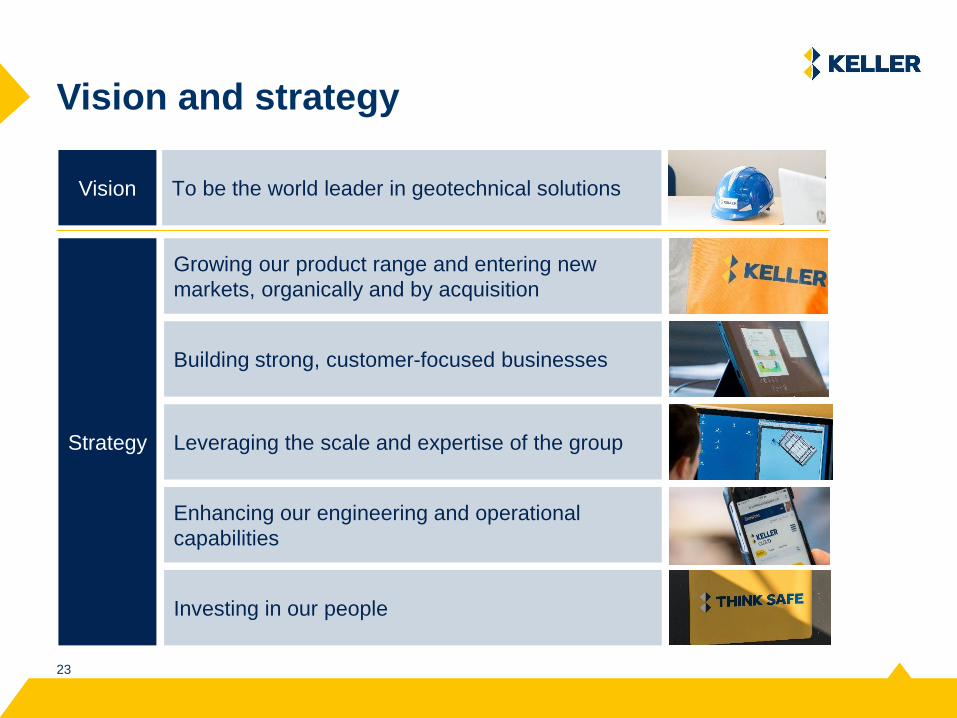
Vision and strategy
Growing our product range and entering new
markets, organically and by acquisition
Building strong, customer-focused businesses
Leveraging the scale and expertise of the group
Enhancing our engineering and operational
capabilities
Investing in our people
Strategy
To be the world leader in geotechnical solutionsVision

2424
Progressing well against strategy
What has been changing?
• Company is more connected and collaborative
• Strategic alignment is much improved
• Our capabilities are expanding
− Larger projects
− Knowledge sharing
− Intra-company benchmarking
− Product technology
• Uncovering much more opportunity
2525
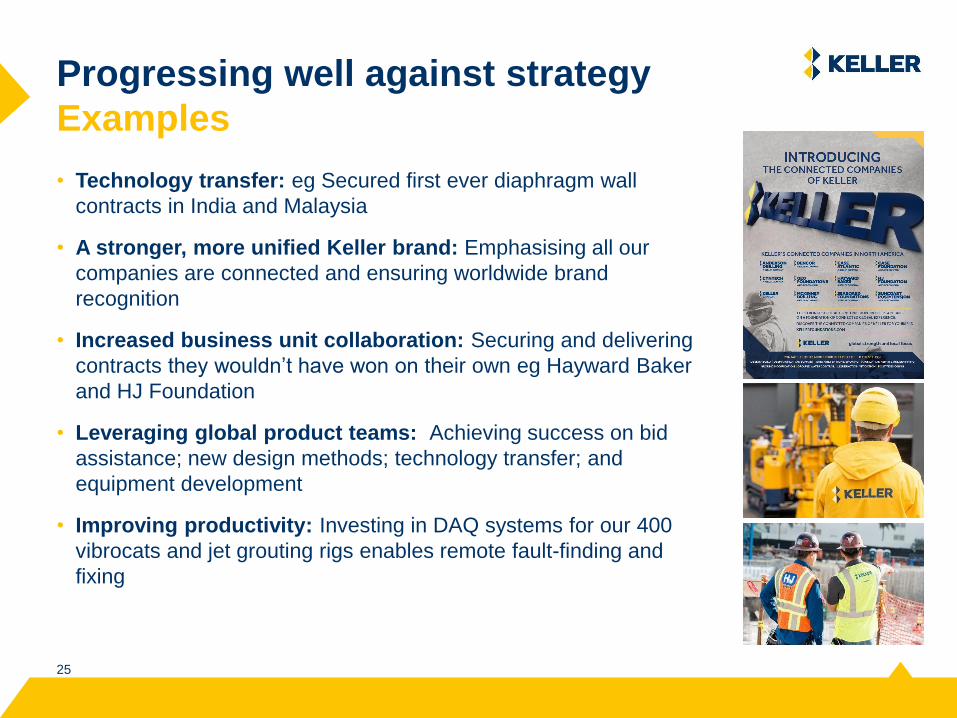
Progressing well against strategy
Examples
• Technology transfer: eg Secured first ever diaphragm wall
contracts in India and Malaysia
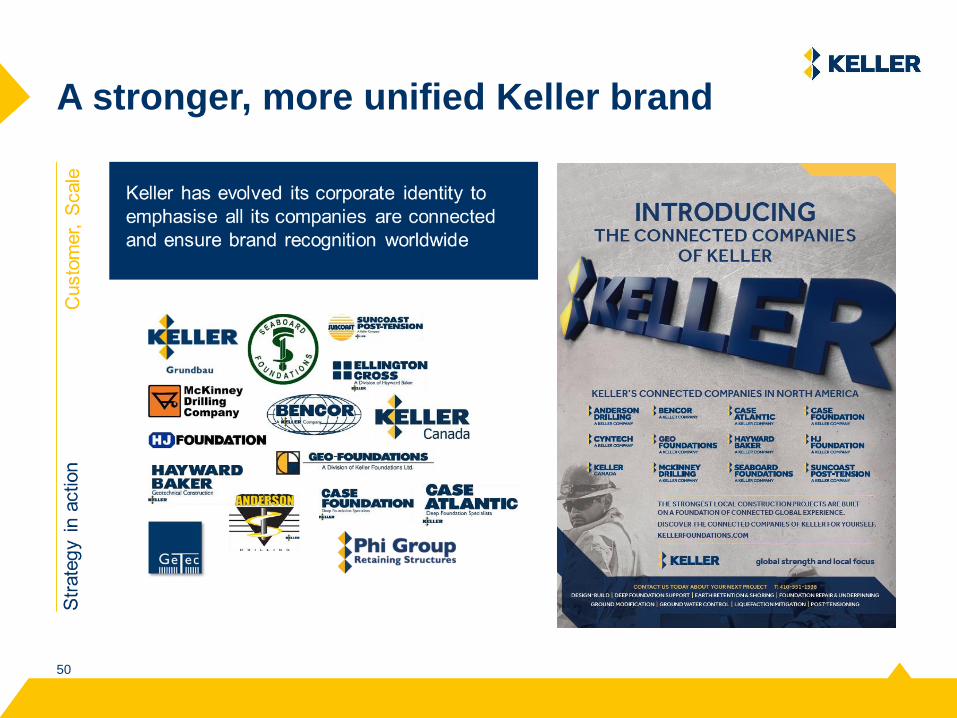
• A stronger, more unified Keller brand: Emphasising all our
companies are connected and ensuring worldwide brand
recognition
• Increased business unit collaboration: Securing and delivering
contracts they wouldn’t have won on their own eg Hayward Baker
and HJ Foundation
• Leveraging global product teams: Achieving success on bid
assistance; new design methods; technology transfer; and
equipment development
• Improving productivity: Investing in DAQ systems for our 400
vibrocats and jet grouting rigs enables remote fault-finding and
fixing
2626
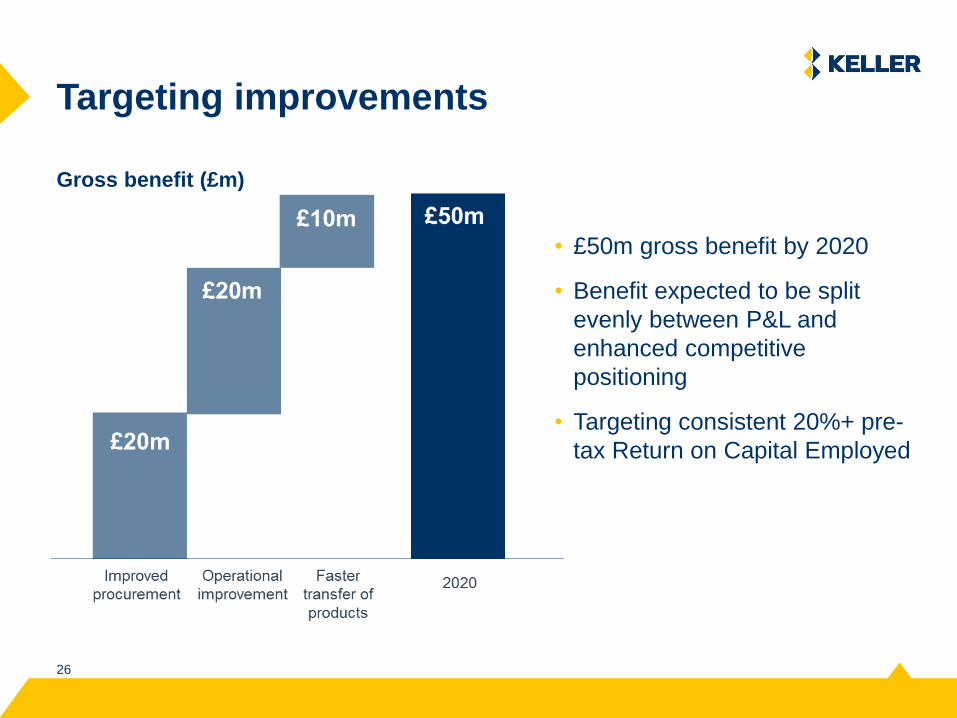
Targeting improvements
• £50m gross benefit by 2020
• Benefit expected to be split
evenly between P&L and
enhanced competitive
positioning
• Targeting consistent 20%+ pre-
tax Return on Capital Employed
Gross benefit (£m)
Outlook
Keller’s in-house equipment manufacturing
Renchen, Germany
2828
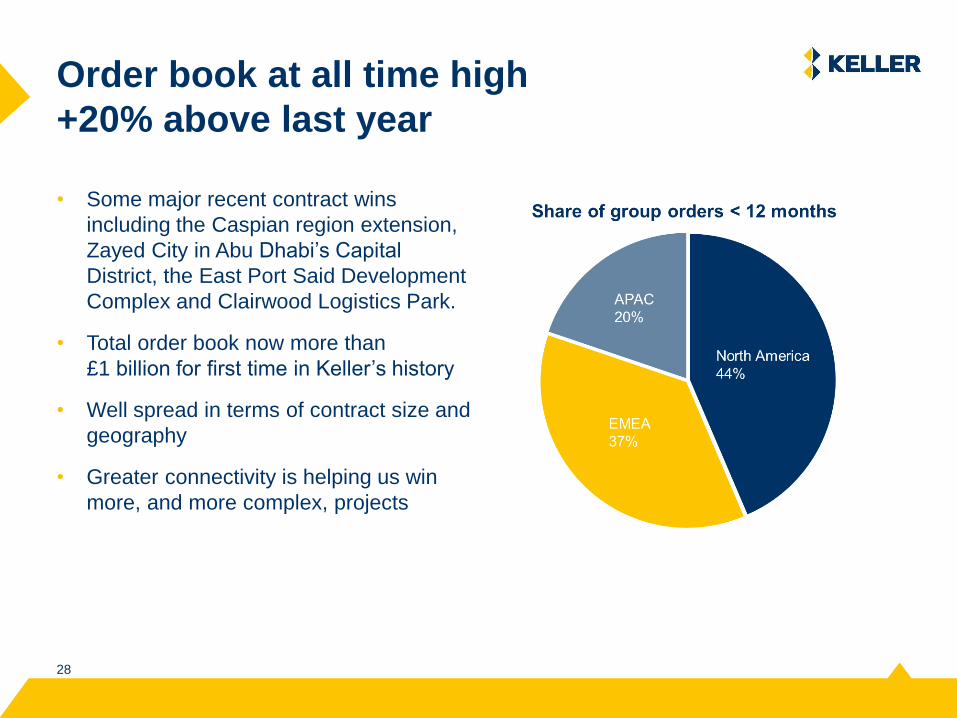
Order book at all time high
+20% above last year
• Some major recent contract wins
including the Caspian region extension,
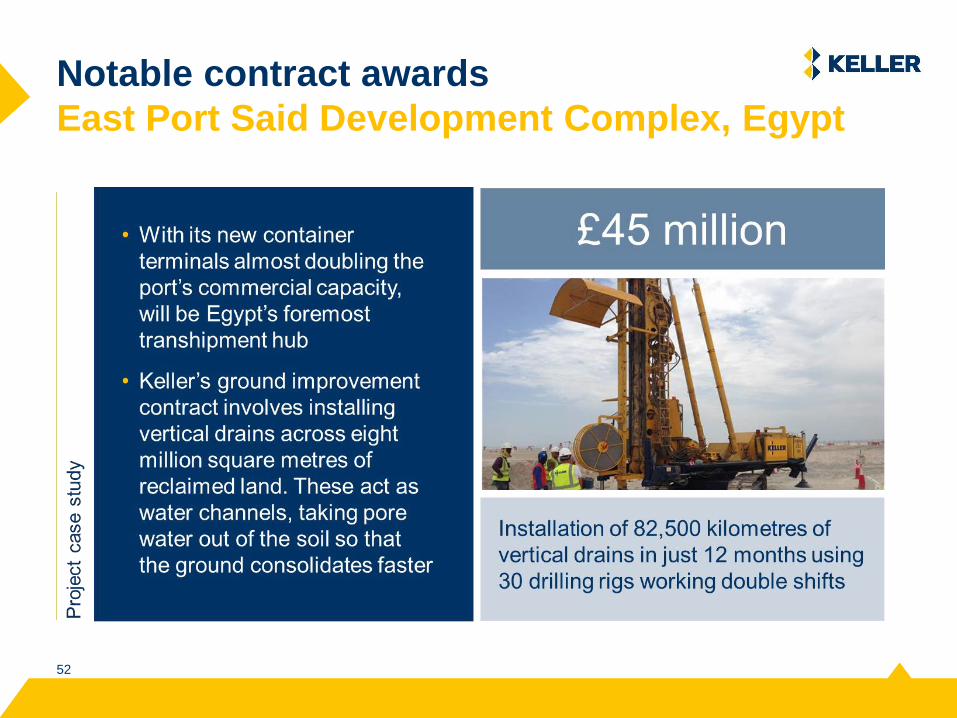
Zayed City in Abu Dhabi’s Capital
District, the East Port Said Development
Complex and Clairwood Logistics Park.
• Total order book now more than
£1 billion for first time in Keller’s history
• Well spread in terms of contract size and
geography
• Greater connectivity is helping us win
more, and more complex, projects
2929
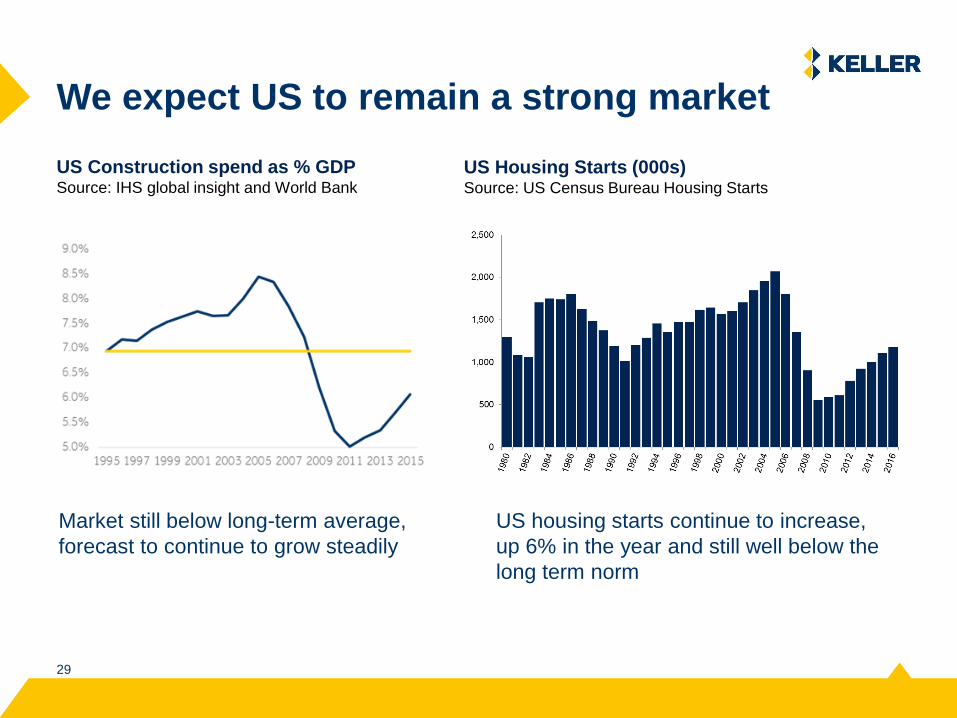
We expect US to remain a strong market
Market still below long-term average,
forecast to continue to grow steadily
US Housing Starts (000s)Source: US Census Bureau Housing Starts
US housing starts continue to increase,
up 6% in the year and still well below the
long term norm
US Construction spend as % GDPSource: IHS global insight and World Bank
3030
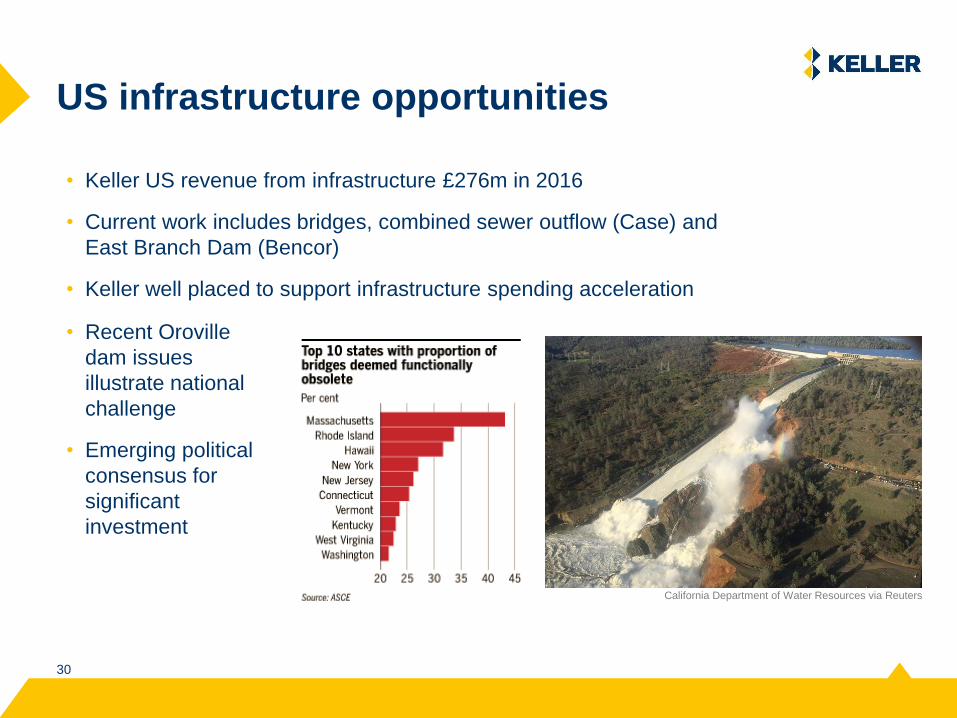
US infrastructure opportunities
• Keller US revenue from infrastructure £276m in 2016
• Current work includes bridges, combined sewer outflow (Case) and
East Branch Dam (Bencor)
• Keller well placed to support infrastructure spending acceleration
California Department of Water Resources via Reuters
• Recent Oroville
dam issues
illustrate national
challenge
• Emerging political
consensus for
significant
investment
3131
Outlook
• Long term drivers of market growth remain robust
− We are well placed to take advantage of any acceleration
in public infrastructure spending
− We remain an active consolidator in a fragmented market
• Our strategy remains clear and consistent and we’re making
good progress
− Significant opportunities to improve the business
− Targeting £50m of gross benefits by 2020
• APAC performance expected to improve in 2017 and return
to profit in 2018
• Steadily growing construction markets in US and Europe,
and management actions, give us confidence for 2017
3232
3333
Cautionary statements
This document contains certain ‘forward looking statements’ with
respect to Keller’s financial condition, results of operations and
business and certain of Keller’s plans and objectives with respect to
these items.
Forward looking statements are sometimes, but not always, identified
by their use of a date in the future or such words as ‘anticipates’,
‘aims’, ‘due’, ‘could’, ‘may’, ‘should’, ‘expects’, ‘believes’, ‘intends’,
‘plans’, ‘potential’, ‘reasonably possible’, ‘targets’, ‘goal’ or ‘estimates’.
By their very nature forward-looking statements are inherently
unpredictable, speculative and involve risk and uncertainty because
they relate to events and depend on circumstances that will occur in
the future.
There are a number of factors that could cause actual results and
developments to differ materially from those expressed or implied by
these forward-looking statements. These factors include, but are not
limited to, changes in the economies and markets in which the Group
operates; changes in the regulatory and competition frameworks in
which the Group operates; the impact of legal or other proceedings
against or which affect the Group; and changes in interest and
exchange rates.
All written or verbal forward looking statements, made in this
document or made subsequently, which are attributable to Keller or
any other member of the Group or persons acting on their behalf are
expressly qualified in their entirety by the factors referred to above.
Keller does not intend to update these forward looking statements.
Nothing in this document should be regarded as a
profits forecast.
This document is not an offer to sell, exchange or transfer any
securities of Keller Group plc or any of its subsidiaries and is not
soliciting an offer to purchase, exchange or transfer such securities in
any jurisdiction. Securities may not be offered, sold or transferred in
the United States absent registration or an applicable exemption from
the registration requirements of the US Securities Act of 1933 (as
amended).
Appendices
3535
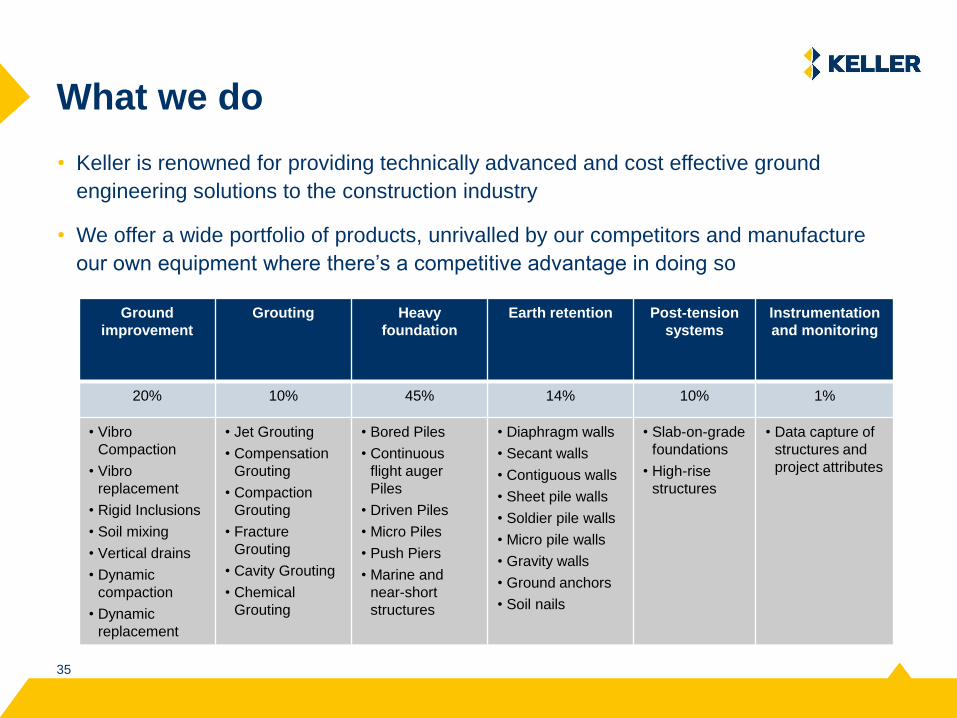
What we do
• Keller is renowned for providing technically advanced and cost effective ground
engineering solutions to the construction industry
• We offer a wide portfolio of products, unrivalled by our competitors and manufacture
our own equipment where there’s a competitive advantage in doing so
Ground
improvement
Grouting Heavy
foundation
Earth retention Post-tension
systems
Instrumentation
and monitoring
20% 10% 45% 14% 10% 1%
• Vibro
Compaction
• Vibro
replacement
• Rigid Inclusions
• Soil mixing
• Vertical drains
• Dynamic
compaction
• Dynamic
replacement
• Jet Grouting
• Compensation
Grouting
• Compaction
Grouting
• Fracture
Grouting
• Cavity Grouting
• Chemical
Grouting
• Bored Piles
• Continuous
flight auger
Piles
• Driven Piles
• Micro Piles
• Push Piers
• Marine and
near-short
structures
• Diaphragm walls
• Secant walls
• Contiguous walls
• Sheet pile walls
• Soldier pile walls
• Micro pile walls
• Gravity walls
• Ground anchors
• Soil nails
• Slab-on-grade
foundations
• High-rise
structures
• Data capture of
structures and
project attributes
3636
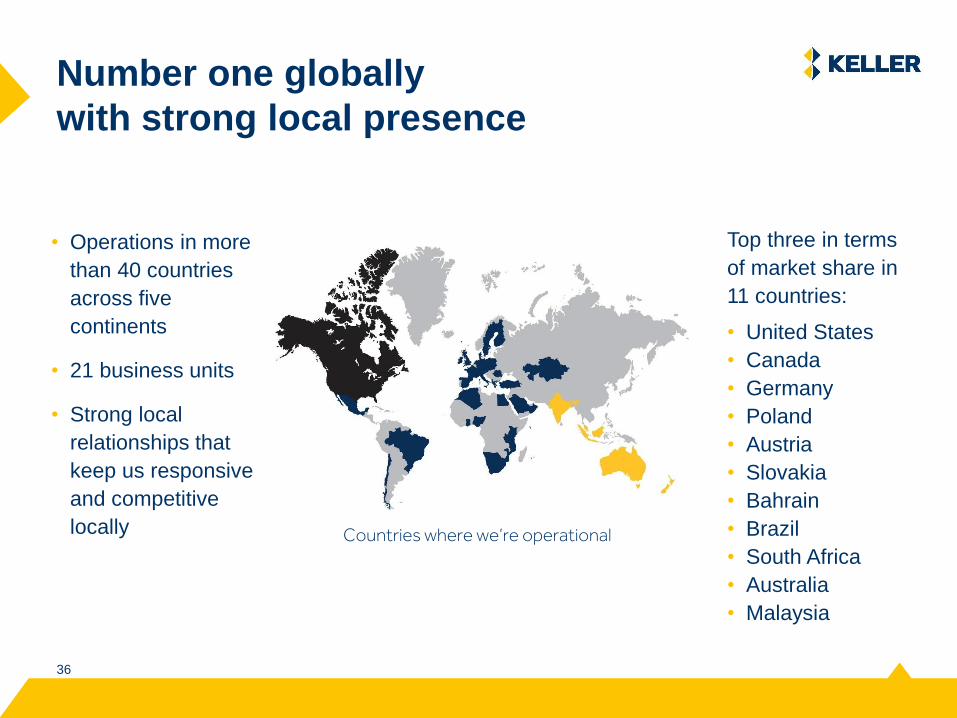
Number one globally
with strong local presence
• Operations in more
than 40 countries
across five
continents
• 21 business units
• Strong local
relationships that
keep us responsive
and competitive
locally Countries where we’re operational
Top three in terms
of market share in
11 countries:
• United States
• Canada
• Germany
• Poland
• Austria
• Slovakia
• Bahrain
• Brazil
• South Africa
• Australia
• Malaysia
3737
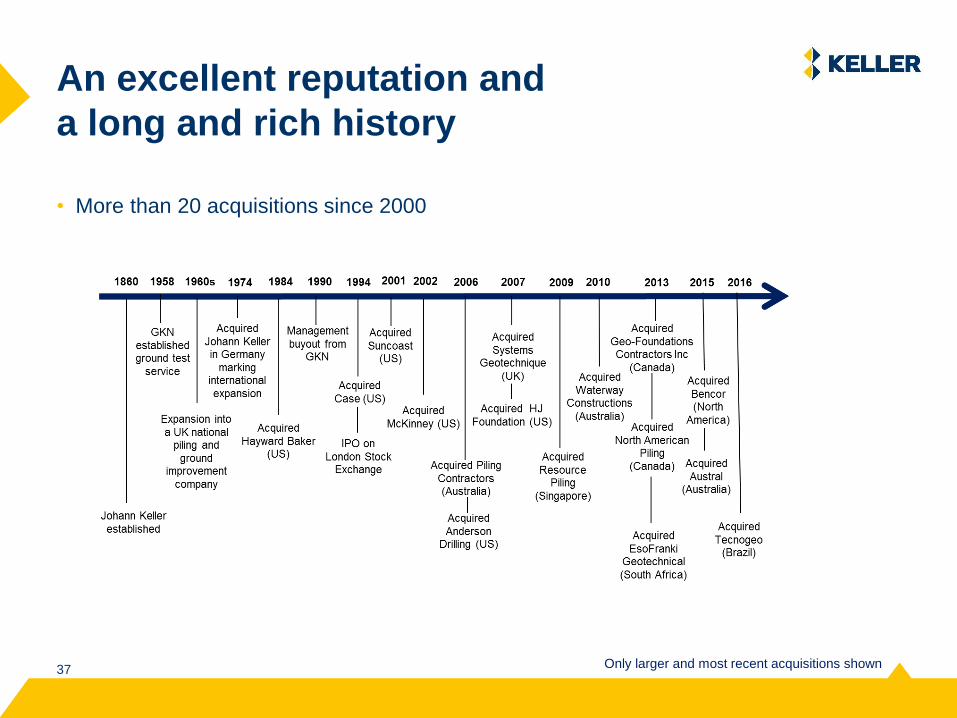
An excellent reputation and
a long and rich history
Only larger and most recent acquisitions shown
• More than 20 acquisitions since 2000
3838
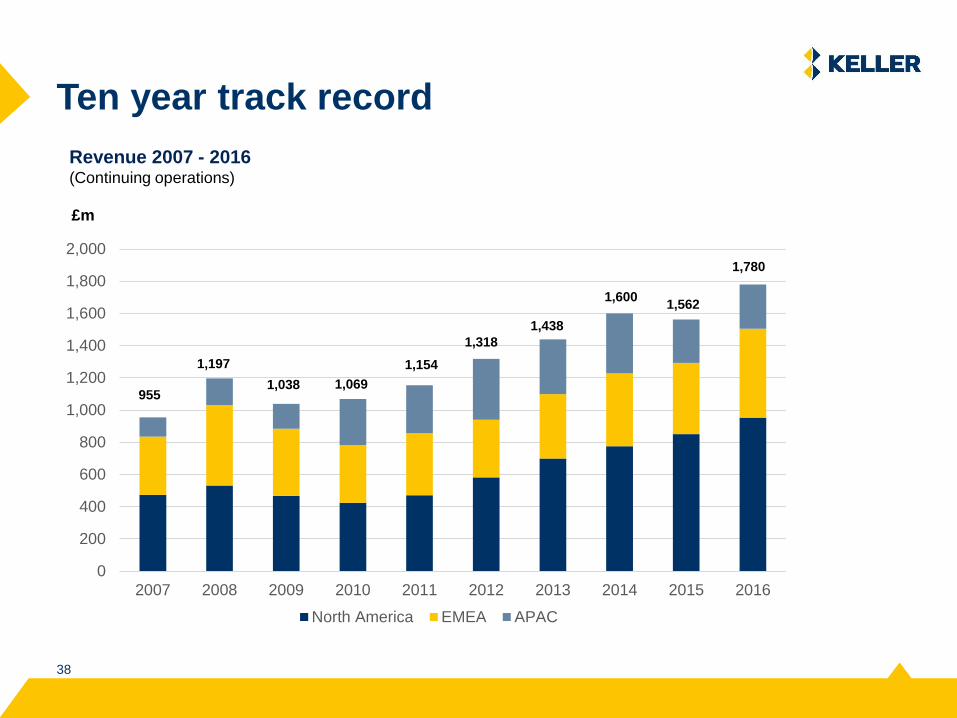
Revenue 2007 - 2016(Continuing operations)
Ten year track record
0
200
400
600
800
1,000
1,200
1,400
1,600
1,800
2,000
2007 2008 2009 2010 2011 2012 2013 2014 2015 2016
North America EMEA APAC
1,197
1,038 1,069
1,438
1,600
1,780
1,562
955
1,154
1,318
£m
3939
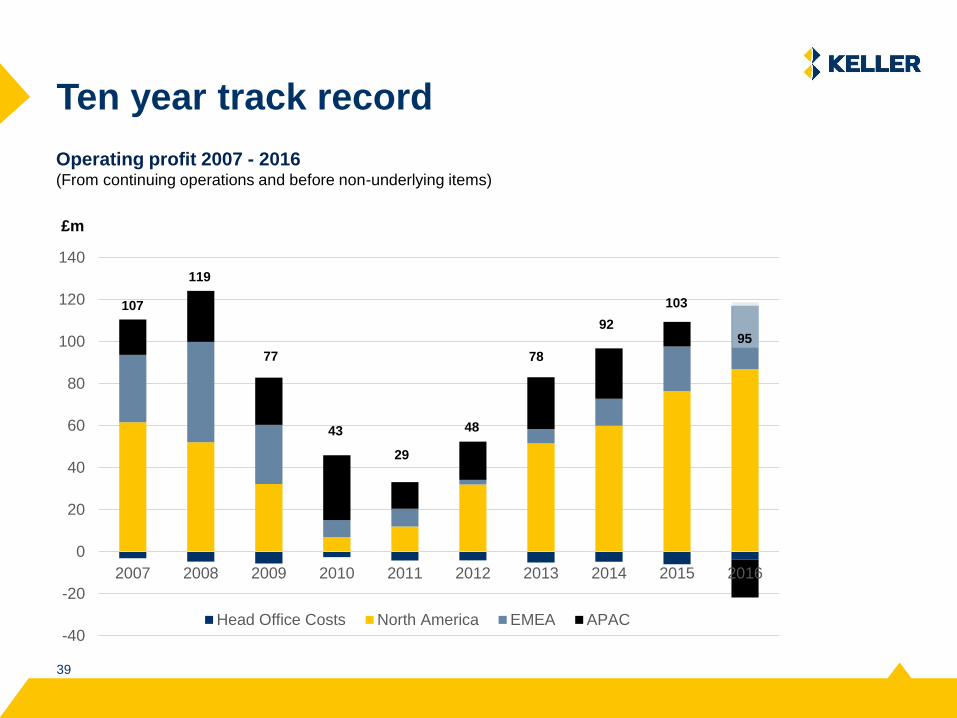
Operating profit 2007 - 2016(From continuing operations and before non-underlying items)
Ten year track record
-40
-20
0
20
40
60
80
100
120
140
2007 2008 2009 2010 2011 2012 2013 2014 2015 2016
Head Office Costs North America EMEA APAC
103
48
107
119
77
43
29
78
92
£m
95
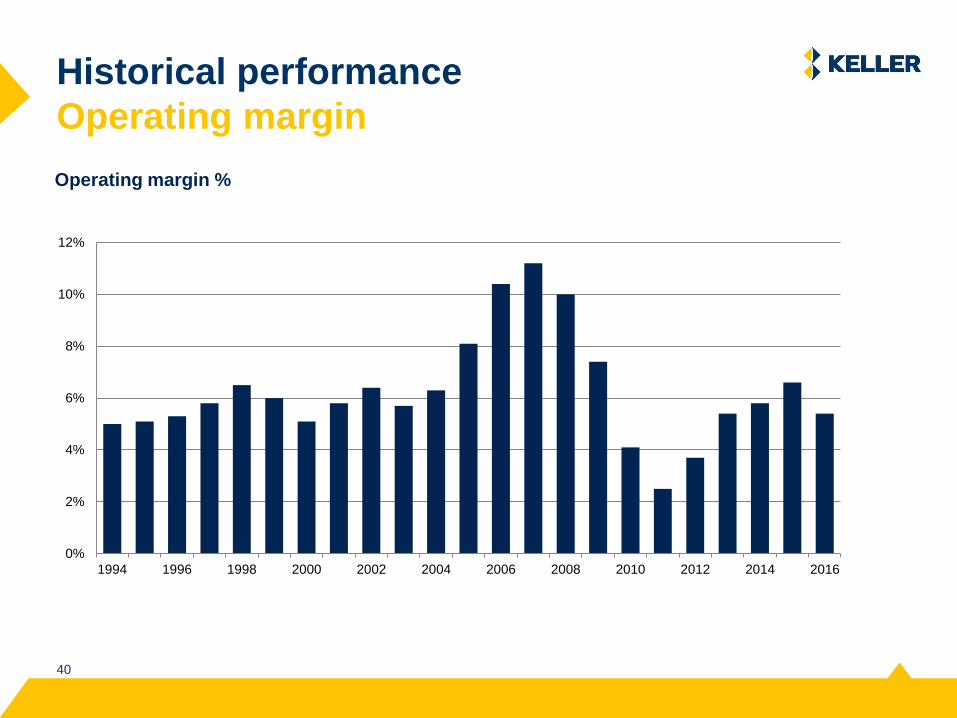
4040
Historical performance
Operating margin
Operating margin %
0%
2%
4%
6%
8%
10%
12%
1994 1996 1998 2000 2002 2004 2006 2008 2010 2012 2014 2016
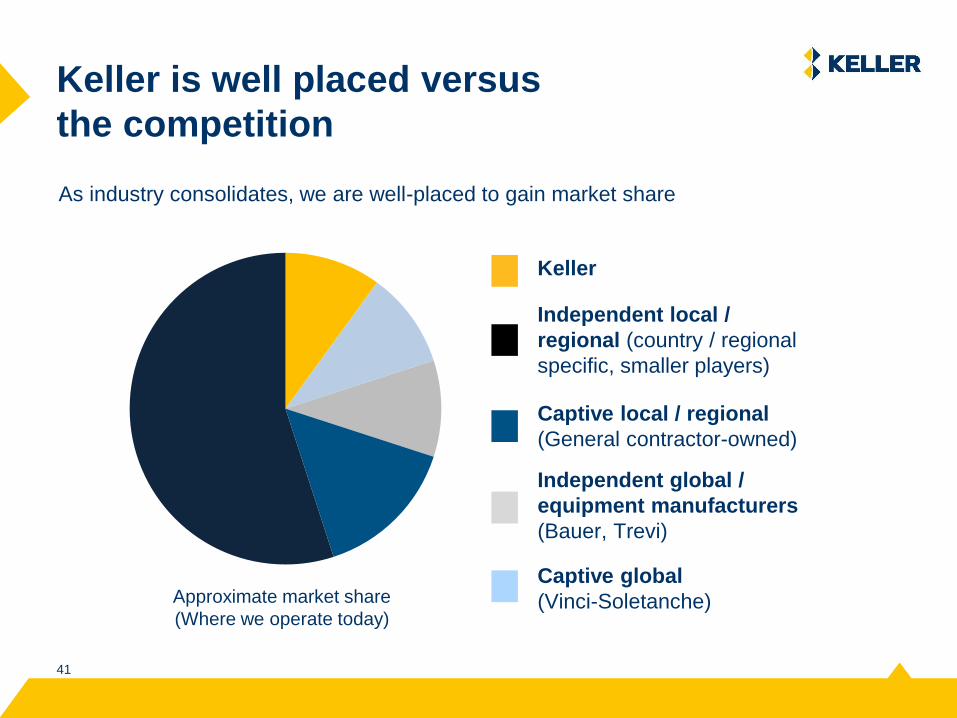
4141
Keller is well placed versus
the competition
Independent global /
equipment manufacturers
(Bauer, Trevi)
Captive global
(Vinci-Soletanche)
Keller
Captive local / regional
(General contractor-owned)
Approximate market share
(Where we operate today)
Independent local /
regional (country / regional
specific, smaller players)
As industry consolidates, we are well-placed to gain market share
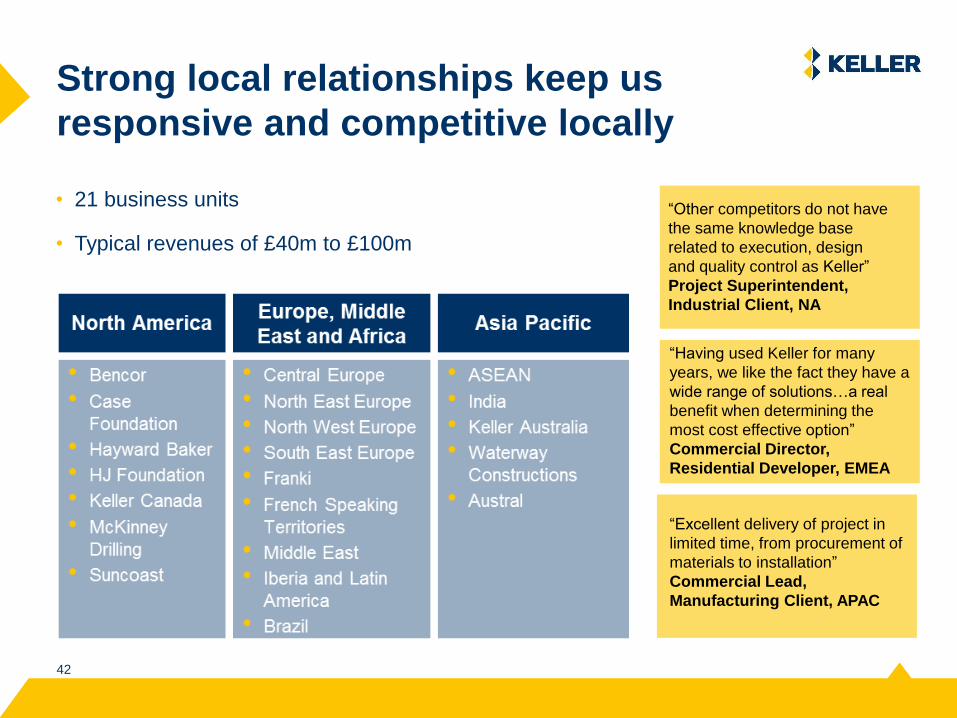
4242
Strong local relationships keep us
responsive and competitive locally
• 21 business units
• Typical revenues of £40m to £100m
“Other competitors do not have
the same knowledge base
related to execution, design
and quality control as Keller”
Project Superintendent,
Industrial Client, NA
“Excellent delivery of project in
limited time, from procurement of
materials to installation”
Commercial Lead,
Manufacturing Client, APAC
“Having used Keller for many
years, we like the fact they have a
wide range of solutions…a real
benefit when determining the
most cost effective option”
Commercial Director,
Residential Developer, EMEA
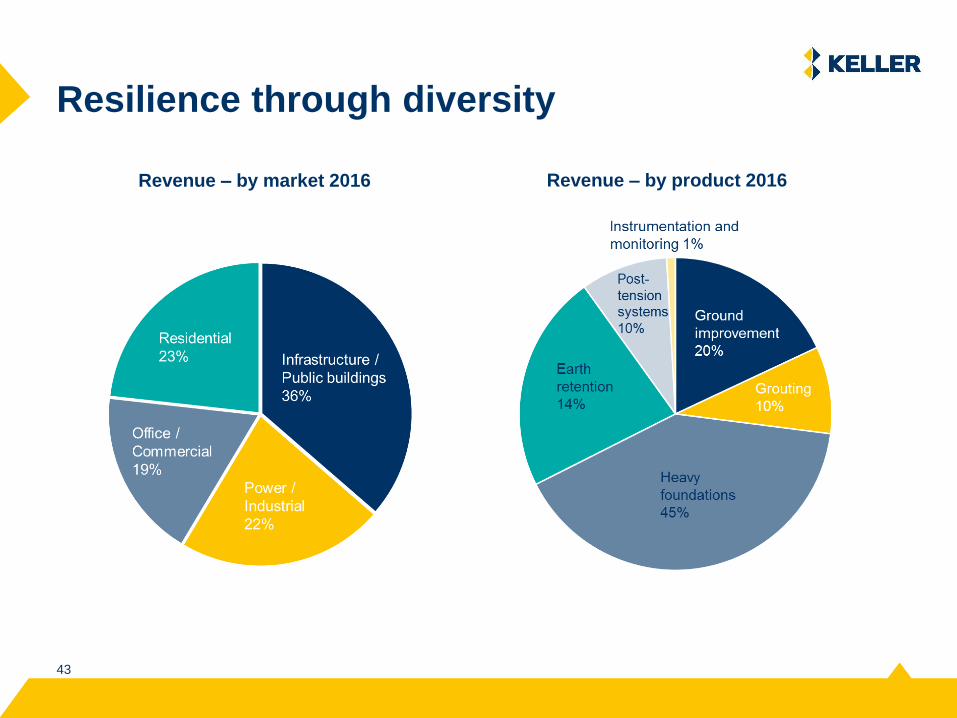
4343
Resilience through diversity
Revenue – by product 2016Revenue – by market 2016
4444
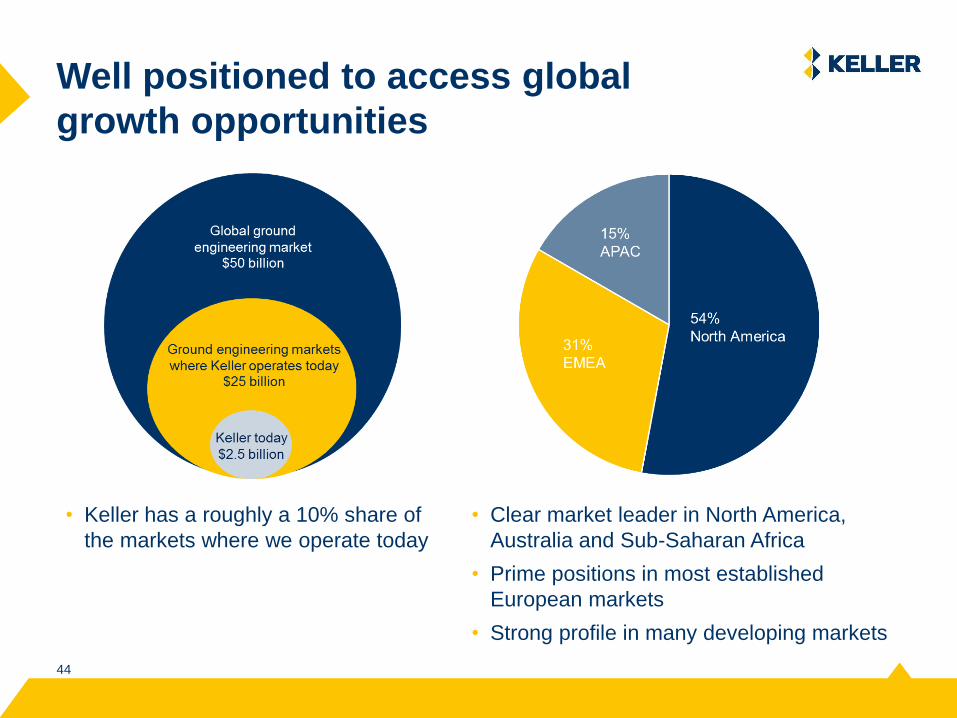
Well positioned to access global
growth opportunities
• Keller has a roughly a 10% share of
the markets where we operate today
• Clear market leader in North America,
Australia and Sub-Saharan Africa
• Prime positions in most established
European markets
• Strong profile in many developing markets
4545
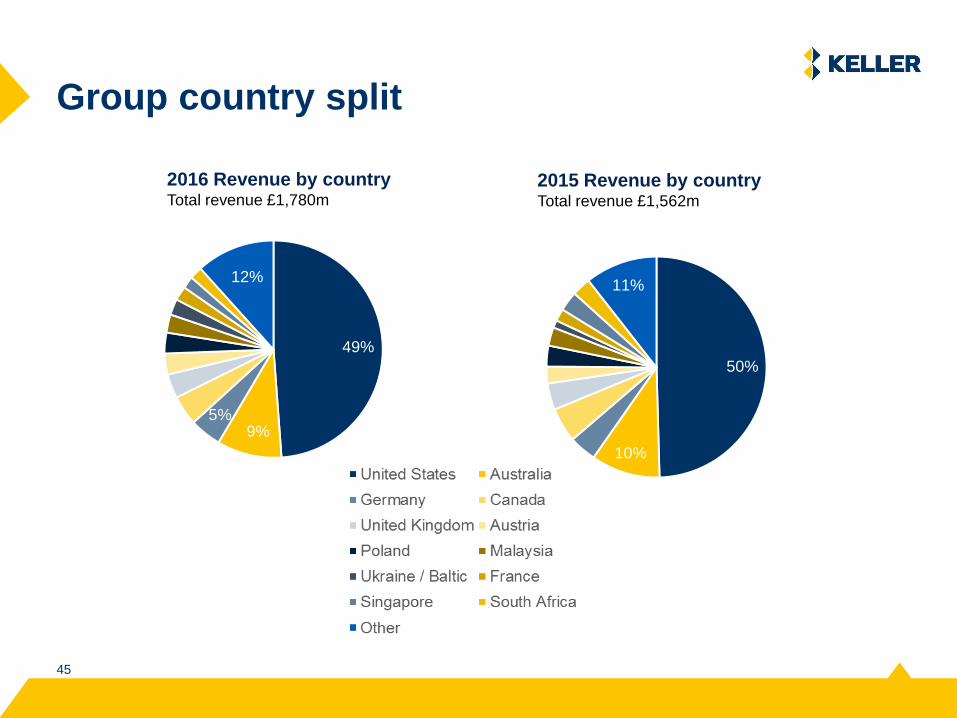
Group country split
2016 Revenue by countryTotal revenue £1,780m
2015 Revenue by countryTotal revenue £1,562m
49%
9%5%
12%
50%
10%
11%

4646
Geographical market approach
4747
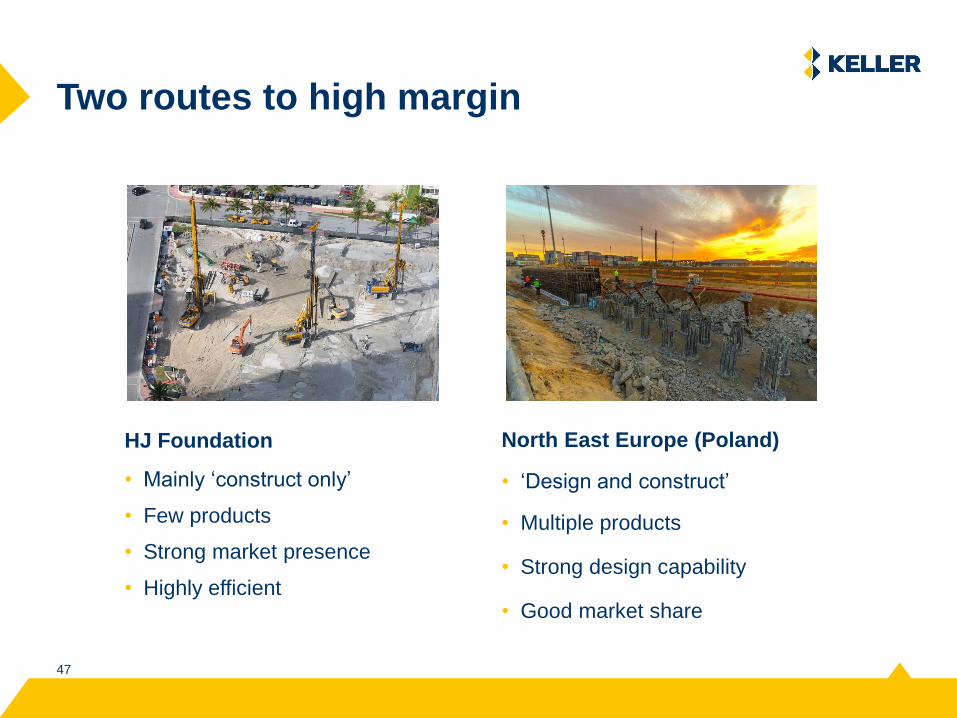
Two routes to high margin
HJ Foundation
• Mainly ‘construct only’
• Few products
• Strong market presence
• Highly efficient
North East Europe (Poland)
• ‘Design and construct’
• Multiple products
• Strong design capability
• Good market share
4848
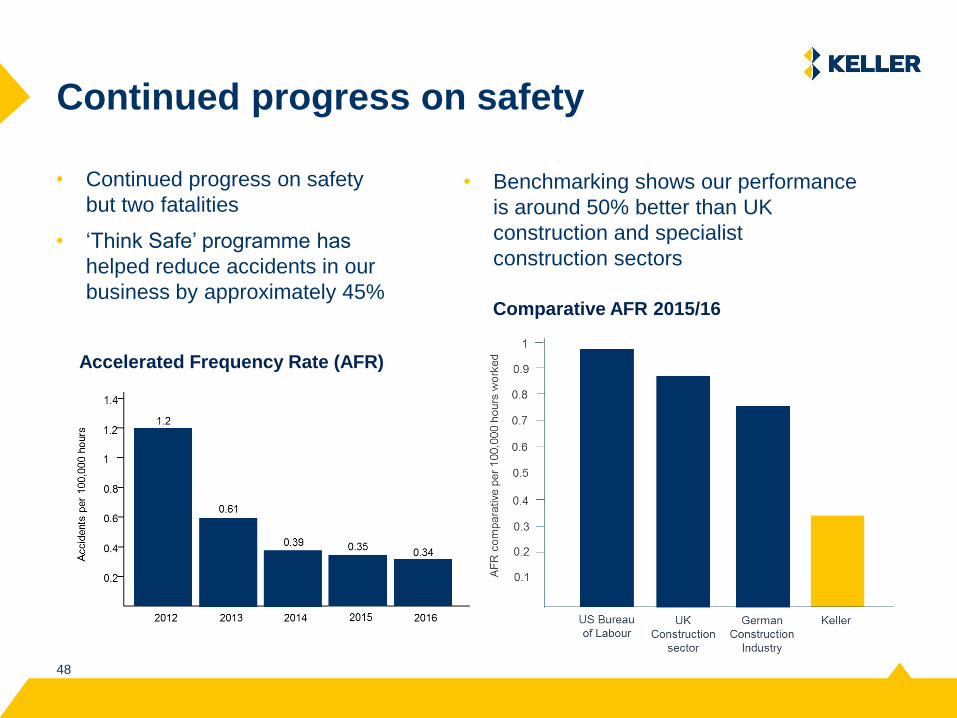
Continued progress on safety
• Continued progress on safety
but two fatalities
• ‘Think Safe’ programme has
helped reduce accidents in our
business by approximately 45%
• Benchmarking shows our performance
is around 50% better than UK
construction and specialist
construction sectors
Accelerated Frequency Rate (AFR)
Comparative AFR 2015/16
4949
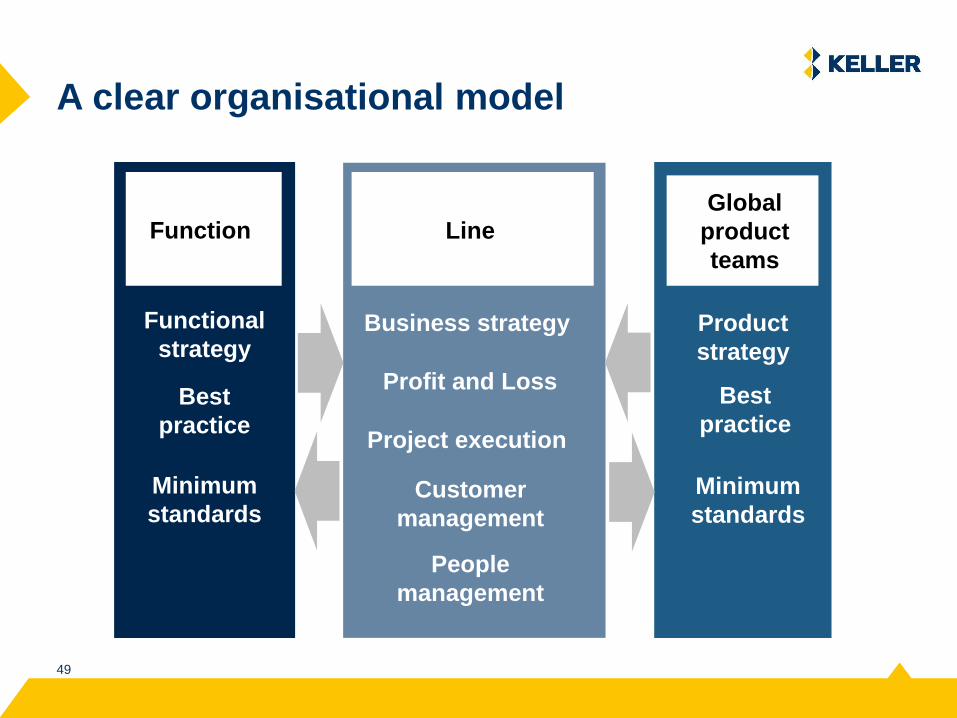
A clear organisational model
Line
Project execution
Customer
management
People
management
Business strategyFunctional
strategy
Best
practice
Minimum
standards
Global
product
teams
Best
practice
Minimum
standards
Product
strategy
Profit and Loss
Function
5050
A stronger, more unified Keller brand
5151
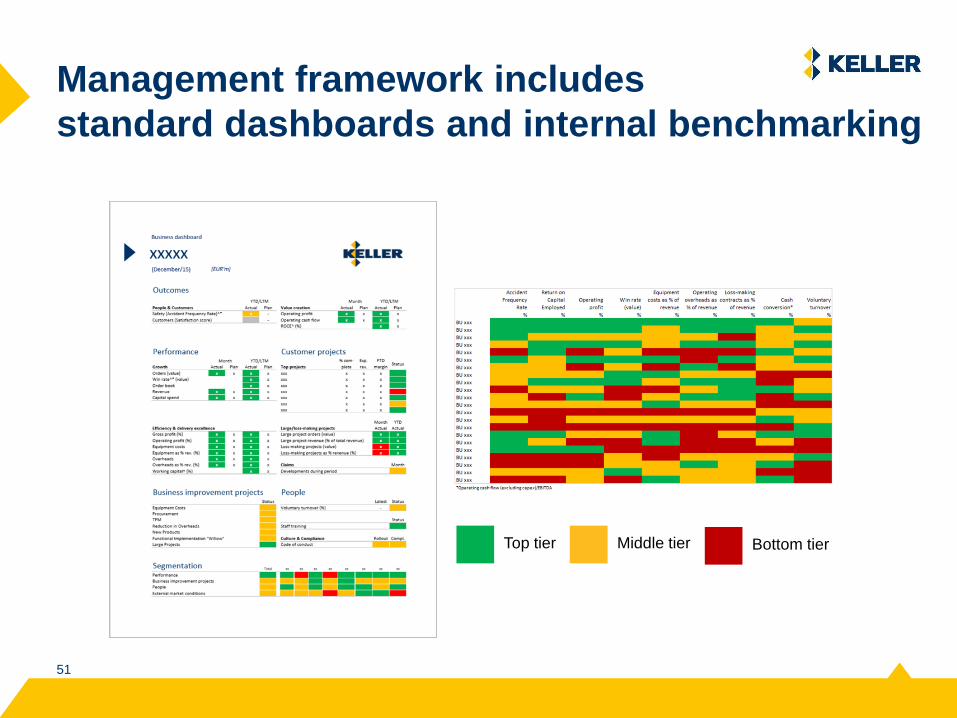
Management framework includes
standard dashboards and internal benchmarking
Top tier Middle tier Bottom tier
5252
Notable contract awards
East Port Said Development Complex, Egypt
5353
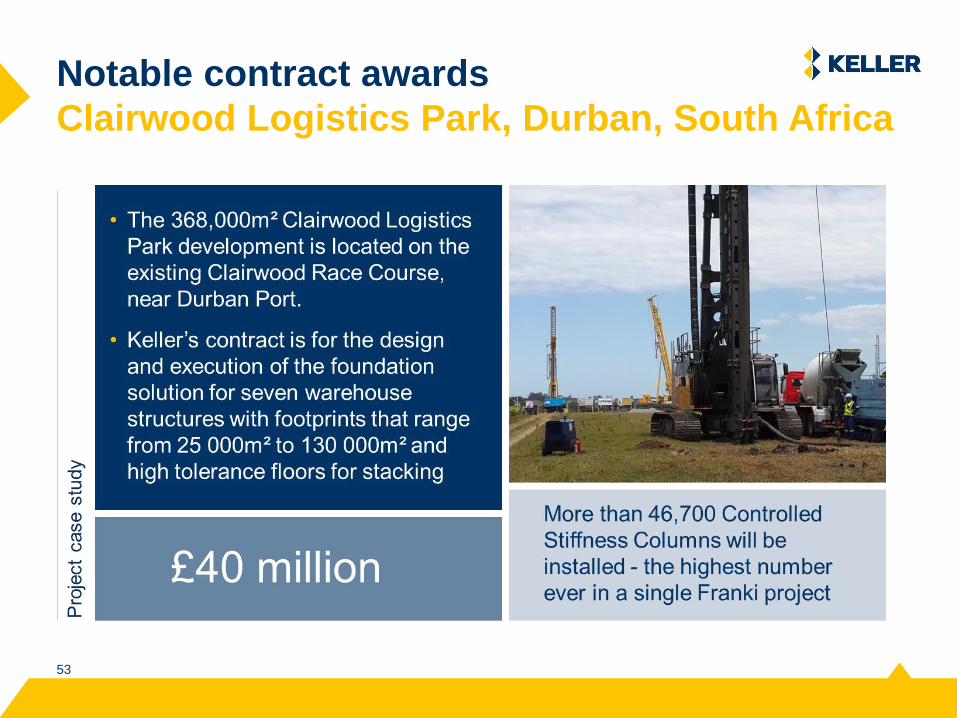
Notable contract awards
Clairwood Logistics Park, Durban, South Africa
5454
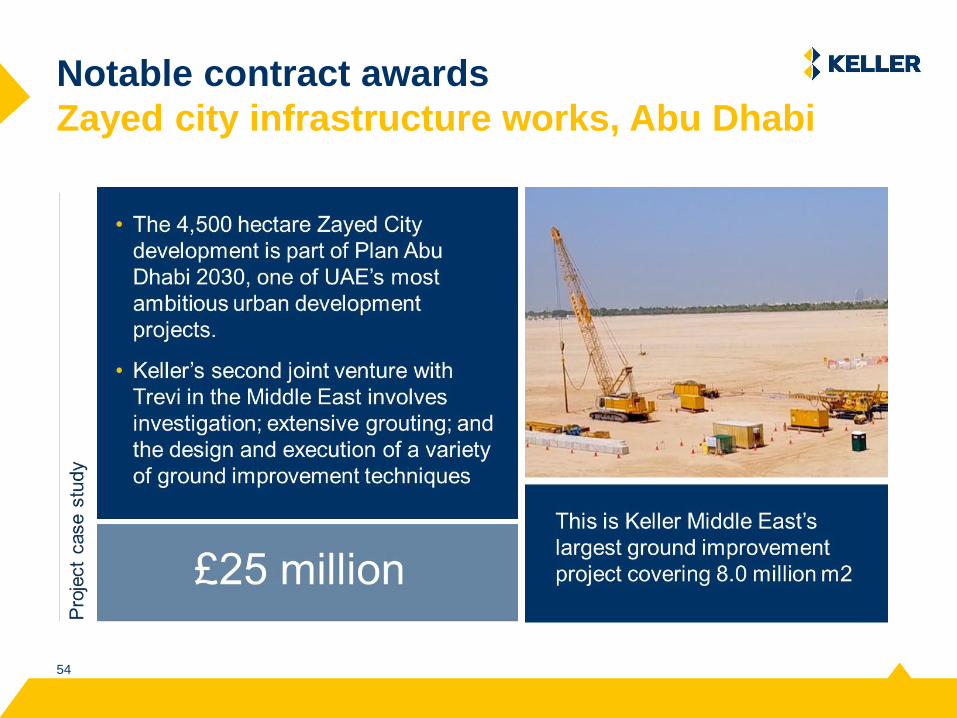
Notable contract awards
Zayed city infrastructure works, Abu Dhabi

5555
Capital allocation priorities
1. Profitable organic growth opportunities
2. Bolt-on acquisitions meeting Keller’s investment criteria
3. Ordinary dividends
• At a level allowing dividend growth through the cycle
4. Deploying funds for the benefit of shareholders
• Only where the balance sheet allows
• Unlikely to be considered if could take net debt to > 1.5x EBITDA
- After taking account of other investment opportunities/cash requirements
Leverage typically to be
maintained at between 1.0x and
2.0x EBITDA
Any short term return of capital likely
to be share buy-back