kepak clonee reg no p0167-02 · surface water monitoring 24 ... o good operating procedures using...
TRANSCRIPT

1
Kepak Clonee
Reg No P0167-02
Annual Environmental Report
2009

2
AER 2009 INDEX
1. Company Details 3 2. The Environmental Policy of Kepak Clonee 4 3. Overview 5 4. Environmental Management 5
5. Schedule of Objective & Targets 6 6. Environmental Management Programme 2009 7 7. Environmental Management Programme 2010 11 8. Emissions to Sewer 13
9. Reporting 14 10. Emissions from the Installation 15 11. Emissions to Air 20 12. Surface Water Monitoring 24 13. Waste Management Record 26 14. Complaints Summary 26 15. Noise Monitoring Summary 27 16. Ambient Monitoring Report 27
17. Tank and Pipeline Testing and Inspection Report 27 18. Reported Incidents Summary 27 19. Proposed Energy Saving Projects 28 20. Efficiency of Use of Raw Materials in Processes &
the Reduction in Waste Generated 28
21. Resource Consumption Summary 28 22. Energy Usage 29
23. Review of Residuals Management Plan 31 24. Statement of Measures in Relation
to Prevention of Environmental Damage & Remedial Actions (Environmental Liabilities) 31
Appendix 1 Noise Monitoring Report Appendix 2 AER Returns Worksheet

3
1. Company Details Company Name: Kepak (Clonee) Licence Register Number: P0167-02 Address: Clonee Co. Meath Sector: Slaughter of Animals Site Manager Michael Kelly Operations Manager Carmel Bracken Technical Manager Brian Robinson Environmental Officer Mark Derham

4

5
2. The Environmental Policy of Kepak (Clonee) Ltd Principles Kepak Clonee recognises that environmental management forms an integral part of our business. Responsible environmental management enhances our business and activities. We are committed to the protection of the environment and the well being of the community in which we operate. We will use clean and efficient processes at all stages of our production, continually monitor energy costs and minimise waste. We will continually seek to improve our environmental performance. Actions We have developed and will strive to improve our Environmental Management System so that all activities on the site are managed and controlled in an environmentally responsible manner. We will make available to the public and customers, information on our environmental performance including information to and from the Environmental Protection Agency and Local Authorities. We will train and develop our staff and contractors in the best environmental and health and safety practices. We will comply with all environmental regulations as laid down by the EPA in the Acts of 1992 and 2003, directive 96/61 EC and other regulatory bodies, and co-operate fully with such bodies. All new activities, products and processes shall be assessed to identify possible environmental impacts. Site response procedures are established to prevent accidental emissions of materials or energy on the site. In addition, corrective action procedures are established in the event of detection of non compliance with this policy. Recycling of waste will be carried out wherever possible to aid us in our efforts to minimise waste. ________________________________ Michael Kelly (Site Manager)

6
3. Overview This is the company’s ninth Annual Environmental Report. This report relates to the environmental performance of the company for the year ending 31st December 2009. It has been compiled as per the EPA’s revised Guidance Notes for Annual Environmental Reports. The company is located on the N3 at Clonee, Co. Meath. The IPPC licence was granted on the 10th October 2007 under section 90(2) of the Environmental Protection Agency Acts, 1992 and 2003. During 2009, the company continued to improve compliance with conditions in its IPPC licence. 4. Environmental Management The Site Manager is responsible for the implementation of the Environmental Policy, overall environmental management of the site and allocation of resources. The Environmental Officer is responsible for the day-to-day environmental operations and monitoring of the site, and the management of the IPPC licence. The Maintenance Supervisor is responsible for the day-to-day plant operation of the wastewater treatment plant and other abatement systems on the site. Environmental Management Chart: Michael Kelly Site Manager Carmel Bracken Operations Manager
Danny Graham Brian Robinson Maintenance Technical Production
Manager Manager Managers Mark Derham Tom Rowan Environmental Environmental Officer Consultant

7

8
5. Schedule of Objectives and Targets
Five Year Objectives & Targets
Licence Objectives Date Licensee targets
WWTP performance parameters to adhere to IPPC license 2007-2012
Consistent IPPC adherence by means of o Daily verbal communications between environmental
manager and WWTP operators. o Good operating procedures using the WWTP Manual o Regular consultation with R.E.C.
Reduction in Fugitive odorous emissions to air 2007-2012
Close communication with neighbours. The Environmental Officer has been designated to liaise with the local community.
Reduction in water consumption 2007-2012
Water intake reduction of 12.7% was achieved in 2009. This is a substantial reduction and we believe that further reduction is possible. o Monitoring water consumption per unit per
department daily. o Maintenance to reduce water wastage through leaks. o Production to reduce water wastage through
processes. o Monthly continuous improvement meetings which
include water reduction projects.
Stability in Electricity Consumption
2007-2012
Electricity usage in 2009 was reduced by 11% due to a slight reduction in production and the implementation of various continuous improvement projects. 2007-2012. To reduce consumption by 1% p.a., relative to production levels. The monitoring & targeting system is installed. It enables monitoring of individual areas of consumption of electricity.
Increase Recycling Quantities & Reduce landfill waste 2007-2012
o To increase use of usable plastic trays o To increase the amount of cardboard being recycled o To increase the amount of plastic being recycled
Environmental Incidents 2007-2012
During 2009 there were no environmental incidents. o Target to maintain zero environmental incidents year
on year.

9
6. Environmental Management Programme (EMP 2008) Report Targets were outlined in the EMP 2009 (AER 2008) to improve the environmental performance of the company. The progress of these targets was as follows: WWTP Performance to adhere with IPPC license Target: To ensure that the final effluent discharge is in full compliance with the
IPPC Licence. Achievement: Effluent discharge to sewer in full compliance with Licence limits. Reduction in Water Consumption Target: Reduction of water consumption. Achievement: There has been a 12.7% reduction in water consumption. Kepak
appointed a dedicated person nominated to carry out daily monitoring on water meters as part of continuous improvement projects to reduce water consumption. A monitoring system is also used to track consumption and identify where water usage can be reduced. Consultation with Mangers and Supervisors occurs in areas of high water usage to identify and minimise water wastage.
Reduction in Electricity Consumption Target: Reduction of Electricity Consumption Achievement: There has been 11% reduction in electricity usage. The reduction was
achieved as a result of continuous improvement projects which were carried out during the year. These projects are analysed through site energy meetings and improvements are carried out with personnel and process control.
Projects that were introduced during 2009 Energy Monitoring System Target: Install an energy management system to monitor usage of electricity,
oil and water. Achievement: The monitoring system is currently available online, providing energy
readings for each department in Kepak Clonee. The system is used to provide daily departmental consumption reports to area supervisors and managers.
Substantial reduction was achieved during 2009 as a result of closely
monitoring the energy usage on the monitoring system.

10
Hand Dryers (Reduction in Waste) Target: Reduction in waste paper disposal by installing high efficiency hand
dryers in the staff toilets. Achieved: Dyson hand dryers were installed, which dramatically reduced paper
usage in the amenity block. Reduce packaging (Reduction Waste) Target: Reduce packaging by using smaller bags for packing the various
products. Achieved: The project was implemented and significant reduction in packaging
was achieved. New Water Efficient Sterilizers and Control Valves (Reduction in oil, water and effluent) Target: To design a more efficient sterilizer and sterilizer water flow control
system. Achieved: Kepak successfully designed a more efficient sterilizer. They carried
out trial on water usage and ability to maintain temperature, before replacing all the old sterilizers in the abattoir.
Tripe Water Recycling System Target: Design a system for recycling 85oC water from the machine which
carries out the final tripe washing. The water from the machine is cooled to 65oC and is recycled back to the primary offal washer.
Achieved: They system was successfully designed and installed. The savings on the energy usage was substantial.
Refrigeration (Reduction in Electricity) Target: Carry out a detailed investigation into the running of the refrigeration in
order to identify where energy can be saved. The Environmental Officer is to work alongside the maintenance manager and investigate the energy usage patterns in order to determine the optimum setting for efficient running of the plant.
Achieved: Numerous changes have been made to the running of the refrigeration plant, which accounted for the majority of the electrical savings that were made in 2009. This is an ongoing process which is continuously monitored.

11
Effluent (Reduction in Suspended Solids and Improved the running of the WWTP) Target: Install 2 catchments baskets at the truck wash to catch any solids from
the trailer washings. Each basket is a wire mesh basket which strains the solids out. Each basket, which holds approximately one tonne, is emptied of its solids twice weekly. The result is a reduction in suspended solids, before flocculation.
Achieved: The baskets were installed. The result was a reduction in suspended solids and the pipelines are less likely to get blocked due to solids build up.
Installation of Proximity Sensors on lighting (electricity usage): Target: To identify investigate the reduction of electricity consumption through
the use of proximity sensors on lighting through out the site. Achieved: Areas were identified throughout the site to install proximity sensors.
Electrical usage has been reduced in the areas proximity sensors have been installed on site.
Installation of Inverters on Condenser Fans: Target: Reduction of electrical cost and air leakage by reducing the load on air
compressors. Achieved: Inverter valves were places on condenser fans throughout the site
which reduced the load on the compressors, reducing the cost of running the compressors.
Shutdown of Boiler at weekend: Target: Investigate shutting down the boiler at weekends to reduce oil and
energy costs. Achieved: The boiler is shut down at the weekend and has resulted in substantial
reductions during 2009 as a result and is closely monitoring using the energy usage on the monitoring system.
Timed Shut Down of Water Pumps: Target: Reduction of water usage by timed shutdown to reduce night time and
weekend use. Achieved: The installation of timed shutdown on water pumps has resulted in
reduced water use.

12
Clonee Electricity Consumption
0
100000
200000
300000
400000
500000
600000
700000
800000
900000
1000000
Jan Feb Mar Apr May Jun Jul Aug Sep Oct Nov Dec
Month
KW
Electricity Units 2009Electricity Units 2008
Clonee Heavy Fuel Oil Usage
0
20,000
40,000
60,000
80,000
100,000
120,000
Jan Feb Mar Apr May Jun Jul Aug Sep Oct Nov Dec
Month
Litr
es HFO Used 2009HFO Used 2008

13
Clonee Water Intake
0
2000
4000
6000
8000
10000
12000
14000
16000
18000
20000
Jan Feb Mar Apr May Jun Jul Aug Sep Oct Nov Dec
Month
M 3 Water intake 2009
Water intake 2008

14
7. Environmental Management Programme (EMP 2010) Kepak Clonee is aware of its responsibility to protect the environment. As a result we are committed to preventing pollution to our environment according to the Best Available Techniques (BAT) regulations. We will use the Kepak Clonee EMP to ensure waste minimisation, IPPC adherence and to minimise the adverse effect on the environment of our activities. This document outlines the different areas being addressed, setting targets, the means and time within which they will be achieved and designating responsibility to achieving these targets. The following reports shall be forwarded quarterly to the EPA.
Monitoring of Emissions to water Surface Water discharge monitoring Complaints Organic Waste Register
An AER is to be completed for the year ending December 31st 2010 and forwarded to the EPA by 31st March 2011. List of targets for the year 2010. Energy Monitoring System (electricity usage): Target: Proposal to investigate potential cost savings by the installation of
additional metering to the refrigeration system to monitor electricity usage and chilling performance more closely.
Time: October 2010. Install sensors on abattoir sinks (water & oil usage): Target: Reduction of Water Consumption. Means: Install sensors on the abattoir sinks in order to better control the 45oC
water usage. Responsibility: Environmental Officer / Maintenance Time: The sensors have been delivered on site. Maintenance department will
have the sensors installed by the end of April 2010. Installation of Proximity Sensors on Lighting (electricity usage): Target: Reduction of Electricity Consumption. Means: The costing and saving for installing proximity sensors in the attics and
plant room have been documented. Responsibility: Environmental Officer / Maintenance Time: To be completed by the end April 2010.

15
Installation of Inverters on Condenser Fans: Target: Reduction of electrical consumption. Means: Place Inverter valves on condenser fans. The use of inverters reduces
the load on the air compressors. Responsibility: Environmental Officer / Maintenance Time: October 2010

16
8. Emissions to Sewer – Fingal County Council Sewer Licence and Emission Limit Values The following table is a list of the discharge emission limit values granted in the IPPC licence: Parameter Emission
Limits until 30th April
2010
Quantity/Time period
Emission Limits from
1st May 2010
Quantity/Time period
Flow 1,300 m3/Day 100 m3/Hour 1,300 m3/Day 100 m3/Hour BOD 2,000
mg/Litre 2,600 kg/Day 1,500
mg/Litre 1,950 kg/Day
COD 4,000 mg/Litre
5,200 kg/Day 3,000 mg/Litre
3,900 kg/Day
Suspended Solids
1,500 mg/Litre
1,950 kg/Day 1,125 mg/Litre
1,462.5 kg/Day
Sulphates 400 mg/Litre 520 kg/Day 300 mg/Litre 390 kg/Day Detergents 100 mg/Litre 130 kg/Day 100 mg/Litre 130 kg/Day Phosphates 100 mg/Litre 130 Kg/Day 100 mg/Litre 130 Kg/Day Fats, Oils and Grease
100 mg/Litre 130 kg/Day 100 mg/Litre 130 kg/Day
pH Limits 6 - 10 6 - 10 6 -10 6 - 10 Maximum Temperature
42oC 42oC 42oC 42oC
Volume During 2009 a total volume 172,557 m3 of wastewater was treated in the treatment plant. The amount of waste water sent for treatment during 2009 reduced by 32.7% from 2008 in which 256,245 m3 was treated. There has been a significant reduction in water usage in the facility since the water usage reduction programme began in 1999, in which 310,328 m3 was treated. The total for 2009 shows a 44.4% overall reduction in waste water since introduction of the water reduction programme in 1999. Water usage can be split into three main areas:
Kill Line 35% Ancillary Process 40% Wash Down 25%
There have been improvements made in certain areas: An average of 473 cubic meters was treated in the facility each day during 2009.

17
Staff awareness and training of water usage, in addition to a zero tolerance on water wastage will help reduce volumes further. Continuous improvement projects are continuously being implemented in order to reduce usage.
Clonee Effluent out to Fingal
0
5000
10000
15000
20000
25000
30000
Jan Feb Mar Apr May Jun Jul Aug Sep Oct Nov Dec
Month
M 3 Water out to Fingal 2009
Water out to Fingal 2008
9. Reporting All quarterly reports were submitted to the agency in full, as required by the license. A Nutrient Management Plan was compiled for lands owned by Ben Dillon, Girley, Co. Meath, for the proposed landspreading of organic waste and submitted to the agency in February 2009. Air, ground water, surface water and effluent analysis was carried out and submitted in the Quarterly Environmental Reports.

18
10. Emissions from the Installation Quality of Final Effluent In accordance with IPPC licence requirements, effluent analysis was carried out on a monthly basis by an independent laboratory. The quality of final effluent has been good during the year. Spot check samples were carried out by the EPA and Fingal County Council during the period, and were determined to be within the licence limits. The wastewater treatment process at Clonee involves the following processes: Clonee Effluent Sump & Course Screen (12mm) SRM Cat 1 Skip Screenings
Covered Balancing Tank Rotary Screen (1.5mm) SRM Cat 1 Skip Screenings
Primary Settlement Solids
DAF Sludge Tank Sludge
Liquid
Belt Press Sewer
Land spreading

19
Summary of Effluent Results for 2009
Effleunt PH
0
2
4
6
8
10
12
08.01
.0920
.01.09
06.02
.0919
.02.09
09.03
.0913
.03.09
02.04
.0922
.04.09
01.05
.0914
.05.09
10.06
.0918
.06.09
02.07
.0923
.07.09
05.08
.0913
.08.09
02.09
.0914
.09.09
08.10
.0913
.10.09
05.11
.0916
.11.09
03.12
.0909
.12.09
Date
PH
pH LimitpH
pH results were within licence limits for the year 2009
Effluent BOD
0
500
1000
1500
2000
2500
08.01
.0920
.01.09
06.02
.0919
.02.09
09.03
.0913
.03.09
02.04
.0922
.04.09
01.05
.0914
.05.09
10.06
.0918
.06.09
02.07
.0923
.07.09
05.08
.0913
.08.09
02.09
.0914
.09.09
08.10
.0913
.10.09
05.11
.0916
.11.09
03.12
.0909
.12.09
Date
mg/
l BOD LimitBOD
BOD results were within licence limits for the year 2009

20
Effluent COD
0
500
1000
1500
2000
2500
3000
3500
4000
4500
08.01
.0920
.01.09
06.02
.0919
.02.09
09.03
.0913
.03.09
02.04
.0922
.04.09
01.05
.0914
.05.09
10.06
.0918
.06.09
02.07
.0923
.07.09
05.08
.0913
.08.09
02.09
.0914
.09.09
08.10
.0913
.10.09
05.11
.0916
.11.09
03.12
.0909
.12.09
Date
mg/
l COD LimitCOD
COD results were within licence limits for the year 2009
Effluent Suspended Solids
0
200
400
600
800
1000
1200
1400
1600
08.01
.0920
.01.09
06.02
.0919
.02.09
09.03
.0913
.03.09
02.04
.0922
.04.09
01.05
.0914
.05.09
10.06
.0918
.06.09
02.07
.0923
.07.09
05.08
.0913
.08.09
02.09
.0914
.09.09
08.10
.0913
.10.09
05.11
.0916
.11.09
03.12
.0909
.12.09
Date
mg/
l SS LimitSS
Suspended Solid results were within licence limits for the year 2009

21
Effluent Sulphates
0
50
100
150
200
250
300
350
400
450
08.01
.0920
.01.09
06.02
.0919
.02.09
09.03
.0913
.03.09
02.04
.0922
.04.09
01.05
.0914
.05.09
10.06
.0918
.06.09
02.07
.0923
.07.09
05.08
.0913
.08.09
02.09
.0914
.09.09
08.10
.0913
.10.09
05.11
.0916
.11.09
03.12
.0909
.12.09
Date
mg/
l SulphateSulphate Limit
Sulphate results were within licence limits for the year 2009
Effleunt Phosphates
0
20
40
60
80
100
120
08.01
.0920
.01.09
06.02
.0919
.02.09
09.03
.0913
.03.09
02.04
.0922
.04.09
01.05
.0914
.05.09
10.06
.0918
.06.09
02.07
.0923
.07.09
05.08
.0913
.08.09
02.09
.0914
.09.09
08.10
.0913
.10.09
05.11
.0916
.11.09
03.12
.09
Date
mg/
l Phosphates LimitPhosphates
The Phosphate results were within licence limits for the year 2009.

22
Effluent Oils, Fats and Greases
0
20
40
60
80
100
120
08.01
.0920
.01.09
06.02
.0919
.02.09
09.03
.0913
.03.09
02.04
.0922
.04.09
01.05
.0914
.05.09
10.06
.0918
.06.09
02.07
.0923
.07.09
05.08
.0913
.08.09
02.09
.0914
.09.09
08.10
.0913
.10.09
05.11
.0916
.11.09
03.12
.0909
.12.09
Date
mg/
l FOG LimitFOG
Oils, Fats and Grease results were within licence limits for the year 2009
Effluent Detergents (Max Result was 0.475)
0
2
4
6
8
10
12
08.01
.0920
.01.09
06.02
.0919
.02.09
09.03
.0913
.03.09
02.04
.0922
.04.09
01.05
.0914
.05.09
10.06
.0918
.06.09
02.07
.0923
.07.09
05.08
.0913
.08.09
02.09
.0914
.09.09
08.10
.0913
.10.09
05.11
.0916
.11.09
03.12
.09
Date
mg/
l MBAS Limit/10MBAS *10
Detergent results were within licence limits for the year 2009

23
11. Emissions to Air Boiler Emissions During 2009 two separate boiler air emissions were carried out. The air from 2 boilers is monitored in these reports. The air is released from the boilers which use boiling water to create steam to heat the heat exchangers which then supply the energy and heat to all water systems throughout the plant. Some steam is released from the boilers and this is then assessed by TMS Environmental bi-annually. The air is analysed for the parameters as cited in Schedule C.1.2 of the IPPC licence. The first Boiler Monitoring for 2009 was carried out by TMS on 22nd June. They were tested at different times. Results as follows: Parameter Units Emission
Boiler 1 (A-1) Boiler 1 (A-2) Limit Value 22.06.2009 22.06.2009 CO mg/Nm3 N/A 8.13 2.9 NOx mg/Nm3 600 626.9 701.6
SO2 mg/Nm3 1700 149.2 561.3 Particulates mg/Nm3 N/A 0.01 0.11
The second Boiler Monitoring for 2009 was carried out by TMS Environmental on 21st December. Results as follows: Parameter Units Emission
Boiler 1 (A-1) Boiler 1 (A-2) Limit Value 19.02.2010 21.12.2009 CO mg/Nm3 N/A 2.53 1.6 NOx mg/Nm3 600 829 504 SO2 mg/Nm3 1700 1153 507 Particulates mg/Nm3 N/A 0.02 0.0002
NOx levels were outside licence limits for the first emissions testing which was carried out on 22.06.2009. During the second annual test only one boiler was tested as the other boiler was not operational. The second boiler was retested on 19.02.2010. NOx levels were outside licence limits for the second emissions testing on boiler 1 (A-1). Ongoing boiler servicing and controls are in place to try and reduce NOx values while maintaining open discussion with the EPA regarding NOx emissions during 2009. The overall NOx emissions for 2009 have decreased from 19.3 tonnes in 2008 to 13724.1 tonnes in 2009. The reason for the low emissions is that although the NOx

24
content per m3 is above the limit, the flue gas flow rate is low due high efficiency boilers and a closely watched energy monitoring system. Fuel usage has also been significantly reduced by 16.7% over the course of 2009 as a result of energy saving projects. Before the current licence was introduced in October 2007, Kepak appealed the reduction limits on the grounds that the application for licence review contained incorrect information. The previous licence contained licence limits which were appropriate for heavy fuel oil emissions with a maximum of 1% Sulphur. The NOx emission limits for licence P0167-02 was appealed by letter on the 9th September 2009 by Eamonn Gavin. This letter of appeal was subsequently declined by the EPA on the 11th November 2009. Quotations have been received for carrying out an atmospheric modelling survey, as advised by Mr. Patrick Kenny, with a view to requesting a technical amendment to the licence. The grounds for the appeal are that the original limits suggested by Kepak to the agency were an error on Kepak’s behalf, due to inaccurate testing carried out by an external laboratory. The atmospheric modelling survey is planned to be carried out by environmental contractors in 2010. The EPA will be formally notified once all relevant information is complied and Kepak Clonee will work closely with the EPA to obtain a satisfactory outcome.

25
Bio-filter The bio-filter from the DAF shed was monitored for the parameters as cited in Schedule C.1.1 of the IPPC licence.
Parameter Units Result
Emission Limit Value mg/m3
Mass Threshold g/hr
Emission Limit Value g/hr
Amines mg/Nm3 0.17 5 <0.29 -
Negative Pressure Negative pressure - - -
Amides mg/Nm3 2.25 Flow Nm3/hr 1349 1,730 - - pH 3.7 - - - Moisture % 32.7 - - - Ammonia mg/Nm3 <3.8 30 <0.072 150 Total Hydrogen Sulphides mg/Nm3 <0.29 3 <0.29 15 Mercaptans mg/Nm3 <1.3 3 <0.072 15
Bord Na Mona 20.03.09
Parameter Units Result
Emission Limit Value mg/m3
Mass Threshold g/hr
Emission Limit Value g/hr
Amines & Amides mg/Nm3 <0.35 5 <0.29 -
Negative Pressure Negative pressure - - -
Temperature oC 15.7 - - - Flow Nm3/hr 830 1,730 - - Moisture % 18.3 - - - Ammonia mg/Nm3 <0.18 30 <0.072 150 Total Hydrogen Sulphides mg/Nm3 <0.17 3 <0.29 15 Mercaptans mg/Nm3 <0.17 3 <0.072 15
TMS Environmental Results 17.07.09
Parameter Units Result
Emission Limit Value mg/m3
Mass Threshold g/hr
Emission Limit Value g/hr
Amines & Amides mg/Nm3 <0.34 5 <0.29 -
Negative Pressure Negative pressure - - -
Temperature oC 2.0 - - - Flow Nm3/hr 499 1,730 - - Moisture % 24.4 - - - Ammonia mg/Nm3 <0.18 30 <0.072 150 Total Hydrogen Sulphides mg/Nm3 <0.33 3 <0.29 15 Mercaptans mg/Nm3 <0.17 3 <0.072 15
TMS Environmental Results 21.12.2009

26
Parameter Units Result
Emission Limit Value mg/m3
Mass Threshold g/hr
Emission Limit Value g/hr
Amines & Amides mg/Nm3 <0.35 5 <0.29 -
Negative Pressure Negative pressure - - -
Temperature oC 8.0 - - - Flow Nm3/hr 582 1,730 - - Moisture % 34 - - - Ammonia mg/Nm3 <0.18 30 <0.072 150 Total Hydrogen Sulphides mg/Nm3 <0.35 3 <0.29 15 Mercaptans mg/Nm3 <0.17 3 <0.072 15
TMS Environmental Results 15.02.2010

27
12. Surface Water Monitoring SW1, SW2 and SW3 surface water emission points are discharged to the Tolka river. It is a licence requirement that it be laboratory tested on a monthly basis. The following table is a summary of results for SW1, 2009. Date PH COD AMMONIA NITROGEN CONDUCTIVITY 02.07.09 7.88 57 0.033 1.5 107.3 02.09.09 6.8 16 <0.01 0.3 117.3 18.11.09 7.1 12 <0.01 <0.5 122
SW1 only flows when there is very heavy rain at the time of sampling. It takes the run off water from the driveway leading up to the group offices and the driveway leading into the factory (relatively small catchments area). The following table is a summary of results for SW2, 2009.
Date pH COD Ammonia Total
Nitrogen Conductivity 15.01.09 7.5 8 0.01 6.9 809 12.02.09 7.45 8 0.01 5.1 1090 16.03.09 7.5 12 0.1 1.4 867 02.04.09 7.54 15 0.016 0.6 910 05.05.09 7.54 16 0.011 1.1 876 10.06.09 7.49 5 0.01 2.7 903 02.07.09 7.2 5 0.023 1.7 844 05.08.09 7.56 9 0.0448 0.4 861 02.09.09 7.5 12 0.01 0.8 565 08.10.09 7.4 18 0.01 0.5 759 05.11.09 7.23 18 0.01 0.5 654 02.12.09 7.6 9 0.01 1.2 565
SW2 always has a flow as it drains water from agricultural lands to the rear of the factory. It also drains area outside the factory dry goods store. Laboratory test results for SW3 were as follows.
Date pH COD Ammonia Total
Nitrogen Conductivity 15.01.09 7.6 45 0.72 6 703 26.02.09 7.64 6 0.01 0.5 880 13.03.09 7.3 36 0.01 6 1170 29.04.09 7.38 21 0.418 8.4 766 05.05.09 7.54 19 0.382 3.5 773 10.06.09 7.59 12 0.374 4.2 871 02.07.09 7.4 18 0.768 4.9 387 05.08.09 7.26 17 0.34 4.1 616 02.09.09 7.2 18 0.01 1.5 474 08.10.09 7.27 18 0.01 2.7 692 05.11.09 7.41 21 0.01 2.2 641 02.12.09 7.34 12 0.01 4.7 625

28
SW3 drains the concreted outside at the right and front of the factory, and some of the roof. Laboratory test results for SW4 were as follows. Date pH COD Ammonia Total Nitrogen Conductivity 02.07.09 7 21 1.1 2 27.2 02.09.09 6.6 8 1.28 1.1 21.5 05.11.09 6.66 18 0.908 0.5 41
SW4 flows into a surface water drain beside the lairage. The catchment area of SW4 is the lairage roof. Ground Water (Well Water) analysis was carried out by TMS as an annual requirement. Results as follows:
Result 08.10.09 Result 06.02.09
Parameter Well 1 Well 2 Units Nitrate 8.2 <3 mg/L pH 7.43 7.7 pH units Conductivity 668 637 uS/cm Ammonia <0.01 0.01 mg/L N COD <18 <5 mg/L N Total Nitrogen <0.5 <0.5 mg/L N Total Coliforms 0 0 cfu/per 100ml Eschericha 0 0 cfu/per 100ml
As can be seen, all parameters are within Drinking Water Regulations.

29
13. Waste Management Record The company produced the following off-site waste in 2009:
Waste Product Metric Tonnes Destination
Destination Licence No. Transporter
EWC Code
Specified Risk Material 4144.04 Collage R911 O' Donohoe 02 02 02 Proteins Bones 3087.46 Collage R911 O' Donohoe 02 02 02 Proteins Offal 2340.16 Farragh P0025-04 O’ Donohoe 02 02 02 Proteins Waste Blood 296.59 College R911 Brian Keogh 02 02 03 Proteins Bovine Blood 1123.75 APC REN/241/89 APC 02 02 99 Technologies Technologies General waste 54.09 Panda 140-2 Panda 02 02 03 Waste Waste Sludge 1545.37 B. Dillon N/A M. Murtagh 02 02 04 Belly Grass 1890.72 B. Dillon N/A M. Murtagh 02 02 99 Oil 1.36 Enva Oil W0184-01 Enva 13 02 08
Cardboard 36.48
Panda 140-2
Panda Waste
15 01 01
Paper/Plastic 9.09
Panda 140-2
Panda Waste
15 01 02
There were no rejected wastes. All wastes were disposed of by approved and licensed contractors. 14. Complaints Summary Kepak received one complaint in 2009 regarding alleged odours from Kepak. On 11th February 2009 an odour complaint was received. The person making the complaint stated that there was a strong and offensive odour at the Paddocks bar and restaurant in Little Place Clonee. Kepak immediately carried out site investigation, the findings of which were presented to the EPA. The report contained details of the wind direction at the time and maps to explain that the odour was not from Kepak, as the wind was blowing in a different direction. However the report detailed that there was a land spreading odour in Clonee Village. In September the Environmental Officer identified odours in the village, and as a follow up a detailed investigation was carried out. The odours were identified as being from a construction site at Sterling road on the opposite side of the village to Kepak. The

30
following day a complaint was received from a resident at Hunter Road at Clonee (the complainant did not notify the EPA). The Environmental Officer explained to the complainant that the odour was not from Kepak and provided directions to the construction site. The Environmental Officer contacted the complainant back two days later to follow up on the situation. The complainant was very satisfied with the information which was provided by the Kepak Environmental Officer and explained that he would be following up with the local authorities with regards to the construction site. 15. Noise Monitoring Report Summary The night-time levels at all locations do not exceed the EPA Guideline levels for noise sensitive receivers when the ambient noise levels are stripped out. The daytime levels at all locations exceeded the EPA guidelines however when the external sources (traffic on the N3 and the R462, distance from source, etc) is removed the readings at all locations will be below the EPA guideline levels. Presently Kepak Clonee does not present a noise issue in the surrounding environment in regard to LAeq daytime or night time readings. No noise complaints have been received by Kepak Clonee in 2009. Noise Monitoring Report is attached. Appendix 1 16. Ambient Monitoring Summary Odour checks are carried out daily as part of the daily environmental monitoring programme. Odour monitoring points are located at (i) the front gate, (ii) behind the treatment plant, (iii) Side of the Lairage, (iv) Kilbride Roundabout located outside the premises and (v) Damastown Ind Estate Cross Roads also located outside the premises. No odours have been detected outside the perimeter. 17. Tank and Pipeline Testing and Inspection Report Underground CCTV pipe survey was carried out by Panda Waste Services, Navan, Co. Meath in January 2008. During this survey it was noted that some cracks were evident. Repairs were carried out to the affected line. Survey report and DVDs are kept on file in Technical Office at Kepak Clonee. Integrity testing of bunds was carried out in 2009 by Danny Graham, Maintenance Manager, Kepak Clonee. There were also monthly planned preventative maintenance pipework audits carried out by the maintenance department. 18. Reported Incidents Summary An environmental incident log is maintained in the Technical Office at Kepak Clonee. There were no incidents during 2009.

31
19. Proposed Energy Saving Projects
Install inverter speed controls on the sabroe condenser fans to control fan speed and the temperature of the refrigeration gas more accurately. This will have the knock on effect of reducing the amount of electricity to run the fans and it may also help to reduce the electrical load on the compressors.
Update the current chill monitoring system in order to closely monitor chilling
performance and energy consumption patterns. It may be possible to save substantial amounts of electricity by simply changing the chilling regimes. It could also highlight inefficiencies in the system, allowing for changes to be made to the gas pressure or highlighting the potential to upgrade processes.
20. Efficiency of Use of Raw Materials in Processes and the Reduction in
Waste Generated During 2009 a project was undertaken to reduce amounts of packaging and waste. Smaller sized suitable packaging is currently in use where it is appropriate. The amount of wrap used for pallet wrapping was reduced by installing a new pallet wrapping machine which pre stretches the plastic as the pallet is being wrapped. 21. Resource Consumption Summary
Energy 2009 2008 2007 2006 2005 Electricity (GW) 8.74 9.82 10.36 10.32 11.59
Heavy Fuel Oil (Litres)
966845 1160967 1132103 972000 1198053
Esso UL 95 (Litres) 10000 5000 7000 17000 18000
Auto Diesel (Litres) 50808 35000 50000 48000 72000
GAS Oil (Litres) 123015 150000 243465 117632 248903

32
Energy Usage
HFO Usage 2009
0
10,000
20,000
30,000
40,000
50,000
60,000
70,000
80,000
90,000
100,000
Jan Feb Mar Apr May Jun Jul Aug Sep Oct Nov Dec
Month
Litr
es
Well W ater Intake 2009
0
2000
4000
6000
8000
10000
12000
14000
16000
Jan Feb Mar Apr May Jun Jul Aug Sep Oct Nov Dec
Month
M3

33
Water Consumption
Source Unit 2009 2008 2007 2006 2005 On-site ground water
Well 1 +2 m3 161,787 185,410 197,755 216,809 260,480
2. Report on Progress Made and Proposals Being Developed to Minimise
Electricity Demand Electricity Usage During 2009 further improvements were made on electricity usage in the facility. This was reflected in a reduction in electricity usage. The electricity consumption was reduced by 11% in one year. The annual electricity consumption for 2009 was 8.74GW compared to 9.82GW in 2008. The electricity usage was reduced in 2009 by installing an energy management system to closely monitor consumption and identify area where electricity could be saved.
Electricity Units Used 2009
0
100000
200000
300000
400000
500000
600000
700000
800000
900000
Jan Feb Mar Apr May Jun Jul Aug Sep Oct Nov Dec
KW
Mon
th
Proposed Water, Oil and Electricity Saving Projects Over the course of 2010 Kepak will strive to reduce energy consumption. Kepak’s energy system will identify key areas of energy usage and help to find areas where energy can be saved. Our target reduction in overall energy for 2010 usage is 2%. The main area to target with regards to electrical usage is the refrigeration compressors. By

34
closely monitoring chilling and coolant pressure Kepak hope to reduce the electrical load on the compressors, and hence reduce overall electricity usage. 23. Review of Residuals Management Plan In the event of Kepak Clonee ceases its production a decommissioning plan has been identified. This plan is in accordance with Environmental Liabilities Risk Assessment. Equipment & Machinery Equipment and Machinery from the factory will be sent to other Kepak sites as required. Any equipment or machinery not used in other Kepak sites will be sold at auction. Building Materials Concrete will be crushed and re-used in the construction industry. Metal will be collected by approved haulier and recycled by licensed metal recycling company. Panels will be re-used in other Kepak sites or sold at auction. Oils and Chemicals Unused oils and chemicals will be collection by approved haulier and disposal of by licensed waste management company. All items will be decommissioned and removed in accordance with Health and Safety Regulations. A final evaluation report will be carried out by a structural engineer. 24. Statement of Measures in Relation to Prevention of Environmental
Damage and Remedial Actions (Environmental Liabilities) A comprehensive Environmental Management System is in place to prevent potential damage to the environment. Remedial actions have been documented and measures put in place. This will be updated in accordance with the ELRA. The ELRA / CRAMP reports were finalised by Rowan Engineering Consultants and submitted during May 2009.

35
Appendix 1
Environmental Noise Survey

36
Environmental Noise Assessment Report Location: Kepak Clonee Clonee Co Meath Date of Noise Survey: 29th October 2009 / 1st November 2009 Consultant: Michael O’ Connor BA Dip OSH MIOSH Safety Manager Kepak Group
Kepak Group Clonee Co Meath
Kepak Clonee IPPC Register Number: 167

37
DOCUMENT CONTROL SHEET
Client Kepak Clonee
Project Title Environmental Noise Assessment 2009
Document No. Kepak Clonee ENA 003
Version Status Author Reviewed by Approved by Issue Date
003 Current Michael O’ Connor Tom Rowan Michael Kelly
004

38
Table of Contents
1. Executive Summary .............................................................................................................................................. 39
1.1 Writer’s Credentials............................................................................................................................................. 39 1.2 Writer’s Instructions ........................................................................................................................................... 39 1.3 Conclusion............................................................................................................................................................ 41
2. Background to Noise Assessment........................................................................................................................7
2.1 EPA IPPC licence requirements and noise ....................................................................................................... 41 2.2 Noise assessment methodology............................................................................................................................ 42
3. Noise Assessment Results .................................................................................................................................. 43
3.1 Noise Sensitive Location’s (NSL’s)..................................................................................................................... 43 3.2 Site Boundary Noise Monitoring........................................................................................................................ 43
4. Discussion............................................................................................................................................................... 45
4.1 Bounadry Noise Measurements.............................................................................................................................. 45 4.2 Noise Sensitive Locations...................................................................................... Error! Bookmark not defined.
5. Conclusion .............................................................................................................................................................. 24
Appendix 1 Noise Monitoring Location Map ......................................................................................................... 26
Appendix 2 Equipment Calibration Certificates.................................................................................................... 62
Appendix 3 1:3 Octave band Analysis....................................................................................................................... 63

39
1. Executive Summary 1.1 Writer’s Credentials Michael O’ Connor 1974 Degree in Legal Science UCG 1989 Diploma in Safety and Health UCD / NEBOSH / IOSH 1990 Irish Defence Forces Safety Manager 1991 IOSH Noise assessment and measurement of noise at work 1995 MIOSH accredited 2002 Diploma in Continuing Education NUI Maynooth 1.2 Writer’s Instructions The aim of the survey is to provide information on the Environmental noise levels emitting from the plant and the effect if any to Domestic and commercial dwellings in the vicinity of the plant. The aim of the survey is to indicate thought the measurement taken on the day of the survey if the noise levels exceed EPA noise level guidelines. 1.3 Conclusions 1.3.1 Location of the Facility
The facility is located in a low density commercial area approx one (1) kilometre from the village of Clonee. The N3 and the R462 run along the Western boundary of the site. The River Tolka flows on the Eastern side of the site with commercial property (approx 800m) from the perimeter on the South and East of the site. The site boundary on the North is Green belt. A tree and fence line surrounds the site and all measurements were taken inside this fence. The nearest noise sensitive location (a commercial property) is approx 800m from the Southern and Eastern boundary. This property is in line of sight on the Eastern perimeter. Trees and hedgerows cover the dead ground between the commercial property and the site boundary. The N3 and R 462 run along the Western boundary and the village of Clonee is approx 1km west of this boundary. The line of sight on the Western boundary is broken by the 2 road ways, hedgerows and trees. There are no other domestic or commercial dwellings within a considerable distance or line of sight of the site.
1.3.2 Reference Documents
The following documents were used for this survey:- ISO 1996 Part 1, 2 and 3 BS 4142:1997 EPA Guidance Notes on Noise 2003 Noise Regulations 2006
1.3.3 Date of the Survey and Meteorological Conditions:

40
29th October 2009 Day Time Measurements 11:27-17.23 Hrs
Temp range: Wind speed: Wind direction: Precipitation: Relative humidity: Atmospheric Pressure:
15-16°C 7 Knots South / South East Full cloud cover, .2mm drizzle 49-60% 1015.8 mBar
1st November 2009 Night Time Measurements 23:29 - 00:52 Hrs
Temp range: Wind speed: Wind direction: Precipitation: Relative humidity: Atmospheric Pressure:
6 - 8 °C 14 Knots South Westerly cloud cover - 3mm - Rain 87%
888 mBar
1.3.3 Type of Instrumentation
See Appendix 2 1.3.4 Calibration Information
All instrumentation is calibrated to IEC 942: 1988 CLASS 2L ANSI SI.40 – 1984 The Sound Level Meter was calibrated on site prior and subsequent to the measuring process using the piston phone. See appendix 2
1.3.5 Measurement Methodology
Due to the isolated nature of the site it was not considered necessary to measure at the nearest noise sensitive locations (Clonee Village or the commercial property) as the distance from the site would make it impossible to accurately measure the noise levels emitting from the site. Therefore measurement locations were chosen inside the perimeter fence at the specific points on the site. Measurement times and noise descriptors are as per EPA guidance. In this case night time measurements were taken between 19.00 hrs and 02.00 hrs and daytime measurements were taken between 11.00 hrs and 14.00 hrs. Measurements were taken at 1.5 m height above ground level and all were more than five (5) meters from building facades.

41
1.3.6 Conclusions 1.3.6.1 This conclusion is my professional opinion based on the noise survey carried
out at Kepak Clonee 1.3.6.2 The night-time levels at all locations do NOT exceed the EPA guideline levels
for noise sensitive locations when the ambient noise levels are striped out. 1.3.6.3 The remoteness of the plant from any noise sensitive location, both domestic
and commercial, has to be considered, and if this noise is attenuated using the distance rule, the limits are well within the EPA guideline limits.
1.3.6.4 No tractor units running and noise levels from the N3 and R462 exceed the
guidelines due to the volume of traffic on both roads. See 1/3 Octave band analysis.
1.3.6.5 Even if the LAF max at the reading points at the perimeter fence is used and if
this level is attenuated at over a distance – (500m to 1000m) the site meets the EPA recommended guideline levels for noise sensitive locations. These roads are Environmental Noise factors and are not attributed to any Noise emission from Kepak Clonee.
1.3.6.6 The sound intensity varies roughly as the inverse square of the distance from
the source. This means that for each doubling of the distance, a 6db reduction in the noise level is expected. However, atmospheric attenuation adds about 1.2 db of reduction per 1000 ft so that increasing the distance from 1000 ft to 2000 ft results in about 7.2db attenuation. The presence of various obstacles and absorbing material, e.g., trees and shrubs, the structure of the building and the services at the rear of the building is sometimes taken into account by adding 25% to the actual distance and considering this an effective distance.
1.3.6.7 Therefore noise sensitive areas which are at a distance of 1000m, the
attenuation of the noise levels will be approximately 9 Db. If this attenuation is A weighted the expectation of the noise level which could be attributed to the site will be in the order of < 40dB (A).
1.3.6.8 The daytime levels at all locations exceeded the EPA guidelines however
when the external sources (traffic on the N3 and the R462, distance from source, etc) is removed the readings at all locations will be below the EPA guideline levels.
2. Background to Noise Assessment 2.1 EPA IPPC licence requirements and noise
Kepak Clonee has an IPPC Licence from the EPA. As part of their IPPC licence requirements, there is a specific obligation to carry out routine noise monitoring on site annually. Within their IPPC licence, Condition 8 outlines the following in regard to noise:
Regulatory Conditions

42
The licensee shall carry out a noise survey of the site operations annually. The licensee shall consult with the Agency on the timing, nature and extent of the survey and shall develop a survey programme to the satisfaction of the Agency. A record of the survey results shall be available for inspection by any authorized persons of the Agency, at all reasonable times and a summary report of this record shall be included as part of the AER.’ It is recognized that environmental noise monitoring shall not give rise to noise levels off-site, at noise sensitive locations which exceed the following sound pressure limits (Leq, 15 minutes) subject to Condition 3 of this licence: Daytime: 55 dB (A) & 8.1.2 Night-time: 45 dB (A). There shall be no clearly audible tonal component or impulsive component in
the Noise emission from the activity at any noise sensitive location
The EPA define a noise sensitive location (NSL) as a ‘Any dwelling house, hotel or hostel, health building, educational establishment, place of worship or entertainment, or any other facility or area of high amenity which for its proper enjoyment requires the absence of noise at nuisance levels’. In regard to noise the EPA define ‘daytime to be 08.00 hours to 20.00 hours’ and ‘night time to be 20.00 hours to 08.00 hours’.
2.2 Noise assessment methodology 2.2.1 In order to assess the surrounding environmental noise levels, a daytime
and night time noise survey was carried out on the 29th October 2009 and on the 1st November 2009 at a number of monitoring locations on the boundary of the site. On the day of the monitoring the site was in full production. The prevailing weather conditions at the time of measurements are contained in the Executive Summary to this report and in summary the weather was poor with wind speeds of 7 – 14 knots.
2.2.2 The site ceased production at 17.00hrs but traffic continued to enter and
exit the site up to 22.00hrs. 2.2.3 Michael O’ Connor of Kepak Group undertook all monitoring and drafted
this report.
2.2.4 Noise measurements for 15 minutes were taken at the boundary locations. The noise monitoring locations are illustrated on the maps in Appendix 1.
2.2.5 The equipment used during this noise survey was a Type 1 Sound Level. The certificates of calibration for the meter and calibrator are included in Appendix 2.
2.2.6 All measurements were carried out in general accordance with ISO 1996:
‘Acoustics- Description and measurement of environmental noise’ and EPA guidelines in regard environmental noise, ‘Environmental Noise Survey Document’, 2003.
2.2.7 Measurements were made placing the microphone at a height of 1.5m
above ground level and were free field, measured >2m from any reflecting surfaces. Before and after the survey the measurement apparatus was checked and calibrated to an accuracy of +/- 0.3dB. Weather conditions

43
during the surveys were in line with the conditions described within ISO 1996, Acoustics ‘Description and Measurements of Environmental Noise.
2.2.8 The measurement results were noted onto survey record sheets
immediately following each measurement and also stored in the instrument’s internal memory for subsequent analysis, notes were taken in relation to the primary contributors to noise build-up at each location.
2.2.9 A 1/3 octave frequency analysis was also carried out. The results of this
analysis are outlined in Section 3 of this report. 2.2.10 Environmental noise parameters which were measured are defined below.
LAeq is the A-weighted equivalent continuous steady sound level during the measurement period and effectively represents an average ambient noise value. LA10 is the A-weighted sound level that is exceeded for 10% of the measurement period and is used to quantify road traffic noise. LA90 is the A-weighted sound level that is exceeded for 90% of the measurement period and is used to quantify background noise level. A-weighting is the process by which noise levels are corrected to account for the non-linearity of human hearing. All noise levels quoted are relative to a sound pressure of 2x10⁻⁵ Pa. Typical ranges of noise levels are presented in the Table 1 below to compare against the baseline noise levels measured:
Sound levels in decibels dB (A) Description of Activity
0 Absolute silence 25 Very Quiet room 35 Rural night time setting with no wind 55 Day time, busy roadway 0.5km away 70 Busy restaurant 85 Very busy pub, voice has to be raised to be heard
100 Disco or rock concert 120 Uncomfortably loud, conversation impossible 140 Noise causes pain in ears
Source: Guidance Note for Noise in relation to Scheduled activities, 2nd Edition, EPA 2006.
3. Noise Assessment Results 3.1 Noise Sensitive Location’s (NSL’s) No noise sensitive locations (NSL’s) were monitored as part of the noise survey (See map in Appendix 1). This is due to the location of the site and the distance from any inhabited dwelling. If the Night and Day time levels were above the EPA guidelines at the boundary then any dwellings close to the site would have been measured and assumed to be an NSL in the survey. 3.2 Site Boundary Noise Monitoring Four (4) boundary readings were taken around perimeter of the site during the day while the abattoir was fully operational and at night time when the site was closed. The boundary measurements were taken for 15 minutes. The results of this monitoring are displayed in the Measurement Tables below and defined in Table 8. Table 8 Boundary monitoring 29/10/09

44
Map Reference Monitoring Location Comments
BD1 Main Entrance Gate
The chosen location was just inside the entrance gate to the site for all vehicles. The abattoir was operational on the day of the reading. This is the main entrance to the site and it is expected that a substantial amount of heavy and light vehicular traffic is present during production days. The ambient noise level from the road is always high with High volumes of traffic travelling along the R462 and the N3. The volume of cars and trucks reduces at night and vehicles entering the site during non production hours (Night time) is low.
BD2 Perimeter fence R462)
The levels measured at this location will always exceed the EPA Guideline. This noise level was contributed to by Traffic Volumes on the N3 and the R462. When attenuated the residual noise level peaked during the day time with night time levels very much reduced but still exceeding EPA limit Guidelines.
BD3 Fence on the North of the
property
Readings at the rear of the site will always read less than the Front of the site. There are no traffic volumes in this area (Agricultural land) but air handling noise will be present. There are no noise sensitive domestic or commercial properties in this area.

45
BD4 Eastern side of the site with commercial property in the distance
This part of the site is 800m from the commercial property on the east of the site. This area it at the rear of the plant and the residual noise levels for day time respectively. There are no noise sensitive domestic properties in this area. The only property is a commercial property 800 m from reading point. It is therefore considered that the levels more accurately reflect the plant noise output. These noise levels place this part of the site within the EPA recommended levels and distance from the nearest dwelling ensures the noise is attenuated to a level well below the recommended levels.
4. Discussion 4.1 Boundary Noise Measurements 4.1.1 Ambient noise measurements were taken at four (4) locations around the site.
These locations are located on the Boundary. See Appendix 1.

46
4.1.2 Looking at each individual location and the results of the LA90 [noise level for 90% of the time] and LA10 [noise level for 10% of the time], the following was found:-
The measurements are contained in special tables attached to the report
and they list the specific detail of the survey which indicates if the levels are above, within or below the EPA guidelines.
The night-time levels at all locations do not exceed the EPA guideline levels for noise sensitive locations when the ambient noise levels are striped out. The remoteness of the plant from any noise sensitive location, both domestic and commercial, has to be considered, and if this noise is attenuated using the distance rule, the limits are well within the EPA guideline limits.
No tractor units running on site and noise levels from the N3 and R462 exceed the guidelines due to the volume of traffic on both roads.
The LAF max at the reading points, perimeter fence and main gate are analysed and if this level is attenuated at over a distance – (500m to 1000m) the site meets the EPA recommended guideline levels for noise sensitive locations.
The roads are a Local Authority responsibility and any emission attributed to the road is not the responsibility of Kepak Clonee.
The sound intensity varies roughly as the inverse square of the distance from the source. This means that for each doubling of the distance, a 6db reduction in the noise level is expected. However, atmospheric attenuation adds about 1.2 db of reduction per 1000 ft so that increasing the distance from 1000 ft to 2000 ft results in about 7.2db attenuation. The presence of various obstacles and absorbing material, e.g., trees and shrubs, near the ground is sometimes taken into account by adding 25% to the actual distance and considering this an effective distance.
Therefore noise sensitive area which is at a distance of 1000m the attenuation of the noise levels will be approximately 9 Db. If this attenuation is A weighted the expectation of the noise level which could be attributed to the site will be in the order of < 40dB (A).
The daytime and Night time levels at all locations exceeded the EPA guidelines however when the external sources (traffic on the N3 and the R462, distance from source, etc) is removed the readings at all locations are below the EPA guideline levels.

47
48

49

50

51

52

53

54

55

56

57

58

59

60
5. Conclusions Presently Kepak Clonee does not present a noise issue in the surrounding environment in regard to LAeq daytime or night time readings. No noise complaints have been received by Kepak Clonee since the last noise survey in 2008. The next environmental noise survey will be undertaken in October 2010. __________________________ Michael O’ Connor Safety Manager Kepak Group Date: 4th November 2009

61
Appendix 1 Noise Monitoring Location Map – Kepak Clonee
BD 1
BD 2
BD 4
BD 3

62
Kepak Clonee – Thatch, Factory and Car park
BD 1
BD 2
BD 3
BD 4

63
Appendix 2 Equipment Calibration Certificates

64

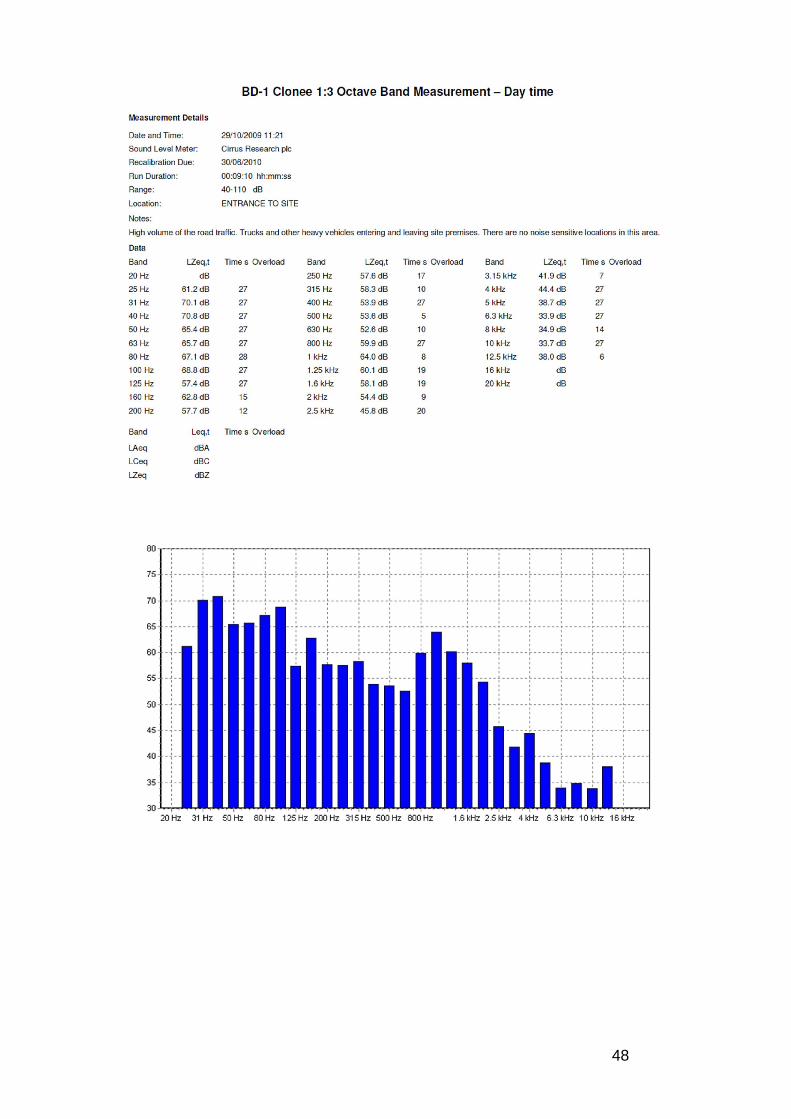
Appendix 3 – 1:3 Octave Band Noise Result Details of the 1/3rd Octave Noise Results Day and Night 29th October 09 and the 1st November 2009 are provided in the following table for the Boundary areas where it is indicated in the survey that we have exceeded the EPA guidelines. If no part of the site exceeds the EPA guidelines then this 1/3 octave band analysis is a measurement at 2 specific sampling points on the site Boundary. Noise Standard ISO1996-2 details that a prominent tonal component may be detected in one-third octave spectra if the level of a one-third octave band exceeds the level of the adjacent bands by 5dB or more. No Impulsive Noise was recorded at both Monitoring locations. See measurements attached - 1/3 Octave band readings taken at BD 1 and BD 4 for day and nigh time.

Kepak Clonee Annual Environmental Report
Page 66
BD 1 - Entrance to site on road. 1/3 Octave band taken at this location

Kepak Clonee Annual Environmental Report
Page 67
BD 1 – Looking back into the site
BD 2 – Boundary fence on the road looking back into the site.

Kepak Clonee Annual Environmental Report
Page 68
BD 2 – looking back into the site

Kepak Clonee Annual Environmental Report
Page 69
BD 4 – North West boundary of the site - 1/3 Octave band taken at this location

Kepak Clonee Annual Environmental Report
Page 70
BD 3 – Looking back into the site from the dry goods store

Kepak Clonee Annual Environmental Report
Page 71
Appendix 2
AER Returns Worksheet

Kepak Clonee Annual Environmental Report
Page 72

Kepak Clonee Annual Environmental Report
Page 73

Kepak Clonee Annual Environmental Report
Page 74

Kepak Clonee Annual Environmental Report
Page 75

Kepak Clonee Annual Environmental Report
Page 76

Kepak Clonee Annual Environmental Report
Page 77

Kepak Clonee Annual Environmental Report
Page 78