kevin x. d. huang, chun jiang, qingyuan li, kai sheng, jia
TRANSCRIPT

Front. Econ. China 2013, 8(2): 165–185 DOI 10.3868/s060-002-013-0008-2
Received January 8, 2013 Kevin X. D. Huang ( ) Department of Economics, Vanderbilt University, Nashville, TN 37235-1819, USA E-mail: [email protected] Chun Jiang, Qingyuan Li, Qiwei Zhao School of Economics and Management, Wuhan University, Wuhan 430072, China Jia Wang World Financial Group, 3300 Holcomb Bridge Road, Norcross, GA 30092-5405, USA Kai Sheng School of Mathematical Sciences, Peking University, Beijing 100871, China
RESEARCH ARTICLE
Kevin X. D. Huang, Chun Jiang, Qingyuan Li, Kai Sheng, Jia Wang, Qiwei Zhao
Financial Development, Foreign Direct Investment, and the Efficiency of Capital Allocation in China Abstract We study the roles of local financial development and foreign direct investment, and more importantly, their interaction with one another, in local capital allocation, based on Chinese industrial and regional data. Our main finding is that, although local financial development and FDI each individually tended to improve the efficiency of local capital allocation during the sample period, they tended to compete and crowd out each other’s effect, so that one impaired the individual function of the other. In particular, there exists a threshold value for local financial development, above which an increase in FDI reduces the efficiency of local capital allocation, rather than improve it. On the other hand, there exists a threshold value for FDI, above which further development in the local financial system lowers the efficiency of local capital allocation, rather than increase it. Our estimations suggest that the levels of FDI and local financial development in some relatively more developed Chinese regions have already surpassed such threshold values. We provide some interpretations of our findings and we discuss potential policy implications. Keywords foreign direct investment (FDI), local financial development, capital allocation efficiency JEL Classification F23, F36, F43, O16
1 Introduction
The relationship between financial development (FD) and economic growth has

166 Kevin X. D. Huang, Chun Jiang, Qingyuan Li, Kai Sheng, Jia Wang, Qiwei Zhao
long been studied in the literature. A large body of empirical work based on country and industry level data provides evidence that supports a well-established theoretical view that a more developed financial system promotes growth (e.g., King and Levine, 1993a&b; Levine, 1997&2002; Levine and Zervos, 1998; Rajan and Zingales, 1998; Beck et al., 2000a&b; Levine et al., 2000; Beck and Levine, 2002a&b). A number of empirical studies have also been carried out to investigate the role of foreign direct investment in productivity and growth (e.g., Borensztein et al., 1998; Aitken and Harrison, 1999; Xu, 2000). In particular, Alfaro et al. (2004) by using cross-country data between 1975 and 1995 find that, although FDI alone plays an ambiguous role in contributing to economic growth, countries with well-developed financial markets are able to benefit more from FDI to promote their economic growth (see Hermes and Lensink, 2000; Carkovic and Levine, 2003).
There are potentially different ways in which financial development may affect economic growth. One discussed in the finance-growth literature is that a well-functioning financial system may help allocate capital more efficiently to enhance productivity and thus promote growth. The idea goes back to Schumpeter almost a century ago, and is later tested by applying formal econometric methods to industry and country level data by Wurgler (2000), who verifies that even if financial development does not lead to higher levels of investment, it can allocate the existing investment better and hence promote economic growth. Here we also emphasize the potential role of foreign direct investment in local capital allocation. Enhancing the efficiency of capital allocation has been a central challenge to China in its attempt to transition from extensive growth, based on higher levels of factor inputs, to intensive growth, for which more efficient factor allocations are key. For the emerging and transitional Chinese economy, FDI has served as an especially important channel in conjunction with the domestic financial system for allocating capital. An important question facing the Chinese economy is whether FDI and the domestic financial system are substitutes or complements to one another in affecting the efficiency of its capital allocation.
In this paper, we take on this question. Our analysis is built on the insights developed in the two strands of literature, the general literature on finance and growth, and the recent literature on FDI in its relation to local capital allocation in emerging and transition economies, especially China.
It is often argued that an important difference between FDI and other forms of international capital flows is that FDI can enter a host country without necessarily going through its local financial intermediaries or financial markets, and this is especially important for countries with incomplete or inefficient financial systems, which is usually the case for less developed economies (e.g., Hausmann and Fernandez-Arias, 2000). Viewed in this way, FDI may serve as a

Financial development, FDI, and the efficiency of capital allocation in China 167
substitute for a developing country’s imperfect financial system in allocating capital to its domestic productive sectors. The past decade has witnessed an increased share of FDI in private international capital flow to developing countries. Ju and Wei (2007) observe that many developing countries, such as the East Asian economies, are net exporters of funds while at the same time have net FDI inflows: their domestic savings are invested in foreign financial securities, while their domestic production is financed by FDI, bypassing their underdeveloped domestic financial system. The situation in China has been just like this since the 1990s. It is now the largest holder of the US government bonds and the largest FDI recipient among developing countries. As Bai (2006) points out, the usual argument based on the saving-investment gap can no longer provide a rational for China to attract FDI, granted its high growth and saving rates over the past few decades; yet, with the belief that FDI can help identify growth opportunities more efficiently (and in some case create growth opportunities, say, through export-oriented FDI), it can make up for the low efficiency of domestic financial intermediaries and financial markets in allocating capital to its productive sectors. In other words, the country outsources its investment allocation decisions to FDI. There is also evidence that some of the recent FDI flows into financial rather than real sectors in China, which may lead to a hypothesis that foreign and domestic funds may complement one another to improve the efficiency of capital allocation in the Chinese economy. However, there is also evidence that the main forces driving the continued FDI inflows to China come from distortions in its financial and, more generally, its political and economic systems, rather than its rising economic power. Thus, a comprehensive description of the role of FDI should take into account domestic financial and general political and economic systems in their ability to allocate capital and general economic resources and opportunities.
The existing studies on the relationship between China’s financial development, FDI, and efficiency of capital allocation are mostly theoretical and so there lacks an empirical test. This paper attempts to fill this gap. The crux of our empirical analysis rests upon the following observation: although an important goal of China in its transition to becoming a market economy is to establish a unified national market and reduce the barriers in regional trade and finance, local government protection and regional market segmentation remain the status quo. In particular, regional financial systems remain highly fragmented, with multiple barriers to fund mobility (e.g., Boyreau-Debray et al., 2004). It is therefore more appropriate to analyze financial development, FDI, and their interaction from the regional perspective rather than from the perspective of the nation as a whole. The cross-region approach shares the empirical methodology with the cross-county studies in the finance-growth literature (e.g., King and Levine, 1993a; Levine and Zervos, 1998; Levine et al., 2000; Wurgler, 2000),

168 Kevin X. D. Huang, Chun Jiang, Qingyuan Li, Kai Sheng, Jia Wang, Qiwei Zhao
without also sharing the problems commonly encountered in these cross-county analyses, such as data incomparability, measurement errors, and missing data, among others (e.g., Levine et al., 2000; Wurgler, 2000). Our data span 28 regions, and 27 industries and sectors for the period between 1999 and 2006. While this choice of sample period allows our investigation to take account of the effects of some major reforms in the Chinese financial system that occurred during this period of time, at the same time it helps to insulate the effects of the 1997–1998 Asian Financial Crisis and of the more recent financial crisis and Global Recession that lasted from 2007 to 2009, and, more importantly, to ensure consistent data measurements to be used in our study, which are available to us only for this period of time. We construct measurements of FDI using the standard methods (e.g., Borensztein et al., 1998; Alfaro et al., 2004) applied at the regional level, we generalize Wurgler’s (2000) method to the regional level to estimate the efficiencies of regional capital allocation, and we estimate the levels of regional financial development based on a fixed-effect cross-sectional panel regression with first-order auto-correlated error terms. The latter are measured by the ratios of total credits extended to regional non-state-owned enterprises to regional GDP, to help eradicate the distortions created by policy-oriented command credits given to state-owned enterprises, as in Aziz and Duenwald (2002) and Ljungwall and Li (2007). Applying system GMM to control for potential reverse causality among the variables, we estimate the contributions of FDI, local financial development, and their interaction with one another to the efficiencies of China’s regional capital allocation.
Our main results are easy to summarize. We find that, though regional financial development and FDI each individually tend to improve the efficiency of regional capital allocation in China over the sample period, they tend to compete and crowd out each other’s effect so that one impaired the function of the other. In particular, there exists a threshold value for local financial development, above which an increase in FDI reduces the efficiency of local capital allocation, rather than improves it. On the other hand, there exists a threshold value for FDI, above which further development in the local financial system lowers the efficiency of local capital allocation, rather than increases it. We present evidence that the levels of FDI and local financial development in some relatively more developed regions, including Beijing, Shanghai, Guangdong, Jiangsu, Tianjin, and Hainan, have already surpassed such threshold values. We provide an interpretation of our findings and discuss their policy implications.
In what follows, we describe our data construction and empirical methodology in Section 2, report our estimation results and analyses in Section 3, and conclude in Section 4.

Financial development, FDI, and the efficiency of capital allocation in China 169
2 Data Construction and Empirical Methodology
For our cross-region study, we construct measurements for the efficiency of local capital allocation, local financial development, and foreign direct investment from China’s regional and industry level statistics on net fixed assets, industry value added, bank credits, local fiscal expenditure net spending on science, education, culture, and health, local industry gross fixed capital formation, FDI and exports (converted from USD into RMB using spot exchange rates), employment, gross industry production by state-owned enterprises (SOEs) and above-scale non-state-owned enterprise (NSOEs), that is, with annual sales of over 5 million yuan, local infrastructure, local economic structure, local GDP, and state-owned enterprise reform, which are drawn from China Industrial Economy Statistical Yearbook, China Economic Census Yearbook, Almanac of China’s Finance and Banking, China Statistical Yearbook for Regional Economy, and China Statistical Yearbook. We exclude Tibet from our sample due to a lack of statistics for this region. Also excluded from the sample is the Sichuan-Chongqing region as it is difficult to separate the FDI data for the period before Chongqing became a separate municipality. Our sample thus spans 28 regions and 27 industries and sectors. Along the time dimension, our sample covers the period of 1999–2006. The choice of this sample period allows our analysis to capture the effects of some major reforms in the Chinese financial system that occurred during this period of time, while at the same time helps to reduce the effects of the 1997–1998 Asian Financial Crisis and the more recent financial crisis and Global Recession that lasted from 2007 to 2009, but, more importantly, to ensure consistent measurements of data are used in our analysis, which are available to us only for this period of time.
2.1 Constructing a Measurement for the Efficiency of Regional Capital Allocation
A well-functioning financial system should lead to increasing investment in growing industries (with higher rates of return) and decreasing investment in declining industries (with lower rates of return), and it is intuitive to assume that a more efficient capital allocation should correspond to a more elastic response in investment to rates of return. Based on this idea, Wurgler (2000) developed an empirical method to measure the efficiency of capital allocation across 65 countries, and he found that a key for the economic success of developed countries compared to developing countries lied with their higher efficiency of capital allocation rather than greater levels of investment. The method is widely accepted in the literature and has been extensively applied by researchers for measuring the efficiency of capital allocation across countries, regions, and
170 Kevin X. D. Huang, Chun Jiang, Qingyuan Li, Kai Sheng, Jia Wang, Qiwei Zhao
industries (e.g., Beck and Levine, 2002; Almeida and Wolfenzon, 2005). Here we apply the method to construct a measure for the efficiency of regional
capital allocation based on a panel of cross-sectional observations for 27 industries from 28 of China’s regions over the period of 1999–2006. In the spirit of Wurgler (2000), our model assumes that investment growth in industry net fixed assets (that can be highly correlated with industry gross fixed capital formation) is determined by industry value added growth (that reflects investment opportunities). As capital chases more profitable investment opportunities, an industry’s value added growth determines the industry’s investment growth. This leads to the following specification for each Chinese region in the sample:
, ,, , ,
, 1 , 1Ln Ln ,ic t ic t
c t c t ic tic t ic t
I VU
I Vα η
− −
⎛ ⎞ ⎛ ⎞= + +⎜ ⎟ ⎜ ⎟⎜ ⎟ ⎜ ⎟
⎝ ⎠ ⎝ ⎠ (1)
where I is investment in net fixed assets,1 V is value added, i, c, and t are industry, region, and year indexes, respectively, ηc,t is the elasticity of investment with respect to the growth prospects of region c’s industries in year t, which measures the extent to which region c in year t increases investment in its growth industries and decreases investment in its declining industries, and which is the measurement for the efficiency of capital allocation (for the given region in the given year) that we aim to construct for our subsequent empirical investigation, and Uic,t is an error term. Real values of net fixed assets and industry value added are derived from deflating the nominal series by the regional Price Indices for Fixed Asset Investment and regional PPI, respectively, taking 1999 as the base year. We exclude observations for which the absolute value of either the logarithm of net fixed asset growth or the logarithm of industry value added growth exceeds one in order to reduce the influence of outliers, which is in line with Wurgler (2000). We allow the investment-value added elasticity to be both region and year specific in order to capture the potential effect of several major financial reforms in China during the sample period, and we allow the constant term αc,t to be both region and time dependent to capture a potentially time-varying region fixed effect. In effect, our sample used in running the regression based on Eq. (1) contains 191 panels of 4,197 region-year-industry specific observations.2 Our region-year specific estimates of the investment-value added elasticity from Eq. (1) will serve as an input in our subsequent empirical analysis. 1 Similar estimates are obtained when we replace this measure with investment in gross fixed assets. 2 We lose five cohorts of observations due to missing data on Price Indices for Fixed Asset Investment from 1999 to 2000 for Guangdong and missing data on PPI from 1999 to 2001 for Hainan.

Financial development, FDI, and the efficiency of capital allocation in China 171
2.2 Measuring Regional Financial Development An ideal measurement for financial development is the cost of capital. Lacking data on the price of finance, however, researchers usually reply on quantity indicators, such as the size of equity and credit markets relative to GDP, as a proxy for the general level of financial development. In the financially repressed Chinese economy during the period, financial development following a series of institutional reforms brought with them more bank autonomy, the reduction and elimination of command credits, and the marketization of financial decisions (e.g., Levine and King, 1993), while equity markets were less developed and less important. That said, the country’s banking system was still characterized to a large extent by policy-oriented command credits, non-performing loans, and corruption (e.g., Chen and Feng, 2000). Hence, using the total credit to GDP ratio as a proxy may overstate the level of financial development and mask its relationship to economic growth (e.g., Aziz and Duenwald, 2002). Existing studies based on the experiences of other countries reveal that bank decisions on extending credits to private sectors are usually more market-based and the loans are also more efficient. As a consequence, the ratio of private sector credit to GDP has been widely used to measure the level of financial development. However, there are a large number of private-public joint-ventures in the Chinese economy. Thus, using the private sector credit to GDP ratio as a proxy may understate the level of financial development.
We here adapt the approach suggested by Aziz and Duenwald (2002) to measure China’s regional financial development. The idea is to divide total bank credit into credit issued to state-owned enterprises (SOEs) and credit extended to non-state-owned enterprises (NSOEs), and based on the close correlation between the ratio to GDP of total bank credit issued to SOEs and the contribution by SOEs to total industrial production, we then run a cross-regional fixed-effect panel regression with a first-order autoregressive error term to estimate the level of financial development across regions. The regression decomposes the ratio to GDP of total bank credit (fin) into the ratios to GDP of total bank credit extended to SOEs and to NSOEs, according to
, , ,c t c t c c tfin soeα β ϑ μ= + + + , where , , 1 ,c t c t c tμ ρμ δ−= + , 1,ρ < (2) where soec,t is the contribution by SOEs to total industrial production in region c in year t, thus βsoec,t captures the ratio to GDP of total bank credit issued to SOEs, and the remaining three terms on the right hand side of Eq. (2) sum up to the ratio to GDP of total bank credit extended to NSOEs. The regional dummy variable ϑc is meant to capture the difference in the level of development of NSOEs across regions, while the AR(1) process for μc,t is meant to allow for potential serial correlations in the error term, as suggested by Aziz and Duenwald (2002).
172 Kevin X. D. Huang, Chun Jiang, Qingyuan Li, Kai Sheng, Jia Wang, Qiwei Zhao
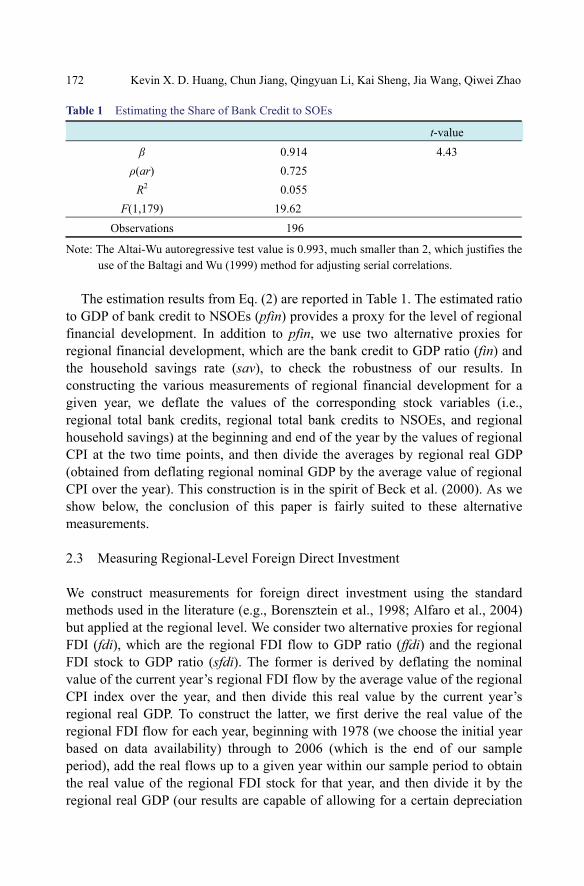
Table 1 Estimating the Share of Bank Credit to SOEs
t-value β 0.914 4.43
ρ(ar) 0.725 R2 0.055
F(1,179) 19.62 Observations 196
Note: The Altai-Wu autoregressive test value is 0.993, much smaller than 2, which justifies the use of the Baltagi and Wu (1999) method for adjusting serial correlations.
The estimation results from Eq. (2) are reported in Table 1. The estimated ratio
to GDP of bank credit to NSOEs (pfin) provides a proxy for the level of regional financial development. In addition to pfin, we use two alternative proxies for regional financial development, which are the bank credit to GDP ratio (fin) and the household savings rate (sav), to check the robustness of our results. In constructing the various measurements of regional financial development for a given year, we deflate the values of the corresponding stock variables (i.e., regional total bank credits, regional total bank credits to NSOEs, and regional household savings) at the beginning and end of the year by the values of regional CPI at the two time points, and then divide the averages by regional real GDP (obtained from deflating regional nominal GDP by the average value of regional CPI over the year). This construction is in the spirit of Beck et al. (2000). As we show below, the conclusion of this paper is fairly suited to these alternative measurements. 2.3 Measuring Regional-Level Foreign Direct Investment We construct measurements for foreign direct investment using the standard methods used in the literature (e.g., Borensztein et al., 1998; Alfaro et al., 2004) but applied at the regional level. We consider two alternative proxies for regional FDI (fdi), which are the regional FDI flow to GDP ratio (ffdi) and the regional FDI stock to GDP ratio (sfdi). The former is derived by deflating the nominal value of the current year’s regional FDI flow by the average value of the regional CPI index over the year, and then divide this real value by the current year’s regional real GDP. To construct the latter, we first derive the real value of the regional FDI flow for each year, beginning with 1978 (we choose the initial year based on data availability) through to 2006 (which is the end of our sample period), add the real flows up to a given year within our sample period to obtain the real value of the regional FDI stock for that year, and then divide it by the regional real GDP (our results are capable of allowing for a certain depreciation
Financial development, FDI, and the efficiency of capital allocation in China 173
rate, i.e., 5%, to annual FDI flow). 2.4 Model and Empirical Methodology The core idea behind our empirical model and methodology is drawn from the finance-growth literature, in which system GMM has become a workhorse for estimating dynamic models of panel data to examine the relationship between financial development and economic growth (e.g., Levine et al., 2000; Boyreau-Debray, 2003; Loayza and Ranciere, 2004; Beck and Levine, 2004; Chen, 2006). The method helps to deal with potential issues of endogeneity of the explanatory variables, the measurements for regional financial development and FDI in our model, reverse causality between the explanatory variables and the dependent variable and measure the efficiency of regional capital allocation, as well as to control for unobservable time and region specific effects, such as those due to differences in geographical or climatic conditions, or the impact of macroeconomic policies across regions (e.g., Bond et al., 2001). While helping to deal with the potential issues of unit roots and fixed effects, and correlations between the lagged dependent variable and the error term, at the same time, the application of the method for our dynamic model of panel data also allows our analysis to take account of information embedded in cross-section variations in levels as well as in differences, to help achieve more efficient estimations of the contributions of regional financial development and FDI, and more importantly, of their interaction with one another with regard to the efficiency of regional capital allocation (e.g., Roodman, 2006). These advantages are particularly helpful for our cross-region analysis of China, as the usual instruments adopted in cross-country analysis for dealing with the issue of endogeneity of financial development, such as the origin of law, are not valid here, as there does not seem to be any systematic difference in legal, political, or financial systems across the different Chinese regions in our sample (e.g., Guariglia and Poncet, 2008).
Our empirical model is specified as follows: '
, 1 , -1 2 , 3 , 4 , , ,
', 1 , -1 2 , 3 , 4 , ,
= + * ,
= + ( * ) ,c t c t c t c t c t c t i t
c t c t c t c t c t c t it
fdi fd fdi fd control
fdi fd fdi fd control
η α η β β β γ ε
η α η β β β γ ε
⎧ + + + +⎪⎨Δ Δ Δ + Δ + Δ + Δ + Δ⎪⎩
where c and t are region and year indexes, respectively, η is the measurement of the efficiency of capital allocation constructed in Section 2.1, fd is a measurement of financial development constructed in Section 2.2, including the primary measurement, share of bank credit to NSOEs (pfin), and the two alternative measurements, ratio of total bank credit to GDP (fin) and the household savings rate (sav), fdi is a measurement of FDI constructed in Section 2.3, including ratios of the current year’s foreign direct investment flow and stock to GDP (ffdi and sfdi), control is a vector of control variables, including
(3)
174 Kevin X. D. Huang, Chun Jiang, Qingyuan Li, Kai Sheng, Jia Wang, Qiwei Zhao
industry gross fixed capital formation (inv), exports (export), infrastructure (infra), economic structure (czp), net fiscal expenditure (gov), human capital (human) that corresponds to the average number of years of schooling for the population aged 6 years of age or above in the region,3 and SOE reform (njob), which are used to help identification, and is an error term. It is important to point out that, our model specification above allows for an interaction effect, fdi*fd, which equals the product of foreign direct investment (fdi) and financial development (fd), to help examine whether the presence of one factor strengthens or weakens the effect of the other on the efficiency of local capital allocation.
3 Estimation Results and Analyses
In this section, we first describe the summary statistics of our sample observations and constructed measurements for the efficiency of capital allocation, local financial development, local foreign direct investment, etc., and report their Pearson correlation test results. We then report the results from our System GMM estimation of Eq. (3). Finally, we provide some analyses of our findings and discuss their policy implications. 3.1 Summary Statistics and Pearson Correlation Test Panel A of Table 2 displays the summary statistics of our sample observations and estimated proxies, and Panel B of the table displays the Pearson correlation test results for these variables. As can be seen from Panel A, the average efficiency of capital allocation (η) across all the Chinese regions in our sample is 0.204, much lower than the average efficiency of capital allocation across the 65 countries studied by Wurgler (2000), which is 0.429.
The results from the Pearson correlation test in Panel B provide useful hints to our main analyses to be conducted in the subsequent section. For instance, the efficiency of regional capital allocation (η) is positively correlated with the level of regional financial development, regardless of which of the three measurements (fin, pfin, sav) is used to proxy the latter. This may not seem surprising, as the three measurements of regional financial development are positively correlated with one another.4 Yet, whether the efficiency of regional capital allocation is 3 The number of years of schooling is set to 0 for people aged 6 years or above who received no education at all, 6 years for elementary school graduates, 9 years for middle school graduates, 12 years for high school graduates, and 16 years for college graduates, and then human is computed as the weighted average of these numbers where the weights are given by the shares of population in each category as a percentage of the total population aged 6 years or above. 4 We confront the potential multicolinearity problem in our regression analyses.

Financial development, FDI, and the efficiency of capital allocation in China 175
positively or negatively correlated with regional foreign direct investment depends on whether it is the stock measurement (sfdi) or the flow measurement (ffdi) that is used to proxy the latter, although the two measurements of regional FDI are also positively correlated. These warn us against drawing any conclusions simply based on these correlations, and call attention to the importance of further analyses of the roles of local financial development and
Table 2 Summary Statistics and Pearson Correlation Test Panel A:Summary Statistics
Min 25% Mean Median 75% Max STD
η 191 –1.221 0.019 0.204 0.189 0.369 1.450 0.296
fin 191 0.622 0.833 1.124 1.018 1.309 3.292 0.430
pfin 191 0.077 0.442 0.715 0.621 0.850 2.894 0.433
sav 191 0.421 0.582 0.690 0.650 0.787 1.339 0.168
ffdi 191 0.001 0.008 0.028 0.018 0.047 0.096 0.023
sfdi 191 0.018 0.069 0.240 0.140 0.338 1.035 0.240
gov 191 0.049 0.081 0.123 0.113 0.152 0.294 0.051
czp 191 0.086 0.222 0.280 0.272 0.334 0.563 0.092
njob 191 0.105 0.316 0.478 0.444 0.611 0.955 0.212
inv 191 0.256 0.337 0.428 0.409 0.501 0.825 0.116
export 191 0.024 0.048 0.177 0.068 0.244 0.989 0.212
infra 191 0.027 0.303 0.553 0.478 0.634 2.220 0.400
hunan 191 1.666 2.014 2.068 2.074 2.121 2.393 0.116
Panel B: Pearson Correlation Test(n=191) η fin pfin sav ffdi Sfdi gov czp njob inv export human
fin 0.026 1.000
pfin 0.065 0.939 1.000
sav 0.064 0.755 0.673 1.000
ffdi –0.045 0.205 0.418 –0.020 1.000
sfdi 0.013 0.219 0.415 0.088 0.863 1.000
gov –0.020 0.403 0.180 0.287 –0.310 –0.333 1.000
csp 0.092 0.104 0.213 0.067 0.313 0.203 –0.019 1.000
njob 0.071 –0.115 0.219 –0.201 0.636 0.574 –0.550 0.368 1.000
inv –0.031 0.363 0.312 0.229 –0.068 –.222 0.679 0.176 –0.084 1.000
export 0.055 0.326 0.545 0.164 0.717 0.721 –0.260 0.494 0.698 –0.095 1.000
infra –0.063 0.320 0.529 0.115 0.640 0.593 0.354 0.434 0.617 –0.107 0.699
human –0.037 0.402 0.497 0.411 0.474 0.465 –0.322 0.264 0.274 –0.127 0.482 0.607
176 Kevin X. D. Huang, Chun Jiang, Qingyuan Li, Kai Sheng, Jia Wang, Qiwei Zhao
FDI, and especially of their interaction with one another, in determining the efficiency of local capital allocation. Indeed, as the panel shows, the two measurements of regional financial development fin and pfin are both positively correlated with the two measurements of regional foreign direct investment sfdi and ffdi. One possible factor behind these positive correlations is that, as government intervention gradually faded out of the highly incomplete and inefficient domestic financial system over the period, FDI acted as a “visible hand” providing a “market signal” to local banks and the regional financial sector so that they could provide credit to regions that attracted FDI (e.g., Luo, 2007). Yet, to a large extent, the FDI was financed by the exports of funds from domestic households, who invested overseas exactly because of the underdeveloped domestic financial system. It is worth noting that the regional household RMB savings rate (sav) is negatively correlated with the current year’s FDI flow measure (ffdi). An important question is how regional financial development and FDI interact in affecting the efficiency of regional capital allocation. Our analyses below help answer this question. 3.2 System GMM Estimation Results and Analyses
We report in Table 3 the results from our System GMM estimation of Eq. (3).5 Panel A of the table reports the results using the FDI Flow Measurement ffdi and Panel B reports the results using the FDI Stock Measurement sfdi. As can be noted from the table, the Sargan test reveals that we cannot reject the null-hypothesis of over-identification in restrictions, and the residual serial correlation index SC2 indicates that there exists no second-order serial correlation in the residual from the regression on first-order differences (justifying our specification of the System GMM in first-order differences), which follows asymptotically a Gaussian distribution.
Though the estimated coefficients for regional financial development using any of the three measurements (fin, pfin, sav) as a proxy and regional foreign direct investment (sfdi) using the stock measurement as a proxy are all statistically significantly positive, the coefficient for their cross-product is statistically significantly negative. These estimates suggest that, although regional financial development and FDI each individually tend to improve the 5 For comparison, we have also run a multivariable linear regression and a fixed-effect panel regression. Our results show that, the coefficients for regional financial development and foreign direct investment estimated from the System GMM are just greater than the coefficients estimated from the fixed-effect panel regression and smaller than the coefficients estimated from the multivariable linear regression, as is much anticipated by econometric theory, and so further justifies our use of the System GMM as an appropriate method for addressing the underlining issues. Due to space limitations, these estimates based on the two alternative models are not reported here, but they are available upon request from the authors.

Ta
ble
3 S
yste
m G
MM
Est
imat
ion6
Pa
nel A
: Usi
ng th
e Fl
ow M
easu
rem
ent f
fdi t
o Pr
oxy
for F
DI
Pane
l B: U
sing
the
Flow
Mea
sure
men
t sfd
i to
Prox
y fo
r FD
I
A
B
C
D
E F
Con
s –0
.104
(–0.
32)
–0.0
03(–
0.01
)–0
.131
(–0.
27)
–1.2
58**
(–2.
01)
–0.6
36(–
1.37
)–1
.170
(–1.
24)
–0.0
13(–
0.02
)0.
176
(0.3
5)
–0.7
89(–
1.40
)–2
.157
**
(–2.
51)
–1.7
07*
(–1.
95)
–1.9
46**
(–
2.36
)
η −1
0.00
6 (0
.08)
–0
.001
(–0.
01)
–0.0
15(–
0.32
)0.
061
(0.8
3)
0.02
0 (0
.25)
0.
037
(0.7
5)
0.02
6 (0
.55)
0.
068
(1.4
6)
0.06
6 (1
.06)
0.
049
(0.9
7)
0.08
3 (1
.56)
0.
016
(0.2
0)
Fin
0.21
7*
(1.8
9)
0.92
6***
(2.8
0)
0.40
4**
(2.4
3)
1.57
0***
(4.3
8)
pfin
0.25
9 (1
.60)
0.
667**
(2.0
4)
0.42
3**
(2.4
5)
1.59
7***
(3.5
7)
sav
0.98
4*
(1.6
6)
2.02
6*
(1.9
0)
0.82
4 (1
.07)
2.
623**
* (3
.68)
fdi
–10.
37(–
1.04
)–9
.753
(–1.
59)
–7.5
37(–
1.37
)13
.85
(1.2
4)
2.45
3 (0
.33)
10
.84
(0.6
4)
0.96
4*(1
.81)
0.
668
(1.1
7)
0.32
4 (0
.87)
5.
649**
*
(4.0
6)
5.74
7***
(3.4
6)
2.80
3 (0
.87)
fin*f
di
–1
6.39
***
(–2.
77)
–3
.327
***
(–4.
81)
Pfin
*fdi
–12.
46**
(–2.
42)
–3
.999
***
(–3.
57)
Sav*
fdi
–1
9.41
(–1.
06)
–3
.644
(–
0.40
)
gov
–1.3
88(–
0.41
)–2
.086
(–0.
65)
–1.5
71(–
0.71
)–0
.379
(–0.
12)
0.41
2 (0
.13)
1.
974
(0.7
3)
2.37
3 (0
.75)
2.
972
(0.9
2)
1.87
3 (0
.72)
0.
956
(0.3
7)
4.44
8 (1
.38)
0.
530
(0.1
8)
czp
1.07
3***
(3.5
0)
0.97
3***
(3.2
9)
1.25
5***
(4.2
9)
1.31
0***
(4.2
2)
1.09
2***
(3.6
0)
1.34
4***
(4.8
4)
1.08
6***
(3.8
7)
1.04
9***
(3.6
8)
1.37
6***
(4.4
8)
1.39
7***
(4.9
4)
1.46
6***
(5.7
7)
1.59
7***
(5.7
1)
(To
be c
ontin
ued)
6 T
o de
al w
ith th
e po
tent
ial p
robl
em o
f th
e hi
gh c
orre
latio
n be
twee
n fin
anci
al d
evel
opm
ent a
nd f
orei
gn d
irect
inve
stm
ent,
we
use
an a
ltern
ativ
e sp
ecifi
catio
n of
the
int
erac
tion
term
. In
par
ticul
ar,
we
follo
w C
arko
vic
and
Levi
ne (
2002
) an
d re
plac
e on
e of
the
tw
o m
easu
rem
ents
in
the
cros
s-pr
oduc
t with
a d
umm
y va
riabl
e. I
t tur
ns o
ut th
at o
ur c
oncl
usio
n in
this
pap
er r
emai
ns u
ncha
nged
und
er th
is a
ltern
ativ
e sp
ecifi
catio
n of
the
inte
ract
ion
term
.

(Con
tinue
d)
Pa
nel A
: Usi
ng th
e Fl
ow M
easu
rem
ent f
fdi t
o Pr
oxy
for F
DI
Pane
l B: U
sing
the
Flow
Mea
sure
men
t sfd
i to
Prox
y fo
r FD
I
A
B
C
D
E
F
inv
–0.0
728
(–0.
07)
–0.3
73(–
0.40
) 0.
790
(0.9
9)
0.49
3 (0
.49)
0.
127
(0.1
4)
0.23
6(0
.28)
–1
.686
*(–
1.96
) –1
.684
*(–
1.94
) 0.
155
(0.1
6)
0.83
1(0
.85)
0.
487
(0.4
3)
1.02
8 (0
.92)
trad
e –0
.939
(–1.
63)
–1.0
78*
(–1.
90)
–0.3
41(–
0.55
) –0
.192
(–
0.38
) –0
.376
(–0.
78)
–0.7
19(–
1.05
) –0
.825
(–1.
26)
–0.7
40(–
1.48
) –0
.733
(–1.
30)
–1.1
12(–
1.52
) –0
.717
(–
1.12
) –0
.808
(–
0.72
)
infr
a –0
.083
(–0.
81)
0.06
4(0
.49)
–0
.038
(–0.
35)
–0.2
43
(–1.
62)
–0.1
22(–
0.72
) –0
.130
(–1.
27)
0.08
9(0
.82)
0.
015
(0.1
5)
–0.0
536
(–0.
33)
–0.1
61(–
1.43
) –0
.234
(–
1.32
) –0
.110
(–
0.87
)
njob
0.
420
(0.5
8)
0.37
8(0
.48)
–0
.670
(–1.
39)
–0.0
64
(–0.
08)
0.01
8(0
.02)
–0
.048
(–0.
09)
0.61
2(0
.82)
0.
707
(1.0
5)
–0.5
08(–
0.65
) 0.
137
(0.1
8)
–0.3
13
(–0.
44)
–0.7
06
(–0.
93)
hum
an
–0.0
27(–
0.54
) 0.
005
(0.1
0)
–0.0
65(–
1.50
) 0.
008
(0.1
8)
0.00
8(0
.18)
–0
.099
*(–
2.18
) –0
.050
(–0.
98)
–0.0
66(–
1.10
) –0
.015
(–0.
27)
–0.0
47(–
0.80
) –0
.049
(–
0.71
) –0
.050
(–
0.94
)
coas
t 1.
124**
(2.0
4)
0.85
1*(1
.87)
0.
750*
(1.8
1)
0.35
2 (0
.83)
0.
518
(1.6
0)
0.73
0*(1
.85)
–0
.371
(–0.
98)
–0.1
74(–
0.38
) 0.
484
(1.0
4)
–0.0
89(–
0.25
) –0
.222
(–
0.40
) 0.
420
(0.5
4)
Wal
d 28
3.87
***
100.
48**
*11
2.52
***
176.
38**
* 25
3.80
***
178.
05**
*18
5.16
***
203.
2***
228.
76**
*31
5.51
***
153.
37**
* 45
9.73
***
Sarg
an T
est
17.2
5 16
.93
16.4
8 10
.98
12.3
5 13
.72
16.9
9 18
.13
16.4
1 11
.80
13.1
9 10
.09
SC2
–1.3
7 –1
.45
–1.2
8 –1
.55
–1.5
1 –1
.26
–1.5
1 –1
.42
–1.3
4 –1
.26
–1.1
5 –1
.10
N
163
163
163
163
163
163
163
163
163
163
163
163
F fo
r FD
7.56
***
5.88
**0.
98
17
.56**
*10
.98**
* 0.
01
F fo
r FD
I
0.13
2.
85*
2.19
7.82
***
6.15
**
0.01
Not
e: A
s us
ual,
the
sign
s, *,
**, a
nd *
** in
dica
te th
e 10
%, 5
%, a
nd 1
% s
igni
fican
ce le
vels
, res
pect
ivel
y, a
t whi
ch th
e es
timat
es a
re d
iffer
ent f
rom
ze
ro.
Financial development, FDI, and the efficiency of capital allocation in China 179
efficiency of local capital allocation in China over our sample period, they tend to compete and crowd out each other’s effect so that one impaired the other’s function. In particular, these estimates reveal that there exists a threshold value for local financial development, above which an increase in FDI reduces the efficiency of regional capital allocation, rather than improves it, and reveals that there also exists a threshold value for FDI, above which further development in the local financial system lowers the efficiency of local capital allocation, rather than increases it.
We now analyze the estimation results in more detail. Since the First National Financial Work Conference in November 1997, the pace of financial system reform in China has accelerated. The years in our sample period witnessed the recapitalization of state-owned banks, the introduction of new governance structure and foreign strategic investors, the improvement in bank management and internal control, and intensified competition in credit markets. These reforms led to a gradual change in bank capital allocation strategy, from passively obeying government administrative commands to actively pursuing profitable investment opportunities, and a transition in the nature of bank credit, from simple quantity expansion with implicit government guarantee to market-orientated allocation with expected loan performance as a priority. As banks increasingly went after high-return, low-risk productive firms and projects, especially more flexibly managed and relatively better performing NSOEs, their credit allocations become more efficient, resulting in a greater efficiency of regional capital allocation. Indeed, the fact that the estimated coefficients for both fin and pfin are statistically significantly positive indicates that bank credit, both the total amount issued to all regional enterprises and the part extended to regional NSOEs, per se tends to promote the efficiency of regional capital allocation, and this is true after controlling for the other factors listed in the table.7 Since household savings are mainly a family’s autonomous decision, less affected by government policy than bank credit (e.g., Chen, 2006), the ratio of household RMB savings to regional GDP (sav) is also a reasonable proxy for the level of regional financial development. The estimated coefficients for sav is statistically significantly positive as well, further supporting the conclusion that regional financial development per se tends to improve the efficiency of regional capital allocation.8 7 The result that the coefficient for fin is positive may also have to do with a “spillover effect” in the Chinese financial system. As total bank credit expands, more financial resources may spill over from SOEs to NSOEs and credit-constrained private enterprise through various channels so as to promote the efficiency of capital allocation. 8 To further control for the potential reverse causality between local financial development and the efficiency of local capital allocation, we run a panel Granger causality test (e.g., Holtz-Eakin et al., 1989) to examine whether the efficiency of regional capital allocation may subsequently cause regional financial development. It turns out that the estimated coefficients for the one-period and two-period lagged levels of regional financial development are not statistically significantly different from zero, and neither is the F value of the Granger causality test. This suggests that regional capital allocation efficiency is unlikely to be a Granger cause of regional financial development.
180 Kevin X. D. Huang, Chun Jiang, Qingyuan Li, Kai Sheng, Jia Wang, Qiwei Zhao
It is worth mentioning that, on a general level, our findings show that financial development per se tends to improve the efficiency of capital allocation across different Chinese regions is broadly consistent with the international evidence presented in Wurgler (2000), Beck and Levine (2002), and Almeida and Wolfenzon (2005). It also provides corroborating evidence in support of the findings for China on the positive correlations between financial development and regional total factor productivity or economic growth (e.g., Cheng and Degryse, 2006; Jeanneney et al., 2006; Hasan et al., 2009).
How was this individually promising channel affected by the dramatic buildup of foreign direct investment which served as an important alternative channel for allocating capital across different Chinese regions over those years? Before answering this question, we should note that FDI per se might tend to promote the efficiency of local capital allocation by injecting funds directly into productive firms and profitable projects, and by “guiding” the relatively underdeveloped Chinese financial institutions to follow its lead. This is in line with the view of Bai (2006) and Luo (2007), while it is also consistent with the findings on the positive correlations between FDI and economic growth across different Chinese regions (e.g., Wen, 2007; Madariaga and Poncet, 2007). Indeed, as Table 3 shows, the estimated coefficient for the stock measure of FDI (sfdi) is statistically significantly positive, controlling for the other factors listed in the table. This indicates that the buildup over those years of the FDI stock per se did tend to promote the efficiency of regional capital allocation. It is worth noting that the sign of the estimated coefficient for the flow measurement of FDI (ffdi) depends on which of the three proxies for regional financial development is used, and thus also on how the interaction term between regional financial development and FDI is specified, and these estimations are not statistically significant. This brings us to a related question as to how the function of FDI as an individually promising channel for efficient capital allocation was affected by the accelerated development of the Chinese financial system over those years.
We now turn to answering these questions. As Table 3 demonstrates, the estimated coefficient for the interaction term between regional financial development and foreign direct investment is statistically significantly negative, regardless of what proxies are used. Our interpretation of this estimation is that, the two individually promising channels for efficient capital allocation tend to compete and crowd out each other’s effect so that one impaired the individual function of the other. In particular, there is a threshold value for FDI above which an increase in the level of regional financial development would deteriorate rather than enhance the efficiency of regional capital allocation. This threshold value of fdi is given by the root to the equation that sets the marginal effect of financial development on the efficiency of local capital allocation əη/əfdi=β3+β4fdi to zero. Take the share of bank credit to NSOEs (pfin) and the
Financial development, FDI, and the efficiency of capital allocation in China 181
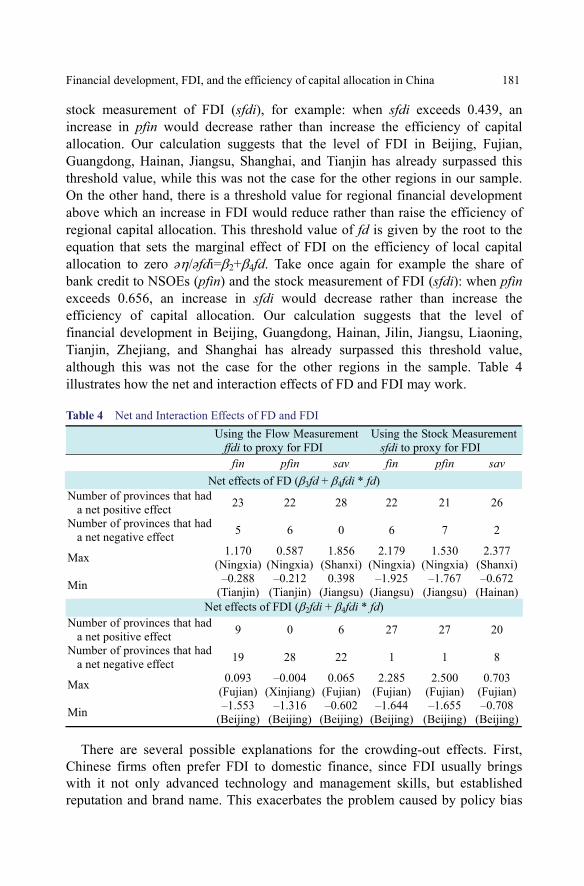
stock measurement of FDI (sfdi), for example: when sfdi exceeds 0.439, an increase in pfin would decrease rather than increase the efficiency of capital allocation. Our calculation suggests that the level of FDI in Beijing, Fujian, Guangdong, Hainan, Jiangsu, Shanghai, and Tianjin has already surpassed this threshold value, while this was not the case for the other regions in our sample. On the other hand, there is a threshold value for regional financial development above which an increase in FDI would reduce rather than raise the efficiency of regional capital allocation. This threshold value of fd is given by the root to the equation that sets the marginal effect of FDI on the efficiency of local capital allocation to zero əη/əfdi=β2+β4fd. Take once again for example the share of bank credit to NSOEs (pfin) and the stock measurement of FDI (sfdi): when pfin exceeds 0.656, an increase in sfdi would decrease rather than increase the efficiency of capital allocation. Our calculation suggests that the level of financial development in Beijing, Guangdong, Hainan, Jilin, Jiangsu, Liaoning, Tianjin, Zhejiang, and Shanghai has already surpassed this threshold value, although this was not the case for the other regions in the sample. Table 4 illustrates how the net and interaction effects of FD and FDI may work.
Table 4 Net and Interaction Effects of FD and FDI
Using the Flow Measurement ffdi to proxy for FDI
Using the Stock Measurement sfdi to proxy for FDI
fin pfin sav fin pfin sav
Net effects of FD (β3fd + β4fdi * fd) Number of provinces that had
a net positive effect 23 22 28 22 21 26
Number of provinces that had a net negative effect 5 6 0 6 7 2
Max 1.170(Ningxia)
0.587 (Ningxia)
1.856(Shanxi)
2.179 (Ningxia)
1.530 (Ningxia)
2.377 (Shanxi)
Min –0.288(Tianjin)
–0.212(Tianjin)
0.398(Jiangsu)
–1.925(Jiangsu)
–1.767 (Jiangsu)
–0.672 (Hainan)
Net effects of FDI (β2fdi + β4fdi * fd) Number of provinces that had
a net positive effect 9 0 6 27 27 20
Number of provinces that had a net negative effect 19 28 22 1 1 8
Max 0.093(Fujian)
–0.004(Xinjiang)
0.065(Fujian)
2.285 (Fujian)
2.500 (Fujian)
0.703 (Fujian)
Min –1.553(Beijing)
–1.316(Beijing)
–0.602(Beijing)
–1.644(Beijing)
–1.655 (Beijing)
–0.708 (Beijing)
There are several possible explanations for the crowding-out effects. First,
Chinese firms often prefer FDI to domestic finance, since FDI usually brings with it not only advanced technology and management skills, but established reputation and brand name. This exacerbates the problem caused by policy bias

182 Kevin X. D. Huang, Chun Jiang, Qingyuan Li, Kai Sheng, Jia Wang, Qiwei Zhao
that induces a misallocation of China’s financial resources between less efficient SOEs and more efficient private enterprises. The private firms are discriminated against not only in terms of access to external funding, but also from the perspectives of property rights protection, taxation, and market opportunities. They then particularly rely on FDI, which allows them to bypass both the financial and legal obstacles that they face at home, as foreign-invested firms are accorded a superior legal status compared with private firms. This limits the accessibility of local banks to profitable investment opportunities and restrains their credit extensions from being more efficiently allocated. On the other side of the coin, since local financial development makes it easier for key Chinese industries and sectors to obtain domestic loans, this limits the accessibility of FDI to certain profitable opportunities and deteriorates its function in helping allocate capital more efficiently. Moreover, since financial deepening in the Chinese economic system lags behind its drastic buildup of FDI, this also restrains domestic firms from fully absorbing the spillovers in technology and management skill brought about by FDI and reduces its ability in allocating capital more efficiently. Also, to the extent by which export-oriented FDI is used to produce exported goods with low technological content or at the low end of the industry chain, and to guide domestic funds to follow this step, the result can mean lower instead of higher efficiency of regional capital allocation. In addition, the Chinese government implemented a variety of preferential policies to encourage foreign capital to cooperate with SOEs, mostly in the form of joint ventures and Greenfield investments. Such foreign investment in structure and facility requires accompanying working capital loans from local banks to purchase raw materials and intermediate goods, and to hire labor services, and therefore it competes for domestic financial resources with other domestic firms (especially private enterprises) that do not have FDI, which certainly has a disadvantage in this competition because of the favorable government policies to the foreign-domestic joint ventures, and because FDI provides a “market signal” to guide domestic banks, especially the big four state-owned banks, to follow its lead in channeling funds. A larger amount of domestic bank credit in this case may well come along with a worsened financial constraint facing the private enterprises (e.g., Harrison and McMillan, 2003), as FDI hinders their accessibility to domestic financial resources, even if they have relatively flexible management structures and high investment returns, and the result is a lower efficiency of capital allocation in the economy.
Other implications of Table 3 are also worth mentioning. First, the estimated coefficient for the lagged level of capital allocation efficiency (η−1) is not statistically significantly positive in most cases, suggesting that the efficiency of regional capital allocation tends to increase over time as China progresses into a market-based economy. Second, the estimated coefficient for regional economic structure (czp) is statistically significantly positive in most cases, suggesting that

Financial development, FDI, and the efficiency of capital allocation in China 183
the efficiency of regional capital allocation increases with the share of above-scale enterprises in the economy. One possible explanation for this finding is that, the presence of a larger number of above-scale enterprises within a given region makes for easier regional capital transactions (this tends to enhance the efficiency of regional capital allocation), mitigating effects brought about by regional protectionism and market segmentation which are the status quo in the Chinese economy. Third, the estimated coefficient for net regional fiscal expenditure (gov) is positive, though in most cases not statistically significant. A potential explanation for this finding is that, a large part of regional government expenditure is often in supporting the reform of SOEs and in promoting regional economic growth (an important criterion for evaluating the performance of regional government officials in the promotion process), which are usually associated with the enhanced efficiency of regional capital allocation (e.g., Cao et al., 1999). Fourth, the estimated coefficient for the share of exports in regional GDP (export) is negative, though not statistically significant. A possible explanation is that the export-oriented policy in China and its speciation in exporting goods of low technological content or at the low end of the industry chain may distort capital allocation to result in a lower efficiency level. Next, the sign of the coefficient for the regional industry gross fixed capital formation term (inv) depends on the specifications of the other parts of the model, and the estimation is not statistically significant. A possible explanation may have to do with the time-to-build feature of fixed capital formation so current-period investment does not significantly affect the efficiency of current-period capital allocation. Finally, the sign of the coefficient for SOE reform (njob) also depends on the specifications of the other parts of the model, and the estimation is also not statistically significant. One potential explanation is that, if SOE reform or privatization did not really turn the enterprises into more competitive business entities with better management structures, it might not help promote the efficiency of regional capital allocation.
4 Concluding Remarks
The confluence of dramatic buildup in foreign direct investment and gradual financial reform has taken a center stage in the financial landscape of the emerging and transitional Chinese economy during recent years. How FDI and local financial development in China affect its regional capital allocation has become an important question for researchers and policymakers. We have taken on this question in this paper. Our main finding is that, though local financial development and FDI each individually tend to improve the efficiency of regional capital allocation over the period, they tend to compete and crowd out each other’s effect so that one impairs the function of the other. In particular, we have estimated a threshold value for regional financial development, above

184 Kevin X. D. Huang, Chun Jiang, Qingyuan Li, Kai Sheng, Jia Wang, Qiwei Zhao
which an increase in FDI would deteriorate rather than enhance the efficiency of regional capital allocation, as well as a threshold value for FDI, above which further regional financial development would deteriorate rather than enhance the efficiency of regional capital allocation. Our estimations show that the levels of FDI and local financial development in some relatively more developed regions, including Beijing, Shanghai, Guangdong, Jiangsu, Tianjin, and Hainan, have already surpassed such threshold values. In the light of our explanations for these findings discussed in the paper, policies that promote financial deepening and create favorable financial environments for enterprises (especially private enterprises) that do not have FDI may help promote the efficiency of regional capital allocation and economic growth in China nowadays. Careful selection and redirection of FDI and rebalancing the ratio of domestic to foreign capital in certain industries to a more proper level can be important as well. Reconsideration of the preferential policies to FDI may also be needed.
References
Aitken B J, Harrison A (1999). Do domestic firms benefit from direct foreign investment? Evidence from Venezuela. American Economic Review, 89: 605–618
Alfaro L, Chanda A, Kalemli-Ozcan S, Sayek S (2004). FDI and economic growth: The role of local financial markets. Journal of International Economics, 64: 89–112
Almeida H, Wolfenzon D (2005). The effect of external finance on the equilibrium allocation of capital. Journal of Financial Economics, 75: 133–164
Aziz J, Duenwald C (2002). Growth-financial intermediation nexus in China. IMF Working Paper, No. 02/194
Bai C (2006). The domestic financial system and capital flows: China. World Bank Working Paper
Beck T, Demirguc-Kunt A, Levine R (2000a). A new database on financial development and structure. World Bank Economic Review, 14: 597– 605
Beck T, Levine R (2002a). Industry growth and capital allocation: Does having a market-or bank-based system matter? Journal of Financial Economics, 64: 147–180
Beck T, Levine R (2002b). Stock markets, banks, and growth: Panel evidence. Journal of Banking and Finance, 28: 423–442
Beck T, Levine R, Loayza N (2000b). Finance and the sources of growth. Journal of Financial Economics, 58: 261– 300
Berthélemy J, Démurger S (2000). Foreign direct investment and economic growth: Theory and application to China. Review of Development Economics, 4: 140–155
Bond S, Hoeffler A,Temple J (2001). GMM estimation of empirical growth models. SSRN paper
Boyreau-Debray G (2003). Financial intermediation and growth: Chinese style. World Bank Working Paper
Cao Y, Qian Y, Weingast B R (1999). From federalism, Chinese style, to privatization, Chinese style. Economics of Transition, 7: 103–131
Chen B, Feng Y (2000). Determinants of economic growth in China: Private enterprises, education, and openness. China Economic Review: 11: 1–15
Chen H (2006). Development of financial intermediation and economic growth: The Chinese experience. China Economic Review, 17: 347–362

Financial development, FDI, and the efficiency of capital allocation in China 185
Cheng X, Degryse H (2006). The impact of bank and nonbank financial institutions on local economic growth in China. LICOS Discussion Paper
Fleisher B, Chen J (1997). The coast-noncoast income gap, productivity, and regional economic policy in China. Journal of Comparative Economics, 25: 220–236
Guariglia A, Poncet S (2008). Could financial distortions be no impediment to economic growth after all? Evidence from China. Journal of Comparative Economics, 36: 633–657
Harrison A E, Lovec I, McMillan M S (2004). Global capital flows and financing constraints. Journal of Development Economics, 75: 269–301
Hasan I, Wachtel P, Zhou M (2009). Institutional development, financial deepening and economic growth: Evidence from China. Journal of Banking and Finance, 33: 157–170
Hausmaan R, Fernández-Arias E (2000). Foreign direct investment: Good cholesterol. Inter-American Development Bank Working Paper
Hermes N, Lensink R (2003). Foreign direct investment, financial development and economic growth. Journal of Development Studies, 40: 142–163
Holtz-Eakin D, Newey W, Rosen H S (1989). The revenues-expenditure nexus: Evidence from local government data. International Economic Review, 30: 415–429
Jeanneney S, Hua P, Liang Z (2006). Financial development, economic efficiency, and productivity growth: Evidence from China. The Developing Economies, 44: 27–52
Ju J, Wei S (2007). Domestic institutions and the bypass effect of financial globalization. NBER Working Paper
King R G, Levine R (1993a). Finance and growth: Schumpeter might be right. Quarterly Journal of Economics, 108: 717–737
King R G, Levine R (1993b). Finance, entrepreneurship and growth: Theory and evidence. Journal of Monetary Economics, 32: 513–542
Levine R (1997). Financial development and economic growth. Journal of Economic Literature, 35: 688–726
Levine R (2002). Bank-based or market-based financial systems: Which is better? Journal of Financial Intermediation, 11: 398–428
Levine R, Loayza N, Beck T (2000). Financial intermediation and growth: Causality and causes. Journal of Monetary Economics, 46: 31–77
Levine R, Zervos S (1998). Stock markets, banks and economic growth. American Economic Review, 88: 537–558
Ljungwall C, Li J (2007). Financial sector development, FDI and economic growth in China. Beijing University Working Paper
Loayza N, Ranciere R (2004). Financial development, financial fragility and growth. World Bank Working Paper
Luo C (2007). FDI: A visible hand. Fudan University Working Paper Madariaga N, Poncet S (2007). FDI in Chinese cities: Spillovers and impact on growth. The
World Economy, 837–862 Mello D (1999). Foreign direct investment-led growth: Evidence from time series and panel
data. Oxford Economic Papers, 51: 133–151 Rajan R J, Zingales L (1998). Financial dependence and growth. American Economic Review,
88: 559–586 Roodman D (2006). How to do xtabond2: An introduction to “Difference” and “System”
GMM in Stata. Center for Global Development Working Paper 103 Wen M (2007). Foreign direct investment, regional market conditions and regional
development: A panel study on China. Economics of Transition, 15: 125–151 Wurgler J (2000). Financial markets and the allocation of capital. Journal of Financial
Economics, 58: 187–214 Xu B (2000). Multinational enterprises, technology diffusion, and host country productivity
growth. Journal of Development Economics, 62: 477–493