key findings national medical association ... change and health page 1 key findings national medical...
TRANSCRIPT

Climate Change and Health
Page 1
KEY FINDINGS
NATIONAL MEDICAL ASSOCIATION
PHYSICIAN SURVEY
Mona Sarfaty, M.D., MPH
Mark Mitchell, M.D., MPH
Brittany Bloodhart, Ph.D.
Christine Berg, M.D.
Edward Maibach, Ph.D., MPH
June 25, 2014

Climate Change and Health
Page 2
A S U R V E Y O F N A T I O N A L M E D I C A L A S S O C I A T I O N P H Y S I C I A N S
Overview
The following report contains the findings of a survey conducted in two phases in March and
May of 2014 among members of the National Medical Association (NMA), the association of
African American physicians. The survey was conducted in collaboration with George Mason
University. The purpose of the survey was to assess physicians’ experience with the health effects
of climate change and their thoughts about how to address this issue. In March, attendees of
the 2014 NMA policy conference were asked to complete a paper version of the survey. In May,
all regular NMA members for whom the association had email addresses were asked to
complete a web-based version of the survey. A total of 284 members from 33 states responded
to one or the other administration of the survey, for a total response rate of 30%.
Table of Contents
Key Findings 3
Detailed Survey Responses 5
Methods 20
Appendix 22
Patient Anecdotes from Physician Respondents 22
Barr iers to Greater Physician Involvement 23
Helpful Resources 24

Climate Change and Health
Page 3
Key Findings
NMA physicians believe climate change is happening.
Over 97% of respondents said that climate change is happening, and 62% said that it is mostly or
entirely caused by human activity. The great majority of respondents said that they had
personally experienced climate change outside their role as a health professional (88%); almost
half (48%) reported having had a moderate amount or great deal of personal experience with
climate change.
NMA physicians report that climate change is affecting the health of
Americans and their own patients .
Nearly all survey respondents think climate change is relevant to direct patient care (88%) and
that it has harmed people in their own city or county over the last decade (86%). Most
respondents also report that climate change is affecting the health of their own patients a great
deal or a moderate amount (61%).
A wide range of health effects from climate change is affecting patients
in the present time.
The most common health effects that respondents have witnessed among their patients are
injuries due to severe weather (88%), air pollution-related increases in severity of chronic disease
(88%), increased allergic symptoms (80%), and heat related effects (75%). Other conditions
affecting patients include vector-borne infections (Lyme Disease or West Nile Virus) (58%),
diarrhea from food/waterborne agents of infection (56%), and mental health problems related
to these health issues (40%). Across all categories of health effects, more physicians (2% - 16%)
think their patients will be harmed in the next 10-20 years.
Certain groups are more vulnerable to the health effects of climate change than
others.
A large majority of respondents reported that certain specific groups of people will be
disproportionately affected by climate change, including people with chronic diseases (88%),
people living near or below the poverty line (86%), young children ages 0-4 (83%), and adults
over age 60 (80%).
Climate Change and Health
Page 4
NMA physicians want to educate and advocate about climate change
and health.
A majority of respondents said that physicians have a responsibility to bring the health effects of
climate change to the attention of their patients (75%) and the public (71%), that teaching
about climate change and its associated health impacts should be integrated into medical
education (80%), and that medical societies should have a significant advocacy role on climate
and health (76%).
Respondents feel that their own actions can make a difference in
responding to climate change.
A large majority of survey participants believe that actions they can take in their personal and
professional lives can contribute to effective action on climate change (78%). Most (81%) also
believe that physicians should have a leadership role in encouraging offices, clinics, and
hospitals to be as environmentally sustainable as possible. Most also feel the following resources
would be helpful: policy statements from medical professional associations (81%), continuing
medical education (89%), and patient education materials (86%).
NMA physicians feel the U.S. should take significant steps to reduce the
impacts of climate change and protect people from its harmful health
effects.
Nearly all respondents feel the U.S. should make a large scale effort (88%) to protect people from
current effects of climate change even if it has large economic costs, or a medium scale effort
to protect people even if it has medium economic costs. Similarly, they believe the U.S. should
make a large scale effort (55%) or a medium scale effort (37%) to prevent future impacts of
climate change.

Climate Change and Health
Page 5
Detailed Survey Responses
SECTION A
Climate change refers to the idea that the world’s average temperature has been increasing over the past 150
years, may be increasing more in the future, and that the world’s climate is changing as a result.
What do you think: Do you think that climate change is happening?
(Those that answered YES were then asked) How sure are you that climate change is happening?
(Those that answered NO were then asked) How sure are you that climate change is not happening?
Response Options
Percent Response Response Number
(N)
Yes
97% 271
Extremely Sure 31% 93
Very Sure 35% 107
Somewhat Sure 20% 59
Not at all Sure 2% 5
Don’t Know
2% 5
No
1% 3
Not at all Sure 0.7% 2
Somewhat Sure 0% 0
Very Sure 0% 0
Extremely Sure 0.3% 1
TOTAL1 100% 279
1 Total N (279) represents the total number of responses to the Question: Do you think climate change is
happening? 271 people responded “yes”, 5 “don’t know”, 3 “no”. There were seven respondents who
answered the question “yes”, but did not answer the subsequent question about how sure they are that
climate change is or is not happening.

Climate Change and Health
Page 6
Do you think climate change over the past 150 years is…
Response Options
Percent Response Response Number
(N)
Caused entirely by human activities 4% 10
Caused mostly by human activities 58% 161
Caused about equally by human activities and natural
changes in the environment
34% 96
Caused mostly by natural changes in the environment 3% 8
Caused entirely by natural changes in the environment 1% 2
None of the above because climate change isn’t
happening
0.5% 1
TOTAL 100% 278
To the best of your knowledge, what percentage of climate scientists has concluded that human-caused
climate change is occurring?
Response Options
Percent Response Response Number
(N)
0-20% 2% 6
21-40% 12% 33
41-60% 17% 46
61-80% 24% 67
81-100% 29% 81
Don’t Know 17% 46
TOTAL 100% 279
How knowledgeable do you feel about the association between climate change and health impacts?
Response Options
Percent Response Response Number
(N)
Very knowledgeable 6% 16
Moderately knowledgeable 18% 51
Modestly knowledgeable 48% 132
Not at all knowledgeable 28% 79
TOTAL 100% 278
Climate Change and Health
Page 7
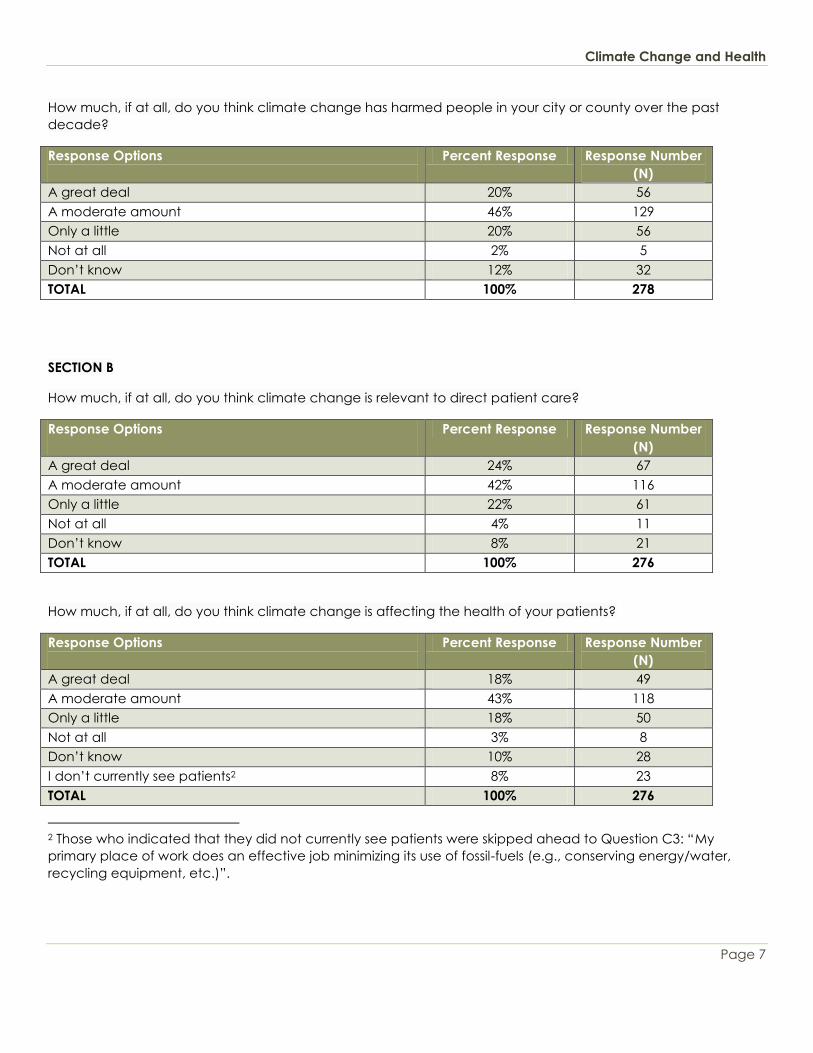
How much, if at all, do you think climate change has harmed people in your city or county over the past
decade?
Response Options
Percent Response Response Number
(N)
A great deal 20% 56
A moderate amount 46% 129
Only a little 20% 56
Not at all 2% 5
Don’t know 12% 32
TOTAL 100% 278
SECTION B
How much, if at all, do you think climate change is relevant to direct patient care?
Response Options
Percent Response Response Number
(N)
A great deal 24% 67
A moderate amount 42% 116
Only a little 22% 61
Not at all 4% 11
Don’t know 8% 21
TOTAL 100% 276
How much, if at all, do you think climate change is affecting the health of your patients?
Response Options
Percent Response Response Number
(N)
A great deal 18% 49
A moderate amount 43% 118
Only a little 18% 50
Not at all 3% 8
Don’t know 10% 28
I don’t currently see patients2 8% 23
TOTAL 100% 276
2 Those who indicated that they did not currently see patients were skipped ahead to Question C3: “My
primary place of work does an effective job minimizing its use of fossil-fuels (e.g., conserving energy/water,
recycling equipment, etc.)”.

Climate Change and Health
Page 8
In which of the following ways, if any, do you think your patients are currently being affected by climate
change, or might be affected in the next 10-20 years?3
Response Options Percent Response Response
Number (N)
People are currently being affected Yes Don’t Know No TOTAL
Heat-related effects (e.g., heatstroke, heat
exhaustion, cardio-respiratory illness)
75% 14% 11% 236
Vectorborne infection (e.g. Lyme, West Nile,
Dengue Fever, Malaria)
58% 26% 16% 232
Diarrhea from food/waterborne illnesses ( e.g.
Salmonella, Giardia, Cryptosporidia) following
downpours or floods
56% 22% 22% 238
Injuries due to severe storms, floods, droughts,
fires
88% 8% 5% 240
Air pollution related increases in severity of
illness (e.g., asthma, COPD, pneumonia,
cardiovascular disease)
88% 10% 3% 242
Increased care for allergic sensitization and
symptoms of exposure to plants or mold (visits to
office/ER for asthma/allergic symptoms)
80% 13% 8% 240
Mental health problems due to the above 40% 41% 19% 235
People will be affected in the next 10-20 years Yes Don’t Know No TOTAL
Heat-related effects (e.g., heatstroke, heat
exhaustion, cardio-respiratory illness)
88% 9% 3% 221
Vectorborne infection (e.g. Lyme, West Nile,
Dengue Fever, Malaria)
70% 21% 9% 222
Diarrhea from food/waterborne illnesses ( e.g.
Salmonella, Giardia, Cryptosporidia) following
downpours or floods
67% 23% 10% 222
Injuries due to severe storms, floods, droughts,
fires
90% 9% 1% 219
Air pollution related increases in severity of
illness (e.g., asthma, COPD, pneumonia,
cardiovascular disease)
91% 8% 2% 221
Increased care for allergic sensitization and
symptoms of exposure to plants/mold (office/ER
visits for asthma/allergy)
86% 11% 4% 222
Mental health problems due to the above 56% 35% 9% 225
3 The percentage responses for each question are based on the number of individuals who answered each
question.
Climate Change and Health
Page 9
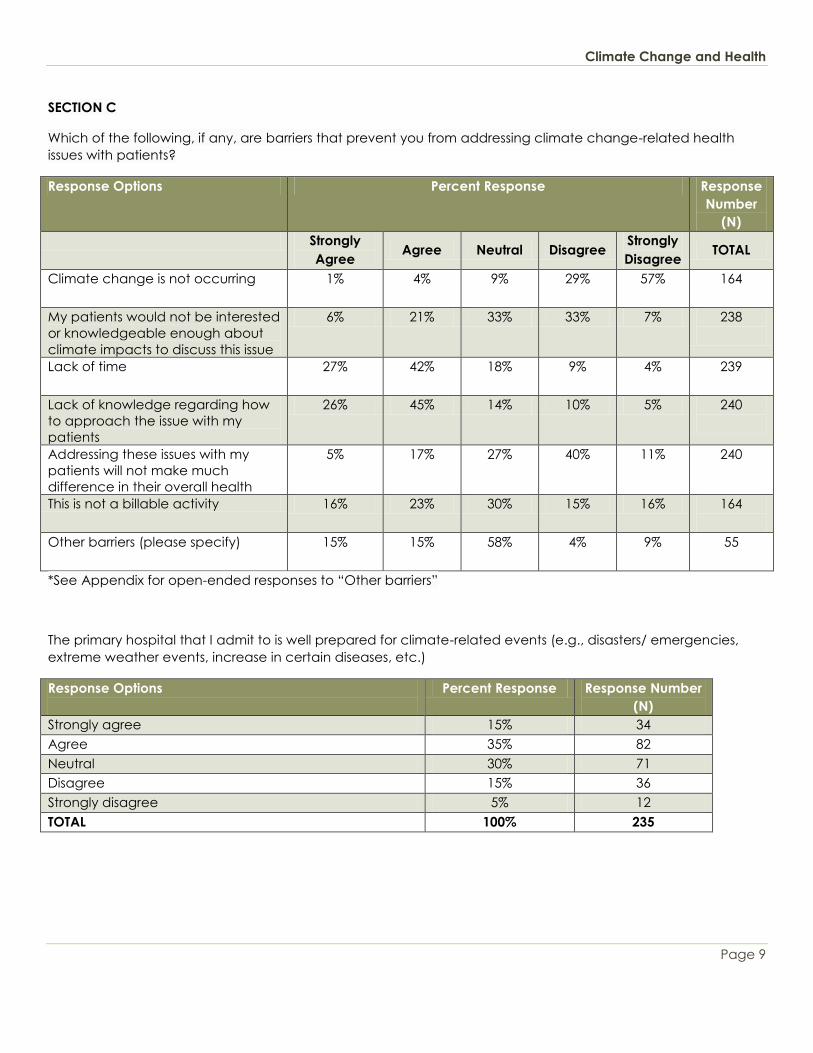
SECTION C
Which of the following, if any, are barriers that prevent you from addressing climate change-related health
issues with patients?
Response Options Percent Response Response
Number
(N)
Strongly
Agree Agree Neutral Disagree
Strongly
Disagree TOTAL
Climate change is not occurring 1% 4% 9% 29% 57% 164
My patients would not be interested
or knowledgeable enough about
climate impacts to discuss this issue
6% 21% 33% 33% 7% 238
Lack of time 27% 42% 18% 9% 4% 239
Lack of knowledge regarding how
to approach the issue with my
patients
26% 45% 14% 10% 5% 240
Addressing these issues with my
patients will not make much
difference in their overall health
5% 17% 27% 40% 11% 240
This is not a billable activity 16% 23% 30% 15% 16% 164
Other barriers (please specify) 15% 15% 58% 4% 9% 55
*See Appendix for open-ended responses to “Other barriers”
The primary hospital that I admit to is well prepared for climate-related events (e.g., disasters/ emergencies,
extreme weather events, increase in certain diseases, etc.)
Response Options
Percent Response Response Number
(N)
Strongly agree 15% 34
Agree 35% 82
Neutral 30% 71
Disagree 15% 36
Strongly disagree 5% 12
TOTAL 100% 235

Climate Change and Health
Page 10
My primary place of work does an effective job minimizing its use of fossil-fuels (e.g., conserving energy/water,
recycling equipment, etc.)
Response Options
Percent Response Response Number
(N)
Strongly agree 6% 16
Agree 23% 58
Neutral 30% 77
Disagree 34% 88
Strongly disagree 7% 17
TOTAL 100% 256
Teaching about climate change and its association with health impacts should be integrated into medical
education.
Response Options
Percent Response Response Number
(N)
Strongly agree 30% 78
Agree 50% 129
Neutral 12% 31
Disagree 5% 14
Strongly disagree 3% 8
TOTAL 100% 260
My medical societies should have a significant advocacy role in relation to climate change and health.
Response Options
Percent Response Response Number
(N)
Strongly agree 28% 71
Agree 48% 125
Neutral 19% 48
Disagree 5% 12
Strongly disagree 1% 2
TOTAL 100% 258

Climate Change and Health
Page 11
I feel that actions I take in my personal and/or professional life can contribute to effective action on climate
change.
Response Options
Percent Response Response Number
(N)
Strongly agree 25% 65
Agree 53% 137
Neutral 17% 43
Disagree 6% 15
Strongly disagree 0% 0
TOTAL 100% 260
Physicians have a responsibility to bring the health effects of climate change to the attention of their patients.
Response Options
Percent Response Response Number
(N)
Strongly agree 24% 63
Agree 51% 132
Neutral 20% 53
Disagree 5% 13
Strongly disagree 0% 0
TOTAL 100% 261
Physicians have a responsibility to bring the health effects of climate change to the attention of the public.4
Response Options
Percent Response Response Number
(N)
Strongly agree 25% 43
Agree 46% 78
Neutral 23% 39
Disagree 5% 9
Strongly disagree 0.5% 1
TOTAL 100% 170
4 This question was only asked on the member survey and not on the leadership survey.

Climate Change and Health
Page 12
Physicians should have a leadership role in encouraging offices, clinics, hospitals to be as environmentally
sustainable as possible.
Response Options
Percent Response Response Number
(N)
Strongly agree 34% 88
Agree 47% 121
Neutral 16% 42
Disagree 3% 8
Strongly disagree 0.5% 1
TOTAL 100% 260
Which of the following resources, if any, would be helpful to you?
Policy statements provided by my professional associations.
Response Options
Percent Response Response Number
(N)
Strongly agree 34% 89
Agree 48% 127
Neutral 14% 37
Disagree 3% 8
Strongly disagree 2% 5
TOTAL 100% 266
Which of the following resources, if any, would be helpful to you?
Continuing medical education (CME) on climate change and health.
Response Options
Percent Response Response Number
(N)
Strongly agree 41% 110
Agree 48% 127
Neutral 8% 21
Disagree 3% 7
Strongly disagree 0.5% 1
TOTAL 100% 266

Climate Change and Health
Page 13
Which of the following resources, if any, would be helpful to you?
Patient education materials.
Response Options
Percent Response Response Number
(N)
Strongly agree 41% 109
Agree 45% 119
Neutral 11% 30
Disagree 3% 7
Strongly disagree 0.5% 1
TOTAL 100% 266
Which of the following resources, if any, would be helpful to you?
Other resources (please specify)*:
Response Options
Percent Response Response Number
(N)
Strongly agree 23% 10
Agree 18% 8
Neutral 52% 23
Disagree 2% 1
Strongly disagree 5% 2
TOTAL 100% 44
*See Appendix for open-ended responses to “Other resources”
Which, if any, of the following groups will disproportionately experience any negative health effects from
climate change? [check all that apply]
Response Options
Percent Response Response
Number (N)
Yes No TOTAL
Young children ages 0 to 4 83% 17% 271
Older children ages 5 to 17 42% 58% 271
Young adults ages 18 to 39 27% 73% 271
Middle aged adults ages 40 to 60 25% 75% 271
Older adults ages 60+ 80% 20% 271
People with chronic diseases 88% 12% 271
People living near or below the poverty line 86% 14% 271
People of color 73% 27% 271
Climate Change and Health
Page 14
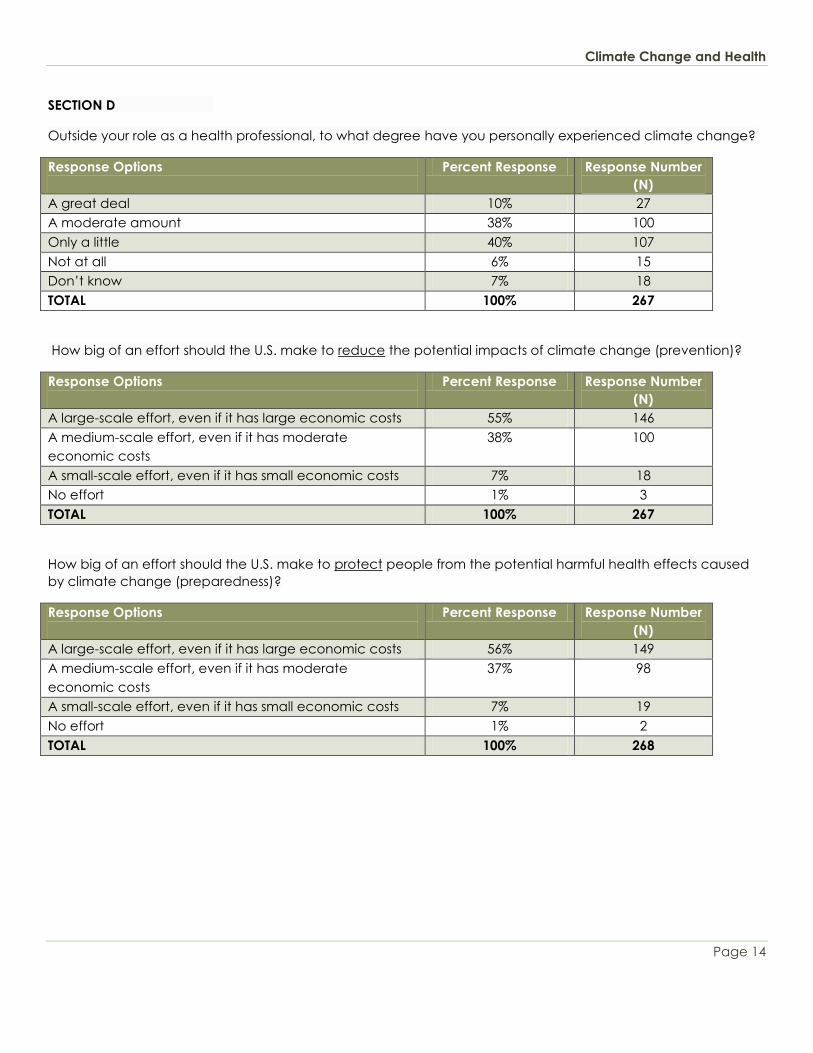
SECTION D
Outside your role as a health professional, to what degree have you personally experienced climate change?
Response Options
Percent Response Response Number
(N)
A great deal 10% 27
A moderate amount 38% 100
Only a little 40% 107
Not at all 6% 15
Don’t know 7% 18
TOTAL 100% 267
How big of an effort should the U.S. make to reduce the potential impacts of climate change (prevention)?
Response Options
Percent Response Response Number
(N)
A large-scale effort, even if it has large economic costs 55% 146
A medium-scale effort, even if it has moderate
economic costs
38% 100
A small-scale effort, even if it has small economic costs 7% 18
No effort 1% 3
TOTAL 100% 267
How big of an effort should the U.S. make to protect people from the potential harmful health effects caused
by climate change (preparedness)?
Response Options
Percent Response Response Number
(N)
A large-scale effort, even if it has large economic costs 56% 149
A medium-scale effort, even if it has moderate
economic costs
37% 98
A small-scale effort, even if it has small economic costs 7% 19
No effort 1% 2
TOTAL 100% 268

Climate Change and Health
Page 15
SECTION E
What is your primary work setting?
Response Options
Percent Response Response Number
(N)
Outpatient (clinical) 49% 126
Hospital (clinical) 29% 74
Non-clinical Administrative 8% 20
Other clinical 8% 21
Other non-clinical 6% 16
Retired .5% 1
TOTAL 100% 258
Which is, or if retired was, your primary work location?
Response Options
Percent Response Response Number
(N)
Urban 69% 167
Suburban 22% 52
Rural 5% 12
Multiple 4% 10
TOTAL 100% 241

Climate Change and Health
Page 16
In which U.S. State do you (or did you) work?
Response Options
Percent Response Response Number
(N)
Alabama 1% 3
Arizona 1% 2
California 8% 20
Colorado 1% 3
Connecticut 0.5% 1
Delaware 1% 2
District of Columbia 6% 14
Florida 4% 10
Georgia 10% 26
Hawaii 0.5% 1
Illinois 3% 7
Indiana 2% 5
Kansas 0.5% 1
Kentucky 0.5% 1
Louisiana 4% 9
Maryland 10% 24
Massachusetts 4% 9
Michigan 3% 8
Minnesota 1% 2
Mississippi 1% 2
Missouri 3% 8
Nevada 1% 3
New Jersey 2% 5
New Mexico 0.5% 1
New York 7% 18
North Carolina 4% 9
Ohio 4% 9
Pennsylvania 2% 6
South Carolina 0.5% 1
Tennessee 3% 7
Texas 7% 17
Virginia 4% 9
Wisconsin 2% 6
TOTAL 100% 249

Climate Change and Health
Page 17
Which of the following degrees or certifications do you hold? [check all that apply]
Response Options Percent Response Response Number
(N)
M.D. 81% 215
Ph. D. 2% 4
PA / CRNP 0.5% 1
Master’s Degree 1% 2
Other clinical degree 1% 3
Other non-clinical degree 2% 4
RN 0.5% 1
Multiple degrees5 13% 35
TOTAL 100% 265
Which best describes your medical training?
Response Options Percent Response Response Number
(N)
Internal Medicine / Family Medicine 29% 74
Pediatrics 14% 36
OB/Gyn 11% 28
Surgery 5% 12
Other Specialty 28% 71
Other Practice 4% 9
Multiple 10% 26
TOTAL 100% 256
If you are in clinical practice, what proportion of your patient population is non-white?
Response Options Percent Response Response Number
(N)
Less than 25% 21% 49
26% - 50% 26% 60
51% - 75% 21% 49
More than 75% 31% 71
TOTAL 100% 229
5 33 out of 35 respondents who hold multiple degrees indicated that one of the degrees was an M.D.

Climate Change and Health
Page 18
If you are in clinical practice, what proportion of your patient population is covered by the following insurance
arrangements?
Response Options Percent Response Response
Number (N)
Less than 50% More than 50% TOTAL
Self-Pay 99% 1% 126
Medicare 83% 17% 134
Medicaid 76% 24% 137
Private 72% 29% 137
Other 68% 32% 25
What is your gender?
Response Options
Percent Response Response Number
(N)
Female 62% 163
Male 40% 97
Female and Male 0.5% 1
Prefer not to answer 1% 2
TOTAL 100% 263
What is your age?
Response Options
Percent Response Response Number
(N)
18-30 5% 14
31-50 38% 100
51-65 43% 111
66 or older 14% 36
TOTAL 100% 261
Please specify your ethnicity:
Response Options
Percent Response Response Number
(N)
Hispanic or Latino/a 1% 3
Not Hispanic or Latino/a 99% 252
TOTAL 100% 255

Climate Change and Health
Page 19
Please specify your race [check all that apply]:
Response Options Percent Response Response Number
(N)
American Indian or Alaskan Native 1% 3
Asian 0% 0
Black or African American 95% 250
Native Hawaiian or other Pacific Islander 0% 0
White 0% 0
Multiple / Bi-racial 3% 9
TOTAL 100% 262
Would you like to assist in education or advocacy focused on climate and health in your community?
Response Options Percent Response Response Number
(N)
Yes 33% 85
No 67% 172
TOTAL 100% 257
Survey Group (not a response option)
Response Options Percent Response Response Number
(N)
Leadership Survey March 2014 36% 101
Member Survey May 2014 64% 183
TOTAL 100% 284
Climate Change and Health
Page 20
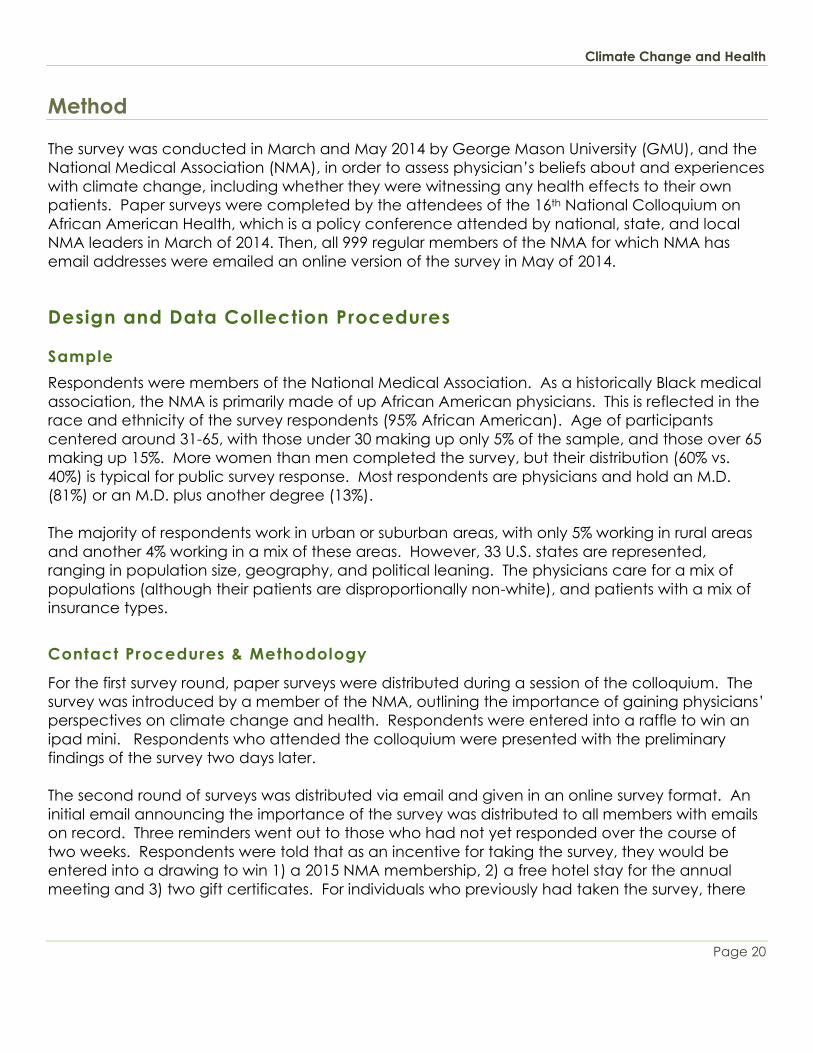
Method
The survey was conducted in March and May 2014 by George Mason University (GMU), and the
National Medical Association (NMA), in order to assess physician’s beliefs about and experiences
with climate change, including whether they were witnessing any health effects to their own
patients. Paper surveys were completed by the attendees of the 16th National Colloquium on
African American Health, which is a policy conference attended by national, state, and local
NMA leaders in March of 2014. Then, all 999 regular members of the NMA for which NMA has
email addresses were emailed an online version of the survey in May of 2014.
Design and Data Collection Procedures
Sample
Respondents were members of the National Medical Association. As a historically Black medical
association, the NMA is primarily made of up African American physicians. This is reflected in the
race and ethnicity of the survey respondents (95% African American). Age of participants
centered around 31-65, with those under 30 making up only 5% of the sample, and those over 65
making up 15%. More women than men completed the survey, but their distribution (60% vs.
40%) is typical for public survey response. Most respondents are physicians and hold an M.D.
(81%) or an M.D. plus another degree (13%).
The majority of respondents work in urban or suburban areas, with only 5% working in rural areas
and another 4% working in a mix of these areas. However, 33 U.S. states are represented,
ranging in population size, geography, and political leaning. The physicians care for a mix of
populations (although their patients are disproportionally non-white), and patients with a mix of
insurance types.
Contact Procedures & Methodology
For the first survey round, paper surveys were distributed during a session of the colloquium. The
survey was introduced by a member of the NMA, outlining the importance of gaining physicians’
perspectives on climate change and health. Respondents were entered into a raffle to win an
ipad mini. Respondents who attended the colloquium were presented with the preliminary
findings of the survey two days later.
The second round of surveys was distributed via email and given in an online survey format. An
initial email announcing the importance of the survey was distributed to all members with emails
on record. Three reminders went out to those who had not yet responded over the course of
two weeks. Respondents were told that as an incentive for taking the survey, they would be
entered into a drawing to win 1) a 2015 NMA membership, 2) a free hotel stay for the annual
meeting and 3) two gift certificates. For individuals who previously had taken the survey, there

Climate Change and Health
Page 21
was an option on the consent page that took them immediately to the end of the survey, so
they would not take the survey a second time.
In both surveys, participants were told the purpose of the study (assessing their attitudes about
how climate change is related to health) before taking the survey. In Survey 1, this information
was announced by an NMA member. In Survey 2, this information was written in the email with
the survey link. In both cases, the informed consent statement also informed participants of the
purpose of the study.
In both surveys, participants were asked whether they were interested in receiving more
information or volunteering to become involved with education or advocacy. If so, they were
asked to provide their contact information. In Survey 1, this information was included on a
separate, final page of the survey, which was removed from the rest of the survey prior to data
entry. In Survey 2, participants who were interested in this option clicked on a link that directed
them to a separate website where their contact information was recorded separately from their
survey responses.
Analysis
Descriptive statistics were run on all data collected during the March and May 2014 surveys. No
weighting was used to account for differences between the sample population and the general
NMA population. Respondents gave some personal information within the survey that is not
reported. Open-ended comments have been edited for minor grammar and spelling
corrections, and some comments which did not directly address the question have been
removed from this report.
Response Rate
The number of returned surveys at the Leadership meeting in March 2014 was 101 out of 139
surveys distributed to those attending the event. The online survey went to 999 members; 67
bounced back because of incorrect email addresses. There were 101 respondents who
completed the survey during the March meeting, and an additional 200 who accessed the
survey online. Seventeen online responses were dropped because respondents chose not to
participate or indicated that they had already taken the survey in March at the Leadership
meeting. The total number of responses for the two surveys was 284, for a total response rate of
30%. Since every survey participant did not answer every question; total responses are
presented for each question.

Climate Change and Health
Page 22
Appendix
Anecdotes about Patients from Physician Respondents (Selected)
Please describe if you have a relevant anecdote about a patient who has experienced one of these
impacts [open-ended question; responses were organized into general themes by the researchers]:
Asthma: I have (seen) a marked increase in the number of my patients who have asthma
exacerbations
I have many patients with asthma induced by weather changes, and this has been
increasing over the last few years.
With the current fluctuations in weather, we have seen quite a few asthma exacerbations.
People are used to having the weather be one way so they can predict when they may
have trouble with their illness, but now they are finding it more difficult to do so.
Heat: Extreme weather (heat and dry climate) (is) causing heat strokes and brush fires; with
subsequent smog worsen(ing) Asthma symptoms.
With the aging of the population, the incidence of heat strokes has risen in my practice
area.
Allergy: I have more patients with asthma and allergies coming in with flares earlier and earlier in the
year because pollen is produced earlier and earlier.
I practice as an allergist in metropolitan city, and patients state their allergic symptoms have
increased in the past 5 years.
I have a patient who has environmental allergies that are usually treated with antihistamines.
They now have to use steroid inhalers and bronchodilators at times.
I have had several patients with worsening or new onset allergic rhinitis.
I have noted an increasing number of patients with seasonal allergies
There is increased diagnosis of allergic respiratory symptoms among my patients.
In New Orleans there are a lot of patient's who experience severe symptoms from asthma.
This was a prevalent concern since we are surrounded by two large bodies of water.
However, following Katrina and it's damage, mold has become an unwelcome presence in
a lot of patient's lives.
Increased heat and dry air cause increased blowing dust, and more upper respiratory
allergy, and irritant symptoms
Seeing more patients with new onset seasonal allergies or worsening of seasonal allergies
Injury: My practice works with injury and the area in which I work has been affected by flooding
and increased snow fall both as a consequence of climate change which has increased
episodes of back injury from snow removal and water removal
Mental Health: Is our environment affecting our well-being, or are we over-diagnosing Bipolar disorders and
allergies. As a Hospitalist/Laborist, I am seeing more of the above. People say when the
temperature rises so do tempers. Maybe there is something to that.
My patient experienced atrocities during hurricane Katrina. As a result, she had PTSD and
severe depression that prevented her from holding a stable job. I do believe that with
climate change and global warming, we should expect more hurricanes of Katrina's severity
and such resultant mental health issues.

Climate Change and Health
Page 23
PTSD from May 2010 floods and or PTSD from 2005 Katrina
Chronic
Disease:
The severe weather and snow have limited patient access to the doctor. This causes acute
problems to become chronic problems and therefore much more difficult to treat.
Weather related Chronic Obstructive Pulmonary Disease (COPD) exacerbation, Cardiac
Failure exacerbations, Sickle crises, asthma, Sarcoid symptoms
My patients with COPD and asthma have had an increase in symptoms secondary to
weather changes.
Barriers to Greater Physician Involvement (Selected)
Other barriers listed [open-ended question; responses were organized into general themes by the researchers]:
Need for
Education:
Access to educational brochures
My lack of knowledge
General knowledge of effect
Lack of general knowledge in community
Lack of Time: As an Anesthesiologist I have a limited time to deal with more pressing issues
I work in the ER
Need for
Research:
Lack of studies on health effects
Lack of evidence based solutions
Won’t
Make a
Difference:
Apathy
Patient ignorance and prejudice
I think most patients would feel that there is little impact they would have on this problem
Not as visible yet in my area
Usually not relevant or useful with the exception of air quality in patients with respiratory
illnesses
Other: Opportunity related to relevancy of the client's visit
No ICD-9 code for billing
Lack of reimbursement
Climate Change and Health
Page 24
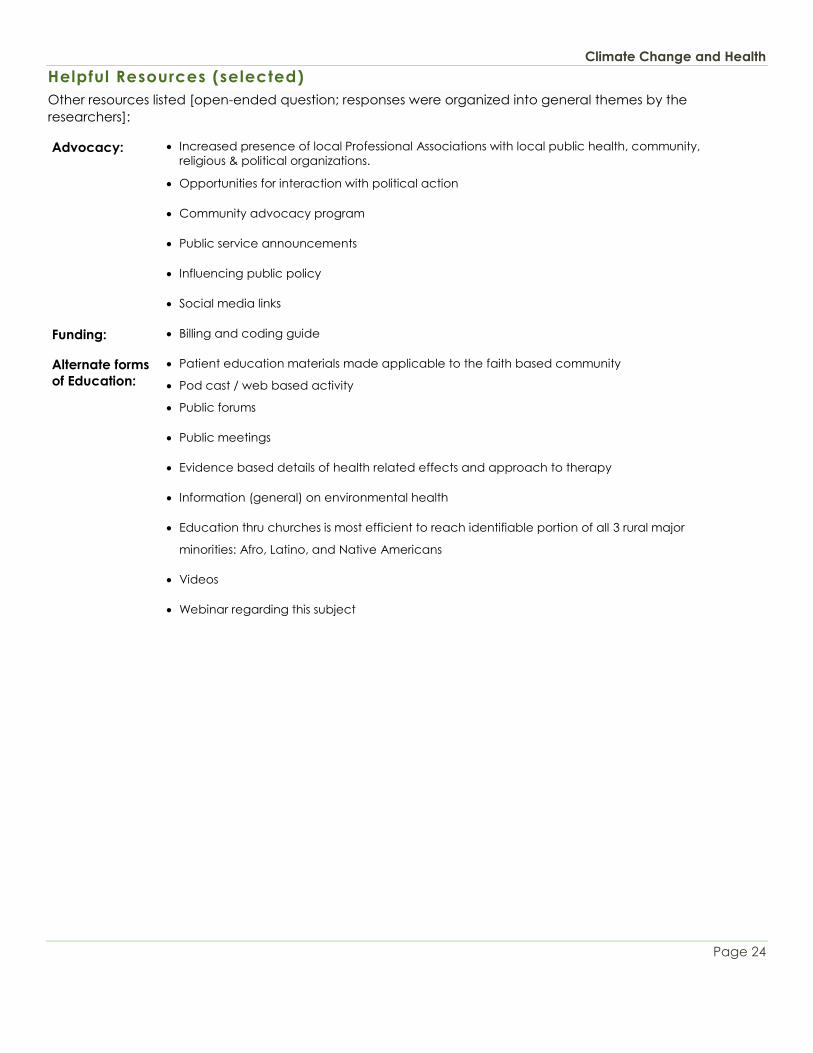
Helpful Resources (selected)
Other resources listed [open-ended question; responses were organized into general themes by the
researchers]:
Advocacy: Increased presence of local Professional Associations with local public health, community,
religious & political organizations.
Opportunities for interaction with political action
Community advocacy program
Public service announcements
Influencing public policy
Social media links
Funding: Billing and coding guide
Alternate forms
of Education:
Patient education materials made applicable to the faith based community
Pod cast / web based activity
Public forums
Public meetings
Evidence based details of health related effects and approach to therapy
Information (general) on environmental health
Education thru churches is most efficient to reach identifiable portion of all 3 rural major
minorities: Afro, Latino, and Native Americans
Videos
Webinar regarding this subject