key insights from pisa 2015 for the uk nations · key insights from pisa 2015 for the uk nations...
TRANSCRIPT
For more information visit www.nfer.ac.uk/international 1
Key insights from PISA 2015 for the UK nations
NFER Education Briefings
The Programme for International Student Assessment (PISA) is a worldwide research project involving schools and students in over 70 countries1. It is run by the OECD2 and takes place every three years.
PISA is designed to examine how 15-year-olds can apply what they have learned in school to real life situations. Students are asked to use their skills of reasoning, interpretation and problem solving rather than simply remembering facts. The 2015 survey was the first to be wholly computer based in the UK.
Each cycle of PISA has a different focus. The main focus in PISA 2015 was science, but it also included questions on maths, reading and collaborative problem solving. PISA also gathers extensive background information about students’ home and learning environments and the quantity, quality and content of teaching. This information can provide powerful insights into how well education systems are functioning, and how to improve teaching and learning for students around the world.
What is PISA?
1The 2018 survey will involve 82 countries. 2Organisation for Economic Co-operation and Development.
For more information visit www.nfer.ac.uk/international2
Has achievement in science, reading and mathematics changed over time?
Simply looking at whether the score for science, maths or reading is higher or lower than in a previous PISA cycle does not tell us accurately whether achievement has improved, is stable or is in decline. It is crucial to consider whether a score is statistically significantly different – in other words, that differences have not arisen solely by chance. In 2015, Northern Ireland’s score for maths was 493 and in 2012 it was 487. Although the score had increased, the international analysis found that Northern Ireland had actually maintained an equivalent level of performance.
How does achievement compare between countries?
It is tempting to focus on ‘rankings’ when comparing achievement between countries. However, ‘rankings’ can be misleading because small differences in scores may not be statistically significant. For example, for maths, although England lies five positions further up the international ‘rankings’ than Scotland, their scores are not actually significantly different.
Another reason not to rely on ‘rankings’ when comparing performance across countries
is that ‘rankings’ can be volatile, varying according to the mix of countries participating in any given cycle. One country’s position relative to other countries is not just based on its own performance. It’s also influenced by which countries participate and whether their performance has changed since the last round of PISA. For example, despite Scotland’s maths score in 2015 not varying significantly from 2012, it was outperformed by four additional countries.
What can PISA tell us about science, reading and
mathematics in the UK?
For more information visit www.nfer.ac.uk/international 3
How does achievement vary within countries?
A country’s average PISA science, reading or maths score doesn’t tell us everything we might need to know. In addition to knowing how well students in the UK performed overall, it is also important, for the purposes of teaching and learning, to examine the spread in performance between the highest and lowest achievers.
PISA provides data on the spread of achievement in two ways: the proportion of students achieving certain ‘proficiency levels’ and the difference between a country’s highest and lowest scores. For example, a high achieving country may have a very wide spread of achievement, whereas a country with average attainment may nevertheless have fewer students below the lowest proficiency levels.
What characteristics are associated with achievement?
PISA also provides in-depth contextual information about education systems, schools, teachers and students and their homes, and explores the relationships between these characteristics and achievement. This information can help countries make evidence-based decisions on aspects of their own education policy that they might review and adapt.
However, it is important to recognise that the data from PISA alone does not provide a magic formula for policy changes that will improve achievement. For example, it cannot tell us whether the high performance of countries such as Singapore or Japan is a direct result of the specific teaching practices they adopt or whether it is due to other aspects of the learning (or wider) environment. It is therefore important to consider PISA alongside other sources of evidence.
PISA also provides in-depth contextual information about education systems, schools, teachers and students and their homes, and explores the relationships between these characteristics and achievement.
For more information visit www.nfer.ac.uk/international4
450 470 490 510 530 550
England
NorthernIreland
Scotland
Wales
Average science achievement
485
497
500
512
OECDaverage493
Science
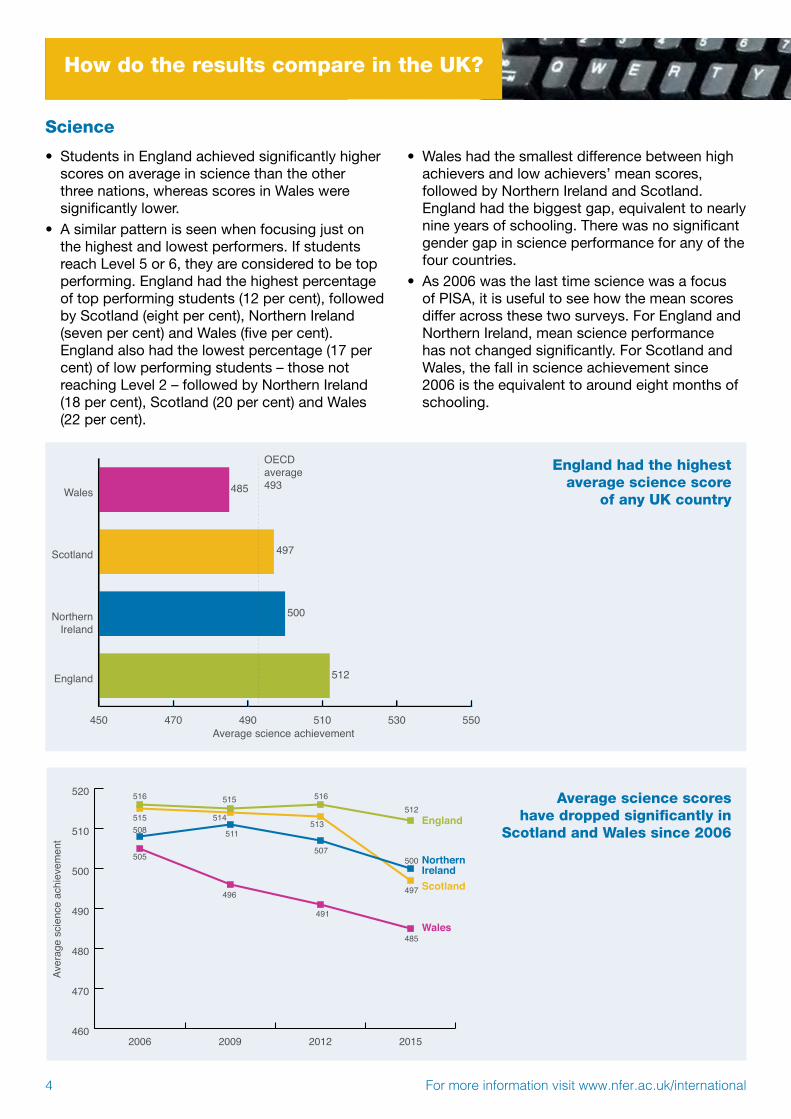
• Students in England achieved significantly higher scores on average in science than the other three nations, whereas scores in Wales were significantly lower.
• A similar pattern is seen when focusing just on the highest and lowest performers. If students reach Level 5 or 6, they are considered to be top performing. England had the highest percentage of top performing students (12 per cent), followed by Scotland (eight per cent), Northern Ireland (seven per cent) and Wales (five per cent). England also had the lowest percentage (17 per cent) of low performing students – those not reaching Level 2 – followed by Northern Ireland (18 per cent), Scotland (20 per cent) and Wales (22 per cent).
• Wales had the smallest difference between high achievers and low achievers’ mean scores, followed by Northern Ireland and Scotland. England had the biggest gap, equivalent to nearly nine years of schooling. There was no significant gender gap in science performance for any of the four countries.
• As 2006 was the last time science was a focus of PISA, it is useful to see how the mean scores differ across these two surveys. For England and Northern Ireland, mean science performance has not changed significantly. For Scotland and Wales, the fall in science achievement since 2006 is the equivalent to around eight months of schooling.
How do the results compare in the UK?
England had the highest average science score
of any UK country
460
470
480
490
500
510
520
2015201220092006
516 515 516512
500
497
485
513
507
491
514
511
496
515508
505
England
NorthernIrelandScotland
Wales
Aver
age
scie
nce
achi
evem
ent
Average science scores have dropped significantly in
Scotland and Wales since 2006
For more information visit www.nfer.ac.uk/international 5
450 470 490 510 530 550
England
NorthernIreland
Scotland
Wales
Average maths achievement
478
491
493
493
OECDaverage490
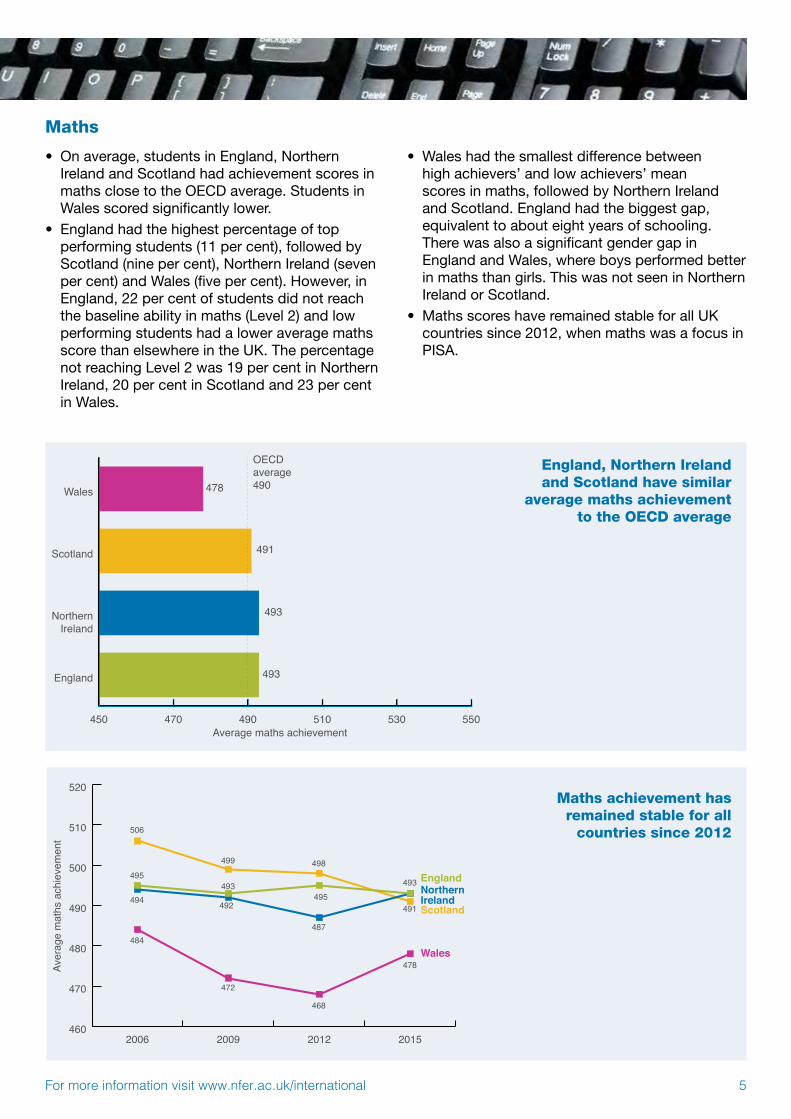
Maths
• On average, students in England, Northern Ireland and Scotland had achievement scores in maths close to the OECD average. Students in Wales scored significantly lower.
• England had the highest percentage of top performing students (11 per cent), followed by Scotland (nine per cent), Northern Ireland (seven per cent) and Wales (five per cent). However, in England, 22 per cent of students did not reach the baseline ability in maths (Level 2) and low performing students had a lower average maths score than elsewhere in the UK. The percentage not reaching Level 2 was 19 per cent in Northern Ireland, 20 per cent in Scotland and 23 per cent in Wales.
• Wales had the smallest difference between high achievers’ and low achievers’ mean scores in maths, followed by Northern Ireland and Scotland. England had the biggest gap, equivalent to about eight years of schooling. There was also a significant gender gap in England and Wales, where boys performed better in maths than girls. This was not seen in Northern Ireland or Scotland.
• Maths scores have remained stable for all UK countries since 2012, when maths was a focus in PISA.
England, Northern Ireland and Scotland have similar
average maths achievement to the OECD average
460
470
480
490
500
510
520
2015201220092006
506
499 498495
494493
492495
487
468
478
491
472
484
493 EnglandNorthernIrelandScotland
Wales
Aver
age
mat
hs a
chie
vem
ent
Maths achievement has remained stable for all
countries since 2012
For more information visit www.nfer.ac.uk/international6
450 470 490 510 530 550
England
NorthernIreland
Scotland
Wales
Average reading achievement
477
493
497
500
OECDaverage493
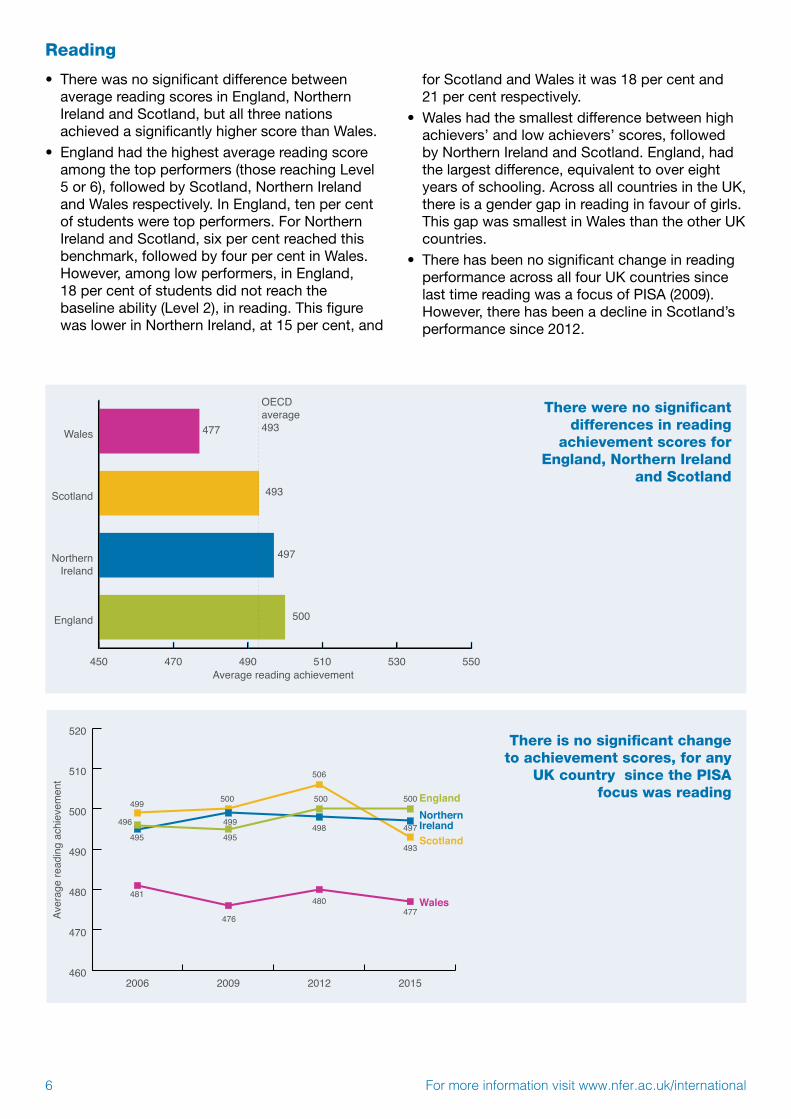
Reading
• There was no significant difference between average reading scores in England, Northern Ireland and Scotland, but all three nations achieved a significantly higher score than Wales.
• England had the highest average reading score among the top performers (those reaching Level 5 or 6), followed by Scotland, Northern Ireland and Wales respectively. In England, ten per cent of students were top performers. For Northern Ireland and Scotland, six per cent reached this benchmark, followed by four per cent in Wales. However, among low performers, in England, 18 per cent of students did not reach the baseline ability (Level 2), in reading. This figure was lower in Northern Ireland, at 15 per cent, and
for Scotland and Wales it was 18 per cent and 21 per cent respectively.
• Wales had the smallest difference between high achievers’ and low achievers’ scores, followed by Northern Ireland and Scotland. England, had the largest difference, equivalent to over eight years of schooling. Across all countries in the UK, there is a gender gap in reading in favour of girls. This gap was smallest in Wales than the other UK countries.
• There has been no significant change in reading performance across all four UK countries since last time reading was a focus of PISA (2009). However, there has been a decline in Scotland’s performance since 2012.
There were no significant differences in reading
achievement scores for England, Northern Ireland
and Scotland
Aver
age
read
ing
achi
evem
ent
460
470
480
490
500
510
520
2015201220092006
499
496
495
481
476
495
499
500
506
500
498
480477
497
500
493
EnglandNorthernIrelandScotland
Wales
There is no significant change to achievement scores, for any
UK country since the PISA focus was reading

For more information visit www.nfer.ac.uk/international 7
Disadvantaged students
• PISA examines the impact socio-economic status (SES) has on performance. England has the largest gap between the average performance of students with high and low SES, and Wales has the smallest (as well as having the lowest average SES score of the four nations). Furthermore, the relationship between SES and outcomes is weakest in Wales, meaning differences between high and low performing students can only be weakly explained by differences in the socio-economic status of students – there are other factors also at play.
• England has a greater proportion of resilient students, defined by OECD as having low socio-economic status but high achievement scores, than Northern Ireland, Wales and Scotland respectively.
Science in the future
• Students in England and Wales had the most confidence in their ability to accomplish goals in science compared to Northern Ireland and Scotland.
• Students in Wales were more likely to report that they wanted to work in science in the future, followed by England, Scotland and Northern Ireland respectively. Across all countries participating in PISA 2015, this aspiration is strongly related to science achievement.
School Environment
• Headteachers /principals in England and Scotland were more likely to report a lack of teaching staff as a concern to their school, more headteachers than in Northern Ireland and Wales.
• Headteachers /principals in England and Wales more often reported a problem with inadequate or poorly qualified teachers than in Scotland and Northern Ireland. Nearly half of headteachers in England, Northern Ireland and Wales reported problems with a lack of physical infrastructure and inadequate or poor quality educational material. Around one in four headteachers in Scotland reported this.
• Headteachers /principals in Northern Ireland and Wales were much less likely to report that learning was hindered by teachers not meeting individuals’ needs than in Scotland and England. More headteachers in Wales reported teachers not being well prepared for classes as a barrier to students learning than in England, Northern Ireland and Scotland.
For more information visit www.nfer.ac.uk/international8
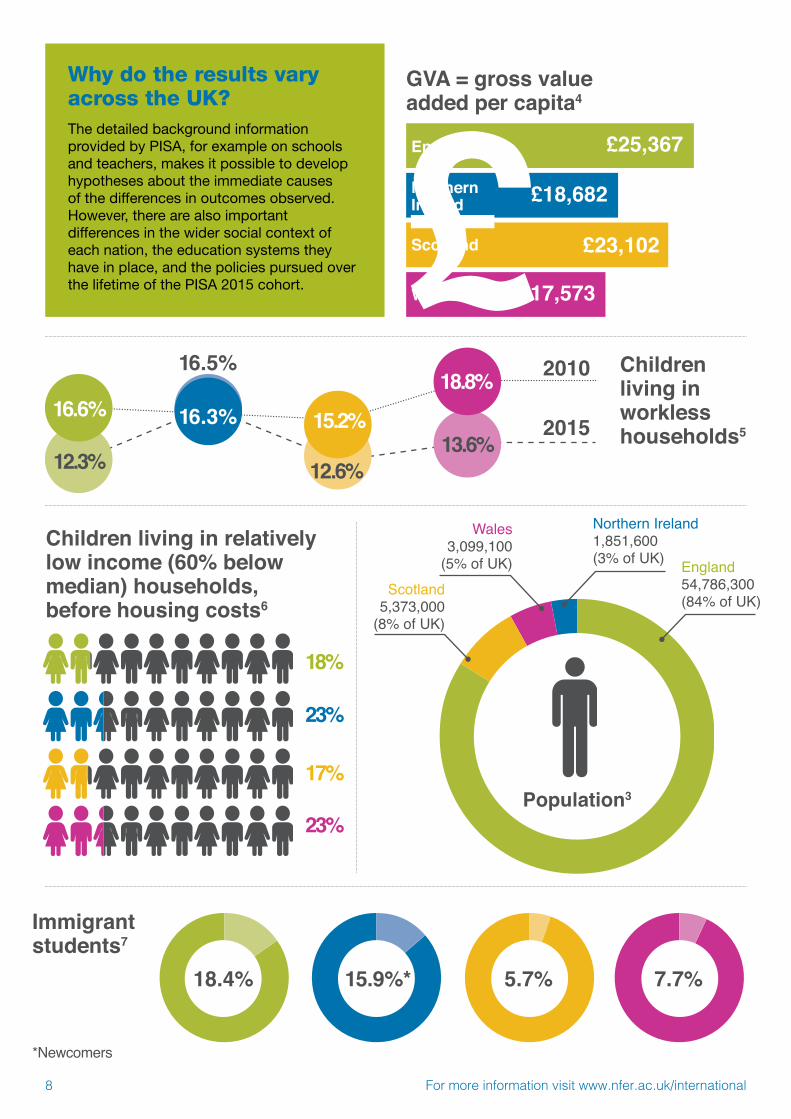
GVA = gross value added per capita4
£25,367
£18,682
£23,102
£17,573£
Population3
Scotland5,373,000
(8% of UK)
England54,786,300(84% of UK)
Wales3,099,100
(5% of UK)
Northern Ireland1,851,600(3% of UK)
Immigrant students7
Children living in relatively low income (60% below median) households, before housing costs6
Children living in workless households5
18%
23%
17%
23%
16.5%
12.6%
15.2%13.6%
18.8%
18.4% 15.9%* 5.7% 7.7%
2010
2015
Why do the results vary across the UK?The detailed background information provided by PISA, for example on schools and teachers, makes it possible to develop hypotheses about the immediate causes of the differences in outcomes observed. However, there are also important differences in the wider social context of each nation, the education systems they have in place, and the policies pursued over the lifetime of the PISA 2015 cohort.
16.6%
12.3%
16.3%
Northern Ireland
England
Scotland
Wales
*Newcomers
For more information visit www.nfer.ac.uk/international 9
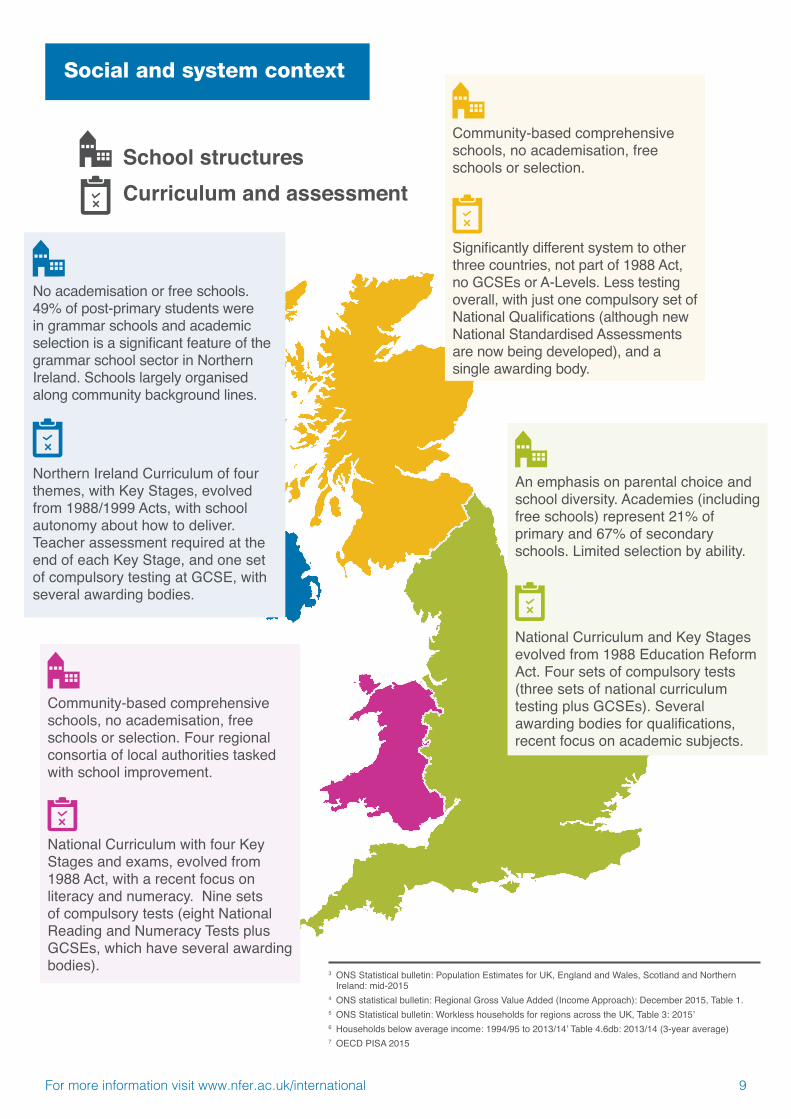
No academisation or free schools. 49% of post-primary students were in grammar schools and academic selection is a significant feature of the grammar school sector in Northern Ireland. Schools largely organised along community background lines.
An emphasis on parental choice and school diversity. Academies (including free schools) represent 21% of primary and 67% of secondary schools. Limited selection by ability.
Community-based comprehensive schools, no academisation, free schools or selection.
Community-based comprehensive schools, no academisation, free schools or selection. Four regional consortia of local authorities tasked with school improvement.
National Curriculum and Key Stages evolved from 1988 Education Reform Act. Four sets of compulsory tests (three sets of national curriculum testing plus GCSEs). Several awarding bodies for qualifications, recent focus on academic subjects.
Significantly different system to other three countries, not part of 1988 Act, no GCSEs or A-Levels. Less testing overall, with just one compulsory set of National Qualifications (although new National Standardised Assessments are now being developed), and a single awarding body.
Northern Ireland Curriculum of four themes, with Key Stages, evolved from 1988/1999 Acts, with school autonomy about how to deliver.Teacher assessment required at the end of each Key Stage, and one set of compulsory testing at GCSE, with several awarding bodies.
National Curriculum with four Key Stages and exams, evolved from 1988 Act, with a recent focus on literacy and numeracy. Nine sets of compulsory tests (eight National Reading and Numeracy Tests plus GCSEs, which have several awarding bodies).
3 ONS Statistical bulletin: Population Estimates for UK, England and Wales, Scotland and Northern Ireland: mid-2015
4 ONS statistical bulletin: Regional Gross Value Added (Income Approach): December 2015, Table 1.5 ONS Statistical bulletin: Workless households for regions across the UK, Table 3: 2015’6 Households below average income: 1994/95 to 2013/14’ Table 4.6db: 2013/14 (3-year average)7 OECD PISA 2015
Curriculum and assessmentSchool structures
Social and system context
For more information visit www.nfer.ac.uk/international10
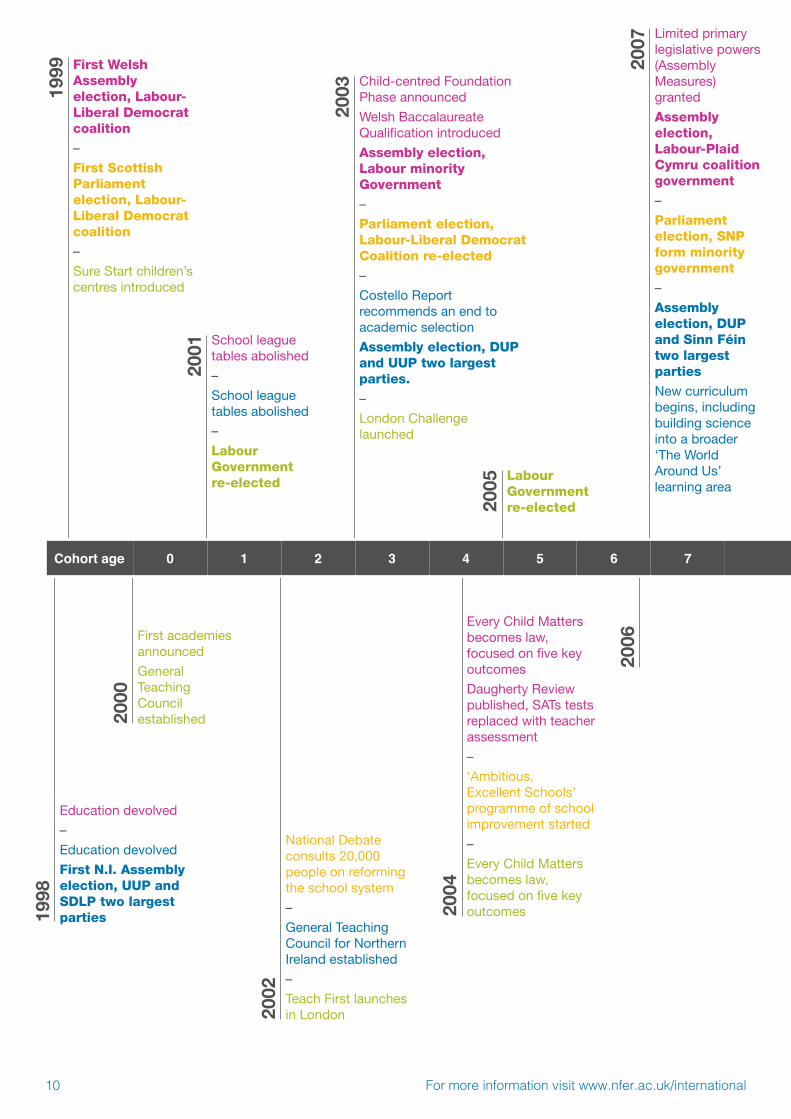
Cohort age PISA 2015
1999
2003
2007
2001
2005
1998
2004
2002
2000
2006
First Welsh Assembly election, Labour-Liberal Democrat coalition
–
First Scottish Parliament election, Labour-Liberal Democrat coalition
–
Sure Start children’s centres introduced
Child-centred Foundation Phase announced
Welsh Baccalaureate Qualification introduced
Assembly election, Labour minority Government
–
Parliament election, Labour-Liberal Democrat Coalition re-elected
–
Costello Report recommends an end to academic selection
Assembly election, DUP and UUP two largest parties.
–
London Challenge launched
Limited primary legislative powers (Assembly Measures) granted
Assembly election, Labour-Plaid Cymru coalition government
–
Parliament election, SNP form minority government
–
Assembly election, DUP and Sinn Féin two largest parties
New curriculum begins, including building science into a broader ‘The World Around Us’ learning area
School league tables abolished
–
School league tables abolished
–
Labour Government re-elected Labour
Government re-elected
Education devolved
–
Education devolved
First N.I. Assembly election, UUP and SDLP two largest parties
Every Child Matters becomes law, focused on five key outcomes
Daugherty Review published, SATs tests replaced with teacher assessment
–
‘Ambitious, Excellent Schools’ programme of school improvement started
–
Every Child Matters becomes law, focused on five key outcomes
National Debate consults 20,000 people on reforming the school system
–
General Teaching Council for Northern Ireland established
–
Teach First launches in London
First academies announced
General Teaching Council established
6 70 2 3 4 51
For more information visit www.nfer.ac.uk/international 11
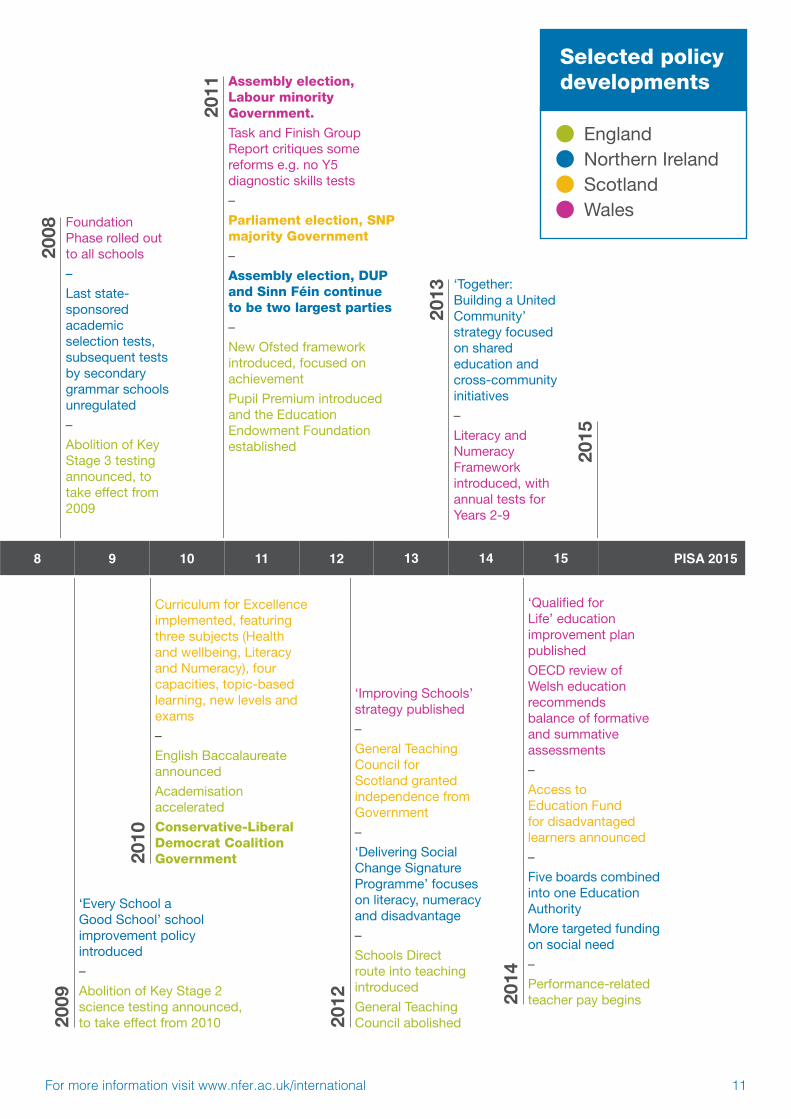
Cohort age PISA 2015
2015
2013
2011
2008
2014
2012
2010
2009
‘Together: Building a United Community’ strategy focused on shared education and cross-community initiatives
–
Literacy and Numeracy Framework introduced, with annual tests for Years 2-9
Assembly election, Labour minority Government.
Task and Finish Group Report critiques some reforms e.g. no Y5 diagnostic skills tests
–
Parliament election, SNP majority Government
–
Assembly election, DUP and Sinn Féin continue to be two largest parties
–
New Ofsted framework introduced, focused on achievement
Pupil Premium introduced and the Education Endowment Foundation established
Foundation Phase rolled out to all schools
–
Last state-sponsored academic selection tests, subsequent tests by secondary grammar schools unregulated
–
Abolition of Key Stage 3 testing announced, to take effect from 2009
‘Qualified for Life’ education improvement plan published
OECD review of Welsh education recommends balance of formative and summative assessments
–
Access to Education Fund for disadvantaged learners announced
–
Five boards combined into one Education Authority
More targeted funding on social need
–
Performance-related teacher pay begins
‘Improving Schools’ strategy published
–
General Teaching Council for Scotland granted independence from Government
–
‘Delivering Social Change Signature Programme’ focuses on literacy, numeracy and disadvantage
–
Schools Direct route into teaching introduced
General Teaching Council abolished
Curriculum for Excellence implemented, featuring three subjects (Health and wellbeing, Literacy and Numeracy), four capacities, topic-based learning, new levels and exams
–
English Baccalaureate announced
Academisation accelerated
Conservative-Liberal Democrat Coalition Government
‘Every School a Good School’ school improvement policy introduced
–
Abolition of Key Stage 2 science testing announced, to take effect from 2010
Selected policy developments
• England• Northern Ireland• Scotland• Wales
8 9 10 11 12 13 14 15
For more information visit www.nfer.ac.uk/international12© NFER 2016 | ISBN 978-1-911039-34-1
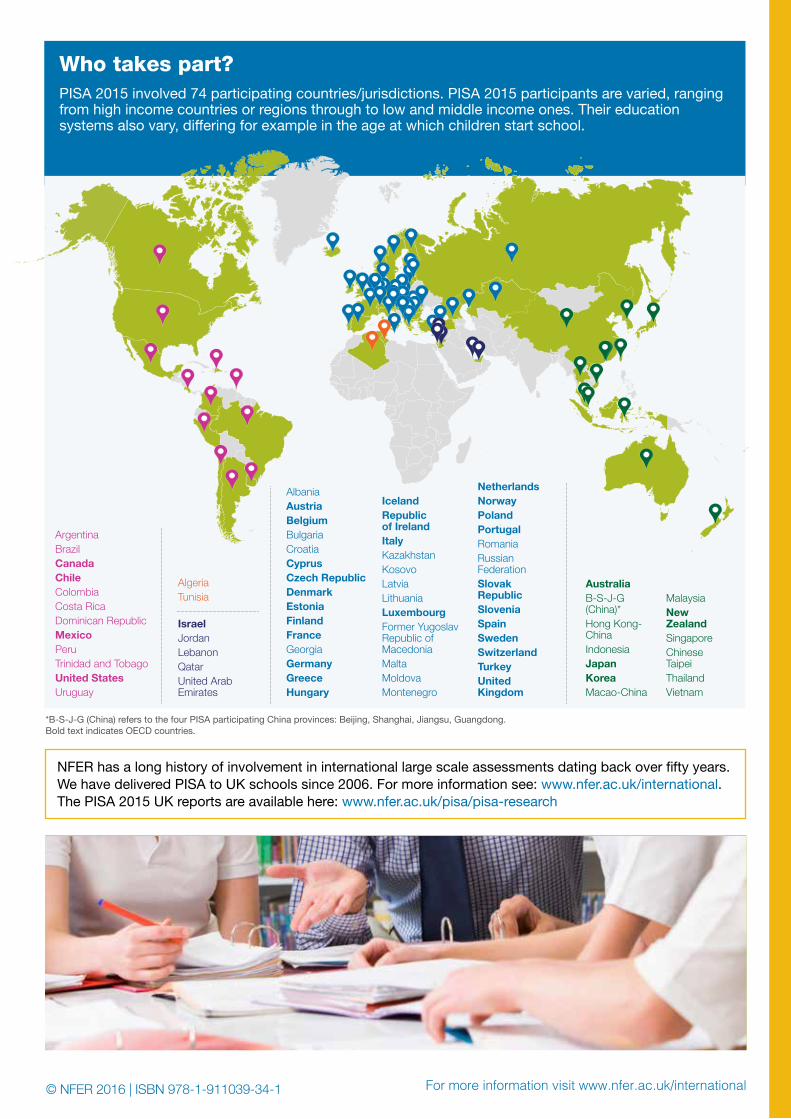
Who takes part?PISA 2015 involved 74 participating countries/jurisdictions. PISA 2015 participants are varied, ranging from high income countries or regions through to low and middle income ones. Their education systems also vary, differing for example in the age at which children start school.
IsraelJordanLebanonQatarUnited Arab Emirates
AlbaniaAustriaBelgiumBulgariaCroatiaCyprusCzech RepublicDenmarkEstoniaFinlandFranceGeorgiaGermanyGreeceHungary
IcelandRepublic of IrelandItalyKazakhstanKosovoLatviaLithuaniaLuxembourgFormer Yugoslav Republic of MacedoniaMaltaMoldovaMontenegro
Netherlands NorwayPolandPortugalRomaniaRussian FederationSlovak RepublicSloveniaSpainSwedenSwitzerlandTurkeyUnited Kingdom
AustraliaB-S-J-G (China)*Hong Kong-ChinaIndonesiaJapanKoreaMacao-China
MalaysiaNew ZealandSingaporeChinese Taipei ThailandVietnam
ArgentinaBrazilCanada ChileColombiaCosta RicaDominican RepublicMexicoPeru Trinidad and TobagoUnited States Uruguay
AlgeriaTunisia
*B-S-J-G (China) refers to the four PISA participating China provinces: Beijing, Shanghai, Jiangsu, Guangdong. Bold text indicates OECD countries.
NFER has a long history of involvement in international large scale assessments dating back over fifty years. We have delivered PISA to UK schools since 2006. For more information see: www.nfer.ac.uk/international. The PISA 2015 UK reports are available here: www.nfer.ac.uk/pisa/pisa-research