key macroeconomic indicators of ukraine analytic information ministry finance of ukraine
TRANSCRIPT
KEY MACROECONOMIC INDICATORS OF UKRAINE
Analytic information
MINISTRY FINANCE OF UKRAINE

Ukraine
AreaArea 603,7 km2
PopulationPopulation 45,6 mln.
GDPGDP 20102010nominal - $136,4 billionreal – 104,1%
GDPGDP 20120111nominal - $165,2 billionreal – 105,2%
GDPGDP 20122012
((forecastforecast))nominal - $187,5 billionreal – 103,9%
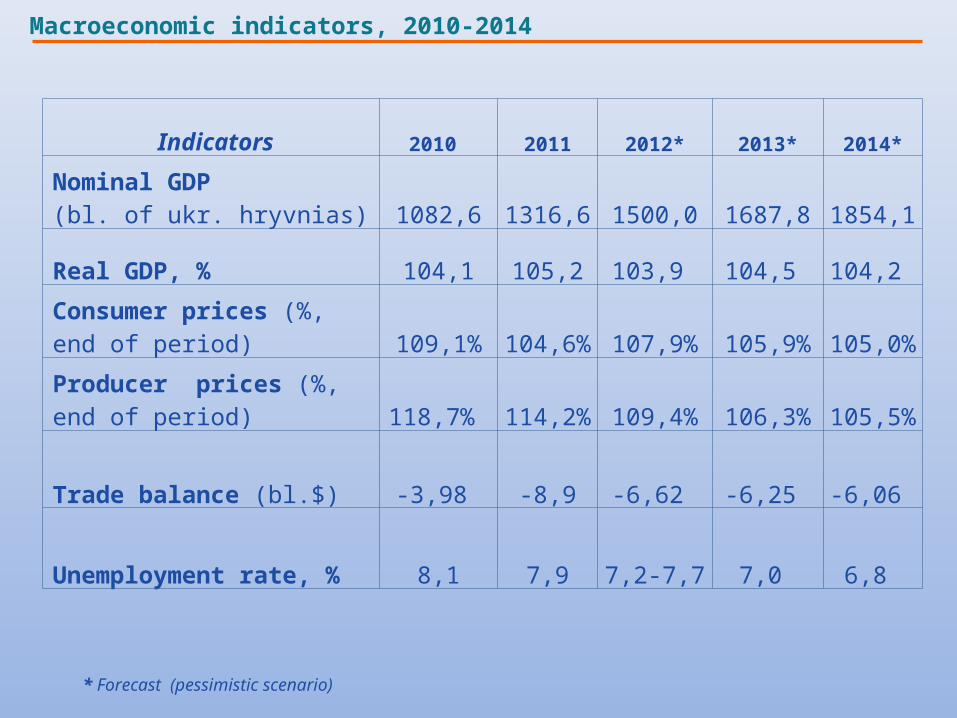
Macroeconomic indicators, 2010-2014
* Forecast (pessimistic scenario)
Indicators 2010 2011 2012* 2013* 2014*
Nominal GDP (bl. of ukr. hryvnias) 1082,6 1316,6 1500,0 1687,8 1854,1
Real GDP, % 104,1 105,2 103,9 104,5 104,2
Consumer prices (%, end of period) 109,1% 104,6% 107,9% 105,9% 105,0%
Producer prices (%, end of period) 118,7% 114,2% 109,4% 106,3% 105,5%
Trade balance (bl.$) -3,98 -8,9 -6,62 -6,25 -6,06
Unemployment rate, % 8,1 7,9 7,2-7,7 7,0 6,8
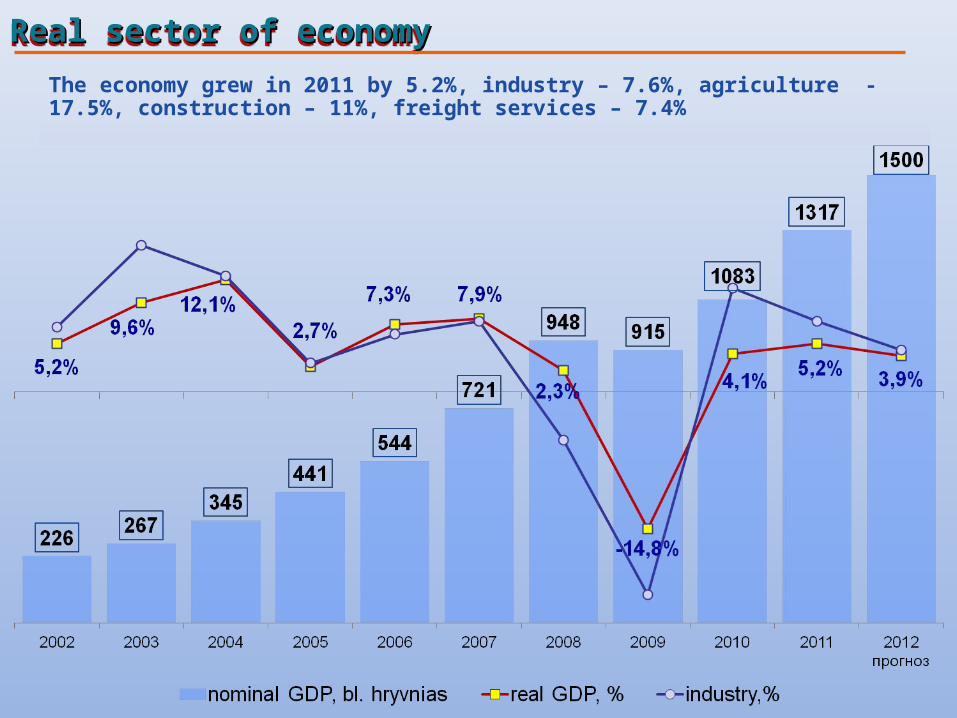
The economy grew in 2011 by 5.2%, industry – 7.6%, agriculture - 17.5%, construction – 11%, freight services – 7.4%
Real sector of economyReal sector of economyReal sector of economyReal sector of economy
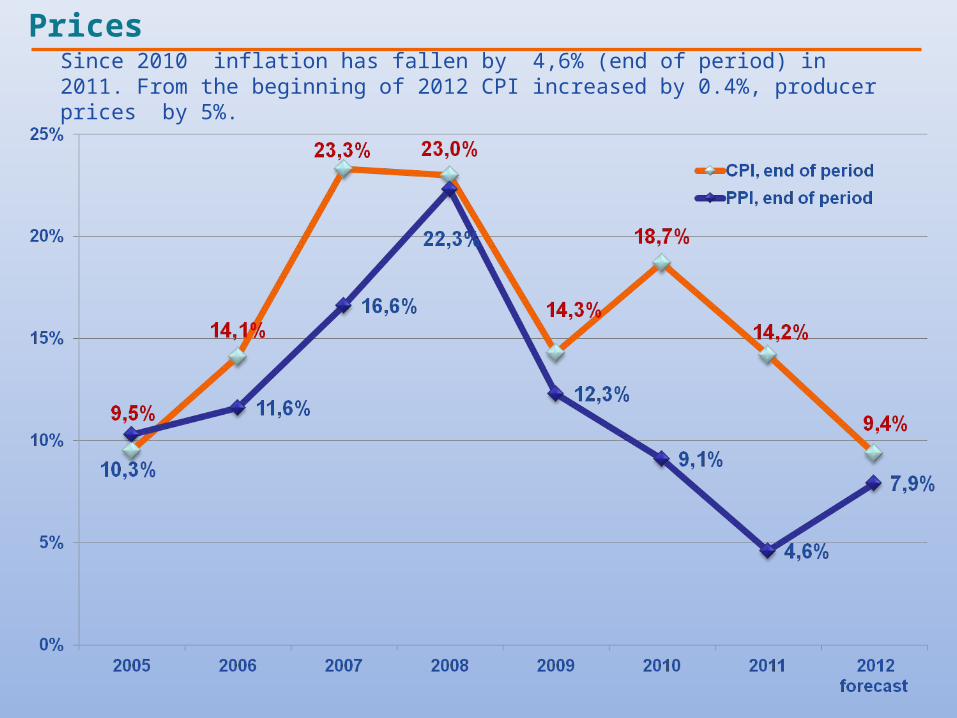
Since 2010 inflation has fallen by 4,6% (end of period) in 2011. From the beginning of 2012 CPI increased by 0.4%, producer prices by 5%.
Prices
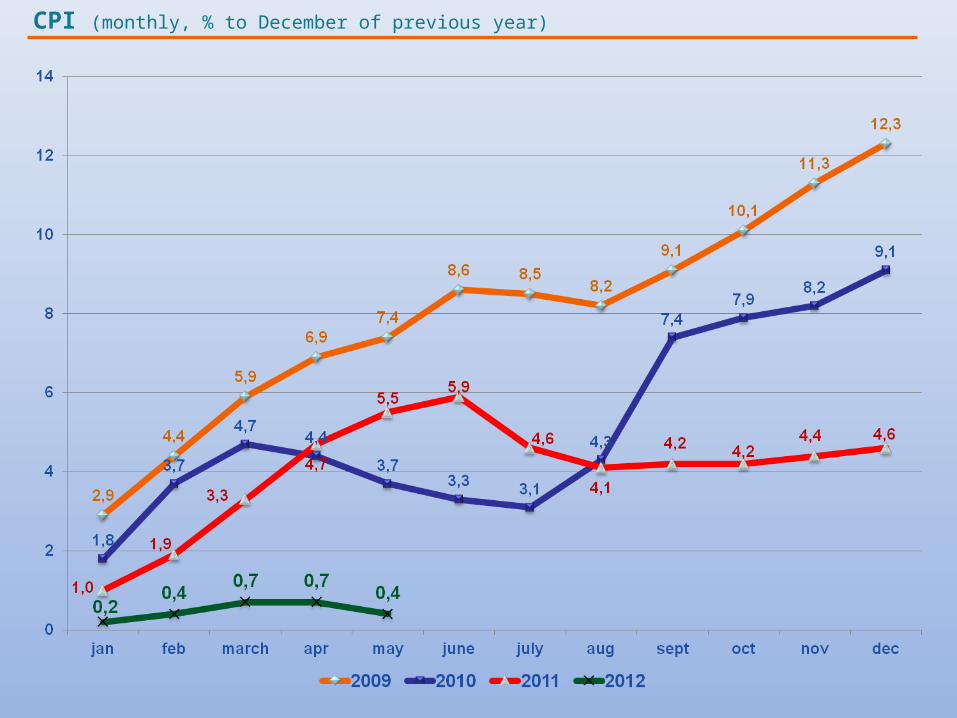
CPI (monthly, % to December of previous year)
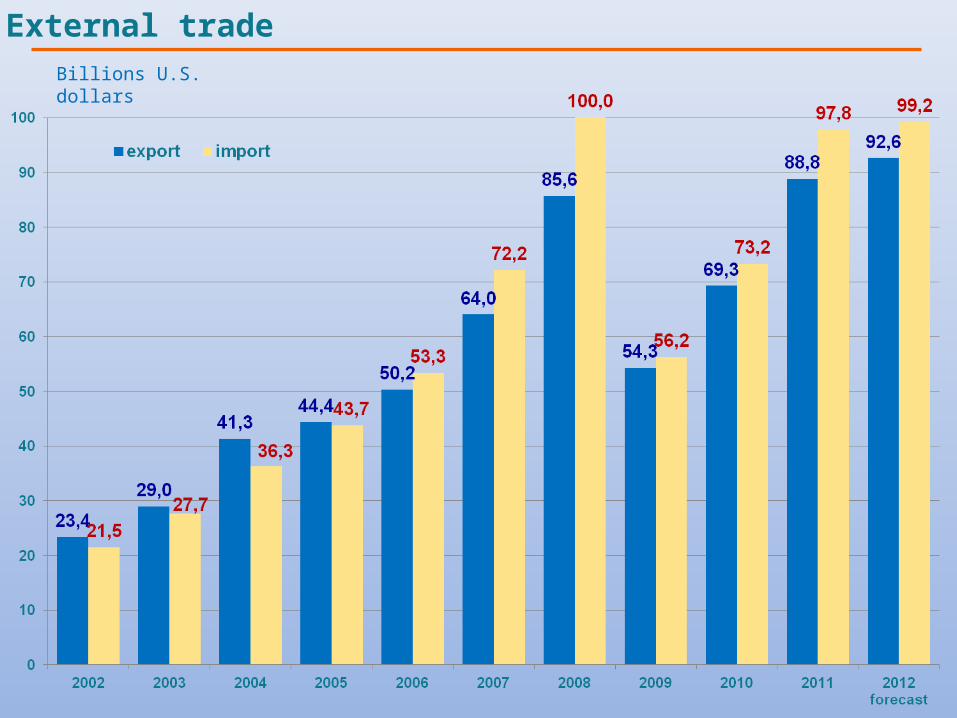
External trade Billions U.S. dollars
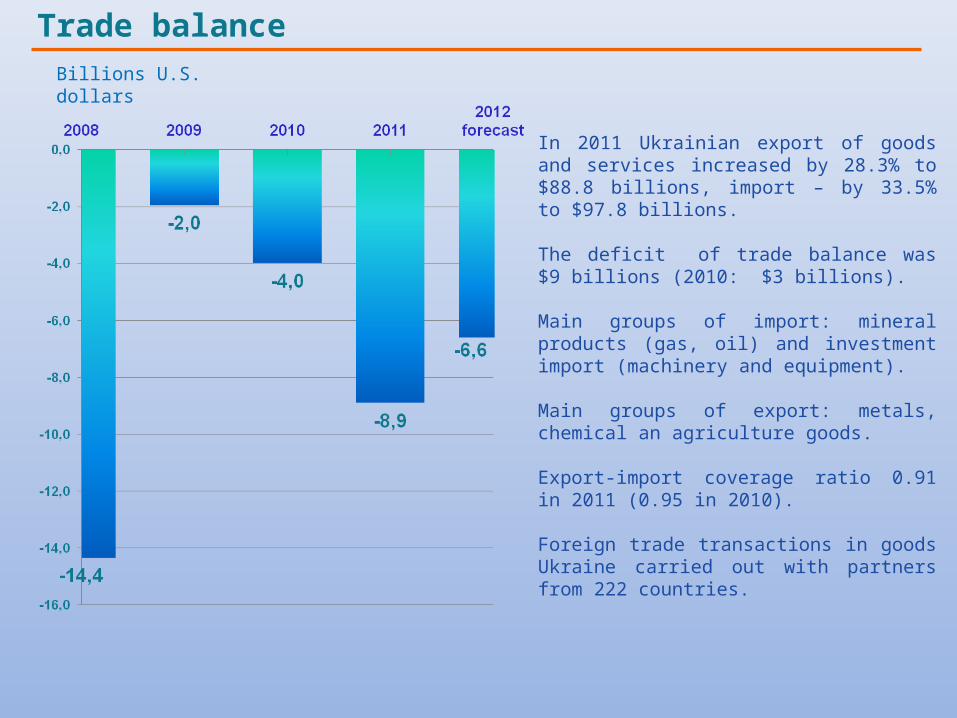
In 2011 Ukrainian export of goods and services increased by 28.3% to $88.8 billions, import – by 33.5% to $97.8 billions.
The deficit of trade balance was $9 billions (2010: $3 billions).
Main groups of import: mineral products (gas, oil) and investment import (machinery and equipment).
Main groups of export: metals, chemical an agriculture goods.
Export-import coverage ratio 0.91 in 2011 (0.95 in 2010).
Foreign trade transactions in goods Ukraine carried out with partners from 222 countries.
Trade balance Billions U.S. dollars
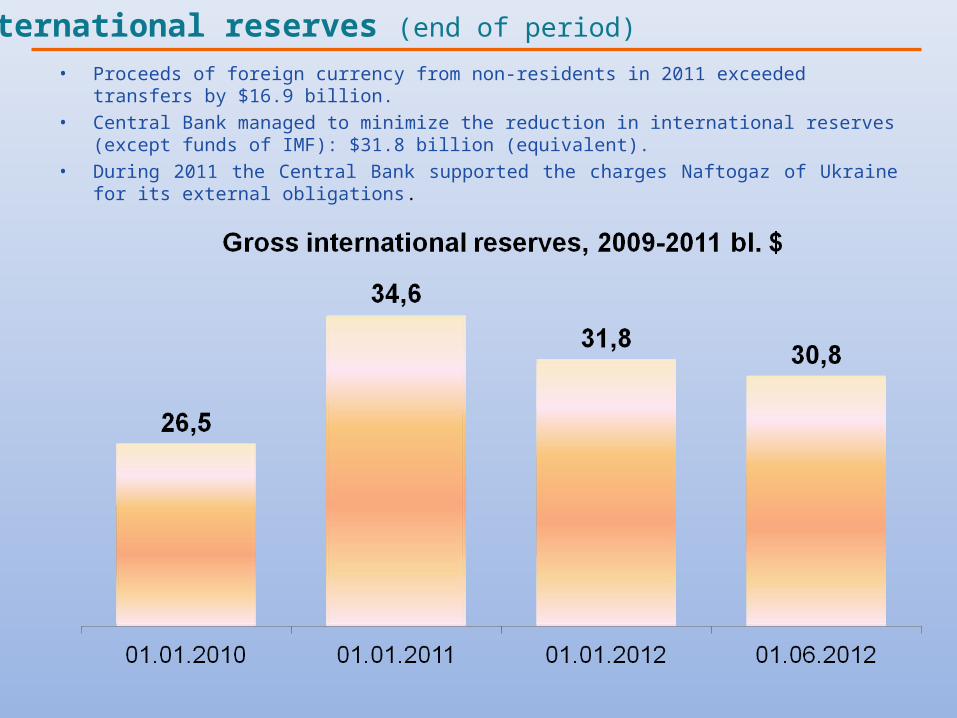
• Proceeds of foreign currency from non-residents in 2011 exceeded transfers by $16.9 billion.
• Central Bank managed to minimize the reduction in international reserves (except funds of IMF): $31.8 billion (equivalent).
• During 2011 the Central Bank supported the charges Naftogaz of Ukraine for its external obligations.
International reserves (end of period)
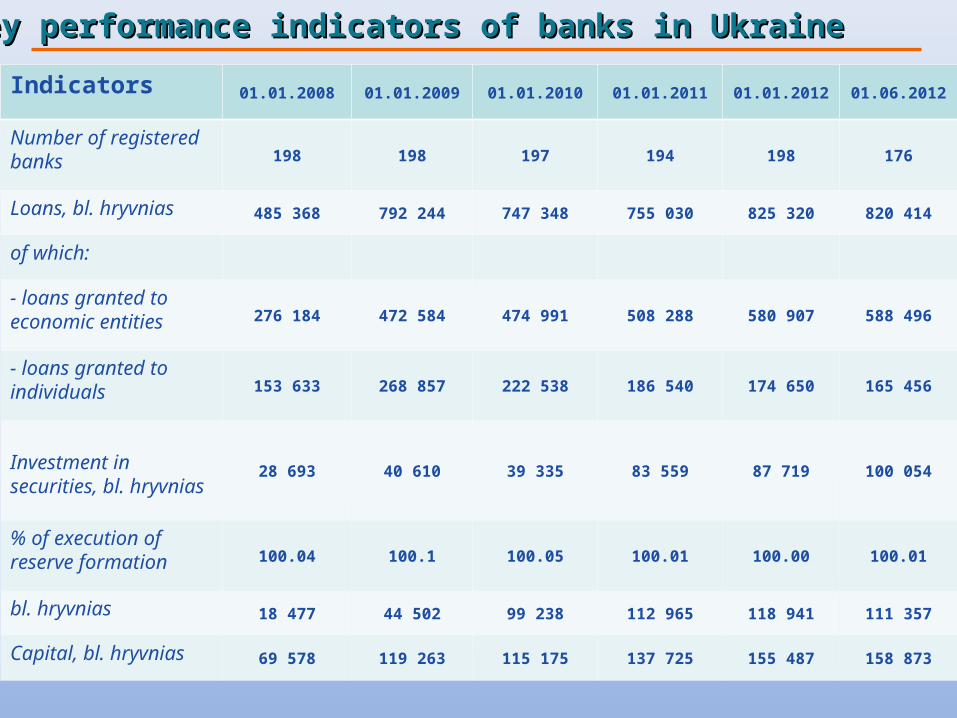
Key performance indicators of banks in UkraineKey performance indicators of banks in Ukraine
Indicators 01.01.2008 01.01.2009 01.01.2010 01.01.2011 01.01.2012 01.06.2012
Number of registered banks 198 198 197 194 198 176
Loans, bl. hryvnias 485 368 792 244 747 348 755 030 825 320 820 414
of which:
- loans granted to economic entities 276 184 472 584 474 991 508 288 580 907 588 496
- loans granted to individuals 153 633 268 857 222 538 186 540 174 650 165 456
Investment in securities, bl. hryvnias
28 693 40 610 39 335 83 559 87 719 100 054
% of execution of reserve formation 100.04 100.1 100.05 100.01 100.00 100.01
bl. hryvnias 18 477 44 502 99 238 112 965 118 941 111 357
Capital, bl. hryvnias 69 578 119 263 115 175 137 725 155 487 158 873
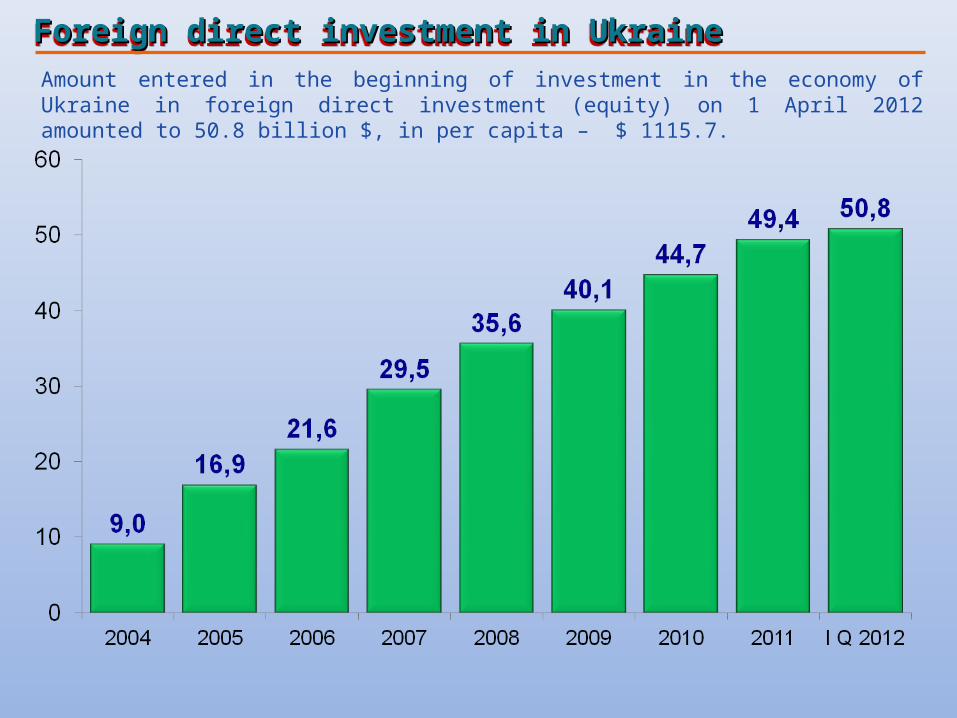
Foreign direct investment in Ukraine Foreign direct investment in Ukraine Foreign direct investment in Ukraine Foreign direct investment in Ukraine
Amount entered in the beginning of investment in the economy of Ukraine in foreign direct investment (equity) on 1 April 2012 amounted to 50.8 billion $, in per capita – $ 1115.7.
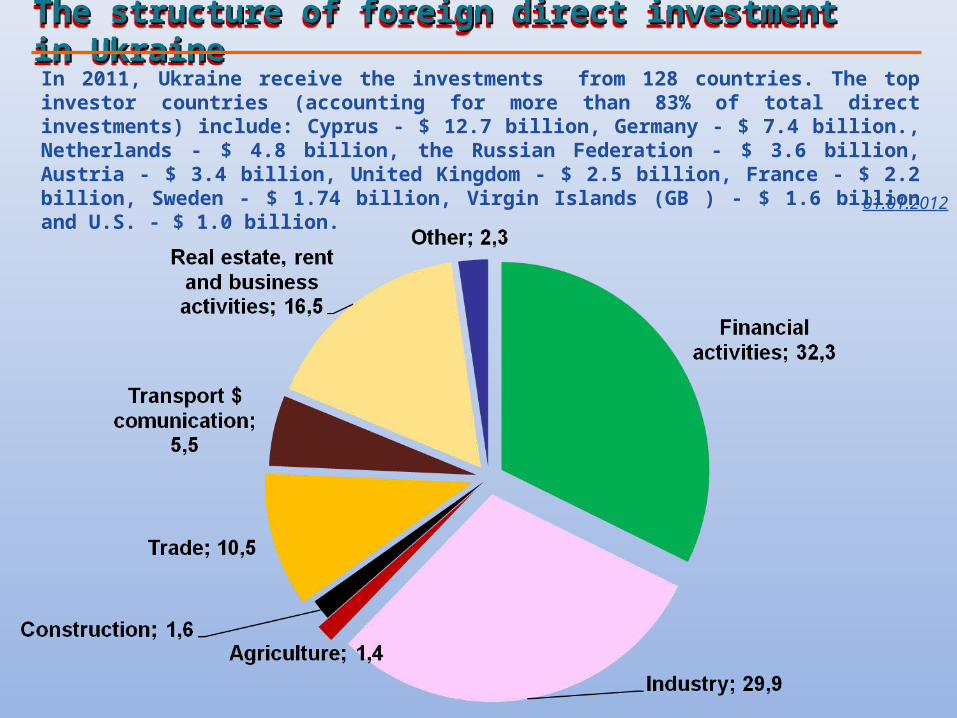
The structure of foreign direct investment in Ukraine The structure of foreign direct investment in Ukraine The structure of foreign direct investment in Ukraine The structure of foreign direct investment in Ukraine In 2011, Ukraine receive the investments from 128 countries. The top investor countries (accounting for more than 83% of total direct investments) include: Cyprus - $ 12.7 billion, Germany - $ 7.4 billion., Netherlands - $ 4.8 billion, the Russian Federation - $ 3.6 billion, Austria - $ 3.4 billion, United Kingdom - $ 2.5 billion, France - $ 2.2 billion, Sweden - $ 1.74 billion, Virgin Islands (GB ) - $ 1.6 billion and U.S. - $ 1.0 billion.
01.01.2012

Gross external debtGross external debtGross external debtGross external debt
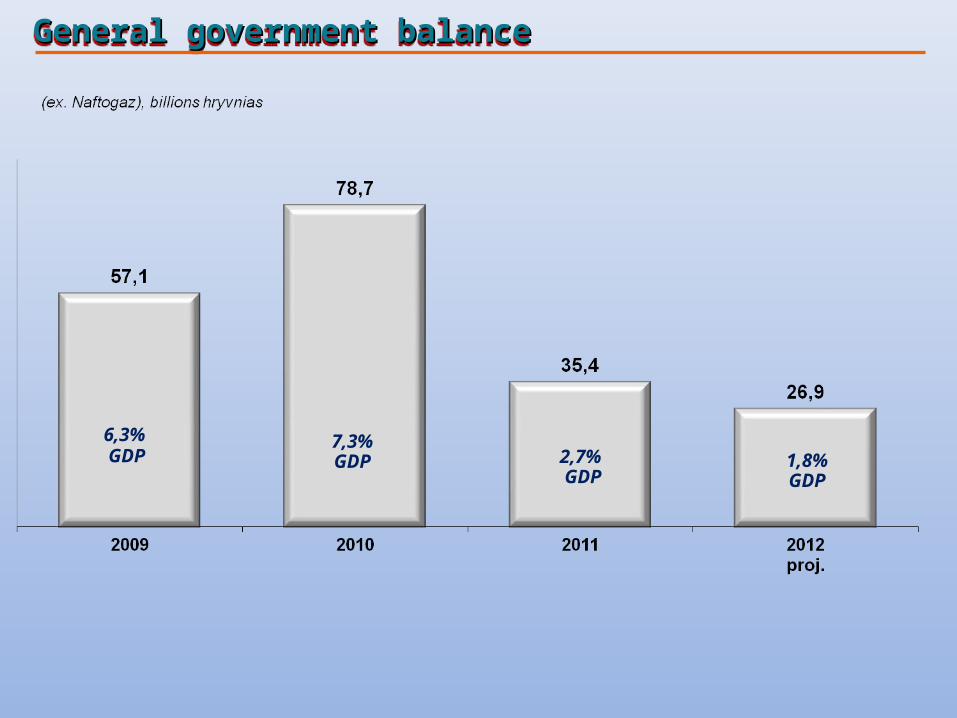
General government balanceGeneral government balanceGeneral government balanceGeneral government balance
6,3% GDP
7,3% GDP 2,7%
GDP1,8% GDP
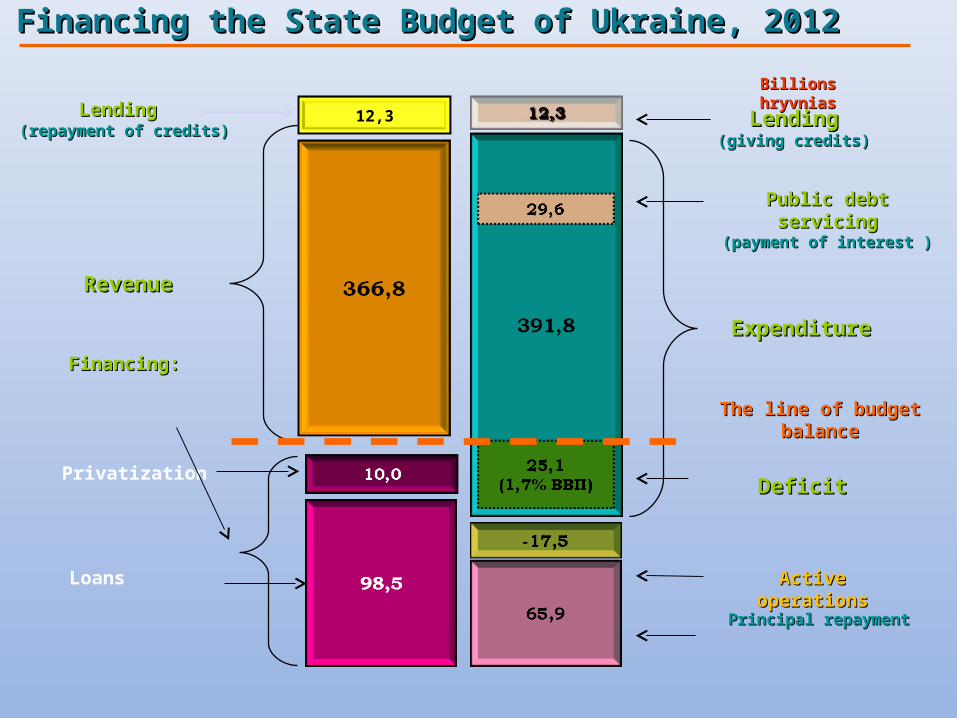
FinancingFinancing the State Budget of Ukraine, the State Budget of Ukraine, 20122012
RevenueRevenue
ExpenditureExpenditure
Deficit Deficit
Financing:Financing:
Principal repayment Principal repayment
The line of budget The line of budget balancebalance
Public debt servicingPublic debt servicing(payment of interest )(payment of interest )
LendingLending(giving credits)(giving credits)
12,3LendingLending (repayment of credits)(repayment of credits)
Active Active operationsoperations
Privatization
Loans
Billions hryvniasBillions hryvnias
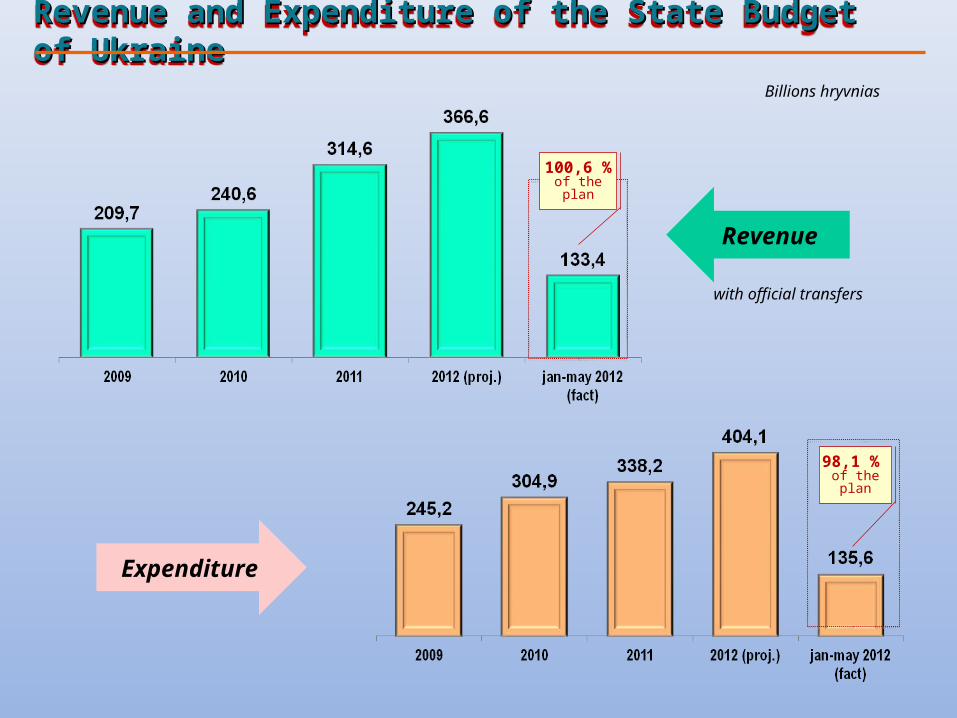
100,6 % of the plan
with official transfers
98,1 % of the plan
Billions hryvnias
Revenue and Expenditure of the State Budget of UkraineRevenue and Expenditure of the State Budget of UkraineRevenue and Expenditure of the State Budget of UkraineRevenue and Expenditure of the State Budget of Ukraine
Revenue
Expenditure
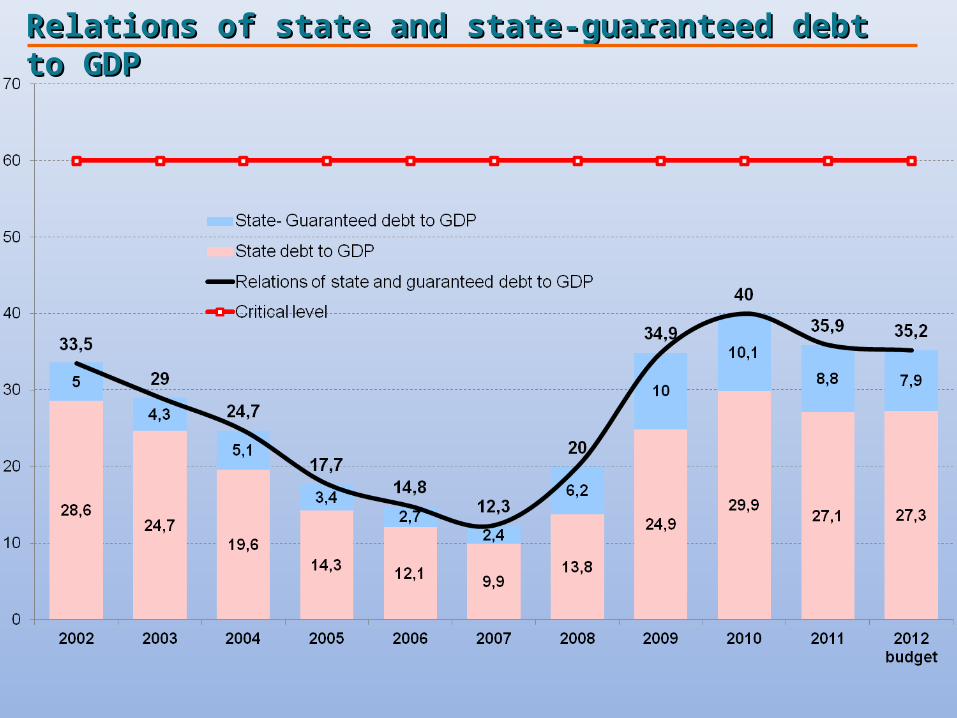
Relations of state and state-guaranteed debt to GDPRelations of state and state-guaranteed debt to GDP

Ukraine CanadaNetherlands
PolandUkraine
Italy
Comparative assessment of the State debt of Ukraine and other countriesComparative assessment of the State debt of Ukraine and other countries
за даними IMF та Мінфіну
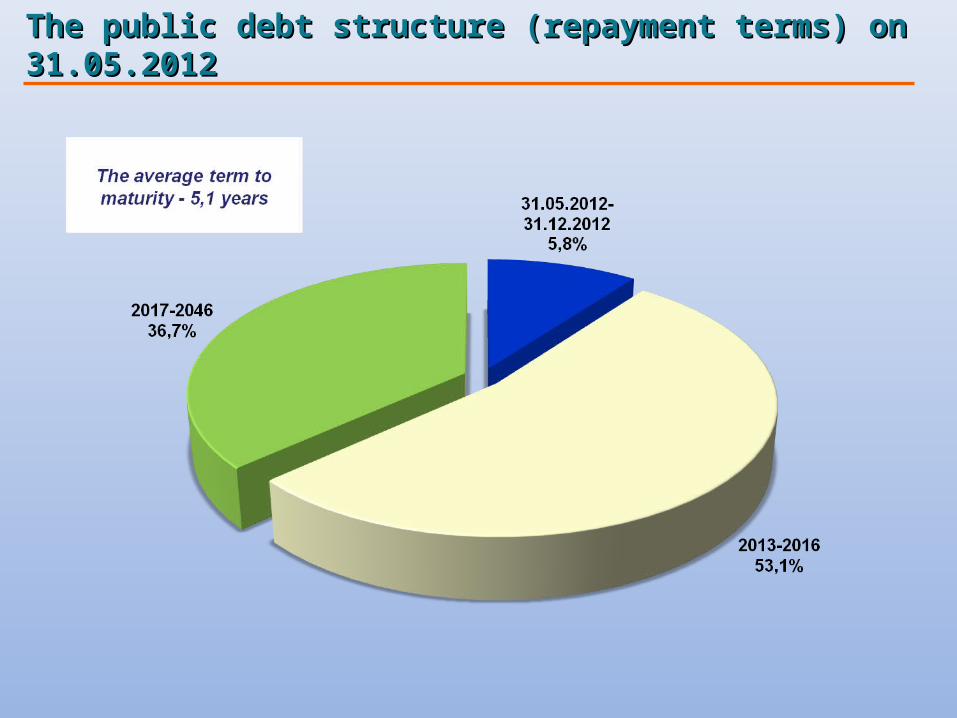
The public debt structure (repayment terms) on 31.05.2012The public debt structure (repayment terms) on 31.05.2012
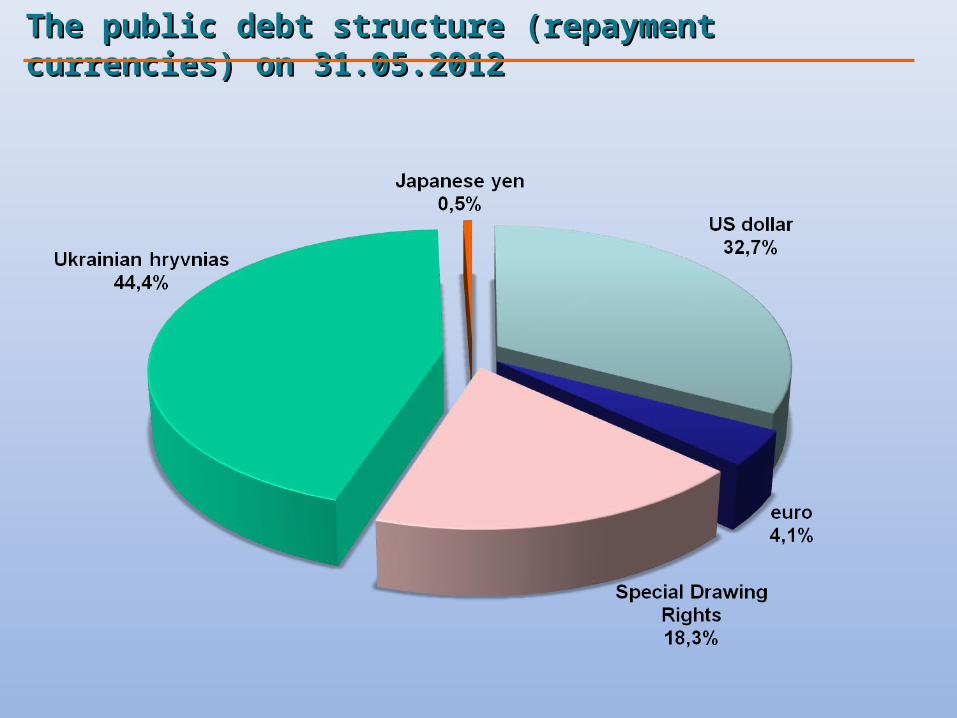
The public debt structure (repayment currencies) on 31.05.2012The public debt structure (repayment currencies) on 31.05.2012
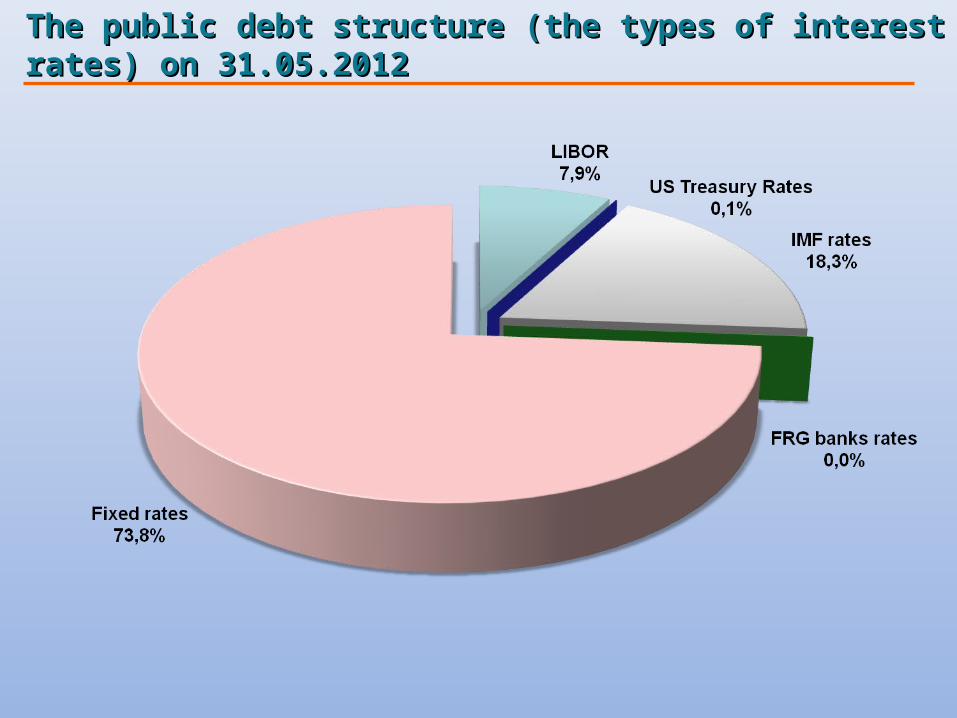
The public debt structure (the types of interest rates) on 31.05.2012The public debt structure (the types of interest rates) on 31.05.2012