macroeconomic indicators of ukraine for several years. (by materials of the national bank of...
DESCRIPTION
Macroeconomic indicators of Ukraine for several years. (By materials of the National Bank of Ukraine). My gift to you.TRANSCRIPT

1. Macroeconomic indicators
1.1. Gross domestic product, output of industry and agriculture, capital investments, retail turnover
1.2. Consumer price index, Industrial producer price index, unemployment
1.3. Revenues and expenditures of population, wages
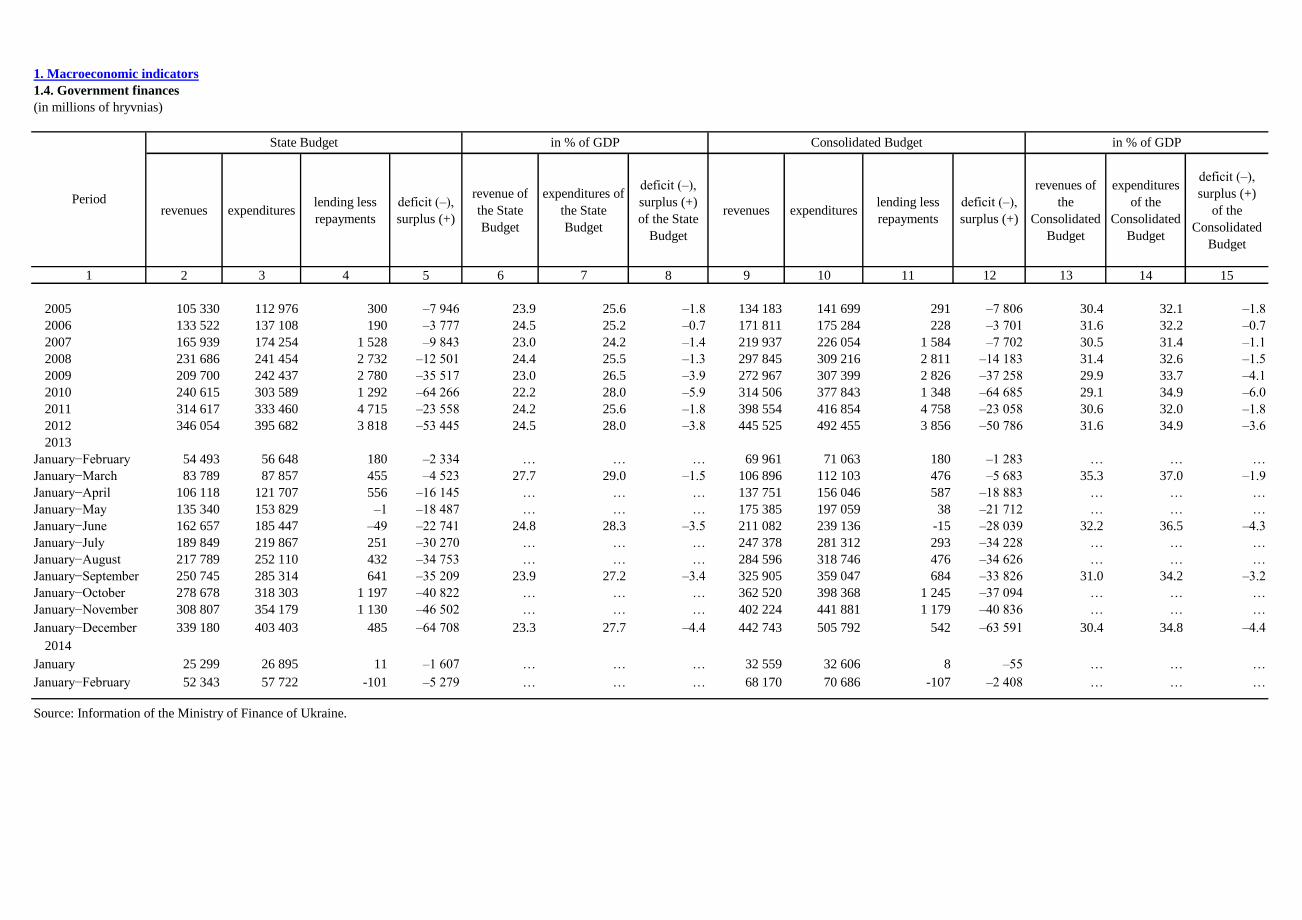
1.4. Government finances
1.5. Balance of payments, external debt, official reserve assets, exchange rate

1. Macroeconomic indicators
1.1. Gross domestic product, output of industry and agriculture, capital investments, retail turnover
(at current prices, in millions of hryvnias)
index of physical
volumedeflator
1 2 3 4 5 6 7 8 9
2005 441 452 103.0 124.2 468 563 103.1 92 540 111 174 94 332
2006 544 153 107.4 114.7 551 729 106.2 95 730 148 972 129 952
2007 720 731 107.6 123.1 717 077 107.6 109 985 222 679 178 233
2008 948 056 102.3 128.6 917 036 94.8 152 210 272 074 246 903
2009 913 345 85.2 113.0 806 551 78.1 154 202 192 878 230 955
2010 1 082 569 104.1 113.8 1 065 851 111.2 189 405 189 061 280 890
2011 1 302 079 105.2 114.3 1 331 888 108.0 253 569 259 932 350 059
2012 1 411 238 100.3 108.1 1 400 680 99.5 261 835 263 728 405 114
2013
January−February … … … 176 330 95.6 14 580 … 59 687
January−March 302 864 98.8 104.6 273 984 95.5 21 270 51 944 94 621
January−April … … … 370 609 96.2 32 301 … 130 048
January−May … … … 458 529 95.2 45 720 … 162 880
January−June 655 889 98.7 3
102.8 3
548 403 95.1 65 216 103 330 197 952
January−July … … … 638 657 95.2 128 746 … 236 701
January−August … … … 729 860 95.3 173 167 … 275 971
January−September 1 050 620 98.8 3
102.6 3
817 971 95.2 191 668 166 977 312 339
January−October … … … 911 953 95.3 230 473 … 350 895
January−November … … … 1 008 134 95.4 262 650 … 387 402
January−December 1 454 931 100.0 103.1 1 111 269 95.7 308 100 247 892 429 242
2014
January … … … 81 940 95.0 7 215 … 31 605
January−February … … … 170 306 95.8 16 020 … 64 020
Source: State Statistics Service of Ukraine.
3 Quarterly data in percentages of the corresponding quarter of the previous year.
Volume of agricultural
production output
4 Fixed investments have been replaced with capital investments put into service (used). Since January – March 2012 the State Statistics Service of Ukraine are calculating according to the international practices which do
not separate calculations for fixed investments.
Volume of industrial
output sold 2
Industrial production
index, %
over corresponding
period of previous year 2
Gross domestic product
2 Since 2010 annual data and since 2012 monthly data are calculating according to the Classification of Economic Activities (DK 009:2010) (NACE Rev.2).
Volume of enterprises
retail turnover
Capital investments
put into service (used)4Period
nominal1
al constant prices of 2007, % over
corresponding period of previous year
1 Data for January−June and January−September have been calculated based on the quarterly data of the nominal amount provided by the State Statistics Service of Ukraine.

1. Macroeconomic indicators
1.2. Consumer price index, Industrial producer price index, unemployment
over previous
month
over December of
the previous year 1
over previous
month
over December of
the previous year 1 age 15−70 years−total
including:
able−bodied citizens
(15−54, 15−59)
1 2 3 4 5 6 7 8 9
2005 … 110.3 … 109.5 20 680 18 887 882 3.2
2006 … 111.6 … 114.1 20 730 19 032 760 2.7
2007 … 116.6 … 123.3 20 905 19 190 642 2.3
2008 … 122.3 … 123.0 20 972 19 252 845 3.0
2009 … 112.3 … 114.3 20 192 18 365 532 1.9
2010 … 109.1 … 118.7 20 266 18 437 545 2.0
2011 … 104.6 … 114.2 20 324 18 516 483 1.8
2012 … 99.8 … 100.3 20 354 18 737 507 1.8
2013
January 100.2 100.2 100.3 100.3 … … 565 2.0
February 99.9 100.1 98.4 98.7 … … 589 2.1
March 100.0 100.1 102.2 100.9 20 085 18 671 572 2.0
April 100.0 100.1 102.5 103.4 … … 535 1.9
May 100.1 100.2 103.1 106.6 … … 501 1.8
June 100.0 100.2 97.3 103.7 20 380 18 877 465 1.7
July 99.9 100.1 97.1 100.7 … … 452 1.6
August 99.3 99.4 101.2 101.9 … … 435 1.6
September 100.0 99.4 100.2 102.1 20 541 19 002 422 1.5
October 100.4 99.8 100.2 102.3 … … 395 1.4
November 100.2 100.0 98.7 101.0 … … 424 1.5
December 100.5 100.5 100.7 101.7 20 404 18 902 488 1.8
2014
January 100.2 100.2 100.5 100.5 … … 525 1.9
February 100.6 100.8 99.8 100.3 … … 536 1.9
1 Annual data − December over December of the previous year.
Source: State Statistics Service of Ukraine.
Period
Consumer price index, % Industrial producer price index, % Registered
unemployment rate
(at the end of the
period),
% of the working age
population
Population employed (on average since the
beginning of the year), thousand of persons Number of registered
unemployed persons,
total (at the end of the
period),
thousand of persons

1. Macroeconomic indicators
1.3. Revenue and expenditures of population, wages
(in millions of hryvnias)
nominal1
disposable1
real disposable
(excluding
inflation), %
over corresponding
period of the previous
year
over December of the
previous year 3
over corresponding
period of the previous
year
over December of the
previous year 3
1 2 3 4 5 6 7 8 9 10 11
2005 381 404 298 275 123.9 335 753 45 651 806 136.7 144.9 120.3 131.5
2006 472 061 363 586 111.8 427 858 44 203 1 041 129.2 125.2 118.3 111.7
2007 623 289 470 953 114.8 575 510 47 779 1 351 129.7 131.1 112.5 110.3
2008 845 641 634 493 107.6 793 630 52 011 1 806 133.7 119.5 106.3 97.0
2009 894 286 661 915 90.0 813 909 80 377 1 906 105.5 111.6 90.8 99.0
2010 1 101 175 847 949 117.1 939 308 161 867 2 239 120.0 120.1 110.2 110.5
2011 1 266 753 988 983 108.0 1 143 630 123 123 2 633 117.6 116.1 108.7 111.0
2012 1 457 864 1 149 244 113.9 1 310 584 147 280 3 026 114.9 110.4 114.4 111.0
2013
January−February … … … … … 3 012 109.2 90.1 109.6 90.2
January−March 329 252 251 242 108.9 300 857 28 395 3 080 109.5 95.1 109.9 95.1
January−April … … … … … 3 116 109.5 95.7 110.2 95.9
January−May … … … … … 3 143 109.1 96.2 109.8 96.3
January−June 701 282 534 980 105.7 4
648 854 52 428 3 181 109.1 100.0 109.6 100.1
January−July … … … … … 3 215 108.9 101.5 109.5 101.5
January−August … … … … … 3 222 108.7 97.7 109.3 98.4
January−September 1 096 139 850 683 102.5 4
1 008 899 87 240 3 227 108.5 96.5 109.1 97.2
January−October … … … … … 3 232 108.2 97.1 108.7 97.6
January−November … … … … … 3 234 107.9 96.7 108.4 97.0
January−December 1 529 406 1 190 351 105.3 1 396 836 132 570 3 265 107.9 107.1 108.2 106.8
2014
January … … … … … 3 148 104.9 87.0 104.6 87.0
January−February … … … … … 3 169 105.2 88.1 104.1 87.6
3 Annual data − December over December of the previous year and monthly data − last month of the period are calculated based on the data provided by the State Statistics Service of Ukraine.
Source: State Statistics Service of Ukraine.
4 Quarterly data in percentages of the corresponding quarter of the previous year.
Average monthly
nominal wage per
full-time employee,
hryvnias 2
Growth/decrease rates of average monthly
nominal wage per full-time employee, % 2
Index of the real average monthly
wage, % 2
Period
Population
expenditures
(except
savings)1
Population
savings1
Population income − total
2 The data refer to enterprises and their independent divisions with 10 and more employees. The information on changes in the organization of enterprises labour observations can be found in the methodological
explanations to express release #49 "Number, Working Time and Wages of Employees in January 2010" as of February 26, 2010.
1 Data for January−June and January−September have been calculated based on the quarterly nominal volume data provided by the State Statistics Service of Ukraine.
1. Macroeconomic indicators
1.4. Government finances
(in millions of hryvnias)
revenues expenditureslending less
repayments
deficit (–),
surplus (+)
revenue of
the State
Budget
expenditures of
the State
Budget
deficit (–),
surplus (+)
of the State
Budget
revenues expenditureslending less
repayments
deficit (–),
surplus (+)
revenues of
the
Consolidated
Budget
expenditures
of the
Consolidated
Budget
deficit (–),
surplus (+)
of the
Consolidated
Budget
1 2 3 4 5 6 7 8 9 10 11 12 13 14 15
2005 105 330 112 976 300 –7 946 23.9 25.6 –1.8 134 183 141 699 291 –7 806 30.4 32.1 –1.8
2006 133 522 137 108 190 –3 777 24.5 25.2 –0.7 171 811 175 284 228 –3 701 31.6 32.2 –0.7
2007 165 939 174 254 1 528 –9 843 23.0 24.2 –1.4 219 937 226 054 1 584 –7 702 30.5 31.4 –1.1
2008 231 686 241 454 2 732 –12 501 24.4 25.5 –1.3 297 845 309 216 2 811 –14 183 31.4 32.6 –1.5
2009 209 700 242 437 2 780 –35 517 23.0 26.5 –3.9 272 967 307 399 2 826 –37 258 29.9 33.7 –4.1
2010 240 615 303 589 1 292 –64 266 22.2 28.0 –5.9 314 506 377 843 1 348 –64 685 29.1 34.9 –6.0
2011 314 617 333 460 4 715 –23 558 24.2 25.6 –1.8 398 554 416 854 4 758 –23 058 30.6 32.0 –1.8
2012 346 054 395 682 3 818 –53 445 24.5 28.0 –3.8 445 525 492 455 3 856 –50 786 31.6 34.9 –3.6
2013
January−February 54 493 56 648 180 –2 334 … … … 69 961 71 063 180 –1 283 … … …
January−March 83 789 87 857 455 –4 523 27.7 29.0 –1.5 106 896 112 103 476 –5 683 35.3 37.0 –1.9
January−April 106 118 121 707 556 –16 145 … … … 137 751 156 046 587 –18 883 … … …
January−May 135 340 153 829 –1 –18 487 … … … 175 385 197 059 38 –21 712 … … …
January−June 162 657 185 447 –49 –22 741 24.8 28.3 –3.5 211 082 239 136 -15 –28 039 32.2 36.5 –4.3
January−July 189 849 219 867 251 –30 270 … … … 247 378 281 312 293 –34 228 … … …
January−August 217 789 252 110 432 –34 753 … … … 284 596 318 746 476 –34 626 … … …
January−September 250 745 285 314 641 –35 209 23.9 27.2 –3.4 325 905 359 047 684 –33 826 31.0 34.2 –3.2
January−October 278 678 318 303 1 197 –40 822 … … … 362 520 398 368 1 245 –37 094 … … …
January−November 308 807 354 179 1 130 –46 502 … … … 402 224 441 881 1 179 –40 836 … … …
January−December 339 180 403 403 485 –64 708 23.3 27.7 –4.4 442 743 505 792 542 –63 591 30.4 34.8 –4.4
2014
January 25 299 26 895 11 –1 607 … … … 32 559 32 606 8 –55 … … …
January−February 52 343 57 722 -101 –5 279 … … … 68 170 70 686 -107 –2 408 … … …
Source: Information of the Ministry of Finance of Ukraine.
State Budget Consolidated Budget in % of GDP
Period
in % of GDP

1. Macroeconomic indicators
1.5. Balance of payments, external debt, official reserve assets, exchange rate
millions of
US dollarsin % to GDP
millions of
US dollarsin % to GDP
millions of
US dollarsin % to GDP
millions of
US dollarsin % to GDP
1 2 3 4 5 6 7 8 9 10 11
2005 2 531 2.9 44 378 51.4 43 707 50.6 39 619 45.9 19 391 505.00
2006 –1 617 –1.5 50 239 46.6 53 307 49.5 54 512 50.6 22 358 505.00
2007 –5 272 –3.7 64 001 44.8 72 153 50.6 79 955 56.0 32 479 505.00
2008 –12 763 –7.0 85 612 47.1 99 962 55.1 101 659 55.9 31 543 770.00
2009 –1 732 –1.5 54 253 46.3 56 206 48.0 103 396 88.3 26 505 798.50
2010 –3 018 –2.2 69 255 50.7 73 239 53.7 117 346 86.0 34 576 796.17
2011 –10 245 –6.3 88 844 53.8 99 001 59.9 126 236 77.3 31 795 798.98
2012
1 quarter –1 934 –5.3 20 836 56.7 23 285 63.4 126 884 75.7 31 127 798.67
2 quarter –3 680 –8.4 22 768 52.1 26 873 61.5 128 955 74.8 29 318 799.25
1 half year –5 614 –7.0 43 604 54.2 50 158 62.3 128 955 74.8 29 318 799.25
3 quarter –3 936 –8.1 23 640 48.7 26 771 55.2 132 447 75.9 29 255 799.30
9 months –9 550 –7.4 67 244 52.1 76 929 59.7 132 447 75.9 29 255 799.30
4 quarter –4 765 –10.1 22 791 48.1 27 432 57.9 135 065 76.6 24 546 799.30
year –14 315 –8.1 90 035 51.1 104 361 59.2 135 065 76.6 24 546 799.30
2013
1 quarter –3 134 –8.3 19 845 52.6 23 068 61.1 136 276 76.8 24 729 799.30
2 quarter –2 254 –5.1 20 732 47.1 22 892 52.0 134 370 75.5 23 245 799.30
1 half year –5 388 –6.6 40 577 49.6 45 960 56.2 134 370 75.5 23 245 799.30
3 quarter –6 025 –12.3 22 448 45.7 27 761 56.5 137 722 77.0 21 640 799.30
9 months –11 413 –8.7 63 025 48.2 73 721 56.3 137 722 77.0 21 640 799.30
4 quarter –4 942 –9.9 22 287 44.8 27 075 54.4 142 520 78.3 20 416 799.30year –16 355 –9.1 85 312 47.2 100 796 55.8 142 520 78.3 20 416 799.30
Official exchange rate
against the US dollar, at end
of period,
hryvnias per 100 US dollars
Period
Current account Export of goods and services Import of goods and servicesGross external debt,
by the end of period Official reserve assets,
at end of period,
millions of US dollars

2. National Bank of Ukraine monetary policy indicators
2.1. Interest rate on refinancing
2.2. Reserve requirements
2.3. Monetary base
2.4. Balance sheet of National Bank of Ukraine

2. National bank of Ukraine monetary policy indicators
2.1. Interest rate on refinancing
(average weighted annual rates, %)
credits
granted
through
tender
over-
night
credits
repo
trans-
actions
credits
granted for
support
of long-
term bank
liquidity
stabili-
zation
credits
swap
trans-
actions
refinancing
credits on
collateral of
property
rightson
deposits
placed with
the NBU
other
credits
credits
granted for
financing
the Euro
2012
Champion-
ship
other
short-
term
credits
other long-
term credits
under the
program of
financial
recovery
1 2 3 4 5 6 7 8 9 10 11 12 13 14
2005 9.5 14.7 12.9 14.9 12.0 – 15.0 – – – – – –
2006 8.5 11.5 10.4 12.1 10.7 – – 9.5 8.5 – – – –
2007 8.0 10.1 10.0 11.1 – – – – 8.3 – – – –
2008 12.0 15.3 16.6 16.0 13.8 – – 15.1 – 14.1 – – –
2009 10.25 16.7 20.6 18.1 21.6 – – 23.1 – 16.0 11.0 – –
2010 7.75 11.6 11.1 11.3 9.4 – – – – 11.9 11.0 – –
2011 7.75 12.4 12.5 9.4 12.6 – – – – – – – –
2012 7.5 8.1 7.7 8.8 7.9 – 9.5 – – – – – –
2013 6.5 7.2 6.8 7.6 6.9 – 8.9 – – – – – –
February 7.5 7.9 7.5 9.6 7.8 – – – – – – – –
March 7.5 8.4 7.5 10.2 7.5 – 9.5 – – – – – –
April 7.5 7.9 7.5 8.7 7.6 – – – – – – – –
May 7.5 7.8 7.5 8.7 7.6 – 9.5 – – – – – –
from 10.06 7.0 – – – – – – – – – – – –
June 7.0 7.1 7.1 10.0 7.0 – – – – – – – –
July 7.0 7.1 7.0 8.0 7.1 – – – – – – – –
from 13.08 6.5 – – – – – – – – – – – –
August 6.5 6.9 6.9 7.9 6.9 – – – – – – – –
September 6.5 6.6 6.5 7.5 6.5 – – – – – – – –
October 6.5 6.5 6.5 7.5 6.5 – – – – – – – –
November 6.5 6.8 6.5 7.5 6.6 – 8.5 – – – – – –
December 6.5 7.1 6.5 7.5 6.5 – 8.5 – – – – – –
2014
January 6.5 6.8 6.5 7.5 6.6 – 8.5 – – – – – –
February 6.5 10.4 14.6 7.5 6.5 – – – – – – 19.5 18.4
1 At end of period.
Period
NBU
dis-
count
rate 1
Average
weighted
interest
rate on all
instru-
ments
including

2. National bank of Ukraine monetary policy indicators
2.2. Reserve requirements
in national
currency
20.11.2003 – 30.09.2004 6 10 8
in national
currency
in national
currency
01.10.2004 – 24.12.2004 7 8
25.12.2004 – 31.08.2005 6 7
01.09.2005 – 09.05.2006 6 8
10.05.2006 – 31.07.2006 4 6
01.08.2006 – 30.09.2006 2 3
01.10.2006 – 04.12.2008 0.5 1
05.12.2008 – 04.01.2009 0 0
05.01.2009 – 31.01.2009 0 0
01.02.2009 – 30.06.2011 0 0
short-term long-term
01.07.2011-29.11.2011 0 6 2 0 0 2 -
30.11.2011-30.03.2012 0 7.5 2 0 0 2 -
31.03.2012-29.06.2012 0 8 2 0 0 2 0
30.06.2012-30.06.2013 0 9 3 0 0 3 0
short-term long-termnon-financial
corporations
house-
holds
01.07.2013-29.09.2013 0 10 5 0 10 15 0 5 0
since 30.09.2013 0 10 7 0 10 15 0 5 0
in national
currency
8.5
6
current accounts and demand deposits of non-
financial corporations and households
current accounts and demand deposits of non-
financial corporations and households
in foreign
currency
deposits of non-resident deposit-taking
corporations and non-resident other
financial corporations
-
-
10
5
5
in national
currency
in foreign
currency
5
7
7
8
8
time deposits of non-financial
corporations and households
in national
currency
in foreign currency
in national
currency
in foreign
currency
(except
Russian
ruble)
in foreign
currencyin national
currency
current accounts and demand deposits of non-
financial corporations and households
deposits of non-resident deposit-taking
corporations and non-resident other
financial corporations
in
Russian
ruble
2
-
-
-
-
-
-
in
Russian
ruble
in foreign
currency
(except
Russian
ruble)
current accounts and demand deposits
of non-financial corporations and
households
6
3
4
7 8
7
8
4
6
3
4
time deposits of non-financial
corporations and households
in foreign currency
Reserve requirements, %
in foreign currency
deposits of non-resident deposit-taking
corporations and non-resident other
financial corporations
8 12
long-term deposits of non-
financial corporations
and households in foreign
currency
in national
currency
in foreign currency
Validity
short-term
deposits of non-
financial
corporations in
national currency
short-term
deposits of non-
financial
corporations and
households in
foreign currency
short-term deposits of
households in
national currency
2
time deposits of non-financial
corporations and households
4
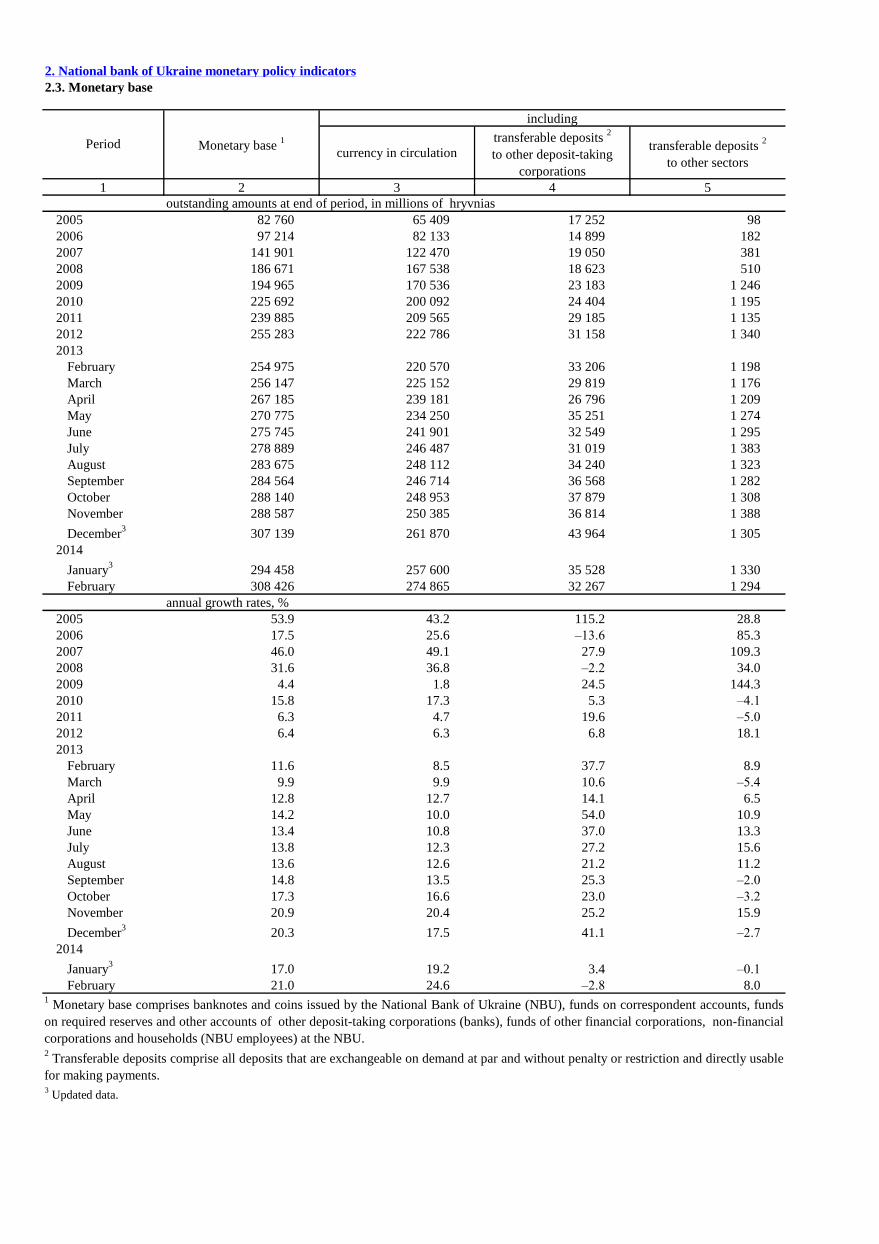
2. National bank of Ukraine monetary policy indicators
2.3. Monetary base
currency in circulation
transferable deposits 2
to other deposit-taking
corporations
transferable deposits 2
to other sectors
1 2 3 4 5
2005 82 760 65 409 17 252 98
2006 97 214 82 133 14 899 182
2007 141 901 122 470 19 050 381
2008 186 671 167 538 18 623 510
2009 194 965 170 536 23 183 1 246
2010 225 692 200 092 24 404 1 195
2011 239 885 209 565 29 185 1 135
2012 255 283 222 786 31 158 1 340
2013
February 254 975 220 570 33 206 1 198
March 256 147 225 152 29 819 1 176
April 267 185 239 181 26 796 1 209
May 270 775 234 250 35 251 1 274
June 275 745 241 901 32 549 1 295
July 278 889 246 487 31 019 1 383
August 283 675 248 112 34 240 1 323
September 284 564 246 714 36 568 1 282
October 288 140 248 953 37 879 1 308
November 288 587 250 385 36 814 1 388
December3
307 139 261 870 43 964 1 305
2014
January3
294 458 257 600 35 528 1 330
February 308 426 274 865 32 267 1 294
annual growth rates, %
2005 53.9 43.2 115.2 28.8
2006 17.5 25.6 –13.6 85.3
2007 46.0 49.1 27.9 109.3
2008 31.6 36.8 –2.2 34.0
2009 4.4 1.8 24.5 144.3
2010 15.8 17.3 5.3 –4.1
2011 6.3 4.7 19.6 –5.0
2012 6.4 6.3 6.8 18.1
2013
February 11.6 8.5 37.7 8.9
March 9.9 9.9 10.6 –5.4
April 12.8 12.7 14.1 6.5
May 14.2 10.0 54.0 10.9
June 13.4 10.8 37.0 13.3
July 13.8 12.3 27.2 15.6
August 13.6 12.6 21.2 11.2
September 14.8 13.5 25.3 –2.0
October 17.3 16.6 23.0 –3.2
November 20.9 20.4 25.2 15.9
December3
20.3 17.5 41.1 –2.7
2014
January3
17.0 19.2 3.4 –0.1
February 21.0 24.6 –2.8 8.0
3 Updated data.
2Transferable deposits comprise all deposits that are exchangeable on demand at par and without penalty or restriction and directly usable
for making payments.
1Monetary base comprises banknotes and coins issued by the National Bank of Ukraine (NBU), funds on correspondent accounts, funds
on required reserves and other accounts of other deposit-taking corporations (banks), funds of other financial corporations, non-financial
corporations and households (NBU employees) at the NBU.
Monetary base 1
including
Period
outstanding amounts at end of period, in millions of hryvnias

2. National bank of Ukraine monetary policy indicators
2.4. Balance sheet of National Bank of Ukraine 1
(outstanding amounts at end of period, in millions of hryvnias)
1. Assets
PeriodMonetary gold
and SDRs
Currency and
deposits
Securities other
than sharesLoans
Shares and
other equity
Financial
derivatives
Other accounts
receivable
Nonfinancial
assetsTotal
1 2 3 4 5 6 7 8 9 10
2005 1 398 78 735 20 578 10 410 145 – 10 521 3 213 124 999
2006 1 814 70 717 43 477 10 856 145 – 10 764 3 464 141 237
2007 2 489 87 754 77 710 10 787 150 – 11 034 8 409 198 333
2008 4 144 115 327 135 888 72 632 187 – 20 159 7 790 356 128
2009 5 942 98 020 165 352 91 332 217 – 18 144 9 249 388 257
2010 7 254 122 401 206 362 78 650 217 – 31 604 10 233 456 721
2011 8 202 101 454 225 187 78 222 234 – 29 152 10 965 453 416
2012 9 252 60 562 233 830 82 520 400 – 31 261 12 284 430 108
2013
February 9 071 59 874 249 303 73 764 399 – 18 203 12 281 422 895
March 9 036 60 057 252 906 70 722 399 – 21 019 12 352 426 492
April 8 788 60 521 261 004 72 246 399 – 20 346 12 311 435 615
May 8 069 56 140 261 821 73 567 483 – 17 025 12 298 429 403
June 7 067 47 999 264 780 73 358 483 – 17 256 12 182 423 125
July 7 922 40 771 272 458 74 023 483 – 20 585 12 316 428 558
August 9 020 31 501 276 851 71 933 483 – 22 193 11 609 423 590
September 8 529 38 310 274 294 70 237 483 – 17 663 11 611 421 128
October 8 894 32 339 271 994 71 762 483 – 21 991 11 752 419 216
November 8 060 35 748 255 234 77 551 553 – 20 948 11 726 409 820
December 8 021 58 148 254 593 82 808 554 – 17 759 11 757 433 639
2014
January 8 463 41 483 252 287 81 238 554 – 24 923 11 749 420 696
February 11 052 35 898 282 540 93 863 560 – 37 214 11 976 473 102
2. Liabilities
PeriodCurrency in
circulationDeposits
Securities other
than sharesLoans
Financial
derivatives
Other accounts
payableSDR Allocations
Shares and
other equityTotal
1 2 3 4 5 6 7 8 9 10
2005 65 409 52 374 2 427 335 – 1 090 – 3 364 124 999
2006 82 133 48 982 180 255 – 1 378 – 8 309 141 237
2007 122 470 48 308 3 117 156 – 2 186 – 22 096 198 333
2008 167 538 85 039 2 809 124 – 2 713 97 905 356 128
2009 170 536 91 944 3 421 59 – 16 271 1 020 105 005 388 257
2010 200 092 124 999 9 441 – – 17 187 999 104 002 456 721
2011 209 565 120 787 5 529 – – 17 699 999 98 838 453 416
2012 222 786 91 904 334 – – 17 156 1 001 96 928 430 108
2013
February 220 570 95 724 3 806 – – 17 131 986 84 678 422 895
March 225 152 92 731 4 784 – – 16 956 976 85 892 426 492
April 239 181 91 468 3 803 – – 28 986 982 71 195 435 615
May 234 250 91 662 5 697 – – 26 968 976 69 852 429 403
June 241 901 82 232 5 645 – – 23 750 979 68 618 423 125
July 246 487 81 865 6 476 – – 20 827 985 71 918 428 558
August 248 112 79 756 2 717 – – 25 053 986 66 966 423 590
September 246 714 81 647 1 852 – – 19 991 999 69 924 421 128
October 248 953 78 155 2 193 – – 16 902 1 001 72 011 419 216
November 250 385 72 551 702 – – 16 861 999 68 322 409 820
December 261 870 82 893 3 126 – – 16 622 1 006 68 122 433 639
2014
January 257 600 74 607 1 061 – – 16 662 999 69 767 420 696
February 274 865 72 624 3 423 – – 16 990 1 259 103 942 473 102
1 In accordance with data of sectoral balance sheet of the National Bank of Ukraine, which accords with the methodology of IMF.

3. Monetary statistics
3.1. Surveys of financial corporations
3.1.1. National Bank of Ukraine survey
3.1.2. Sectoral Balance Sheet for Deposit-taking corporations (excluding National Bank of Ukraine)
3.1.3. Deposit-taking corporations survey (excluding National Bank of Ukraine)
3.1.4. Deposit-taking corporations survey (including National Bank of Ukraine)
3.1.5. Monetary aggregates and counterparts
3.1.6. Components of monetary aggregates
3.1.7. Domestic credit
3.1.8. Net foreign assets
3.1.9. Official reserve assets
3.1.10. Sectoral balance sheet for other financial corporations
3.1.11. Other financial corporations survey
3.1.12. Financial corporations survey

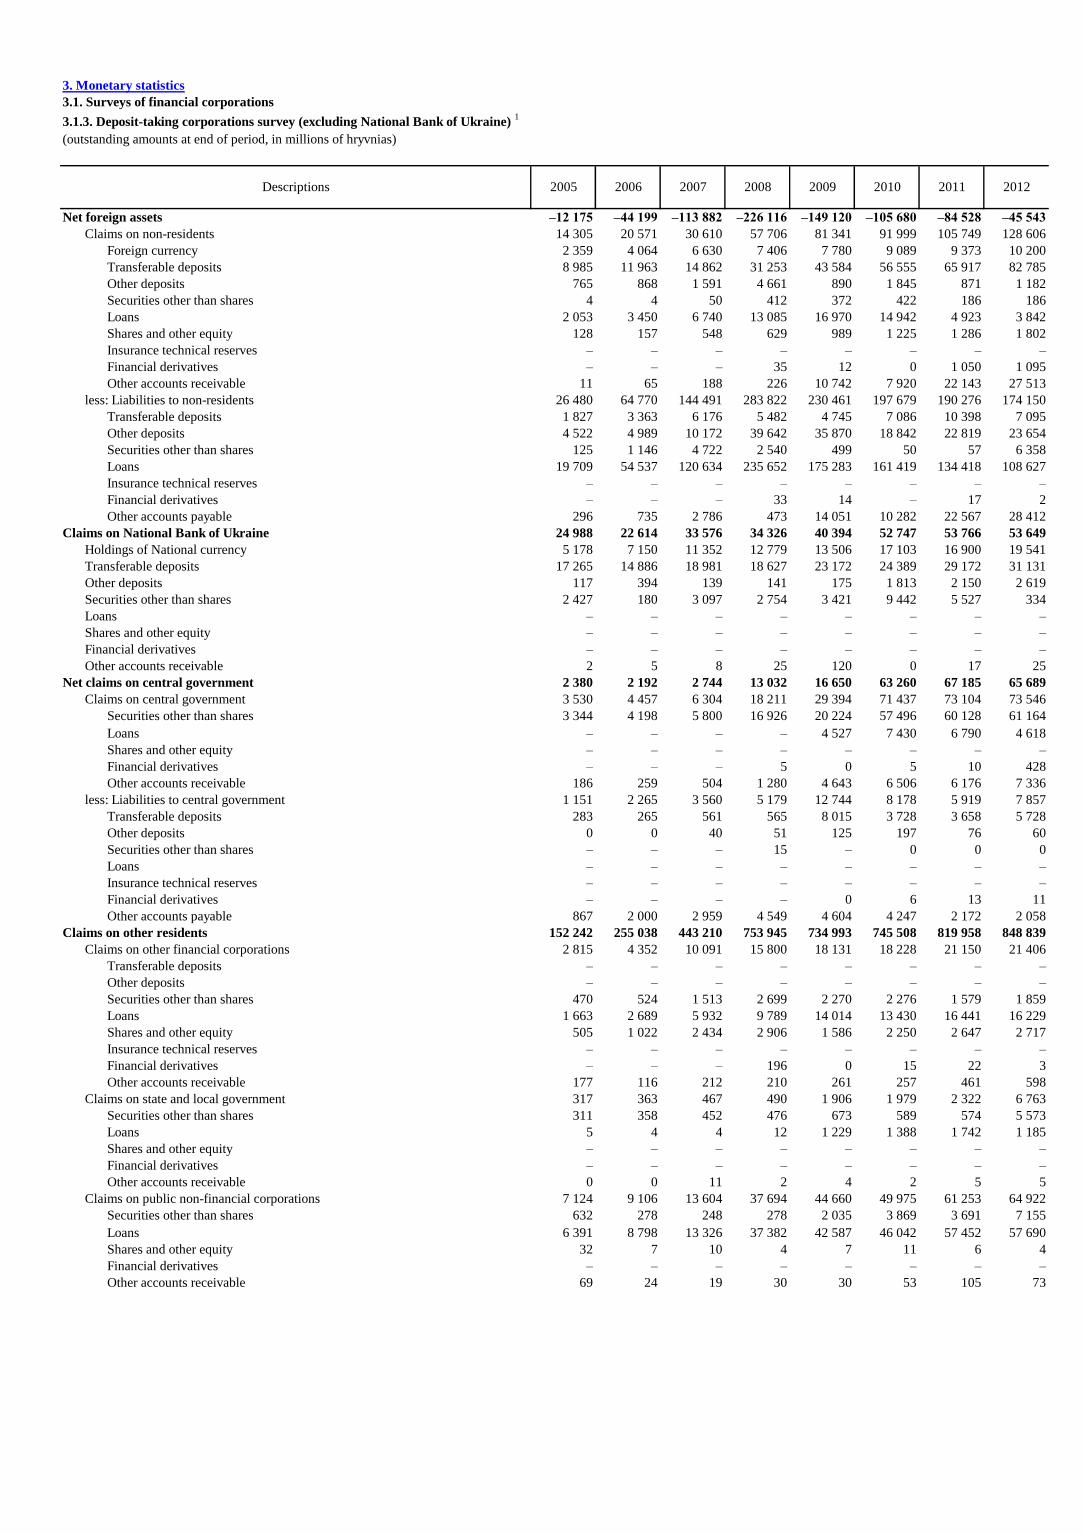
3. Monetary statistics
3.1. Surveys of financial corporations
3.1.1. National Bank of Ukraine survey 1
(outstanding amounts at end of period, in millions of hryvnias)
Net foreign assets 94 000 111 240 165 325 209 994 165 627 221 411 199 286 160 404
Claims on non-residents 110 296 126 167 178 641 262 798 232 568 298 194 276 144 216 269
Monetary gold and SDR holdings 1 398 1 814 2 489 4 144 5 942 7 254 8 202 9 252
Foreign currency 73 75 76 90 87 80 591 597
Transferable deposits 1 825 806 554 17 716 10 232 3 187 12 791 6 370
Other deposits 76 837 69 837 87 123 97 521 87 701 119 133 88 070 53 588
Securities other than shares 20 139 43 065 77 315 126 861 111 206 151 487 149 210 129 264
Loans – – – – – – – –
Shares and other equity 121 121 121 121 121 121 121 121
Insurance technical reserves – – – – – – – –
Financial derivatives – – – – – – – –
Other accounts receivable 9 903 10 448 10 962 16 344 17 279 16 931 17 160 17 077
less: Liabilities to non-residents 16 296 14 927 13 316 52 803 66 941 76 782 76 858 55 866
Transferable deposits 15 960 14 657 13 147 52 650 65 805 75 770 75 855 54 855
Other deposits – – – – – – – –
Securities other than shares – – – – – – – –
Loans 335 255 156 124 59 – – –
Financial derivatives – – – – – – – –
Other accounts payable 2 15 14 30 57 14 4 10
SDR Allocations – – – – 1 020 999 999 1 001
Claims on other deposit-taking corporations 895 1 580 1 876 61 162 87 515 74 937 74 654 79 187
Transferable deposits 0 – – – – – 1 1
Other deposits – 0 0 0 0 1 1 6
Securities other than shares – – – – – – – –
Loans 892 1 570 1 866 61 132 87 499 74 923 74 625 79 004
Shares and other equity – – – – – – 10 176
Insurance technical reserves – – – – – – – –
Financial derivatives – – – – – – – –
Other accounts receivable 3 10 10 30 16 14 16 1
Net claims on central government2
–8 149 –8 949 –6 274 10 754 55 619 49 956 77 428 115 866
Claims on central government 10 315 9 676 9 058 23 674 57 011 71 526 89 650 117 165
Securities other than shares 439 411 395 9 027 52 947 53 667 74 577 100 119
Loans 9 294 9 042 8 660 11 145 3 439 3 306 3 174 3 042
Shares and other equity – – – – – – – –
Financial derivatives – – – – – – – –
Other accounts receivable 582 223 3 3 502 626 14 552 11 899 14 005
less: Liabilities to central government2
18 464 18 625 15 332 12 920 1 392 21 570 12 222 1 299
Transferable deposits2
18 462 18 624 15 328 12 917 1 390 21 567 12 218 1 280
Other deposits – – – – – – – –
Securities other than shares – – – – – – – –
Loans – – – – – – – –
Financial derivatives – – – – – – – –
Other accounts payable 2 1 4 3 3 2 4 19
Claims on other residents 279 350 347 701 1 912 1 822 1 999 5 199
Claims on other financial corporations 24 44 46 108 1 332 1 308 1 510 4 550
Transferable deposits – – – – – – – –
Other deposits – – – – – – – –
Securities other than shares – – – – 1 200 1 207 1 400 4 447
Loans – – – – – – – –
Shares and other equity 24 24 29 66 96 96 103 103
Insurance technical reserves – – – – – – – –
Financial derivatives – – – – – – – –
Other accounts receivable 0 21 17 42 36 5 6 0
Claims on state and local government 0 0 0 0 1 0 1 1
Securities other than shares – – – – – – – –
Loans – – – – – – – –
Shares and other equity – – – – – – – –
Financial derivatives – – – – – – – –
Other accounts receivable 0 0 0 0 1 0 1 1
Claims on public non-financial corporations 108 123 101 161 170 169 171 219
Securities other than shares – – – – – – – –
Loans 101 102 100 157 167 167 167 167
Shares and other equity – – – – – – – –
Financial derivatives – – – – – – – –
Other accounts receivable 7 21 2 4 3 3 4 52
201120102007 2008 20122009Descriptions 2005 2006

201120102007 2008 20122009Descriptions 2005 2006
Claims on other non-financial corporations 80 93 88 271 210 111 82 139
Securities other than shares – – – – – – – –
Loans 57 53 50 38 30 22 22 22
Shares and other equity – – – – – – – –
Financial derivatives – – – – – – – –
Other accounts receivable 23 40 39 233 179 89 61 117
Claims on other resident sectors 67 90 112 163 199 233 236 289
Securities other than shares – – – – – – – –
Loans 67 90 111 161 197 232 234 286
Financial derivatives – – – – – – – –
Other accounts receivable 0 0 0 2 2 1 2 3
Monetary base (reserve money)2
82 760 97 214 141 901 186 671 194 965 225 692 239 885 255 283
Currency in circulation 65 409 82 133 122 470 167 538 170 536 200 092 209 565 222 786
Liabilities to other deposit-taking corporations excluded from
monetary aggregate M3 (broad money) 17 252 14 899 19 050 18 623 23 183 24 404 29 185 31 158
Transferable deposits 17 252 14 899 19 050 18 623 23 183 24 404 29 185 31 158
Other deposits – – – – – – – –
Securities other than shares – – – – – – – –
Liabilities to other resident sectors included in monetary aggregate
M32
98 182 381 510 1 246 1 195 1 135 1 340
Liabilities to other deposit-taking corporations excluded from
monetary base 2 958 788 3 486 3 095 3 622 11 367 7 784 3 477
Deposits excluded from monetary base 71 14 35 55 130 139 139 128
Deposits included in monetary aggregate M3 71 13 35 54 130 138 139 128
Deposits excluded from monetary aggregate M3 0 0 0 1 0 0 0 0
Securities other than shares excluded from monetary base – – – – – – – –
Securities other than shares included in monetary
aggregate M3 – – – – – – – –
Securities other than shares excluded from monetary
aggregate M3 – – – – – – – –
Loans – – – – – – – –
Financial derivatives – – – – – – – –
Shares and other equity 3 364 8 309 22 096 97 905 105 005 104 002 98 838 96 928
Other items (net) –2 127 –2 104 –6 244 –5 114 6 951 6 927 6 722 4 838
1National Bank of Ukraine survey – analytical form of presenting
National Bank of Ukraine statistical data that are consolidated into the
generalized categories of assets and liabilities. The survey comprises
data on National Bank of Ukraine liabilities that are included to the
monetary base and underlie the monetary aggregates.
National Bank of Ukraine survey is based on sectoral balanse sheet for
the National Bank of Ukraine, which accords with the methodology of
IMF.
2 Updated data for December 2013 and January 2014.

3. Monetary statistics
3.1. Surveys of financial corporations
3.1.1. National Bank of Ukraine survey 1
(outstanding amounts at end of period, in millions of hryvnias)
Net foreign assets
Claims on non-residents
Monetary gold and SDR holdings
Foreign currency
Transferable deposits
Other deposits
Securities other than shares
Loans
Shares and other equity
Insurance technical reserves
Financial derivatives
Other accounts receivable
less: Liabilities to non-residents
Transferable deposits
Other deposits
Securities other than shares
Loans
Financial derivatives
Other accounts payable
SDR Allocations
Claims on other deposit-taking corporations
Transferable deposits
Other deposits
Securities other than shares
Loans
Shares and other equity
Insurance technical reserves
Financial derivatives
Other accounts receivable
Net claims on central government2
Claims on central government
Securities other than shares
Loans
Shares and other equity
Financial derivatives
Other accounts receivable
less: Liabilities to central government2
Transferable deposits2
Other deposits
Securities other than shares
Loans
Financial derivatives
Other accounts payable
Claims on other residents
Claims on other financial corporations
Transferable deposits
Other deposits
Securities other than shares
Loans
Shares and other equity
Insurance technical reserves
Financial derivatives
Other accounts receivable
Claims on state and local government
Securities other than shares
Loans
Shares and other equity
Financial derivatives
Other accounts receivable
Claims on public non-financial corporations
Securities other than shares
Loans
Shares and other equity
Financial derivatives
Other accounts receivable
DescriptionsFebruary March April May June July
167 281 167 834 171 815 172 457 162 309 157 703
216 297 216 405 220 775 215 162 205 187 200 884
9 071 9 036 8 788 8 069 7 067 7 922
595 591 594 592 592 595
6 445 7 177 4 742 6 133 6 243 4 225
52 832 52 286 55 183 49 414 41 162 35 948
130 196 130 329 134 374 133 974 132 920 134 906
– – – – – –
121 121 121 121 121 121
– – – – – –
– – – – – –
17 037 16 865 16 973 16 859 17 081 17 166
49 016 48 572 48 960 42 705 42 878 43 182
48 018 47 580 47 946 41 698 41 875 42 179
– – – – – –
– – – – – –
– – – – – –
– – – – – –
12 16 32 31 24 18
986 976 982 976 979 985
70 396 67 404 68 905 70 294 70 141 70 782
1 2 2 2 2 2
1 0 0 0 0 0
– – – – – –
70 216 67 224 68 725 70 032 69 877 70 520
176 176 176 260 260 260
– – – – – –
– – – – – –
2 1 1 1 2 1
107 198 113 100 103 220 105 240 120 513 130 534
118 635 125 135 128 349 126 333 130 386 139 247
114 568 118 125 122 123 123 298 127 410 133 044
3 066 3 009 3 021 3 034 2 976 2 988
– – – – – –
– – – – – –
1 001 4 001 3 205 1 1 3 214
11 437 12 034 25 130 21 093 9 874 8 713
11 435 12 029 13 127 11 090 3 935 4 769
– – – – – –
– – – – – –
– – – – – –
– – – – – –
2 5 12 003 10 003 5 939 3 944
5 281 5 190 5 270 5 311 5 225 5 323
4 641 4 553 4 609 4 652 4 552 4 609
– – – – – –
– – – – – –
4 539 4 452 4 507 4 549 4 450 4 507
– – – – – –
102 102 102 102 102 102
– – – – – –
– – – – – –
0 0 0 1 0 0
1 2 2 1 1 2
– – – – – –
– – – – – –
– – – – – –
– – – – – –
1 2 2 1 1 2
224 217 219 219 218 218
– – – – – –
167 167 167 167 166 166
– – – – – –
– – – – – –
57 49 52 52 52 52
2013

Descriptions
Claims on other non-financial corporations
Securities other than shares
Loans
Shares and other equity
Financial derivatives
Other accounts receivable
Claims on other resident sectors
Securities other than shares
Loans
Financial derivatives
Other accounts receivable
Monetary base (reserve money)2
Currency in circulation
Liabilities to other deposit-taking corporations excluded from
monetary aggregate M3 (broad money)
Transferable deposits
Other deposits
Securities other than shares
Liabilities to other resident sectors included in monetary aggregate
M32
Liabilities to other deposit-taking corporations excluded from
monetary base
Deposits excluded from monetary base
Deposits included in monetary aggregate M3
Deposits excluded from monetary aggregate M3
Securities other than shares excluded from monetary base
Securities other than shares included in monetary
aggregate M3
Securities other than shares excluded from monetary
aggregate M3
Loans
Financial derivatives
Shares and other equity
Other items (net)
1National Bank of Ukraine survey – analytical form of presenting
National Bank of Ukraine statistical data that are consolidated into the
generalized categories of assets and liabilities. The survey comprises
data on National Bank of Ukraine liabilities that are included to the
monetary base and underlie the monetary aggregates.
National Bank of Ukraine survey is based on sectoral balanse sheet for
the National Bank of Ukraine, which accords with the methodology of
IMF.
2 Updated data for December 2013 and January 2014.
February March April May June July
2013
117 114 125 123 131 162
– – – – – –
22 22 22 22 22 22
– – – – – –
– – – – – –
95 93 103 102 109 141
297 304 316 317 323 332
– – – – – –
293 300 311 312 318 328
– – – – – –
5 4 5 5 5 4
254 975 256 147 267 185 270 775 275 745 278 889
220 570 225 152 239 181 234 250 241 901 246 487
33 206 29 819 26 796 35 251 32 549 31 019
33 206 29 819 26 796 35 251 32 549 31 019
– – – – – –
– – – – – –
1 198 1 176 1 209 1 274 1 295 1 383
5 516 6 759 6 000 7 904 8 932 8 849
156 152 195 142 138 144
156 152 195 142 138 144
0 0 0 0 0 0
– – – – – –
– – – – – –
– – – – – –
– – – – – –
– – – – – –
84 678 85 892 71 195 69 852 68 618 71 918
4 830 4 578 4 634 4 630 4 754 4 543

3. Monetary statistics
3.1. Surveys of financial corporations
3.1.1. National Bank of Ukraine survey 1
(outstanding amounts at end of period, in millions of hryvnias)
Net foreign assets
Claims on non-residents
Monetary gold and SDR holdings
Foreign currency
Transferable deposits
Other deposits
Securities other than shares
Loans
Shares and other equity
Insurance technical reserves
Financial derivatives
Other accounts receivable
less: Liabilities to non-residents
Transferable deposits
Other deposits
Securities other than shares
Loans
Financial derivatives
Other accounts payable
SDR Allocations
Claims on other deposit-taking corporations
Transferable deposits
Other deposits
Securities other than shares
Loans
Shares and other equity
Insurance technical reserves
Financial derivatives
Other accounts receivable
Net claims on central government2
Claims on central government
Securities other than shares
Loans
Shares and other equity
Financial derivatives
Other accounts receivable
less: Liabilities to central government2
Transferable deposits2
Other deposits
Securities other than shares
Loans
Financial derivatives
Other accounts payable
Claims on other residents
Claims on other financial corporations
Transferable deposits
Other deposits
Securities other than shares
Loans
Shares and other equity
Insurance technical reserves
Financial derivatives
Other accounts receivable
Claims on state and local government
Securities other than shares
Loans
Shares and other equity
Financial derivatives
Other accounts receivable
Claims on public non-financial corporations
Securities other than shares
Loans
Shares and other equity
Financial derivatives
Other accounts receivable
DescriptionsAugust September October November December January February
155 262 154 858 147 730 139 739 153 111 133 245 140 377
192 540 192 688 184 775 170 701 184 271 163 311 176 544
9 020 8 529 8 894 8 060 8 021 8 463 11 052
594 597 599 596 598 594 744
5 577 6 264 1 460 6 932 16 102 6 662 6 163
25 328 31 448 30 279 28 218 41 426 34 209 28 980
134 709 128 335 125 986 109 369 100 459 95 837 107 682
– – – – – – –
121 121 121 121 121 121 121
– – – – – – –
– – – – – – –
17 191 17 394 17 436 17 405 17 544 17 425 21 801
37 279 37 830 37 045 30 963 31 160 30 066 36 166
36 280 36 786 36 021 29 928 30 137 29 055 34 888
– – – – – – –
– – – – – – –
– – – – – – –
– – – – – – –
12 45 23 35 18 13 20
986 999 1 001 999 1 006 999 1 259
68 677 67 040 68 549 74 434 80 579 78 994 91 598
2 2 1 2 2 2 2
0 0 0 0 20 16 8
– – – – – – –
68 414 66 775 68 285 74 059 80 176 78 587 91 194
260 260 260 366 366 366 369
– – – – – – –
– – – – – – –
1 4 3 7 15 24 24
130 480 135 541 146 619 144 632 145 350 153 967 181 561
143 775 142 892 147 189 145 991 149 131 158 839 185 494
136 042 139 948 139 930 139 763 146 863 149 262 167 986
3 001 2 943 2 955 2 967 2 268 2 284 2 298
– – – – – – –
– – – – – – –
4 732 2 4 305 3 261 1 7 293 15 210
13 295 7 351 571 1 359 3 781 4 872 3 933
5 230 4 285 559 1 346 3 773 4 870 3 931
– – – – – – –
– – – – – – –
– – – – – – –
– – – – – – –
8 065 3 066 12 13 7 2 1
6 984 6 891 6 946 6 963 7 900 7 803 7 490
6 202 6 114 6 181 6 168 7 338 7 254 6 942
– – – – – – –
– – – – – – –
6 100 6 012 6 079 6 102 7 271 7 187 6 872
– – – – – – –
102 102 102 66 66 66 70
– – – – – – –
– – – – – – –
0 0 0 0 0 0 0
2 2 3 3 1 1 3
– – – – – – –
– – – – – – –
– – – – – – –
– – – – – – –
2 2 3 3 1 1 3
277 275 277 323 80 69 70
– – – – – – –
166 166 166 166 – – –
– – – – – – –
– – – – – – –
112 109 112 157 80 69 70
20142013

Descriptions
Claims on other non-financial corporations
Securities other than shares
Loans
Shares and other equity
Financial derivatives
Other accounts receivable
Claims on other resident sectors
Securities other than shares
Loans
Financial derivatives
Other accounts receivable
Monetary base (reserve money)2
Currency in circulation
Liabilities to other deposit-taking corporations excluded from
monetary aggregate M3 (broad money)
Transferable deposits
Other deposits
Securities other than shares
Liabilities to other resident sectors included in monetary aggregate
M32
Liabilities to other deposit-taking corporations excluded from
monetary base
Deposits excluded from monetary base
Deposits included in monetary aggregate M3
Deposits excluded from monetary aggregate M3
Securities other than shares excluded from monetary base
Securities other than shares included in monetary
aggregate M3
Securities other than shares excluded from monetary
aggregate M3
Loans
Financial derivatives
Shares and other equity
Other items (net)
1National Bank of Ukraine survey – analytical form of presenting
National Bank of Ukraine statistical data that are consolidated into the
generalized categories of assets and liabilities. The survey comprises
data on National Bank of Ukraine liabilities that are included to the
monetary base and underlie the monetary aggregates.
National Bank of Ukraine survey is based on sectoral balanse sheet for
the National Bank of Ukraine, which accords with the methodology of
IMF.
2 Updated data for December 2013 and January 2014.
August September October November December January February
20142013
167 163 143 126 135 129 123
– – – – – – –
22 22 22 22 22 22 22
– – – – – – –
– – – – – – –
146 141 122 104 113 107 101
335 337 340 343 346 349 353
– – – – – – –
330 332 335 338 343 345 348
– – – – – – –
4 5 5 5 3 4 4
–
283 675 284 564 288 140 288 587 307 218 294 636 308 426
248 112 246 714 248 953 250 385 261 870 257 600 274 865
34 240 36 568 37 879 36 814 43 964 35 528 32 267
34 240 36 568 37 879 36 814 43 964 35 528 32 267
– – – – – – –
– – – – – – –
1 323 1 282 1 308 1 388 1 384 1 508 1 294
5 257 4 432 4 431 3 642 6 631 4 579 3 534
144 147 152 135 131 129 133
144 147 152 135 131 129 133
0 0 0 0 0 – 0
– – – – – – –
– – – – – – –
– – – – – – –
– – – – – – –
– – – – – – –
66 966 69 924 72 011 68 322 68 122 69 767 103 942
5 361 5 264 5 110 5 082 4 838 4 898 4 992

3. Monetary statistics
3.1. Surveys of financial corporations
3.1.2. Sectoral balance sheet for deposit-taking corporations (excluding National Bank of Ukraine)
1. Assets
A 1 2 3 4 4.1 4.2 4.3 4.4 4.5 4.6 4.7 4.8 4.9 5 6 7 8 9 10
outstanding amounts at end of period, in millions of hryvnias
2008 20 185 75 200 34 309 776 815 – 29 708 9 789 – 12 37 382 406 283 280 556 13 085 6 575 – 453 5 969 49 757 969 263
2009 21 287 87 840 35 426 760 845 – 20 580 14 014 4 527 1 229 42 587 419 627 241 311 16 970 4 640 – 35 33 121 58 728 1 001 922
2010 26 191 107 027 79 871 774 242 – 26 477 13 430 7 430 1 388 46 042 454 919 209 615 14 942 5 440 – 451 29 125 65 332 1 087 681
2011 26 273 126 763 84 021 847 075 – 40 343 16 441 6 790 1 742 57 452 518 093 201 291 4 923 5 984 – 1 759 49 634 73 293 1 214 803
2012 29 741 143 169 91 710 842 838 – 23 854 16 229 4 618 1 185 57 690 547 735 187 685 3 842 6 948 – 2 122 74 274 78 861 1 269 663
2013
February 29 112 127 750 110 380 845 592 – 15 456 17 410 4 617 947 55 296 557 345 188 265 6 257 6 923 – 2 059 78 357 79 439 1 279 613
March 28 156 131 632 118 810 847 453 – 16 036 19 379 4 620 960 53 903 559 283 188 450 4 821 7 037 – 2 155 74 163 79 495 1 288 901
April 33 697 130 924 122 401 849 872 – 16 395 17 811 4 626 902 55 288 561 540 190 111 3 200 7 130 – 2 150 76 518 80 070 1 302 761
May 28 637 135 164 129 986 849 523 – 15 996 17 671 4 621 901 53 720 562 562 190 880 3 174 7 054 – 2 161 79 229 80 749 1 312 504
June 30 860 134 819 131 146 857 297 – 16 666 19 105 4 618 899 52 937 570 161 190 041 2 870 7 115 – 2 110 89 400 82 098 1 334 846
July 31 316 132 716 134 671 868 181 – 18 970 17 215 4 620 907 52 705 575 483 190 870 7 413 7 050 – 2 076 87 251 82 638 1 345 899
August 31 450 143 336 127 600 869 879 – 15 450 17 412 4 623 905 52 976 582 271 193 060 3 182 7 099 – 2 090 89 172 83 182 1 353 809
September 31 229 143 186 123 548 885 497 – 18 177 18 341 4 419 908 54 274 593 000 193 363 3 016 7 181 – 2 201 95 163 83 762 1 371 766
October 30 355 140 955 123 195 892 492 – 17 680 17 727 4 059 913 53 700 601 589 194 320 2 504 6 995 – 2 180 102 182 84 657 1 383 012
November 30 917 132 201 123 640 914 221 – 18 913 19 548 4 707 914 55 729 613 892 192 821 7 697 7 189 – 2 220 107 302 85 295 1 402 985
December 35 847 141 142 133 544 931 941 – 18 771 19 317 4 998 910 50 472 641 431 193 654 2 388 7 411 – 2 502 73 572 86 103 1 412 061
2014
January 34 599 135 272 129 639 934 155 – 22 715 20 800 4 879 981 51 251 632 943 192 604 7 981 7 380 – 1 767 27 017 86 570 1 356 400
February 36 504 126 131 140 315 1 008 002 – 17 987 21 527 4 805 908 55 997 684 097 208 750 13 931 8 280 – 4 711 23 601 87 150 1 434 694
transactions1 during the period, in millions of hryvnias
2008 –302 10 889 11 763 126 220 – –25 708 2 699 – 8 21 786 77 363 48 164 1 908 –11 – – 1 934 13 030 163 522
2009 758 10 112 2 236 –31 668 – –9 517 4 145 4 527 1 217 5 010 6 169 –46 005 2 786 –1 545 – – 26 942 8 856 15 690
2010 5 198 20 437 42 690 16 783 – 6 088 –566 2 903 159 3 606 37 491 –31 168 –1 731 799 – – –2 763 6 464 89 607
2011 176 19 914 4 280 72 418 – 13 983 2 991 –639 354 11 418 63 375 –8 809 –10 255 344 – – 21 262 7 945 126 339
2012 3 332 15 806 8 145 –5 009 – –16 480 –217 –2 172 –557 213 28 843 –13 749 –890 849 – – 23 806 5 510 52 439
2013 6 027 –2 262 40 618 87 823 – –5 158 3 076 380 –275 –7 223 92 697 5 838 –1 511 103 – – –2 034 7 457 137 732
February 478 –9 782 6 874 7 062 – –397 256 –1 –15 –1 646 8 359 34 472 65 – – –3 166 542 2 073
March –905 4 251 8 518 2 694 – 611 1 975 3 13 –1 378 2 599 270 –1 399 86 – – –3 573 60 11 131
April 5 494 –1 015 3 405 1 658 – 332 –1 573 6 –58 1 376 1 642 1 586 –1 653 –34 – – 1 758 636 11 903
May –5 021 4 499 7 988 171 – –377 –137 –5 –2 –1 558 1 425 841 –16 –109 – – 3 113 710 11 350
June 2 230 –147 895 7 693 – 664 1 433 –2 –2 –771 7 568 –888 –307 68 – – 10 093 1 432 22 265
July 414 –2 472 3 678 10 206 – 2 269 –1 894 1 8 –242 4 779 769 4 515 –57 – – –2 763 499 9 505
August 144 10 636 –7 089 1 768 – –3 518 197 3 –1 275 6 849 2 191 –4 229 39 – – 1 937 502 7 936
September –294 –504 –4 439 14 815 – 2 690 924 –204 2 1 276 10 091 227 –191 55 – – 5 289 621 15 543
October –911 –2 501 –491 6 430 – –522 –618 –359 5 –587 8 121 914 –525 –184 – – 6 414 881 9 637
November 606 –8 427 205 22 251 – 1 254 1 824 648 1 2 047 12 744 –1 459 5 192 –36 – – 5 619 693 20 911
December 4 880 8 691 9 926 17 094 – –164 –236 291 –4 –5 272 27 035 768 –5 323 342 – – –34 262 823 7 493
2014
January –1 147 –5 438 –4 128 3 112 – 3 982 1 488 –119 71 810 –7 758 –993 5 629 –20 – – –46 203 450 –53 374
February –1 126 –26 336 9 132 –6 704 – –6 362 66 –75 –73 1 001 –4 408 –306 3 452 466 – – –3 969 396 –28 141
State and Local
Government
Other accounts
receivableCentral
Government
including
Other
Depository
Corporations
Public
Nonfinancial
Corporations
Shares and
other
equity
Period Currency Deposits
Securities
other than
shares
Loans Other
Nonfinancial
Corporations
Other
Resident
Sectors
Nonfinancial
assetsNonresidents
Insurance
Technical
Reserves
Financial
derivatives
1Transactions are calculating according to the IMF methodology using the following formula: T = CS – OS – VC – OCVA, where T – transactions, OS (opening stock) – outstanding amounts at the beginning of period, CS (closing stock) – outstanding amounts at end of
period, VC – valuation change due to price and/or exchange rate change, OCVA –other changes in the volume of financial assets.
TotalCentral Bank
Other
financial
corporations

A
2008
2009
2010
2011
2012
2013
February
March
April
May
June
July
August
September
October
November
December
2014
January
February
2008
2009
2010
2011
2012
2013
February
March
April
May
June
July
August
September
October
November
December
2014
January
February
Period
2. Liabilities
11 11.1 11.2 11.3 11.4 11.5 11.6 11.7 11.8 11.9 12 13 14 15 16 17 18
outstanding amounts at end of period, in millions of hryvnias
425 856 – 20 992 19 305 615 1 921 12 281 105 907 219 711 45 124 10 784 327 528 – 325 68 925 135 846 969 263
402 381 3 26 810 15 621 8 140 446 12 319 82 477 215 949 40 614 4 949 283 517 – 51 165 099 145 925 1 001 922
464 300 0 21 722 19 022 3 924 208 13 952 102 153 277 390 25 928 3 038 261 195 – 48 185 131 173 970 1 087 681
553 001 1 28 026 21 799 3 734 160 17 964 135 155 312 943 33 218 7 343 249 577 – 152 214 457 190 273 1 214 803
628 214 4 25 119 20 852 5 788 141 27 229 146 090 372 241 30 749 10 989 205 294 – 144 222 622 202 399 1 269 663
646 191 1 25 578 21 598 5 230 766 25 610 147 290 388 233 31 884 11 716 192 693 – 115 224 636 204 261 1 279 613
657 923 2 29 294 24 111 5 376 748 25 486 147 777 393 586 31 542 11 062 192 183 – 200 220 408 207 126 1 288 901
672 845 2 35 652 21 342 5 224 1 172 25 681 150 096 402 592 31 084 10 972 188 562 – 187 221 556 208 640 1 302 761
679 528 2 38 613 21 524 4 961 1 084 25 569 150 666 406 187 30 922 10 990 189 129 – 177 222 562 210 117 1 312 504
689 824 2 38 114 24 256 4 420 1 064 23 934 146 696 418 026 33 311 10 894 188 659 – 178 234 708 210 582 1 334 846
700 718 2 39 288 21 639 4 878 1 034 22 347 156 152 422 324 33 055 11 445 191 735 – 212 231 108 210 680 1 345 899
705 607 2 39 185 22 822 4 413 1 001 21 998 155 901 426 764 33 521 12 308 187 388 – 165 235 808 212 533 1 353 809
718 214 2 37 242 25 114 4 504 1 061 21 911 162 578 433 399 32 404 13 424 187 822 – 217 238 728 213 361 1 371 766
715 581 1 35 744 23 022 5 058 1 147 22 558 157 074 438 839 32 138 14 191 188 533 – 258 248 101 216 348 1 383 012
720 014 2 35 190 24 220 4 552 1 064 21 953 157 637 443 992 31 404 14 346 197 859 – 300 250 659 219 808 1 402 985
738 274 3 36 646 26 174 2 761 189 26 438 168 722 445 690 31 651 13 985 208 131 – 256 219 313 232 103 1 412 061
725 963 3 39 552 24 892 2 843 195 22 835 163 702 441 445 30 495 14 445 216 768 – 370 164 110 234 745 1 356 400
749 836 3 37 234 25 154 3 505 157 28 400 168 730 453 093 33 561 14 884 250 764 – 2 856 189 962 226 392 1 434 694
transactions1 during the period, in millions of hryvnias
38 040 – 3 629 1 956 –210 –1 669 1 897 5 956 13 163 13 317 –9 026 62 643 – – 21 329 50 535 163 522
–31 890 3 5 395 –3 962 7 070 –1 475 –217 –24 572 –8 045 –6 088 –5 848 –51 995 – – 92 157 13 266 15 690
65 810 –2 –4 792 3 420 –4 128 –238 1 690 20 409 63 840 –14 388 –1 903 –21 239 – – 18 900 28 038 89 607
89 474 1 6 374 2 747 –104 –48 4 023 33 310 35 897 7 275 4 307 –11 683 – – 26 887 17 353 126 339
73 624 3 –2 989 –975 2 014 –19 9 240 10 634 58 278 –2 563 3 645 –44 601 – – 6 252 13 519 52 439
108 344 –1 11 324 5 356 –3 119 47 –815 22 399 72 351 802 2 989 2 680 – – –6 303 30 022 137 732
9 055 –3 3 045 –511 297 623 –828 –1 091 8 156 –632 686 –3 580 – – –5 612 1 525 2 073
12 892 1 3 803 2 526 232 –17 –107 666 6 059 –271 –653 –279 – – –3 858 3 029 11 131
13 898 –0 6 271 –2 766 –240 423 181 2 177 8 373 –523 –91 –3 768 – – 280 1 584 11 903
7 445 –0 3 028 196 –217 –87 –102 679 4 058 –111 19 709 – – 1 108 2 070 11 350
10 310 –0 –465 2 753 –565 –20 –1 633 –3 940 11 806 2 375 –96 –390 – – 11 873 567 22 265
9 799 –0 1 048 –2 639 401 –30 –1 599 9 308 3 615 –305 549 2 901 – – –4 394 651 9 505
4 904 –0 –96 1 174 –462 –33 –346 –226 4 425 470 863 –4 305 – – 4 467 2 007 7 936
11 531 –0 –2 059 2 292 43 60 –108 6 466 6 029 –1 191 1 114 170 – – 2 021 706 15 543
–3 521 –1 –1 589 –2 103 517 86 633 –5 653 4 899 –310 764 544 – – 8 668 3 181 9 637
5 266 1 –476 1 217 –479 –83 –590 723 5 648 –694 156 9 535 – – 2 945 3 008 20 911
17 407 1 1 368 1 952 –1 822 –876 4 469 10 932 1 190 194 –364 10 065 – – –31 768 12 153 7 493
–11 200 –0 3 026 –1 281 110 8 –3 577 –4 745 –3 664 –1 076 464 9 039 – – –55 215 3 539 –53 374
–44 727 –0 –7 104 –730 180 –54 2 362 –5 223 –32 068 –2 090 –90 4 302 – – 14 490 –2 117 –28 141
Deposits TotalPublic
Nonfinancial
Corporations
LoansShares and
other equity
Other accounts
payableOther financial
corporations
State and Local
Government
Other Resident
Sectors
Other
Depository
Corporations
including
Financial
derivatives
Securities other
than sharesOther
Nonfinancial
Corporations
Central BankCentral
Government
Insurance
Technical
ReservesNonresidents
1Transactions are calculating according to the IMF methodology using the following formula: T = CS – OS – VC – OCVA, where T – transactions, OS (opening stock) – outstanding amounts at the beginning of period, CS (closing stock) – outstanding amounts at end of
period, VC – valuation change due to price and/or exchange rate change, OCVA –other changes in the volume of financial assets.
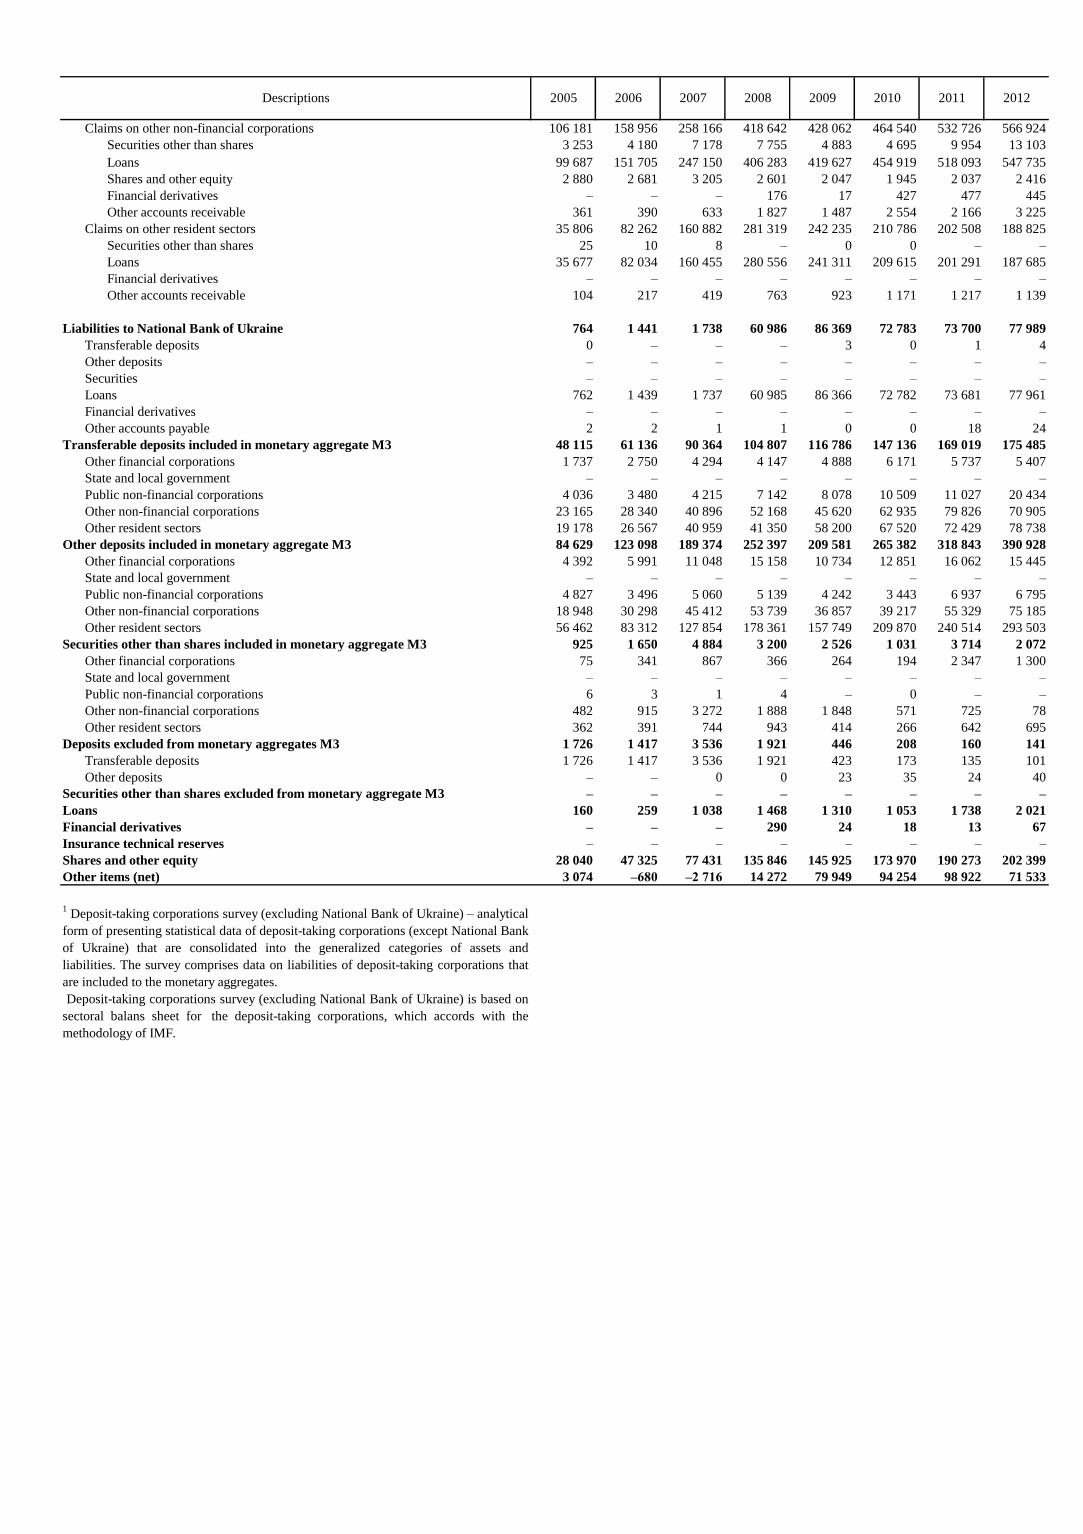
3. Monetary statistics
3.1. Surveys of financial corporations
3.1.3. Deposit-taking corporations survey (excluding National Bank of Ukraine) 1
(outstanding amounts at end of period, in millions of hryvnias)
Net foreign assets –12 175 –44 199 –113 882 –226 116 –149 120 –105 680 –84 528 –45 543
Claims on non-residents 14 305 20 571 30 610 57 706 81 341 91 999 105 749 128 606
Foreign currency 2 359 4 064 6 630 7 406 7 780 9 089 9 373 10 200
Transferable deposits 8 985 11 963 14 862 31 253 43 584 56 555 65 917 82 785
Other deposits 765 868 1 591 4 661 890 1 845 871 1 182
Securities other than shares 4 4 50 412 372 422 186 186
Loans 2 053 3 450 6 740 13 085 16 970 14 942 4 923 3 842
Shares and other equity 128 157 548 629 989 1 225 1 286 1 802
Insurance technical reserves – – – – – – – –
Financial derivatives – – – 35 12 0 1 050 1 095
Other accounts receivable 11 65 188 226 10 742 7 920 22 143 27 513
less: Liabilities to non-residents 26 480 64 770 144 491 283 822 230 461 197 679 190 276 174 150
Transferable deposits 1 827 3 363 6 176 5 482 4 745 7 086 10 398 7 095
Other deposits 4 522 4 989 10 172 39 642 35 870 18 842 22 819 23 654
Securities other than shares 125 1 146 4 722 2 540 499 50 57 6 358
Loans 19 709 54 537 120 634 235 652 175 283 161 419 134 418 108 627
Insurance technical reserves – – – – – – – –
Financial derivatives – – – 33 14 – 17 2
Other accounts payable 296 735 2 786 473 14 051 10 282 22 567 28 412
Claims on National Bank of Ukraine 24 988 22 614 33 576 34 326 40 394 52 747 53 766 53 649
Holdings of National currency 5 178 7 150 11 352 12 779 13 506 17 103 16 900 19 541
Transferable deposits 17 265 14 886 18 981 18 627 23 172 24 389 29 172 31 131
Other deposits 117 394 139 141 175 1 813 2 150 2 619
Securities other than shares 2 427 180 3 097 2 754 3 421 9 442 5 527 334
Loans – – – – – – – –
Shares and other equity – – – – – – – –
Financial derivatives – – – – – – – –
Other accounts receivable 2 5 8 25 120 0 17 25
Net claims on central government 2 380 2 192 2 744 13 032 16 650 63 260 67 185 65 689
Claims on central government 3 530 4 457 6 304 18 211 29 394 71 437 73 104 73 546
Securities other than shares 3 344 4 198 5 800 16 926 20 224 57 496 60 128 61 164
Loans – – – – 4 527 7 430 6 790 4 618
Shares and other equity – – – – – – – –
Financial derivatives – – – 5 0 5 10 428
Other accounts receivable 186 259 504 1 280 4 643 6 506 6 176 7 336
less: Liabilities to central government 1 151 2 265 3 560 5 179 12 744 8 178 5 919 7 857
Transferable deposits 283 265 561 565 8 015 3 728 3 658 5 728
Other deposits 0 0 40 51 125 197 76 60
Securities other than shares – – – 15 – 0 0 0
Loans – – – – – – – –
Insurance technical reserves – – – – – – – –
Financial derivatives – – – – 0 6 13 11
Other accounts payable 867 2 000 2 959 4 549 4 604 4 247 2 172 2 058
Claims on other residents 152 242 255 038 443 210 753 945 734 993 745 508 819 958 848 839
Claims on other financial corporations 2 815 4 352 10 091 15 800 18 131 18 228 21 150 21 406
Transferable deposits – – – – – – – –
Other deposits – – – – – – – –
Securities other than shares 470 524 1 513 2 699 2 270 2 276 1 579 1 859
Loans 1 663 2 689 5 932 9 789 14 014 13 430 16 441 16 229
Shares and other equity 505 1 022 2 434 2 906 1 586 2 250 2 647 2 717
Insurance technical reserves – – – – – – – –
Financial derivatives – – – 196 0 15 22 3
Other accounts receivable 177 116 212 210 261 257 461 598
Claims on state and local government 317 363 467 490 1 906 1 979 2 322 6 763
Securities other than shares 311 358 452 476 673 589 574 5 573
Loans 5 4 4 12 1 229 1 388 1 742 1 185
Shares and other equity – – – – – – – –
Financial derivatives – – – – – – – –
Other accounts receivable 0 0 11 2 4 2 5 5
Claims on public non-financial corporations 7 124 9 106 13 604 37 694 44 660 49 975 61 253 64 922
Securities other than shares 632 278 248 278 2 035 3 869 3 691 7 155
Loans 6 391 8 798 13 326 37 382 42 587 46 042 57 452 57 690
Shares and other equity 32 7 10 4 7 11 6 4
Financial derivatives – – – – – – – –
Other accounts receivable 69 24 19 30 30 53 105 73
Descriptions 2006 20072005 2008 2009 2010 2011 2012
Descriptions 2006 20072005 2008 2009 2010 2011 2012
Claims on other non-financial corporations 106 181 158 956 258 166 418 642 428 062 464 540 532 726 566 924
Securities other than shares 3 253 4 180 7 178 7 755 4 883 4 695 9 954 13 103
Loans 99 687 151 705 247 150 406 283 419 627 454 919 518 093 547 735
Shares and other equity 2 880 2 681 3 205 2 601 2 047 1 945 2 037 2 416
Financial derivatives – – – 176 17 427 477 445
Other accounts receivable 361 390 633 1 827 1 487 2 554 2 166 3 225
Claims on other resident sectors 35 806 82 262 160 882 281 319 242 235 210 786 202 508 188 825
Securities other than shares 25 10 8 – 0 0 – –
Loans 35 677 82 034 160 455 280 556 241 311 209 615 201 291 187 685
Financial derivatives – – – – – – – –
Other accounts receivable 104 217 419 763 923 1 171 1 217 1 139
Liabilities to National Bank of Ukraine 764 1 441 1 738 60 986 86 369 72 783 73 700 77 989
Transferable deposits 0 – – – 3 0 1 4
Other deposits – – – – – – – –
Securities – – – – – – – –
Loans 762 1 439 1 737 60 985 86 366 72 782 73 681 77 961
Financial derivatives – – – – – – – –
Other accounts payable 2 2 1 1 0 0 18 24
Transferable deposits included in monetary aggregate M3 48 115 61 136 90 364 104 807 116 786 147 136 169 019 175 485
Other financial corporations 1 737 2 750 4 294 4 147 4 888 6 171 5 737 5 407
State and local government – – – – – – – –
Public non-financial corporations 4 036 3 480 4 215 7 142 8 078 10 509 11 027 20 434
Other non-financial corporations 23 165 28 340 40 896 52 168 45 620 62 935 79 826 70 905
Other resident sectors 19 178 26 567 40 959 41 350 58 200 67 520 72 429 78 738
Other deposits included in monetary aggregate M3 84 629 123 098 189 374 252 397 209 581 265 382 318 843 390 928
Other financial corporations 4 392 5 991 11 048 15 158 10 734 12 851 16 062 15 445
State and local government – – – – – – – –
Public non-financial corporations 4 827 3 496 5 060 5 139 4 242 3 443 6 937 6 795
Other non-financial corporations 18 948 30 298 45 412 53 739 36 857 39 217 55 329 75 185
Other resident sectors 56 462 83 312 127 854 178 361 157 749 209 870 240 514 293 503
Securities other than shares included in monetary aggregate M3 925 1 650 4 884 3 200 2 526 1 031 3 714 2 072
Other financial corporations 75 341 867 366 264 194 2 347 1 300
State and local government – – – – – – – –
Public non-financial corporations 6 3 1 4 – 0 – –
Other non-financial corporations 482 915 3 272 1 888 1 848 571 725 78
Other resident sectors 362 391 744 943 414 266 642 695
Deposits excluded from monetary aggregates M3 1 726 1 417 3 536 1 921 446 208 160 141
Transferable deposits 1 726 1 417 3 536 1 921 423 173 135 101
Other deposits – – 0 0 23 35 24 40
Securities other than shares excluded from monetary aggregate M3 – – – – – – – –
Loans 160 259 1 038 1 468 1 310 1 053 1 738 2 021
Financial derivatives – – – 290 24 18 13 67
Insurance technical reserves – – – – – – – –
Shares and other equity 28 040 47 325 77 431 135 846 145 925 173 970 190 273 202 399
Other items (net) 3 074 –680 –2 716 14 272 79 949 94 254 98 922 71 533
1Deposit-taking corporations survey (excluding National Bank of Ukraine) – analytical
form of presenting statistical data of deposit-taking corporations (except National Bank
of Ukraine) that are consolidated into the generalized categories of assets and
liabilities. The survey comprises data on liabilities of deposit-taking corporations that
are included to the monetary aggregates.
Deposit-taking corporations survey (excluding National Bank of Ukraine) is based on
sectoral balans sheet for the deposit-taking corporations, which accords with the
methodology of IMF.

3. Monetary statistics
3.1. Surveys of financial corporations
3.1.3. Deposit-taking corporations survey (excluding National Bank of Ukraine) 1
(outstanding amounts at end of period, in millions of hryvnias)
Net foreign assets
Claims on non-residents
Foreign currency
Transferable deposits
Other deposits
Securities other than shares
Loans
Shares and other equity
Insurance technical reserves
Financial derivatives
Other accounts receivable
less: Liabilities to non-residents
Transferable deposits
Other deposits
Securities other than shares
Loans
Insurance technical reserves
Financial derivatives
Other accounts payable
Claims on National Bank of Ukraine
Holdings of National currency
Transferable deposits
Other deposits
Securities other than shares
Loans
Shares and other equity
Financial derivatives
Other accounts receivable
Net claims on central government
Claims on central government
Securities other than shares
Loans
Shares and other equity
Financial derivatives
Other accounts receivable
less: Liabilities to central government
Transferable deposits
Other deposits
Securities other than shares
Loans
Insurance technical reserves
Financial derivatives
Other accounts payable
Claims on other residents
Claims on other financial corporations
Transferable deposits
Other deposits
Securities other than shares
Loans
Shares and other equity
Insurance technical reserves
Financial derivatives
Other accounts receivable
Claims on state and local government
Securities other than shares
Loans
Shares and other equity
Financial derivatives
Other accounts receivable
Claims on public non-financial corporations
Securities other than shares
Loans
Shares and other equity
Financial derivatives
Other accounts receivable
DescriptionsFebruary March April May June July
–58 534 –60 769 –59 061 –66 613 –64 553 –61 386
118 975 118 025 115 142 106 470 110 551 115 450
9 978 9 080 8 989 8 307 8 867 9 193
67 492 70 957 66 936 59 209 62 062 60 215
309 318 298 307 439 336
182 183 184 185 186 187
6 257 4 821 3 200 3 174 2 870 7 413
1 825 1 849 1 849 1 877 1 759 1 746
– – – – – –
1 113 1 127 1 135 1 128 1 126 1 120
31 819 29 690 32 551 32 283 33 241 35 240
177 509 178 794 174 203 173 083 175 104 176 836
7 973 8 214 8 948 9 207 10 731 10 748
23 911 23 328 22 136 21 715 22 579 22 306
6 756 6 758 6 761 6 763 6 769 6 779
107 775 109 681 103 726 103 201 102 112 102 254
– – – – – –
12 5 6 6 1 4
31 082 30 808 32 626 32 191 32 911 34 744
57 870 55 359 57 237 63 605 62 805 61 786
19 134 19 076 24 708 20 330 21 993 22 123
33 189 29 742 26 952 35 234 32 517 30 997
1 445 1 598 1 558 1 849 2 019 1 831
3 806 4 784 3 801 5 694 5 643 6 477
– – – – – –
– – – – – –
– – – – – –
296 160 218 498 634 358
81 459 87 561 89 177 94 283 95 738 98 107
88 257 94 652 95 834 100 926 102 228 104 762
75 921 82 321 83 793 88 330 89 716 91 810
4 617 4 620 4 626 4 621 4 618 4 620
– – – – – –
423 416 382 373 359 350
7 296 7 295 7 034 7 602 7 534 7 983
6 798 7 091 6 657 6 642 6 490 6 655
5 141 5 099 5 029 4 805 4 364 4 304
88 277 195 156 57 574
0 0 0 0 0 0
– – – – – –
– – – – – –
19 48 29 25 29 35
1 549 1 667 1 404 1 656 2 041 1 742
858 055 862 914 869 068 870 590 879 225 883 215
22 536 25 316 23 846 23 378 25 362 22 913
– – – – – –
– – – – – –
1 954 2 668 2 817 2 765 2 614 2 773
17 410 19 379 17 811 17 671 19 105 17 215
2 709 2 722 2 773 2 638 2 601 2 410
– – – – – –
30 48 44 41 57 54
433 498 400 262 985 460
6 665 6 640 6 654 6 710 6 466 6 506
5 710 5 671 5 744 5 803 5 561 5 593
947 960 902 901 899 907
– – – – – –
– – – – – –
8 9 7 6 6 7
62 996 62 329 63 965 63 719 62 525 62 531
7 615 8 338 8 588 9 826 9 497 9 737
55 296 53 903 55 288 53 720 52 937 52 705
3 3 3 3 3 3
– – – – – –
81 85 87 170 88 86
2013

Descriptions
Claims on other non-financial corporations
Securities other than shares
Loans
Shares and other equity
Financial derivatives
Other accounts receivable
Claims on other resident sectors
Securities other than shares
Loans
Financial derivatives
Other accounts receivable
Liabilities to National Bank of Ukraine
Transferable deposits
Other deposits
Securities
Loans
Financial derivatives
Other accounts payable
Transferable deposits included in monetary aggregate M3
Other financial corporations
State and local government
Public non-financial corporations
Other non-financial corporations
Other resident sectors
Other deposits included in monetary aggregate M3
Other financial corporations
State and local government
Public non-financial corporations
Other non-financial corporations
Other resident sectors
Securities other than shares included in monetary aggregate M3
Other financial corporations
State and local government
Public non-financial corporations
Other non-financial corporations
Other resident sectors
Deposits excluded from monetary aggregates M3
Transferable deposits
Other deposits
Securities other than shares excluded from monetary aggregate M3
Loans
Financial derivatives
Insurance technical reserves
Shares and other equity
Other items (net)
1Deposit-taking corporations survey (excluding National Bank of Ukraine) – analytical
form of presenting statistical data of deposit-taking corporations (except National Bank
of Ukraine) that are consolidated into the generalized categories of assets and
liabilities. The survey comprises data on liabilities of deposit-taking corporations that
are included to the monetary aggregates.
Deposit-taking corporations survey (excluding National Bank of Ukraine) is based on
sectoral balans sheet for the deposit-taking corporations, which accords with the
methodology of IMF.
February March April May June July
2013
575 580 577 538 582 286 583 186 591 396 596 611
13 515 13 289 15 916 15 782 16 063 15 934
557 345 559 283 561 540 562 562 570 161 575 483
2 377 2 453 2 496 2 527 2 743 2 881
368 395 397 422 372 364
1 975 2 118 1 937 1 893 2 056 1 948
190 279 191 092 192 317 193 597 193 477 194 654
– – – – – –
188 265 188 450 190 111 190 880 190 041 190 870
– 0 3 18 2 4
2 014 2 641 2 203 2 700 3 433 3 781
69 266 66 220 67 735 69 049 69 019 69 640
1 2 2 2 2 2
– – – – – –
– – – – – –
69 162 66 190 67 699 69 009 68 986 69 591
– – – – – –
103 28 35 39 31 47
184 719 186 648 189 174 193 056 193 199 198 310
6 548 7 671 5 897 6 019 6 865 5 125
– – – – – –
20 076 20 355 20 194 20 815 18 904 18 212
77 412 75 534 75 138 78 116 73 475 82 210
80 683 83 089 87 944 88 106 93 956 92 763
398 012 404 312 410 537 410 889 419 713 424 152
15 051 16 440 15 445 15 504 17 392 16 514
– – – – – –
5 534 5 131 5 487 4 754 5 030 4 135
69 878 72 243 74 958 72 549 73 222 73 942
307 550 310 498 314 647 318 081 324 070 329 561
2 583 2 544 2 390 2 439 2 236 2 427
1 623 1 713 1 548 1 600 1 622 1 623
– – – – – –
8 – – – – –
79 108 55 25 7 8
873 724 787 815 607 796
766 748 1 172 1 084 1 064 1 034
730 708 1 131 1 043 1 023 1 000
36 40 40 41 41 34
– – – – – –
2 000 1 223 1 565 1 634 1 631 1 636
6 25 21 23 26 29
– – – – – –
204 261 207 126 208 640 210 117 210 582 210 680
77 235 76 219 75 186 73 573 75 745 73 815

3. Monetary statistics
3.1. Surveys of financial corporations
3.1.3. Deposit-taking corporations survey (excluding National Bank of Ukraine) 1
(outstanding amounts at end of period, in millions of hryvnias)
Net foreign assets
Claims on non-residents
Foreign currency
Transferable deposits
Other deposits
Securities other than shares
Loans
Shares and other equity
Insurance technical reserves
Financial derivatives
Other accounts receivable
less: Liabilities to non-residents
Transferable deposits
Other deposits
Securities other than shares
Loans
Insurance technical reserves
Financial derivatives
Other accounts payable
Claims on National Bank of Ukraine
Holdings of National currency
Transferable deposits
Other deposits
Securities other than shares
Loans
Shares and other equity
Financial derivatives
Other accounts receivable
Net claims on central government
Claims on central government
Securities other than shares
Loans
Shares and other equity
Financial derivatives
Other accounts receivable
less: Liabilities to central government
Transferable deposits
Other deposits
Securities other than shares
Loans
Insurance technical reserves
Financial derivatives
Other accounts payable
Claims on other residents
Claims on other financial corporations
Transferable deposits
Other deposits
Securities other than shares
Loans
Shares and other equity
Insurance technical reserves
Financial derivatives
Other accounts receivable
Claims on state and local government
Securities other than shares
Loans
Shares and other equity
Financial derivatives
Other accounts receivable
Claims on public non-financial corporations
Securities other than shares
Loans
Shares and other equity
Financial derivatives
Other accounts receivable
DescriptionsAugust September October November December January February
–60 954 –59 969 –62 529 –65 110 –73 315 –72 944 –93 118
117 048 124 060 124 583 123 094 106 004 81 198 89 008
8 565 8 848 8 510 8 339 11 753 12 879 14 711
67 508 66 890 64 985 56 859 56 848 56 341 55 595
358 351 413 771 866 686 1 043
182 183 185 75 74 74 227
3 182 3 016 2 504 7 697 2 388 7 981 13 931
1 757 1 792 1 805 1 832 1 938 1 908 2 416
– – – – – – –
1 108 1 133 1 117 1 114 1 069 201 240
34 387 41 848 45 064 46 407 31 067 1 127 843
178 002 184 029 187 112 188 204 179 319 154 142 182 125
11 546 9 866 9 980 10 075 10 813 12 627 12 872
21 975 22 538 22 157 21 329 20 838 17 867 20 689
7 189 8 005 8 008 7 998 8 004 8 093 7 997
103 234 102 269 101 978 104 633 108 963 115 059 139 739
– – – – – – –
3 5 6 2 4 2 4
34 055 41 345 44 982 44 167 30 698 492 825
62 414 63 074 64 499 63 485 74 461 63 859 57 912
22 886 22 381 21 845 22 578 24 094 21 719 21 793
34 223 36 533 37 855 36 776 43 947 35 503 32 336
1 982 2 044 2 142 2 835 3 287 3 312 69
2 719 1 852 2 193 702 3 126 1 061 3 422
– – – – – – –
– – – – – – –
– – – – – – –
605 265 463 594 7 2 262 292
94 183 90 319 89 444 91 955 95 985 94 871 102 450
100 502 97 075 96 385 98 579 101 261 99 639 108 210
87 868 84 302 84 124 85 639 88 091 86 482 94 517
4 623 4 419 4 059 4 707 4 998 4 879 4 805
– – – – – – –
325 308 315 313 312 318 597
7 687 8 046 7 886 7 919 7 860 7 959 8 291
6 320 6 756 6 940 6 624 5 276 4 767 5 760
4 014 3 987 4 304 3 694 2 657 2 709 3 375
399 517 755 857 104 134 129
0 0 0 0 0 0 0
– – – – – – –
– – – – – – –
20 6 23 17 15 8 18
1 886 2 246 1 859 2 056 2 499 1 916 2 238
893 854 906 476 912 025 927 164 956 687 947 917 1 021 595
23 069 24 423 23 208 25 254 25 571 26 945 28 620
– – – – – – –
– – – – – – –
2 693 2 692 2 720 2 711 3 062 3 115 3 611
17 412 18 341 17 727 19 548 19 317 20 800 21 527
2 472 2 406 2 233 2 413 2 213 2 201 2 617
– – – – – – –
40 73 74 76 147 108 122
452 911 453 505 832 721 744
6 573 6 955 6 975 7 020 6 776 6 909 6 955
5 662 6 042 6 053 6 100 5 860 5 924 5 984
905 908 913 914 910 981 908
– – – – – – –
– – – – – – –
6 6 9 6 7 4 62
62 897 64 115 63 388 65 612 64 403 65 245 70 014
9 826 9 749 9 590 9 784 13 861 13 929 13 959
52 976 54 274 53 700 55 729 50 472 51 251 55 997
3 3 3 8 3 3 3
– – – – – – –
92 90 95 91 67 62 54
20142013
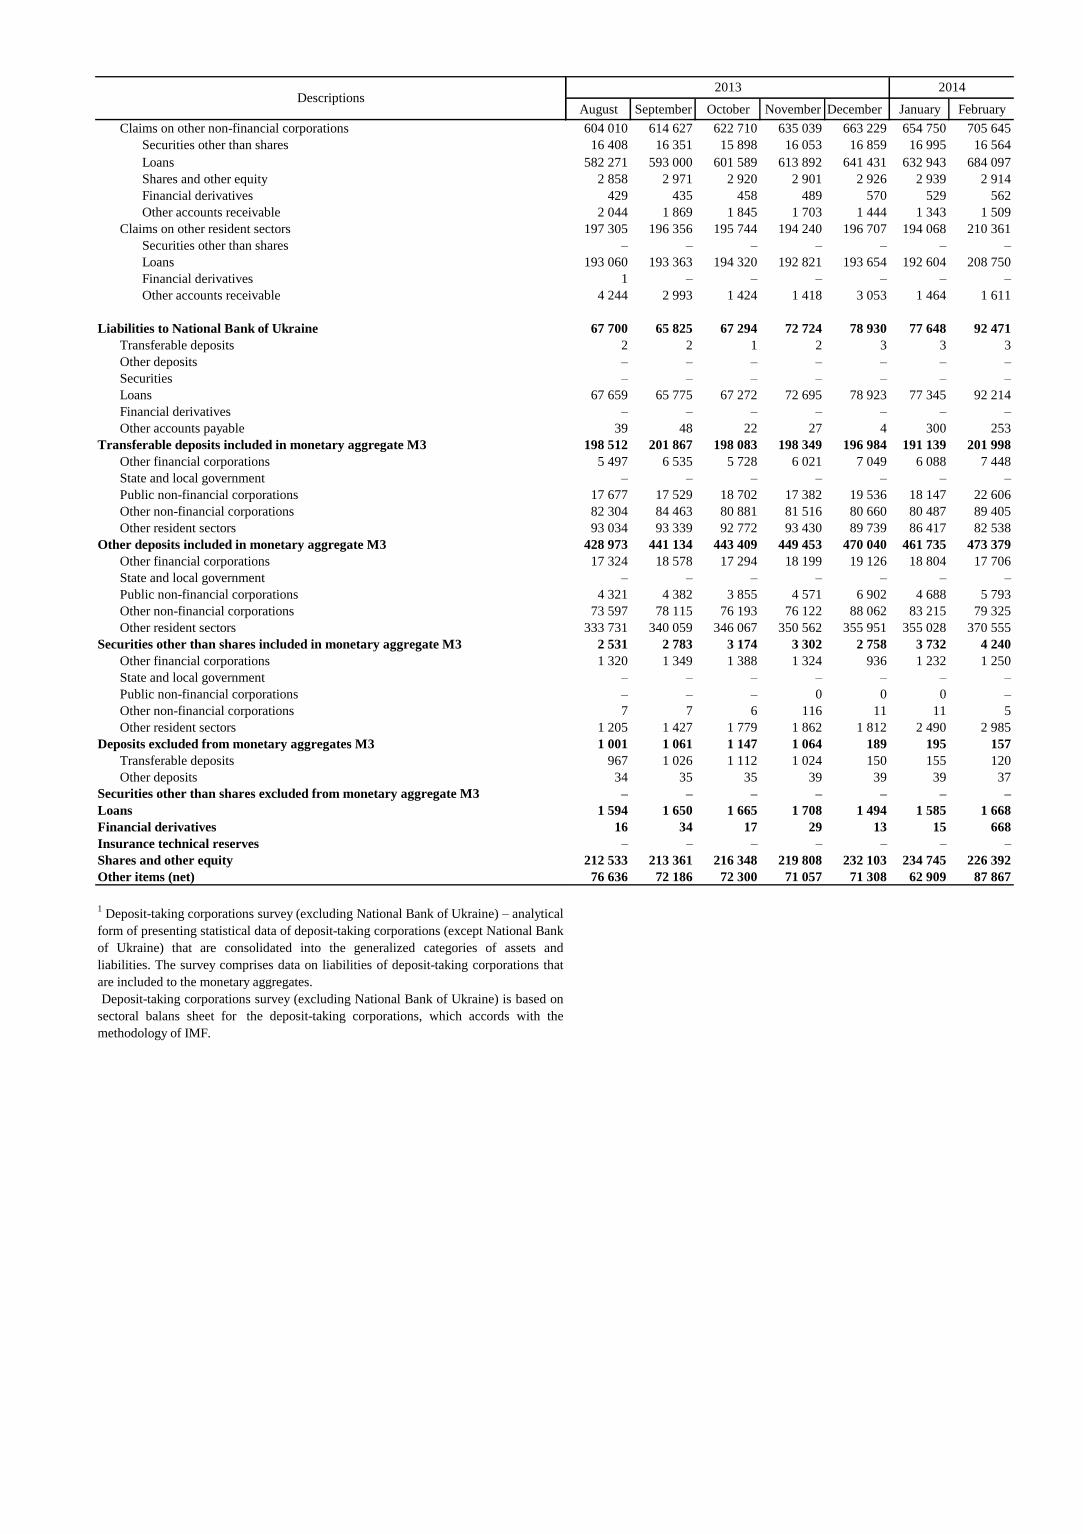
Descriptions
Claims on other non-financial corporations
Securities other than shares
Loans
Shares and other equity
Financial derivatives
Other accounts receivable
Claims on other resident sectors
Securities other than shares
Loans
Financial derivatives
Other accounts receivable
Liabilities to National Bank of Ukraine
Transferable deposits
Other deposits
Securities
Loans
Financial derivatives
Other accounts payable
Transferable deposits included in monetary aggregate M3
Other financial corporations
State and local government
Public non-financial corporations
Other non-financial corporations
Other resident sectors
Other deposits included in monetary aggregate M3
Other financial corporations
State and local government
Public non-financial corporations
Other non-financial corporations
Other resident sectors
Securities other than shares included in monetary aggregate M3
Other financial corporations
State and local government
Public non-financial corporations
Other non-financial corporations
Other resident sectors
Deposits excluded from monetary aggregates M3
Transferable deposits
Other deposits
Securities other than shares excluded from monetary aggregate M3
Loans
Financial derivatives
Insurance technical reserves
Shares and other equity
Other items (net)
1Deposit-taking corporations survey (excluding National Bank of Ukraine) – analytical
form of presenting statistical data of deposit-taking corporations (except National Bank
of Ukraine) that are consolidated into the generalized categories of assets and
liabilities. The survey comprises data on liabilities of deposit-taking corporations that
are included to the monetary aggregates.
Deposit-taking corporations survey (excluding National Bank of Ukraine) is based on
sectoral balans sheet for the deposit-taking corporations, which accords with the
methodology of IMF.
August September October November December January February
20142013
604 010 614 627 622 710 635 039 663 229 654 750 705 645
16 408 16 351 15 898 16 053 16 859 16 995 16 564
582 271 593 000 601 589 613 892 641 431 632 943 684 097
2 858 2 971 2 920 2 901 2 926 2 939 2 914
429 435 458 489 570 529 562
2 044 1 869 1 845 1 703 1 444 1 343 1 509
197 305 196 356 195 744 194 240 196 707 194 068 210 361
– – – – – – –
193 060 193 363 194 320 192 821 193 654 192 604 208 750
1 – – – – – –
4 244 2 993 1 424 1 418 3 053 1 464 1 611
67 700 65 825 67 294 72 724 78 930 77 648 92 471
2 2 1 2 3 3 3
– – – – – – –
– – – – – – –
67 659 65 775 67 272 72 695 78 923 77 345 92 214
– – – – – – –
39 48 22 27 4 300 253
198 512 201 867 198 083 198 349 196 984 191 139 201 998
5 497 6 535 5 728 6 021 7 049 6 088 7 448
– – – – – – –
17 677 17 529 18 702 17 382 19 536 18 147 22 606
82 304 84 463 80 881 81 516 80 660 80 487 89 405
93 034 93 339 92 772 93 430 89 739 86 417 82 538
428 973 441 134 443 409 449 453 470 040 461 735 473 379
17 324 18 578 17 294 18 199 19 126 18 804 17 706
– – – – – – –
4 321 4 382 3 855 4 571 6 902 4 688 5 793
73 597 78 115 76 193 76 122 88 062 83 215 79 325
333 731 340 059 346 067 350 562 355 951 355 028 370 555
2 531 2 783 3 174 3 302 2 758 3 732 4 240
1 320 1 349 1 388 1 324 936 1 232 1 250
– – – – – – –
– – – 0 0 0 –
7 7 6 116 11 11 5
1 205 1 427 1 779 1 862 1 812 2 490 2 985
1 001 1 061 1 147 1 064 189 195 157
967 1 026 1 112 1 024 150 155 120
34 35 35 39 39 39 37
– – – – – – –
1 594 1 650 1 665 1 708 1 494 1 585 1 668
16 34 17 29 13 15 668
– – – – – – –
212 533 213 361 216 348 219 808 232 103 234 745 226 392
76 636 72 186 72 300 71 057 71 308 62 909 87 867

3. Monetary statistics
3.1. Surveys of financial corporations
3.1.4. Deposit-taking corporations survey (including National Bank of Ukraine) 1
(outstanding amounts at end of period, in millions of hryvnias)
Net foreign assets 81 825 67 041 51 443 –16 121 16 507 115 732 114 759 114 860
Claims on non-residents 124 602 146 737 209 251 320 504 313 909 390 193 381 893 344 875
Monetary gold and SDR holdings 1 398 1 814 2 489 4 144 5 942 7 254 8 202 9 252
Foreign currency 2 433 4 139 6 707 7 495 7 867 9 169 9 964 10 797
Transferable deposits 10 810 12 768 15 416 48 968 53 816 59 743 78 708 89 155
Other deposits 77 602 70 704 88 715 102 182 88 592 120 978 88 941 54 770
Securities other than shares 20 143 43 070 77 365 127 274 111 578 151 909 149 395 129 450
Loans 2 053 3 450 6 740 13 085 16 970 14 942 4 923 3 842
Shares and other equity 249 279 670 750 1 111 1 346 1 407 1 924
Insurance technical reserves – – – – – – – –
Financial derivatives – – – 35 12 0 1 050 1 095
Other accounts receivable 9 914 10 514 11 150 16 570 28 021 24 851 39 302 44 591
less: Liabilities to non-residents 42 776 79 696 157 808 336 625 297 402 274 461 267 134 230 015
Transferable deposits 17 787 18 020 19 323 58 131 70 550 82 856 86 253 61 950
Other deposits 4 522 4 989 10 172 39 642 35 870 18 842 22 819 23 654
Securities other than shares 125 1 146 4 722 2 540 499 50 57 6 358
Loans 20 044 54 792 120 790 235 776 175 342 161 419 134 418 108 627
Insurance technical reserves – – – – – – – –
Financial derivatives – – – 33 14 – 17 2
Other accounts payable 298 749 2 800 503 14 108 10 296 22 571 28 422
SDR Allocations – – – – 1 020 999 999 1 001
Domestic credit2
146 752 248 631 440 027 778 432 809 174 860 545 966 570 1 035 593
Net claims on central government2
–5 769 –6 757 –3 530 23 786 72 268 113 216 144 613 181 555
Claims on central government 13 845 14 133 15 362 41 885 86 405 142 963 162 754 190 711
Securities other than shares 3 783 4 609 6 195 25 953 73 171 111 163 134 705 161 282
Loans 9 294 9 042 8 660 11 145 7 965 10 736 9 964 7 660
Shares and other equity – – – – – – – –
Financial derivatives – – – 5 0 5 10 428
Other accounts receivable 768 483 507 4 782 5 268 21 058 18 075 21 341
less: Liabilities to central government2
19 614 20 890 18 892 18 099 14 136 29 747 18 142 9 157
Transferable deposits2
18 745 18 889 15 889 13 482 9 405 25 295 15 876 7 008
Other deposits 0 0 40 51 125 197 76 60
Securities other than shares – – – 15 – 0 0 0
Loans – – – – – – – –
Insurance technical reserves – – – – – – – –
Financial derivatives – – – – 0 6 13 11
Other accounts payable 869 2 001 2 963 4 552 4 606 4 249 2 176 2 078
Claims on other residents 152 522 255 388 443 557 754 646 736 905 747 330 821 958 854 038
Claims on other financial corporations 2 839 4 396 10 137 15 907 19 463 19 536 22 659 25 956
Transferable deposits – – – – – – – –
Other deposits – – – – – – – –
Securities other than shares 470 524 1 513 2 699 3 470 3 483 2 979 6 305
Loans 1 663 2 689 5 932 9 789 14 014 13 430 16 441 16 229
Shares and other equity 529 1 046 2 463 2 972 1 682 2 346 2 750 2 820
Insurance technical reserves – – – – – – – –
Financial derivatives – – – 196 0 15 22 3
Other accounts receivable 177 137 228 252 297 262 467 599
Claims on state and local government 317 363 467 490 1 907 1 980 2 323 6 764
Securities other than shares 311 358 452 476 673 589 574 5 573
Loans 5 4 4 12 1 229 1 388 1 742 1 185
Shares and other equity – – – – – – – –
Financial derivatives – – – – – – – –
Other accounts receivable 0 1 11 2 6 3 6 6
Claims on public non-financial corporations 7 232 9 229 13 705 37 855 44 830 50 145 61 424 65 141
Securities other than shares 632 278 248 278 2 035 3 869 3 691 7 155
Loans 6 492 8 899 13 426 37 538 42 754 46 209 57 619 57 858
Shares and other equity 32 7 10 4 7 11 6 4
Financial derivatives – – – – – – – –
Other accounts receivable 76 45 21 34 33 56 108 125
Claims on other non-financial corporations 106 261 159 049 258 254 418 913 428 271 464 651 532 809 567 063
Securities other than shares 3 253 4 180 7 178 7 755 4 883 4 695 9 954 13 103
Loans 99 744 151 758 247 199 406 321 419 658 454 940 518 115 547 756
Shares and other equity 2 880 2 681 3 205 2 601 2 047 1 945 2 037 2 416
Financial derivatives – – – 176 17 427 477 445
Other accounts receivable 385 430 672 2 060 1 666 2 643 2 226 3 342
2011 2012Descriptions 2005 20102006 2007 2008 2009

2011 2012Descriptions 2005 20102006 2007 2008 2009
Claims on other resident sectors 35 873 82 352 160 994 281 482 242 434 211 019 202 743 189 114
Securities other than shares 25 10 8 – 0 0 – –
Loans 35 744 82 124 160 566 280 717 241 508 209 847 201 525 187 971
Financial derivatives – – – – – – – –
Other accounts receivable 104 217 419 765 925 1 172 1 219 1 142
Monetary aggregate M32
194 071 261 063 396 156 515 727 487 298 597 872 685 515 773 199
Currency in circulation outside deposit-taking corporations 60 231 74 984 111 119 154 759 157 029 182 990 192 665 203 245
Transferable deposits2
48 285 61 332 90 780 105 372 118 162 148 469 170 293 176 953
Other financial corporations2
1 737 2 750 4 294 4 147 5 637 6 726 6 131 5 838
State and local government – – – – – – – –
Public non-financial corporations 4 116 3 505 4 325 7 241 8 092 10 522 11 034 20 435
Other non-financial corporations 23 165 28 340 40 896 52 168 45 663 62 937 79 835 70 955
Other resident sectors 19 266 26 737 41 265 41 816 58 770 68 284 73 293 79 727
Other deposits 84 629 123 098 189 374 252 397 209 581 265 382 318 843 390 928
Other financial corporations 4 392 5 991 11 048 15 158 10 734 12 851 16 062 15 445
State and local government – – – – – – – –
Public non-financial corporations 4 827 3 496 5 060 5 139 4 242 3 443 6 937 6 795
Other non-financial corporations 18 948 30 298 45 412 53 739 36 857 39 217 55 329 75 185
Other resident sectors 56 462 83 312 127 854 178 361 157 749 209 870 240 514 293 503
Securities other than shares 925 1 650 4 884 3 200 2 526 1 031 3 714 2 072
Other financial corporations 75 341 867 366 264 194 2 347 1 300
State and local government – – – – – – – –
Public non-financial corporations 6 3 1 4 – 0 – –
Other non-financial corporations 482 915 3 272 1 888 1 848 571 725 78
Other resident sectors 362 391 744 943 414 266 642 695
Deposits excluded from monetary aggregate M3 1 726 1 417 3 536 1 922 447 208 160 141
Transferable deposits 1 726 1 417 3 536 1 921 423 173 135 101
Other financial corporations – – – – – – – –
State and local government 1 726 1 417 3 536 1 921 423 173 135 101
Public non-financial corporations – – – – – – – –
Other non-financial corporations – – – – – – – –
Other resident sectors – – – – – – – –
Other deposits 0 0 0 1 23 35 24 40
Other financial corporations – – – – – – – –
State and local government – – 0 0 23 35 24 40
Public non-financial corporations – – – – – – – –
Other non-financial corporations – – – – – – – –
Other resident sectors 0 0 0 1 0 0 0 0
Securities other than shares excluded from monetary aggregate M3 – – – – – – – –
Other financial corporations – – – – – – – –
State and local government – – – – – – – –
Public non-financial corporations – – – – – – – –
Other non-financial corporations – – – – – – – –
Other resident sectors – – – – – – – –
Loans 160 259 1 038 1 468 1 310 1 053 1 738 2 021
Financial derivatives – – – 290 24 18 13 67
Insurance technical reserves – – – – – – – –
Shares and other equity 31 404 55 634 99 527 233 751 250 931 277 972 289 111 299 326
Other items (net) 1 216 –2 701 –8 787 9 153 85 671 99 153 104 793 75 700
1Deposit-taking corporations survey (including National Bank of Ukraine) – analytical
form of presenting statistical data of deposit-taking corporations (National Bank of
Ukraine and other deposit-taking corporations) that are consolidated into the
generalized categories of assets and liabilities. The survey comprises data on liabilities
of deposit-taking corporations that are included to the monetary aggregates. The
balance sheet identity in Deposit-taking corporations survey (including the National
Bank of Ukraine) reflects the link of monetary aggregate M3 and other items with
claims of deposit-taking corporations on residents and non-residents.
Deposit-taking corporations survey (including National Bank of Ukraine) is based on
sectoral balans sheet for the National Bank of Ukraine and other deposit-taking
corporations (banks), which accords with the methodology of IMF.
2 Updated data for December 2013 and January 2014.

3. Monetary statistics
3.1. Surveys of financial corporations
3.1.4. Deposit-taking corporations survey (including National Bank of Ukraine) 1
(outstanding amounts at end of period, in millions of hryvnias)
Net foreign assets
Claims on non-residents
Monetary gold and SDR holdings
Foreign currency
Transferable deposits
Other deposits
Securities other than shares
Loans
Shares and other equity
Insurance technical reserves
Financial derivatives
Other accounts receivable
less: Liabilities to non-residents
Transferable deposits
Other deposits
Securities other than shares
Loans
Insurance technical reserves
Financial derivatives
Other accounts payable
SDR Allocations
Domestic credit2
Net claims on central government2
Claims on central government
Securities other than shares
Loans
Shares and other equity
Financial derivatives
Other accounts receivable
less: Liabilities to central government2
Transferable deposits2
Other deposits
Securities other than shares
Loans
Insurance technical reserves
Financial derivatives
Other accounts payable
Claims on other residents
Claims on other financial corporations
Transferable deposits
Other deposits
Securities other than shares
Loans
Shares and other equity
Insurance technical reserves
Financial derivatives
Other accounts receivable
Claims on state and local government
Securities other than shares
Loans
Shares and other equity
Financial derivatives
Other accounts receivable
Claims on public non-financial corporations
Securities other than shares
Loans
Shares and other equity
Financial derivatives
Other accounts receivable
Claims on other non-financial corporations
Securities other than shares
Loans
Shares and other equity
Financial derivatives
Other accounts receivable
DescriptionsFebruary March April May June July
108 748 107 065 112 753 105 844 97 757 96 317
335 273 334 430 335 917 321 632 315 738 316 334
9 071 9 036 8 788 8 069 7 067 7 922
10 573 9 671 9 583 8 898 9 460 9 788
73 936 78 134 71 678 65 341 68 305 64 441
53 141 52 604 55 480 49 720 41 601 36 285
130 378 130 511 134 558 134 159 133 106 135 093
6 257 4 821 3 200 3 174 2 870 7 413
1 947 1 971 1 971 1 998 1 880 1 867
– – – – – –
1 113 1 127 1 135 1 128 1 126 1 120
48 857 46 554 49 524 49 142 50 322 52 406
226 525 227 365 223 164 215 787 217 981 220 017
55 991 55 794 56 894 50 905 52 606 52 927
23 911 23 328 22 136 21 715 22 579 22 306
6 756 6 758 6 761 6 763 6 769 6 779
107 775 109 681 103 726 103 201 102 112 102 254
– – – – – –
12 5 6 6 1 4
31 094 30 824 32 659 32 222 32 935 34 762
986 976 982 976 979 985
1 051 993 1 068 766 1 066 734 1 075 424 1 100 701 1 117 179
188 657 200 662 192 397 199 523 216 251 228 641
206 892 219 787 224 183 227 258 232 614 244 009
190 490 200 447 205 916 211 628 217 126 224 855
7 683 7 629 7 647 7 655 7 594 7 608
– – – – – –
423 416 382 373 359 350
8 296 11 295 10 239 7 603 7 535 11 197
18 235 19 125 31 787 27 736 16 363 15 368
16 576 17 129 18 156 15 896 8 298 9 073
88 277 195 156 57 574
0 0 0 0 0 0
– – – – – –
– – – – – –
19 48 29 25 29 35
1 551 1 672 13 407 11 659 7 979 5 686
863 335 868 105 874 338 875 902 884 450 888 539
27 177 29 869 28 455 28 029 29 914 27 522
– – – – – –
– – – – – –
6 493 7 119 7 324 7 314 7 065 7 281
17 410 19 379 17 811 17 671 19 105 17 215
2 811 2 824 2 875 2 740 2 703 2 512
– – – – – –
30 48 44 41 57 54
434 499 400 264 985 461
6 666 6 641 6 655 6 711 6 467 6 509
5 710 5 671 5 744 5 803 5 561 5 593
947 960 902 901 899 907
– – – – – –
– – – – – –
9 10 9 7 7 9
63 220 62 546 64 184 63 938 62 743 62 748
7 615 8 338 8 588 9 826 9 497 9 737
55 463 54 071 55 455 53 887 53 103 52 870
3 3 3 3 3 3
– – – – – –
138 134 139 222 141 138
575 696 577 653 582 411 583 310 591 527 596 773
13 515 13 289 15 916 15 782 16 063 15 934
557 366 559 305 561 562 562 583 570 183 575 504
2 377 2 453 2 496 2 527 2 743 2 881
368 395 397 422 372 364
2 070 2 211 2 041 1 995 2 165 2 088
2013

Descriptions
Claims on other resident sectors
Securities other than shares
Loans
Financial derivatives
Other accounts receivable
Monetary aggregate M32
Currency in circulation outside deposit-taking corporations
Transferable deposits2
Other financial corporations2
State and local government
Public non-financial corporations
Other non-financial corporations
Other resident sectors
Other deposits
Other financial corporations
State and local government
Public non-financial corporations
Other non-financial corporations
Other resident sectors
Securities other than shares
Other financial corporations
State and local government
Public non-financial corporations
Other non-financial corporations
Other resident sectors
Deposits excluded from monetary aggregate M3
Transferable deposits
Other financial corporations
State and local government
Public non-financial corporations
Other non-financial corporations
Other resident sectors
Other deposits
Other financial corporations
State and local government
Public non-financial corporations
Other non-financial corporations
Other resident sectors
Securities other than shares excluded from monetary aggregate M3
Other financial corporations
State and local government
Public non-financial corporations
Other non-financial corporations
Other resident sectors
Loans
Financial derivatives
Insurance technical reserves
Shares and other equity
Other items (net)
1Deposit-taking corporations survey (including National Bank of Ukraine) – analytical
form of presenting statistical data of deposit-taking corporations (National Bank of
Ukraine and other deposit-taking corporations) that are consolidated into the
generalized categories of assets and liabilities. The survey comprises data on liabilities
of deposit-taking corporations that are included to the monetary aggregates. The
balance sheet identity in Deposit-taking corporations survey (including the National
Bank of Ukraine) reflects the link of monetary aggregate M3 and other items with
claims of deposit-taking corporations on residents and non-residents.
Deposit-taking corporations survey (including National Bank of Ukraine) is based on
sectoral balans sheet for the National Bank of Ukraine and other deposit-taking
corporations (banks), which accords with the methodology of IMF.
2 Updated data for December 2013 and January 2014.
February March April May June July
2013
190 576 191 396 192 633 193 914 193 799 194 987
– – – – – –
188 557 188 751 190 422 191 192 190 359 191 198
– 0 3 18 2 4
2 019 2 645 2 208 2 705 3 438 3 785
788 106 800 908 817 978 821 719 836 489 850 779
201 436 206 076 214 473 213 919 219 908 224 364
186 074 187 975 190 578 194 471 194 632 199 836
6 830 7 899 6 193 6 289 7 128 5 454
– – – – – –
20 076 20 355 20 194 20 815 18 904 18 212
77 457 75 574 75 168 78 142 73 493 82 223
81 711 84 147 89 022 89 225 95 107 93 947
398 012 404 312 410 537 410 889 419 713 424 152
15 051 16 440 15 445 15 504 17 392 16 514
– – – – – –
5 534 5 131 5 487 4 754 5 030 4 135
69 878 72 243 74 958 72 549 73 222 73 942
307 550 310 498 314 647 318 081 324 070 329 561
2 583 2 544 2 390 2 439 2 236 2 427
1 623 1 713 1 548 1 600 1 622 1 623
– – – – – –
8 – – – – –
79 108 55 25 7 8
873 724 787 815 607 796
766 748 1 172 1 084 1 064 1 034
730 708 1 131 1 043 1 023 1 000
– – – – – –
730 708 1 131 1 043 1 023 1 000
– – – – – –
– – – – – –
– – – – – –
36 40 40 41 41 34
– – – – – –
36 40 40 41 41 34
– – – – – –
– – – – – –
0 0 0 0 0 0
– – – – – –
– – – – – –
– – – – – –
– – – – – –
– – – – – –
– – – – – –
2 000 1 223 1 565 1 634 1 631 1 636
6 25 21 23 26 29
– – – – – –
288 939 293 018 279 835 279 969 279 200 282 598
80 923 79 908 78 917 76 840 80 047 77 420
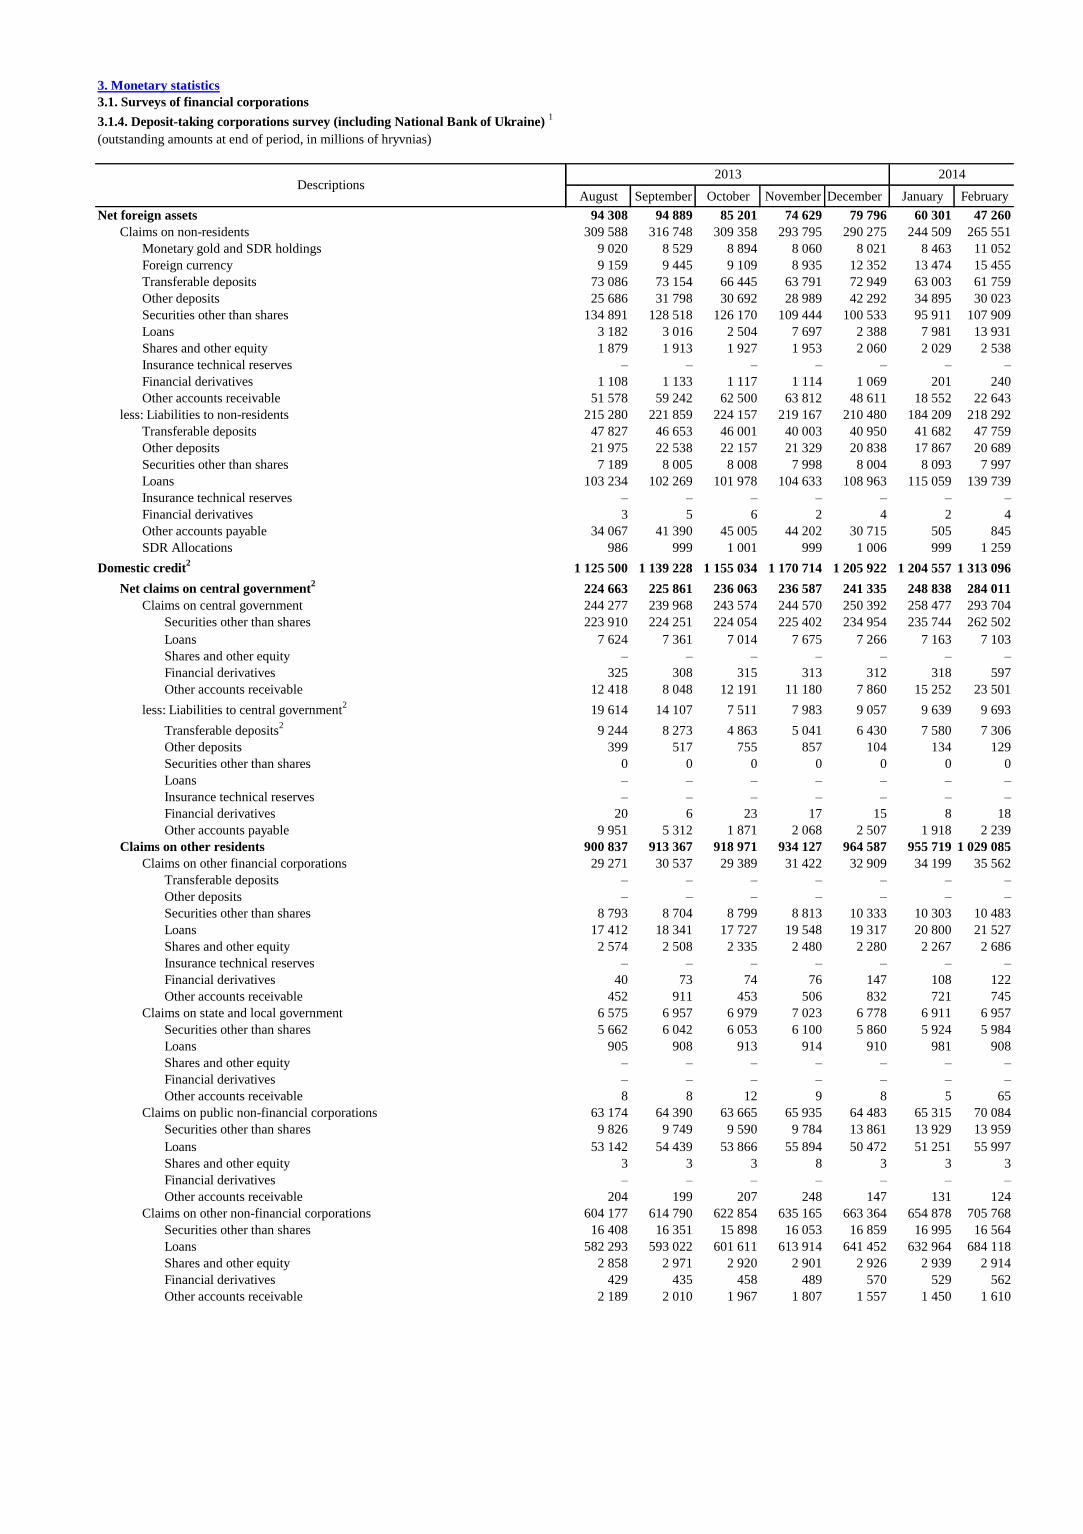
3. Monetary statistics
3.1. Surveys of financial corporations
3.1.4. Deposit-taking corporations survey (including National Bank of Ukraine) 1
(outstanding amounts at end of period, in millions of hryvnias)
Net foreign assets
Claims on non-residents
Monetary gold and SDR holdings
Foreign currency
Transferable deposits
Other deposits
Securities other than shares
Loans
Shares and other equity
Insurance technical reserves
Financial derivatives
Other accounts receivable
less: Liabilities to non-residents
Transferable deposits
Other deposits
Securities other than shares
Loans
Insurance technical reserves
Financial derivatives
Other accounts payable
SDR Allocations
Domestic credit2
Net claims on central government2
Claims on central government
Securities other than shares
Loans
Shares and other equity
Financial derivatives
Other accounts receivable
less: Liabilities to central government2
Transferable deposits2
Other deposits
Securities other than shares
Loans
Insurance technical reserves
Financial derivatives
Other accounts payable
Claims on other residents
Claims on other financial corporations
Transferable deposits
Other deposits
Securities other than shares
Loans
Shares and other equity
Insurance technical reserves
Financial derivatives
Other accounts receivable
Claims on state and local government
Securities other than shares
Loans
Shares and other equity
Financial derivatives
Other accounts receivable
Claims on public non-financial corporations
Securities other than shares
Loans
Shares and other equity
Financial derivatives
Other accounts receivable
Claims on other non-financial corporations
Securities other than shares
Loans
Shares and other equity
Financial derivatives
Other accounts receivable
DescriptionsAugust September October November December January February
94 308 94 889 85 201 74 629 79 796 60 301 47 260
309 588 316 748 309 358 293 795 290 275 244 509 265 551
9 020 8 529 8 894 8 060 8 021 8 463 11 052
9 159 9 445 9 109 8 935 12 352 13 474 15 455
73 086 73 154 66 445 63 791 72 949 63 003 61 759
25 686 31 798 30 692 28 989 42 292 34 895 30 023
134 891 128 518 126 170 109 444 100 533 95 911 107 909
3 182 3 016 2 504 7 697 2 388 7 981 13 931
1 879 1 913 1 927 1 953 2 060 2 029 2 538
– – – – – – –
1 108 1 133 1 117 1 114 1 069 201 240
51 578 59 242 62 500 63 812 48 611 18 552 22 643
215 280 221 859 224 157 219 167 210 480 184 209 218 292
47 827 46 653 46 001 40 003 40 950 41 682 47 759
21 975 22 538 22 157 21 329 20 838 17 867 20 689
7 189 8 005 8 008 7 998 8 004 8 093 7 997
103 234 102 269 101 978 104 633 108 963 115 059 139 739
– – – – – – –
3 5 6 2 4 2 4
34 067 41 390 45 005 44 202 30 715 505 845
986 999 1 001 999 1 006 999 1 259
1 125 500 1 139 228 1 155 034 1 170 714 1 205 922 1 204 557 1 313 096
224 663 225 861 236 063 236 587 241 335 248 838 284 011
244 277 239 968 243 574 244 570 250 392 258 477 293 704
223 910 224 251 224 054 225 402 234 954 235 744 262 502
7 624 7 361 7 014 7 675 7 266 7 163 7 103
– – – – – – –
325 308 315 313 312 318 597
12 418 8 048 12 191 11 180 7 860 15 252 23 501
19 614 14 107 7 511 7 983 9 057 9 639 9 693
9 244 8 273 4 863 5 041 6 430 7 580 7 306
399 517 755 857 104 134 129
0 0 0 0 0 0 0
– – – – – – –
– – – – – – –
20 6 23 17 15 8 18
9 951 5 312 1 871 2 068 2 507 1 918 2 239
900 837 913 367 918 971 934 127 964 587 955 719 1 029 085
29 271 30 537 29 389 31 422 32 909 34 199 35 562
– – – – – – –
– – – – – – –
8 793 8 704 8 799 8 813 10 333 10 303 10 483
17 412 18 341 17 727 19 548 19 317 20 800 21 527
2 574 2 508 2 335 2 480 2 280 2 267 2 686
– – – – – – –
40 73 74 76 147 108 122
452 911 453 506 832 721 745
6 575 6 957 6 979 7 023 6 778 6 911 6 957
5 662 6 042 6 053 6 100 5 860 5 924 5 984
905 908 913 914 910 981 908
– – – – – – –
– – – – – – –
8 8 12 9 8 5 65
63 174 64 390 63 665 65 935 64 483 65 315 70 084
9 826 9 749 9 590 9 784 13 861 13 929 13 959
53 142 54 439 53 866 55 894 50 472 51 251 55 997
3 3 3 8 3 3 3
– – – – – – –
204 199 207 248 147 131 124
604 177 614 790 622 854 635 165 663 364 654 878 705 768
16 408 16 351 15 898 16 053 16 859 16 995 16 564
582 293 593 022 601 611 613 914 641 452 632 964 684 118
2 858 2 971 2 920 2 901 2 926 2 939 2 914
429 435 458 489 570 529 562
2 189 2 010 1 967 1 807 1 557 1 450 1 610
2013 2014

Descriptions
Claims on other resident sectors
Securities other than shares
Loans
Financial derivatives
Other accounts receivable
Monetary aggregate M32
Currency in circulation outside deposit-taking corporations
Transferable deposits2
Other financial corporations2
State and local government
Public non-financial corporations
Other non-financial corporations
Other resident sectors
Other deposits
Other financial corporations
State and local government
Public non-financial corporations
Other non-financial corporations
Other resident sectors
Securities other than shares
Other financial corporations
State and local government
Public non-financial corporations
Other non-financial corporations
Other resident sectors
Deposits excluded from monetary aggregate M3
Transferable deposits
Other financial corporations
State and local government
Public non-financial corporations
Other non-financial corporations
Other resident sectors
Other deposits
Other financial corporations
State and local government
Public non-financial corporations
Other non-financial corporations
Other resident sectors
Securities other than shares excluded from monetary aggregate M3
Other financial corporations
State and local government
Public non-financial corporations
Other non-financial corporations
Other resident sectors
Loans
Financial derivatives
Insurance technical reserves
Shares and other equity
Other items (net)
1Deposit-taking corporations survey (including National Bank of Ukraine) – analytical
form of presenting statistical data of deposit-taking corporations (National Bank of
Ukraine and other deposit-taking corporations) that are consolidated into the
generalized categories of assets and liabilities. The survey comprises data on liabilities
of deposit-taking corporations that are included to the monetary aggregates. The
balance sheet identity in Deposit-taking corporations survey (including the National
Bank of Ukraine) reflects the link of monetary aggregate M3 and other items with
claims of deposit-taking corporations on residents and non-residents.
Deposit-taking corporations survey (including National Bank of Ukraine) is based on
sectoral balans sheet for the National Bank of Ukraine and other deposit-taking
corporations (banks), which accords with the methodology of IMF.
2 Updated data for December 2013 and January 2014.
August September October November December January February
2013 2014
197 640 196 693 196 084 194 582 197 053 194 417 210 713
– – – – – – –
193 390 193 695 194 655 193 159 193 996 192 949 209 098
1 – – – – – –
4 248 2 998 1 429 1 423 3 057 1 468 1 615
856 709 871 546 873 234 880 434 909 074 894 125 934 117
225 226 224 333 227 108 227 807 237 777 235 881 253 072
199 978 203 296 199 543 199 872 198 499 192 776 203 425
5 758 6 758 5 973 6 241 7 260 6 395 7 585
– – – – – – –
17 677 17 529 18 702 17 382 19 536 18 147 22 606
82 313 84 472 80 881 81 581 80 716 80 541 89 454
94 230 94 536 93 986 94 668 90 987 87 693 83 780
428 973 441 134 443 409 449 453 470 040 461 735 473 379
17 324 18 578 17 294 18 199 19 126 18 804 17 706
– – – – – – –
4 321 4 382 3 855 4 571 6 902 4 688 5 793
73 597 78 115 76 193 76 122 88 062 83 215 79 325
333 731 340 059 346 067 350 562 355 951 355 028 370 555
2 531 2 783 3 174 3 302 2 758 3 732 4 240
1 320 1 349 1 388 1 324 936 1 232 1 250
– – – – – – –
– – – 0 0 0 –
7 7 6 116 11 11 5
1 205 1 427 1 779 1 862 1 812 2 490 2 985
1 001 1 061 1 147 1 064 189 195 157
967 1 026 1 112 1 024 150 155 120
– – – – – – –
967 1 026 1 112 1 024 150 155 120
– – – – – – –
– – – – – – –
– – – – – – –
34 35 35 39 39 39 37
– – – – – – –
34 35 35 39 39 39 37
– – – – – – –
– – – – – – –
0 0 0 0 0 – 0
– – – – – – –
– – – – – – –
– – – – – – –
– – – – – – –
– – – – – – –
– – – – – – –
1 594 1 650 1 665 1 708 1 494 1 585 1 668
16 34 17 29 13 15 668
– – – – – – –
279 498 283 285 288 359 288 130 300 224 304 511 330 333
80 989 76 541 75 811 73 978 74 724 64 428 93 413

3. Monetary statistics
3.1. Surveys of financial corporations
total М0 M1–M0
1 2 3 4 5 6 7 8 9 10 11 12 13
2008 515 727 512 527 225 127 154 759 70 369 287 400 3 200 1 922 233 751 10 911 –16 121 778 432
2009 487 298 484 772 233 748 157 029 76 719 251 023 2 526 447 250 931 87 005 16 507 809 174
2010 597 872 596 841 289 894 182 990 106 904 306 947 1 031 208 277 972 100 225 115 732 860 545
2011 685 515 681 801 311 047 192 665 118 382 370 754 3 714 160 289 111 106 544 114 759 966 570
2012 773 199 771 126 323 225 203 245 119 980 447 901 2 072 141 299 326 77 787 114 860 1 035 593
2013
February 788 106 785 522 329 834 201 436 128 398 455 688 2 583 766 288 939 82 929 108 748 1 051 993
March 800 908 798 364 337 461 206 076 131 385 460 903 2 544 748 293 018 81 156 107 065 1 068 766
April 817 978 815 588 349 424 214 473 134 950 466 165 2 390 1 172 279 835 80 503 112 753 1 066 734
May 821 719 819 280 352 252 213 919 138 333 467 027 2 439 1 084 279 969 78 496 105 844 1 075 424
June 836 489 834 253 359 535 219 908 139 627 474 718 2 236 1 064 279 200 81 704 97 757 1 100 701
July 850 779 848 352 367 816 224 364 143 452 480 536 2 427 1 034 282 598 79 085 96 317 1 117 179
August 856 709 854 178 370 150 225 226 144 924 484 027 2 531 1 001 279 498 82 600 94 308 1 125 500
September 871 546 868 763 372 178 224 333 147 845 496 585 2 783 1 061 283 285 78 225 94 889 1 139 228
October 873 234 870 060 370 652 227 108 143 544 499 409 3 174 1 147 288 359 77 494 85 201 1 155 034
November 880 434 877 132 371 800 227 807 143 993 505 332 3 302 1 064 288 130 75 716 74 629 1 170 714
December8
908 994 906 236 383 821 237 777 146 044 522 416 2 758 189 300 224 76 231 79 796 1 205 843
2014
January8
893 947 890 215 376 002 235 881 140 121 514 212 3 732 195 304 511 66 027 60 301 1 204 379
February 934 117 929 877 388 359 253 072 135 287 541 518 4 240 157 330 333 95 749 47 260 1 313 096
transactions7 during the period, in millions of hryvnias
2008 64 910 66 746 43 462 43 640 –178 23 284 –1 836 –1 669 89 843 7 710 –19 520 180 313
2009 –34 401 –33 718 8 621 2 271 6 350 –42 340 –683 –1 475 3 124 72 643 20 242 19 649
2010 113 793 115 287 56 145 25 961 30 185 59 142 –1 495 –238 21 139 11 914 96 542 50 065
2011 88 282 85 598 21 153 9 675 11 478 64 445 2 684 –48 20 379 3 240 4 775 107 077
2012 86 307 87 949 12 179 10 580 1 599 75 771 –1 642 –19 13 836 –30 476 1 429 68 219
20138
134 462 133 783 60 595 34 532 26 064 73 188 678 47 9 417 –4 300 –27 959 167 584
February 9 442 9 066 3 339 3 463 –124 5 727 376 623 1 638 1 840 1 213 12 330
March 13 722 13 760 7 627 4 640 2 987 6 133 –38 –17 4 397 –1 940 –1 373 17 535
April 16 280 16 436 11 962 8 397 3 566 4 473 –155 423 –11 972 –1 362 6 419 –3 050
May 4 341 4 291 2 829 –554 3 383 1 462 50 –87 3 847 –2 309 –3 719 9 511
June 14 788 14 991 7 283 5 989 1 294 7 708 –204 –20 2 179 2 753 –5 395 25 094
July 13 422 13 232 8 281 4 456 3 825 4 951 190 –30 2 859 –2 840 –2 673 16 083
August 5 933 5 828 2 334 862 1 472 3 494 105 –33 –3 389 3 399 –2 400 8 310
September 13 994 13 745 2 027 –893 2 920 11 717 249 60 3 958 –4 897 588 12 527
October 969 580 –1 526 2 775 –4 301 2 107 388 86 4 465 –1 042 –10 699 15 176
November 7 890 7 761 1 149 699 450 6 612 130 –83 785 –1 957 –9 066 15 701
December8
27 876 28 423 12 021 9 970 2 051 16 403 –547 –876 12 780 657 5 855 34 582
2014
January8
–14 159 –15 138 –7 819 –1 896 –5 923 –7 319 979 8 4 444 –10 362 –19 264 –805
February –18 543 –18 530 12 357 17 191 –4 835 –30 886 –14 –53 21 940 19 127 –6 288 28 759
annual growth rates, %
2008 30.2 31.0 23.9 39.3 –0.3 37.1 –34.5 –45.7 134.9 – – 76.9
2009 –5.5 –5.4 3.8 1.5 9.0 –12.7 –21.1 –76.8 7.3 – – 3.9
2010 22.7 23.1 24.0 16.5 39.3 22.3 –59.2 –53.4 10.8 – – 6.3
2011 14.7 14.2 7.3 5.3 10.7 20.8 260.3 –23.3 4.0 – – 12.3
2012 12.8 13.1 3.9 5.5 1.4 20.8 –44.2 –11.8 3.5 – – 7.1
2013
February 16.0 16.2 9.9 8.0 13.1 21.1 –25.4 –54.3 –3.3 – – 8.8
March 15.9 16.0 9.3 9.7 8.8 21.4 –19.4 –59.1 2.3 – – 11.0
April 16.2 17.0 10.6 10.3 11.2 22.3 –64.6 –41.7 –3.0 – – 9.8
May 17.2 17.9 12.3 9.8 16.4 22.5 –60.5 –50.1 1.5 – – 12.0
June 17.8 17.9 12.7 9.8 17.6 22.3 –27.6 –50.1 –0.5 – – 12.1
July 18.0 18.1 13.7 11.4 17.4 21.8 –10.8 –54.7 0.1 – – 14.2
August 18.2 18.2 16.2 12.2 23.0 19.9 –4.7 –58.1 –2.2 – – 14.1
September 19.1 19.2 15.9 12.3 21.9 21.7 5.0 –54.8 –2.6 – – 14.0
October 19.7 19.7 18.5 16.5 21.8 20.6 12.4 –47.8 –2.2 – – 13.4
November 20.8 20.8 23.1 19.3 29.6 19.1 21.4 –48.9 –3.2 – – 13.7
December8
17.6 17.5 18.7 17.0 21.7 16.6 33.1 34.0 0.3 – – 16.4
2014
January8
14.6 14.4 15.2 19.1 9.0 13.9 69.0 35.5 5.9 – – 15.7
February 18.5 18.4 17.7 25.6 5.4 18.8 64.1 –79.6 14.3 – – 24.8
8 Updated data.
4Liabilities of deposit-taking corporations that include funds contributed by owners, retained earnings, current year result, general and special reserves, and valuation
adjustment.5 Net foreign assets mean a balance between claims and liabilities of deposit-taking corporations vis-a-vis non-residents.
Liabilities
excluded
from M3 3
total
7 Transactions are calculating according to the IMF methodology using the following formula: T = CS – OS – VC – OCVA, where T – transactions, OS (opening stock)
– outstanding amounts at the beginning of period, CS (closing stock) – outstanding amounts at end of period, VC – valuation change due to price and/or exchange rate
change, OCVA –other changes in the volume of financial assets.
6Domestic credit includes net claims of deposit-taking corporations on the central government and claims on other sectors of economy. Net claims on the central
government are a balance between claims and liabilities of deposit-taking corporations vis-a-vis central government.
2Monetary aggregates consist of certain liabilities of resident deposit-taking corporations vis-a-vis resident sectors of the economy except general government and other
deposit-taking corporations. 3 Liabilities excluded from M3 are the sum total of transferable and other deposits of state and local government in national and foreign
currencies.
M2
M3–M2
3.1.5. Monetary aggregates1 and counterparts
M3 2
total
Domestic
credit 6
Other
items
(net)M2–M1
Period
Shares
and other
equity 4M1
Net
foreign
assets 5
1 Monetary aggregates are based on the sectoral balance sheets for the National Bank of Ukraine, and other deposit-taking corporations (banks), which accords with the
methodology of IMF.
outstanding amounts at end of period, in millions of hryvnias

3. Monetary statistics
3.1. Surveys of financial corporations
3.1.6. Components of monetary aggregates1
in national
currency
in foreign
currency
in national
currency
in foreign
currency
1 2 3 4 5 6 7 8 9 10 11 12
outstanding amounts at end of period, in millions of hryvnias
2005 194 071 60 231 38 341 9 944 84 629 48 955 35 674 925 766 160 …
2006 261 063 74 984 48 292 13 040 123 098 65 983 57 115 1 650 1 402 248 …
2007 396 156 111 119 70 546 20 233 189 374 119 740 69 634 4 884 4 595 289 …
2008 515 727 154 759 70 369 35 003 252 397 129 888 122 509 3 200 2 763 437 507 214
2009 487 298 157 029 76 719 41 443 209 581 96 867 112 713 2 526 2 310 216 480 175
2010 597 872 182 990 106 904 41 566 265 382 133 014 132 368 1 031 828 203 589 548
2011 685 515 192 665 118 382 51 912 318 843 162 723 156 120 3 714 3 322 391 676 467
2012 773 199 203 245 119 980 56 973 390 928 199 848 191 080 2 072 1 751 321 762 173
2013
February 788 106 201 436 128 398 57 676 398 012 206 432 191 581 2 583 2 243 340 796 291
March 800 908 206 076 131 385 56 590 404 312 214 321 189 991 2 544 2 316 228 802 529
April 817 978 214 473 134 950 55 627 410 537 220 324 190 214 2 390 2 112 278 812 583
May 821 719 213 919 138 333 56 138 410 889 222 109 188 781 2 439 2 140 299 824 517
June 836 489 219 908 139 627 55 005 419 713 230 237 189 477 2 236 1 910 326 831 996
July 850 779 224 364 143 452 56 384 424 152 233 522 190 630 2 427 1 997 430 843 875
August 856 709 225 226 144 924 55 054 428 973 237 133 191 840 2 531 1 977 554 853 272
September 871 546 224 333 147 845 55 451 441 134 244 981 196 153 2 783 2 044 739 870 397
October 873 234 227 108 143 544 55 999 443 409 250 963 192 447 3 174 2 140 1 034 878 997
November 880 434 227 807 143 993 55 879 449 453 257 392 192 061 3 302 2 218 1 084 895 360
December5 908 994 237 777 146 044 52 376 470 040 276 307 193 733 2 758 1 275 1 483 894 834
2014
January5 893 947 235 881 140 121 52 477 461 735 272 812 188 924 3 732 1 647 2 085 898 632
February 934 117 253 072 135 287 68 139 473 379 256 983 216 397 4 240 1 637 2 603 941 181
transactions4 during the period, in millions of hryvnias
2008 64 910 43 640 –178 2 683 20 601 10 148 10 453 –1 836 –1 832 –4 –
2009 –34 401 2 271 6 350 4 632 –46 972 –33 021 –13 952 –683 –453 –230 –
2010 113 793 25 961 30 185 822 58 320 36 147 22 173 –1 495 –1 482 –12 –
2011 88 282 9 675 11 478 10 607 53 838 29 709 24 129 2 684 2 494 190 –
2012 86 307 10 580 1 599 4 649 71 121 37 125 33 997 –1 642 –1 571 –71 –
20135 134 462 34 532 26 064 –4 896 78 084 76 459 1 625 678 –477 1 155 –
February 9 442 3 463 –124 –733 6 460 6 412 49 376 403 –27 –
March 13 722 4 640 2 987 –858 6 991 7 889 –898 –38 74 –111 –
April 16 280 8 397 3 566 –1 145 5 618 6 003 –385 –155 –204 49 –
May 4 341 –554 3 383 663 800 1 785 –985 50 28 22 –
June 14 788 5 989 1 294 –1 105 8 813 8 128 686 –204 –230 27 –
July 13 422 4 456 3 825 1 167 3 785 3 285 500 190 87 103 –
August 5 933 862 1 472 –1 323 4 817 3 612 1 206 105 –20 124 –
September 13 994 –893 2 920 158 11 560 7 848 3 711 249 67 182 –
October 969 2 775 –4 301 359 1 748 5 982 –4 234 388 96 293 –
November 7 890 699 450 76 6 536 6 430 107 130 78 51 –
December5 27 876 9 970 2 051 –3 678 20 080 18 914 1 166 –547 –943 396 –
2014
January5 –14 159 –1 896 –5 923 356 –7 676 –3 495 –4 180 979 372 607 –
February –18 543 17 191 –4 835 2 185 –33 071 –15 829 –17 242 –14 –9 –4 –
annual growth rates, %
monthly
change, %
2008 30.2 39.3 -0.3 73.0 33.3 8.5 75.9 -34.5 -39.9 51.6 –
2009 -5.5 1.5 9.0 18.4 -17.0 -25.4 -8.0 -21.1 -16.4 -50.6 –
2010 22.7 16.5 39.3 0.3 26.6 37.3 17.4 -59.2 -64.2 -6.1 –
2011 14.7 5.3 10.7 24.9 20.1 22.3 17.9 260.3 301.4 92.8 –
2012 12.8 5.5 1.4 9.8 22.6 22.8 22.4 -44.2 -47.3 -18.0 –
2013
February 16.0 8.0 13.1 12.8 22.4 25.9 18.9 -25.4 -26.5 -17.6 1.5
March 15.9 9.7 8.8 18.2 21.9 27.1 16.5 -19.4 -15.1 -46.8 0.8
April 16.2 10.3 11.2 17.4 23.0 29.5 16.2 -64.6 -66.5 -38.6 1.3
May 17.2 9.8 16.4 18.0 23.1 29.8 16.2 -60.5 -62.7 -31.9 1.5
June 17.8 9.8 17.6 16.7 23.0 30.9 14.7 -27.6 -23.9 -43.8 0.9
July 18.0 11.4 17.4 10.4 23.5 33.7 12.9 -10.8 -10.9 -10.4 1.4
August 18.2 12.2 23.0 9.6 21.3 32.0 10.3 -4.7 -10.3 22.7 1.1
September 19.1 12.3 21.9 12.9 22.9 36.5 9.3 5.0 -6.4 58.5 2.0
October 19.7 16.5 21.8 10.9 22.0 40.1 4.3 12.4 -11.6 157.6 1.0
November 20.8 19.3 29.6 15.9 19.5 36.9 2.2 21.4 -6.8 218.0 1.9
December5 17.6 17.0 21.7 -8.1 20.2 38.3 1.4 33.1 -27.2 362.1 -0.1
2014
January5 14.6 19.1 9.0 -10.7 17.6 36.4 -1.9 69.0 -10.5 465.2 0.4
February 18.5 25.6 5.4 18.1 18.9 24.5 13.0 64.1 -27.0 664.5 4.7
5 Updated data.
other deposits
M2–M1
M3
(seasonally
adjusted3)
transferable
deposits in
national
currency
transferable
deposits in
foreign
currency
including
including
M3–M2
securities other than shares
total
1 Monetary aggregates are based on the sectoral balance sheets for the National Bank of Ukraine, and other deposit-taking corporations (banks), which accords with the methodology of IMF.
2 Monetary aggregates consist of certain liabilities of resident deposit-taking corporations vis-a-vis resident sectors of the economy except general government and other deposit-taking
corporations. 3
Seasonal adjustment is carried out by using the DEMETRA+ software (X-12-ARIMA method) and provides for the monthly revision of seasonally adjusted data for previous periods.
4 Transactions are calculating according to the IMF methodology using the following formula: T = CS – OS – VC – OCVA, where T – transactions, OS (opening stock) – outstanding
amounts at the beginning of period, CS (closing stock) – outstanding amounts at end of period, VC – valuation change due to price and/or exchange rate change, OCVA –other changes in
the volume of financial assets.
M32Period
M1
including
total
currency in
circulation
outside
deposit-taking
corporations
(М0)

3. Monetary statistics
3.1. Surveys of financial corporations
3.1.7. Domestic credit
in national
currency
in foreign
currency
in national
currency
in foreign
currency
in national
currency
in foreign
currency
1 2 3 4 5 6 7 8 9 10 11
outstanding amounts at end of period, in millions of hryvnias
2005 146 752 –5 769 –9 990 4 221 152 522 90 095 62 426 143 648 81 348 62 300
2006 248 631 –6 757 –2 576 –4 181 255 388 133 673 121 716 245 475 123 879 121 596
2007 440 027 –3 530 2 529 –6 059 443 557 230 187 213 370 427 128 213 915 213 213
2008 778 432 23 786 21 632 2 154 754 646 320 443 434 203 734 377 300 421 433 956
2009 809 174 72 268 77 956 –5 687 736 905 368 181 368 724 719 163 351 223 367 940
2010 860 545 113 216 133 205 –19 989 747 330 408 578 338 752 725 814 388 329 337 484
2011 966 570 144 613 152 841 –8 228 821 958 497 985 323 973 795 442 472 063 323 379
2012 1 035 593 181 555 167 094 14 461 854 038 553 530 300 508 810 999 511 271 299 728
2013
February 1 051 993 188 657 169 522 19 136 863 335 562 198 301 137 819 743 519 851 299 892
March 1 068 766 200 662 177 000 23 662 868 105 560 778 307 327 822 466 516 837 305 628
April 1 066 734 192 397 164 945 27 451 874 338 566 435 307 902 826 152 519 145 307 007
May 1 075 424 199 523 169 832 29 691 875 902 568 115 307 787 826 234 520 610 305 624
June 1 100 701 216 251 178 452 37 799 884 450 576 659 307 790 833 648 528 117 305 532
July 1 117 179 228 641 188 627 40 014 888 539 578 819 309 720 837 694 530 464 307 230
August 1 125 500 224 663 183 321 41 342 900 837 591 255 309 582 847 142 540 112 307 030
September 1 139 228 225 861 189 238 36 622 913 367 604 827 308 540 860 405 553 995 306 410
October 1 155 034 236 063 194 755 41 308 918 971 610 790 308 181 868 772 561 194 307 578
November 1 170 714 236 587 197 924 38 662 934 127 628 058 306 069 883 429 577 810 305 620
December4
1 205 843 241 255 205 437 35 819 964 587 654 568 310 019 906 148 598 142 308 006
2014
January4
1 204 379 248 660 206 735 41 924 955 719 653 213 302 507 898 946 596 830 302 116
February 1 313 096 284 011 231 589 52 422 1 029 085 644 260 384 825 971 649 587 268 384 381
annual growth rates, %
2005 34.3 – – – 61.0 57.8 65.9 61.7 58.6 66.0
2006 69.4 – – – 67.4 48.4 95.0 70.9 52.3 95.2
2007 77.0 – – – 73.7 72.2 75.3 74.0 72.7 75.3
2008 76.9 – – – 70.1 39.2 103.5 71.9 40.4 103.5
2009 3.9 – – – –2.4 14.9 –15.1 –2.1 16.9 –15.2
2010 6.3 – – – 1.4 11.0 –8.1 0.9 10.6 –8.3
2011 12.3 – – – 10.0 21.9 –4.4 9.6 21.6 –4.2
2012 7.1 – – – 3.9 11.2 –7.2 2.0 8.3 –7.3
2013
February 8.8 – – – 5.2 13.2 –7.1 3.4 10.8 –7.3
March 11.0 – – – 5.5 11.7 –4.2 3.7 9.1 –4.4
April 9.8 – – – 5.9 12.1 –3.9 3.7 8.7 –3.8
May 12.0 – – – 6.5 11.4 –1.5 4.2 8.1 –1.8
June 12.1 – – – 7.1 11.3 0.1 4.7 7.9 –0.4
July 14.2 – – – 7.7 11.8 0.9 5.6 8.8 0.4
August 14.1 – – – 8.5 12.6 1.4 6.2 9.3 1.0
September 14.0 – – – 9.1 13.6 1.2 7.0 10.7 0.8
October 13.4 – – – 9.2 14.1 0.6 7.3 11.3 0.7
November 13.7 – – – 9.4 16.0 –2.0 8.0 13.8 –1.5
December4
16.4 – – – 12.9 18.3 3.2 11.7 17.0 2.8
2014
January4
15.7 – – – 11.6 17.6 0.5 10.5 16.2 0.7
February 24.8 – – – 19.2 14.6 27.8 18.5 13.0 28.2
4 Updated data.
3Claims on other residents include the claims of deposit-taking corporations under the loans, investments in securities etc with regard to other
financial corporations, state and local government, public and private non-financial corporations, other sectors of the economy (households and non-
profit institutions serving households).
1 Domestic credit includes net claims of deposit-taking corporations on the central government and claims on other sectors of economy.
Period
Domestic credit 1
total
including
of which:
loans
granted,
total
liabilities to non-residents
net claims on central government 2
claims on other residents 3
total
including
total
including
2 Net claims on the central government are a balance between claims and liabilities of deposit-taking corporations vis-a-vis central government.

3. Monetary statistics
3.1. Surveys of financial corporations
3.1.8. Net foreign assets
in national
currency
in foreign
currency
in national
currency
in foreign
currency
in national
currency
in foreign
currency
in national
currency
in foreign
currency
in national
currency
in foreign
currency
in national
currency
in foreign
currency1 2 3 4 5 6 7 8 9 10 11 12 13 14 15 16
outstanding amounts at end of period, in millions of hryvnias
2005 81 825 35 124 566 19 118 23 659 94 000 2 110 294 15 916 380 –12 175 33 14 272 3 202 23 278
2006 67 041 62 146 676 18 591 61 106 111 240 2 126 165 14 617 310 –44 199 60 20 511 3 974 60 796
2007 51 443 176 209 075 21 154 136 654 165 325 2 178 640 13 127 189 –113 882 174 30 436 8 027 136 465
2008 –16 121 737 319 767 57 390 279 235 209 994 2 262 796 52 532 271 –226 116 735 56 971 4 857 278 964
2009 16 507 1 090 312 820 71 735 225 667 165 627 2 232 566 65 689 1 252 –149 120 1 088 80 253 6 046 224 415
2010 115 732 1 338 388 855 83 302 191 159 221 411 1 298 193 75 637 1 145 –105 680 1 338 90 661 7 665 190 014
2011 114 759 2 477 379 416 90 007 177 127 199 286 1 276 144 75 690 1 168 –84 528 2 476 103 273 14 317 175 959
2012 114 860 2 951 341 924 68 823 161 192 160 404 1 216 268 54 740 1 125 –45 543 2 950 125 656 14 083 160 067
2013
February 108 748 2 974 332 298 63 263 163 263 167 281 1 216 297 47 995 1 021 –58 534 2 974 116 002 15 268 162 241
March 107 065 2 979 331 451 62 240 165 126 167 834 1 216 405 47 499 1 072 –60 769 2 979 115 046 14 740 164 054
April 112 753 3 005 332 912 64 006 159 157 171 815 1 220 774 47 810 1 150 –59 061 3 004 112 138 16 196 158 007
May 105 844 3 032 318 600 57 056 158 731 172 457 1 215 161 41 683 1 022 –66 613 3 031 103 439 15 373 157 710
June 97 757 3 088 312 649 56 887 161 094 162 309 1 205 186 41 822 1 055 –64 553 3 088 107 463 15 065 160 038
July 96 317 3 039 313 295 57 876 162 141 157 703 1 200 884 42 086 1 096 –61 386 3 039 112 411 15 790 161 045
August 94 308 3 039 306 550 52 106 163 174 155 262 1 192 540 36 276 1 003 –60 954 3 038 114 010 15 830 162 171
September 94 889 3 129 313 619 53 649 168 209 154 858 1 192 687 36 760 1 070 –59 969 3 129 120 931 16 890 167 139
October 85 201 3 140 306 218 52 763 171 394 147 730 1 184 775 35 971 1 075 –62 529 3 139 121 443 16 792 170 319
November 74 629 3 160 290 636 48 146 171 021 139 739 1 170 701 29 930 1 032 –65 110 3 159 119 935 18 216 169 989
December 79 796 2 758 287 517 48 491 161 988 153 111 1 184 270 30 125 1 035 –73 315 2 758 103 247 18 366 160 953
2014
January 60 301 2 259 242 250 46 506 137 703 133 245 1 163 311 29 029 1 038 –72 944 2 258 78 940 17 477 136 665
February 47 260 2 778 262 774 51 871 166 420 140 377 1 176 543 34 889 1 277 –93 118 2 777 86 231 16 982 165 144
annual growth rates, %
2005 – 168.7 61.1 –6.7 100.7 – 63.0 69.3 –19.8 –24.1 – 178.2 16.9 407.1 106.2
2006 – 75.4 17.7 –2.8 158.3 – –0.1 14.4 –8.2 –18.5 – 79.4 43.7 24.1 161.2
2007 – 186.1 42.5 13.8 123.6 – – 41.6 –10.2 –38.9 – 191.5 48.4 102.0 124.5
2008 – 318.6 52.9 171.3 104.3 – –0.2 47.1 300.2 43.1 – 321.8 87.2 –39.5 104.4
2009 – 47.8 –2.2 25.0 –19.2 – 0.0 –11.5 25.0 362.1 – 47.9 40.9 24.5 –19.6
2010 – 22.8 24.3 16.1 –15.3 – -61.5 28.2 15.1 –8.6 – 23.0 13.0 26.8 –15.3
2011 – 85.1 –2.4 8.0 –7.3 – –0.0 –7.4 0.1 2.0 – 85.1 13.9 86.8 –7.4
2012 – 19.1 –9.9 –23.5 –9.0 – 1.3 –21.7 -27.7 –3.7 – 19.1 21.7 –1.6 –9.0
2013
February – 18.2 –13.4 –24.5 –9.4 – – –20.1 -33.4 –3.9 – 18.2 2.7 30.1 –9.5
March – 17.8 –13.6 –25.3 –10.0 – 1.9 –19.8 -33.7 –8.8 – 17.8 1.1 26.4 –10.0
April – 16.0 –13.2 –20.5 –12.0 – –7.5 –19.2 -33.4 –9.9 – 16.0 1.7 85.0 –12.0
May – 17.9 –14.6 –24.3 –12.7 – –9.3 –18.9 -36.3 –1.5 – 17.9 –4.2 54.3 –12.8
June – 32.0 –13.6 –31.0 –7.6 – 0.2 –19.2 -36.2 –6.6 – 32.0 –0.3 –10.8 –7.7
July – 28.7 –15.9 –28.4 –6.9 – 0.4 –22.8 -35.6 –10.3 – 28.7 0.2 2.1 –6.9
August – 30.3 –16.6 –32.7 –6.2 – 1.9 –25.7 -39.6 –5.2 – 30.3 5.1 –9.2 –6.2
September – 20.3 –14.4 –29.8 –4.1 – –2.2 –24.1 -39.6 –8.6 – 20.3 7.6 8.2 –4.0
October – 21.2 –12.4 –29.6 –3.0 – 0.0 –21.2 -40.8 –15.0 – 21.2 5.3 18.3 –2.9
November – 11.7 –11.5 –30.3 –0.8 – –1.3 –23.4 -45.2 –3.4 – 11.7 13.5 25.8 –0.8
December – –6.5 –15.9 –29.5 0.5 – –1.3 –14.8 -45.0 –8.0 – –6.5 –17.8 30.4 0.6
2014
January – –24.1 –30.1 –35.1 –18.8 – –0.1 –24.5 -47.0 –13.8 – –24.1 –39.3 3.9 –18.9
February – –6.6 –20.9 –18.0 1.9 – – –18.4 -27.3 25.0 – –6.6 –25.7 11.2 1.81 Net foreign assets mean a balance between claims and liabilities of deposit-taking corporations vis-a-vis non-residents.
2Claims of deposit-taking corporations on non-residents include claims under foreign currencies, transferable deposits, other deposits, securities other than shares, loans, shares and other equity, financial derivatives, other
accounts receivable. Claims on non-residents include official reserve assets (international reserves).
3 Liabilities to non-residents include transferable deposits, other deposits, securities other than shares, financial derivatives and other accounts payable.
Periodclaims on non-residents liabilities to non-residents claims on non-residents
including
National Bank of Ukraine other deposit-taking corporations
including
including
total
Net foreign assets 1
totalliabilities to non-residents
totalclaims on non-residents
2liabilities to non-residents
3
including

3. Monetary statistics
3.1. Surveys of financial corporations
3.1.9. Official reserve assets
(outstanding amounts at end of period, in millions of US dollar)
foreign currency
reserves
IMF reserve
positionSDRs gold other reserve assets
1 2 3 4 5 6 7
2005 19 391 18 987 0.004 1 403 –
2006 22 358 21 843 0.004 1 513 –
2007 32 479 31 783 0.010 3 693 –
2008 31 543 30 792 0.030 9 743 –
2009 26 505 25 493 0.030 64 948 –
2010 34 576 33 319 0.030 8 1 249 –
2011 31 795 30 391 0.030 18 1 385 –
2012 24 546 22 647 0.030 9 1 890 –
2013
February 24 710 22 839 0.030 10 1 861 –
March 24 729 22 865 0.030 10 1 854 –
April 25 242 23 469 0.030 62 1 710 –
May 24 542 22 889 0.030 14 1 638 –
June 23 245 21 698 0.030 14 1 533 –
July 22 720 21 015 0.030 51 1 654 –
August 21 656 19 768 0.030 15 1 872 –
September 21 640 19 859 0.030 15 1 765 –
October 20 633 18 792 0.030 39 1 803 –
November 18 812 17 133 0.030 16 1 663 –
December 20 416 18 760 0.030 16 1 640 –
2014
January 17 806 16 070 0.030 31 1 704 –
February 15 462 13 637 0.030 16 1 809 –1
Official reserve assets are claims on non-residents in convertible foreign currencies.
includingPeriod
total
Official reserve assets 1

3. Monetary statistics
3.1. Surveys of financial corporations
3.1.10. Sectoral balance sheet for other financial corporations1
1. Assets
A 1 2 3 3.1 3.2 3.3 3.4 3.5 3.6 3.7 3.8 3.9 4 5 6 7 8 9 10
outstanding amounts at end of period, in millions of hryvnias
2008 136 19 305 51 189 – 366 523 462 51 – 49 746 40 – 21 082 46 696 3 499 155 54 126 8 877 205 064
2009
1 quarter 88 17 865 50 842 – 349 557 532 47 – 49 308 49 – 19 896 53 272 2 941 65 47 798 8 321 201 088
2 quarter 133 16 965 52 203 – 389 584 671 44 – 50 457 58 – 19 284 49 240 2 778 27 60 618 10 246 211 494
3 quarter 125 16 970 58 387 – 359 627 716 40 – 56 577 67 – 19 398 46 254 2 479 5 70 528 11 533 225 679
4 quarter 149 16 370 60 150 – 264 646 1 180 37 – 57 948 76 – 18 067 49 173 3 068 5 80 642 10 251 237 874
2010
1 quarter 272 17 972 63 677 – 218 661 1 403 29 – 61 280 86 – 16 021 51 978 2 965 5 81 837 9 583 244 310
2 quarter 197 17 307 62 518 – 335 683 1 391 35 – 59 978 96 – 16 024 54 380 2 891 6 92 185 10 297 255 806
3 quarter 173 17 827 63 211 – 212 683 1 799 33 – 60 386 97 – 16 102 56 018 3 175 6 93 149 10 624 260 284
4 quarter 138 19 577 63 249 – 194 651 2 155 32 – 60 130 86 – 18 115 58 778 3 940 8 104 943 11 189 279 938
2011
1 quarter 204 20 661 61 578 – 1 174 679 1 385 28 – 58 224 88 – 16 823 60 533 4 235 9 128 852 11 351 304 247
2 quarter 236 24 983 58 740 – 1 870 701 1 508 44 – 54 532 86 – 16 337 61 951 3 145 6 126 649 11 520 303 568
3 quarter 183 23 979 62 459 – 1 781 692 1 696 42 – 58 159 89 – 16 921 64 411 2 418 5 113 856 11 421 295 653
4 quarter 217 22 194 65 074 – 2 347 779 1 778 28 – 60 044 98 – 21 468 67 446 1 647 6 120 796 12 746 311 594
2012
1 quarter 191 20 842 65 656 – 1 696 1 033 1 836 25 – 60 967 98 – 24 771 65 514 1 336 5 119 424 12 520 310 259
2 quarter 202 19 554 69 896 – 1 669 909 2 250 26 – 64 955 87 – 21 763 69 346 1 396 12 127 360 12 587 322 117
3 quarter 199 19 669 70 620 – 1 713 866 2 780 22 – 65 152 87 – 22 451 72 788 1 352 5 129 477 12 623 329 184
4 quarter 280 21 282 81 536 – 1 300 1 008 3 095 16 – 76 073 45 – 20 610 80 889 1 906 8 151 935 13 267 371 712
2013
1 quarter 345 24 339 80 736 – 1 713 1 661 2 976 22 – 74 338 27 – 19 695 80 836 2 499 13 154 101 13 464 376 028
2 quarter 360 24 520 78 655 – 1 622 1 394 3 066 19 – 72 530 23 – 21 005 83 310 2 745 22 150 849 13 988 375 453
3 quarter 430 25 336 82 078 – 1 349 1 729 2 783 14 – 76 177 25 – 22 081 89 750 2 836 76 164 074 14 785 401 447
transactions and other changes in assets2 over period, in millions of hryvnias
2009 13 –3 211 8 962 – –102 122 718 –14 – 8 201 36 – –3 030 2 476 –431 1 26 655 1 374 32 809
1 quarter –48 –1 386 –346 – –17 34 69 –3 – –438 9 – –1 172 6 575 –558 0 –6 486 –556 –3 977
2 quarter 45 –918 1 361 – 40 26 140 –3 – 1 149 9 – –621 –4 031 –163 0 12 809 1 924 10 406
3 quarter –7 –322 6 183 – –30 43 45 –4 – 6 120 9 – 92 –2 987 –298 0 10 237 1 288 14 186
4 quarter 23 –584 1 763 – –95 19 464 –4 – 1 371 9 – –1 329 2 919 588 0 10 096 –1 282 12 195
2010 –10 3 236 3 099 – –70 5 975 –4 – 2 183 10 – 59 9 606 872 3 24 261 938 42 064
1 quarter 124 1 679 3 526 – –46 15 223 –8 – 3 333 10 – –2 035 2 805 –103 1 1 106 –668 6 436
2 quarter –76 –600 –1 159 – 117 22 –12 7 – –1 303 10 – 18 2 402 –74 1 10 270 714 11 497
3 quarter –24 433 693 – –123 0 409 –2 – 408 1 – 62 1 638 284 – 1 064 326 4 477
4 quarter –34 1 724 38 – –18 –33 356 –1 – –256 –10 – 2 014 2 761 765 1 11 820 566 19 654
2011 78 2 592 1 825 – 2 153 128 –377 –4 – –86 11 – 3 358 8 667 –2 293 –3 15 874 1 557 31 656
1 quarter 65 1 035 –1 671 – 980 28 –771 –4 – –1 906 1 – –1 299 1 754 295 –1 23 968 162 24 309
2 quarter 32 4 290 –2 838 – 695 22 123 15 – –3 692 –2 – –490 1 419 –1 091 –1 –2 169 168 –679
3 quarter –53 –974 3 719 – –89 –10 188 –1 – 3 627 3 – 592 2 460 –727 –0 –12 832 –98 –7 915
4 quarter 34 –1 758 2 615 – 566 87 83 –14 – 1 885 9 – 4 554 3 035 –771 –0 6 907 1 325 15 941
2012 63 –942 16 462 – –1 048 229 1 317 –12 – 16 029 –53 – –861 13 444 259 –0 31 175 520 60 119
1 quarter –25 –1 384 581 – –651 254 58 –2 – 923 0 – 3 298 –1 932 –311 –0 –1 336 –226 –1 335
2 quarter 11 –1 249 4 241 – –27 –124 413 1 – 3 988 –11 – –2 999 3 832 60 –0 7 896 67 11 858
3 quarter –3 80 724 – 45 –42 531 –5 – 196 –0 – 684 3 442 –44 –0 2 148 36 7 068
4 quarter 80 1 611 10 916 – –414 142 315 –6 – 10 922 –42 – –1 845 8 101 554 0 22 466 643 42 528
2013
1 quarter 66 3 084 –801 – 414 653 –119 6 – –1 735 –18 – –911 –53 592 –2 2 143 198 4 315
2 quarter 15 216 –2 081 – –92 –266 90 –2 – –1 807 –4 – 1 308 2 474 246 6 –3 282 524 –575
3 quarter 70 780 3 423 – –272 335 –284 –5 – 3 647 2 – 1 071 6 440 92 42 13 279 797 25 994
2 Transactions and other changes are calculating as as a difference between the outstanding amounts at the beginnind of period and at the end of period. For deposit-taking corporations data on transactions from the sectoral balanse sheets for
deposit-taking corporations are used.
1 Comprise data of insurance corporations, non-state pension funds and, collective investment insitutions (unit and corporate investment funds), credit unions, other credit institutions, financial companies, legal entities involved in financial
leasing services, pawnshops and financial auxiliaries. Calculations and estimates of the National Bank of Ukraine.
Period Currency Deposits
Securities
other than
shares
including
LoansPublic
nonfinancial
corporations
Other
nonfinancial
corporations
Other
resident
sectors
Nonresidents
Shares and
other equity
Insurance
technical
reserves
Financial
derivatives
Other
accounts
receivable
Nonfinancial
assetsTotal assets
Central bank
Other
depository
corporations
Other
financial
corporations
Central
government
State and
local
government

A
2008
2009
1 quarter
2 quarter
3 quarter
4 quarter
2010
1 quarter
2 quarter
3 quarter
4 quarter
2011
1 quarter
2 quarter
3 quarter
4 quarter
2012
1 quarter
2 quarter
3 quarter
4 quarter
2013
1 quarter
2 quarter
3 quarter
2009
1 quarter
2 quarter
3 quarter
4 quarter
2010
1 quarter
2 quarter
3 quarter
4 quarter
2011
1 quarter
2 quarter
3 quarter
4 quarter
2012
1 quarter
2 quarter
3 quarter
4 quarter
2013
1 quarter
2 quarter
3 quarter
Period
2. Liabilities
11 12 13 14 14.1 14.2 14.3 15 16 17 18
outstanding amounts at end of period, in millions of hryvnias
4 255 6 076 9 789 11 519 1 609 609 9 300 196 60 360 112 871 205 064
3 431 6 182 12 696 10 374 1 588 658 8 128 68 51 373 116 964 201 088
3 435 7 245 13 857 10 354 1 604 731 8 019 18 59 589 116 996 211 494
3 350 6 693 14 530 10 166 1 707 796 7 662 2 67 450 123 489 225 679
3 349 8 176 14 014 11 003 1 789 855 8 360 0 74 013 127 319 237 874
2 326 7 965 13 526 10 369 1 847 936 7 585 0 69 794 140 330 244 310
2 051 8 977 12 253 10 379 1 903 982 7 494 0 76 322 145 825 255 806
2 456 9 527 13 425 11 190 2 041 1 048 8 101 0 73 711 149 974 260 284
2 146 10 006 13 430 12 540 2 185 1 141 9 215 15 80 063 161 737 279 938
1 652 9 762 13 534 12 661 2 289 1 219 9 153 17 102 713 163 908 304 247
1 371 9 182 12 895 12 419 2 417 1 263 8 739 19 95 127 172 554 303 568
1 387 8 795 15 302 12 546 2 526 1 304 8 716 24 85 369 172 229 295 653
1 298 7 989 16 441 13 088 2 664 1 385 9 040 22 84 859 187 897 311 594
1 349 9 571 37 142 12 730 2 777 1 465 8 488 30 60 530 188 907 310 259
1 347 10 209 36 650 12 955 2 869 1 518 8 568 31 64 634 196 291 322 117
1 390 10 224 35 827 13 675 3 022 1 546 9 108 3 63 759 204 306 329 184
1 404 17 998 32 746 14 809 3 223 1 658 9 929 3 78 427 226 325 371 712
1 370 19 997 29 771 15 079 3 352 1 730 9 997 48 83 244 226 518 376 028
1 421 18 826 27 717 15 781 3 485 1 829 10 467 57 82 540 229 110 375 453
1 491 22 710 27 792 16 319 3 669 1 931 10 718 73 86 460 246 602 401 447
transactions and other changes in assets2 over period, in millions of hryvnias
–906 2 140 4 145 –515 180 245 –941 – 13 497 14 448 32 809
–824 187 2 965 –1 144 –21 49 –1 172 – –9 253 4 093 –3 977
4 1 003 1 161 –21 15 73 –109 – 8 226 33 10 406
–85 –523 517 –188 103 65 –356 – 7 972 6 492 14 186
–1 1 473 –497 838 82 58 697 – 6 552 3 830 12 195
–1 203 1 783 –566 1 537 396 286 855 – 6 095 34 419 42 064
–1 023 –177 –427 –635 58 82 –774 – –4 313 13 011 6 436
–275 929 –1 208 10 56 45 –91 – 6 546 5 494 11 497
405 569 1 069 811 139 66 607 – –2 526 4 149 4 477
–310 461 0 1 350 144 93 1 113 – 6 389 11 764 19 654
–848 –2 030 2 991 548 479 244 –175 – 4 837 26 159 31 656
–494 –248 65 120 104 78 –62 – 22 695 2 171 24 309
–281 –596 –658 –242 128 44 –414 – –7 549 8 646 –679
16 –385 2 439 127 109 40 –23 – –9 787 –326 –7 915
–89 –802 1 145 542 138 81 323 – –523 15 668 15 941
106 9 983 16 301 1 721 559 273 889 – –6 419 38 428 60 119
51 1 577 20 695 –358 113 80 –552 – –24 310 1 011 –1 335
–2 616 –478 225 92 53 80 – 4 113 7 384 11 858
44 35 –830 720 152 28 540 – –915 8 014 7 068
14 7 755 –3 086 1 134 201 111 821 – 14 693 22 019 42 528
–34 2 008 –2 969 270 129 73 68 – 4 846 194 4 315
51 –1 166 –2 058 702 134 99 469 – –695 2 592 –575
69 3 799 66 538 184 102 252 – 4 029 17 492 25 994
2 Transactions and other changes are calculating as as a difference between the outstanding amounts at the beginnind of period and at the end of period. For deposit-taking corporations data on transactions
from the sectoral balanse sheets for deposit-taking corporations are used.
1 Comprise data of insurance corporations, non-state pension funds and, collective investment insitutions (unit and corporate investment funds), credit unions, other credit institutions, financial companies, legal
entities involved in financial leasing services, pawnshops and financial auxiliaries. Calculations and estimates of the National Bank of Ukraine.
DepositsSecurities other than
sharesLoans
Insurance technical
reserves
including
Financial derivativesNet equity of
households in life
insurance reserves
Net equity of
households in
pension funds
Prepayment of
premiums and
reserves against
outstanding claims
Other accounts
receivable
Shares and other
equityTotal liabilities

3. Monetary statistics
3.1. Surveys of financial corporations
3.1.11. Other financial corporations survey1
(outstanding amounts at end of period, in millions of hryvnias)
1 quarter 2 quarter 3 quarter 4 quarter
Net foreign assets 2 195 3 528 5 982 4 518 4 281 4 710 2 903
Claims on non-residents 2 227 8 675 11 592 9 858 9 488 8 060 7 178
less: Liabilities to non-residents 32 5 147 5 610 5 339 5 207 3 350 4 276
Claims on deposit-taking corporations 22 036 18 562 21 471 23 824 28 928 27 924 27 108
Holdings of national currency 136 149 138 204 236 183 217
Transferable deposits 4 147 5 637 6 726 7 401 6 839 6 003 6 131
Other deposits 15 158 10 734 12 851 13 260 18 144 17 976 16 062
Securities other than shares 366 264 194 1 174 1 870 1 781 2 347
Loans 1 468 1 310 1 053 1 204 1 362 1 413 1 738
Shares and other equity 269 255 272 303 295 328 306
Financial derivatives 151 0 0 3 1 0 1
Other accounts receivable 340 214 236 275 182 240 306
Net claims on central government 452 1 230 2 225 1 871 1 782 1 847 2 199
Claims on central government 598 1 399 2 414 2 035 1 985 2 062 2 445
Securities other than shares 462 1 180 2 155 1 385 1 508 1 696 1 778
Other accounts receivable 135 219 259 650 478 366 666
less: Liabilities to central government 145 169 189 163 203 215 245
Other accounts payable 145 169 189 163 203 215 245
Claims on other residents 137 531 156 573 173 227 178 166 174 484 178 074 188 445
Claims on state and local government 51 37 32 28 44 42 28
Securities other than shares 51 37 32 28 44 42 28
Claims on public non-financial corporations – – – – – – –
Claims on other non-financial corporations 126 666 148 233 166 005 172 255 168 993 172 288 181 841
Securities other than shares 49 746 57 948 60 130 58 224 54 532 58 159 60 044
Loans 8 840 8 530 9 958 9 824 9 613 9 853 13 252
Shares and other equity 46 050 48 560 58 125 59 804 61 244 63 624 66 711
Financial derivatives 4 5 7 6 6 5 5
Other accounts receivable 22 026 33 191 37 784 44 396 43 598 40 648 41 829
Claims on other resident sectors 10 814 8 303 7 190 5 883 5 448 5 744 6 576
Securities other than shares 40 76 86 88 86 89 98
Loans 10 774 8 227 7 103 5 795 5 362 5 655 6 478
Deposits 4 255 3 349 2 146 1 652 1 371 1 387 1 298
Securities other than shares 5 520 7 499 9 327 9 053 8 448 8 072 7 175
Loans 9 789 14 014 13 430 13 534 12 895 15 302 16 441
Financial derivatives 196 0 15 17 19 24 22
Deposit-taking corporations 196 0 15 17 19 24 22
Insurance technical reserves 8 647 8 584 9 470 9 455 10 299 11 267 12 232
Net equity of households in life insurance reserves 1 609 1 789 2 185 2 289 2 417 2 526 2 664
Net equity of households in pension funds 609 855 1 141 1 219 1 263 1 304 1 385Prepayment of premiums and reserves against outstanding
claims
6 429 5 941 6 145 5 947 6 619 7 438 8 183
Shares and other equity 112 871 127 319 161 737 163 908 172 554 172 229 187 897
Other items (net) 20 937 19 127 6 780 10 761 3 889 4 273 -4 4101
Other financial corporations survey – analytical form of
presenting statistical data of other financial corporations
(excluding deposit-taking corporations) that are consolidated
into the generalized categories of assets and liabilities. Other
financial corporations survey is based on sectoral balans sheet
for other financial corporations according to the methodology
of IMF.
2011Descriptions 2008 2009 2010

3. Monetary statistics
3.1. Surveys of financial corporations
3.1.11. Other financial corporations survey1
(outstanding amounts at end of period, in millions of hryvnias)
Net foreign assets
Claims on non-residents
less: Liabilities to non-residents
Claims on deposit-taking corporations
Holdings of national currency
Transferable deposits
Other deposits
Securities other than shares
Loans
Shares and other equity
Financial derivatives
Other accounts receivable
Net claims on central government
Claims on central government
Securities other than shares
Other accounts receivable
less: Liabilities to central government
Other accounts payable
Claims on other residents
Claims on state and local government
Securities other than shares
Claims on public non-financial corporations
Claims on other non-financial corporations
Securities other than shares
Loans
Shares and other equity
Financial derivatives
Other accounts receivable
Claims on other resident sectors
Securities other than shares
Loans
Deposits
Securities other than shares
Loans
Financial derivatives
Deposit-taking corporations
Insurance technical reserves
Net equity of households in life insurance reserves
Net equity of households in pension funds
Prepayment of premiums and reserves against outstanding
claims
Shares and other equity
Other items (net)1
Other financial corporations survey – analytical form of
presenting statistical data of other financial corporations
(excluding deposit-taking corporations) that are consolidated
into the generalized categories of assets and liabilities. Other
financial corporations survey is based on sectoral balans sheet
for other financial corporations according to the methodology
of IMF.
Descriptions1 quarter 2 quarter 3 quarter 4 quarter 1 quarter 2 quarter 3 quarter
-14 942 -13 515 -11 771 -7 424 -1 637 -3 353 745
7 981 8 875 10 174 12 470 12 173 9 028 12 208
22 923 22 390 21 946 19 895 13 810 12 381 11 463
25 675 23 415 23 944 25 418 28 024 29 297 29 405
191 199 199 279 344 358 427
6 495 5 872 5 572 5 838 7 899 7 128 6 758
14 347 13 682 14 097 15 445 16 440 17 392 18 578
1 696 1 669 1 713 1 300 1 713 1 622 1 349
1 757 1 567 1 964 2 021 1 223 1 631 1 650
248 251 236 235 235 254 262
1 8 1 3 10 13 25
941 167 163 298 159 900 354
2 228 2 622 3 150 3 380 3 547 3 613 3 420
2 447 2 859 3 392 3 636 3 649 3 738 3 577
1 836 2 250 2 780 3 095 2 976 3 066 2 783
611 609 612 541 673 672 795
219 237 242 256 101 125 158
219 237 242 256 101 125 158
186 776 196 006 199 245 221 197 220 625 218 185 225 430
25 26 22 16 22 19 14
25 26 22 16 22 19 14
– – – – – – –
179 944 189 076 193 046 214 576 214 346 211 557 218 840
60 967 64 955 65 152 76 073 74 338 72 530 76 177
16 305 13 380 14 397 12 028 12 241 12 788 13 874
64 709 68 549 72 021 79 988 80 003 82 103 82 454
4 4 4 5 3 9 51
37 959 42 188 41 472 46 482 47 761 44 127 46 284
6 806 6 904 6 178 6 606 6 257 6 610 6 576
98 87 87 45 27 23 25
6 709 6 816 6 091 6 560 6 230 6 587 6 551
1 349 1 347 1 390 1 404 1 370 1 421 1 491
8 442 9 273 9 339 16 961 18 287 17 403 20 946
17 924 18 197 18 199 16 229 19 379 19 105 20 004
30 31 3 3 48 57 73
30 31 3 3 48 57 73
12 212 12 418 13 192 14 309 13 718 14 475 14 949
2 777 2 869 3 022 3 223 3 352 3 485 3 669
1 465 1 518 1 546 1 658 1 730 1 829 1 931
7 970 8 030 8 624 9 429 8 636 9 161 9 349
188 907 196 291 204 306 226 325 226 518 229 110 246 602
-29 126 -29 028 -31 862 -32 660 -28 761 -33 829 -45 065
20132012

3. Monetary statistics
3.1. Surveys of financial corporations
3.1.12. Financial corporations survey1
(outstanding amounts at end of period, in millions of hryvnias)
1 quarter 2 quarter 3 quarter 4 quarter
Net foreign assets -13 926 20 035 121 714 133 028 156 121 135 106 117 661
Claims on non-residents 322 731 322 584 401 785 431 758 442 189 414 784 389 071
less: Liabilities to non-residents 336 657 302 549 280 071 298 730 286 068 279 677 271 410
Domestic credit 900 508 947 513 1 016 462 1 029 672 1 067 237 1 094 843 1 134 556
Net claims on central government 24 238 73 498 115 441 103 363 117 168 116 980 146 812
Claims on central government 42 483 87 804 145 377 135 100 157 398 151 585 165 199
less: Liabilities to central government 18 245 14 306 29 937 31 736 40 230 34 605 18 387
Claims on other residents 876 270 874 014 901 021 926 309 950 070 977 863 987 744
Claims on state and local government 541 1 944 2 012 1 996 2 045 2 340 2 350
Claims on public non-financial corporations 37 855 44 830 50 145 52 362 54 915 58 261 61 424
Claims on other non-financial corporations 580 350 656 964 712 806 729 203 736 055 749 941 773 368
Claims on other resident sectors 234 053 218 241 198 571 196 690 194 562 197 140 200 375
Currency in circulation outside financial
corporations 154 623 156 881 182 851 179 325 187 466 189 726 192 448
Deposits 344 639 315 168 396 628 421 306 439 430 448 648 468 400
Securities other than shares 5 655 6 291 6 680 6 945 6 532 6 268 5 562
Loans – – – – – – –
Financial derivatives 139 24 18 13 22 11 12
Insurance technical reserves 8 647 8 584 9 470 9 455 10 299 11 267 12 232
Shares and other equity 346 622 378 249 439 710 434 129 458 010 456 337 477 007
Other items (net) 26 256 102 350 102 817 111 527 121 599 117 692 96 5551
Financial corporations survey – analytical
form of presenting statistical data of financial
corporations that are consolidated into the
generalized categories of assets and liabilities.
Financial corporations survey comprises data of
sectoral balance sheets for the National bank of
Ukraine, other deposit-taking corporations
(excluding National bank of Ukraine) and other
financial corporations according to the
metodology of IMF.
2009 2010Descriptions 20082011

3. Monetary statistics
3.1. Surveys of financial corporations
3.1.12. Financial corporations survey1
(outstanding amounts at end of period, in millions of hryvnias)
Net foreign assets
Claims on non-residents
less: Liabilities to non-residents
Domestic credit
Net claims on central government
Claims on central government
less: Liabilities to central government
Claims on other residents
Claims on state and local government
Claims on public non-financial corporations
Claims on other non-financial corporations
Claims on other resident sectors
Currency in circulation outside financial
corporations
Deposits
Securities other than shares
Loans
Financial derivatives
Insurance technical reserves
Shares and other equity
Other items (net)1
Financial corporations survey – analytical
form of presenting statistical data of financial
corporations that are consolidated into the
generalized categories of assets and liabilities.
Financial corporations survey comprises data of
sectoral balance sheets for the National bank of
Ukraine, other deposit-taking corporations
(excluding National bank of Ukraine) and other
financial corporations according to the
metodology of IMF.
Descriptions1 quarter 2 quarter 3 quarter 4 quarter 1 quarter 2 quarter 3 quarter
104 280 93 856 105 403 107 436 105 428 94 404 95 634
393 960 373 135 379 141 357 346 346 603 324 765 328 956
289 680 279 280 273 738 249 910 241 175 230 362 233 322
1 128 168 1 156 241 1 176 661 1 234 213 1 263 069 1 292 585 1 337 540
142 446 158 798 164 747 184 934 204 209 219 864 229 280
166 027 178 529 187 251 194 347 223 435 236 352 243 545
23 581 19 731 22 505 9 413 19 226 16 488 14 265
985 722 997 443 1 011 914 1 049 279 1 058 860 1 072 721 1 108 260
2 523 2 509 2 427 6 780 6 663 6 486 6 971
60 333 60 772 62 508 65 141 62 546 62 743 64 390
794 734 189 076 193 046 214 576 214 346 211 557 218 840
203 500 6 904 6 178 6 606 6 257 6 610 6 576
187 722 200 157 199 557 202 966 205 732 219 550 223 906
482 571 490 867 513 398 548 143 570 066 592 310 621 645
6 838 7 684 7 301 11 428 11 999 10 953 13 676
– – – – – – 1 663
4 6 7 64 15 13 9
12 212 12 418 13 192 14 309 13 718 14 475 14 949
475 278 476 774 495 161 525 651 519 537 508 310 529 887
67 823 62 190 53 449 39 088 47 430 41 377 27 440
20132012

3. Monetary Statistics
3.2. Deposits held with deposit-taking corporations (excluding National Bank of Ukraine)
3.2.1. Deposits by resident sectors (excluding deposit-taking corporations)
3.2.1.1. Deposits by resident sectors
3.2.1.2. Deposits by resident sectors by type of currencies and original maturity
3.2.2. Deposits by other financial corporations
3.2.2.1. Deposits by other financial corporations, breakdown by agreed maturity
3.2.2.2. Deposits by other financial corporations, breakdown by currencies
3.2.2.3. Deposits by other financial corporations, breakdown by type of deposits and currencies
3.2.3. Deposits by non-financial corporations
3.2.3.1. Deposits by non-financial corporations, breakdown by agreed maturity
3.2.3.2. Deposits by non-financial corporations, breakdown by currencies
3.2.3.3. Deposits by non-financial corporations, breakdown by type of deposits and currencies
3.2.3.4. Deposits by non-financial corporations, breakdown by type of industry, currencies and agreed maturity
3.2.3.5. Deposits by non-financial corporations, breakdown by type of industry, type of deposits and currencies
3.2.3.6. Deposits by non-financial corporations, in foreign currency, breakdown by type of industry, currencies and agreed maturity
3.2.4. Deposits by households
3.2.4.1. Deposits by households, breakdown by type of currencies and agreed maturity
3.2.4.2. Deposits by households, breakdown by currencies
3.2.5. Deposits by other deposit-taking corporations
3.2.5.1. Deposits by other deposit-taking corporations, breakdown by type of currencies and maturity
3.2.5.2. Deposits by other deposit-taking corporations, in foreign currency, breakdown by currencies and maturity
3.2.6. Deposits by non-residents
3.2.6.1. Deposits by non-residents, breakdown by type of currencies and maturity
3.2.6.2. Deposits by non-residents, in foreign currency, breakdown by currencies and maturity

3. Monetary Statistics
3.2. Deposits held with deposit-taking corporations (excluding National Bank of Ukraine)
3.2.1. Deposits by resident sectors (excluding deposit-taking corporations)
3.2.1.1. Deposits by resident sectors
insurance
corporations
and pension
funds
other financial
intermediaries
and financial
auxiliaries
central
government
state and
local
government
public non-
financial
corporations
other non-
financial
corporations
households
non-profit
institutions
serving
households
1 2 3 4 5 6 7 8 9 10 11 12 13 14
outstanding amounts at end of period, in millions of hryvnias
2005 134 754 6 129 … … 2 010 284 1 726 50 976 8 862 42 114 75 640 74 778 862
2006 185 917 8 741 4 063 4 679 1 682 266 1 417 65 614 6 976 58 638 109 879 108 860 1 020
2007 283 875 15 343 7 043 8 300 4 136 601 3 536 95 583 9 275 86 308 168 813 167 239 1 575
2008 359 740 19 305 8 537 10 768 2 536 615 1 921 118 188 12 281 105 907 219 711 217 860 1 851
2009 334 953 15 621 7 477 8 144 8 586 8 140 446 94 796 12 319 82 477 215 949 214 098 1 851
2010 416 650 19 022 8 169 10 854 4 132 3 924 208 116 105 13 952 102 153 277 390 275 093 2 298
2011 491 756 21 799 9 887 11 912 3 894 3 734 160 153 120 17 964 135 155 312 943 310 390 2 553
2012 572 342 20 852 11 084 9 769 5 929 5 788 141 173 319 27 229 146 090 372 241 369 264 2 977
2013
January 583 652 22 132 9 189 12 943 5 206 5 063 144 175 124 26 463 148 661 381 189 377 817 3 373
February 588 728 21 598 9 106 12 492 5 996 5 230 766 172 900 25 610 147 290 388 233 384 768 3 466
March 597 084 24 111 10 989 13 122 6 125 5 376 748 173 263 25 486 147 777 393 586 390 185 3 401
April 606 107 21 342 9 228 12 114 6 396 5 224 1 172 175 777 25 681 150 096 402 592 399 055 3 537
May 609 991 21 524 9 266 12 258 6 046 4 961 1 084 176 235 25 569 150 666 406 187 402 599 3 589
June 618 397 24 256 11 397 12 859 5 484 4 420 1 064 170 630 23 934 146 696 418 026 414 384 3 642
July 628 374 21 639 9 641 11 998 5 912 4 878 1 034 178 499 22 347 156 152 422 324 418 708 3 616
August 632 899 22 822 9 925 12 897 5 414 4 413 1 001 177 899 21 998 155 901 426 764 422 980 3 785
September 648 566 25 114 12 218 12 895 5 565 4 504 1 061 184 489 21 911 162 578 433 399 429 600 3 799
October 647 698 23 022 9 737 13 285 6 206 5 058 1 147 179 632 22 558 157 074 438 839 435 004 3 835
November 653 418 24 220 9 693 14 528 5 615 4 552 1 064 179 590 21 953 157 637 443 992 440 143 3 849
December 669 974 26 174 12 383 13 792 2 950 2 761 189 195 160 26 438 168 722 445 690 441 951 3 739
2014
January 655 912 24 892 10 435 14 457 3 038 2 843 195 186 537 22 835 163 702 441 445 437 562 3 884
February 679 038 25 154 10 449 14 705 3 661 3 505 157 197 130 28 400 168 730 453 093 449 028 4 066
annual growth rates, %
2005 59.3 16.0 … … 22.7 –36.2 44.7 48.3 34.3 51.7 74.6 75.9 6.7
2006 38.0 42.6 … … –16.3 –6.4 –17.9 28.7 –21.3 39.2 45.3 45.6 18.3
2007 52.7 75.5 73.4 77.4 145.9 126.1 149.6 45.7 33.0 47.2 53.6 53.6 54.4
2008 26.7 25.8 21.2 29.7 –38.7 2.4 –45.7 23.6 32.4 22.7 30.2 30.3 17.6
2009 –6.9 –19.1 –12.4 –24.4 238.5 1 222.8 –76.8 –19.8 0.3 –22.1 –1.7 –1.7 –0.0
2010 24.4 21.8 9.3 33.3 –51.9 –51.8 –53.4 22.5 13.3 23.9 28.5 28.5 24.1
2011 18.0 13.7 20.0 8.9 –5.8 –4.8 –23.2 31.9 28.8 32.3 12.8 12.8 11.1
2012 16.4 –4.3 12.1 –18.0 52.3 55.0 –11.8 13.2 51.6 8.1 18.9 19.0 16.6
2013January 18.7 17.4 20.7 15.2 –5.4 13.1 –86.0 19.2 62.0 13.9 19.0 19.0 26.5February 18.9 17.1 9.6 23.3 –9.1 6.2 –54.3 21.3 51.8 17.3 18.5 18.5 21.2March 17.6 18.3 4.8 32.7 –29.5 –21.6 –59.1 19.2 64.3 13.9 18.1 18.1 18.5April 18.8 15.9 6.1 24.5 –27.8 –23.7 –41.7 22.8 63.4 17.8 18.5 18.5 17.1May 20.2 19.5 8.4 29.6 –30.4 –23.9 –50.1 25.2 78.2 19.2 19.4 19.5 14.9June 20.2 26.2 14.7 38.5 –37.8 –33.9 –50.1 21.0 67.7 15.8 21.0 21.0 19.9July 19.9 25.9 18.2 33.0 –31.7 –23.4 –54.6 19.2 52.6 15.5 21.2 21.2 20.8August 19.6 33.0 22.9 42.0 –39.8 –33.3 –58.1 18.4 64.5 13.9 20.9 20.9 25.2September 20.8 30.5 18.4 44.4 –39.2 –33.8 –54.8 22.0 53.6 18.7 21.2 21.2 24.3October 20.1 30.0 14.9 43.8 –31.1 –25.7 –47.8 17.0 52.8 13.2 22.2 22.2 24.6November 20.5 39.2 14.5 62.8 –32.0 –26.3 –48.9 18.4 48.9 15.1 21.7 21.7 21.2December 17.1 25.5 11.7 41.2 –50.2 –52.3 34.0 12.6 –2.9 15.5 19.7 19.7 25.6
2014January 12.4 12.5 13.6 11.7 –41.7 –43.8 35.6 6.5 –13.7 10.1 15.8 15.8 15.1February 15.3 16.5 14.7 17.7 –38.9 –33.0 –79.6 14.0 10.9 14.6 16.7 16.7 17.3
Period Total
including
other financial corporations general government non-financial corporations other resident sectors
total
including
total
includingincluding
total
including
total

3. Monetary Statistics
3.2. Deposits held with deposit-taking corporations (excluding National Bank of Ukraine)
3.2.1. Deposits by resident sectors (excluding deposit-taking corporations)
3.2.1.2. Deposits by resident sectors by type of currencies and original maturity
demand up to 1 year
over 1 year
and up to 2
years1
over 2 years demand up to 1 year
over 1 year
and up to 2
years1
over 2
yearsdemand up to 1 year
over 1 year
and up to 2
years1
over 2
years
1 2 3 4 5 6 7 8 9 10 11 12 13 14 15 16
outstanding amounts at end of period, in millions of hryvnias
2005 134 754 50 634 32 922 51 198 … 87 769 40 226 18 612 28 931 … 46 985 10 408 14 310 22 267 …
2006 185 917 62 557 42 762 80 598 … 115 102 49 036 23 097 42 970 … 70 814 13 520 19 666 37 628 …
2007 283 875 93 404 60 618 106 222 23 630 192 297 72 389 38 222 65 212 16 476 91 577 21 016 22 396 41 010 7 155
2008 359 740 107 589 92 912 122 344 36 897 201 835 71 737 46 355 62 228 21 514 157 905 35 852 46 556 60 115 15 382
2009 334 953 119 793 135 357 60 425 19 378 173 091 77 165 55 871 30 872 9 183 161 862 42 628 79 486 29 553 10 194
2010 416 650 152 477 133 499 106 718 23 956 239 302 107 206 65 880 54 909 11 307 177 348 45 271 67 619 51 809 12 650
2011 491 756 174 959 153 983 132 907 29 907 280 440 119 310 81 260 65 947 13 923 211 316 55 649 72 723 66 960 15 985
2012 572 342 185 314 187 948 163 861 35 219 320 268 122 767 114 368 68 065 15 068 252 074 62 547 73 580 95 796 20 152
2013
January 583 652 193 862 184 424 168 311 37 055 328 107 129 949 110 861 70 551 16 745 255 545 63 912 73 562 97 760 20 311
February 2
588 728 194 284 185 747 188 232 20 464 335 172 130 570 114 477 78 784 11 341 253 555 63 714 71 270 109 448 9 123
March 597 084 194 903 187 398 193 553 21 230 346 349 133 449 118 475 82 170 12 255 250 735 61 454 68 924 111 382 8 975
April 606 107 198 181 187 068 199 304 21 554 356 250 137 259 120 513 86 075 12 404 249 857 60 922 66 556 113 229 9 150
May 609 991 200 896 183 035 204 131 21 929 361 253 139 790 118 806 89 867 12 789 248 738 61 106 64 229 114 263 9 140
June 618 397 201 088 184 679 209 785 22 846 370 414 141 340 122 003 93 690 13 381 247 983 59 748 62 676 116 094 9 465
July 628 374 205 683 177 774 221 454 23 462 378 074 145 051 121 896 96 898 14 229 250 300 60 632 55 878 124 556 9 234
August 632 899 205 625 176 930 226 102 24 241 383 015 146 330 121 705 100 470 14 510 249 884 59 295 55 225 125 632 9 731
September 648 566 211 946 177 772 235 066 23 783 394 084 149 657 122 983 107 044 14 401 254 482 62 289 54 789 128 023 9 382
October 647 698 206 394 177 362 239 156 24 787 396 371 145 756 125 000 109 875 15 740 251 328 60 638 52 362 129 281 9 047
November 653 418 206 636 177 696 242 728 26 358 402 681 146 177 126 217 112 723 17 564 250 737 60 458 51 480 130 005 8 794
December 669 974 205 565 188 831 249 362 26 216 421 754 148 911 135 327 120 093 17 424 248 220 56 655 53 504 129 269 8 793
2014
January 655 912 197 355 179 704 252 079 26 773 412 566 141 440 128 992 124 130 18 003 243 346 55 915 50 712 127 949 8 771
February 679 038 209 299 178 621 259 366 31 753 392 266 137 806 118 934 115 154 20 371 286 773 71 493 59 687 144 211 11 382
annual growth rates, %
2005 59.3 … … … … 65.0 … … … … 49.7 … … … …
2006 38.0 23.6 29.9 57.4 … 31.1 21.9 24.1 48.5 … 50.7 29.9 37.4 69.0 …
2007 52.7 49.3 41.8 31.8 … 67.1 47.6 65.5 51.8 … 29.3 55.4 13.9 9.0 …
2008 26.7 15.2 53.3 15.2 56 5.0 –0.9 21.3 –4.6 31 72.4 70.6 107.9 47 115
2009 –6.9 11.3 45.7 –50.6 –47.5 –14.2 7.6 20.5 –50.4 –57.3 2.5 18.9 70.7 –50.8 –33.7
2010 24.4 27.3 –1.4 76.6 23.6 38.3 38.9 17.9 77.9 23.1 9.6 6.2 –14.9 75.3 24.1
2011 16.9 16.9 16.9 16.9 16.9 16.9 16.9 16.9 16.9 16.9 16.9 16.9 16.9 16.9 16.9
2012 16.4 5.9 22.1 23.3 17.8 14.2 2.9 40.7 3.2 8.2 19.3 12.4 1.2 43.1 26.1
2013
January 18.7 10.4 20.8 26.5 23.1 17.6 8.6 38.2 8.6 18.3 20.2 14.1 1.5 43.6 27.3
February 18.9 13.3 17.0 39.5 –31.5 20.0 12.3 36.0 20.6 –16.5 17.5 15.4 –4.5 57.2 –44.0
March 17.6 10.2 15.4 39.6 –28.5 18.9 8.6 35.8 21.4 –9.0 15.9 14.0 –8.3 57.0 –44.6
April 18.8 11.9 15.5 41.5 –28.5 21.3 10.5 39.0 24.9 –10.2 15.4 15.0 –11.5 57.5 –44.0
May 20.2 15.1 13.1 45.1 –27.9 23.5 15.4 34.1 31.3 –10.0 15.6 14.4 –12.3 58.1 –43.6
June 20.2 15.5 9.6 47.0 –21.4 24.7 16.6 30.5 35.9 0.3 14.0 12.9 –16.5 57.4 –39.7
July 19.9 13.8 6.5 51.5 –22.3 26.3 16.8 30.9 41.4 6.0 11.3 7.2 –24.4 60.3 –44.9
August 19.6 17.0 2.6 50.6 –22.0 27.6 22.1 24.4 45.9 6.0 9.1 6.1 –25.9 54.6 –44.1
September 20.8 18.9 2.8 53.3 –26.7 29.9 21.1 25.7 57.7 1.9 9.0 13.9 –27.0 49.8 –48.8
October 20.1 17.5 2.5 52.3 –26.2 32.4 22.0 26.9 63.8 9.5 4.7 7.9 –29.8 43.8 –52.9
November 20.5 23.6 –1.9 51.9 –22.8 33.5 29.2 18.7 66.7 21.2 4.2 11.8 –31.1 41.0 –55.3
December 17.1 10.9 0.5 52.2 –25.6 31.7 21.3 18.3 76.4 15.6 –1.5 –9.4 –27.3 34.9 –56.4
2014
January 12.4 1.8 –2.6 49.8 –27.7 25.7 8.8 16.4 75.9 7.5 –4.8 –12.5 –31.1 30.9 –56.8
February 15.3 7.7 –3.8 37.8 55.2 17.0 5.5 3.9 46.2 79.6 13.1 12.2 –16.3 31.8 24.8
1 To January 2007 data include deposits with agreed maturity over 1 year.
2 Starting from February 2013, banks have revised classification of deposits by original maturity.
Types of industry Total
including by agreed maturity
including
in national currency in foreign currency
total
including by agreed maturity
total
including by agreed maturity

3. Monetary Statistics
3.2. Deposits held with deposit-taking corporations (excluding National Bank of Ukraine)
3.2.2. Deposits by other financial corporations
3.2.2.1. Deposits by other financial corporations, breakdown by agreed maturity
(outstanding amounts at end of period, in millions of hryvnias)
demand up to 1 year
over 1 year
and up to 2
years1
over 2 years demand up to 1 year
over 1 year
and up to 2
years1
over 2 years demand up to 1 year
over 1 year
and up to 2
years1
over 2 years
1 2 3 4 5 6 7 8 9 10 11 12 13 14 15 16
2005 6 129 1 739 2 048 2 343 … … … … … … … … … … …
2006 8 741 2 769 2 145 3 828 … 4 063 640 1 389 2 034 … 4 679 2 129 755 1 794 …
2007 15 343 4 295 3 723 5 125 2 199 7 043 1 229 2 162 2 711 940 8 300 3 066 1 561 2 414 1 259
2008 19 305 4 159 7 684 5 071 2 391 8 537 1 548 3 281 2 712 997 10 768 2 611 4 404 2 359 1 394
2009 15 621 4 890 7 032 2 341 1 358 7 477 1 899 4 015 1 239 324 8 144 2 991 3 017 1 102 1 034
2010 19 022 6 131 8 562 3 558 771 8 169 1 976 4 384 1 533 276 10 854 4 155 4 178 2 025 495
2011 21 625 5 740 10 490 3 819 1 577 9 804 2 127 5 233 1 927 517 11 822 3 613 5 257 1 892 1 0602012 20 852 5 418 10 680 3 285 1 469 11 084 2 103 6 828 1 649 503 9 769 3 315 3 852 1 636 9662013
January 22 132 6 490 10 141 3 977 1 523 9 189 1 289 5 856 1 563 481 12 943 5 201 4 286 2 413 1 043February 21 598 6 556 9 701 3 824 1 517 9 106 1 213 5 782 1 629 482 12 492 5 343 3 919 2 195 1 035March 24 111 7 676 9 898 4 886 1 651 10 989 2 039 6 170 2 281 499 13 122 5 637 3 729 2 604 1 152April 21 342 5 911 9 386 4 531 1 515 9 228 1 251 5 471 1 991 515 12 114 4 660 3 914 2 540 1 000May 21 524 6 027 9 414 4 628 1 456 9 266 1 344 5 385 2 081 456 12 258 4 683 4 028 2 547 1 000June 24 256 6 879 10 655 4 827 1 895 11 397 2 288 6 180 2 469 461 12 859 4 591 4 475 2 358 1 435July 21 639 5 131 10 092 4 435 1 981 9 641 1 489 5 526 2 187 439 11 998 3 642 4 566 2 248 1 541August 22 822 5 504 10 621 4 519 2 177 9 925 1 742 5 601 2 142 440 12 897 3 762 5 020 2 377 1 737September 25 114 6 541 11 341 4 983 2 248 12 218 2 529 6 730 2 464 495 12 895 4 012 4 611 2 519 1 754October 23 022 5 738 10 415 4 589 2 280 9 737 1 628 5 640 2 068 401 13 285 4 110 4 775 2 521 1 878November 24 220 6 042 10 479 4 606 3 093 9 693 1 669 5 443 2 146 435 14 528 4 373 5 036 2 460 2 658December 26 174 7 057 10 673 5 658 2 787 12 383 2 477 6 324 3 080 502 13 792 4 580 4 349 2 578 2 285
2014
January 24 892 6 097 10 341 5 810 2 644 10 435 1 824 5 561 2 668 382 14 457 4 274 4 779 3 142 2 262
February 25 154 7 461 10 302 4 818 2 573 10 449 2 025 5 602 2 371 452 14 705 5 437 4 700 2 448 2 120
1 To January 2007 data include deposits with agreed maturity over 1 year.
including by agreed maturity
including by agreed maturity including by agreed maturityPeriod Total
including
insurance corporations and pension funds other financial intermediaries and financial auxiliaries
total total

3. Monetary Statistics
3.2. Deposits held with deposit-taking corporations (excluding National Bank of Ukraine)
3.2.2. Deposits by other financial corporations
3.2.2.2. Deposits by other financial corporations, breakdown by currencies
(outstanding amounts at end of period, in millions of hryvnias)
hryvniaUS
dollarEuro
Russian
rubleother hryvnia
US
dollarEuro
Russian
rubleother hryvnia
US
dollarEuro
Russian
rubleother
1 2 3 4 5 6 7 8 9 10 11 12 13 14 15 16 17 18 19
2005 6 129 5 666 360 73 – 30 … … … … … … … … … … … …
2006 8 741 7 601 841 257 2 41 4 063 3 554 374 108 1 25 4 679 4 046 467 149 0 16
2007* 15 343 14 011 1 027 228 3 74 7 043 6 146 658 191 3 45 8 300 7 865 369 37 0 29
2008 19 305 12 861 5 465 858 3 119 8 537 6 181 1 640 645 3 69 10 768 6 680 3 824 213 0 50
2009 15 621 10 844 3 973 664 4 137 7 477 5 282 1 632 469 3 91 8 144 5 562 2 341 195 1 45
2010 19 022 13 264 4 739 867 5 148 8 169 5 760 1 884 422 5 97 10 854 7 503 2 855 444 0 51
2011 21 799 15 893 5 342 384 2 178 9 887 7 435 2 012 329 1 111 11 912 8 458 3 330 55 1 68
2012 20 852 16 674 3 489 458 2 230 11 084 8 695 1 925 368 1 95 9 769 7 979 1 564 90 1 135
2013
January 22 132 17 611 3 849 451 3 218 9 189 6 887 1 858 347 1 96 12 943 10 724 1 991 103 3 122
February 21 598 17 466 3 478 450 3 202 9 106 6 876 1 823 324 1 82 12 492 10 590 1 655 126 1 120
March 24 111 19 520 3 768 618 2 203 10 989 8 705 1 886 315 1 82 13 122 10 814 1 882 303 1 121
April 21 342 17 085 3 561 495 13 188 9 228 6 965 1 858 328 1 77 12 114 10 121 1 703 167 12 111
May 21 524 17 413 3 443 486 2 180 9 266 7 009 1 861 322 1 74 12 258 10 404 1 582 164 1 106
June 24 256 19 866 3 715 518 1 156 11 397 9 023 1 963 346 1 65 12 859 10 843 1 752 164 1 106
July 21 639 17 423 3 556 504 1 156 9 641 7 377 1 843 350 1 70 11 998 10 046 1 712 153 0 86
August 22 822 18 540 3 642 472 3 165 9 925 7 599 1 908 338 2 78 12 897 10 941 1 734 134 1 88
September 25 114 20 717 3 749 494 3 152 12 218 9 861 1 930 355 2 71 12 895 10 856 1 818 139 1 81
October 23 022 18 484 3 906 483 1 147 9 737 7 488 1 832 348 1 69 13 285 10 996 2 074 135 1 79
November 24 220 19 867 3 851 368 2 132 9 693 7 501 1 822 310 1 60 14 528 12 366 2 029 58 1 72
December 26 174 21 986 3 681 373 3 133 12 383 10 219 1 787 312 2 62 13 792 11 766 1 894 60 0 71
2014
January 24 892 20 900 3 517 341 1 134 10 435 8 276 1 791 305 1 61 14 457 12 623 1 726 35 0 73
February 25 154 20 255 4 383 421 3 91 10 449 7 744 2 247 376 2 80 14 705 12 512 2 136 45 1 11
Period
total total
other financial intermediaries and financial auxiliariesinsurance corporations and pension funds
Total
including by currencies
including
including by currencies including by currencies
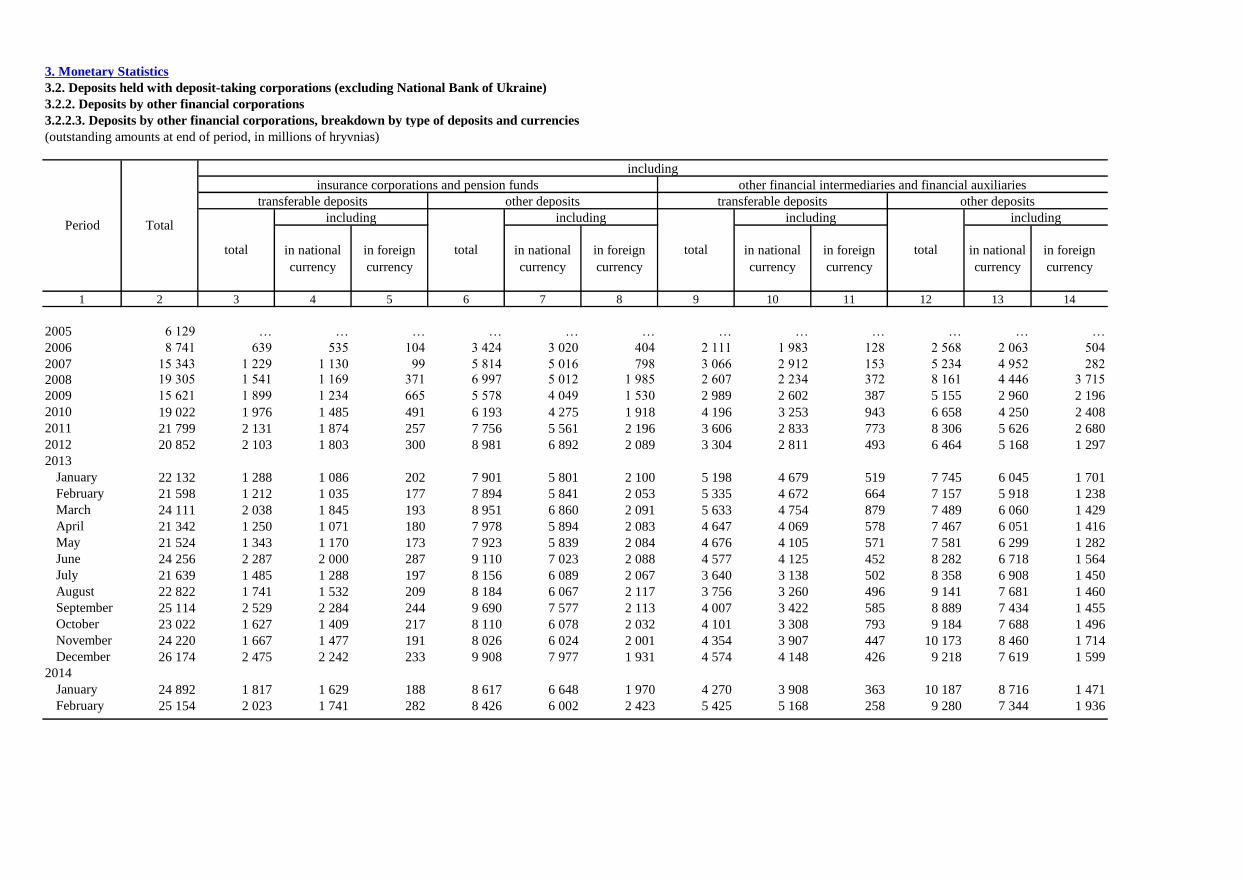
3. Monetary Statistics
3.2. Deposits held with deposit-taking corporations (excluding National Bank of Ukraine)
3.2.2. Deposits by other financial corporations
3.2.2.3. Deposits by other financial corporations, breakdown by type of deposits and currencies
(outstanding amounts at end of period, in millions of hryvnias)
in national
currency
in foreign
currency
in national
currency
in foreign
currency
in national
currency
in foreign
currency
in national
currency
in foreign
currency
1 2 3 4 5 6 7 8 9 10 11 12 13 14
2005 6 129 … … … … … … … … … … … …
2006 8 741 639 535 104 3 424 3 020 404 2 111 1 983 128 2 568 2 063 504
2007 15 343 1 229 1 130 99 5 814 5 016 798 3 066 2 912 153 5 234 4 952 282
2008 19 305 1 541 1 169 371 6 997 5 012 1 985 2 607 2 234 372 8 161 4 446 3 715
2009 15 621 1 899 1 234 665 5 578 4 049 1 530 2 989 2 602 387 5 155 2 960 2 196
2010 19 022 1 976 1 485 491 6 193 4 275 1 918 4 196 3 253 943 6 658 4 250 2 408
2011 21 799 2 131 1 874 257 7 756 5 561 2 196 3 606 2 833 773 8 306 5 626 2 680
2012 20 852 2 103 1 803 300 8 981 6 892 2 089 3 304 2 811 493 6 464 5 168 1 297
2013
January 22 132 1 288 1 086 202 7 901 5 801 2 100 5 198 4 679 519 7 745 6 045 1 701
February 21 598 1 212 1 035 177 7 894 5 841 2 053 5 335 4 672 664 7 157 5 918 1 238
March 24 111 2 038 1 845 193 8 951 6 860 2 091 5 633 4 754 879 7 489 6 060 1 429
April 21 342 1 250 1 071 180 7 978 5 894 2 083 4 647 4 069 578 7 467 6 051 1 416
May 21 524 1 343 1 170 173 7 923 5 839 2 084 4 676 4 105 571 7 581 6 299 1 282
June 24 256 2 287 2 000 287 9 110 7 023 2 088 4 577 4 125 452 8 282 6 718 1 564
July 21 639 1 485 1 288 197 8 156 6 089 2 067 3 640 3 138 502 8 358 6 908 1 450
August 22 822 1 741 1 532 209 8 184 6 067 2 117 3 756 3 260 496 9 141 7 681 1 460
September 25 114 2 529 2 284 244 9 690 7 577 2 113 4 007 3 422 585 8 889 7 434 1 455
October 23 022 1 627 1 409 217 8 110 6 078 2 032 4 101 3 308 793 9 184 7 688 1 496
November 24 220 1 667 1 477 191 8 026 6 024 2 001 4 354 3 907 447 10 173 8 460 1 714
December 26 174 2 475 2 242 233 9 908 7 977 1 931 4 574 4 148 426 9 218 7 619 1 599
2014
January 24 892 1 817 1 629 188 8 617 6 648 1 970 4 270 3 908 363 10 187 8 716 1 471
February 25 154 2 023 1 741 282 8 426 6 002 2 423 5 425 5 168 258 9 280 7 344 1 936
Period Total
transferable deposits
total
including
including
other deposits
insurance corporations and pension funds
total
including
total
including including
other financial intermediaries and financial auxiliaries
total
other depositstransferable deposits

3. Monetary Statistics
3.2. Deposits held with deposit-taking corporations (excluding National Bank of Ukraine)
3.2.3. Deposits by non-financial corporations
3.2.3.1. Deposits by non-financial corporations, breakdown by agreed maturity
(outstanding amounts at end of period, in millions of hryvnias)
demand up to 1 year
over 1 year
and up to 2
years1
over 2 years demand up to 1 year
over 1 year
and up to 2
years1
over 2
yearsdemand up to 1 year
over 1 year
and up to 2
years1
over 2
years
1 2 3 4 5 6 7 8 9 10 11 12 13 14 15 16
2005 50 976 29 406 9 982 11 587 … 8 862 5 779 1 695 1 388 … 42 114 23 626 8 287 10 200 …
2006 65 614 32 938 16 193 16 483 … 6 976 4 120 1 568 1 288 … 58 638 28 818 14 625 15 195 …
2007 95 583 47 504 20 616 18 865 8 598 9 275 5 873 1 412 1 178 813 86 308 41 631 19 204 17 688 7 786
2008 118 188 61 204 27 791 17 985 11 208 12 281 8 426 1 513 1 503 839 105 907 52 778 26 278 16 483 10 369
2009 94 796 55 225 22 557 11 205 5 810 12 319 9 078 1 842 1 016 384 82 477 46 147 20 715 10 189 5 426
2010 116 105 74 871 24 221 11 004 6 009 13 952 11 410 1 424 833 285 102 153 63 462 22 796 10 171 5 724
2011 153 120 101 435 41 534 7 630 2 362 160 17 964 10 130 6 575 846 342 72 135 155 91 305 34 959
2012 173 319 95 795 50 137 20 839 6 547 27 229 22 555 2 851 1 536 287 146 090 73 241 47 286 19 303 6 2602013
January 175 124 104 765 42 318 20 338 7 703 26 463 22 819 1 793 1 567 285 148 661 81 946 40 525 18 772 7 418February 172 900 102 097 42 673 20 101 8 028 25 610 21 779 1 942 1 614 276 147 290 80 319 40 731 18 487 7 753March 173 263 99 142 44 644 21 060 8 417 25 486 21 598 1 988 1 628 272 147 777 77 544 42 656 19 432 8 145April 175 777 99 315 46 498 21 050 8 913 25 681 21 843 1 994 1 574 270 150 096 77 472 44 504 19 476 8 643May 176 235 102 082 43 465 21 587 9 100 25 569 22 073 1 857 1 373 266 150 666 80 009 41 609 20 214 8 834June 170 630 96 083 43 136 21 944 9 468 23 934 20 683 1 865 1 122 264 146 696 75 400 41 270 20 822 9 204July 178 499 103 168 43 099 22 225 10 007 22 347 19 334 1 756 995 262 156 152 83 834 41 343 21 230 9 745August 177 899 102 958 43 281 21 942 9 718 21 998 18 858 1 877 1 002 260 155 901 84 100 41 403 20 940 9 458September 184 489 107 843 43 165 24 818 8 662 21 911 18 872 1 846 918 275 162 578 88 971 41 319 23 900 8 387October 179 632 103 028 42 873 24 534 9 197 22 558 19 785 1 613 892 267 157 074 83 243 41 259 23 642 8 930November 179 590 102 861 43 186 24 026 9 517 21 953 18 997 1 856 877 223 157 637 83 864 41 330 23 150 9 294December 195 160 106 207 55 237 25 005 8 711 26 438 22 707 2 625 883 222 168 722 83 500 52 612 24 121 8 489
2014January 186 537 102 228 49 768 25 774 8 768 22 835 19 464 2 234 918 219 163 702 82 764 47 534 24 855 8 549February 197 130 116 032 48 615 21 432 11 051 28 400 24 802 2 480 855 263 168 730 91 230 46 135 20 577 10 788
1 To January 2007 data include deposits with agreed maturity over 1 year.
Period Total
including by agreed maturity
including
public non-financial corporations other non-financial corporations
total
including by agreed maturity
total
including by agreed maturity

3. Monetary Statistics
3.2. Deposits held with deposit-taking corporations (excluding National Bank of Ukraine)
3.2.3. Deposits by non-financial corporations
3.2.3.2. Deposits by non-financial corporations, breakdown by currencies
(outstanding amounts at end of period, in millions of hryvnias)
hryvniaUS
dollarEuro
Russian
rubleother hryvnia
US
dollarEuro
Russian
rubleother hryvnia
US
dollarEuro
Russian
rubleother
1 2 3 4 5 6 7 8 9 10 11 12 13 14 15 16 17 18 19
2005 50 976 37 121 11 274 1 941 609 32 8 862 5 917 2 733 73 138 2 42 114 31 204 8 541 1 867 471 30
2006 65 614 45 732 15 365 3 841 528 147 6 976 4 533 2 249 93 98 3 58 638 41 200 13 116 3 748 430 144
2007 95 583 72 104 17 135 5 000 934 409 9 275 7 250 1 637 262 122 3 86 308 64 854 15 498 4 738 813 405
2008 118 188 75 281 31 679 8 873 1 119 1 236 12 281 8 952 2 647 503 126 53 105 907 66 329 29 032 8 370 993 1 184
2009 94 796 58 866 25 120 9 175 1 446 189 12 319 7 329 3 704 1 046 103 137 82 477 51 538 21 416 8 129 1 343 52
2010 116 105 80 646 25 495 7 667 2 060 238 13 952 9 319 3 132 877 437 187 102 153 71 327 22 362 6 790 1 623 50
2011 153 120 101 435 41 534 7 630 2 362 160 17 964 10 130 6 575 846 342 72 135 155 91 305 34 959 6 784 2 020 88
2012 173 319 112 644 50 585 7 943 2 035 113 27 229 10 807 15 603 663 144 12 146 090 101 837 34 982 7 280 1 891 101
2013
January 175 124 114 287 51 020 7 957 1 764 96 26 463 9 417 16 212 700 124 11 148 661 104 870 34 808 7 257 1 640 85
February 172 900 112 369 50 588 7 725 2 105 112 25 610 9 570 15 222 620 186 11 147 290 102 799 35 366 7 105 1 919 101
March 173 263 114 182 49 574 7 315 2 100 92 25 486 9 523 15 105 667 180 11 147 777 104 658 34 469 6 648 1 920 82
April 175 777 117 096 49 415 7 364 1 790 110 25 681 9 945 15 026 564 129 17 150 096 107 151 34 390 6 800 1 661 94
May 176 235 118 226 48 360 7 536 1 970 142 25 569 9 951 14 778 604 187 50 150 666 108 275 33 583 6 932 1 784 92
June 170 630 114 246 46 951 7 341 1 991 101 23 934 9 007 14 115 612 179 21 146 696 105 239 32 835 6 729 1 813 81
July 178 499 120 790 47 674 8 110 1 810 114 22 347 8 805 12 769 587 167 19 156 152 111 985 34 905 7 524 1 643 96
August 177 899 121 502 45 705 8 543 1 924 225 21 998 8 652 12 413 599 217 117 155 901 112 851 33 291 7 944 1 707 108
September 184 489 125 115 48 107 9 059 1 998 209 21 911 8 935 12 011 646 197 122 162 578 116 181 36 097 8 412 1 801 87
October 179 632 122 812 45 654 8 939 2 004 222 22 558 9 955 11 558 718 190 136 157 074 112 856 34 096 8 221 1 814 86
November 179 590 122 304 46 786 8 507 1 770 223 21 953 9 615 11 255 857 154 72 157 637 112 689 35 531 7 650 1 617 151
December 195 160 138 242 46 219 8 268 2 244 188 26 438 13 563 11 970 584 234 86 168 722 124 678 34 249 7 683 2 010 102
2014
January 186 537 131 170 45 229 8 160 1 853 125 22 835 10 233 11 870 562 152 18 163 702 120 937 33 358 7 598 1 701 107
February 197 130 130 705 54 223 9 902 2 108 192 28 400 12 190 15 197 724 267 22 168 730 118 516 39 025 9 178 1 841 170
Period
public non-financial corporations
Total
including by currencies
including
other non-financial corporations
total
including by currencies
total
including by currencies

3. Monetary Statistics
3.2. Deposits held with deposit-taking corporations (excluding National Bank of Ukraine)
3.2.3. Deposits by non-financial corporations
3.2.3.3. Deposits by non-financial corporations, breakdown by type of deposits and currencies
(outstanding amounts at end of period, in millions of hryvnias)
in national
currency
in foreign
currency
in national
currency
in foreign
currency
in national
currency
in foreign
currency
in national
currency
in foreign
currency
1 2 3 4 5 6 7 8 9 10 11 12 13 14
2005 50 976 4 036 2 859 1 177 4 827 3 058 1 769 23 165 17 943 5 222 18 948 13 261 5 687
2006 65 614 3 480 2 594 886 3 496 1 939 1 557 28 340 22 110 6 230 30 298 19 090 11 209
2007 95 583 4 215 3 118 1 096 5 060 4 132 928 40 896 30 467 10 429 45 412 34 387 11 025
2008 118 188 7 142 5 274 1 868 5 139 3 679 1 460 52 168 32 435 19 732 53 739 33 893 19 846
2009 94 796 8 078 4 800 3 278 4 242 2 529 1 713 45 620 30 746 14 874 36 857 20 792 16 065
2010 116 105 10 509 7 078 3 430 3 443 2 240 1 203 62 935 47 705 15 230 39 217 23 622 15 596
2011 153 120 11 027 6 466 4 561 6 937 3 664 3 273 79 826 56 784 23 043 55 329 34 521 20 808
2012 173 319 20 434 6 137 14 297 6 795 4 670 2 125 70 905 52 646 18 259 75 185 49 191 25 994
2013
January 175 124 21 564 6 410 15 154 4 900 3 008 1 892 79 800 60 729 19 071 68 861 44 141 24 720
February 172 900 20 076 6 011 14 065 5 534 3 559 1 974 77 412 58 379 19 033 69 878 44 420 25 459
March 173 263 20 355 6 194 14 161 5 131 3 329 1 802 75 534 57 838 17 695 72 243 46 820 25 423
April 175 777 20 194 6 325 13 870 5 487 3 620 1 866 75 138 58 615 16 523 74 958 48 536 26 422
May 176 235 20 815 6 886 13 929 4 754 3 065 1 690 78 116 61 598 16 518 72 549 46 677 25 873
June 170 630 18 904 5 506 13 398 5 030 3 501 1 529 73 475 57 285 16 190 73 222 47 954 25 268
July 178 499 18 212 5 946 12 266 4 135 2 859 1 276 82 210 63 747 18 463 73 942 48 238 25 704
August 177 899 17 677 5 731 11 946 4 321 2 920 1 400 82 304 64 631 17 673 73 597 48 220 25 377
September 184 489 17 529 5 958 11 571 4 382 2 977 1 405 84 463 65 896 18 567 78 115 50 285 27 830
October 179 632 18 702 7 164 11 538 3 855 2 791 1 064 80 881 61 434 19 447 76 193 51 422 24 771
November 179 590 17 382 6 243 11 139 4 571 3 372 1 199 81 516 61 075 20 441 76 122 51 615 24 507
December 195 160 19 536 7 913 11 623 6 902 5 650 1 251 80 660 61 938 18 722 88 062 62 740 25 322
2014
January 186 537 18 147 6 831 11 316 4 688 3 402 1 286 80 487 61 503 18 984 83 215 59 434 23 782
February 197 130 22 606 7 954 14 652 5 793 4 235 1 558 89 405 62 712 26 692 79 325 55 803 23 522
total
including including
other non-financial corporations
total
other depositstransferable deposits
Period Total
transferable deposits
total
including
including
other deposits
public non-financial corporations
total
including

3. Monetary Statistics
3.2. Deposits held with deposit-taking corporations (excluding National Bank of Ukraine)
3.2.3. Deposits by non-financial corporations
3.2.3.4. Deposits by non-financial corporations, breakdown by type of industry, currencies and agreed maturity
(outstanding amounts at end of period, in millions of hryvnias)
demandup to 1
year
over 1 year
and up to 2
years
over 2
yearsdemand
up to 1
year
over 1 year
and up to 2
years
over 2
yearsdemand
up to 1
year
over 1 year
and up to 2
years
over 2
years
1 2 3 4 5 6 7 8 9 10 11 12 13 14 15 16
Total 197 130 116 032 48 615 21 432 11 051 130 705 73 580 35 872 13 576 7 678 66 425 42 453 12 744 7 856 3 373
Agriculture, forestry and fishing 22 892 17 186 3 729 1 550 427 9 717 4 611 3 338 1 467 300 13 175 12 575 391 82 127
Mining and quarrying 10 895 7 022 1 121 2 236 515 4 271 2 717 799 713 42 6 624 4 305 322 1 523 473
Manufacturing 35 926 19 424 10 275 4 513 1 713 20 796 11 854 5 542 2 657 744 15 129 7 571 4 733 1 856 969
Electricity, gas, steam and air conditioning supply 9 953 8 160 1 431 187 174 8 223 6 618 1 367 187 51 1 729 1 542 65 – 123
Water supply; sewerage, waste management and remediation activities 503 442 44 11 6 479 420 43 11 6 24 23 1 0 –
Construction 8 784 4 086 2 046 2 104 548 7 776 3 680 1 824 1 946 326 1 008 406 222 159 221
Wholesale and retail trade; repair of motor vehicles and motorcycles 58 144 31 992 16 149 5 535 4 468 44 641 24 342 12 881 3 252 4 165 13 502 7 650 3 267 2 283 303
Transportation and storage 9 791 6 888 2 301 540 62 6 375 4 151 1 750 440 33 3 416 2 737 551 99 29
Accommodation and food service activities 944 561 301 78 5 722 441 209 69 4 222 120 92 9 1
Information and communication 8 478 3 873 3 502 684 419 6 108 3 068 2 201 490 349 2 370 805 1 301 194 70
Real estate activities 7 346 3 362 2 345 770 869 5 620 2 796 2 198 322 305 1 726 566 147 448 565
Professional, scientific and technical activities 17 762 9 215 4 021 2 770 1 755 11 967 6 438 2 474 1 778 1 277 5 795 2 777 1 547 993 478
Administrative and support service activities 3 296 2 471 609 131 86 2 107 1 384 552 98 73 1 189 1 087 56 33 13
Education 442 252 177 14 0 399 220 167 13 0 43 32 10 1 –
Human health and social work activities 598 404 181 11 2 521 356 155 8 2 77 48 26 2 0
Arts, entertainment and recreation 692 187 242 263 0 479 143 235 100 0 214 44 6 164 –
Other service activities 685 507 142 34 2 503 341 135 25 1 182 166 7 9 1
total
including by agreed maturity
at the end of February, 2014
Note. Data are given according to the National classificator of Ukraine DK 009:2010 "Classification of economic activities" approved by the decree of State Committee of Ukraine for Technical Regulation and Consumer Policy from 11.10.2010
№ 457 (as amended).
Types of industry Total
including by agreed maturity
including
in national currency in foreign currency
total
including by agreed maturity
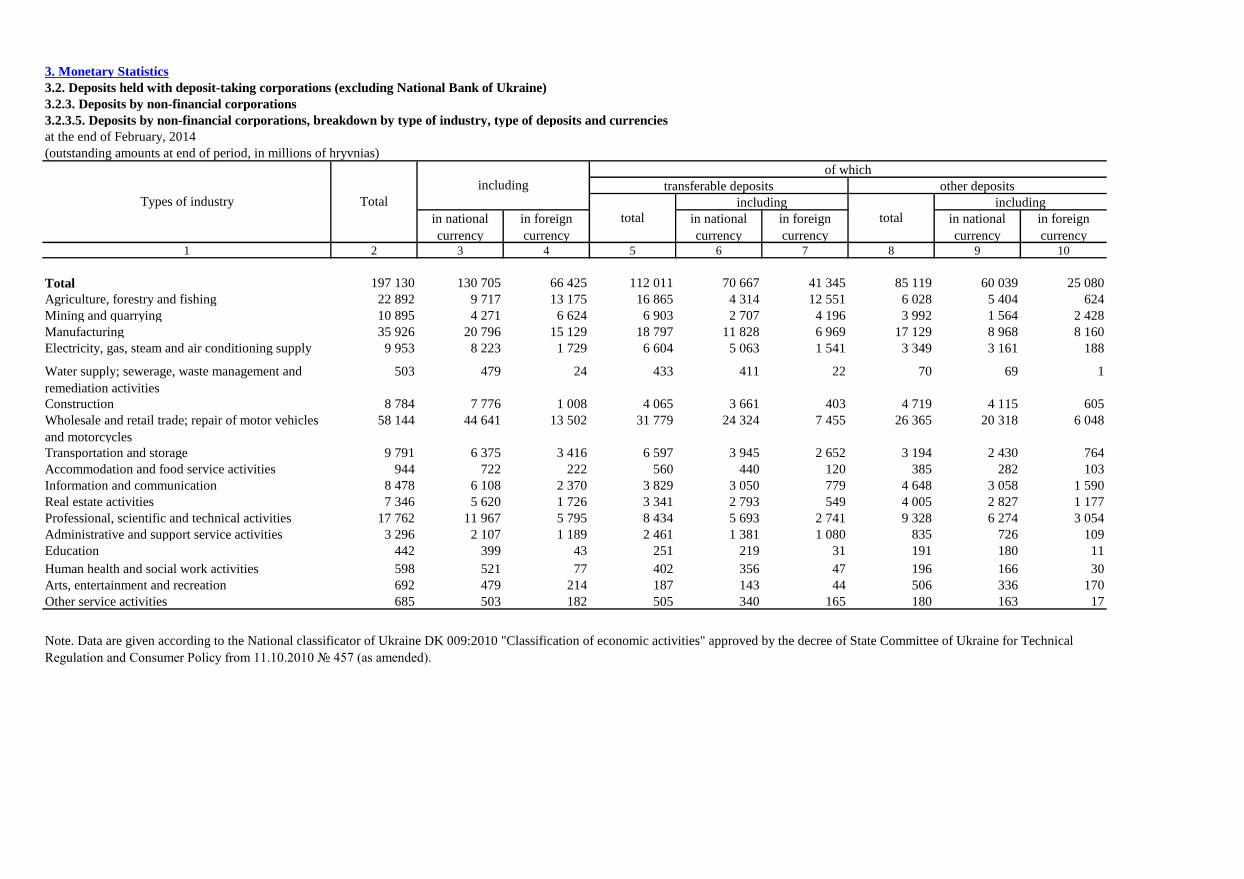
3. Monetary Statistics
3.2. Deposits held with deposit-taking corporations (excluding National Bank of Ukraine)
3.2.3. Deposits by non-financial corporations
3.2.3.5. Deposits by non-financial corporations, breakdown by type of industry, type of deposits and currencies
(outstanding amounts at end of period, in millions of hryvnias)
in national
currency
in foreign
currency
in national
currency
in foreign
currency
in national
currency
in foreign
currency1 2 3 4 5 6 7 8 9 10
Total 197 130 130 705 66 425 112 011 70 667 41 345 85 119 60 039 25 080
Agriculture, forestry and fishing 22 892 9 717 13 175 16 865 4 314 12 551 6 028 5 404 624
Mining and quarrying 10 895 4 271 6 624 6 903 2 707 4 196 3 992 1 564 2 428
Manufacturing 35 926 20 796 15 129 18 797 11 828 6 969 17 129 8 968 8 160
Electricity, gas, steam and air conditioning supply 9 953 8 223 1 729 6 604 5 063 1 541 3 349 3 161 188
Water supply; sewerage, waste management and
remediation activities
503 479 24 433 411 22 70 69 1
Construction 8 784 7 776 1 008 4 065 3 661 403 4 719 4 115 605
Wholesale and retail trade; repair of motor vehicles
and motorcycles
58 144 44 641 13 502 31 779 24 324 7 455 26 365 20 318 6 048
Transportation and storage 9 791 6 375 3 416 6 597 3 945 2 652 3 194 2 430 764
Accommodation and food service activities 944 722 222 560 440 120 385 282 103
Information and communication 8 478 6 108 2 370 3 829 3 050 779 4 648 3 058 1 590
Real estate activities 7 346 5 620 1 726 3 341 2 793 549 4 005 2 827 1 177
Professional, scientific and technical activities 17 762 11 967 5 795 8 434 5 693 2 741 9 328 6 274 3 054
Administrative and support service activities 3 296 2 107 1 189 2 461 1 381 1 080 835 726 109
Education 442 399 43 251 219 31 191 180 11
Human health and social work activities 598 521 77 402 356 47 196 166 30
Arts, entertainment and recreation 692 479 214 187 143 44 506 336 170
Other service activities 685 503 182 505 340 165 180 163 17
total
including
at the end of February, 2014
Note. Data are given according to the National classificator of Ukraine DK 009:2010 "Classification of economic activities" approved by the decree of State Committee of Ukraine for Technical
Regulation and Consumer Policy from 11.10.2010 № 457 (as amended).
Types of industry Total
other deposits
total
including
including
of which
transferable deposits

3. Monetary Statistics
3.2. Deposits held with deposit-taking corporations (excluding National Bank of Ukraine)
3.2.3. Deposits by non-financial corporations
3.2.3.6. Deposits by non-financial corporations, in foreign currency, breakdown by type of industry, currencies and agreed maturity
(outstanding amounts at end of period, in millions of hryvnias)
demandup to 1
year
over 1
year and
up to 2
years
over 2
yearsdemand
up to 1
year
over 1
year and
up to 2
years
over 2
yearsdemand
up to 1
year
over 1
year and
up to 2
years
over 2
yearsdemand
up to 1
year
over 1
year and
up to 2
years
over 2
years
1 2 3 4 5 6 7 8 9 10 11 12 13 14 15 16 17 18 19 20 21 22
Total 66 425 54 223 34 619 10 029 6 625 2 949 9 902 6 118 2 256 1 192 336 2 108 1 539 446 35 88 192 176 12 3 –
Agriculture, forestry and
fishing 13 175 12 867 12 379 368 82 39 211 188 23 1 – 96 8 – – 88 0 0 – – –
Mining and quarrying 6 624 6 302 4 000 307 1 521 473 229 226 1 2 – 78 65 13 0 – 15 14 1 – –
Manufacturing 15 129 11 447 5 046 3 866 1 616 918 2 779 1 790 720 218 51 827 659 145 22 0 77 75 2 – –
Electricity, gas, steam and air
conditioning supply 1 729 1 321 1 259 60 – 2 374 248 5 – 121 34 34 – – – 0 0 – – –
Water supply; sewerage,
waste management and
remediation activities 24 7 7 0 0 – 15 15 0 – – 1 1 – – – 0 0 0 – –
Construction 1 008 693 209 153 110 221 250 169 33 49 – 64 28 36 – – 0 0 0 0 –
Wholesale and retail trade;
repair of motor vehicles and
motorcycles 13 502 9 935 5 713 2 317 1 673 232 2 970 1 480 817 603 70 561 431 125 4 – 37 26 9 2 –
Transportation and storage
3 416 2 124 1 662 357 87 19 1 225 1 013 190 13 10 58 53 5 – – 9 9 – – –
Accommodation and food
service activities 222 140 86 46 9 0 72 26 46 0 1 10 9 1 0 – 0 0 – – –
Information and
communication 2 370 1 841 533 1 058 180 70 482 231 240 11 – 27 21 2 3 – 20 20 – – –
Real estate activities 1 726 1 631 513 131 434 553 84 43 16 13 11 10 10 – – – 1 0 0 1 –
Professional, scientific and
technical activities 5 795 4 644 2 026 1 318 893 408 817 536 113 98 71 309 191 116 2 – 24 24 – – –
Administrative and support
service activities 1 189 1 026 980 22 11 13 142 87 34 21 0 18 18 0 0 – 2 2 – – –
Education 43 25 14 10 1 – 12 12 0 – – 1 1 – – – 4 4 – – –
Human health and social
work activities 77 36 27 9 0 – 28 15 14 – 0 12 6 4 2 – 0 0 – – –
Arts, entertainment and
recreation 214 19 13 6 – – 194 30 0 164 – 1 1 – – – 0 0 – – –
Other service activities 182 162 152 2 8 1 18 12 5 1 – 1 1 – – – 1 1 – – –
Note. Data are given according to the National classificator of Ukraine DK 009:2010 "Classification of economic activities" approved by the decree of State Committee of Ukraine for Technical Regulation and
Consumer Policy from 11.10.2010 № 457 (as amended).
Types of industry Total US
dollar
including
including by agreed maturityother
curren-
cies
including by agreed maturity
Russian
ruble
at the end of February, 2014
including by agreed maturity
Euro
including by agreed maturity

3. Monetary Statistics
3.2. Deposits held with deposit-taking corporations (excluding National Bank of Ukraine)
3.2.4. Deposits by households
3.2.4.1. Deposits by households, breakdown by type of currencies and agreed maturity
(outstanding amounts at end of period, in millions of hryvnias)
demand up to 1 year
over 1 year
and up to 2
years1
over 2 years demand up to 1 year
over 1 year
and up to 2
years1
over 2
yearsdemand up to 1 year
over 1 year
and up to 2
years1
over 2 years
1 2 3 4 5 6 7 8 9 10 11 12 13 14 15 16
2005 74 778 18 660 19 025 37 093 … 43 688 15 424 9 032 19 232 … 31 090 3 236 9 993 17 861 …
2006 108 860 25 940 22 853 60 066 … 59 889 20 360 9 712 29 817 … 48 970 5 580 13 142 30 249 …
2007 167 239 40 123 32 504 81 901 12 711 102 379 31 795 16 396 46 389 7 798 64 860 8 328 16 108 35 511 4 913
2008 217 860 40 578 55 878 98 626 22 777 110 016 27 971 23 870 46 687 11 488 107 844 12 607 32 008 51 939 11 290
2009 214 098 57 265 98 157 46 638 12 038 101 081 35 325 38 292 21 753 5 711 113 016 21 939 59 865 24 885 6 328
2010 275 093 66 164 99 966 91 938 17 025 142 924 45 045 43 308 46 402 8 169 132 169 21 119 56 658 45 536 8 856
2011 310 390 70 921 104 440 113 824 21 206 160 530 48 090 45 926 56 196 10 318 149 860 22 831 58 514 57 628 10 888
2012 369 264 77 153 125 560 139 490 27 062 186 772 53 935 65 393 57 355 10 089 182 493 23 217 60 167 82 135 16 973
2013
January 377 817 76 049 130 422 143 660 27 685 192 635 52 712 69 980 59 468 10 476 185 181 23 338 60 442 84 192 17 210
February 2
384 768 78 724 131 337 163 934 10 772 201 070 55 492 72 719 68 079 4 780 183 698 23 232 58 619 95 855 5 993
March 390 185 81 157 130 707 167 303 11 018 208 028 57 950 74 563 70 262 5 253 182 157 23 207 56 144 97 041 5 765
April 399 055 85 929 128 736 173 405 10 985 216 998 61 952 75 375 74 368 5 303 182 058 23 978 53 361 99 037 5 682
May 402 599 85 977 127 786 177 604 11 232 220 554 61 474 76 185 77 389 5 506 182 045 24 503 51 601 100 215 5 726
June 414 384 91 779 128 575 182 701 11 330 231 444 67 563 78 106 80 185 5 590 182 941 24 216 50 468 102 516 5 740
July 418 708 90 617 122 287 194 479 11 325 234 369 66 099 79 056 83 502 5 712 184 339 24 518 43 230 110 977 5 613
August 422 980 90 737 120 736 199 301 12 206 237 642 66 554 78 237 86 641 6 210 185 338 24 182 42 499 112 660 5 996
September 429 600 91 070 120 856 204 940 12 734 242 609 67 067 78 683 89 750 7 108 186 991 24 003 42 173 115 190 5 625
October 435 004 90 523 121 665 209 644 13 172 248 720 66 946 80 742 93 369 7 663 186 284 23 576 40 923 116 275 5 510
November 440 143 91 171 121 656 213 708 13 607 254 598 67 922 81 687 96 587 8 402 185 546 23 249 39 969 117 121 5 205
December 441 951 87 720 121 343 218 308 14 580 257 829 66 776 81 375 100 550 9 128 184 122 20 944 39 968 117 758 5 452
2014
January 437 562 84 187 118 059 220 092 15 224 256 361 62 997 80 028 103 574 9 762 181 200 21 190 38 030 116 518 5 462
February 2
449 028 80 252 118 103 232 678 17 995 236 818 54 462 73 664 97 868 10 824 212 210 25 790 44 439 134 810 7 171
1 To January 2007 data include deposits with agreed maturity over 1 year.
2 Starting from February 2013, banks have revised classification of deposits by original maturity.
Period Total
including by agreed maturity
including
in national currency in foreign currency
total
including by agreed maturity
total
including by agreed maturity

3. Monetary Statistics
3.2. Deposits held with deposit-taking corporations (excluding National Bank of Ukraine)
3.2.4. Deposits by households
3.2.4.2. Deposits by households, breakdown by currencies
(outstanding amounts at end of period, in millions of hryvnias)
hryvniaUS
dollarEuro
Russian
rubleother hryvnia
US
dollarEuro
Russian
rubleother hryvnia
US
dollarEuro
Russian
rubleother
1 2 3 4 5 6 7 8 9 10 11 12 13 14 15 16 17 18 19
2005 74 778 43 688 26 372 4 615 20 83 18 648 15 418 … … … … 56 130 28 270 … … … …
2006 108 860 59 889 40 848 7 909 27 186 25 931 20 359 4 564 948 26 35 82 928 39 530 36 285 6 961 1 151
2007 167 239 102 379 48 808 15 514 57 480 40 086 31 779 6 360 1 846 48 54 127 152 70 600 42 448 13 669 8 427
2008 217 860 110 016 75 461 31 134 81 1 169 40 304 27 885 9 122 3 075 51 170 177 556 82 130 66 339 28 059 29 999
2009 214 098 101 081 78 627 33 126 133 1 131 57 126 35 190 15 355 5 879 54 648 156 972 65 891 63 272 27 247 78 483
2010 275 093 142 924 96 092 34 330 295 1 452 66 149 45 043 15 022 5 279 82 722 208 943 97 880 81 069 29 050 213 730
2011 310 390 160 530 114 859 31 620 493 2 889 70 908 48 085 16 857 4 924 127 915 239 483 112 445 98 002 26 696 366 1 974
2012 369 264 186 772 149 286 30 831 715 1 660 77 121 53 928 18 366 4 420 117 290 292 143 132 844 130 920 26 411 599 1 370
2013
January 377 817 192 635 151 132 31 635 714 1 701 76 017 52 699 18 473 4 377 114 353 301 800 139 936 132 659 27 257 599 1 348
February 384 768 201 070 150 910 30 503 696 1 588 78 698 55 485 18 510 4 304 105 294 306 070 145 585 132 401 26 199 591 1 294
March 390 185 208 028 150 212 29 772 697 1 476 81 140 57 942 18 618 4 202 114 263 309 046 150 086 131 593 25 570 583 1 213
April 399 055 216 998 149 477 30 464 702 1 415 85 903 61 944 19 063 4 518 117 261 313 152 155 054 130 414 25 946 585 1 154
May 402 599 220 554 149 836 30 070 709 1 429 85 951 61 468 19 515 4 535 125 308 316 648 159 087 130 321 25 535 584 1 121
June 414 384 231 444 150 692 30 215 725 1 309 91 755 67 557 19 242 4 599 141 215 322 630 163 886 131 449 25 616 584 1 093
July 418 708 234 369 151 314 30 869 766 1 389 90 588 66 092 19 293 4 825 141 236 328 120 168 277 132 021 26 044 625 1 153
August 422 980 237 642 152 375 30 764 809 1 390 90 711 66 546 19 139 4 622 151 253 332 269 171 096 133 236 26 142 658 1 138
September 429 600 242 609 153 438 31 323 865 1 365 91 046 67 061 18 953 4 627 158 247 338 554 175 548 134 485 26 696 707 1 118
October 435 004 248 720 152 108 31 880 861 1 435 90 496 66 939 18 448 4 718 137 254 344 508 181 782 133 660 27 162 724 1 181
November 440 143 254 598 151 947 31 384 852 1 362 91 146 67 915 18 226 4 622 133 249 348 997 186 683 133 721 26 762 719 1 113
December 441 951 257 829 150 707 31 199 889 1 327 87 673 66 769 16 141 4 375 156 232 354 278 191 060 134 566 26 824 733 1 095
2014
January 437 562 256 361 148 970 30 090 793 1 348 84 166 62 990 16 560 4 264 118 234 353 396 193 371 132 410 25 826 675 1 114
February 449 028 236 818 174 406 35 312 895 1 597 80 226 54 456 20 084 5 276 130 281 368 802 182 362 154 322 30 036 766 1 316
including
Period Total
including by currencies transferable deposits other deposits
total
including by currencies
total
including by currencies

3. Monetary Statistics
3.2. Deposits held with deposit-taking corporations (excluding National Bank of Ukraine)
3.2.5. Deposits by other deposit-taking corporations
3.2.5.1. Deposits by other deposit-taking corporations, breakdown by type of currencies and agreed maturity
(outstanding amounts at end of period, in millions of hryvnias)
demand up to 1 year
over 1 year
and up to 2
years2
over 2
yearsdemand up to 1 year
over 1 year
and up to 2
years2
over 2
yearsdemand up to 1 year
over 1 year
and up to 2
years2
over 2
years
1 2 3 4 5 6 7 8 9 10 11 12 13 14 15 16
2005 3 595 3 087 458 50 … 1 710 1 434 264 12 … 1 885 1 653 194 38 …
2006 9 084 7 097 1 916 72 … 4 432 3 320 1 084 28 … 4 652 3 777 832 43 …
2007 14 056 11 945 2 023 72 16 8 616 7 449 1 100 65 2 5 440 4 496 923 7 14
2008 20 501 10 594 9 540 345 22 10 172 5 797 4 214 161 – 10 329 4 798 5 326 184 22
2009 26 810 16 072 10 574 140 25 13 135 7 914 5 166 55 – 13 676 8 158 5 407 85 25
2010 21 722 11 888 9 652 160 21 8 896 4 537 4 261 97 – 12 826 7 351 5 391 63 21
2011 28 026 13 540 14 167 183 136 12 057 6 530 5 294 156 75 15 970 7 010 8 873 26 61
2012 25 119 15 856 8 652 412 198 9 925 6 729 2 763 281 152 15 194 9 127 5 889 131 46
2013
January 22 651 15 887 6 167 398 198 8 815 6 784 1 612 267 152 13 836 9 103 4 555 131 47
February 25 578 18 259 6 726 396 197 9 891 8 091 1 390 259 152 15 687 10 167 5 337 138 46
March 29 294 20 473 8 217 407 197 11 631 10 092 1 118 270 152 17 663 10 382 7 099 137 45
April 35 652 25 452 9 619 384 197 15 689 13 109 2 168 260 152 19 963 12 343 7 451 124 45
May 38 613 25 955 12 073 389 197 16 842 13 291 3 138 261 151 21 772 12 664 8 934 128 46
June 38 114 23 422 14 137 360 195 16 822 12 270 4 148 255 149 21 292 11 152 9 989 105 46
July 39 288 23 452 15 276 365 196 18 082 13 019 4 646 267 149 21 206 10 433 10 630 97 46
August 39 185 24 978 13 647 365 196 18 320 13 961 3 942 267 149 20 865 11 017 9 705 97 47
September 37 242 23 753 12 917 377 195 16 804 13 235 3 153 267 149 20 437 10 518 9 764 110 46
October 35 744 21 007 14 228 277 232 15 468 11 048 4 090 151 179 20 276 9 959 10 138 126 53
November 35 190 22 049 12 632 277 233 15 198 11 782 3 085 151 179 19 992 10 267 9 547 126 53
December 36 646 23 179 12 863 370 233 16 788 13 899 2 462 247 179 19 858 9 280 10 401 123 54
2014
January 39 552 24 811 14 089 435 218 16 798 14 414 1 908 312 164 22 754 10 396 12 181 123 54
February 37 234 23 678 12 862 478 217 15 805 13 251 2 093 312 149 21 429 10 427 10 768 166 68
1 Since January 2009 the data include clearing accounts, amounts to be inquired and transit accounts.
2 To January 2007 data include deposits with agreed maturity over 1 year.
Period Total1
including by agreed maturity
including
total total
in foreign currencyin national currency
including by agreed maturity including by agreed maturity

3. Monetary Statistics
3.2. Deposits held with deposit-taking corporations (excluding National Bank of Ukraine)
3.2.5. Deposits by other deposit-taking corporations
3.2.5.2. Deposits by other deposit-taking corporations, in foreign currency, breakdown by currencies and agreed maturity
(outstanding amounts at end of period, in millions of hryvnias)
demandup to 1
year
over 1
year and
up to 2
years2
over 2
yearsdemand
up to 1
year
over 1
year and
up to 2
years2
over 2
yearsdemand
up to 1
year
over 1
year and
up to 2
years2
over 2
yearsdemand
up to 1
year
over 1
year and
up to 2
years2
over 2
years
1 2 3 4 5 6 7 8 9 10 11 12 13 14 15 16 17 18 19 20 21 22
2005 1 885 1 218 1 024 173 21 … 543 505 21 17 … 116 116 – – … 8 8 – – …
2006 4 652 3 388 2 598 756 34 … 1 205 1 121 76 9 … 41 41 – – … 18 18 – – …
2007 5 440 4 230 3 464 747 5 14 1 161 986 175 – – 35 35 – – – 14 11 – 2 –
2008 10 329 7 757 3 846 3 708 181 22 2 491 910 1 581 – – 39 23 16 – – 42 18 21 3 –
2009 13 676 10 023 5 948 3 967 83 25 3 621 2 213 1 409 – – 75 44 30 – – –44 –47 1 2 –
2010 12 826 9 878 6 153 3 642 61 21 2 761 1 056 1 705 0 – 133 101 32 – – 54 41 11 2 –
2011 15 970 11 620 5 607 5 925 26 61 4 034 1 215 2 818 – 0 177 78 99 – – 140 110 30 – –
2012 15 194 11 441 7 725 3 553 116 46 3 359 1 132 2 213 15 – 231 194 37 – – 163 76 86 – –
2013
January 13 836 10 551 8 016 2 371 116 47 3 083 890 2 178 15 – 123 118 5 – – 79 79 – – –
February 15 687 11 993 9 013 2 812 123 46 3 437 930 2 493 15 – 137 105 32 – – 120 120 – – –
March 17 663 13 380 9 075 4 137 123 45 4 026 1 053 2 959 15 – 144 141 3 – – 113 113 – – –
April 19 963 15 511 10 933 4 409 124 45 4 057 1 136 2 922 – – 85 82 3 – – 309 191 118 – –
May 21 772 17 070 11 315 5 582 128 46 4 540 1 199 3 342 – – 93 83 11 – – 68 68 – – –
June 21 292 15 606 9 108 6 348 105 46 5 032 1 401 3 631 – – 116 105 10 – – 538 538 – – –
July 21 206 15 791 8 953 6 695 97 46 5 301 1 377 3 924 – – 67 56 10 – – 47 46 1 – –
August 20 865 15 131 9 367 5 620 97 47 5 570 1 490 4 081 – – 90 87 3 – – 74 73 1 – –
September 20 437 14 628 8 811 5 661 110 46 5 661 1 565 4 095 – – 106 103 3 – – 43 39 4 – –
October 20 276 14 576 8 524 5 874 126 53 5 488 1 231 4 257 – – 114 111 3 – – 98 93 4 – –
November 19 992 14 571 8 816 5 575 126 53 5 153 1 188 3 964 – – 117 114 3 – – 152 148 4 – –
December 19 858 14 031 8 053 5 801 123 54 5 602 1 014 4 588 – – 109 100 10 – – 116 114 2 – –
2014
January 22 754 15 297 8 261 6 859 123 54 7 257 1 946 5 310 – – 149 139 10 – – 51 49 2 – –
February 21 429 14 748 8 240 6 274 166 68 6 552 2 065 4 487 – – 71 63 8 – – 59 59 – – –
1 Since January 2009 the data include clearing accounts, amounts to be inquired and transit accounts.
2 To January 2007 data include deposits with agreed maturity over 1 year.
including by agreed maturity
Russian
ruble
including by agreed maturity
other
curren-
cies
including by agreed maturity
Period Total1
including
US dollar
including by agreed maturity
Euro

3. Monetary Statistics
3.2. Deposits held with deposit-taking corporations (excluding National Bank of Ukraine)
3.2.6. Deposits by non-residents
3.2.6.1. Deposits by non-residents, breakdown by type of currencies and agreed maturity
(outstanding amounts at end of period, in millions of hryvnias)
demand up to 1 year
over 1 year
and up to 2
years2
over 2
yearsdemand up to 1 year
over 1 year
and up to 2
years2
over 2
yearsdemand up to 1 year
over 1 year
and up to 2
years2
over 2
years
1 2 3 4 5 6 7 8 9 10 11 12 13 14 15 16
2005 6 349 1 828 1 462 3 059 … 3 040 659 726 1 655 … 3 309 1 169 736 1 404 …
2006 8 350 3 373 657 4 320 … 2 982 1 617 61 1 304 … 5 368 1 756 597 3 016 …
2007 16 347 6 178 1 987 6 783 1 399 3 217 2 542 113 235 327 13 130 3 636 1 874 6 548 1 072
2008 45 123 5 485 1 987 21 090 16 561 2 236 1 628 171 131 306 42 887 3 856 1 816 20 959 16 256
2009 40 614 4 750 6 571 14 273 15 020 1 457 1 212 61 49 135 39 157 3 538 6 509 14 225 14 885
2010 25 928 7 088 2 364 8 738 7 737 5 803 3 571 212 1 297 723 20 125 3 517 2 152 7 441 7 014
2011 33 218 10 591 3 318 8 842 10 466 13 410 7 038 241 2 913 3 219 19 808 3 554 3 077 5 929 7 247
2012 30 749 7 140 4 319 10 342 8 948 7 170 2 031 209 1 897 3 033 23 579 5 109 4 109 8 446 5 916
2013
January 32 627 8 336 4 189 11 259 8 843 8 617 2 882 390 2 412 2 933 24 010 5 454 3 799 8 847 5 910
February 31 884 8 012 4 124 11 160 8 587 8 223 2 457 354 2 458 2 955 23 661 5 556 3 771 8 703 5 632
March 31 542 8 221 4 025 10 892 8 404 7 698 2 100 386 2 231 2 981 23 844 6 121 3 640 8 661 5 423
April 31 084 9 072 3 728 9 895 8 389 8 624 3 503 328 1 785 3 008 22 461 5 569 3 400 8 110 5 381
May 30 922 9 242 3 222 9 011 9 447 8 311 3 246 316 709 4 038 22 611 5 995 2 905 8 302 5 409
June 33 311 10 734 3 148 9 290 10 137 8 189 3 057 334 723 4 075 25 121 7 678 2 814 8 567 6 062
July 33 055 10 755 3 030 9 633 9 637 8 897 3 852 320 737 3 988 24 158 6 904 2 710 8 896 5 648
August 33 521 11 550 2 924 9 482 9 565 8 527 3 418 343 763 4 002 24 994 8 132 2 581 8 719 5 563
September 32 404 10 160 2 651 9 798 9 795 8 769 3 643 334 714 4 078 23 636 6 517 2 317 9 085 5 717
October 32 138 10 224 2 429 9 808 9 677 8 660 3 564 363 736 3 997 23 477 6 659 2 067 9 072 5 679
November 31 404 10 103 2 449 9 537 9 315 8 661 3 736 353 751 3 821 22 743 6 367 2 095 8 786 5 494
December 31 651 10 971 2 568 8 853 9 259 10 246 5 200 456 736 3 854 21 405 5 771 2 112 8 117 5 405
2014
January 30 495 12 860 2 395 8 499 6 741 9 257 6 740 340 800 1 377 21 238 6 120 2 055 7 699 5 364
February 33 561 12 894 2 600 10 219 7 848 8 242 6 127 269 717 1 129 25 319 6 767 2 331 9 502 6 718
1 Since January 2009 the data include clearing accounts, amounts to be inquired and transit accounts.
2 To January 2007 data include deposits with agreed maturity over 1 year.
Period Total1
including by agreed maturity
including
total total
in foreign currencyin national currency
including by agreed maturity including by agreed maturity

3. Monetary Statistics
3.2. Deposits held with deposit-taking corporations (excluding National Bank of Ukraine)
3.2.6. Deposits by non-residents
3.2.6.2. Deposits by non-residents, in foreign currency, breakdown by currencies and agreed maturity
(outstanding amounts at end of period, in millions of hryvnias)
demandup to 1
year
over 1
year and
up to 2
years2
over 2
yearsdemand
up to 1
year
over 1
year and
up to 2
years2
over 2
yearsdemand
up to 1
year
over 1
year and
up to 2
years2
over 2
yearsdemand
up to 1
year
over 1
year and
up to 2
years2
over 2
years
1 2 3 4 5 6 7 8 9 10 11 12 13 14 15 16 17 18 19 20 21 22
2005 3 309 … … … … … … … … … … … … … … … … … … … …
2006 5 368 4 762 1 511 460 2 791 … 529 175 136 217 … 66 58 – 8 … 11 11 – – …
2007 13 130 11 541 3 066 1 788 5 771 917 1 286 548 86 497 156 18 18 – 0 – 285 5 – 280 –
2008 42 887 37 482 3 184 1 203 17 892 15 203 4 417 640 572 2 956 250 27 27 0 0 – 960 5 41 111 803
2009 39 157 35 728 2 876 6 284 12 754 13 814 2 686 651 211 1 470 353 6 4 1 1 0 738 7 13 0 717
2010 20 125 16 819 2 954 1 872 6 026 5 968 2 256 523 212 1 209 313 92 33 57 2 0 957 7 11 205 733
2011 19 808 17 119 2 932 2 845 5 261 6 080 1 924 574 108 407 835 43 28 13 2 0 585 12 86 186 301
2012 23 579 20 076 4 199 3 762 7 351 4 764 2 859 873 322 991 674 32 16 5 10 0 612 21 20 93 478
2013
January 24 010 20 301 4 462 3 432 7 658 4 748 3 047 930 343 1 085 690 67 53 3 11 0 595 9 20 93 473
February 23 661 20 228 4 608 3 423 7 538 4 659 2 783 880 328 1 062 512 71 57 4 11 0 579 11 16 92 460
March 23 844 20 514 4 835 3 280 7 722 4 677 2 428 953 340 839 295 335 321 4 11 0 567 12 16 90 450
April 22 461 19 405 4 570 3 015 7 198 4 622 2 342 878 353 810 301 123 109 4 10 0 589 11 29 91 458
May 22 611 19 246 4 663 2 513 7 402 4 667 2 341 884 361 799 298 447 433 4 10 0 577 15 28 90 443
June 25 121 22 059 6 532 2 408 7 654 5 465 2 209 892 362 810 146 258 244 3 11 0 595 10 42 93 451
July 24 158 21 187 5 775 2 287 8 002 5 123 2 186 949 376 789 71 185 172 3 11 0 599 8 43 94 454
August 24 994 21 678 6 717 2 124 7 804 5 033 2 285 992 410 810 74 430 416 3 11 0 601 8 44 94 455
September 23 636 20 483 5 308 2 099 7 969 5 107 2 383 1 073 156 1 078 77 141 127 3 12 0 628 9 59 26 534
October 23 477 20 108 5 252 1 858 7 938 5 061 2 541 1 207 160 1 093 81 207 191 4 12 0 620 10 45 29 536
November 22 743 19 363 4 940 1 875 7 652 4 896 2 483 1 161 166 1 094 62 273 258 4 12 0 623 8 51 29 536
December 21 405 18 380 4 708 1 891 7 067 4 714 2 363 1 038 169 1 008 148 34 18 4 12 0 629 7 48 30 544
2014
January 21 238 17 726 4 545 1 843 6 654 4 683 2 345 1 031 159 1 007 148 551 536 4 11 0 616 8 48 26 534
February 25 319 21 635 5 435 2 043 8 292 5 865 2 828 1 261 222 1 163 182 80 61 5 14 0 775 10 61 33 671
1 Since January 2009 the data include clearing accounts, amounts to be inquired and transit accounts.
2 To January 2007 data include deposits with agreed maturity over 1 year.
including by agreed maturity
Russian
ruble
including by agreed maturity
other
curren-
cies
including by agreed maturity
Period Total1
US dollar
including
including by agreed maturity
Euro
3. Monetary Statistics
3.3. Loans granted by deposit-taking corporations (excluding National Bank of Ukraine)
3.3.1. Loans to resident (excluding deposit-taking corporations)
3.3.1.1. Loans to resident sectors
3.3.1.2. Loans to resident by type of currencies and original maturity
3.3.2. Loans to other financial corporations
3.3.2.1. Loans to other financial corporations, breakdown by original maturity
3.3.2.2. Loans to other financial corporations, breakdown by currencies
3.3.3. Loans to general government, breakdown by type of currencies
3.3.4. Loans to non-financial corporations
3.3.4.1. Loans to non-financial corporations, breakdown by original maturity
3.3.4.2. Loans to non-financial corporations, breakdown by currencies
3.3.4.3. Loans to non-financial corporations, breakdown by type of loans and original maturity
3.3.4.4. Loans to non-financial corporations, breakdown by type of loans and currencies
3.3.4.5. Loans to non-financial corporations, breakdown by type of industry, currencies and original maturity
3.3.4.6. Outstanding loans to non-financial corporations, breakdown by type of industry, currencies and original maturity
3.3.4.7. Loans to non-financial corporations, in foreign currency, breakdown by type of industry, currencies and original maturity
3.3.4.8. Loans to manufacturing industry, breakdown by type currencies and original maturity
3.3.5. Loans to households
3.3.5.1. Loans to households, breakdown by type of loans and original maturity
3.3.5.2. Loans to households, breakdown by type of loans and currencies
3.3.6. Loans to other deposit-taking corporations
3.3.6.1. Loans to other deposit-taking corporations, breakdown by type of currencies and original maturity
3.3.6.2. Loans to other deposit-taking corporations, in foreign currency, breakdown by currencies and original maturity
3.3.7. Loans to non-residents
3.3.7.1. Loans to non-residents, breakdown by type of currencies and original maturity
3.3.7.2. Loans to non-residents, in foreign currency, breakdown by currencies and maturity
3.3.7.3. Geographic distribution of loans, granted to non-residents

3. Monetary Statistics
3.3. Loans granted by deposit-taking corporations (excluding National Bank of Ukraine)
3.3.1. Loans to resident (excluding deposit-taking corporations)
3.3.1.1. Loans to resident sectors
insurance
corporations and
non-state pension
funds
other financial
intermediaries and
financial
auxiliaries
central governmentstate and local
government
public non-
financial
corporations1
other non-
financial
corporations1
households
non-profit
institutions
serving
households
1 2 3 4 5 6 7 8 9 10 11 12 13 14
outstanding amounts at end of period, in millions of hryvnias
2005 143 423 1 663 … … 5 – 5 106 078 6 391 99 687 35 677 35 659 18
2006 245 230 2 689 319 2 370 4 – 4 160 503 8 798 151 705 82 034 82 010 24
2007 426 867 5 932 550 5 382 4 – 4 260 476 13 326 247 150 160 455 160 386 69
2008 734 022 9 789 729 9 060 12 – 12 443 665 37 382 406 283 280 556 280 490 66
2009 723 295 14 014 632 13 382 5 755 4 527 1 229 462 215 42 587 419 627 241 311 241 249 63
2010 732 823 13 430 935 12 496 8 817 7 430 1 388 500 961 46 042 454 919 209 615 209 538 76
2011 801 809 16 441 1 006 15 435 8 532 6 790 1 742 575 545 57 452 518 093 201 291 201 224 67
2012 815 142 16 229 1 095 15 133 5 803 4 618 1 185 605 425 57 690 547 735 187 685 187 629 56
2013
February 823 879 17 410 1 006 16 403 5 564 4 617 947 612 641 55 296 557 345 188 265 188 219 46
March 826 596 19 379 1 075 18 305 5 580 4 620 960 613 186 53 903 559 283 188 450 188 406 44
April 830 278 17 811 1 053 16 758 5 528 4 626 902 616 828 55 288 561 540 190 111 190 055 56
May 830 353 17 671 1 065 16 606 5 522 4 621 901 616 281 53 720 562 562 190 880 190 824 55
June 837 761 19 105 1 219 17 886 5 517 4 618 899 623 098 52 937 570 161 190 041 189 984 58
July 841 799 17 215 1 116 16 099 5 526 4 620 907 628 188 52 705 575 483 190 870 190 785 84
August 851 247 17 412 1 155 16 257 5 528 4 623 905 635 248 52 976 582 271 193 060 192 970 90
September 864 304 18 341 1 155 17 186 5 326 4 419 908 647 274 54 274 593 000 193 363 193 270 93
October 872 309 17 727 673 17 055 4 972 4 059 913 655 289 53 700 601 589 194 320 194 228 92
November 887 611 19 548 700 18 848 5 621 4 707 914 669 621 55 729 613 892 192 821 192 729 92
December 910 782 19 317 523 18 795 5 908 4 998 910 691 903 50 472 641 431 193 654 193 529 125
2014
January 903 458 20 800 480 20 320 5 860 4 879 981 684 194 51 251 632 943 192 604 192 479 125
February 976 084 21 527 502 21 025 5 713 4 805 908 740 094 55 997 684 097 208 750 208 613 137
annual growth rates, %
2005 61.9 97.5 … … –87.2 – –87.2 48.2 16.5 50.8 121.0 121.1 20.0
2006 71.0 61.7 … … –11.5 – –11.5 51.3 37.7 52.2 129.9 130.0 34.0
2007 74.1 120.6 72.4 127.1 –10.8 – –10.8 62.3 51.5 62.9 95.6 95.6 185.1
2008 72.0 65.0 32.6 68.3 203.5 – 203.5 70.3 180.5 64.4 74.8 74.9 –4.4
2009 –1.5 43.2 –13.3 47.7 … … … 4.2 13.9 3.3 –14.0 –14.0 –4.8
2010 1.3 –4.2 47.9 –6.6 53.2 64.1 12.9 8.4 8.1 8.4 –13.1 –13.1 21.9
2011 9.4 22.4 7.7 23.5 –3.2 –8.6 25.5 14.9 24.8 13.9 –4.0 –4.0 –12.4
2012 1.7 –1.3 8.8 –2.0 –32.0 –32.0 –32.0 5.2 0.4 5.7 –6.8 –6.8 –16.0
2013
February 3.1 3.7 –29.2 6.7 –33.9 –30.7 –45.9 6.4 –0.5 7.1 –4.9 –4.9 –23.1
March 3.4 8.1 –33.1 12.2 –33.7 –30.0 –47.2 6.1 –3.2 7.1 –3.3 –3.3 –26.7
April 3.4 –0.9 –42.8 3.9 –34.3 –29.9 –50.2 5.9 1.9 6.3 –1.9 –1.9 –6.5
May 3.9 –0.9 –39.5 3.3 –34.4 –30.0 –50.3 6.2 –3.5 7.2 –0.7 –0.7 –8.3
June 4.4 5.0 –15.4 6.7 –34.6 –30.2 –50.4 6.3 –5.2 7.6 0.2 0.2 –4.1
July 5.3 –1.1 –7.4 –0.6 –29.0 –30.0 –23.5 7.4 –5.4 8.8 0.6 0.5 40.0
August 5.8 0.7 0.6 0.7 –29.0 –30.0 –23.7 7.7 –6.1 9.2 1.9 1.9 49.9
September 6.6 0.8 –15.6 2.1 –31.3 –32.5 –24.2 8.7 –4.4 10.1 2.2 2.2 61.3
October 6.9 5.0 –38.4 8.0 –35.8 –38.0 –23.7 9.0 –6.3 10.6 2.2 2.2 64.4
November 7.7 15.4 –36.1 19.0 –27.4 –28.1 –23.6 9.7 –2.7 11.0 2.0 2.0 59.7
December 11.7 19.0 –52.3 24.2 1.8 8.2 –23.2 14.3 –12.5 17.1 3.2 3.1 122.3
2014
January 10.4 21.2 –52.0 25.7 5.0 5.7 1.9 12.7 –10.0 15.1 2.3 2.2 116.8
February 18.5 23.7 –50.1 28.2 2.7 4.1 –4.1 20.8 1.3 22.7 10.9 10.8 197.3
including
other resident sectors
1 In March and November 2010 there has been a reclassification of subsectors of the sector S.11 “Non-financial corporations” according to the Classification of Institutional Sectors of the Economy of Ukraine, approved by the decree of the State Statistics
Committee of Ukraine № 96 of April 18,2005 (amended).
total
including
total
including
Period Total
non-financial corporationsother financial corporations general government
totaltotal
includingincluding

3. Monetary Statistics
3.3. Loans granted by deposit-taking corporations (excluding National Bank of Ukraine)
3.3.1. Loans to resident (excluding deposit-taking corporations)
3.3.1.2. Loans to resident by type of currencies and original maturity
up to 1 yearover 1 year and up
to 5 yearsover 5 years up to 1 year
over 1 year and up
to 5 yearsover 5 years up to 1 year
over 1 year and up
to 5 yearsover 5 years
1 2 3 4 5 6 7 8 9 10 11 12 13
outstanding amounts at end of period, in millions of hryvnias
2005 143 423 54 823 88 601 … 81 279 39 477 41 802 … 62 144 15 346 46 798 …
2006 245 230 86 197 159 033 … 123 787 60 105 63 682 … 121 443 26 092 95 351 …
2007 426 867 131 505 181 311 114 052 213 802 95 159 94 562 24 081 213 065 36 346 86 748 89 971
2008 734 022 222 033 278 581 233 408 300 220 129 048 132 079 39 093 433 801 92 985 146 501 194 315
2009 723 295 230 974 266 699 225 623 355 521 163 952 147 340 44 229 367 774 67 022 119 359 181 394
2010 732 823 242 772 275 605 214 446 395 504 173 845 171 949 49 709 337 319 68 927 103 655 164 737
2011 801 809 297 422 301 002 203 385 478 596 218 240 200 142 60 214 323 213 79 182 100 860 143 171
2012 815 142 344 237 294 511 176 394 515 580 255 556 194 559 65 465 299 562 88 681 99 952 110 929
2013
February 823 879 358 164 289 167 176 548 524 153 262 920 195 127 66 105 299 726 95 245 94 040 110 442
March 826 596 362 688 288 649 175 260 521 134 261 134 194 000 66 000 305 463 101 554 94 649 109 260
April 830 278 361 084 295 255 173 939 523 436 257 358 199 645 66 434 306 842 103 726 95 610 107 506
May 830 353 363 595 294 078 172 680 524 895 260 309 197 942 66 644 305 458 103 286 96 136 106 036
June 837 761 370 936 294 948 171 877 532 395 266 682 198 982 66 731 305 366 104 253 95 966 105 147
July 841 799 371 654 296 724 173 421 534 734 266 014 199 235 69 485 307 064 105 640 97 489 103 936
August 851 247 377 004 302 496 171 747 544 383 275 338 198 684 70 360 306 865 101 666 103 812 101 387
September 864 304 387 965 306 409 169 930 558 059 285 342 202 633 70 084 306 244 102 623 103 775 99 846
October 872 309 389 132 309 687 173 489 564 896 287 695 203 998 73 204 307 412 101 438 105 689 100 286
November 887 611 400 122 314 612 172 878 582 157 300 741 207 706 73 710 305 454 99 380 106 906 99 168
December 910 782 426 082 310 739 173 961 602 776 325 299 203 671 73 805 308 006 100 783 107 068 100 156
2014
January 903 458 417 587 310 929 174 942 601 342 319 779 205 669 75 895 302 116 97 809 105 260 99 047
February 976 084 431 400 349 614 195 069 591 703 306 977 209 585 75 141 384 381 124 424 140 029 119 929
annual growth rates, %
2005 61.9 35.1 84.5 … 58.6 46.9 71.6 … 66.3 11.9 97.8 …
2006 71.0 57.2 79.5 … 52.3 52.3 52.3 … 95.4 70.0 103.7 …
2007 74.1 52.6 14.0 … 72.7 58.3 48.5 … 75.4 39.3 –9.0 …
2008 72.0 68.8 53.6 104.7 40.4 35.6 39.7 62.3 103.6 155.8 68.9 116.0
2009 –1.5 4.0 –4.3 –3.3 18.4 27.0 11.6 13.1 –15.2 –27.9 –18.5 –6.6
2010 1.3 5.1 3.3 –5.0 11.2 6.0 16.7 12.4 –8.3 2.8 –13.2 –9.2
2011 9.4 22.5 9.2 –5.2 21.0 25.5 16.4 21.1 –4.2 14.9 –2.7 –13.1
2012 1.7 15.7 –2.2 –13.3 7.7 17.1 –2.8 8.7 –7.3 12.0 –0.9 –22.5
2013
February 3.1 18.0 –2.4 –11.4 10.2 18.4 0.9 9.8 –7.3 16.9 –8.5 –20.6
March 3.4 17.8 –3.0 –9.5 8.6 14.8 0.9 9.9 –4.4 26.1 –10.1 –18.2
April 3.4 16.6 –2.1 –9.3 8.2 12.2 3.0 9.6 –3.8 29.3 –11.2 –18.0
May 3.9 14.6 0.2 –8.3 7.6 9.8 3.7 11.2 –1.8 29.0 –6.3 –17.4
June 4.4 14.9 0.1 –7.1 7.4 10.4 2.8 10.4 –0.4 28.6 –5.0 –15.5
July 5.3 15.6 0.7 –5.6 8.3 11.5 2.6 13.4 0.4 27.4 –2.9 –15.1
August 5.8 16.1 2.3 –6.5 8.8 14.6 1.0 10.8 1.0 20.3 4.9 –15.7
September 6.6 16.9 3.2 –6.5 10.2 15.9 3.1 9.5 0.8 19.7 3.4 –15.2
October 6.9 15.6 4.3 –4.8 10.6 14.9 4.7 12.3 0.7 17.7 3.6 –14.3
November 7.7 15.8 5.3 –3.9 13.2 19.1 5.9 12.7 –1.5 6.9 4.1 –13.4
December 11.7 23.8 5.5 –1.4 16.9 27.3 4.7 12.7 2.8 13.6 7.1 –9.7
2014
January 10.4 20.3 5.5 –0.8 16.1 24.4 5.2 16.0 0.7 8.7 6.2 –10.7
February 18.5 20.4 20.9 10.5 12.9 16.8 7.4 13.7 28.2 30.6 48.9 8.6
including by original maturity
total
including by original maturity
1 To January 2007, data include loans with original maturity over 1 year.
Period Total
total
including by original maturity
including
in national currency in foreign currency

3. Monetary Statistics
3.3. Loans granted by deposit-taking corporations (excluding National Bank of Ukraine)
3.3.2. Loans to other financial corporations
3.3.2.1. Loans to other financial corporations, breakdown by original maturity
(outstanding amounts at end of period, in millions of hryvnias)
up to 1 year
over 1 year
and up to 5
years1
over 5
yearsup to 1 year
over 1 year
and up to 5
years1
over 5
yearsup to 1 year
over 1 year
and up to 5
years1
over 5
years
1 2 3 4 5 6 7 8 9 10 11 12 13
2005 1 663 991 672 … … … … … … … … …
2006 2 689 1 341 1 348 … 319 201 118 … 2 370 1 140 1 230 …
2007 5 932 2 823 2 626 484 550 340 187 24 5 382 2 483 2 439 460
2008 9 789 3 913 4 934 942 729 386 322 22 9 060 3 527 4 612 921
2009 14 014 8 659 4 001 1 354 632 299 310 23 13 382 8 359 3 691 1 332
2010 13 430 7 478 4 682 1 271 935 501 394 40 12 496 6 977 4 288 1 231
2011 16 441 9 274 5 953 1 214 1 006 343 625 39 15 435 8 931 5 328 1 175
2012 16 229 9 094 6 116 1 019 1 095 930 122 44 15 133 8 164 5 994 976
2013
February 17 410 10 118 6 292 999 1 006 839 123 45 16 403 9 279 6 170 955
March 19 379 11 807 6 622 950 1 075 874 155 45 18 305 10 933 6 467 905
April 17 811 10 565 6 296 950 1 053 882 125 46 16 758 9 683 6 171 904
May 17 671 10 383 6 340 949 1 065 880 139 46 16 606 9 503 6 201 902
June 19 105 11 684 6 484 937 1 219 1 004 168 47 17 886 10 680 6 316 890
July 17 215 10 091 6 225 900 1 116 915 154 47 16 099 9 176 6 071 852
August 17 412 10 296 6 249 867 1 155 936 171 48 16 257 9 360 6 078 819
September 18 341 10 784 6 715 842 1 155 938 170 47 17 186 9 846 6 544 796
October 17 727 10 014 6 833 881 673 456 169 47 17 055 9 557 6 664 834
November 19 548 11 491 7 179 878 700 472 180 48 18 848 11 019 6 999 830
December 19 317 11 056 7 247 1 015 523 307 168 48 18 795 10 749 7 079 967
2014
January 20 800 11 982 7 792 1 026 480 261 158 61 20 320 11 720 7 634 966
February 21 527 12 195 8 225 1 108 502 249 189 64 21 025 11 946 8 035 1 044
1 To January 2007, data include loans with original maturity over 1 year.
Period Total
including by original maturity
including
total total
other financial intermediaries and financial
auxiliariesinsurance corporations and non-state pension funds
including by original maturity including by original maturity
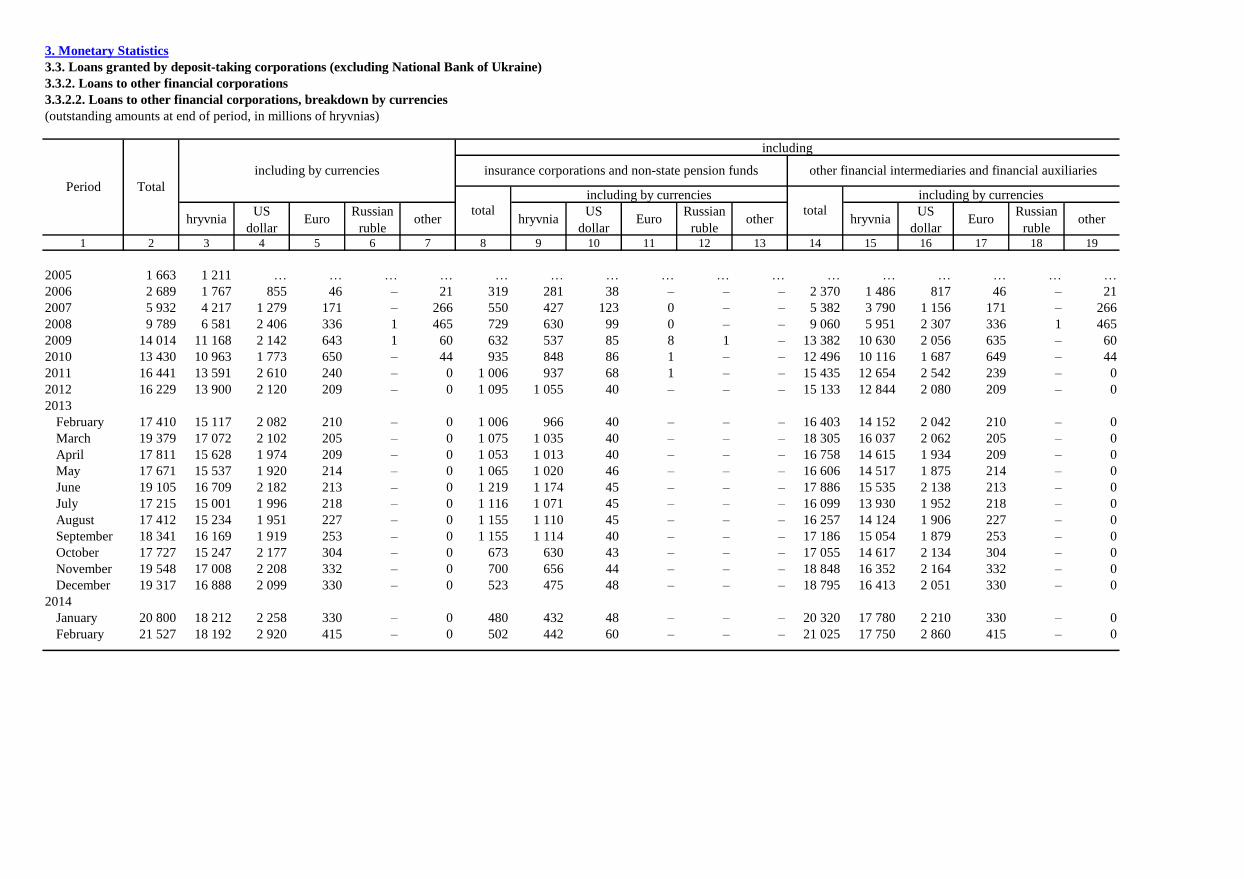
3. Monetary Statistics
3.3. Loans granted by deposit-taking corporations (excluding National Bank of Ukraine)
3.3.2. Loans to other financial corporations
3.3.2.2. Loans to other financial corporations, breakdown by currencies
(outstanding amounts at end of period, in millions of hryvnias)
hryvniaUS
dollarEuro
Russian
rubleother hryvnia
US
dollarEuro
Russian
rubleother hryvnia
US
dollarEuro
Russian
rubleother
1 2 3 4 5 6 7 8 9 10 11 12 13 14 15 16 17 18 19
2005 1 663 1 211 … … … … … … … … … … … … … … … …
2006 2 689 1 767 855 46 – 21 319 281 38 – – – 2 370 1 486 817 46 – 21
2007 5 932 4 217 1 279 171 – 266 550 427 123 0 – – 5 382 3 790 1 156 171 – 266
2008 9 789 6 581 2 406 336 1 465 729 630 99 0 – – 9 060 5 951 2 307 336 1 465
2009 14 014 11 168 2 142 643 1 60 632 537 85 8 1 – 13 382 10 630 2 056 635 – 60
2010 13 430 10 963 1 773 650 – 44 935 848 86 1 – – 12 496 10 116 1 687 649 – 44
2011 16 441 13 591 2 610 240 – 0 1 006 937 68 1 – – 15 435 12 654 2 542 239 – 0
2012 16 229 13 900 2 120 209 – 0 1 095 1 055 40 – – – 15 133 12 844 2 080 209 – 0
2013
February 17 410 15 117 2 082 210 – 0 1 006 966 40 – – – 16 403 14 152 2 042 210 – 0
March 19 379 17 072 2 102 205 – 0 1 075 1 035 40 – – – 18 305 16 037 2 062 205 – 0
April 17 811 15 628 1 974 209 – 0 1 053 1 013 40 – – – 16 758 14 615 1 934 209 – 0
May 17 671 15 537 1 920 214 – 0 1 065 1 020 46 – – – 16 606 14 517 1 875 214 – 0
June 19 105 16 709 2 182 213 – 0 1 219 1 174 45 – – – 17 886 15 535 2 138 213 – 0
July 17 215 15 001 1 996 218 – 0 1 116 1 071 45 – – – 16 099 13 930 1 952 218 – 0
August 17 412 15 234 1 951 227 – 0 1 155 1 110 45 – – – 16 257 14 124 1 906 227 – 0
September 18 341 16 169 1 919 253 – 0 1 155 1 114 40 – – – 17 186 15 054 1 879 253 – 0
October 17 727 15 247 2 177 304 – 0 673 630 43 – – – 17 055 14 617 2 134 304 – 0
November 19 548 17 008 2 208 332 – 0 700 656 44 – – – 18 848 16 352 2 164 332 – 0
December 19 317 16 888 2 099 330 – 0 523 475 48 – – – 18 795 16 413 2 051 330 – 0
2014
January 20 800 18 212 2 258 330 – 0 480 432 48 – – – 20 320 17 780 2 210 330 – 0
February 21 527 18 192 2 920 415 – 0 502 442 60 – – – 21 025 17 750 2 860 415 – 0
Period
total total
other financial intermediaries and financial auxiliariesinsurance corporations and non-state pension funds
Total
including by currencies
including
including by currencies including by currencies

3. Monetary Statistics
3.3. Loans granted by deposit-taking corporations (excluding National Bank of Ukraine)
3.3.3.Loans to general government, breakdown by type of currencies
(outstanding amounts at end of period, in millions of hryvnias)
in national
currency
in foreign
currency
in national
currency
in foreign
currency
in national
currency
in foreign
currency1 2 3 4 5 6 7 8 9 10
2005 5 5 – – – – 5 5 –
2006 4 4 – – – – 4 4 –
2007 4 4 – – – – 4 4 –
2008 12 12 – – – – 12 12 –
2009 5 755 5 755 – 4 527 4 527 – 1 229 1 229 –
2010 8 817 8 817 – 7 430 7 430 – 1 388 1 388 –
2011 8 532 8 532 – 6 790 6 790 – 1 742 1 742 –
2012 5 803 5 803 0 4 618 4 618 – 1 185 1 185 0
2013
February 5 564 5 564 0 4 617 4 617 – 947 947 0
March 5 580 5 580 0 4 620 4 620 – 960 960 0
April 5 528 5 528 0 4 626 4 626 – 902 902 0
May 5 522 5 522 0 4 621 4 621 – 901 901 0
June 5 517 5 517 – 4 618 4 618 – 899 899 –
July 5 526 5 526 – 4 620 4 620 – 907 907 –
August 5 528 5 528 – 4 623 4 623 – 905 905 –
September 5 326 5 326 – 4 419 4 419 – 908 908 –
October 4 972 4 972 – 4 059 4 059 – 913 913 –
November 5 621 5 621 – 4 707 4 707 – 914 914 –
December 5 908 5 908 – 4 998 4 998 – 910 910 –
2014
January 5 860 5 860 – 4 879 4 879 – 981 981 –
February 5 713 5 713 – 4 805 4 805 – 908 908 –
Period
total total
central government state and local government
Total
including
including
including including

3. Monetary Statistics
3.3. Loans granted by deposit-taking corporations (excluding National Bank of Ukraine)
3.3.4. Loans to non-financial corporations
3.3.4.1. Loans to non-financial corporations, breakdown by original maturity
(outstanding amounts at end of period, in millions of hryvnias)
up to 1 year
over 1 year
and up to 5
years1
over 5 years up to 1 year
over 1 year
and up to 5
years1
over 5
yearsup to 1 year
over 1 year
and up to 5
years1
over 5 years
1 2 3 4 5 6 7 8 9 10 11 12 13
2005 106 078 47 028 59 050 … 6 391 3 537 2 854 … 99 687 43 491 56 196 …
2006 160 503 72 050 88 452 … 8 798 5 353 3 444 … 151 705 66 697 85 008 …
2007 260 476 107 921 128 239 24 315 13 326 8 173 4 538 615 247 150 99 748 123 701 23 700
2008 443 665 190 299 203 247 50 119 37 382 20 652 16 209 521 406 283 169 647 187 038 49 598
2009 462 215 199 323 206 536 56 356 42 587 25 734 16 531 322 419 627 173 589 190 004 56 034
2010 500 961 208 201 224 112 68 647 46 042 19 033 26 224 785 454 919 189 168 197 888 67 863
2011 575 545 251 298 244 410 79 837 57 452 28 475 28 894 83 518 093 222 823 215 517 79 753
2012 605 425 296 547 235 171 73 707 57 690 26 545 30 887 259 547 735 270 002 204 284 73 448
2013
February 612 641 305 480 230 976 76 184 55 296 23 913 31 103 280 557 345 281 568 199 873 75 904
March 613 186 307 263 229 440 76 484 53 903 22 812 30 772 319 559 283 284 451 198 667 76 165
April 616 828 304 642 235 995 76 191 55 288 24 373 30 558 356 561 540 280 269 205 437 75 835
May 616 281 305 141 235 112 76 029 53 720 23 408 29 938 374 562 562 281 733 205 174 75 655
June 623 098 310 517 235 727 76 854 52 937 22 501 30 033 404 570 161 288 017 205 695 76 450
July 628 188 311 628 238 909 77 650 52 705 21 102 31 198 405 575 483 290 526 207 711 77 246
August 635 248 315 102 243 321 76 824 52 976 21 412 31 165 399 582 271 293 690 212 156 76 425
September 647 274 324 585 245 990 76 698 54 274 21 353 32 486 435 593 000 303 232 213 505 76 263
October 655 289 325 013 249 165 81 111 53 700 21 311 31 957 432 601 589 303 702 217 208 80 680
November 669 621 334 063 253 110 82 447 55 729 23 119 32 138 472 613 892 310 945 220 972 81 975
December 691 903 358 812 247 827 85 264 50 472 23 013 26 835 624 641 431 335 799 220 991 84 640
2014
January 684 194 348 278 247 038 88 878 51 251 23 365 27 270 616 632 943 324 913 219 768 88 262
February 740 094 361 123 280 199 98 772 55 997 26 100 29 166 731 684 097 335 023 251 033 98 041
1 To January 2007, data include loans with original maturity over 1 year.
total total
2 In March and November 2010 there has been a reclassification of subsectors of the sector S.11 “Non-financial corporations” according to the Classification of Institutional Sectors
of the Economy of Ukraine, approved by the decree of the State Statistics Committee of Ukraine # 96 of April 18,2005 (amended).
Period Total
including by original maturity
including
public non-financial corporations2
other non-financial corporations2
including by original maturity including by original maturity

3. Monetary Statistics
3.3. Loans granted by deposit-taking corporations (excluding National Bank of Ukraine)
3.3.4. Loans to non-financial corporations
3.3.4.2. Loans to non-financial corporations, breakdown by currencies
(outstanding amounts at end of period, in millions of hryvnias)
hryvniaUS
dollarEuro
Russian
rubleother hryvnia
US
dollarEuro
Russian
rubleother hryvnia
US
dollarEuro
Russian
rubleother
1 2 3 4 5 6 7 8 9 10 11 12 13 14 15 16 17 18 19
2005 106 078 64 745 35 666 5 289 201 177 6 391 4 581 1 543 260 7 – 99 687 60 164 34 123 5 029 194 177
2006 160 503 91 307 56 383 11 371 225 1 217 8 798 6 369 2 118 240 2 68 151 705 84 938 54 265 11 131 223 1 149
2007 260 476 151 135 90 398 15 971 432 2 539 13 326 10 625 2 220 185 3 293 247 150 140 511 88 178 15 786 429 2 247
2008 443 665 214 774 198 099 26 901 770 3 121 37 382 30 937 5 767 223 16 438 406 283 183 837 192 333 26 678 754 2 682
2009 462 215 271 907 159 056 27 875 906 2 471 42 587 35 867 4 301 2 395 21 3 419 627 236 040 154 755 25 480 885 2 468
2010 500 961 310 929 162 839 23 701 1 662 1 830 46 042 37 989 7 710 241 101 1 454 919 272 939 155 128 23 461 1 561 1 829
2011 575 545 369 763 176 535 25 088 3 162 998 57 452 48 108 8 501 479 363 – 518 093 321 655 168 034 24 608 2 798 998
2012 605 425 393 147 180 238 27 767 3 604 669 57 690 43 309 13 513 502 367 – 547 735 349 839 166 726 27 265 3 236 669
2013
February 612 641 398 209 182 513 27 563 3 721 634 55 296 42 302 12 190 450 354 – 557 345 355 907 170 323 27 113 3 368 634
March 613 186 392 005 189 580 27 152 3 828 621 53 903 41 389 11 690 453 371 – 559 283 350 616 177 891 26 699 3 456 621
April 616 828 392 800 192 158 27 414 3 782 673 55 288 41 414 12 989 483 402 – 561 540 351 386 179 169 26 931 3 380 673
May 616 281 392 238 193 006 26 503 3 858 676 53 720 40 123 12 742 497 358 – 562 562 352 115 180 265 26 005 3 501 676
June 623 098 397 963 193 355 27 433 3 726 621 52 937 38 542 13 543 491 362 – 570 161 359 421 179 813 26 942 3 364 621
July 628 188 399 492 196 551 27 987 3 534 624 52 705 37 899 13 943 500 362 – 575 483 361 592 182 608 27 486 3 172 624
August 635 248 405 927 197 960 27 193 3 548 619 52 976 37 804 14 293 502 378 – 582 271 368 124 183 667 26 691 3 171 619
September 647 274 416 780 198 646 27 578 3 639 631 54 274 38 910 14 365 611 387 – 593 000 377 870 184 281 26 967 3 251 631
October 655 289 422 878 199 925 28 309 3 547 631 53 700 38 662 14 058 588 391 – 601 589 384 216 185 867 27 720 3 156 631
November 669 621 436 342 202 279 27 163 3 316 520 55 729 39 987 14 799 629 314 – 613 892 396 356 187 480 26 534 3 003 520
December 691 903 454 215 203 942 29 912 3 320 514 50 472 35 417 14 076 706 272 – 641 431 418 797 189 866 29 205 3 048 514
2014
January 684 194 451 304 200 125 29 270 2 982 513 51 251 36 404 14 013 597 238 – 632 943 414 900 186 112 28 674 2 744 513
February 740 094 440 830 258 506 36 352 3 756 649 55 997 37 115 17 829 751 302 – 684 097 403 715 240 677 35 601 3 454 649
total
including by currencies
1 In March and November 2010 there has been a reclassification of subsectors of the sector S.11 “Non-financial corporations” according to the Classification of Institutional Sectors of the Economy of
Ukraine, approved by the decree of the State Statistics Committee of Ukraine # 96 of April 18,2005 (amended).
Periodpublic non-financial corporations
1
Total
including by currencies
including
other non-financial corporations1
total
including by currencies

3. Monetary Statistics
3.3. Loans granted by deposit-taking corporations (excluding National Bank of Ukraine)
3.3.4. Loans to non-financial corporations
3.3.4.3. Loans to non-financial corporations, breakdown by type of loans and original maturity
(outstanding amounts at end of period, in millions of hryvnias)
up to 1 year
over 1
year and
up to 5
years1
over 5
yearsup to 1 year
over 1
year and
up to 5
years1
over 5
years
up to 1
year
over 1 year
and up to 5
years1
over 5
years
1 2 3 4 5 6 7 8 9 10 11 12 13 14 15 16 17
2005 106 078 … … … … … … … … … … … … … … …
2006 160 503 72 050 88 452 … 6 405 675 5 730 … 154 098 71 375 82 723 … 10 507 852 9 655 …
2007 260 476 107 921 128 239 24 315 10 618 1 380 5 862 3 376 249 858 106 541 122 377 20 939 49 095 11 911 27 902 9 282
2008 443 665 190 299 203 247 50 119 18 262 2 776 8 337 7 150 425 402 187 523 194 910 42 970 79 193 21 217 40 784 17 193
2009 462 215 199 323 206 536 56 356 17 670 2 677 7 600 7 393 444 545 196 646 198 936 48 963 75 648 20 407 37 112 18 130
2010 500 961 208 201 224 112 68 647 13 612 2 080 4 750 6 782 487 349 206 120 219 363 61 866 74 508 24 459 32 690 17 359
2011 575 545 251 298 224 076 100 171 10 318 1 429 3 457 5 431 565 227 249 869 220 619 94 739 74 390 19 859 35 508 19 023
2012 605 425 296 547 235 171 73 707 7 467 1 142 2 654 3 671 597 958 295 405 232 517 70 037 112 061 31 528 53 269 27 264
2013
February 612 641 305 480 230 976 76 184 13 280 1 433 6 087 5 760 599 361 304 048 224 890 70 423 106 211 32 657 45 886 27 668
March 613 186 307 263 229 440 76 484 12 857 1 272 6 010 5 576 600 329 305 991 223 430 70 908 115 084 35 190 51 158 28 737
April 616 828 304 642 235 995 76 191 12 784 1 080 5 980 5 724 604 043 303 562 230 015 70 466 112 850 34 783 51 097 26 970
May 616 281 305 141 235 112 76 029 12 809 1 085 6 000 5 724 603 473 304 056 229 112 70 304 111 783 34 816 50 431 26 536
June 623 098 310 517 235 727 76 854 12 896 1 102 5 982 5 812 610 202 309 415 229 746 71 042 107 490 34 854 46 909 25 726
July 628 188 311 628 238 909 77 650 12 864 1 086 6 305 5 473 615 323 310 542 232 604 72 177 109 586 36 138 47 450 25 997
August 635 248 315 102 243 321 76 824 13 070 1 141 6 389 5 540 622 177 313 961 236 932 71 284 110 145 35 930 48 073 26 142
September 647 274 324 585 245 990 76 698 12 861 1 359 6 045 5 456 634 413 323 226 239 945 71 242 111 477 36 683 48 551 26 243
October 655 289 325 013 249 165 81 111 13 488 1 343 6 384 5 761 641 802 323 670 242 781 75 351 112 567 37 238 46 560 28 769
November 669 621 334 063 253 110 82 447 13 491 1 237 6 521 5 733 656 130 332 827 246 589 76 714 110 696 35 356 48 276 27 064
December 691 903 358 812 247 827 85 264 13 026 950 6 635 5 441 678 877 357 862 241 191 79 823 110 708 34 834 47 303 28 572
2014
January 684 194 348 278 247 038 88 878 12 921 832 6 553 5 536 671 273 347 445 240 486 83 342 107 345 33 219 45 576 28 550
February 740 094 361 123 280 199 98 772 14 311 853 8 114 5 344 725 783 360 270 272 085 93 428 111 693 36 780 51 473 23 441
4 Starting from February 2013, banks have revised classification of loans by types of loans due to changes in accounting.
Commercial real estate loans4
including by original maturity
total
including by type of loans
3 Starting from February 2012, classification of loans has been revised by types of collateral. The mortgage loans include loans backed by several types of collateral, among which the largest value of
collateral falls on:
property rights for future real estate of residential properties;
property rights for other future real estate;
real estate of residential properties;
other real estate.
2 Since September 2011 mortgage credits comprise credits backed by several types of collateral, among which the cost of mortgage is the highest.
1 To January 2007, data include loans with original maturity over 1 year and up to 5 years as well as loans with original maturity over 5 years.
TotalPeriod
up to 1
year
Other lending
Mortgage credits2,3
. From sum total.
including by original maturity
over 1
year and
up to 5
years1
including by original maturity
over 5
yearstotal
including by original maturity
total3

3. Monetary Statistics
3.3. Loans granted by deposit-taking corporations (excluding National Bank of Ukraine)
3.3.4. Loans to non-financial corporations
3.3.4.4. Loans to non-financial corporations, breakdown by type of loans and currencies
(outstanding amounts at end of period, in millions of hryvnias)
hryvniaUS
dollarEuro
Rus-
sian
ruble
other hryvniaUS
dollarEuro
Rus-
sian
ruble
other
1 2 3 4 5 6 7 8 9 10 11 12 13 14 15 16 17 18 19 20 21 22 23 24 25
2005 106 078 … … … … … … … … … … … … … … … … … … … … … … …
2006 160 503 91 307 56 383 11 371 225 1 217 6 405 2 494 3 429 391 33 59 154 098 88 813 52 955 10 980 192 1 158 10 507 4 081 5 359 966 34 67
2007 260 476 151 135 90 398 15 971 432 2 539 10 618 5 094 5 057 382 0 85 249 858 146 041 85 340 15 589 432 2 455 49 095 26 649 19 608 2 241 39 559
2008 443 665 214 774 198 099 26 901 770 3 121 18 262 5 680 11 857 588 0 137 425 402 209 093 186 243 26 313 770 2 983 79 193 36 172 38 339 3 961 31 690
2009 462 215 271 907 159 056 27 875 906 2 471 17 670 6 510 10 491 534 – 135 444 545 265 397 148 565 27 341 906 2 335 75 648 41 345 30 392 3 234 26 652
2010 500 961 310 929 162 839 23 701 1 662 1 830 13 612 5 313 7 687 471 5 135 487 349 305 616 155 151 23 230 1 657 1 695 74 508 41 191 29 762 2 978 79 499
2011 575 545 369 763 176 535 25 088 3 162 998 10 318 4 365 5 250 624 5 74 565 227 365 398 171 285 24 464 3 157 923 74 390 45 199 24 625 3 965 410 191
2012 605 425 393 147 180 238 27 767 3 604 669 7 467 3 457 3 409 523 12 65 597 958 389 690 176 829 27 244 3 592 604 112 061 63 152 42 184 5 963 659 102
2013
February 612 641 398 209 182 513 27 563 3 721 634 13 280 5 921 6 290 926 82 61 599 361 392 288 176 223 26 637 3 640 574 106 211 61 127 38 873 5 591 547 73
March 613 186 392 005 189 580 27 152 3 828 621 12 857 5 811 6 005 904 78 59 600 329 386 195 183 575 26 248 3 750 562 115 084 61 060 46 335 6 927 483 280
April 616 828 392 800 192 158 27 414 3 782 673 12 784 5 814 5 978 858 76 59 604 043 386 986 186 181 26 556 3 706 614 112 850 63 829 42 592 5 609 549 272
May 616 281 392 238 193 006 26 503 3 858 676 12 809 5 928 5 953 798 72 57 603 473 386 310 187 053 25 705 3 786 619 111 783 62 705 42 199 6 089 528 263
June 623 098 397 963 193 355 27 433 3 726 621 12 896 6 017 5 960 793 67 59 610 202 391 947 187 395 26 640 3 659 562 107 490 59 863 41 009 5 833 444 340
July 628 188 399 492 196 551 27 987 3 534 624 12 864 6 134 5 805 803 64 59 615 323 393 358 190 747 27 184 3 470 565 109 586 59 772 42 864 6 042 566 341
August 635 248 405 927 197 960 27 193 3 548 619 13 070 6 332 5 819 801 62 57 622 177 399 596 192 141 26 392 3 487 562 110 145 59 836 43 659 5 830 469 350
September 647 274 416 780 198 646 27 578 3 639 631 12 861 6 154 5 793 794 61 58 634 413 410 626 192 854 26 783 3 578 573 111 477 60 531 44 484 5 624 483 355
October 655 289 422 878 199 925 28 309 3 547 631 13 488 6 587 5 977 806 59 59 641 802 416 291 193 948 27 502 3 488 572 112 567 62 059 43 811 5 883 461 354
November 669 621 436 342 202 279 27 163 3 316 520 13 491 6 629 5 978 770 56 58 656 130 429 714 196 301 26 393 3 260 462 110 696 60 701 43 674 5 533 432 355
December 691 903 454 215 203 942 29 912 3 320 514 13 026 6 303 5 833 779 53 59 678 877 447 912 198 110 29 133 3 268 455 110 708 60 100 42 973 6 704 568 363
2014
January 684 194 451 304 200 125 29 270 2 982 513 12 921 6 222 5 834 760 46 58 671 273 445 082 194 291 28 510 2 936 454 107 345 59 255 40 446 6 779 522 343
February 740 094 440 830 258 506 36 352 3 756 649 14 311 6 188 7 255 738 56 74 725 783 434 642 251 251 35 615 3 700 575 111 693 53 352 50 812 6 372 721 436
1 Since September 2011 mortgage credits comprise credits backed by several types of collateral, among which the cost of mortgage is the highest.
3 Starting from February 2013, banks have revised classification of loans by types of loans due to changes in accounting.
total3Euro
including by currencies
other
including by currencies
Mortgage credits1,2
. From sum total.
Other lending
including by type of loans
total
Commercial real estate loans3
total hryvniaUS
dollar
including by currencies
2 Starting from February 2012, classification of loans has been revised by types of collateral. The mortgage loans include loans backed by several types of collateral, among which the largest value of collateral falls on:
property rights for future real estate of residential properties;
property rights for other future real estate;
real estate of residential properties;
other real estate.
Period Total
Rus-
sian
ruble
otherhryvnia US dollar Euro
Rus-
sian
ruble

3. Monetary Statistics
3.3. Loans granted by deposit-taking corporations (excluding National Bank of Ukraine)
3.3.4. Loans to non-financial corporations
3.3.4.5. Loans to non-financial corporations, breakdown by type of industry, currencies and original maturity
at the end of February, 2014
(outstanding amounts at end of period, in millions of hryvnias)
up to 1 year
over 1 year
and up to 5
years
over 5 years up to 1 year
over 1 year
and up to 5
years
over 5 years up to 1 year
over 1 year
and up to 5
years
over 5 years
1 2 3 4 5 6 7 8 9 10 11 12 13
Total 740 094 361 123 280 199 98 772 440 830 241 609 153 538 45 683 299 264 119 515 126 661 53 089
Agriculture, forestry and fishing 44 267 20 820 19 315 4 132 30 260 13 230 13 729 3 301 14 007 7 590 5 586 831
Mining and quarrying 19 492 15 669 3 052 771 7 596 5 323 1 603 670 11 897 10 346 1 449 102
Manufacturing 152 573 60 654 72 049 19 871 62 903 25 960 28 363 8 580 89 671 34 694 43 686 11 291
Electricity, gas, steam and air conditioning supply 31 840 12 418 10 089 9 333 11 642 7 675 3 077 890 20 198 4 742 7 012 8 443
Water supply; sewerage, waste management and
remediation activities 2 247 691 615 941 1 232 479 304 449 1 016 212 312 493
Construction 53 324 20 014 19 152 14 157 36 646 14 232 15 374 7 039 16 678 5 782 3 778 7 118
Wholesale and retail trade; repair of motor vehicles
and motorcycles 280 793 178 306 79 370 23 117 193 427 135 415 45 930 12 082 87 367 42 892 33 440 11 035
Transportation and storage 29 772 8 985 18 766 2 021 12 044 6 180 5 700 163 17 728 2 804 13 065 1 859
Accommodation and food service activities 5 903 1 052 2 698 2 153 2 829 850 1 333 646 3 074 202 1 365 1 507
Information and communication 7 347 3 949 2 863 535 5 617 3 070 2 354 192 1 731 879 509 343
Real estate activities 54 719 16 032 21 173 17 514 32 084 10 386 11 683 10 015 22 635 5 646 9 490 7 499
Professional, scientific and technical activities 40 920 15 627 22 730 2 563 34 094 13 776 19 505 813 6 826 1 851 3 225 1 750
Administrative and support service activities 11 244 5 061 5 390 794 5 964 3 426 2 301 237 5 281 1 635 3 088 557
Education 363 154 177 32 213 152 31 30 149 2 146 2
Human health and social work activities 1 200 97 434 669 783 93 258 432 417 4 176 237
Arts, entertainment and recreation 3 193 969 2 106 119 2 793 857 1 830 106 401 112 276 13
Other service activities 896 626 221 49 705 504 162 39 191 122 59 10
Note. Data are given according to the National classificator of Ukraine DK 009:2010 "Classification of economic activities" approved by the decree of State Committee of Ukraine for Technical Regulation and
Consumer Policy from 11.10.2010 № 457 (as amended).
including by original maturityTypes of industry Total
in foreign currency
total
including by original maturity
including by original maturity
including
in national currency
total

3. Monetary Statistics
3.3. Loans granted by deposit-taking corporations (excluding National Bank of Ukraine)
3.3.4. Loans to non-financial corporations
3.3.4.6. Outstanding loans to non-financial corporations, breakdown by type of industry, currencies and original maturitu
at the end of February, 2014
(outstanding amounts at end of period, in millions of hryvnias)
up to 1 year
over 1 year
and up to 5
years
over 5 years up to 1 year
over 1 year
and up to 5
years
over 5 years up to 1 year
over 1 year
and up to 5
years
over 5 years
1 2 3 4 5 6 7 8 9 10 11 12 13
Total 59 832 24 326 28 178 7 328 35 984 16 420 16 611 2 953 23 848 7 906 11 567 4 375
Agriculture, forestry and fishing 2 839 1 154 1 456 229 2 033 792 1 080 162 806 362 376 67
Mining and quarrying 1 981 1 504 322 155 904 683 128 93 1 078 821 195 62
Manufacturing 15 886 4 246 8 203 3 438 8 747 2 599 4 959 1 189 7 139 1 646 3 244 2 249
Electricity, gas, steam and air conditioning supply 162 40 114 8 148 39 108 – 14 1 5 8
Water supply; sewerage, waste management and
remediation activities 300 88 201 11 92 17 73 3 208 72 129 8
Construction 5 079 1 297 3 199 583 3 430 982 2 303 145 1 649 315 896 438
Wholesale and retail trade; repair of motor vehicles
and motorcycles 22 210 11 747 8 613 1 850 14 407 8 523 4 929 954 7 803 3 224 3 684 896
Transportation and storage 1 388 802 495 91 666 406 249 10 722 396 246 80
Accommodation and food service activities 241 115 119 6 52 33 16 2 189 82 103 4
Information and communication 723 220 366 138 517 193 244 80 206 27 121 58
Real estate activities 5 820 1 722 3 428 671 2 932 1 210 1 493 229 2 888 512 1 935 441
Professional, scientific and technical activities 1 402 745 622 35 965 690 266 9 437 55 356 26
Administrative and support service activities 907 362 493 52 396 82 284 30 510 280 209 22
Education 5 4 0 2 3 2 0 1 2 2 – 0
Human health and social work activities 103 43 37 23 91 43 29 19 12 0 8 4
Arts, entertainment and recreation 478 27 440 10 429 27 401 1 48 – 39 9
Other service activities 307 211 69 27 171 99 48 24 136 112 21 3
in national currency in foreign currency
total
including by loans
total
including by loans
Note. Data are given according to the National classificator of Ukraine DK 009:2010 "Classification of economic activities" approved by the decree of State Committee of Ukraine for Technical Regulation and
Consumer Policy from 11.10.2010 № 457 (as amended).
Types of industry Total
including by loans
including

3. Monetary Statistics
3.3. Loans granted by deposit-taking corporations (excluding National Bank of Ukraine)
3.3.4. Loans to non-financial corporations
3.3.4.7. Loans to non-financial corporations, in foreign currency, breakdown by type of industry, currencies and original maturity
at the end of February, 2014
(outstanding amounts at end of period, in millions of hryvnias)
up to 1
year
over 1 year
and up to 5
years
over 5
years
up to 1
year
over 1 year
and up to 5
years
over 5
years
up to 1
year
over 1 year
and up to 5
years
over 5
years
up to 1
year
over 1 year
and up to 5
years
over 5
years
1 2 3 4 5 6 7 8 9 10 11 12 13 14 15 16 17 18
Total 299 264 258 506 108 778 108 032 41 696 36 352 8 851 16 869 10 632 3 756 1 725 1 455 576 649 161 304 185
Agriculture, forestry and fishing 14 007 12 613 7 274 4 671 669 864 252 536 76 528 64 380 85 3 – – 3
Mining and quarrying 11 897 11 412 10 124 1 224 64 309 46 225 37 176 176 – – – – – –
Manufacturing 89 671 74 280 29 852 36 927 7 501 13 493 3 765 6 129 3 599 1 492 939 392 161 406 139 238 29
Electricity, gas, steam and air
conditioning supply 20 198 8 886 3 264 1 877 3 745 11 312 1 478 5 135 4 698 – – – – – – – –
Water supply; sewerage, waste
management and remediation
activities 1 016 602 193 296 113 414 19 15 380 – – – – – – – –
Construction 16 678 15 742 5 412 3 631 6 699 873 362 127 384 14 7 7 – 48 – 13 35
Wholesale and retail trade; repair of
motor vehicles and motorcycles 87 367 80 762 40 021 30 197 10 544 5 573 2 343 2 777 453 962 505 457 0 69 22 9 38
Transportation and storage 17 728 16 167 2 628 11 932 1 608 1 466 159 1 094 212 56 18 39 – 39 – – 39
Accommodation and food service
activities 3 074 2 713 164 1 077 1 472 316 38 243 35 1 – 1 – 44 – 44 0
Information and communication 1 731 1 591 837 423 331 137 42 84 11 2 – 2 – 1 – – 1
Real estate activities 22 635 21 776 5 460 9 331 6 985 420 186 86 147 402 – 72 330 37 – – 37
Professional, scientific and technical
activities 6 826 6 119 1 755 3 139 1 225 691 83 86 523 14 14 – – 3 – – 3
Administrative and support service
activities 5 281 5 002 1 563 2 957 482 275 70 131 74 3 1 1 – 1 – – 1
Education 149 149 2 146 2 – – – – 0 0 – – – – – –
Human health and social work
activities 417 308 4 68 237 4 – 4 – 105 – 105 – – – – –
Arts, entertainment and recreation 401 255 108 134 13 145 3 142 – – – – – – – – –
Other service activities 191 129 119 3 7 61 3 55 3 1 1 – – – – – –
including by original maturity
US dollar
Note. Data are given according to the National classificator of Ukraine DK 009:2010 "Classification of economic activities" approved by the decree of State Committee of Ukraine for Technical Regulation and
Consumer Policy from 11.10.2010 № 457 (as amended).
EuroRussian
ruble
other
curren-
cies
Types of industry Total
including by original maturity
including
including by original maturity including by original maturity

3. Monetary Statistics
3.3. Loans granted by deposit-taking corporations (excluding National Bank of Ukraine)
3.3.4. Loans to non-financial corporations
3.3.4.8. Loans to manufacturing industry, breakdown by type currencies and original maturity
at the end of February, 2014
(outstanding amounts at end of period, in millions of hryvnias)
up to 1
year
over 1 year
and up to 5
years
over 5
years
up to 1
year
over 1 year
and up to 5
years
over 5
years
up to 1
year
over 1 year
and up to 5
years
over 5
years
1 2 3 4 5 6 7 8 9 10 11 12 13
Manufacturing 152 573 60 654 72 049 19 871 62 903 25 960 28 363 8 580 89 671 34 694 43 686 11 291
Manufacture of food products 40 941 14 067 24 155 2 718 19 998 8 533 9 338 2 127 20 942 5 534 14 817 591
Manufacture of beverages 8 108 3 378 4 255 475 5 119 2 128 2 688 302 2 989 1 250 1 567 173
Manufacture of tobacco products 1 720 1 621 99 – 1 720 1 621 99 – 0 0 – –
Manufacture of textiles 671 425 228 17 203 121 74 8 468 305 153 9
Manufacture of wearing apparel 503 248 208 47 291 193 92 6 212 55 116 41
Manufacture of leather and related products 1 332 680 605 48 951 485 446 21 381 195 159 27
Manufacture of wood and of products of wood and cork, except
furniture; manufacture of articles of straw and plaiting
materials 1 570 503 608 459 441 273 141 27 1 129 230 468 432
Manufacture of paper and paper products 2 657 1 482 878 297 1 001 518 352 132 1 656 964 526 166
Printing and reproduction of recorded media 1 363 238 395 731 801 116 211 474 562 122 184 256
Manufacture of coke and refined petroleum products 2 721 2 048 416 258 1 821 1 562 224 35 900 485 192 223
Manufacture of chemicals and chemical products 14 481 4 351 5 208 4 921 3 342 996 1 217 1 129 11 139 3 355 3 991 3 793
Manufacture of basic pharmaceutical products and pharmaceutical
preparations 1 953 545 1 372 37 1 533 265 1 256 11 420 279 116 25
Manufacture of rubber and plastic products 7 212 1 974 3 909 1 328 3 223 1 230 1 815 178 3 989 744 2 095 1 150
Manufacture of other non-metallic mineral products 7 392 2 750 2 769 1 873 4 167 2 015 1 246 906 3 225 735 1 523 967
Manufacture of basic metals 20 007 9 256 9 469 1 282 2 078 892 1 172 15 17 929 8 364 8 297 1 268
Manufacture of fabricated metal products, except machinery and
equipment 5 494 2 258 1 646 1 590 3 299 1 143 807 1 350 2 195 1 115 839 240
Manufacture of computer, electronic and optical products 1 243 626 398 219 566 155 245 166 677 472 153 53
Manufacture of electrical equipment 7 036 3 009 3 055 972 794 464 276 53 6 242 2 544 2 779 919
Manufacture of machinery and equipment n.e.c. 10 076 5 205 3 681 1 190 4 161 1 042 2 024 1 094 5 915 4 163 1 657 96
Manufacture of motor vehicles, trailers and semi-trailers 5 379 1 215 3 399 766 3 102 421 2 500 181 2 277 794 898 585
Manufacture of other transport equipment 6 749 3 075 3 565 109 1 582 660 920 3 5 167 2 415 2 645 107
Manufacture of furniture 665 331 219 115 185 79 83 23 479 252 136 92
Other manufacturing 1 235 414 423 398 914 331 262 322 321 83 161 77
Repair and installation of machinery and equipment 2 065 956 1 089 20 1 610 717 876 17 455 239 213 3
total
including by original maturityDescriptions
Note. Data are given according to the National classificator of Ukraine DK 009:2010 "Classification of economic activities" approved by the decree of State Committee of Ukraine for Technical Regulation and
Consumer Policy from 11.10.2010 № 457 (as amended).
Total
including by original maturityincluding
in national currency in foreign currency
total
including by original maturity

3. Monetary Statistics
3.3. Loans granted by deposit-taking corporations (excluding National Bank of Ukraine)
3.3.5. Loans to households
3.3.5.1. Loans to households, breakdown by type of loans and original maturity
(outstanding amounts at end of period, in millions of hryvnias)
up to 1
year
over 1 year and
up to 5 years1
over 5
years
up to 1
year
over 1 year
and up to 5
years1
over 5 yearsup to 1
year
over 1 year
and up to 5
years1
over 5
years
over 10
years
up to 1
year
over 1 year
and up to 5
years1
over 5
years
up to 1
year
over 1 year
and up to 5
years1
over 5
years
1 2 3 4 5 6 3.1. 3.2. 3.3. 3.4. 7 8 9 10 11 12 13 14 15 16 17 18 19
2005 35 659 … … … … … … … … … … … … … … … … … … … … …
2006 82 010 58 453 11 440 47 013 … … … … … 20 412 314 20 098 … … 3 145 1 034 2 111 … 20 523 317 20 206 …
2007 160 386 115 032 19 072 44 007 51 953 … … … … 40 778 483 3 825 7 872 28 597 4 577 1 178 2 601 799 73 084 1 490 12 103 59 491
2008 280 490 186 088 25 128 61 881 99 080 … … … … 88 352 1 384 5 307 15 241 66 420 6 050 1 291 3 194 1 565 143 416 3 360 17 391 122 666
2009 241 249 137 113 19 219 40 584 77 310 33 698 428 7 982 25 288 98 792 2 533 7 432 19 212 69 616 5 343 771 2 836 1 736 132 757 3 421 14 005 115 332
2010 209 538 122 942 23 138 32 297 67 507 25 088 411 6 212 18 465 81 953 2 291 4 195 14 961 60 505 4 643 1 130 1 992 1 521 110 725 3 278 9 828 97 618
2011 201 224 126 192 32 324 37 338 56 530 19 511 565 6 052 12 895 70 447 2 385 3 643 13 024 51 396 4 585 1 161 2 065 1 359 97 431 4 676 9 445 83 309
2012 187 629 125 011 35 874 41 678 47 460 18 759 447 6 980 11 332 58 427 1 552 3 778 9 313 43 785 4 191 1 145 1 957 1 089 63 158 2 910 8 269 51 980
2013
February 188 219 126 981 38 843 41 208 46 930 17 019 1 224 6 514 9 281 57 115 2 374 3 315 8 471 42 955 4 123 1 331 1 803 989 60 993 2 604 6 652 51 737
March 188 406 127 302 39 763 41 863 45 676 18 021 1 269 6 274 10 477 56 878 2 372 3 315 8 353 42 838 4 226 1 444 1 843 940 61 990 2 836 6 965 52 189
April 190 055 129 192 41 895 42 249 45 048 18 055 1 303 6 358 10 394 56 491 2 389 3 331 8 220 42 551 4 372 1 567 1 851 953 62 082 3 152 7 313 51 618
May 190 824 130 442 44 012 42 093 44 337 17 709 1 325 6 207 10 177 55 957 2 439 3 357 8 080 42 081 4 426 1 602 1 881 942 63 822 2 842 7 001 53 978
June 189 984 130 353 44 620 42 227 43 506 17 493 1 337 6 173 9 982 55 115 2 416 3 304 7 946 41 450 4 515 1 678 1 914 923 62 145 2 726 6 528 52 891
July 190 785 131 504 45 764 43 066 42 674 17 069 1 289 6 159 9 621 54 715 2 442 3 356 7 849 41 068 4 566 1 696 1 952 918 61 267 2 739 6 482 52 046
August 192 970 133 934 47 406 44 265 42 263 17 048 1 299 6 257 9 492 54 420 2 401 3 457 7 724 40 837 4 617 1 760 1 986 870 60 629 2 672 6 434 51 524
September 193 270 135 098 48 358 45 259 41 481 16 990 1 305 6 309 9 376 53 600 2 360 3 469 7 495 40 276 4 572 1 836 1 960 777 59 606 2 766 6 466 50 374
October 194 228 136 330 49 749 45 624 40 956 16 782 1 327 6 297 9 158 53 227 2 357 3 468 7 425 39 978 4 671 1 945 1 949 777 59 817 3 440 6 414 49 964
November 192 729 135 648 49 540 46 239 39 869 300 363 192 729 107 373 260 52 357 2 260 3 479 7 260 39 357 4 725 2 027 1 959 739 57 931 2 661 6 306 48 964
December 193 529 137 346 50 872 47 555 38 919 15 155 506 6 129 8 520 51 447 2 263 3 450 6 896 38 837 4 736 2 042 1 992 702 56 270 2 564 6 095 47 611
2014
January 192 479 136 814 52 059 48 110 36 644 14 869 493 6 077 8 299 50 938 2 241 3 484 6 693 38 519 4 728 2 034 1 992 702 55 147 2 517 6 073 46 558
February 208 613 144 150 53 306 49 359 41 484 16 023 535 6 320 9 169 59 501 1 659 7 350 7 304 43 189 4 963 2 113 2 118 731 62 477 1 752 9 897 50 828
2To January 2007, data include mortgage credits of loans granted for the purpose investing.
3 Starting from February 2012, classification of loans has been revised by types of collateral. The mortgage loans include loans backed by several types of collateral, among which the largest value of collateral falls on:
property rights for future real estate of residential properties;
property rights for other future real estate;
real estate of residential properties;
other real estate.
including lending for vehicle purchase
total
including by original maturity
total
Other lending
total
including by original maturity
1 To January 2007, data include loans with original maturity over 1 year.
total
including by original maturityincluding by original maturity
total3
Period Total
Consumer credits
including by original maturity
Mortgage credits. From sum total2,3Lending for house purchase

3. Monetary Statistics
3.3. Loans granted by deposit-taking corporations (excluding National Bank of Ukraine)
3.3.5. Loans to households
3.3.5.2. Loans to households, breakdown by type of loans and currencies
(outstanding amounts at end of period, in millions of hryvnias)
hryvniaUS
dollarEuro
Rus-sian
rubleother hryvnia
US
dollarEuro
Rus-
sian
ruble
other hryvniaUS
dollarEuro
Rus-
sian
ruble
other hryvnia US dollar EuroRus-sian
rubleother
1 2 3 4 5 6 7 8 9 10 11 12 13 14 15 16 17 18 19 20 21 22 23 24 25 26
2005 35 659 … … … … … … … … … … … … … … … … … … … … … … … …
2006 82 010 58 453 26 093 30 448 1 276 0 635 20 412 2 417 17 107 463 – 425 3 145 2 183 736 202 1 23 20 523 2 479 17 136 477 – 431
2007 160 386 115 032 49 083 62 361 2 130 0 1 458 40 778 6 079 32 752 693 – 1 254 4 577 3 241 1 119 188 1 28 73 084 13 730 55 742 1 386 1 2 226
2008 280 490 186 088 66 693 113 773 3 708 0 1 915 88 352 8 847 76 034 1 298 – 2 173 6 050 3 282 2 443 297 1 27 143 416 21 346 116 180 2 480 0 3 409
2009 241 249 137 113 52 190 80 906 2 549 0 1 468 98 792 11 632 83 086 1 548 – 2 526 5 343 2 847 2 159 311 1 26 132 757 20 542 106 415 2 402 0 3 399
2010 209 538 122 942 52 478 67 033 1 873 0 1 557 81 953 9 841 69 054 1 090 – 1 967 4 643 2 439 2 051 125 1 28 110 725 18 104 87 817 1 774 1 3 029
2011 201 224 126 192 71 091 52 602 1 573 2 924 70 447 12 503 55 694 881 2 1 368 4 585 3 081 1 402 90 0 12 97 431 21 938 72 008 1 531 4 1 950
2012 187 629 125 011 85 384 37 751 1 181 2 694 58 427 14 243 42 318 778 2 1 087 4 191 3 063 1 016 101 0 9 63 158 20 670 40 445 1 004 3 1 036
2013
February 188 219 126 981 88 507 36 677 1 144 1 652 57 115 13 697 41 624 764 2 1 030 4 123 3 028 986 99 0 9 60 993 19 331 39 865 891 3 903
March 188 406 127 302 89 580 36 028 1 110 1 583 56 878 13 704 41 390 742 1 1 041 4 226 3 164 946 106 0 9 61 990 19 305 40 844 891 3 947
April 190 055 129 192 92 399 35 094 1 114 1 583 56 491 13 740 40 948 755 1 1 046 4 372 3 300 949 112 0 10 62 082 20 031 40 159 938 3 952
May 190 824 130 442 94 459 34 357 1 092 1 532 55 957 13 741 40 488 742 1 984 4 426 3 360 949 108 0 9 63 822 20 267 41 512 926 2 1 114
June 189 984 130 353 95 168 33 549 1 094 1 541 55 115 13 567 39 820 726 1 1 001 4 515 3 430 969 108 0 8 62 145 19 678 40 451 894 2 1 120
July 190 785 131 504 97 400 32 495 1 065 1 543 54 715 13 793 39 187 730 1 1 004 4 566 3 454 989 115 0 8 61 267 19 547 39 703 897 2 1 118
August 192 970 133 934 100 295 32 043 1 056 4 536 54 420 13 854 38 849 726 1 990 4 617 3 472 1 019 117 0 9 60 629 19 436 39 198 888 2 1 105
September 193 270 135 098 102 322 31 200 1 042 1 534 53 600 13 850 38 006 735 1 1 007 4 572 3 536 921 106 0 9 59 606 19 587 38 013 874 2 1 129
October 194 228 136 330 104 214 30 538 1 045 1 531 53 227 13 884 37 593 745 1 1 004 4 671 3 626 928 109 0 9 59 817 20 223 37 586 884 2 1 122
November 192 729 135 648 105 552 28 619 955 1 521 52 357 13 790 36 849 729 1 988 4 725 3 768 848 101 0 8 57 931 19 187 36 808 849 2 1 085
December 193 529 137 346 108 224 27 657 939 1 525 51 447 13 685 36 040 736 1 984 4 736 3 772 852 104 0 8 56 270 18 641 35 691 854 2 1 082
2014
January 192 479 136 814 108 469 26 909 924 1 511 50 938 13 645 35 641 713 1 937 4 728 3 766 853 100 0 9 55 147 18 575 34 700 832 2 1 037
February 208 613 144 150 109 485 32 880 1 147 1 636 59 501 13 555 43 881 893 1 1 171 4 963 3 840 993 118 0 11 62 477 18 279 41 876 1 028 2 1 291
1To January 2007, data include mortgage credits of loans granted for the purpose investing.
2 Starting from February 2012, classification of loans has been revised by types of collateral. The mortgage loans include loans backed by several types of collateral, among which the largest value of collateral falls on:
property rights for future real estate of residential properties;
property rights for other future real estate;
real estate of residential properties;
other real estate.
including by currenciesPeriod Total
total total
Lending for house purchase Other lending
including by currencies
Consumer credits
total
including by currenciesincluding by currencies
Mortgage credits. From sum total1,2
total2

3. Monetary Statistics
3.3. Loans granted by deposit-taking corporations (excluding National Bank of Ukraine)
3.3.6. Loans to other deposit-taking corporations
3.3.6.1. Loans to other deposit-taking corporations, breakdown by type of currencies and original maturity
(outstanding amounts at end of period, in millions of hryvnias)
up to 1 year
over 1 year
and up to 5
years 1
over 5
yearsup to 1 year
over 1 year
and up to 5
years 1
over 5
yearsup to 1 year
over 1 year
and up to 5
years 1
over 5
years
1 2 3 4 5 6 7 8 9 10 11 12 13
2005 10 408 9 994 414 … 5 219 5 043 175 … 5 190 4 951 239 …
2006 18 612 18 145 467 … 9 063 8 715 348 … 9 549 9 430 119 …
2007 47 021 45 579 1 373 69 22 059 21 287 771 1 24 962 24 293 602 68
2008 29 708 27 950 1 387 372 12 615 12 250 365 – 17 093 15 699 1 022 372
2009 20 580 19 239 915 426 9 645 9 419 226 – 10 935 9 820 689 426
2010 26 477 25 421 675 381 12 648 12 526 115 6 13 829 12 895 559 375
2011 40 343 37 739 2 307 297 17 344 15 900 1 444 – 22 999 21 839 864 297
2012 23 854 22 318 1 319 218 15 721 14 749 909 63 8 134 7 569 410 155
2013
February 15 456 14 005 1 037 415 8 897 7 944 895 58 6 559 6 060 142 356
March 16 036 14 618 1 007 410 9 934 8 986 892 56 6 102 5 632 116 354
April 16 395 15 012 988 394 9 361 8 422 885 53 7 034 6 590 103 341
May 15 996 14 602 1 002 392 9 606 8 646 909 51 6 390 5 956 93 341
June 16 666 15 484 995 187 11 069 10 119 901 48 5 597 5 365 94 138
July 18 970 17 792 788 389 11 954 11 007 693 254 7 016 6 785 95 135
August 15 450 14 255 821 374 9 681 8 699 730 251 5 769 5 556 90 122
September 18 177 17 004 802 371 12 014 11 055 710 249 6 163 5 949 92 122
October 17 680 16 527 788 365 11 744 10 802 695 246 5 936 5 725 93 119
November 18 913 17 798 759 355 12 811 11 902 667 243 6 101 5 897 92 113
December 18 771 17 611 812 348 11 785 10 908 639 238 6 985 6 703 173 109
2014
January 22 715 21 510 865 340 12 865 12 009 622 234 9 850 9 501 244 106
February 17 987 16 816 812 360 11 952 11 118 602 232 6 035 5 698 209 128
1 To January 2007, data include loans with original maturity over 1 year.
Period Total
including by original maturity
including
total total
in foreign currencyin national currency
including by original maturity including by original maturity

3. Monetary Statistics
3.3. Loans granted by deposit-taking corporations (excluding National Bank of Ukraine)
3.3.6. Loans to other deposit-taking corporations
3.3.6.2. Loans to other deposit-taking corporations, in foreign currency, breakdown by currencies and original maturity
(outstanding amounts at end of period, in millions of hryvnias)
up to 1
year
over 1
year and
up to 5
years 1
over 5
years
up to 1
year
over 1
year and
up to 5
years 1
over 5
years
up to 1
year
over 1
year and
up to 5
years 1
over 5
years
up to 1
year
over 1
year and
up to 5
years 1
over 5
years
1 2 3 4 5 6 7 8 9 10 11 12 13 14 15 16 17 18
2005 5 190 3 618 3 514 104 … 1 493 1 357 135 … 46 46 … … 33 33 … …
2006 9 549 6 844 6 770 74 … 2 611 2 566 45 … 81 81 … … 13 13 … …
2007 24 962 19 726 19 135 524 68 5 164 5 086 78 – 62 62 – – 10 10 – –
2008 17 093 14 792 13 512 908 372 2 228 2 125 103 – 29 29 – – 45 34 11 –
2009 10 935 8 176 7 097 653 426 2 711 2 675 36 – 16 16 – – 32 32 – –
2010 13 829 10 630 9 715 559 355 3 058 3 038 0 20 141 141 – – – – – –
2011 22 999 17 956 16 806 857 293 4 640 4 629 7 4 326 326 – – 78 78 – –
2012 8 134 5 876 5 389 336 151 2 189 2 111 74 4 69 69 0 – – – – –
2013
February 6 559 5 009 4 588 69 352 1 332 1 255 73 4 218 218 – – – – – –
March 6 102 4 677 4 284 44 350 1 244 1 168 72 4 181 181 – – – – – –
April 7 034 5 475 5 108 30 336 1 300 1 223 73 4 138 138 – – 121 121 – –
May 6 390 5 127 4 770 21 336 1 174 1 097 72 4 85 85 – – 4 4 – –
June 5 597 4 519 4 364 21 134 1 012 935 73 4 63 63 – – 3 3 – –
July 7 016 4 959 4 806 21 132 1 994 1 916 74 4 60 60 – – 3 3 – –
August 5 769 3 959 3 824 16 118 1 631 1 553 74 4 179 179 – – – – – –
September 6 163 4 416 4 283 16 118 1 667 1 588 76 4 79 79 – – – – – –
October 5 936 4 405 4 275 16 114 1 388 1 307 77 4 143 143 – – – – – –
November 6 101 4 706 4 582 16 109 1 275 1 195 76 4 119 119 – – – – – –
December 6 985 5 657 5 456 95 105 1 271 1 189 77 4 58 58 – – – – – –
2014
January 9 850 6 937 6 667 168 102 2 827 2 748 76 4 82 82 – – 4 4 – –
February 6 035 3 982 3 650 209 123 1 895 1 891 – 5 152 152 – – 5 5 – –
1 To January 2007, data include loans with original maturity over 1 year.
Period Total
including
US dollar
including by original maturity
Euro
including by original maturity
Russian
ruble
including by original maturity
other
curren-
cies
including by original maturity

3. Monetary Statistics
3.3. Loans granted by deposit-taking corporations (excluding National Bank of Ukraine)
3.3.7. Loans to non-residents
3.3.7.1. Loans to non-residents, breakdown by type of currencies and original maturity
(outstanding amounts at end of period, in millions of hryvnias)
up to 1
year
over 1
year and
up to 5
years 2
over 5
years
up to 1
year
over 1
year and
up to 5
years 2
over 5
years
up to 1
year
over 1
year and
up to 5
years 2
over 5
years
up to 1
year
over 1
year and
up to 5
years 2
over 5
years
1 2 3 4 5 6 7 8 9 10 11 12 13 14 15 16 17 18 19
2005 2 053 3 1 2 … 2 050 1 756 294 … 363 3 1 2 … 360 127 233 …
2006 3 450 7 1 6 … 3 442 2 605 838 … 1 748 7 1 6 … 1 741 943 797 …
2007 6 740 14 4 6 3 6 726 4 938 1 508 281 2 713 14 4 6 3 2 699 994 1 425 281
2008 13 085 74 43 14 17 13 011 8 770 3 283 957 8 355 74 43 14 17 8 281 4 264 3 059 957
2009 16 970 70 47 9 14 16 900 12 729 3 224 947 6 612 70 47 9 14 6 542 2 617 2 977 947
2010 14 942 112 60 36 16 14 831 11 996 2 165 670 3 335 112 60 36 16 3 224 615 1 939 670
2011 4 923 145 101 18 26 4 778 3 804 664 310 1 357 145 101 18 26 1 212 461 441 310
2012 3 842 157 103 29 25 3 685 2 919 507 258 1 565 157 103 29 25 1 408 800 349 258
2013
February 6 257 145 91 29 25 6 113 5 354 295 464 1 531 145 91 29 25 1 386 785 295 306
March 4 821 118 63 30 25 4 703 4 022 219 463 1 489 118 63 30 25 1 371 845 219 307
April 3 200 119 70 24 25 3 081 2 403 297 381 1 382 119 70 24 25 1 264 743 297 224
May 3 174 141 92 25 25 3 033 2 434 228 371 1 385 141 92 25 25 1 244 801 228 215
June 2 870 197 149 25 23 2 673 2 074 228 371 1 428 197 149 25 23 1 232 789 228 215
July 7 413 167 119 25 23 7 246 6 711 218 317 1 222 167 119 25 23 1 054 677 218 159
August 3 182 169 121 25 23 3 013 2 562 208 243 1 096 169 121 25 23 926 559 208 160
September 3 016 169 120 26 23 2 847 2 394 209 244 1 083 169 120 26 23 915 544 209 161
October 2 504 169 120 26 23 2 335 1 877 214 245 1 074 169 120 26 23 905 530 214 161
November 7 697 169 120 26 23 7 528 7 033 251 245 1 059 169 120 26 23 891 479 251 161
December 2 388 161 112 26 23 2 227 1 735 133 358 1 038 161 112 26 23 877 468 133 275
2014
January 7 981 221 104 93 23 7 761 7 271 132 358 1 083 221 104 93 23 862 455 132 275
February 13 931 229 112 94 23 13 702 13 094 161 447 1 289 229 112 94 23 1 060 555 161 344
1 Excluding non-resident deposit-taking corporations
2 To January 2007, data include loans with original maturity over 1 year.
of which: non-resident customers 1
totalPeriod Total
in national currency
including
total total
including by original maturity including by original maturity
total
including by original maturity
total
including by original maturity
in foreign currencyincluding
in national currency in foreign currency

3. Monetary Statistics
3.3. Loans granted by deposit-taking corporations (excluding National Bank of Ukraine)
3.3.7. Loans to non-residents
3.3.7.2. Loans to non-residents, in foreign currency, breakdown by currencies and original maturity
(outstanding amounts at end of period, in millions of hryvnias)
up to 1
year
over 1
year and
up to 5
years
over 5
years
up to 1
year
over 1
year and
up to 5
years
over 5
years
up to 1
year
over 1
year and
up to 5
years
over 5
years
up to 1
year
over 1
year and
up to 5
years
over 5
years
1 2 3 4 5 6 7 8 9 10 11 12 13 14 15 16 17 18
2005 2 050 1 060 771 289 … 986 982 4 … 4 3 1 … … … … …
2006 3 442 2 218 1 614 603 … 1 020 960 60 … 31 30 1 … 174 – 174 …
2007 6 726 2 969 1 355 1 369 244 3 488 3 342 121 25 60 43 17 – 209 198 – 11
2008 13 011 8 829 5 318 2 608 903 3 913 3 247 629 37 84 38 46 – 185 167 – 18
2009 16 900 12 778 9 395 2 475 909 3 960 3 238 701 20 87 39 48 – 75 57 – 18
2010 14 831 6 915 4 700 1 575 640 7 718 7 195 511 11 173 94 79 – 25 6 – 18
2011 4 778 4 078 3 378 419 281 630 402 217 10 46 18 28 – 25 7 – 18
2012 3 685 2 103 1 537 324 242 1 526 1 374 150 1 33 – 33 – 23 8 0 16
2013
February 6 113 4 540 3 981 185 374 1 516 1 365 76 74 34 0 33 – 23 8 – 15
March 4 703 2 925 2 364 186 375 1 717 1 645 0 73 38 5 33 – 23 8 – 15
April 3 081 2 461 1 982 187 292 554 403 77 74 43 10 33 – 23 8 – 15
May 3 033 2 380 1 902 195 283 547 473 0 73 84 51 33 – 22 7 – 15
June 2 673 2 319 1 840 196 283 222 148 0 74 110 79 32 – 22 7 – 15
July 7 246 5 556 5 143 186 227 1 635 1 560 0 75 33 1 32 – 22 7 – 15
August 3 013 1 719 1 316 176 227 1 240 1 239 0 1 32 – 32 – 22 7 – 15
September 2 847 1 687 1 284 176 228 1 103 1 102 0 1 33 – 33 – 23 7 – 16
October 2 335 1 762 1 353 180 228 516 516 0 1 34 – 34 – 23 8 – 16
November 7 528 5 657 5 211 218 228 1 814 1 813 0 1 34 1 33 – 23 7 – 16
December 2 227 2 092 1 651 100 342 77 76 0 1 35 1 34 – 23 7 – 16
2014
January 7 761 2 369 1 927 100 341 5 338 5 337 0 1 31 – 31 – 23 7 – 15
February 13 702 12 449 11 900 122 427 1 186 1 185 0 1 39 – 39 – 29 9 – 19
1 To January 2007, data include loans with original maturity over 1 year.
including by original maturity
other
curren-
cies
including by original maturity
Period Total
including
US dollar
including by original maturity
Euro
including by original maturity
Russian
ruble

3. Monetary Statistics
3.3. Loans granted by deposit-taking corporations (excluding National Bank of Ukraine)
3.3.7. Loans to non-residents
3.3.7.3. Geographic distribution of loans, granted to non-residents
at the end of February, 2014
(outstanding amounts at end of period, in millions of hryvnias)
up to 1 year
over 1 year
and up to 5
years 1
over 5
yearsup to 1 year
over 1 year
and up to 5
years 1
over 5
yearsup to 1 year
over 1 year
and up to 5
years 1
over 5
years
1 2 3 4 5 6 7 8 9 10 11 12 13
Total 13 931 13 206 255 470 229 112 94 23 13 702 13 094 161 447
Neighboring countries 462 164 137 161 173 68 93 12 289 96 44 149
Belarus 6 0 0 6 0 0 0 0 6 0 0 6
Georgia 200 95 0 104 0 0 0 – 199 95 – 104
Hungary 0 0 0 0 0 0 0 – 0 0 – 0
Moldova 8 0 0 8 0 0 0 0 8 0 – 8
Poland 2 0 0 1 0 0 0 – 1 0 0 1
Russian Federation 191 28 128 35 129 27 89 12 62 1 39 23
Bulgaria 0 0 – – 0 0 – – 0 0 – –
Romania 0 0 – – 0 0 – – – – – –
Slovakia 0 0 – – 0 0 – – 0 0 – –
Turkey 55 41 8 6 44 41 3 – 11 0 5 6
Other countries by jurisdiction 13 469 13 042 118 309 56 44 1 10 13 414 12 998 117 299
United States 3 149 3 084 42 23 43 38 0 5 3 106 3 046 42 18
Germany 3 158 3 095 19 44 3 0 0 3 3 155 3 095 19 41
Switzerland 319 317 – 2 0 0 – 0 319 317 – 2
Cyprus 337 190 – 147 – – – – 337 190 – 147
Marshall Islands 253 253 – – – – – – 253 253 – –
Israel 175 103 2 70 1 0 0 1 174 103 2 69
Latvia 6 6 0 0 6 6 0 – 1 0 – 0
Panama 53 – 53 – – – – – 53 – 53 –
Great Britain 12 2 0 10 1 0 0 1 12 2 – 10
Lithuania 3 0 0 3 0 0 – – 3 0 0 3
Denmark 0 0 – – 0 0 – – 0 0 – –
Austria 2 999 2 997 0 3 0 0 0 – 2 999 2 996 – 3
France 2 0 0 2 0 0 0 – 2 0 0 2
Korea 1 0 0 1 0 0 0 – 1 0 – 1
Other countries 3 003 2 997 2 4 2 0 1 0 3 002 2 997 1 4
including by original maturity including by original maturityRecipient Geographic Location Total
including by original maturity
including
total total
in foreign currencyin national currency

3. Monetary Statistics
3.4. Securities held by deposit-taking corporations (excluding National bank of Ukraine)
3.4.1. Holdings of securities other than shares issued by resident sectors (excluding deposit-taking corporations)
3.4.1.1. Holdings of securities other than shares, breakdown by sectors of the issuer
3.4.1.2. Holdings of securities other than shares, breakdown by type of portfolio and currencies
3.4.1.3. Holdings of securities other than shares, breakdown by sectors of the issuer and original maturity
3.4.2. Holdings of securities other than shares issued by other deposit-taking corporations and non-residents, breakdown by original maturity
3.4.3. Holdings of shares and other equity
3.4.3.1. Holdings of shares and other equity, breakdown by sectors of the issuer
3.4.3.2. Holdings of shares and other equity, breakdown by type of portfolio

3. Monetary Statistics
3.4. Securities held by deposit-taking corporations (excluding National Bank of Ukraine)
3.4.1. Holdings of securities other than shares issued by resident sectors (excluding deposit-taking corporations)
3.4.1.1. Holdings of securities other than shares, breakdown by sectors of the issuer
insurance
corporations
and pension
funds
other financial
intermediaries
and financial
auxiliaries
central
government
state and
local
government
public non-
financial
corporations
other non-
financial
corporations
households
non-profit
institutions
serving
households1 2 3 4 5 6 7 8 9 10 11 12 13 14
outstanding amounts at end of period, in millions of hryvnias
2005 8 035 470 … … 3 656 3 344 312 3 885 632 3 253 25 25 –
2006 9 548 524 104 421 4 556 4 198 358 4 458 278 4 180 10 10 –
2007 15 200 1 513 177 1 336 6 252 5 800 452 7 426 248 7 178 8 8 –
2008 28 134 2 699 194 2 505 17 402 16 926 476 8 033 278 7 755 – – –
2009 30 086 2 270 179 2 091 20 897 20 224 673 6 919 2 035 4 883 0 0 –
2010 68 925 2 276 169 2 107 58 085 57 496 589 8 564 3 869 4 695 0 0 –
2011 75 926 1 579 313 1 266 60 702 60 128 574 13 645 3 691 9 954 – – –
2012 88 854 1 859 187 1 671 66 737 61 164 5 573 20 258 7 155 13 103 – – –
2013
February 104 716 1 954 175 1 779 81 632 75 921 5 710 21 130 7 615 13 515 – – –
March 112 286 2 668 176 2 492 87 992 82 321 5 671 21 627 8 338 13 289 – – –
April 116 858 2 817 176 2 641 89 537 83 793 5 744 24 504 8 588 15 916 – – –
May 122 506 2 765 176 2 589 94 133 88 330 5 803 25 609 9 826 15 782 – – –
June 123 452 2 614 177 2 437 95 278 89 716 5 561 25 560 9 497 16 063 – – –
July 125 849 2 773 177 2 596 97 404 91 810 5 593 25 672 9 737 15 934 – – –
August 122 456 2 693 147 2 545 93 530 87 868 5 662 26 234 9 826 16 408 – – –
September 119 136 2 692 147 2 545 90 344 84 302 6 042 26 100 9 749 16 351 – – –
October 118 385 2 720 147 2 573 90 178 84 124 6 053 25 488 9 590 15 898 – – –
November 120 288 2 711 194 2 517 91 739 85 639 6 100 25 838 9 784 16 053 – – –
December 127 734 3 062 194 2 868 93 951 88 091 5 860 30 720 13 861 16 859 – – –
2014
January 126 446 3 115 194 2 921 92 406 86 482 5 924 30 925 13 929 16 995 – – –
February 134 635 3 611 229 3 382 100 501 94 517 5 984 30 523 13 959 16 564 – – –
annual growth rates, %
2005 42.3 227.9 … … 36.1 31.5 115.6 38.2 –21.8 62.3 … … …
2006 18.8 14.7 … … 24.6 25.5 14.9 14.4 –56.1 28.0 –58.4 –58.4 –
2007 59.2 187.8 71.0 216.5 37.2 38.2 26.3 66.6 –10.5 71.8 –20.3 –20.3 –
2008 85.1 78.4 9.3 87.5 178.3 191.8 5.4 8.2 12.0 8.0 – – –
2009 6.9 –15.9 –7.3 –16.5 20.1 19.5 41.1 –13.9 631.6 –37.0 – – –
2010 129.1 0.2 –6.0 0.8 178.0 184.3 –12.4 23.8 90.1 –3.9 –2.3 –2.3 –
2011 19.7 –19.6 –11.3 –20.3 15.2 15.6 –13.0 60.3 –21.3 123.1 – – –
2012 17.0 17.7 –40.1 32.0 9.9 1.7 870.7 48.5 93.8 31.6 – – –
2013
February 31.7 25.4 –32.1 36.9 30.2 22.4 765.8 38.4 81.4 22.1 – – –
March 30.5 60.2 –51.7 91.5 29.0 21.9 741.2 34.0 92.1 12.6 – – –
April 33.2 108.7 30.5 117.4 27.5 20.5 751.8 51.7 97.4 34.8 – – –
May 32.6 99.8 10.2 111.6 25.7 19.0 763.4 59.0 128.0 33.8 – – –
June 27.2 62.4 –32.0 80.6 20.8 14.7 736.2 54.4 104.6 34.8 – – –
July 26.8 76.9 10.1 84.6 20.4 15.2 380.9 52.7 95.8 34.6 – – –
August 23.6 73.5 8.8 79.7 16.4 11.0 381.3 52.5 85.1 38.0 – – –
September 21.9 70.7 –19.3 82.5 14.8 8.8 402.3 49.7 81.5 35.5 – – –
October 22.7 82.7 –0.2 91.9 16.3 10.3 401.4 45.5 81.5 30.0 – – –
November 25.8 76.8 12.9 84.9 20.6 17.6 86.6 43.7 70.7 31.1 – – –
December 43.8 64.7 3.6 71.6 40.8 44.0 5.1 51.6 93.7 28.7 – – –
2014
January 28.0 71.5 10.8 78.0 21.9 23.3 4.7 46.4 84.1 25.3 – – –
February 28.6 84.8 30.8 90.1 23.1 24.5 4.8 44.5 83.3 22.6 – – –
includingincluding
total
including
total
Period Total
including
other financial corporations general government non-financial corporations other resident sectors
total
including
total

3. Monetary Statistics
3.4. Securities held by deposit-taking corporations (excluding National Bank of Ukraine)
3.4.1. Holdings of securities other than shares issued by resident sectors (excluding deposit-taking corporations)
3.4.1.2. Holdings of securities other than shares, breakdown by type of portfolio and currencies
in national
currency
in foreign
currency
in national
currency
in foreign
currency
in national
currency
in foreign
currency1 2 3 4 5 6 7 8 9 10 11
outstanding amounts at end of period, in millions of hryvnias
2005 8 035 224 224 – 5 230 5 206 24 2 582 2 580 1
2006 9 548 1 624 1 598 26 5 444 5 444 – 2 481 2 480 1
2007 15 200 2 416 2 416 – 9 283 9 283 – 3 500 3 500 –
2008 28 134 2 667 2 667 – 22 598 22 598 – 2 869 2 869 –
2009 30 086 1 081 1 081 – 24 324 24 255 68 4 681 4 681 –
2010 68 925 6 129 6 129 – 54 163 54 098 65 8 633 8 633 –
2011 75 926 9 535 8 747 788 57 606 55 266 2 340 8 785 8 645 140
2012 88 854 15 316 10 162 5 154 70 198 58 280 11 918 3 340 3 039 300
2013
February 104 716 15 411 10 457 4 954 85 980 61 090 24 890 3 326 3 011 315
March 112 286 15 629 10 138 5 491 93 536 64 998 28 537 3 122 2 836 286
April 116 858 16 188 10 289 5 899 97 515 68 092 29 422 3 156 2 869 286
May 122 506 16 231 9 293 6 938 103 174 71 840 31 334 3 101 2 839 262
June 123 452 14 997 8 783 6 213 105 270 71 918 33 352 3 185 2 921 265
July 125 849 14 084 8 732 5 353 108 643 74 834 33 809 3 121 3 022 99
August 122 456 11 117 7 565 3 552 108 326 72 821 35 505 3 013 2 913 100
September 119 136 10 919 6 975 3 944 105 166 71 209 33 957 3 052 2 951 100
October 118 385 11 158 7 130 4 028 104 382 70 290 34 091 2 846 2 746 100
November 120 288 10 619 7 106 3 512 106 806 73 784 33 022 2 864 2 774 90
December 127 734 8 695 6 152 2 543 116 247 80 684 35 562 2 792 2 702 90
2014
January 126 446 8 606 5 846 2 760 115 172 80 081 35 091 2 668 2 577 91
February 134 635 13 291 10 591 2 699 118 731 76 365 42 366 2 614 2 499 114
annual growth rates, %
2005 42.3 225.0 225.0 – 49.8 50.1 –1.2 23.7 23.8 –42.0
2006 18.8 625.3 613.8 – 4.1 4.6 – –3.9 –3.9 –60.5
2007 59.2 48.8 51.2 – 70.5 70.5 – 41.1 41.1 –
2008 85.1 10.4 10.4 – 143.4 143.4 – –18.0 –18.0 –
2009 6.9 –59.5 –59.5 – 7.6 7.3 – 63.2 63.2 –
2010 129.1 466.9 466.9 – 122.7 123.0 –4.8 84.4 84.4 –
2011 10.2 55.6 42.7 – 6.4 2.2 … 1.8 0.1 –
2012 17.0 60.6 16.2 553.6 21.9 5.5 409.3 –62.0 –64.8 115.3
2013
February 31.7 31.7 –0.7 323.1 44.3 10.1 510.3 –59.6 –62.6 64.2
March 30.5 23.6 –7.9 237.4 40.4 10.2 273.8 –53.9 –57.1 70.7
April 33.2 25.3 –6.6 210.3 42.8 14.4 235.7 –51.7 –54.9 69.7
May 32.6 –6.9 –12.9 2.5 50.6 19.1 281.5 –51.9 –54.9 70.5
June 27.2 –19.4 –9.2 –30.5 47.1 17.1 228.4 –53.4 –54.9 –27.3
July 26.8 –25.9 –18.5 –35.5 48.8 19.9 218.5 –56.8 –56.1 –71.7
August 23.6 –34.0 –23.8 –48.5 44.0 17.3 170.1 –57.1 –56.7 –67.8
September 21.9 –29.8 –26.5 –35.0 38.6 13.7 157.1 –51.5 –50.7 –67.2
October 22.7 –31.6 –28.3 –36.7 40.8 13.8 175.6 –52.9 –52.1 –67.8
November 25.8 –34.9 –33.5 –37.6 45.8 23.1 148.2 –52.6 –51.4 –72.5
December 43.8 –43.2 –39.5 –50.7 65.6 38.4 198.4 –16.4 –11.1 –70.0
2014
January 28.0 –40.9 –42.7 –37.0 42.6 31.0 79.1 –22.8 –18.4 –69.6
February 28.6 -13.8 1.3 -45.5 38.1 25.0 70.2 -21.4 -17.0 -63.7
Period Total
including
tradable securities other than shares securities other than shares available for sale held-to-maturity securities other than shares
total
including
total
including
total
including

3. Monetary Statistics
3.4. Securities held by deposit-taking corporations (excluding National Bank of Ukraine)
3.4.1. Holdings of securities other than shares issued by resident sectors (excluding deposit-taking corporations)
3.4.1.3. Holdings of securities other than shares, breakdown by sectors of the issuer and original maturity
(outstanding amounts at end of period, in millions of hryvnias)
demandup to 1
years
over 1 year
and up to 2
years
over 2
yearsdemand
up to 1
years
over 1 year
and up to 2
years
over 2
yearsdemand
up to 1
years
over 1 year
and up to 2
years
over 2
yearsdemand
up to 1
years
over 1 year
and up to 2
years
over 2
years
1 2 3 4 5 6 7 8 9 10 11 12 13 14 15 16 17 18 19 20 21 22
2005 8 035 470 … … … … 3 656 … … … … 3 885 … … … … 25 … … … …
2006 9 548 524 … … … … 4 556 … … … … 4 458 … … … … 10 … … … …
2007 15 200 1 513 139 171 48 1 156 6 252 398 1 175 1 149 3 530 7 426 1 112 2 498 830 2 987 8 – – – 8
2008 28 134 2 699 198 600 89 1 812 17 402 53 1 500 1 672 14 176 8 033 1 052 2 635 1 561 2 784 – – – – –
2009 30 086 2 270 27 360 46 1 837 20 897 427 9 647 1 085 9 738 6 919 411 1 282 1 178 4 048 0 – – 0 –
2010 68 925 2 276 87 192 192 1 805 58 085 6 904 18 011 6 134 27 036 8 564 662 1 917 1 452 4 534 0 – – 0 –
2011 75 926 1 579 163 135 81 1 200 60 702 4 487 15 188 5 377 35 650 13 645 1 142 5 771 821 5 912 – – – – –
2012 88 854 1 859 154 505 11 1 189 66 737 7 767 16 820 13 574 28 576 20 258 1 448 7 152 2 388 9 271 – – – – –
2013
February 104 716 1 954 152 575 40 1 187 81 632 8 455 13 952 20 738 38 487 21 130 1 543 7 229 2 808 9 551 – – – – –
March 112 286 2 668 252 864 125 1 427 87 992 7 411 17 884 18 522 44 176 21 627 1 471 7 914 2 712 9 530 – – – – –
April 116 858 2 817 166 847 125 1 678 89 537 7 918 15 612 18 425 47 582 24 504 1 674 4 646 7 240 10 944 – – – – –
May 122 506 2 765 145 921 89 1 609 94 133 7 344 15 640 19 781 51 368 25 609 1 592 4 297 7 151 12 570 – – – – –
June 123 452 2 614 186 802 17 1 610 95 278 6 785 18 081 20 510 49 901 25 560 1 618 4 040 7 357 12 545 – – – – –
July 125 849 2 773 184 1 059 17 1 514 97 404 5 505 19 854 22 226 49 818 25 672 1 611 4 054 7 395 12 611 – – – – –
August 122 456 2 693 261 877 3 1 553 93 530 5 773 19 478 22 536 45 743 26 234 1 664 4 510 8 445 11 615 – – – – –
September 119 136 2 692 313 790 3 1 587 90 344 3 104 16 966 23 810 46 464 26 100 1 645 4 050 8 457 11 948 – – – – –
October 118 385 2 720 269 765 293 1 394 90 178 2 774 14 726 24 180 48 497 25 488 1 407 3 564 8 612 11 906 – – – – –
November 120 288 2 711 293 774 288 1 356 91 739 4 873 15 207 23 199 48 461 25 838 1 488 3 916 8 901 11 533 – – – – –
December 127 734 3 062 295 504 386 1 878 93 951 11 443 16 990 21 573 43 945 30 720 1 391 8 329 8 864 12 136 – – – – –
2014
January 126 446 3 115 306 512 548 1 749 92 406 12 284 16 570 20 086 43 466 30 925 1 523 8 522 8 579 12 301 – – – – –
February 134 635 3 611 307 305 276 2 723 ###### 13 423 18 360 23 651 45 067 30 523 1 452 8 203 8 618 12 250 – – – – –
total
non-financial corporations
total
households and non-profit institutions
serving householdsPeriod Total
including
total
other financial corporations
total
general government

3. Monetary Statistics
3.4. Securities held by deposit-taking corporations (excluding National Bank of Ukraine)
3.4.2. Holdings of securities other than shares issued by other deposit-taking corporations and non-residents, breakdown by original maturity
annual growth rates, %
demand up to 1 yearsover 1 year and
up to 2 years1 over 2 years demand up to 1 years
over 1 year and
up to 2 years1 over 2 years
1 2 3 4 5 6 7 8 9 10 11
outstanding amounts at end of period, in millions of hryvnias
2005 412 … … … … 4 … … … …
2006 795 … … … … 4 … … … …
2007 4 443 1 407 1 281 277 1 478 50 – – – 50
2008 3 009 467 1 016 413 1 112 412 0 – 0 412
2009 1 547 70 441 626 409 372 0 – 102 270
2010 1 082 0 307 150 624 422 – 5 86 331
2011 2 383 30 186 684 1 482 186 – 5 – 181
2012 2 336 42 242 915 1 137 186 – 5 – 181
2013
February 1 676 42 237 328 1 068 182 – 1 – 181
March 1 558 0 137 331 1 089 183 – 2 – 181
April 1 558 1 170 330 1 057 184 – 3 – 181
May 1 601 0 227 246 1 127 185 – 4 – 181
June 1 865 – 365 377 1 123 186 – 5 – 181
July 2 159 – 483 400 1 275 187 – 6 – 181
August 2 244 – 369 610 1 264 182 – 1 – 181
September 2 376 – 455 662 1 259 183 – 2 – 181
October 2 431 – 544 553 1 334 185 – 3 – 182
November 2 575 0 408 497 1 670 75 – 0 – 75
December 2 610 35 467 493 1 615 74 – 0 – 74
2014
January 2 058 – 350 405 1 302 74 – 0 – 74
February 2 030 – 349 397 1 284 227 – 1 – 226
annual growth rates, %
2005 273.3 … … … … –6.1 … … … …
2006 92.9 … … … … –0.3 … … … …
2007 455.0 – – – – 1 040.4 – – – –
2008 –31.8 –66.1 –20.7 49.0 –24.7 723.3 – – – 723.3
2009 –48.6 –85.0 –56.6 51.6 –63.2 –9.8 0.7 – … –34.6
2010 –30.0 –99.3 –30.3 –76.0 52.6 13.4 – – –15.8 22.6
2011 120.2 6 123.7 –39.4 356.0 137.4 –55.9 – 0.4 – –45.3
2012 –2.0 39.3 29.8 33.8 –23.3 0.1 – 3.8 – –
2013
February –34.8 –46.4 42.8 –58.2 –30.6 – – –14.9 – 0.1
March –39.6 –94.5 –30.7 –67.0 –20.5 – – –8.4 – 0.1
April –45.5 –92.8 –65.4 –66.4 –23.3 – – –5.9 – 0.1
May –40.6 –97.7 –46.4 –72.8 –16.2 –0.1 – –4.5 – –
June –20.6 –100.0 117.2 –59.3 –10.4 –0.1 – –3.7 – –
July –8.6 – 196.3 –58.7 3.7 –0.1 – –3.1 – –
August –3.4 – 127.5 –34.8 3.2 –0.1 – –13.6 – –
September 3.2 – 186.2 –29.7 4.9 –0.1 – –8.1 – –
October 4.4 – 238.0 –41.3 8.8 0.4 – –5.7 – 0.6
November 13.3 –90.5 140.8 –46.7 42.7 –59.4 – –98.3 – –58.5
December 11.7 –17.0 93.2 –46.1 42.1 –60.1 – –98.3 – –59.0
2014
January –5.4 –100.0 41.4 –25.1 –3.1 –60.2 – –98.3 – –59.0
February 21.2 –100.0 47.0 21.0 20.2 24.9 – 17.7 – 24.9
Periodtotal
including by maturity
total
Other deposit-taking corporations non-residents
including by maturity

3. Monetary Statistics
3.4. Securities held by deposit-taking corporations (excluding National Bank of Ukraine)
3.4.3. Holdings of shares and other equity
3.4.3.1. Holdings of shares and other equity, breakdown by sectors of the issuer
insurance
corporations and
pension funds
other financial
intermediaries and
financial auxiliaries 1
public non-
financial
corporations
other non-
financial
corporations
1 2 3 4 5 6 7 8 9 10
outstanding amounts at end of period, in millions of hryvnias
2005 3 580 37 505 … … 2 911 32 2 880 128
2006 4 109 242 1 022 117 906 2 688 7 2 681 157
2007 6 478 281 2 434 354 2 080 3 215 10 3 205 548
2008 6 575 435 2 906 217 2 689 2 605 4 2 601 629
2009 4 640 10 1 586 205 1 381 2 054 7 2 047 989
2010 5 440 9 2 250 262 1 988 1 956 11 1 945 1 225
2011 5 984 12 2 644 277 2 367 2 042 6 2 037 1 286
2012 6 948 9 2 717 244 2 472 2 420 4 2 416 1 802
2013
February 6 923 9 2 709 226 2 484 2 380 3 2 377 1 825
March 7 037 9 2 722 223 2 499 2 456 3 2 453 1 849
April 7 130 9 2 773 223 2 550 2 498 3 2 496 1 849
May 7 054 9 2 638 223 2 415 2 529 3 2 527 1 877
June 7 115 9 2 601 223 2 377 2 746 3 2 743 1 759
July 7 050 9 2 410 223 2 187 2 884 3 2 881 1 746
August 7 099 9 2 472 224 2 248 2 861 3 2 858 1 757
September 7 181 9 2 406 223 2 183 2 974 3 2 971 1 792
October 6 995 34 2 233 223 2 010 2 923 3 2 920 1 805
November 7 189 35 2 413 223 2 190 2 909 8 2 901 1 832
December 7 411 330 2 213 220 1 994 2 929 3 2 926 1 938
2014
January 7 380 330 2 201 219 1 981 2 942 3 2 939 1 908
February 8 280 330 2 617 219 2 397 2 917 3 2 914 2 416
annual growth rates, %
2005 58.5 60.9 159.0 … … 43.4 300.0 42.4 1 063.6
2006 14.8 554.1 102.4 – – –7.7 –78.1 –6.9 22.7
2007 57.7 16.2 138.2 202.5 129.6 19.6 42.4 19.5 249.2
2008 1.5 54.6 19.4 –38.7 29.3 –19.0 –58.9 –18.8 14.7
2009 –29.4 –97.7 –45.4 –5.5 –48.6 –21.2 67.0 –21.3 57.3
2010 17.3 –8.4 41.9 27.9 43.9 –4.8 60.7 –5.0 23.8
2011 10.0 27.1 17.5 5.8 19.0 4.4 –47.4 4.7 5.0
2012 16.1 0.1 2.7 –11.8 4.4 18.5 –37.0 18.6 40.2
2013
February 17.1 – 2.3 –19.8 4.9 21.4 –48.7 21.6 40.9
March 22.4 – 8.9 –1.3 10.0 27.7 –48.8 27.9 40.6
April 23.0 – 11.1 –1.2 12.3 29.9 –47.3 30.1 35.5
May 21.6 – 5.2 –1.3 5.8 30.4 –35.3 30.5 39.5
June 24.1 0.1 0.8 –1.1 1.0 35.8 –24.9 35.9 56.7
July 21.6 0.1 –8.5 –1.1 –9.2 41.8 –29.8 41.9 55.6
August 19.1 0.1 –8.3 –0.8 –9.0 34.1 –22.7 34.2 56.5
September 14.3 0.1 –11.2 –1.2 –12.1 35.9 –30.9 36.0 30.0
October 10.8 281.0 –19.1 –1.4 –20.7 35.1 –17.9 35.2 30.9
November 10.1 283.0 –10.8 –1.4 –11.7 33.0 127.1 32.8 12.8
December 6.7 – –18.5 –10.2 –19.4 21.0 –22.6 21.1 7.5
2014
January 8.0 – –16.4 –2.8 –17.7 24.2 –9.5 24.3 4.6
February 19.6 – –3.4 –2.7 –3.5 22.6 –4.4 22.6 32.4
1 Data refined from March 2011 to April 2013
non-financial corporations
total 1
including
totalnon-residents
Period Total
including
other deposit-
taking
corporations 1
including
other financial corporations

3. Monetary Statistics
3.4. Securities held by deposit-taking corporations (excluding National Bank of Ukraine)
3.4.3. Holdings of shares and other equity
3.4.3.2. Holdings of shares and other equity, breakdown by type of portfolio
tradable
shares
shares
available
for sale 1
equity
investments in
associates and
subsidiaries
tradable
shares
shares
available
for sale 1
equity
investments in
associates and
subsidiaries
tradable
shares
shares
available
for sale
equity
investments in
associates and
subsidiaries
tradable
shares
shares
available
for sale
equity
investments in
associates and
subsidiaries
1 2 3 4 5 6 7 8 9 10 11 12 13 14 15 16 17 18
outstanding amounts at end of period, in millions of hryvnias
2005 3 580 37 – 24 12 505 0 481 24 2 911 476 2 322 113 128 – 9 119
2006 4 109 242 – 9 233 1 022 598 352 72 2 688 1 603 1 009 76 157 1 3 154
2007 6 478 281 0 9 272 2 434 1 590 625 219 3 215 1 964 1 051 200 548 – 1 547
2008 6 575 435 – 9 426 2 906 1 568 1 020 318 2 605 1 411 1 004 190 629 59 5 565
2009 4 640 10 1 9 – 1 586 812 470 304 2 054 600 1 264 190 989 105 64 820
2010 5 440 9 – 9 – 2 250 646 1 232 372 1 956 672 1 162 122 1 225 84 58 1 083
2011 5 984 12 – 12 – 2 644 853 1 104 687 2 042 761 1 119 163 1 286 123 81 1 082
2012 6 948 9 – 9 – 2 717 854 1 168 695 2 420 789 1 418 213 1 802 – 390 1 412
2013 –
February 6 923 9 – 9 – 2 709 914 1 100 695 2 380 766 1 400 213 1 825 – 414 1 412
March 7 037 9 – 9 – 2 722 905 1 093 724 2 456 777 1 466 214 1 849 – 438 1 412
April 7 130 9 – 9 – 2 773 924 1 125 724 2 498 882 1 403 213 1 849 – 438 1 411
May 7 054 9 – 9 – 2 638 920 994 724 2 529 882 1 434 213 1 877 – 465 1 411
June 7 115 9 – 9 – 2 601 921 956 724 2 746 884 1 649 213 1 759 – 347 1 411
July 7 050 9 – 9 – 2 410 909 964 537 2 884 887 1 597 400 1 746 – 334 1 412
August 7 099 9 – 9 – 2 472 900 1 036 536 2 861 888 1 580 392 1 757 – 346 1 412
September 7 181 9 – 9 – 2 406 902 968 536 2 974 898 1 627 449 1 792 – 380 1 412
October 6 995 34 – 34 – 2 233 902 794 536 2 923 903 1 571 449 1 805 3 390 1 412
November 7 189 35 – 35 – 2 413 1 106 789 518 2 909 907 1 553 449 1 832 3 417 1 412
December 7 411 330 – 35 295 2 213 899 795 519 2 929 990 1 471 468 1 938 4 451 1 484
2014
January 7 380 330 – 35 295 2 201 929 752 519 2 942 989 1 485 468 1 908 3 421 1 484
February 8 280 330 – 35 295 2 617 1 358 739 519 2 917 992 1 457 468 2 416 4 547 1 865
annual growth rates, %
2005 58.6 62.4 – 828.1 –38.7 159.3 –76.3 190.4 –13.8 43.4 1 383.1 24.3 –12.8 1 045.7 – 383.8 1 179.7
2006 14.7 559.2 – –63.2 1 803.4 102.5 – –26.7 200.7 –7.7 236.2 –56.6 –32.6 23.3 – –65.7 29.7
2007 57.7 16.1 419.0 1.6 16.6 138.1 166.0 77.6 202.1 19.7 22.6 4.2 163.1 248.4 – –54.2 255.7
2008 1.5 54.8 – –1.9 56.7 19.4 –1.3 63.1 45.1 –19.0 –28.1 –4.5 –4.8 14.7 – 281.1 3.2
2009 –29.4 –97.7 – 0.6 – –45.4 –48.2 –54.0 –4.2 –21.2 –57.5 25.9 – 57.3 78.6 1 071.5 45.3
2010 17.3 –8.4 – 0.5 – 41.9 –20.5 162.3 22.4 –4.8 12.1 –8.0 –36.0 23.8 –20.0 –9.0 32.0
2011 10.0 27.1 – 27.1 – 17.5 32.2 –10.5 84.5 4.4 13.2 –3.7 33.5 5.0 45.6 40.1 –0.1
2012 16.1 0.1 – 0.1 – 2.7 0.1 5.6 1.1 18.5 3.7 26.7 31.3 40.2 – 381.5 30.5
2013
February 17.1 – – – – 2.3 4.7 12.1 –12.5 21.4 1.5 34.3 31.3 40.9 – 357.7 30.4
March 22.4 – – – – 8.9 7.7 10.8 7.8 27.7 –1.1 47.0 50.7 40.6 – 381.8 30.4
April 23.0 – – – – 11.1 8.0 16.0 7.8 29.9 16.8 37.1 47.0 35.5 – 349.0 25.4
May 21.6 – – – – 5.2 6.9 1.8 7.8 30.4 14.1 40.4 46.8 39.5 – 436.9 26.5
June 24.1 0.1 – 0.1 – 0.8 2.3 –5.2 7.8 35.8 11.6 52.0 47.0 56.7 – – 26.5
July 21.6 0.1 – 0.1 – –8.5 1.6 –9.6 –20.0 41.8 15.7 42.2 175.9 55.6 – – 26.5
August 19.1 0.1 – 0.1 – –8.3 0.1 –8.1 –20.1 34.1 16.0 36.9 83.3 56.5 – – 26.5
September 14.3 0.1 – 0.1 – –11.2 –1.7 –13.6 –20.1 35.9 12.9 38.0 109.5 30.0 – 280.6 26.4
October 10.8 281.0 – 281.0 – –19.1 –0.7 –31.2 –23.1 35.1 17.9 32.8 109.5 30.9 –98.1 288.4 26.4
November 10.1 283.0 – 283.0 – –10.8 27.4 –30.9 –25.7 33.0 17.9 29.0 109.5 12.8 – 45.4 5.6
December 6.7 – – 286.4 – –18.5 5.3 –31.9 –25.3 21.0 25.5 3.8 119.1 7.5 – 15.6 5.1
2014
January 8.0 – – 286.8 – –16.4 7.5 –29.9 –25.3 24.2 31.3 5.9 119.1 4.6 – 2.3 5.1
February 6.6 – – 286.6 – –18.8 1.7 –31.6 –25.3 23.6 29.0 6.1 119.1 4.5 – 1.8 5.1
1 Data refined from March 2011 to April 2013
total
non-financial corporations non-residents
including
total
including including
other financial corporations
total 1
including
Period Total
including
other deposit-taking corporations
total 1

4. Financial markets
4.1. Interest rates of deposit-taking corporations (excluding National Bank of Ukraine)
4.1.1. Interest rates on loans (new business)
4.1.1.1. Interest rates and new business volumes of loans granted to resident sectors (excluding deposit-taking corporations)
4.1.1.2. Interest rates and new business volumes of loans granted to non-financial corporations, breakdown by original maturity
4.1.1.3. Interest rates on loans granted to non-financial corporations, breakdown by type of currencies and original maturity
4.1.1.4. Interest rates on loans granted to non-financial corporations, in foreign currency, breakdown by original maturity and currencies
4.1.1.5. Interest rates on loans granted to non-financial corporations, breakdown by type of loans and currencies
4.1.1.6. Interest rates on loans granted to non-financial corporations, breakdown by type of industry and currencies
4.1.1.7. Interest rates and new business volumes of loans granted to households, breakdown by original maturity
4.1.1.8. Interest rates on loans granted to households, breakdown by type of currencies and original maturity
4.1.1.9. Interest rates on loans granted to households, in foreign currency, breakdown by original maturity and currencies
4.1.1.10. Interest rates on loans granted to households, breakdown by type of loans and currencies
4.1.1.11. Interest rates on loans granted to non-residents (excluding deposit-taking corporations), breakdown by type of currencies and original maturity
4.1.2. Interest rates on deposits (new business)
4.1.2.1. Interest rates and new business volumes of deposits by resident sectors (excluding deposit-taking corporations)
4.1.2.2. Interest rates and new business volumes of deposits by other financial corporations, breakdown by maturity
4.1.2.3. Interest rates on deposits from other financial corporations, breakdown by type of currencies and maturity
4.1.2.4. Interest rates on deposits from other financial corporations, in foreign currency, breakdown by maturity and currencies
4.1.2.5. Interest rates and new business volumes of deposits from general government, breakdown by maturity
4.1.2.6. Interest rates and new business volumes of deposits from non-financial corporations, breakdown by maturity
4.1.2.7. Interest rates on deposits from non-financial corporations, breakdown by type of currencies and maturity
4.1.2.8. Interest rates on deposits from non-financial corporations, in foreign currency, breakdown by maturity and currencies
4.1.2.9. Interest rates and new business volumes of deposits from households, breakdown by maturity
4.1.2.10. Interest rates on deposits from households, breakdown by type of currencies and maturity
4.1.2.11. Interest rates on deposits from households, in foreign currency, breakdown by maturity and currencies
4.1.2.12. Interest rates and new business volumes of deposits from non-residents (excluding deposit-taking corporations), breakdown by type of currencies and original maturity
4.2. Money market interest rates
4.2.1. Interest rates and new business volumes of loans granted to resident other deposit-taking corporations
4.2.2. Interest rates and new business volumes of loans granted to non-resident other deposit-taking corporations
4.2.3. Interest rates and new business volumes of deposits from resident other deposit-taking corporations
4.2.4. Interest rates and new business volumes of deposits from non-resident other deposit-taking corporations
4.3. Government securities
4.3.1. Yield of government securities allocated on the primary market
4.3.2. Yield of government securities allocated on the open market
4.4. PFTS index

4. Financial markets
4.1. Interest rates of deposit-taking corporations (excluding National Bank of Ukraine)
4.1.1. Interest rates on loans (new business)
4.1.1.1. Interest rates and new business volumes of loans granted to resident sectors (excluding deposit-taking corporations)
(period average, percentages per annum)
in national
currency
in foreign
currency
in national
currency
in foreign
currency1 2 3 4 5 6 7 8 9 10 11 12 13 14 15 16 17 18 19
2005 438 391 14.6 16.4 11.5 355 815 14.1 16.0 11.6 829 14.0 79 18.6 396 276 14.4 41 207 16.3 … …
2006 627 967 14.1 15.4 11.3 494 758 13.6 15.1 11.3 2 124 14.3 8 15.8 534 677 13.9 91 159 15.2 … …
2007 969 567 13.5 14.4 11.3 768 965 13.0 13.9 11.3 3 438 15.1 10 13.5 809 995 13.1 156 125 15.6 … …
2008 1 116 456 16.0 17.8 11.6 868 542 15.5 17.6 11.6 5 536 17.0 25 21.6 945 532 15.5 165 369 18.7 … …
2009 810 279 18.3 20.9 10.0 717 061 17.7 20.5 9.9 11 264 20.5 1 937 20.8 750 520 18.0 45 520 22.3 1 038 16.5
2010 4
1 112 545 14.6 15.7 10.5 991 849 13.7 14.6 10.6 16 907 17.1 3 259 13.4 1 034 525 14.0 57 800 25.2 54 22.9
2011 1 314 200 14.3 16.0 9.2 1 138 941 13.4 15.0 9.2 20 855 15.3 5 463 15.6 1 189 487 13.3 98 205 26.5 190 19.0
2012 1 371 761 15.5 18.4 8.4 1 191 530 14.7 17.8 8.5 28 828 16.0 2 033 16.0 1 236 640 14.5 104 104 27.4 156 20.0
2013 1 641 018 14.4 16.6 9.4 1 434 974 13.6 15.9 9.4 38 344 13.7 16 412 14.4 1 451 644 13.2 134 274 27.3 343 20.5
February 111 334 14.5 17.0 9.2 96 785 13.4 15.9 9.2 1 504 16.2 1 304 16.2 99 694 13.1 8 815 29.0 17 23.2
March 115 893 15.0 17.4 10.0 99 558 13.8 16.1 10.0 2 867 14.8 701 16.3 101 817 13.5 10 469 29.9 38 19.7
April 145 192 14.4 16.4 9.9 126 639 13.4 15.3 10.0 2 755 12.5 3 470 15.3 126 282 13.0 12 636 28.1 48 20.8
May 106 459 14.5 16.8 9.3 91 566 13.4 15.6 9.4 1 373 13.6 1 140 15.5 92 917 13.2 10 984 26.0 44 18.4
June 126 290 13.9 15.9 9.8 111 998 13.1 15.1 9.9 2 932 13.5 1 090 16.1 113 038 12.8 9 203 27.2 26 21.7
July 133 333 14.1 16.6 9.3 115 741 13.3 15.8 9.4 2 585 13.0 493 18.5 118 578 12.8 11 646 27.5 31 21.5
August 151 769 13.7 15.7 9.8 135 906 13.0 15.0 9.8 3 065 14.3 787 12.5 136 828 12.6 11 065 26.8 24 22.0
September 142 673 14.0 15.8 9.6 125 689 13.4 15.2 9.6 5 245 15.5 829 14.1 124 925 12.8 11 654 26.0 20 21.7
October 155 381 13.9 15.8 8.9 134 659 13.4 15.4 8.9 3 003 14.5 448 15.5 139 778 12.8 12 136 26.6 16 24.3
November 167 670 14.9 17.0 8.6 147 843 14.5 16.7 8.7 4 299 13.0 1 598 12.2 150 153 14.0 11 605 27.7 14 24.2
December 183 811 15.0 17.7 8.8 161 284 14.5 17.4 8.8 6 312 12.2 1 308 13.4 161 190 14.1 14 946 26.0 56 17.2
2014
January 134 904 14.1 15.7 8.6 116 557 13.4 15.1 8.7 3 636 14.4 582 15.7 119 874 12.9 10 800 26.7 12 24.6
February 128 898 16.3 20.0 9.0 115 500 16.0 20.3 9.0 2 720 13.0 512 17.6 115 038 15.2 10 609 28.6 19 24.1
1 To January 2009 data refer to overdraft.
2 To January 2009 includes sub-sectors of employers and own-account workers of the households sector.
3 To January 2009 includes sub-sectors of employees and recipients of property and transfer incomes of the households sector.
Period
including
Excluding overdraft
interest
rates, %
business
volume,
hryvnias
interest
rates, %
business
volume,
hryvnias
business
volume,
hryvnias
Total
interest
rates, %
business
volume,
hryvnias
including
other financial
corporations 1 general government
non-financial
corporations 2 households
3
4 Since January 2010 include interest rates and volumes under primary agreements concluded during the reporting period as well as, аdditional agreements, a change whereof occurred either in the amount or the interest
rate, or the amount and the interest rate.
non-profit institutions
serving households
business
volume,
hryvnias
interest
rates, %
interest
rates, %
business
volume,
hryvnias
includinginterest
rates, %
business
volume,
hryvnias
interest
rates, %

4. Financial markets
4.1. Interest rates of deposit-taking corporations (excluding National Bank of Ukraine)
4.1.1. Interest rates on loans (new business)
4.1.1.2. Interest rates and new business volumes of loans granted to non-financial corporations 1, breakdown by original maturity
(period average, percentages per annum)
business volume,
hryvnias mln
interest
rates, %
business volume,
hryvnias mln
interest
rates, %
business volume,
hryvnias mln
interest
rates, %
business volume,
hryvnias mln
interest
rates, %
business volume,
hryvnias mln
interest
rates, %
business volume,
hryvnias mln
interest
rates, %
1 2 3 4 5 6 7 8 9 10 11 12 13
2005 396 276 14.4 77 793 16.8 318 483 13.9 210 111 13.7 108 372 14.2 … …
2006 534 677 13.9 121 049 15.9 413 627 13.3 272 651 13.1 140 976 13.8 … …
2007 809 995 13.1 183 379 15.3 626 616 12.5 404 272 11.9 222 344 13.6 … …
2008 945 532 15.5 221 440 16.9 724 092 15.1 503 769 15.1 197 435 15.2 22 888 14.0
2009 750 522 18.0 77 524 21.8 672 999 17.5 575 460 17.4 87 562 18.2 9 977 16.5
2010 3
1 034 525 14.0 96 097 20.1 938 428 13.4 714 830 13.0 184 505 15.3 39 093 11.4
2011 1 189 487 13.3 133 059 16.8 1 056 428 12.8 773 107 12.6 237 025 13.7 46 295 10.9
2012 1 236 640 14.5 146 640 18.6 1 089 999 13.9 908 912 13.9 147 416 14.5 33 672 12.0
2013 1 451 644 13.2 162 517 18.1 1 289 127 12.6 1 093 938 12.3 162 450 14.9 32 739 11.2
February 99 694 13.1 11 250 19.6 88 444 12.3 77 497 11.9 9 597 15.5 1 349 13.3
March 101 817 13.5 11 884 19.4 89 933 12.7 76 945 12.2 11 408 16.2 1 581 13.9
April 126 282 13.0 13 799 18.2 112 483 12.4 95 252 12.0 14 511 14.8 2 720 11.5
May 92 917 13.2 11 569 19.0 81 348 12.3 70 429 12.0 10 157 14.3 762 12.9
June 113 038 12.8 11 404 18.5 101 634 12.1 82 626 12.0 12 426 14.3 6 582 10.3
July 118 578 12.8 14 212 18.1 104 366 12.1 87 466 11.6 14 536 15.1 2 363 12.6
August 136 828 12.6 13 133 18.0 123 695 12.1 102 317 11.8 15 636 14.3 5 742 9.9
September 124 925 12.8 13 693 17.8 111 232 12.2 95 552 11.7 13 569 15.8 2 111 12.0
October 139 778 12.8 17 216 15.7 122 561 12.4 103 045 12.0 17 767 15.0 1 750 11.0
November 150 153 14.0 15 955 16.9 134 198 13.6 113 825 13.4 17 323 15.4 3 050 12.6
December 161 190 14.1 17 730 17.8 143 461 13.7 123 097 13.6 17 348 14.6 3 015 11.3
2014
January 119 874 12.9 14 985 16.9 104 889 12.4 89 996 12.0 11 699 15.9 3 194 9.7
February 115 038 15.2 10 307 17.4 104 731 15.0 84 634 15.3 17 188 14.0 2 909 13.1
1 To January 2009 includes sub-sectors of employers and own-account workers of the households sector.
2 To January 2007 data include loans with original original maturity over 1 year.
3 Since January 2010 include interest rates and volumes under primary agreements concluded during the reporting period as well as, аdditional agreements, a change whereof occurred either in the amount or the
interest rate, or the amount and the interest rate.
Period up to 1 year over 1 year and up to 5 years 2
including
overdraft excluding overdraftincluding by original maturity
over 5 years
Total

4. Financial markets
4.1. Interest rates of deposit-taking corporations (excluding National Bank of Ukraine)
4.1.1. Interest rates on loans (new business)
4.1.1.3. Interest rates on loans granted to non-financial corporations 1, breakdown by type of currencies and original maturity
(period average, percentages per annum)
up to 1
year
over 1 year
and up to 5
years 2
over 5
years
up to 1
year
over 1 year
and up to 5
years 2
over 5
years
up to 1
year
over 1 year
and up to 5
years 2
over 5
years
1 2 3 4 5 6 7 8 9 10 11 12 13 14 15 16 17 18 19
2005 14.4 16.8 13.9 13.7 14.2 … 16.1 17.2 15.7 15.8 15.5 … 11.2 11.5 11.2 10.7 12.2 …
2006 13.9 15.9 13.3 13.1 13.8 … 15.1 16.2 14.7 14.4 15.2 … 10.7 11.3 10.7 10.1 11.6 …
2007 13.1 15.3 12.5 11.9 13.6 … 13.9 15.6 13.3 12.6 14.8 … 10.5 11.2 10.5 9.7 11.5 …
2008 15.5 16.9 15.1 15.1 15.2 14.0 17.2 17.3 17.1 17.4 16.4 17.4 10.6 6.8 10.8 9.9 12.6 12.0
2009 18.0 21.8 17.5 17.4 18.2 16.5 21.0 22.2 20.8 21.1 19.6 19.1 9.7 10.6 9.7 9.1 14.1 12.1
2010 3
14.0 20.1 13.4 13.0 15.3 11.4 14.9 20.4 14.2 13.7 16.6 12.8 10.5 6.5 10.5 9.9 12.4 9.7
2011 13.3 16.8 12.8 12.6 13.7 10.9 14.7 17.0 14.3 14.1 15.1 14.6 9.2 6.0 9.2 8.8 10.5 8.9
2012 14.5 18.6 13.9 13.9 14.5 12.0 17.3 18.9 17.0 17.1 17.2 13.3 8.4 6.6 8.4 8.1 10.3 9.6
2013 13.2 18.1 12.6 12.3 14.9 11.2 15.2 18.4 14.6 14.1 18.3 12.1 9.4 6.7 9.4 9.2 10.3 10.3
February 13.1 19.6 12.3 11.9 15.5 13.3 15.4 19.9 14.5 13.9 18.5 15.2 9.2 6.8 9.2 9.1 9.8 11.0
March 13.5 19.4 12.7 12.2 16.2 13.9 15.5 19.6 14.6 14.0 18.5 15.2 10.0 9.1 10.0 9.7 11.8 12.9
April 13.0 18.2 12.4 12.0 14.8 11.5 14.6 18.6 13.9 13.3 18.9 15.1 10.0 7.0 10.0 9.9 10.8 10.1
May 13.2 19.0 12.3 12.0 14.3 12.9 15.1 19.4 14.2 13.8 17.0 15.9 9.3 5.1 9.4 9.2 10.6 9.0
June 12.8 18.5 12.1 12.0 14.3 10.3 14.5 18.9 13.7 13.5 18.0 10.2 9.9 6.7 9.9 9.8 10.2 11.0
July 12.8 18.1 12.1 11.6 15.1 12.6 14.9 18.5 14.1 13.3 19.0 13.5 9.4 6.0 9.4 9.3 10.2 9.8
August 12.6 18.0 12.1 11.8 14.3 9.9 14.3 18.3 13.6 13.3 18.6 9.7 9.8 7.8 9.8 9.6 10.6 10.6
September 12.8 17.8 12.2 11.7 15.8 12.0 14.4 18.1 13.7 13.0 18.3 13.8 9.6 6.4 9.6 9.5 10.2 11.0
October 12.8 15.7 12.4 12.0 15.0 11.0 14.4 16.0 14.1 13.5 19.1 11.6 8.9 6.6 9.0 8.7 9.8 10.4
November 14.0 16.9 13.6 13.4 15.4 12.6 16.0 17.2 15.8 15.4 18.7 17.3 8.7 6.4 8.7 8.3 10.3 9.6
December 14.1 17.8 13.7 13.6 14.6 11.3 16.8 18.2 16.6 16.5 17.4 12.8 8.8 6.2 8.8 8.4 10.8 10.8
2014
January 12.9 16.9 12.4 12.0 15.9 9.7 14.4 17.2 13.8 13.3 18.9 10.3 8.6 5.4 8.6 8.5 9.7 8.2
February 15.2 17.4 15.0 15.3 14.0 13.1 19.0 17.6 19.2 19.6 17.8 14.7 9.0 6.8 9.0 8.8 9.7 8.9
1 To January 2009 includes sub-sectors of employers and own-account workers of the households sector.
2 To January 2007 data include loans with original original maturity over 1 year.
3 Since January 2010 include interest rates and volumes under primary agreements concluded during the reporting period as well as, аdditional agreements, a change whereof occurred either in the amount or the
interest rate, or the amount and the interest rate.
Period including by original maturity
including
total
including
totalexcluding
overdraft
including by original maturity
excluding
overdraftoverdraft
Total
including
including
in national currency in foreign currency
overdraftexcluding
overdraft
including by original maturity
overdraft

4. Financial markets
4.1. Interest rates of deposit-taking corporations (excluding National Bank of Ukraine)
4.1.1. Interest rates on loans (new business)
4.1.1.4. Interest rates on loans granted to non-financial corporations 1, in foreign currency, breakdown by original maturity and currencies
(period average, percentages per annum)
US
dollarEuro
Rus-
sian
ruble
otherUS
dollarEuro
Rus-
sian
ruble
otherUS
dollarEuro
Rus-
sian
ruble
otherUS
dollarEuro
Rus-
sian
ruble
otherUS
dollarEuro
Rus-
sian
ruble
otherUS
dollarEuro
Rus-
sian
ruble
other
1 2 3 4 5 6 7 8 9 10 11 12 13 14 15 16 17 18 19 20 21 22 23 24 25
2005 11.0 11.1 20.3 5.5 10.7 12.3 28.1 55.5 11.0 11.0 19.8 4.6 10.5 10.3 20.3 3.7 12.1 12.3 16.1 9.0 … … … …
2006 10.7 10.5 18.4 6.8 11.8 8.2 17.6 18.3 10.7 10.7 18.4 6.8 10.0 10.3 19.0 4.9 11.7 11.2 17.2 9.0 … … … …
2007 10.6 10.0 12.6 7.5 11.7 9.1 7.1 41.0 10.6 10.1 13.0 7.4 9.8 9.2 13.2 4.8 11.6 11.0 12.3 9.3 … … … …
2008 10.7 10.3 10.3 8.0 7.3 7.6 2.0 27.0 10.8 10.5 12.7 8.0 10.0 9.5 12.6 6.4 12.7 12.3 13.1 14.3 12.3 11.0 16.5 10.8
2009 9.9 8.6 17.6 1.6 10.9 8.1 17.8 14.8 9.9 8.6 17.6 1.6 9.3 7.9 16.9 1.5 14.1 13.7 21.9 8.8 12.4 11.7 – 5.4
2010 3
10.6 10.0 14.9 4.0 6.6 5.3 20.5 0.9 10.6 10.1 14.9 4.0 9.9 10.2 14.9 2.6 12.5 11.2 14.9 7.7 10.3 9.4 – 4.0
2011 9.1 8.9 12.0 7.5 6.1 5.2 16.4 13.0 9.2 9.1 11.9 7.5 8.8 8.3 12.3 13.3 10.5 10.0 11.5 10.7 8.8 9.5 10.8 5.0
2012 8.3 8.4 12.8 10.0 7.4 4.6 13.1 7.7 8.3 8.6 12.8 10.0 8.0 7.7 13.0 19.2 10.4 9.6 11.5 8.5 9.5 9.8 11.0 8.8
2013 9.3 9.0 13.4 8.4 7.6 3.9 14.6 3.1 9.3 9.2 13.4 8.4 9.1 8.6 13.4 8.4 10.2 10.8 15.2 20.0 10.4 9.4 10.4 –
February 9.0 9.6 14.3 3.0 6.4 4.3 15.0 3.0 9.0 9.7 14.3 – 8.9 9.5 14.3 – 9.6 10.9 14.2 – 11.0 8.5 – –
March 9.9 9.1 14.2 3.0 8.6 6.3 14.8 3.0 9.9 9.2 14.2 – 9.6 9.0 14.1 – 12.1 9.4 16.0 – 13.1 11.7 – –
April 10.0 8.2 13.9 8.4 8.1 3.3 14.4 3.1 10.0 8.5 13.9 8.4 9.8 8.6 13.8 8.4 10.7 10.7 14.8 – 10.7 1.2 11.7 –
May 9.2 8.8 13.7 8.4 6.3 2.7 13.7 3.1 9.3 9.2 13.7 8.4 9.1 8.1 13.5 8.4 10.4 11.0 16.8 – 9.2 6.0 – –
June 9.8 9.3 13.0 – 8.2 2.8 14.3 – 9.8 9.5 13.0 – 9.8 7.9 12.8 – 9.7 11.3 15.6 – 11.5 7.5 – –
July 9.4 7.9 13.1 – 6.9 3.4 14.0 – 9.4 8.0 13.1 – 9.3 7.1 13.0 – 10.1 10.7 15.0 – 11.3 7.4 – –
August 9.8 8.5 13.8 – 9.3 5.2 14.0 – 9.8 8.8 13.8 – 9.6 8.1 13.7 – 10.5 11.5 14.7 – 10.6 8.1 – –
September 9.6 9.0 12.9 19.6 7.4 3.2 16.6 3.1 9.6 9.2 12.9 20.0 9.5 9.1 12.8 – 10.2 9.6 16.4 20.0 11.1 9.3 11.7 –
October 8.9 8.6 12.4 3.0 7.8 3.7 15.5 3.0 8.9 8.9 12.4 – 8.6 8.7 12.4 – 9.8 9.6 14.1 – 10.5 8.0 8.5 –
November 8.6 8.9 12.7 11.8 8.2 3.6 – 3.0 8.6 9.2 12.7 20.0 8.2 8.5 12.6 – 10.1 11.0 16.6 20.0 9.6 8.0 – –
December 8.6 9.9 12.6 20.0 6.8 3.3 – – 8.6 10.0 12.6 20.0 8.2 9.4 12.6 20.0 10.8 11.1 14.7 – 11.5 10.5 – –
2014
January 8.5 8.6 12.6 20.0 6.4 3.1 18.0 – 8.5 8.9 12.6 20.0 8.3 8.9 12.5 20.0 9.8 9.1 15.6 – 8.3 7.6 – –
February 9.0 8.7 10.5 56.2 6.4 8.5 – 3.0 9.0 8.7 10.5 59.7 8.8 8.8 10.2 59.7 9.7 8.6 16.3 – 9.1 7.5 – –
1 To January 2009 includes sub-sectors of employers and own-account workers of the households sector.
2 To January 2007 data include loans with original original maturity over 1 year.
3 Since January 2010 include interest rates and volumes under primary agreements concluded during the reporting period as well as, аdditional agreements, a change whereof occurred either in the amount or the
interest rate, or the amount and the interest rate.
over 1 year and up to 5 years 2 over 5 years
Period
including
overdraft excluding overdraftincluding by original maturity
up to 1 year
Total

4. Financial markets
4.1. Interest rates of deposit-taking corporations (excluding National Bank of Ukraine)
4.1.1. Interest rates on loans (new business)
4.1.1.5. Interest rates on loans granted to non-financial corporations 1, breakdown by type of loans and currencies
(period average, percentages per annum)
hryvnia US dollar EuroRussian
rubleother hryvnia US dollar Euro
Russian
rubleother
1 2 3 4 5 6 7 8 9 10 11 12 13 14
2005 14.4 … … … … … … 14.4 16.1 11.1 11.1 20.3 5.5
2006 13.9 14.8 17.1 12.7 12.1 13.1 9.1 13.9 15.1 10.7 10.5 18.5 6.7
2007 13.1 13.8 15.2 11.5 12.3 – 8.5 13.4 14.3 10.4 9.6 10.0 7.9
2008 15.5 15.5 18.6 11.9 12.5 – 9.1 15.8 17.5 10.9 10.3 10.2 8.0
2009 18.0 19.2 22.3 12.5 12.6 – – 17.9 21.0 9.9 8.6 17.6 1.6
2010 2
14.0 15.5 17.3 10.7 9.4 – 8.4 14.0 14.9 10.6 10.0 14.9 3.8
2011 13.3 11.9 15.4 9.2 9.5 – – 13.3 14.7 9.1 8.9 12.0 7.5
2012 14.5 13.1 14.9 9.0 9.4 14.5 8.5 14.5 17.3 8.3 8.4 12.8 10.1
2013 13.2 13.0 13.5 11.4 10.7 20.2 – 13.2 15.2 9.3 9.0 13.4 8.4
February 13.1 13.8 14.0 11.4 11.8 – – 13.1 15.4 9.0 9.6 14.3 3.0
March 13.5 15.8 16.4 11.7 11.8 – – 13.5 15.5 9.9 9.1 14.2 3.0
April 13.0 13.6 14.7 11.6 12.0 – – 13.0 14.6 10.0 8.2 13.9 8.4
May 13.2 16.0 17.4 10.6 11.9 – – 13.2 15.1 9.2 8.8 13.7 8.4
June 12.8 14.1 15.5 11.0 15.3 – – 12.8 14.5 9.8 9.3 13.0 –
July 12.8 15.7 16.8 11.2 11.9 – – 12.8 14.9 9.4 7.8 13.1 –
August 12.6 10.2 10.1 11.4 12.0 – – 12.6 14.3 9.8 8.5 13.8 –
September 12.8 8.2 6.6 11.8 12.1 – – 12.9 14.4 9.6 9.0 12.9 19.6
October 12.8 14.1 15.3 11.4 10.1 – – 12.8 14.4 8.8 8.6 12.4 3.0
November 14.0 11.3 11.4 11.5 8.5 20.2 – 14.0 16.0 8.6 8.9 12.6 11.8
December 14.1 11.1 10.8 11.8 – – – 14.1 16.8 8.6 9.9 12.6 20.0
2014
January 12.9 10.2 9.8 11.8 – – – 12.9 14.4 8.5 8.6 12.6 20.0
February 15.2 7.4 6.1 11.7 – – – 15.2 19.0 9.0 8.7 10.5 56.2
1 To January 2009 includes sub-sectors of employers and own-account workers of the households sector.
including by currencies
total
including by currencies
total
2 Since January 2010 include interest rates and volumes under primary agreements concluded during the reporting period as well as, аdditional agreements, a change whereof
occurred either in the amount or the interest rate, or the amount and the interest rate.
Period Total
including
real estate loans other lending

4. Financial markets
4.1. Interest rates of deposit-taking corporations (excluding National Bank of Ukraine)
4.1.1. Interest rates on loans (new business)
4.1.1.6. Interest rates on loans granted to non-financial corporations, breakdown by type of industry and currencies
at the end of February 2014
(period average, percentages per annum)
overdraftexcluding
overdraftoverdraft
excluding
overdraftoverdraft
excluding
overdraft1 2 3 4 5 6 7 8 9 10
Total 15.2 17.4 15.0 19.0 17.6 19.2 9.0 6.8 9.0
Agriculture, forestry and fishing 17.4 19.2 17.3 20.6 20.6 20.5 8.1 5.3 8.1
Mining and quarrying 10.3 18.5 10.3 21.0 18.5 21.3 9.2 2.3 9.2
Manufacturing 15.1 18.6 14.8 19.4 19.1 19.5 8.4 7.1 8.4
Electricity, gas, steam and air conditioning supply 16.0 17.4 15.8 18.4 17.5 18.6 7.6 11.0 7.6
Water supply; sewerage, waste management and
remediation activities 15.3 17.6 14.6 15.3 17.6 14.6 14.1 – 14.1
Construction 17.6 19.6 17.3 18.7 19.6 18.6 11.2 – 11.2
Wholesale and retail trade; repair of motor vehicles
and motorcycles 15.8 19.7 15.4 19.5 19.8 19.4 9.3 5.6 9.4
Transportation and storage 17.7 19.6 17.2 18.8 19.6 18.5 10.2 50.0 10.2
Accommodation and food service activities 13.4 22.9 12.3 13.4 22.9 12.2 12.8 – 12.8
Information and communication 13.5 4.8 15.5 16.3 4.6 20.7 8.4 8.2 8.5
Real estate activities 17.1 16.9 17.1 18.0 16.9 18.0 7.9 – 7.9
Professional, scientific and technical activities 12.7 2.6 15.6 13.7 2.6 19.1 10.8 – 10.8
Administrative and support service activities 9.6 22.4 9.2 17.9 22.8 16.6 8.3 11.0 8.3
Education 23.3 24.6 23.2 23.3 24.6 23.2 20.0 – 20.0
Human health and social work activities 21.5 23.7 20.7 21.6 23.7 20.9 18.4 – 18.4
Arts, entertainment and recreation 8.3 21.3 8.1 8.2 21.3 8.0 14.1 – 14.1
Other service activities 22.8 22.8 22.8 22.8 22.8 22.8 12.9 – 12.9
including
Note. Data are given according to the National classificator of Ukraine DK 009:2010 "Classification of economic activities" approved by the decree of State Committee of Ukraine for Technical Regulation and
Consumer Policy from 11.10.2010 № 457 (as amended).
Types of industry Total
total
including
including
in national currency in foreign currency
total
including

4. Financial markets
4.1. Interest rates of deposit-taking corporations (excluding National Bank of Ukraine)
4.1.1. Interest rates on loans (new business)
4.1.1.7. Interest rates and new business volumes of loans granted to households 1, breakdown by original maturity
(period average, percentages per annum)
business volume,
hryvnias mln
interest
rates, %
business volume,
hryvnias mln
interest
rates, %
business volume,
hryvnias mln
interest
rates, %
business volume,
hryvnias mln
interest
rates, %
business volume,
hryvnias mln
interest
rates, %
business volume,
hryvnias mln
interest
rates, %
1 2 3 4 5 6 7 8 9 10 11 12 13
2005 41 207 16.3 3 954 15.5 37 253 16.4 9 082 19.2 28 171 15.5 … …
2006 91 159 15.2 10 036 15.9 81 123 15.1 17 507 17.4 63 616 14.5 … …
2007 156 125 15.6 13 785 18.2 142 340 15.3 26 116 17.8 116 223 14.8 … …
2008 165 369 18.7 20 938 29.1 144 431 17.2 31 277 20.0 39 801 20.1 73 353 14.5
2009 45 520 22.3 13 986 27.7 31 534 19.9 15 039 19.7 10 231 21.8 6264 17.4
2010 3
57 800 25.2 23 277 31.9 34 523 20.6 19 106 20.4 10 198 23.5 5219 16.0
2011 98 205 26.5 39 505 32.4 58 700 22.6 25 633 22.2 23 555 25.5 9512 16.3
2012 104 104 27.4 29 912 30.4 74 192 26.2 31 334 25.4 32 886 29.3 9 972 18.4
2013 134 274 27.3 35 823 28.6 98 451 26.8 42 147 25.9 49 277 28.5 7 028 20.7
February 8 815 29.0 2 878 30.4 5 937 28.2 2 467 27.3 3 078 30.0 393 20.8
March 10 469 29.9 3 969 31.7 6 501 28.7 2 569 27.9 3 376 30.5 557 21.7
April 12 636 28.1 4 101 30.9 8 535 26.8 3 604 24.9 4 176 29.5 755 20.6
May 10 984 26.0 2 974 29.9 8 010 24.5 3 839 21.6 3 703 28.0 469 20.6
June 9 203 27.2 2 132 28.0 7 071 27.0 2 967 26.0 3 498 28.8 607 21.7
July 11 646 27.5 2 817 27.0 8 829 27.7 3 517 27.9 4 532 28.7 780 21.0
August 11 065 26.8 2 350 26.6 8 714 26.8 3 804 26.2 4 305 28.2 606 20.9
September 11 654 26.0 2 570 25.5 9 084 26.2 3 993 25.0 4 471 28.2 620 19.3
October 12 136 26.6 2 968 26.5 9 167 26.6 4 177 24.8 4 317 29.2 673 20.6
November 11 605 27.7 2 943 26.5 8 662 28.1 3 611 28.0 4 434 29.5 617 19.6
December 14 946 26.0 3 403 26.9 11 542 25.7 4 844 26.0 6 002 26.1 696 19.6
2014
January 10 800 26.7 2 997 26.5 7 803 26.8 3 666 25.8 3 724 28.5 414 20.5
February 10 609 28.6 2 242 28.1 8 367 28.7 4 356 28.9 3 603 29.4 408 20.5
1 To January 2009 includes sub-sectors of employees and recipients of property and transfer incomes of the households sector.
2 To January 2007 data include loans with original original maturity over 1 year.
3 Since January 2010 include interest rates and volumes under primary agreements concluded during the reporting period as well as, аdditional agreements, a change whereof occurred either in the amount or the
interest rate, or the amount and the interest rate.
Period
Total
including
overdraft excluding overdraftincluding by original maturity
up to 1 year over 1 year and up to 5 years 2 over 5 years

4. Financial markets
4.1. Interest rates of deposit-taking corporations (excluding National Bank of Ukraine)
4.1.1. Interest rates on loans (new business)
4.1.1.8. Interest rates on loans granted to households 1, breakdown by type of currencies and original maturity
(period average, percentages per annum)
up to 1
year
over 1 year
and up to 5
years 2
over 5
years
up to 1
year
over 1 year
and up to 5
years 2
over 5
years
up to 1
year
over 1 year
and up to 5
years 2
over 5
years
1 2 3 4 5 6 7 8 9 10 11 12 13 14 15 16 17 18 19
2005 16.3 15.5 16.4 19.2 15.5 … 20.0 19.3 20.0 21.3 19.3 … 13.4 10.3 13.6 15.2 13.4 …
2006 15.2 15.9 15.1 17.4 14.5 … 19.1 19.6 19.0 19.7 18.6 … 12.7 10.3 12.9 14.0 12.7 …
2007 15.6 18.2 15.3 17.8 14.8 … 19.2 21.1 18.9 19.6 18.5 … 13.0 11.0 13.1 14.2 13.0 …
2008 18.7 29.1 17.2 20.0 20.1 14.5 23.0 31.5 20.9 22.6 22.6 17.1 14.3 19.4 14.0 14.7 15.7 13.5
2009 22.3 27.7 19.9 19.7 21.8 17.4 24.3 30.1 21.5 20.5 23.7 20.0 16.2 18.7 15.3 16.4 15.6 13.8
2010 3
25.2 31.9 20.6 20.4 23.5 16.0 26.4 32.4 21.9 20.9 24.5 20.0 13.0 18.2 12.1 11.6 14.0 11.6
2011 26.5 32.4 22.6 22.2 25.5 16.3 27.3 32.5 23.5 22.9 26.1 17.7 12.3 20.9 11.9 12.6 13.8 10.1
2012 27.4 30.4 26.2 25.4 29.3 18.4 27.7 30.4 26.6 25.5 29.4 19.7 11.8 20.3 11.3 10.4 12.4 11.3
2013 27.3 28.6 26.8 25.9 28.5 20.7 27.5 28.6 27.1 26.0 28.7 21.4 12.2 22.5 11.9 13.3 11.1 12.2
February 29.0 30.4 28.2 27.3 30.0 20.8 29.1 30.4 28.4 27.3 30.1 22.4 11.7 28.2 10.6 14.1 13.8 9.2
March 29.9 31.7 28.7 27.9 30.5 21.7 30.1 31.7 29.0 28.0 30.7 22.9 13.0 14.3 13.0 15.0 13.0 12.3
April 28.1 30.9 26.8 24.9 29.5 20.6 28.3 30.9 27.1 24.9 29.8 21.8 12.5 16.8 12.4 16.5 12.5 11.5
May 26.0 29.9 24.5 21.6 28.0 20.6 26.1 30.0 24.6 21.6 28.1 21.2 13.9 12.7 14.0 17.0 13.4 13.2
June 27.2 28.0 27.0 26.0 28.8 21.7 27.4 28.0 27.2 26.1 29.0 22.3 13.1 13.0 13.1 14.5 10.8 13.4
July 27.5 27.0 27.7 27.9 28.7 21.0 27.7 27.0 27.9 28.0 28.8 21.5 13.7 29.7 13.2 15.5 12.2 12.9
August 26.8 26.6 26.8 26.2 28.2 20.9 26.9 26.6 27.0 26.3 28.3 21.3 13.1 22.6 12.8 11.8 11.4 14.7
September 26.0 25.5 26.2 25.0 28.2 19.3 26.4 25.5 26.7 25.1 29.2 19.7 10.7 32.8 10.3 6.3 9.7 14.3
October 26.6 26.5 26.6 24.8 29.2 20.6 26.7 26.5 26.7 24.9 29.4 21.0 13.8 33.1 12.9 12.6 12.0 14.3
November 27.7 26.5 28.1 28.0 29.5 19.6 27.9 26.5 28.3 28.0 29.6 20.4 10.4 21.7 10.1 5.4 11.0 10.7
December 26.0 26.9 25.7 26.0 26.1 19.6 26.1 26.9 25.9 26.1 26.4 19.9 11.7 15.1 11.7 13.9 11.3 10.2
2014
January 26.7 26.5 26.8 25.8 28.5 20.5 26.8 26.5 26.9 25.8 28.6 21.2 10.6 24.7 9.6 12.1 10.6 8.8
February 28.6 28.1 28.7 28.9 29.4 20.5 28.7 28.0 28.8 28.9 29.5 21.3 14.0 41.7 10.2 14.2 10.5 8.7
1 To January 2009 includes sub-sectors of employees and recipients of property and transfer incomes of the households sector.
2 To January 2007 data include loans with original original maturity over 1 year.
Period Total
including
including
in national currency in foreign currency
total
including
total
including
3 Since January 2010 include interest rates and volumes under primary agreements concluded during the reporting period as well as, аdditional agreements, a change whereof occurred either in the amount or the
interest rate, or the amount and the interest rate.
including by original maturity
excluding
overdraft
including by original maturity
overdraftexcluding
overdraftoverdraft
excluding
overdraft
including by original maturity
overdraft

4. Financial markets
4.1. Interest rates of deposit-taking corporations (excluding National Bank of Ukraine)
4.1.1. Interest rates on loans (new business)
4.1.1.9. Interest rates on loans granted to households 1, in foreign currency, breakdown by original maturity and currencies
(period average, percentages per annum)
US
dollarEuro
Rus-
sian
ruble
otherUS
dollarEuro
Rus-
sian
ruble
otherUS
dollarEuro
Rus-
sian
ruble
otherUS
dollarEuro
Rus-
sian
ruble
otherUS
dollarEuro
Rus-
sian
ruble
otherUS
dollarEuro
Rus-
sian
ruble
other
1 2 3 4 5 6 7 8 9 10 11 12 13 14 15 16 17 18 19 20 21 22 23 24 25
2005 13.4 12.3 12.1 8.7 10.3 10.6 – – 13.7 12.4 12.1 8.7 15.3 12.0 12.1 14.6 13.4 12.5 – 8.5 … … … …
2006 12.8 12.1 16.5 8.7 10.3 11.2 – – 13.0 12.1 16.6 8.7 14.1 13.5 16.6 8.4 12.8 12.0 – 8.7 … … … …
2007 13.1 12.4 12.2 9.2 11.0 11.6 – 0.3 13.2 12.5 12.2 9.2 14.2 13.2 12.2 9.6 13.1 12.3 – 9.2 … … … …
2008 14.3 14.3 17.7 9.9 19.7 17.8 – – 14.1 13.5 17.7 9.9 14.8 13.1 17.9 10.9 15.8 14.1 17.9 10.7 13.5 13.2 12.0 9.8
2009 15.9 17.7 25.0 9.2 19.0 18.1 25.0 20.9 15.3 16.4 20.9 9.2 16.3 17.4 20.9 16.1 15.6 15.1 – 9.1 13.8 13.3 – 9.1
2010 3
12.8 16.8 25.0 7.5 18.9 17.4 25.0 12.4 12.2 13.9 – 7.5 11.6 13.3 – – 13.9 15.2 – 9.7 11.8 13.0 – 7.5
2011 12.4 14.2 16.0 6.3 21.0 20.7 32.0 10.0 12.1 10.8 16.0 6.3 12.6 10.3 11.0 9.0 14.0 9.6 15.8 13.5 10.4 12.3 16.4 6.3
2012 12.1 11.0 26.4 7.2 19.9 23.5 26.4 1.5 11.7 9.8 – 7.2 11.2 8.5 – – 12.6 11.1 – 12.5 11.6 12.0 – 7.2
2013 12.6 10.2 32.0 7.0 22.7 21.1 32.0 18.0 12.3 9.8 – 6.9 13.5 11.3 – – 11.8 9.5 – 7.5 12.3 11.8 – 6.7
February 11.9 13.5 32.0 6.0 29.0 20.9 32.0 3.2 10.6 12.9 – 6.1 13.8 14.4 – – 14.0 12.8 – 5.1 9.3 11.0 – 6.2
March 13.3 12.8 – 6.4 13.9 15.2 – 22.0 13.3 12.6 – 6.4 15.9 13.2 – – 13.2 11.6 – 9.5 12.6 11.6 – 5.9
April 12.7 11.7 – 7.8 17.7 13.6 – 22.3 12.6 11.4 – 7.8 16.9 11.4 – – 12.8 11.4 – 8.1 11.7 12.2 – 7.7
May 13.9 13.8 32.0 21.9 11.7 22.6 32.0 21.9 14.1 11.5 – – 17.2 8.4 – – 13.5 12.3 – – 13.2 11.3 – –
June 13.2 10.1 – 4.8 15.4 10.1 – 36.1 13.2 10.0 – 4.3 14.6 9.4 – – 10.9 10.2 – – 13.5 10.0 – 4.3
July 13.8 12.9 – 36.0 29.1 31.9 – 36.0 13.3 11.0 – – 16.7 10.9 – – 12.3 11.2 – – 13.0 10.7 – –
August 13.2 12.5 – 5.1 22.0 26.3 – 22.3 12.9 11.3 – 5.0 12.0 10.6 – – 11.5 11.2 – 5.0 14.6 24.0 – 8.2
September 11.9 9.2 32.0 21.0 33.2 27.4 32.0 21.0 11.3 9.2 – – 6.3 10.7 – – 10.4 9.2 – – 14.4 12.5 – –
October 14.0 12.0 32.0 46.0 33.1 33.3 32.0 46.0 13.1 10.7 – – 13.3 9.5 – – 12.1 10.6 – – 14.2 15.4 – –
November 10.4 10.3 32.0 22.3 20.4 28.1 32.0 22.3 10.1 9.8 – – 5.2 11.6 – – 11.8 9.5 – – 10.7 10.8 – –
December 11.9 10.3 32.0 22.4 13.6 30.6 32.0 22.4 11.9 10.0 – – 14.2 10.7 – – 11.6 9.7 – – 10.1 10.8 – –
2014
January 11.8 11.9 32.0 7.9 20.4 33.7 32.0 22.3 10.9 9.5 – 7.9 13.8 10.4 – – 12.1 9.4 – 7.5 9.8 10.0 – 7.9
February 14.3 12.0 32.0 5.6 42.7 24.3 32.0 22.3 10.3 10.7 – 5.5 14.4 13.0 – – 10.5 9.8 – – 8.9 – – 5.5
1 To January 2009 includes sub-sectors of employees and recipients of property and transfer incomes of the households sector.
2 To January 2007 data include loans with original original maturity over 1 year.
3 Since January 2010 include interest rates and volumes under primary agreements concluded during the reporting period as well as, аdditional agreements, a change whereof occurred either in the amount or the interest
rate, or the amount and the interest rate.
Total
over 5 yearsPeriod
including
overdraft excluding overdraftincluding by original maturity
up to 1 year over 1 year and up to 5 years 2

4. Financial markets
4.1. Interest rates of deposit-taking corporations (excluding National Bank of Ukraine)
4.1.1. Interest rates on loans (new business)
4.1.1.10. Interest rates on loans granted to households 1, breakdown by type of loans and currencies
(period average, percentages per annum)
hryvnia US dollar EuroRussian
rubleother hryvnia US dollar Euro
Russian
rubleother hryvnia US dollar Euro
Russian
rubleother
1 2 3 4 5 6 7 8 9 10 11 12 13 14 15 16 17 18 19 20
2005 16.3 16.3 20.0 13.5 12.3 12.1 8.5 … … … … … … … … … … … …
2006 15.2 15.8 19.2 13.0 12.2 16.5 8.8 12.4 16.1 12.1 11.3 – 8.5 … … … … … …
2007 15.6 16.3 19.6 13.5 12.8 12.2 9.4 13.0 15.5 12.7 11.5 – 9.3 … … … … … …
2008 18.7 19.8 23.4 15.0 14.7 17.7 10.4 14.0 16.8 13.5 13.0 – 9.6 … … … … … …
2009 22.3 22.4 24.0 16.3 18.1 0.3 9.9 17.6 20.6 13.3 12.4 – 9.0 22.6 23.9 15.5 16.4 24.0 14.4
2010 2
25.2 26.5 27.4 13.5 19.0 – 7.1 15.2 19.3 11.9 13.2 – 7.6 19.6 20.6 10.9 15.8 25.0 11.0
2011 26.5 28.1 28.8 13.2 14.7 15.8 6.6 14.9 16.4 9.3 12.4 16.3 6.2 18.6 19.0 11.0 10.7 – 9.0
2012 27.4 28.7 29.0 12.6 11.0 26.4 8.0 15.9 17.1 11.1 11.0 – 6.6 21.8 22.0 13.0 11.1 – 11.1
2013 27.3 28.5 28.5 12.7 19.5 32.0 7.0 17.6 18.5 13.0 12.7 – 7.0 22.2 22.5 12.2 9.7 – 7.3
February 29.0 30.5 30.6 11.5 20.9 32.0 3.7 17.7 19.1 10.0 – – 6.2 21.8 21.9 13.8 12.9 – 5.0
March 29.9 31.3 31.3 15.3 26.8 – 6.8 16.8 19.0 12.5 – – 5.4 22.5 22.8 13.2 12.4 – –
April 28.1 29.2 29.3 12.5 20.9 – 5.0 17.8 19.6 12.6 12.6 – 8.7 22.5 22.8 13.1 11.1 – 8.5
May 26.0 26.7 26.7 15.2 20.5 32.0 21.9 17.7 18.8 13.2 – – – 22.7 22.8 13.8 11.3 – –
June 27.2 28.5 28.5 12.5 10.1 – 36.1 17.6 18.2 14.4 – – 4.3 22.2 22.6 12.9 10.1 – –
July 27.5 29.0 29.0 15.4 29.5 – 36.0 17.8 18.3 13.5 – – – 22.0 22.2 12.6 11.0 – –
August 26.8 27.9 27.9 16.7 23.8 – 17.2 16.8 17.7 13.3 – – – 22.0 22.2 12.0 10.7 – 5.0
September 26.0 27.5 27.5 13.6 19.7 32.0 21.0 17.3 17.9 14.5 14.0 – – 20.7 22.1 10.5 9.2 – –
October 26.6 27.7 27.7 14.4 20.5 32.0 46.0 18.4 19.0 14.5 – – – 22.2 22.4 12.2 10.0 – –
November 27.7 29.2 29.3 8.1 25.9 32.0 22.3 17.0 18.1 10.6 – – – 22.3 22.4 12.1 9.8 – –
December 26.0 26.6 26.7 11.5 22.4 32.0 22.4 18.1 18.3 13.3 – – – 23.3 23.7 12.0 9.9 – –
2014
January 26.7 27.9 27.9 15.6 31.4 32.0 22.3 18.0 18.9 13.5 – – 7.9 22.1 22.3 11.0 9.4 – 7.5
February 28.6 30.0 30.0 19.3 25.5 32.0 22.3 18.5 19.2 11.6 – – 5.5 24.2 24.4 10.6 10.7 – –
Notes. In data from 2005 to February 2008 make a changes decause was make alterations in the methodology.1 To January 2009 includes sub-sectors of employees and recipients of property and transfer incomes of the households sector.
2 Since January 2010 include interest rates and volumes under primary agreements concluded during the reporting period as well as, аdditional agreements, a change whereof occurred either in the amount or the interest
rate, or the amount and the interest rate.
including by currenciestotal
Period Total
including
consumer credit real estate loans other lending
totalincluding by currenciesincluding by currencies
total

4. Financial markets
4.1. Interest rates of deposit-taking corporations (excluding National Bank of Ukraine)
4.1.1. Interest rates on loans (new business)
4.1.1.11. Interest rates and new business volumes on loans granted to non-residents (excluding deposit-taking corporations), breakdown by type of currencies and original maturity
(period average, percentages per annum)
up to 1
year
over 1
year and
up to 5
years 1
over 5
years
up to 1
year
over 1
year and
up to 5
years 1
over 5
years
up to 1
year
over 1
year and
up to 5
years 1
over 5
years
1 2 3 4 5 6 7 8 9 10 11 12 13 14 15 16 17 18 19 20
2005 2 408 16.4 10.8 16.5 16.9 13.6 … 17.3 16.9 18.8 20.2 15.8 … 16.4 2.7 16.5 16.9 13.5 …
2006 2 826 10.2 18.5 10.1 8.7 11.7 … 14.5 18.4 11.3 10.0 17.5 … 10.1 18.8 10.1 8.7 11.6 …
2007 6 278 9.9 18.1 9.9 9.4 11.4 … 12.1 18.8 11.0 10.7 16.3 … 9.8 12.8 9.8 9.3 11.3 …
2008 16 544 12.6 15 12.6 12 14.9 15 4.6 16 4.4 4 17.1 17 13.7 13 13.7 13 14.9 15
2009 10389 17.8 16.0 17.8 16.0 18.9 18.0 22.4 16.6 24.5 25.5 22.6 20.2 17.8 14.1 17.8 16.0 18.9 17.9
2010 2
945 52.0 23.2 53.4 73.7 12.8 12.8 21.7 27.4 19.1 16.9 27.7 17.3 56.2 7.0 56.7 80.0 11.9 11.9
2011 1 536 13.2 27.2 12.8 12.7 18.1 14.6 19.1 27.3 18.5 18.6 18.3 15.3 9.7 21.6 9.7 9.7 13.6 12.0
2012 1 842 11.4 28.4 10.7 10.9 19.5 8.7 23.5 28.4 22.0 22.2 20.0 10.2 9.2 29.7 9.2 9.2 13.4 8.7
2013 3 879 17.9 30.7 17.5 17.5 20.8 17.0 20.3 30.7 19.9 19.9 25.9 17.0 9.5 21.9 9.5 9.5 11.8 –
February 168 14.4 30.1 13.8 13.8 26.2 – 27.3 30.1 26.9 26.9 26.2 – 9.3 18.7 9.3 9.3 – –
March 140 11.2 30.3 10.1 10.0 22.5 – 23.3 30.3 15.0 13.6 22.5 – 9.8 19.1 9.8 9.8 – –
April 22 22.7 30.7 18.1 17.9 20.2 – 23.4 30.8 15.1 12.9 25.1 – 21.4 29.1 21.2 22.2 3.7 –
May 161 11.1 30.8 10.2 10.0 13.3 – 18.1 30.8 14.4 13.8 26.6 – 9.6 15.5 9.6 9.3 12.3 –
June 584 17.8 32.2 17.6 17.6 17.3 – 20.0 32.2 19.8 19.8 21.0 – 9.2 13.7 9.2 9.2 3.7 –
July 803 18.4 31.0 18.3 18.3 24.7 – 20.1 31.1 19.9 19.9 29.4 – 9.2 18.4 9.2 9.2 3.8 –
August 604 17.9 31.2 17.7 17.7 25.0 17.0 20.0 31.3 19.8 19.8 25.0 17.0 9.2 13.0 9.2 9.2 – –
September 499 20.1 30.6 19.9 19.9 23.5 – 20.1 30.6 19.9 19.9 23.5 – 18.2 18.2 – – – –
October 190 20.2 30.8 19.7 19.6 27.4 – 20.2 30.9 19.7 19.6 27.4 – 17.3 17.3 – – – –
November 348 20.1 30.3 19.8 19.8 30.1 – 20.1 30.3 19.8 19.8 30.1 – 18.6 19.0 18.6 18.6 – –
December 205 20.1 30.4 19.6 19.6 20.5 – 20.1 30.4 19.6 19.6 20.5 – 8.1 8.1 – – – –
2014
January 209 15.7 30.5 15.0 20.0 8.2 – 15.7 30.7 15.0 20.0 8.2 – 14.0 14.0 – – – –
February 211 20.6 31.8 20.1 20.1 20.2 – 20.6 31.9 20.1 20.1 20.2 – 17.0 17.0 – – – –
1 To January 2007 data include loans with original original maturity over 1 year.
in national currency
total
including by original
overdraft
in foreign currency
including by original including by original
excluding
overdraft
excluding
overdraft
total excluding
overdraft
including
2 Since January 2010 include interest rates and volumes under primary agreements concluded during the reporting period as well as, аdditional agreements, a change whereof occurred either in the amount or the interest
rate, or the amount and the interest rate.
overdraft
including, interest rates, %
including
interest
rates, %
business
volume,
hryvnias
mln
Total
Period
overdraft
including
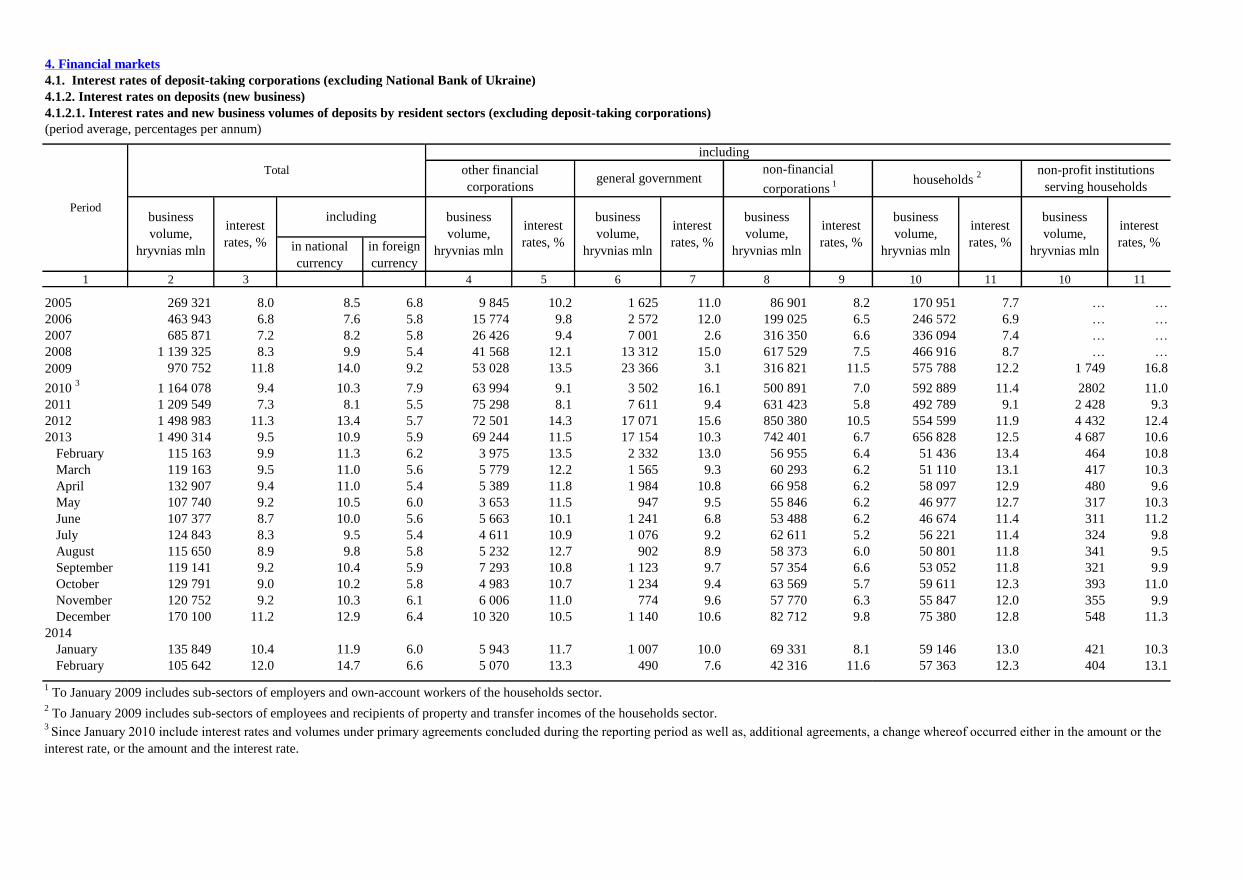
4. Financial markets
4.1. Interest rates of deposit-taking corporations (excluding National Bank of Ukraine)
4.1.2. Interest rates on deposits (new business)
(period average, percentages per annum)
in national
currency
in foreign
currency
1 2 3 4 5 6 7 8 9 10 11 10 11
2005 269 321 8.0 8.5 6.8 9 845 10.2 1 625 11.0 86 901 8.2 170 951 7.7 … …
2006 463 943 6.8 7.6 5.8 15 774 9.8 2 572 12.0 199 025 6.5 246 572 6.9 … …
2007 685 871 7.2 8.2 5.8 26 426 9.4 7 001 2.6 316 350 6.6 336 094 7.4 … …
2008 1 139 325 8.3 9.9 5.4 41 568 12.1 13 312 15.0 617 529 7.5 466 916 8.7 … …
2009 970 752 11.8 14.0 9.2 53 028 13.5 23 366 3.1 316 821 11.5 575 788 12.2 1 749 16.8
2010 3
1 164 078 9.4 10.3 7.9 63 994 9.1 3 502 16.1 500 891 7.0 592 889 11.4 2802 11.0
2011 1 209 549 7.3 8.1 5.5 75 298 8.1 7 611 9.4 631 423 5.8 492 789 9.1 2 428 9.3
2012 1 498 983 11.3 13.4 5.7 72 501 14.3 17 071 15.6 850 380 10.5 554 599 11.9 4 432 12.4
2013 1 490 314 9.5 10.9 5.9 69 244 11.5 17 154 10.3 742 401 6.7 656 828 12.5 4 687 10.6
February 115 163 9.9 11.3 6.2 3 975 13.5 2 332 13.0 56 955 6.4 51 436 13.4 464 10.8
March 119 163 9.5 11.0 5.6 5 779 12.2 1 565 9.3 60 293 6.2 51 110 13.1 417 10.3
April 132 907 9.4 11.0 5.4 5 389 11.8 1 984 10.8 66 958 6.2 58 097 12.9 480 9.6
May 107 740 9.2 10.5 6.0 3 653 11.5 947 9.5 55 846 6.2 46 977 12.7 317 10.3
June 107 377 8.7 10.0 5.6 5 663 10.1 1 241 6.8 53 488 6.2 46 674 11.4 311 11.2
July 124 843 8.3 9.5 5.4 4 611 10.9 1 076 9.2 62 611 5.2 56 221 11.4 324 9.8
August 115 650 8.9 9.8 5.8 5 232 12.7 902 8.9 58 373 6.0 50 801 11.8 341 9.5
September 119 141 9.2 10.4 5.9 7 293 10.8 1 123 9.7 57 354 6.6 53 052 11.8 321 9.9
October 129 791 9.0 10.2 5.8 4 983 10.7 1 234 9.4 63 569 5.7 59 611 12.3 393 11.0
November 120 752 9.2 10.3 6.1 6 006 11.0 774 9.6 57 770 6.3 55 847 12.0 355 9.9
December 170 100 11.2 12.9 6.4 10 320 10.5 1 140 10.6 82 712 9.8 75 380 12.8 548 11.3
2014
January 135 849 10.4 11.9 6.0 5 943 11.7 1 007 10.0 69 331 8.1 59 146 13.0 421 10.3
February 105 642 12.0 14.7 6.6 5 070 13.3 490 7.6 42 316 11.6 57 363 12.3 404 13.1
1 To January 2009 includes sub-sectors of employers and own-account workers of the households sector.
2 To January 2009 includes sub-sectors of employees and recipients of property and transfer incomes of the households sector.
business
volume,
hryvnias mln
Total
business
volume,
hryvnias mln
interest
rates, %
business
volume,
hryvnias mln
interest
rates, %
includinginterest
rates, %
non-profit institutions
serving households
business
volume,
hryvnias mln
interest
rates, %
interest
rates, %
business
volume,
hryvnias mln
business
volume,
hryvnias mln
3 Since January 2010 include interest rates and volumes under primary agreements concluded during the reporting period as well as, аdditional agreements, a change whereof occurred either in the amount or the
interest rate, or the amount and the interest rate.
4.1.2.1. Interest rates and new business volumes of deposits by resident sectors (excluding deposit-taking corporations)
including
general governmentnon-financial
corporations 1 households
2other financial
corporations
Period
interest
rates, %

4. Financial markets
4.1. Interest rates of deposit-taking corporations (excluding National Bank of Ukraine)
4.1.2. Interest rates on deposits (new business)
(period average, percentages per annum)
business volume,
hryvnias mln
interest rates,
%
business volume,
hryvnias mln
interest rates,
%
business volume,
hryvnias mln
interest rates,
%
business volume,
hryvnias mln
interest rates,
%
business volume,
hryvnias mln
interest rates,
%
1 2 3 4 5 6 7 8 9 10 11
2005 9 845 10.2 … … 4 811 10.4 5 034 10.1 … …
2006 15 774 9.8 … … 7 518 8.4 8 256 11.1 … …
2007 26 426 9.4 … … 11 963 7.9 14 462 10.7 … …
2008 41 568 12.1 … … 21 320 12.3 13 958 12.2 6 290 11.4
2009 53 028 13.5 … … 47 208 13.2 3 802 15.7 2 018 16.5
2010 2
63 994 9.1 13586 8.1 42 901 8.4 6 170 14.7 1 337 15.6
2011 75 298 8.1 10154 6.4 55 127 7.7 7 981 12.2 2 036 12.4
2012 72 501 14.3 8765 8.2 54 671 15.6 7 216 12.4 1 849 13.0
2013 69 244 11.5 9093 8.3 45 623 12.5 10 613 11.4 3 915 7.4
February 3 975 13.5 624 8.7 2 923 14.4 394 15.6 35 7.2
March 5 779 12.2 859 8.5 3 598 12.9 1 096 11.9 227 15.6
April 5 389 11.8 814 8.6 3 516 12.2 836 14.4 223 6.3
May 3 653 11.5 673 7.4 2 662 12.1 288 14.9 30 20.7
June 5 663 10.1 823 7.5 3 877 11.1 571 11.8 391 3.8
July 4 611 10.9 958 7.9 3 039 11.5 332 12.9 282 11.6
August 5 232 12.7 567 9.4 3 816 12.6 600 13.6 249 20.1
September 7 293 10.8 667 8.1 5 225 11.0 894 12.0 507 10.6
October 4 983 10.7 1006 7.1 3 121 11.7 601 12.3 255 8.5
November 6 006 11.0 710 9.1 3 547 12.9 908 12.1 841 3.7
December 10 320 10.5 842 9.0 5 565 13.6 3 219 7.2 693 3.4
2014
January 5 943 11.7 920 9.2 3 876 12.2 1 045 12.3 103 8.5
February 5 070 13.3 382 9.4 3 603 15.0 494 14.8 591 4.5
1 To January 2007 data include deposits with agreed maturity over 1 year.
2 Since January 2010 include interest rates and volumes under primary agreements concluded during the reporting period as well as, аdditional agreements, a change whereof occurred either in the
amount or the interest rate, or the amount and the interest rate.
4.1.2.2. Interest rates and new business volumes of deposits by other financial corporations, breakdown by maturity
over 1 year and up to 2 years 1 over 2 years
Totalup to 1 year
Period
including by maturity
demand

4. Financial markets
4.1. Interest rates of deposit-taking corporations (excluding National Bank of Ukraine)
4.1.2. Interest rates on deposits (new business)
(period average, percentages per annum)
demand up to 1 year
over 1 year
and up to 2
years1
over 2 years demand up to 1 year
over 1 year
and up to 2
years1
over 2 years demand up to 1 year
over 1 year
and up to 2
years1
over 2 years
1 2 3 4 5 6 7 8 9 10 11 12 13 14 15 16
2005 10.2 … 10.4 10.1 … 10.5 … 10.9 10.2 … 5.5 … 5.4 5.6 …
2006 9.8 … 8.4 11.1 … 10.0 … 8.6 11.2 … 8.0 … 7.1 9.6 …
2007 9.4 … 7.9 10.7 … 9.8 … 8.4 10.8 … 6.6 … 5.2 9.0 …
2008 12.1 … 12.3 12.2 11.4 12.6 … 13.2 12.4 11.5 9.7 … 8.9 11.0 10.6
2009 13.5 … 13.2 15.7 16.5 16.6 … 16.5 17.4 16.8 8.1 … 8.1 8.5 9.4
2010 2
9.1 8.1 8.4 14.7 15.6 10.2 9.3 9.4 16.1 15.8 5.1 3.1 5.2 8.7 5.3
2011 8.1 6.4 7.7 12.2 12.4 8.6 6.7 8.2 13.0 15.0 4.3 1.5 3.8 7.0 7.4
2012 14.3 8.2 15.6 12.4 13.0 15.9 9.2 17.3 13.0 15.4 3.5 1.3 2.9 7.8 7.5
2013 11.5 8.3 12.5 11.4 7.4 12.3 9.2 13.3 12.0 7.5 4.3 2.0 4.2 6.4 6.6
February 13.5 8.7 14.4 15.6 7.2 14.2 9.1 14.8 18.3 12.4 4.6 0.2 3.9 6.1 6.7
March 12.2 8.5 12.9 11.9 15.6 13.1 8.9 13.6 14.2 16.5 2.8 3.5 2.6 2.3 7.6
April 11.8 8.6 12.2 14.4 6.3 12.5 9.2 12.9 15.8 6.3 4.2 1.6 3.4 7.0 6.5
May 11.5 7.4 12.1 14.9 20.7 12.4 8.6 12.7 18.6 23.9 3.8 0.3 4.5 6.0 6.3
June 10.1 7.5 11.1 11.8 3.8 10.6 8.4 11.6 12.2 3.6 6.8 1.8 8.0 6.4 6.8
July 10.9 7.9 11.5 12.9 11.6 12.0 9.7 12.4 15.2 11.7 3.3 2.7 2.2 7.3 6.7
August 12.7 9.4 12.6 13.6 20.1 13.5 9.9 13.4 14.7 20.6 4.2 1.6 3.3 7.6 6.8
September 10.8 8.1 11.0 12.0 10.6 11.7 8.3 12.2 12.6 10.6 3.0 1.3 2.5 6.7 6.8
October 10.7 7.1 11.7 12.3 8.5 11.7 9.1 12.3 12.8 8.6 3.8 2.5 4.5 7.2 6.8
November 11.0 9.1 12.9 12.1 3.7 11.7 9.6 13.8 12.3 2.9 5.2 1.1 4.7 7.8 6.4
December 10.5 9.0 13.6 7.2 3.4 11.0 9.5 14.5 7.1 3.3 5.2 1.8 4.1 8.3 5.1
2014
January 11.7 9.2 12.2 12.3 8.5 12.3 10.2 12.8 12.4 9.6 4.1 2.4 4.1 8.4 3.2
February 13.3 9.4 15.0 14.8 4.5 14.4 10.6 16.3 17.1 4.5 5.4 1.9 4.9 8.3 5.6
1 To January 2007 data include deposits with agreed maturity over 1 year.
total total
including by maturity
including by maturity including by maturity
2 Since January 2010 include interest rates and volumes under primary agreements concluded during the reporting period as well as, аdditional agreements, a change whereof occurred either in the amount or the
interest rate, or the amount and the interest rate.
4.1.2.3. Interest rates on deposits from other financial corporations, breakdown by type of currencies and maturity
Period Total
including
in national currency in foreign currency

4. Financial markets
4.1. Interest rates of deposit-taking corporations (excluding National Bank of Ukraine)
4.1.2. Interest rates on deposits (new business)
(period average, percentages per annum)
US dollar EuroRussian
rubleother US dollar Euro
Russian
rubleother US dollar Euro
Russian
rubleother US dollar Euro
Russian
rubleother
1 2 3 4 5 6 7 8 9 10 11 12 13 14 15 16 17 18
2005 5.5 … … … … 6.1 3.5 – 2.6 5.1 9.5 – 6.1 … … … …
2006 8.0 … … … … 7.8 3.4 – 4.2 10.0 8.6 – 3.4 … … … …
2007 6.6 … … … … 5.3 4.5 – 2.7 9.4 7.1 3.5 4.8 … … … …
2008 9.7 … … … … 9.2 6.7 – 2.3 11.3 8.5 3.5 4.8 10.9 8.5 3.5 4.4
2009 8.1 … … … … 8.3 6.9 7.0 3.2 8.6 8.4 – 3.9 9.9 10.7 – 3.8
2010 2
5.1 3.3 2.1 4.4 1.0 5.2 5.6 4.8 3.1 8.8 7.0 5.0 4.8 8.4 7.3 – 3.5
2011 4.3 1.9 0.8 3.0 1.6 3.8 3.6 – 2.7 7.1 6.2 – 1.9 7.9 4.4 – 1.7
2012 3.5 1.3 1.4 2.5 1.3 2.8 3.6 6.7 2.5 8.1 8.5 – 1.7 7.7 4.8 – 3.0
2013 4.3 2.2 0.6 2.5 0.9 4.2 3.9 5.0 2.7 6.5 5.7 – 3.2 6.6 5.9 – 5.0
February 4.6 0.3 0.0 – 1.0 3.7 5.5 5.0 3.1 6.1 8.2 – 5.0 6.7 7.3 – 5.0
March 2.8 3.9 0.0 – 1.0 2.5 2.9 – 1.6 1.5 4.8 – 3.0 7.6 7.3 – 5.0
April 4.2 1.8 0.3 2.5 0.6 3.3 4.8 – 1.9 7.0 6.6 – 5.0 6.5 7.3 – 5.0
May 3.8 0.2 1.1 – 0.9 4.5 4.6 – 3.0 6.1 4.9 – 5.0 6.8 4.7 – 5.0
June 6.8 1.9 0.0 – 1.0 8.3 3.0 – 5.0 6.4 6.7 – 5.0 6.8 – – –
July 3.3 2.8 0.1 – 1.0 2.0 3.5 – 2.3 7.3 7.0 – 5.0 6.7 – – –
August 4.2 2.0 0.0 – 1.0 3.2 4.5 – 3.0 7.6 7.0 – 5.0 6.8 – – –
September 3.0 1.9 0.1 – 1.0 2.5 2.7 – 2.3 6.8 3.3 – 3.2 6.8 – – –
October 3.8 2.5 0.1 – 1.0 4.4 4.8 – 1.0 7.3 4.9 – 2.2 6.8 – – –
November 5.2 1.0 1.1 – 1.0 4.8 4.5 – 3.6 7.6 9.0 – 5.0 6.4 – – –
December 5.2 1.8 1.6 – 1.0 4.1 3.6 – 3.1 8.4 7.2 – – 5.1 – – –
2014
January 4.1 2.5 0.2 – 1.0 4.1 4.2 – 5.0 8.5 6.8 – 2.8 3.2 – – –
February 5.4 2.1 0.0 – – 4.9 5.7 – 2.2 8.3 7.6 – – 5.6 – – –
1 To January 2007 data include deposits with agreed maturity over 1 year.
2 Since January 2010 include interest rates and volumes under primary agreements concluded during the reporting period as well as, аdditional agreements, a change whereof occurred either in the
amount or the interest rate, or the amount and the interest rate.
4.1.2.4. Interest rates on deposits from other financial corporations, in foreign currency, breakdown by maturity and currencies
Period Totalover 1 year and up to 2 years
1 over 2 yearsup to 1 year
including by maturity
demand

4. Financial markets
4.1. Interest rates of deposit-taking corporations (excluding National Bank of Ukraine)
4.1.2. Interest rates on deposits (new business)
(period average, percentages per annum)
business volume,
hryvnias mln
interest rates,
%
business volume,
hryvnias mln
interest rates,
%
business volume,
hryvnias mln
interest rates,
%
business volume,
hryvnias mln
interest rates,
%
business volume,
hryvnias mln
interest rates,
%
1 2 3 4 5 6 7 8 9 10 11
2005 1 625 11.0 … … 1 433 10.8 192 11.9 … …
2006 2 572 12.0 … … 1 612 11.8 960 12.4 … …
2007 7 001 11.5 … … 5 721 11.1 1 280 13.2 … …
2008 13 312 15.0 … … 10 145 15.2 2 130 14.0 1 037 15.2
2009 23 366 3.1 … … 23 304 3.1 18 14.9 43 14.2
2010 2
3 502 16.1 1 836 17.4 1 633 14.8 14 11.4 18 10.3
2011 7 611 9.4 4 025 9.9 3 560 8.8 23 8.2 4 14.9
2012 17 071 15.6 2 274 14.2 14 775 15.8 22 15.1 0 6.4
2013 17 154 10.3 13 233 9.2 3 599 14.4 321 7.8 0 8.0
February 2 332 13.0 1 641 11.7 687 16.0 3 16.8 0 8.0
March 1 565 9.3 1 207 8.8 351 10.9 6 17.3 – –
April 1 984 10.8 1 487 9.5 486 14.7 11 17.7 – –
May 947 9.5 746 8.8 195 12.2 7 16.0 – –
June 1 241 6.8 1 131 6.2 103 13.5 8 14.9 – –
July 1 076 9.2 887 8.6 179 12.2 10 16.2 – –
August 902 8.9 807 8.5 88 11.8 7 15.6 – –
September 1 123 9.7 928 8.7 188 14.7 6 14.7 – –
October 1 234 9.4 1 030 8.7 194 13.0 9 16.3 – –
November 774 9.6 675 8.9 93 14.3 6 15.5 – –
December 1 140 10.6 870 8.8 265 16.5 6 14.2 – –
2014
January 1 007 10.0 755 9.3 241 12.2 11 7.7 – –
February 490 7.6 377 6.5 109 10.9 3 15.4 – –
1 To January 2007 data include deposits with agreed maturity over 1 year.
2 Since January 2010 include interest rates and volumes under primary agreements concluded during the reporting period as well as, аdditional agreements, a change whereof occurred either
in the amount or the interest rate, or the amount and the interest rate.
4.1.2.5. Interest rates and new business volumes of deposits from general government, breakdown by maturity
over 1 year and up to 2 years 1 over 2 years
Totalup to 1 year
Period
including by maturity
demand

4. Financial markets
4.1. Interest rates of deposit-taking corporations (excluding National Bank of Ukraine)
4.1.2. Interest rates on deposits (new business)
(period average, percentages per annum)
business
volume,
hryvnias
interest
rates, %
business
volume,
hryvnias
interest
rates, %
business
volume,
hryvnias
interest
rates, %
business
volume,
hryvnias
interest
rates, %
business
volume,
hryvnias
interest
rates, %
business
volume,
hryvnias
interest
rates, %
business
volume,
hryvnias
interest
rates, %
business
volume,
hryvnias
interest
rates, %
business
volume,
hryvnias
interest
rates, %
1 2 3 4 5 6 7 8 9 10 11 12 13 14 15 16 17 18 19
2005 86 901 8.2 … … 44 956 7.9 16 654 5.1 9 587 8.5 5 032 10.8 13 683 9.8 41 944 8.6 … …
2006 199 025 6.5 … … 137 228 5.7 93 477 4.4 21 359 8.0 5 944 9.2 16 447 9.0 61 797 8.1 … …
2007 316 350 6.6 … … 194 866 5.5 134 768 4.3 24 531 6.9 9 082 9.3 26 486 9.0 121 484 8.4 … …
2008 617 529 7.5 … … 373 495 6.5 281 878 4.8 31 904 14.1 18 356 11.7 41 357 9.8 95 068 10.7 148 967 8.1
2009 316 821 11.5 … … 252 743 11.3 177 271 10.0 39 557 15.2 11 355 14.4 24 560 13.3 47 325 12.2 16 753 12.1
2010 3
500 891 7.0 192446 8.5 260 587 5.1 178 172 2.5 40 086 8.8 15 039 11.4 27 291 12.4 38 417 10.9 9 441 13.2
2011 631 423 5.8 180 981 5.1 392 971 5.8 294 404 4.7 48 755 9.4 18 535 9.2 31 277 9.4 47 247 7.4 10 222 9.0
2012 850 380 10.5 248 264 7.7 558 526 11.8 438 987 11.5 68 083 14.0 18 566 12.1 32 890 11.9 37 789 8.6 5 800 14.6
2013 742 401 6.7 200 616 7.2 494 147 6.1 348 765 3.4 91 116 12.5 26 715 12.7 27 551 12.4 36 188 10.6 11 449 8.3
February 56 955 6.4 14 641 7.5 39 583 5.6 26 687 2.2 8 097 12.3 1 968 13.6 2 831 12.8 2 250 11.9 482 13.3
March 60 293 6.2 16 052 8.0 39 895 5.1 26 942 2.1 6 781 11.6 2 673 11.1 3 499 11.2 3 665 7.5 682 17.7
April 66 958 6.2 20 342 6.7 42 354 5.5 29 375 2.6 9 060 11.4 2 069 13.7 1 850 11.8 3 509 11.2 753 8.8
May 55 846 6.2 15 111 7.6 37 289 5.2 27 974 2.9 6 106 11.7 1 450 12.7 1 760 12.3 3 133 11.1 313 12.0
June 53 488 6.2 14 734 7.5 34 970 5.2 24 526 2.4 6 429 11.7 2 340 12.9 1 675 11.4 2 985 10.5 799 8.9
July 62 611 5.2 18 344 6.8 40 513 4.6 29 097 2.0 7 647 11.1 1 875 10.1 1 894 11.6 3 141 4.9 614 4.6
August 58 373 6.0 18 639 7.3 36 910 5.1 25 489 2.0 7 204 11.5 1 835 14.0 2 382 12.0 2 213 9.7 611 9.4
September 57 354 6.6 16 632 6.8 35 403 5.7 23 233 2.2 6 318 11.9 2 877 12.6 2 975 12.4 4 539 12.5 780 10.8
October 63 569 5.7 18 034 6.8 40 214 5.1 28 444 2.4 6 838 11.9 2 478 12.2 2 453 10.6 2 333 10.4 2 988 3.9
November 57 770 6.3 15 552 6.8 39 181 5.9 28 626 3.3 6 350 12.8 2 540 12.5 1 664 13.5 1 936 10.0 1 102 8.0
December 82 712 9.8 16 295 7.3 61 269 10.2 43 657 8.6 11 967 14.4 2 822 13.7 2 824 14.1 4 543 13.2 605 13.2
2014
January 69 331 8.1 15 642 6.8 49 132 8.1 32 249 5.0 10 925 13.4 2 117 12.5 3 841 16.9 3 876 12.4 682 14.6
February 42 316 11.6 8 587 5.9 29 291 12.8 19 798 11.8 6 751 15.3 1 434 14.6 1 307 11.9 3 838 16.8 600 4.0
1 To January 2009 includes sub-sectors of employers and own-account workers of the households sector.
2 To January 2007 data include deposits with agreed maturity over 1 year.
Totalup to 1 year
includingover 1 year and up to
2 years 2
including by maturity
demand over 2 yearsup to 1 month
3 Since January 2010 include interest rates and volumes under primary agreements concluded during the reporting period as well as, аdditional agreements, a change whereof occurred either in the amount or the interest
rate, or the amount and the interest rate.
4.1.2.6. Interest rates and new business volumes of deposits from non-financial corporations 1, breakdown by maturity
over 1 month and up to
3 months
over 3 months and up
to 6 months
over 6 months and up
to 1 yearPeriod
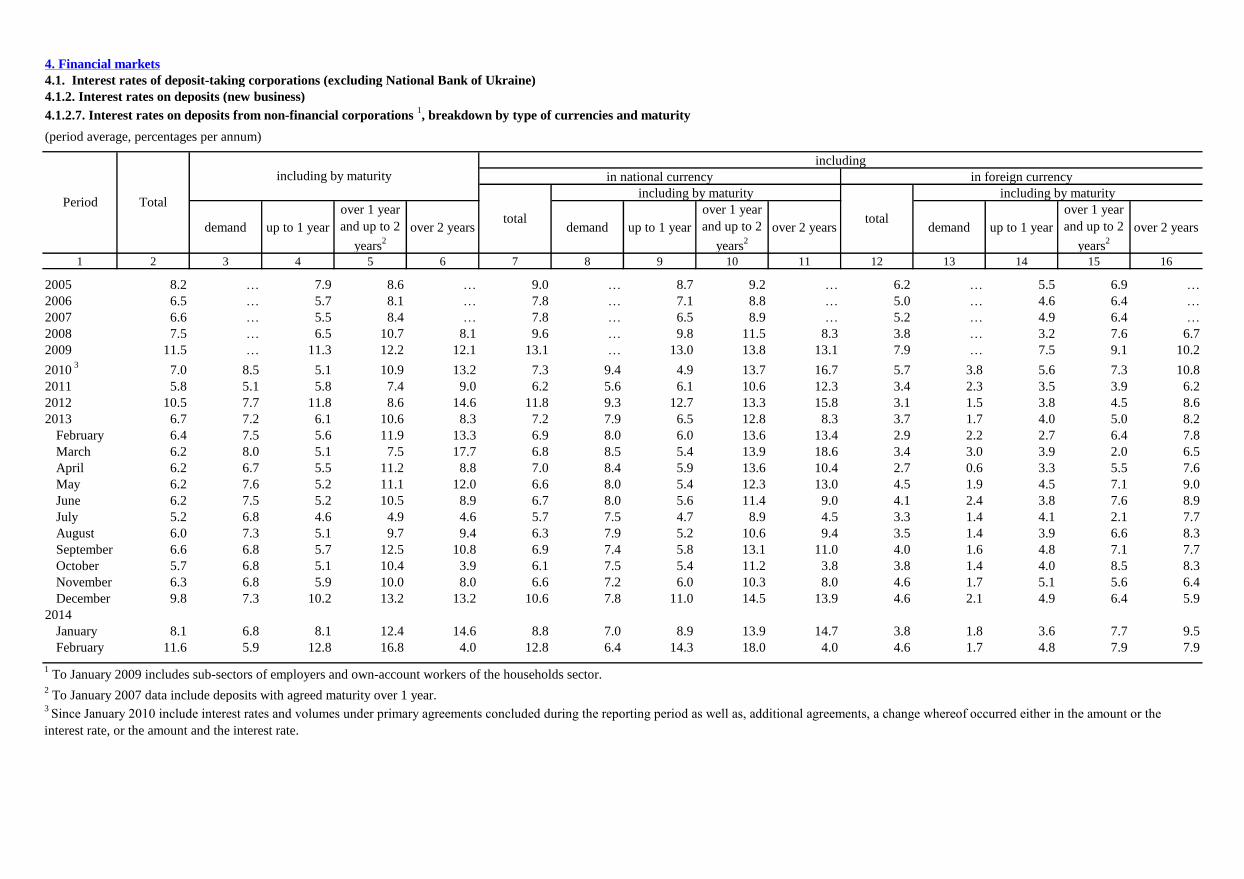
4. Financial markets
4.1. Interest rates of deposit-taking corporations (excluding National Bank of Ukraine)
4.1.2. Interest rates on deposits (new business)
(period average, percentages per annum)
demand up to 1 year
over 1 year
and up to 2
years2
over 2 years demand up to 1 year
over 1 year
and up to 2
years2
over 2 years demand up to 1 year
over 1 year
and up to 2
years2
over 2 years
1 2 3 4 5 6 7 8 9 10 11 12 13 14 15 16
2005 8.2 … 7.9 8.6 … 9.0 … 8.7 9.2 … 6.2 … 5.5 6.9 …
2006 6.5 … 5.7 8.1 … 7.8 … 7.1 8.8 … 5.0 … 4.6 6.4 …
2007 6.6 … 5.5 8.4 … 7.8 … 6.5 8.9 … 5.2 … 4.9 6.4 …
2008 7.5 … 6.5 10.7 8.1 9.6 … 9.8 11.5 8.3 3.8 … 3.2 7.6 6.7
2009 11.5 … 11.3 12.2 12.1 13.1 … 13.0 13.8 13.1 7.9 … 7.5 9.1 10.2
2010 3
7.0 8.5 5.1 10.9 13.2 7.3 9.4 4.9 13.7 16.7 5.7 3.8 5.6 7.3 10.8
2011 5.8 5.1 5.8 7.4 9.0 6.2 5.6 6.1 10.6 12.3 3.4 2.3 3.5 3.9 6.2
2012 10.5 7.7 11.8 8.6 14.6 11.8 9.3 12.7 13.3 15.8 3.1 1.5 3.8 4.5 8.6
2013 6.7 7.2 6.1 10.6 8.3 7.2 7.9 6.5 12.8 8.3 3.7 1.7 4.0 5.0 8.2
February 6.4 7.5 5.6 11.9 13.3 6.9 8.0 6.0 13.6 13.4 2.9 2.2 2.7 6.4 7.8
March 6.2 8.0 5.1 7.5 17.7 6.8 8.5 5.4 13.9 18.6 3.4 3.0 3.9 2.0 6.5
April 6.2 6.7 5.5 11.2 8.8 7.0 8.4 5.9 13.6 10.4 2.7 0.6 3.3 5.5 7.6
May 6.2 7.6 5.2 11.1 12.0 6.6 8.0 5.4 12.3 13.0 4.5 1.9 4.5 7.1 9.0
June 6.2 7.5 5.2 10.5 8.9 6.7 8.0 5.6 11.4 9.0 4.1 2.4 3.8 7.6 8.9
July 5.2 6.8 4.6 4.9 4.6 5.7 7.5 4.7 8.9 4.5 3.3 1.4 4.1 2.1 7.7
August 6.0 7.3 5.1 9.7 9.4 6.3 7.9 5.2 10.6 9.4 3.5 1.4 3.9 6.6 8.3
September 6.6 6.8 5.7 12.5 10.8 6.9 7.4 5.8 13.1 11.0 4.0 1.6 4.8 7.1 7.7
October 5.7 6.8 5.1 10.4 3.9 6.1 7.5 5.4 11.2 3.8 3.8 1.4 4.0 8.5 8.3
November 6.3 6.8 5.9 10.0 8.0 6.6 7.2 6.0 10.3 8.0 4.6 1.7 5.1 5.6 6.4
December 9.8 7.3 10.2 13.2 13.2 10.6 7.8 11.0 14.5 13.9 4.6 2.1 4.9 6.4 5.9
2014
January 8.1 6.8 8.1 12.4 14.6 8.8 7.0 8.9 13.9 14.7 3.8 1.8 3.6 7.7 9.5
February 11.6 5.9 12.8 16.8 4.0 12.8 6.4 14.3 18.0 4.0 4.6 1.7 4.8 7.9 7.9
1 To January 2009 includes sub-sectors of employers and own-account workers of the households sector.
2 To January 2007 data include deposits with agreed maturity over 1 year.
total total
including by maturity
including by maturity including by maturity
3 Since January 2010 include interest rates and volumes under primary agreements concluded during the reporting period as well as, аdditional agreements, a change whereof occurred either in the amount or the
interest rate, or the amount and the interest rate.
4.1.2.7. Interest rates on deposits from non-financial corporations 1, breakdown by type of currencies and maturity
Period Total
including
in national currency in foreign currency

4. Financial markets
4.1. Interest rates of deposit-taking corporations (excluding National Bank of Ukraine)
4.1.2. Interest rates on deposits (new business)
(period average, percentages per annum)
US dollar EuroRussian
rubleother US dollar Euro
Russian
rubleother US dollar Euro
Russian
rubleother US dollar Euro
Russian
rubleother US dollar Euro
Russian
rubleother
1 2 3 4 5 6 7 8 9 10 11 12 13 14 15 16 17 18 19 20 21
2005 5.9 5.5 11.0 1.3 … … … … 5.5 4.4 9.6 2.0 6.4 6.3 11.4 1.1 … … … …
2006 5.0 4.5 6.1 3.5 … … … … 4.7 4.1 2.6 3.0 6.3 5.6 8.7 4.4 … … … …
2007 5.2 5.0 4.6 5.1 … … … … 5.0 4.6 1.6 6.0 6.4 6.2 7.1 5.0 … … … …
2008 3.7 5.1 3.8 5.0 … … … … 3.0 4.7 4.0 2.8 7.7 8.1 2.5 4.9 7.3 6.2 3.9 6.7
2009 8.2 6.7 10.9 1.7 … … … … 7.8 6.2 11.0 1.9 9.0 9.0 12.3 5.8 10.3 9.6 8.0 5.5
2010 3
5.9 4.8 5.5 3.7 3.8 4.0 1.7 0.8 6.2 4.3 7.1 3.1 7.4 7.0 9.5 6.0 11.0 8.1 7.2 –
2011 3.5 2.6 4.9 5.1 2.2 1.9 3.4 – 3.8 2.3 6.6 5.1 3.8 4.8 4.3 – 6.2 7.7 5.5 –
2012 2.9 3.4 5.3 1.4 1.2 3.3 3.9 – 3.8 3.1 6.0 4.5 4.5 4.9 10.5 1.1 9.1 7.0 0.5 0.1
2013 3.4 4.3 5.1 1.7 1.4 3.7 3.3 – 3.7 4.0 5.1 1.7 4.7 6.4 6.2 – 8.2 7.9 – –
February 2.4 5.0 7.3 – 2.0 4.6 4.2 – 2.3 4.0 7.4 – 5.3 7.6 10.1 – 7.0 10.9 – –
March 3.0 4.3 5.1 0.5 2.7 4.6 4.1 – 3.5 4.0 5.1 0.5 1.9 6.7 5.2 – 7.1 3.9 – –
April 2.4 4.4 5.2 3.0 0.4 4.7 3.4 – 3.0 3.5 5.2 3.0 5.4 6.5 4.2 – 7.4 12.7 – –
May 4.6 3.3 4.5 1.4 1.5 2.9 3.6 – 4.6 3.4 4.5 1.4 7.6 4.3 3.0 – 9.0 – – –
June 3.8 4.5 4.7 – 2.3 3.4 3.7 – 3.3 3.6 4.7 – 7.7 7.5 5.0 – 8.9 7.5 – –
July 2.9 3.8 4.7 – 0.8 4.5 4.1 – 3.8 3.9 4.7 – 2.0 2.5 4.0 – 7.7 7.7 – –
August 3.4 3.4 5.8 1.3 1.1 3.5 3.9 – 3.9 3.1 5.9 1.3 6.8 5.1 1.9 – 8.3 – – –
September 3.9 3.5 5.7 2.6 1.5 2.2 2.2 – 4.8 3.7 5.8 2.6 7.0 6.9 9.9 – 7.9 5.8 – –
October 3.4 5.1 5.2 – 1.1 4.3 3.1 – 3.5 4.1 5.3 – 8.5 8.5 7.0 – 8.1 12.4 – –
November 4.4 4.7 5.6 3.0 1.4 3.3 3.0 – 4.9 5.1 5.7 3.0 5.5 5.7 5.9 – 6.4 8.0 – –
December 4.3 4.7 6.6 3.0 1.9 3.1 2.9 – 4.6 5.0 6.7 3.0 6.4 6.9 7.6 – 5.9 8.0 – –
2014
January 3.5 4.0 5.5 – 1.4 3.6 2.9 – 3.0 4.0 5.6 – 7.8 5.2 6.4 – 9.5 8.0 – –
February 4.2 5.5 6.8 – 1.0 4.6 3.7 – 4.5 5.4 6.9 – 7.8 8.2 5.0 – 8.0 5.8 – –
1 To January 2009 includes sub-sectors of employers and own-account workers of the households sector.
2 To January 2007 data include deposits with agreed maturity over 1 year.
3 Since January 2010 include interest rates and volumes under primary agreements concluded during the reporting period as well as, аdditional agreements, a change whereof occurred either in the amount or the interest
rate, or the amount and the interest rate.
4.1.2.8. Interest rates on deposits from non-financial corporations 1, in foreign currency, breakdown by maturity and currencies
Periodup to 1 year over 1 year and up to 2 years
2 over 2 yearsTotal
including by maturity
demand

4. Financial markets
4.1. Interest rates of deposit-taking corporations (excluding National Bank of Ukraine)
4.1.2. Interest rates on deposits (new business)
(period average, percentages per annum)
business
volume,
hryvnias
interest
rates, %
business
volume,
hryvnias
interest
rates, %
business
volume,
hryvnias
interest
rates, %
business
volume,
hryvnias
interest
rates, %
business
volume,
hryvnias
interest
rates, %
business
volume,
hryvnias
interest
rates, %
business
volume,
hryvnias
interest
rates, %
business
volume,
hryvnias
interest
rates, %
business
volume,
hryvnias
interest
rates, %
1 2 3 4 5 6 7 8 9 10 11 12 13 14 15 16 17 18 19
2005 170 951 7.7 76 354 2.8 53 551 10.9 3 332 7.1 15 870 10.8 14 304 11.8 20 046 11.0 41 046 12.5 … …
2006 246 572 6.9 113 183 2.3 61 256 9.7 4 874 5.8 23 460 9.3 16 356 10.4 16 566 10.6 72 133 11.6 … …
2007 336 094 7.4 140 243 2.5 80 862 10.0 6 623 6.7 27 937 9.4 21 781 10.6 24 520 10.9 114 989 11.7 … …
2008 466 916 8.7 200 088 3.1 123 514 12.8 18 326 11.6 42 986 13.3 28 304 13.3 33 897 12.3 124 429 13.1 18 885 13.3
2009 575 788 12.2 165 183 5.2 340 674 14.8 183 476 14.4 94 728 15.0 36 232 16.2 26 238 15.3 64 425 15.9 5 505 14.1
2010 3
592 889 11.4 107 084 6.1 367 694 12.1 98 827 10.8 98 052 12.0 72 237 12.7 98 578 12.9 110 365 14.3 7 746 14.1
2011 492 789 9.1 99 924 4.6 246 676 9.3 61 330 7.0 67 760 10.0 55 643 10.1 61 943 9.9 135 652 11.8 10 536 12.9
2012 554 599 11.9 82 137 5.7 318 511 13.2 65 156 11.0 115 726 14.3 78 019 13.7 59 611 12.7 146 482 12.5 7 469 12.4
2013 656 828 12.5 79 923 6.5 344 459 13.6 57 783 9.5 109 171 14.1 102 257 15.0 75 248 14.0 223 787 12.9 8 659 13.2
February 51 436 13.4 5 816 6.3 28 498 15.0 3 581 11.9 9 997 15.3 9 856 15.9 5 065 14.8 16 225 13.2 896 13.5
March 51 110 13.1 6 427 6.7 28 463 14.2 3 787 11.4 8 560 13.8 6 668 15.7 9 449 14.7 15 563 13.4 656 15.8
April 58 097 12.9 7 312 6.6 31 154 14.0 4 172 11.6 9 589 13.3 10 772 15.1 6 620 14.8 19 060 13.5 571 13.4
May 46 977 12.7 5 833 6.3 25 586 13.4 3 579 11.5 7 540 12.8 5 960 14.6 8 508 14.0 15 102 13.8 456 13.7
June 46 674 11.4 5 752 6.1 25 676 11.7 6 845 6.2 6 262 12.8 8 250 14.3 4 320 14.1 14 702 12.9 543 13.1
July 56 221 11.4 6 325 6.7 29 513 11.9 7 040 7.3 7 920 12.4 6 163 13.6 8 389 14.0 19 807 12.2 576 14.9
August 50 801 11.8 6 634 6.8 25 218 12.6 4 115 9.1 7 940 12.2 5 688 13.8 7 476 14.0 18 396 12.4 553 12.2
September 53 052 11.8 6 311 6.6 26 494 12.8 4 210 7.7 8 569 12.9 9 145 14.5 4 570 13.6 19 483 12.1 764 12.5
October 59 611 12.3 7 370 6.7 30 151 13.8 4 137 9.4 8 720 13.8 12 264 15.2 5 030 13.7 21 453 12.3 636 11.9
November 55 847 12.0 7 452 6.6 27 182 13.1 5 079 8.2 7 925 14.8 8 799 14.5 5 379 13.0 20 315 12.4 899 14.6
December 75 380 12.8 8 999 6.2 35 073 13.7 7 337 10.2 12 807 15.2 8 495 15.5 6 433 12.5 29 847 13.7 1 461 10.8
2014
January 59 146 13.0 6 880 6.2 28 864 14.1 5 212 9.3 9 663 15.3 8 731 16.2 5 258 13.0 22 199 13.8 1 204 10.6
February 57 363 12.3 7 645 5.9 27 320 13.6 7 573 11.6 8 963 15.5 6 161 15.0 4 623 11.6 20 845 13.1 1 553 9.2
1 To January 2009 includes sub-sectors of employees and recipients of property and transfer incomes of the households sector.
2 To January 2007 data include deposits with agreed maturity over 1 year.
includingover 1 year and up to
2 years 2up to 1 month
including by maturity
over 2 yearsover 1 month and up
to 3 months
over 3 months and
up to 6 months
over 6 months and
up to 1 year
3 Since January 2010 include interest rates and volumes under primary agreements concluded during the reporting period as well as, аdditional agreements, a change whereof occurred either in the amount or the
interest rate, or the amount and the interest rate.
4.1.2.9. Interest rates and new business volumes of deposits from households 1, breakdown by maturity
Period
Totaldemand up to 1 year

4. Financial markets
4.1. Interest rates of deposit-taking corporations (excluding National Bank of Ukraine)
4.1.2. Interest rates on deposits (new business)
4.1.2.10. Interest rates on deposits from households 1, breakdown by type of currencies and maturity
(period average, percentages per annum)
demand up to 1 year
over 1 year
and up to 2
years 2
over 2 years demand up to 1 year
over 1 year
and up to 2
years 2
over 2 years demand up to 1 year
over 1 year
and up to 2
years 2
over 2 years
1 2 3 4 5 6 7 8 9 10 11 12 13 14 15 16
2005 7.7 2.8 10.9 12.5 … 8.0 3.2 12.9 15.2 … 7.1 1.3 8.4 9.6 …
2006 6.9 2.3 9.7 11.6 … 7.1 2.7 12.7 14.3 … 6.5 1.1 7.9 9.0 …
2007 7.4 2.5 10.0 11.7 … 8.2 2.9 12.6 14.1 … 6.4 1.4 8.0 9.0 …
2008 8.7 3.1 12.8 13.1 13.3 9.8 3.5 16.0 15.5 15.4 7.2 2.2 9.6 10.0 9.8
2009 12.2 5.2 14.8 15.9 14.1 14.7 5.5 20.2 20.4 17.4 10.0 4.7 11.3 12.0 11.1
2010 3
11.4 6.1 12.1 14.3 14.1 14.6 6.4 16.8 18.8 18.3 8.7 5.4 9.0 9.9 10.1
2011 9.1 4.6 9.3 11.8 12.9 12.3 5.4 13.7 15.8 16.9 6.2 3.5 6.3 7.7 8.0
2012 11.9 5.7 13.2 12.5 12.4 16.7 7.3 18.6 18.6 17.6 7.1 3.5 7.2 8.2 8.1
2013 12.5 6.5 13.6 12.9 13.2 16.9 9.0 17.6 19.0 17.8 6.8 3.0 6.6 7.9 7.0
February 13.4 6.3 15.0 13.2 13.5 18.4 8.5 20.0 19.4 19.5 7.2 3.1 7.2 8.3 8.4
March 13.1 6.7 14.2 13.4 15.8 17.5 8.8 18.7 19.2 19.8 6.9 3.3 6.9 8.0 7.1
April 12.9 6.6 14.0 13.5 13.4 17.2 8.8 18.2 19.3 16.8 6.8 3.2 6.7 7.9 7.2
May 12.7 6.3 13.4 13.8 13.7 17.0 8.5 17.7 19.3 18.1 6.8 3.1 6.8 8.0 7.5
June 11.4 6.1 11.7 12.9 13.1 15.5 8.1 15.9 18.8 15.4 6.3 3.0 5.5 8.0 9.6
July 11.4 6.7 11.9 12.2 14.9 15.5 9.8 15.2 18.5 17.9 6.4 3.0 6.0 7.7 7.5
August 11.8 6.8 12.6 12.4 12.2 15.6 9.4 15.9 18.2 17.2 6.5 2.8 6.3 7.5 6.1
September 11.8 6.6 12.8 12.1 12.5 16.0 9.2 16.4 18.3 17.4 6.5 2.8 6.2 7.7 7.2
October 12.3 6.7 13.8 12.3 11.9 16.2 9.2 16.9 18.0 16.6 6.8 2.8 6.6 7.8 7.0
November 12.0 6.6 13.1 12.4 14.6 16.2 9.2 16.9 18.4 17.2 6.5 2.8 6.2 7.8 6.5
December 12.8 6.2 13.7 13.7 10.8 17.5 9.0 17.9 20.0 17.6 7.0 2.6 6.6 8.4 5.8
2014
January 13.0 6.2 14.1 13.8 10.6 17.3 9.4 17.7 19.2 18.8 6.9 2.5 6.7 8.3 4.7
February 12.3 5.9 13.6 13.1 9.2 17.2 9.2 18.0 19.0 20.0 7.0 2.7 7.1 8.6 5.6
1 To January 2009 includes sub-sectors of employees and recipients of property and transfer incomes of the households sector.
2 To January 2007 data include deposits with agreed maturity over 1 year.
total
including by maturity
3 Since January 2010 include interest rates and volumes under primary agreements concluded during the reporting period as well as, аdditional agreements, a change whereof occurred either in the amount or the
interest rate, or the amount and the interest rate.
total
including by maturityPeriod Total
including by maturity
including
in national currency in foreign currency

4. Financial markets
4.1. Interest rates of deposit-taking corporations (excluding National Bank of Ukraine)
4.1.2. Interest rates on deposits (new business)
(period average, percentages per annum)
US
dollarEuro
Russian
rubleother
US
dollarEuro
Russian
rubleother
US
dollarEuro
Russian
rubleother
US
dollarEuro
Russian
rubleother
US
dollarEuro
Russian
rubleother
1 2 3 4 5 6 7 8 9 10 11 12 13 14 15 16 17 18 19 20 21
2005 7.2 6.7 0.5 3.8 1.3 1.4 0.2 0.3 8.6 7.7 3.4 4.5 9.7 8.8 8.3 4.9 … … … …
2006 6.6 6.2 0.4 2.4 1.2 1.0 0.1 0.0 8.0 7.0 4.1 3.6 9.3 8.1 6.0 4.8 … … … …
2007 6.5 6.4 1.2 2.8 1.5 1.2 0.1 0.1 8.2 6.9 5.5 2.8 9.3 8.2 8.6 5.0 … … … …
2008 7.2 7.4 3.2 3.0 2.3 2.0 0.2 0.1 9.9 8.9 5.7 4.0 10.3 9.5 8.2 4.9 10.1 9.0 4.0 5.3
2009 10.2 9.4 8.2 2.4 5.1 3.7 1.3 0.3 11.6 10.6 9.9 4.1 12.3 11.5 11.8 4.9 11.4 10.0 8.1 4.9
2010 3
9.0 8.1 3.8 3.8 5.8 4.2 0.7 0.1 9.2 8.3 6.8 3.6 10.3 9.1 10.3 4.8 10.4 8.8 10.0 5.1
2011 6.5 5.3 4.8 2.1 3.7 2.4 1.0 0.7 6.6 5.3 5.2 2.6 8.2 6.8 6.4 1.9 8.3 6.2 9.1 4.1
2012 7.2 6.1 6.4 3.2 3.7 2.6 1.0 0.6 7.4 6.2 6.6 3.0 8.5 7.1 8.1 3.5 8.3 5.8 5.8 4.9
2013 6.9 6.0 6.9 3.1 3.1 2.2 1.0 1.2 6.7 5.9 6.6 3.2 8.1 7.0 8.5 2.9 7.0 7.1 5.5 4.0
February 7.4 6.5 6.9 3.1 3.3 2.1 1.3 1.0 7.4 6.3 6.8 2.7 8.5 7.4 8.7 3.6 8.1 9.1 4.3 3.8
March 7.0 6.0 6.9 3.1 3.5 2.6 0.8 0.8 7.0 6.0 6.7 2.8 8.2 6.9 9.3 3.4 7.3 6.4 5.4 5.9
April 6.9 6.1 7.2 2.6 3.3 2.7 0.9 1.4 6.9 5.9 6.7 2.3 8.0 7.2 9.5 3.1 7.3 6.3 5.3 4.4
May 7.0 6.0 7.0 3.2 3.2 2.3 0.9 2.5 7.0 5.9 6.8 3.0 8.2 7.1 8.9 3.8 8.0 4.9 6.0 2.8
June 6.3 6.1 7.1 2.4 3.1 2.3 0.8 0.1 5.5 6.1 6.7 2.9 8.2 7.2 9.0 2.2 10.0 6.7 5.7 5.7
July 6.6 5.8 6.9 1.6 3.1 2.6 0.8 1.4 6.1 5.6 6.4 2.3 7.9 7.0 8.5 1.2 7.8 6.6 5.3 3.5
August 6.6 5.8 6.9 3.4 2.9 2.2 0.8 1.0 6.5 5.4 6.4 2.9 7.6 6.9 8.5 3.8 6.2 5.2 6.2 6.0
September 6.6 5.8 6.8 3.7 2.9 2.0 1.5 0.2 6.3 5.5 6.6 3.0 7.8 6.9 8.5 4.0 7.4 5.6 5.3 3.6
October 6.9 5.8 6.8 4.8 2.9 2.2 1.0 1.5 6.8 5.6 6.5 5.5 8.0 6.9 8.2 3.1 7.1 6.2 5.0 4.1
November 6.7 5.5 6.6 2.9 3.1 1.6 0.9 1.0 6.3 5.5 6.5 2.8 8.0 6.8 8.0 2.9 6.6 6.1 5.9 3.5
December 7.1 6.0 6.6 3.0 2.8 1.8 0.9 1.0 6.7 5.9 6.6 3.0 8.6 7.1 8.0 3.1 5.8 6.6 5.2 2.6
2014
January 7.0 6.0 7.0 3.3 2.6 1.9 0.9 0.6 6.8 6.1 6.7 2.7 8.5 7.4 8.0 4.0 4.6 7.9 7.2 3.1
February 7.2 5.9 6.3 3.5 2.8 1.9 0.9 1.0 7.3 5.8 6.6 3.3 8.7 7.4 8.1 3.8 5.6 6.6 6.6 3.3
1 To January 2009 includes sub-sectors of employees and recipients of property and transfer incomes of the households sector.
2 To January 2007 data include deposits with agreed maturity over 1 year.
3 Since January 2010 include interest rates and volumes under primary agreements concluded during the reporting period as well as, аdditional agreements, a change whereof occurred either in the amount or
the interest rate, or the amount and the interest rate.
4.1.2.11. Interest rates on deposits from households 1, in foreign currency, breakdown by maturity and currencies
Period
including by maturity
demand up to 1 year over 1 year and up to 2 years 2 over 2 years
Total

4. Financial markets
4.1. Interest rates of deposit-taking corporations (excluding National Bank of Ukraine)
4.1.2. Interest rates on deposits (new business)
(period average, percentages per annum)
business
volume,
hryvnias mln
interest rates,
%demand up to 1 year over 1 year demand up to 1 year over 1 year demand up to 1 year over 1 year
1 2 3 4 5 6 7 8 9 10 11 12 13 14
2005 8 449 8.6 0.9 10.5 8.6 10.6 1.1 12.5 9.0 6.1 0.7 7.9 8.2
2006 8 275 4.8 0.5 8.9 8.8 4.7 0.8 12.6 13.3 4.8 0.3 8.3 8.4
2007 10 341 6.8 1.2 9.6 8.8 7.1 2.3 12.0 12.2 6.7 0.8 8.8 8.6
2008 14 744 8.3 2.5 11.0 10.5 9.5 3.7 15.6 14.8 8.1 2.0 9.3 10.2
2009 10 144 10.3 6.9 11.4 13.2 11.6 9.8 19.9 17.6 10.1 5.1 10.5 13.1
2010 1
11 771 9.0 4.7 9.4 9.8 11.3 6.9 12.2 11.7 8.2 3.9 8.7 8.9
2011 14 779 9.6 3.7 8.5 10.6 11.8 5.4 11.9 12.1 7.2 3.2 6.6 8.4
2012 9 577 8.7 6.0 10.9 8.3 15.7 10.8 18.1 18.2 7.3 3.3 7.9 7.8
2013 14 784 9.2 5.4 9.9 9.8 12.4 7.4 15.7 12.6 7.1 3.2 5.2 8.2
February 770 9.8 6.0 12.9 10.1 12.4 6.7 16.1 20.1 7.0 2.5 5.3 8.0
March 1 238 8.9 6.2 13.0 9.0 10.6 7.0 16.1 11.3 7.6 2.9 6.3 8.1
April 1 069 7.3 5.3 7.3 9.3 11.8 6.6 15.5 16.9 5.8 4.6 4.4 7.5
May 785 8.6 6.7 9.7 8.6 14.2 9.1 16.4 19.0 7.3 2.7 6.8 7.8
June 1 396 10.2 5.2 10.8 10.7 12.2 6.3 16.2 19.7 10.0 3.0 6.1 10.5
July 1 151 8.0 4.1 14.5 8.1 16.3 8.9 20.8 18.4 6.8 2.7 6.7 7.8
August 3 086 11.4 4.8 13.7 11.7 12.2 7.1 17.8 12.2 6.7 2.5 6.4 7.7
September 1 021 8.4 4.5 12.2 8.4 14.6 7.2 15.5 18.1 7.1 2.2 6.1 7.5
October 874 7.7 5.2 7.6 8.5 13.7 7.4 18.0 17.7 6.3 2.4 4.7 7.8
November 712 8.1 4.9 10.0 8.3 13.7 7.9 16.6 18.2 6.6 2.9 6.6 7.5
December 1 237 8.1 5.9 7.8 10.0 14.2 9.0 14.2 19.8 5.3 3.4 4.4 7.8
2014
January 1 262 8.4 6.8 5.5 11.0 9.8 9.2 6.1 20.7 7.4 3.1 4.3 8.9
February 598 9.7 6.9 12.6 8.4 13.0 8.4 13.5 19.3 6.1 3.1 7.3 6.3
Total
total
1 Since January 2010 include interest rates and volumes under primary agreements concluded during the reporting period as well as, аdditional agreements, a change whereof occurred either in the
amount or the interest rate, or the amount and the interest rate.
including by maturity
total
including by maturity
4.1.2.12. Interest rates and new business volumes of deposits from non-residents (excluding deposit-taking corporations), breakdown by type of currencies and original maturity
Period
including by maturity
including
in national currency in foreign currency

4. Financial markets
4.2. Money market interest rates
4.2.1. Interest rates and new business volumes of loans granted to resident other deposit-taking corporations
(period average, percentages per annum)
in
national
currency
in foreign
currency
business
volume,
hryvnias
mln
interest
rates, %
business
volume,
hryvnias
mln
interest
rates, %
business
volume,
hryvnias
mln
interest
rates, %
business
volume,
hryvnias
mln
interest
rates, %
business
volume,
hryvnias
mln
interest
rates, %
business
volume,
hryvnias
mln
interest
rates, %
business
volume,
hryvnias
mln
interest
rates, %
business
volume,
hryvnias
mln
interest
rates, %
1 2 3 4 5 6 7 8 9 10 11 12 13 14 15 16 17 18 19 20 21
2005 436 087 4.5 5.0 3.4 10 12.3 327 387 4.3 60 349 4.6 35 125 5.7 10 515 5.7 2 702 10.8 … … … …
2006 729 920 4.2 3.8 4.9 347 3.8 541 913 3.8 102 810 4.7 59 173 6.1 21 381 6.4 4 296 10.1 … … … …
2007 925 005 4.0 2.5 5.6 71 8.5 610 530 3.5 150 533 4.3 104 066 5.3 40 681 5.5 19 125 6.5 … … … …
2008 1 720 483 10.3 13.2 5.6 99 5.7 1 278 139 10.2 227 851 10.6 154 568 10.6 44 917 10.6 10 028 8.9 3 692 9.8 1 189 9.5
2009 787 316 12.2 17.8 3.4 32 21.9 508 544 12.3 136 957 11.6 114 798 12.1 23 541 13.7 1 441 14.5 1 565 17 437 16
2010 2
703 454 2.6 3.5 1.4 5 35.5 391 927 1.7 167 599 2.6 123 168 4.6 18 801 5.8 812 6.3 769 11.4 373 11.5
2011 1 313 270 5.1 8.0 1.3 62 9.0 777 407 4.7 303 265 4.9 192 106 6.6 34 552 8.1 633 7.2 845 13.9 4 399 10.2
2012 1 539 483 8.5 13.1 2.0 29 12.4 1 033 795 8.6 269 915 7.7 187 980 8.9 44 060 8.4 758 7.2 1 449 15.0 1 498 7.1
2013 1 084 520 4.1 4.9 2.5 39 12.5 890 334 3.8 106 665 4.0 58 740 6.2 22 119 7.9 440 6.0 5 742 10.1 441 7.6
February 64 699 2.7 2.5 2.9 2 17.9 51 985 2.3 7 463 3.0 4 931 5.4 225 5.3 – – 18 9.1 75 7.0
March 67 660 2.7 2.7 2.5 0 36.5 52 884 2.3 7 749 2.5 4 653 5.0 1 506 6.9 – – 867 10.3 1 16.0
April 87 547 3.0 3.1 2.6 1 19.4 71 659 2.6 8 243 3.2 4 568 5.4 2 015 6.1 – – 924 8.4 137 7.5
May 74 000 3.3 4.1 2.2 5 14.6 60 305 2.8 7 791 4.3 4 186 5.6 1 284 8.3 3 3.0 397 12.3 29 14.6
June 87 221 2.5 2.5 2.4 1 23.6 73 875 2.2 8 175 2.9 3 686 5.1 1 296 5.9 70 15.6 118 8.5 – –
July 101 983 2.8 2.9 2.4 0 36.5 84 254 2.5 10 216 2.6 5 600 5.1 1 307 6.9 245 1.3 353 8.1 9 10.0
August 101 404 3.4 4.0 2.2 0 36.5 84 866 3.2 10 794 4.0 4 729 5.6 1 004 7.2 – – 12 3.0 – –
September 93 440 3.1 3.7 2.2 0 24.1 78 931 2.7 7 877 3.7 4 084 5.5 1 254 10.7 49 12.1 1 245 7.3 – –
October 107 450 4.3 4.9 3.0 3 13.1 93 712 4.1 6 631 4.0 5 993 5.5 778 8.1 5 18.5 237 18.8 90 7.6
November 115 360 5.1 6.3 2.4 6 3.5 97 834 5.0 11 639 4.8 4 581 7.0 965 8.1 29 1.7 305 15.1 – –
December 123 539 8.8 11.7 2.8 15 11.7 102 294 8.9 12 907 7.3 6 104 9.6 1 341 9.0 40 12.0 758 10.0 80 7.5
2014
January 114 260 5.2 7.3 2.6 1 11.5 87 055 5.4 14 652 4.1 11 367 4.6 980 5.4 8 3.0 125 7.2 72 11.0
February 105 254 12.1 16.5 3.5 26 11.8 89 474 12.0 8 732 14.1 6 050 10.5 814 8.9 – – 157 8.6 – –
1 To January 2007 data include loans with original original maturity over 3 months.
Period
includingTotal
2 Since January 2010 include interest rates and volumes under primary agreements concluded during the reporting period as well as, аdditional agreements, a change whereof occurred either in the amount or the interest
rate, or the amount and the interest rate.
over 1 month and
up to 3 months
over 3 months and
up to 6 months 1 over 1 year
over 2 days and up
to 7 days
over 6 months and
up to 1 yearincluding
over 7 days and up
to 1 month
interest
rates, %
business
volume,
hryvnias
mln
overdraft overnight

4. Financial markets
4.2. Money market interest rates
4.2.2. Interest rates and new business volumes of loans granted to nonresident other deposit-taking corporations
(period average, percentages per annum)
in
national
currency
in
foreign
currency
business
volume,
hryvnias
mln
interest
rates, %
business
volume,
hryvnias
mln
interest
rates, %
business
volume,
hryvnias
mln
interest
rates, %
business
volume,
hryvnias
mln
interest
rates, %
business
volume,
hryvnias
mln
interest
rates, %
business
volume,
hryvnias
mln
interest
rates, %
business
volume,
hryvnias
mln
interest
rates, %
business
volume,
hryvnias
mln
interest
rates, %
1 2 3 4 5 6 7 8 9 10 11 12 13 14 15 16 17 18 19 20 21
2005 561 094 2.8 2.1 2.8 13 2.1 472 776 2.8 86 065 2.7 1 382 3.1 273 4.7 585 5.4 … … … …
2006 502 762 3.7 1.6 3.7 2 2.8 420 103 3.8 79 532 3.5 2 080 4.1 379 7.5 666 4.3 … … … …
2007 873 750 4.5 2.3 4.5 6 3.2 723 941 4.4 139 253 4.5 8 412 5.7 666 6.0 1 472 5.6 … … … …
2008 1 154 593 3.4 3.0 3.4 1 6.6 1 129 734 3.4 17 019 3.9 5 992 6.1 1 386 4.5 35 9.0 270 12.1 156 9.4
2009 1 289 968 0.5 12.0 0.5 0 – 1 250 076 0.4 21 472 0.6 12 158 6.2 4 220 6.8 1 915 13.4 42 6 85 1
2010 2
2 042 105 0.3 – 0.3 – – 1 999 249 0.3 35 963 0.2 2 080 0.7 2 428 0.5 2 237 4.2 146 1.2 – –
2011 1 645 780 0.5 4.7 0.5 – – 1 607 036 0.5 34 185 0.4 4 363 0.8 165 3.2 30 6.0 0 14.7 – –
2012 1 072 873 0.2 – 0.2 – – 1 067 130 0.2 3 535 2.7 1 352 2.3 335 4.6 – – 520 0.7 – –
2013 483 051 0.3 – 0.3 – – 470 566 0.3 7 110 0.9 4 579 1.3 256 0.2 200 5.3 341 1.6 – –
February 15 083 0.2 – 0.2 – – 14 622 0.2 364 0.4 96 0.4 – – – – 1 20.3 – –
March 52 096 0.1 – 0.1 – – 51 893 0.1 102 6.0 96 0.5 – – – – 6 22.1 – –
April 15 279 0.3 – 0.3 – – 15 096 0.3 113 5.8 – – 64 0.2 – – 6 22.2 – –
May 6 949 1.6 – 1.6 – – 6 859 1.6 89 6.2 – – – – – – 1 21.5 – –
June 7 065 1.8 – 1.8 – – 6 710 1.6 355 6.0 – – – – – – 0 12.5 – –
July 63 093 0.8 – 0.8 – – 62 939 0.8 153 5.8 – – – – – – – – – –
August 50 694 0.4 – 0.4 – – 46 831 0.3 106 0.0 3 757 1.0 – – – – 0 12.5 – –
September 29 300 0.1 – 0.1 – – 29 169 0.1 132 1.2 – – – – – – – – – –
October 28 456 0.1 – 0.1 – – 24 518 0.1 3 651 0.2 126 6.7 160 0.1 – – – – – –
November 58 631 0.1 – 0.1 – – 56 657 0.0 1 607 0.3 364 2.9 – – – – 2 20.9 – –
December 95 394 0.1 – 0.1 – – 94 907 0.0 211 0.1 76 1.5 – – 200 5.3 – – – –
2014
January 167 024 0.2 – 0.2 – – 166 914 0.2 86 0.2 24 12.0 – – – – – – – –
February 57 484 0.2 – 0.2 – – 47 662 0.1 4 519 0.1 5 303 1.0 – – – – – – – –
1 To January 2007 data include loans with original original maturity over 3 months.
overdraft overnightover 7 days and up
to 1 monthbusiness
volume,
hryvnias
mln
interest
rates, %
2 Since January 2010 include interest rates and volumes under primary agreements concluded during the reporting period as well as, аdditional agreements, a change whereof occurred either in the amount or the interest
rate, or the amount and the interest rate.
over 1 month and
up to 3 months
over 3 months and
up to 6 months 1 over 1 year
over 2 days and up
to 7 daysPeriod
including
over 6 months and
up to 1 year
Total
including

4. Financial markets
4.2. Money market interest rates
4.2.3. Interest rates and new business volumes of deposits from resident other deposit-taking corporations
(period average, percentages per annum)
in national
currency
in foreign
currency
business
volume,
hryvnias
mln
interest
rates, %
business
volume,
hryvnias
mln
interest
rates, %
business
volume,
hryvnias
mln
interest
rates, %
business
volume,
hryvnias
mln
interest
rates, %
business
volume,
hryvnias
mln
interest
rates, %
business
volume,
hryvnias
mln
interest
rates, %
business
volume,
hryvnias
mln
interest
rates, %
1 2 3 4 5 6 7 8 9 10 11 12 13 14 15 16 17 18 19
2005 7 205 4.5 5.1 3.2 … … 916 2.9 4 828 4.0 1 041 6.9 248 8.3 117 8.7 54 8.1
2006 8 087 5.8 6.4 4.7 … … 1 560 4.5 3 839 5.7 2 193 6.2 238 8.2 192 10.3 66 9.4
2007 10 914 5.4 5.1 5.7 … … 1 968 3.9 5 074 5.0 2 273 6.1 911 6.2 575 9.9 111 7.4
2008 47 338 10.9 19.8 5.7 … … 8 442 12.0 28 118 10.9 6 059 12.2 3 059 7.2 1 202 8.7 458 10.5
2009 150 056 6.9 14.3 3.9 … … 78 793 6.6 64 831 6.7 4 744 13.3 640 11.8 780 19.5 134 13.3
2010 1
194 818 2.9 4.8 1.5 291 5.8 62 185 2.0 121 514 3.0 9 384 7.0 399 6.6 842 9.0 202 14.3
2011 267 263 5.0 8.2 1.2 157 2.9 80 005 4.6 164 854 4.8 20 640 8.2 676 11.9 554 11.3 377 8.6
2012 153 262 6.8 13.5 1.3 177 2.3 37 972 7.6 99 137 6.2 13 757 8.7 1 015 8.4 822 11.4 383 9.6
2013 131 134 2.8 5.2 1.5 2 422 0.5 22 664 2.2 77 170 2.9 24 153 2.8 2 743 3.4 1 561 4.8 420 9.1
February 8 020 1.8 3.2 1.3 48 0.8 2 500 1.4 4 294 1.7 792 2.0 317 2.2 62 13.0 7 0.4
March 8 652 1.5 4.6 1.1 109 0.7 1 887 1.0 5 133 1.6 747 2.8 172 1.3 586 0.3 18 12.8
April 10 312 2.7 5.5 1.5 123 0.8 1 239 1.9 5 163 2.6 2 563 2.3 1 075 4.1 30 17.9 120 12.7
May 9 034 2.6 5.5 1.3 135 1.1 923 2.0 6 252 2.5 1 661 3.1 24 11.5 36 17.0 4 0.2
June 11 545 2.4 4.0 1.6 75 1.3 1 914 1.1 4 712 2.1 4 670 3.3 67 3.9 78 6.5 29 8.9
July 13 239 2.3 3.5 1.4 157 0.6 3 293 1.7 6 828 2.4 2 265 2.7 261 3.3 366 1.3 70 7.3
August 14 399 3.5 5.2 1.3 106 1.2 1 891 2.6 10 618 3.8 1 689 2.5 75 2.4 21 12.4 – –
September 13 628 2.4 4.5 1.4 125 0.8 2 385 1.6 9 042 2.5 1 442 1.9 436 3.2 184 10.3 13 4.5
October 11 348 2.5 4.7 1.4 326 0.7 2 012 2.4 7 290 2.7 1 584 1.8 26 4.3 55 14.0 54 5.6
November 11 308 3.6 6.0 1.6 507 0.2 1 567 3.5 7 384 4.2 1 810 1.8 29 1.0 – – 11 14.5
December 13 292 4.2 10.3 1.8 695 0.2 905 11.0 6 907 3.8 4 471 3.9 76 1.4 142 10.3 96 8.3
2014
January 11 123 2.5 5.9 1.8 487 0.4 598 3.4 6 624 2.7 2 549 2.1 755 1.6 15 4.2 94 6.2
February 16 849 2.8 9.3 2.0 721 0.2 794 11.2 11 694 2.5 2 606 2.2 1 025 2.7 – – 10 5.5
over 3 months and
up to 6 monthsdemand
over 6 months and up
to 1 yearover 1 years
1 Since January 2010 include interest rates and volumes under primary agreements concluded during the reporting period as well as, аdditional agreements, a change whereof occurred either in the amount or the interest
rate, or the amount and the interest rate.
including up to 1 month
Period
overnightover 1 month and up
to 3 months
Total
business
volume,
hryvnias
mln
interest
rates, %
including

4. Financial markets
4.2. Money market interest rates
4.2.4. Interest rates and new business volumes of deposits from nonresident other deposit-taking corporations
(period average, percentages per annum)
in national
currency
in foreign
currency
business
volume,
hryvnias
mln
interest
rates, %
business
volume,
hryvnias
mln
interest
rates, %
business
volume,
hryvnias
mln
interest
rates, %
business
volume,
hryvnias
mln
interest
rates, %
business
volume,
hryvnias
mln
interest
rates, %
business
volume,
hryvnias
mln
interest
rates, %
business
volume,
hryvnias
mln
interest
rates, %
1 2 3 4 5 6 7 8 9 10 11 12 13 14 15 16 17 18 19
2005 971 5.9 7.8 5.4 … … 97 3.7 312 3.4 102 3.2 89 6.4 250 9.0 120 9.6
2006 1 549 6.9 11.3 6.5 … … 19 3.0 357 6.7 373 6.2 144 7.4 363 8.9 294 5.5
2007 6 542 4.8 0.0 4.9 … … 304 4.9 1 763 2.6 1 833 6.3 406 6.4 134 6.0 2 102 5.1
2008 26 437 4.8 6.7 4.8 … … 2 473 9.3 5 390 3.2 1 360 8.5 73 10.3 358 6.3 16 783 4.3
2009 98 276 2.4 6.7 2.4 … … 54 456 1.0 23 069 2.6 6 398 3.5 1 146 11.4 7 076 7.1 6 118 5.2
2010 1
32 247 1.7 1.7 1.7 1 305 0.0 17 451 0.5 10 190 1.8 1 109 3.2 93 3.7 1 030 12.2 1 069 10.4
2011 20 558 1.8 7.6 1.5 644 0.8 10 854 0.4 4 181 0.7 170 10.0 103 7.3 1 726 7.1 2 879 5.3
2012 100 057 0.7 3.8 0.7 1 159 0.3 73 066 0.4 21 422 0.5 100 2.9 50 3.3 2 456 6.9 1 803 5.8
2013 5 089 4.7 – 4.9 543 0.8 80 0.9 86 0.1 452 1.8 227 2.5 1 736 6.3 1 965 5.6
February 318 7.4 – 7.4 23 0.0 – – – – 51 3.3 – – 152 8.9 93 9.1
March 353 4.5 – 4.5 – – – – – – – – – – 308 3.9 45 8.9
April 512 3.9 – 3.9 – – 80 0.9 – – 140 0.6 4 8.0 128 8.5 160 4.6
May 223 5.0 – 5.0 – – – – 80 0.0 2 4.0 2 4.0 63 8.0 76 7.6
June 711 2.7 – 4.2 254 – – – – – 128 0.6 – – 54 8.2 274 5.1
July 414 7.2 0.1 7.2 0 0.0 – – – – 2 4.0 2 4.5 141 7.7 269 7.0
August 470 4.2 – 4.2 0 – – – 1 1.9 29 3.8 192 2.0 161 7.5 87 3.2
September 647 3.1 – 3.1 176 1.2 – – 1 2.0 35 3.2 24 5.0 49 7.8 362 3.3
October 254 4.4 – 4.4 28 7.6 – – 4 2.0 – – 3 5.3 183 3.7 36 5.7
November 366 4.4 – 4.4 17 – – – – – 18 2.7 – – 285 4.3 47 7.2
December 257 5.0 – 5.0 45 – – – – – – – – – 165 7.8 47 –
2014
January 64 2.8 – 2.8 33 – – – – – – – – – – – 31 5.8
February 1 151 3.0 0.0 3.9 531 0.4 – – 26 7.5 61 4.3 – – 18 8.5 515 5.1
interest
rates, %
including
including
demand
1 Since January 2010 include interest rates and volumes under primary agreements concluded during the reporting period as well as, аdditional agreements, a change whereof occurred either in the amount or the interest
rate, or the amount and the interest rate.
up to 1 month
Period
overnightover 1 month and up
to 3 months
over 3 months and
up to 6 months
over 6 months and
up to 1 yearover 1 years
Total
business
volume,
hryvnias
mln
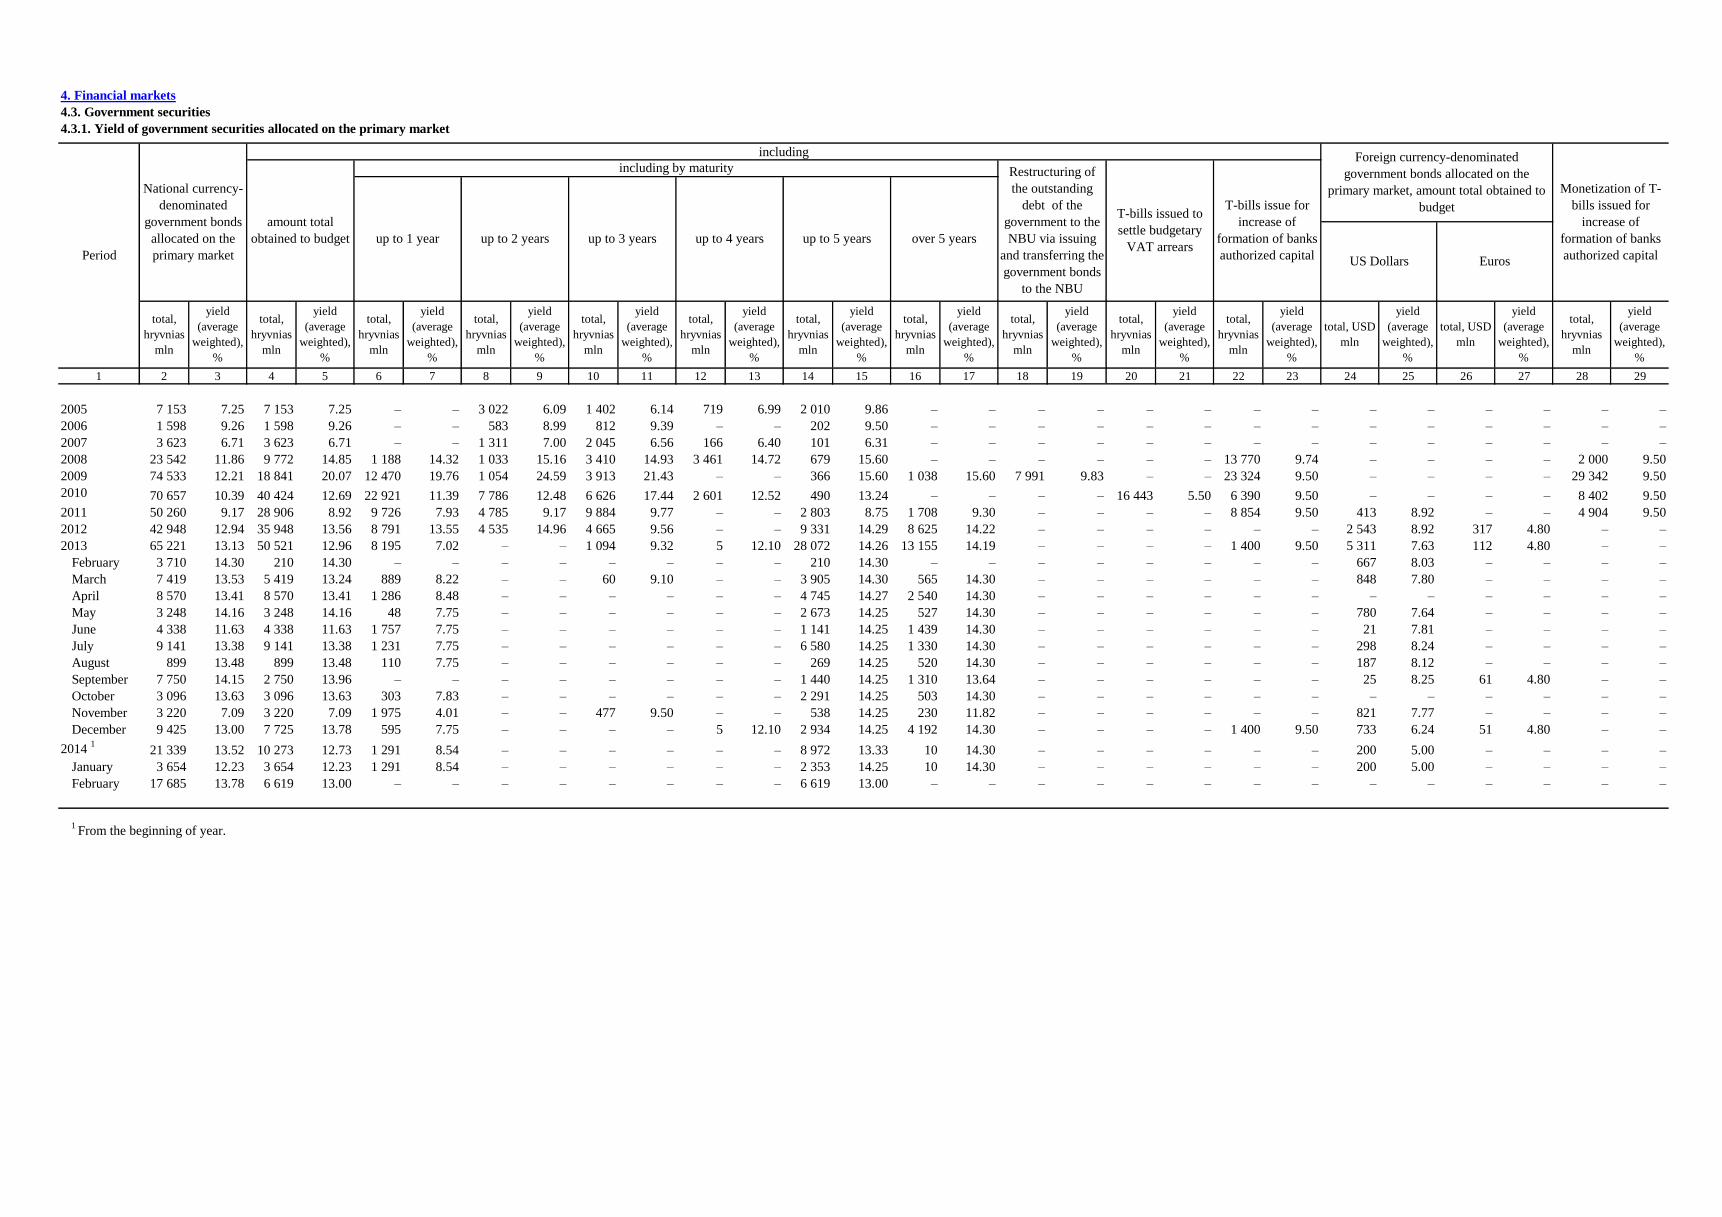
4. Financial markets
4.3. Government securities
4.3.1. Yield of government securities allocated on the primary market
1 2 3 4 5 6 7 8 9 10 11 12 13 14 15 16 17 18 19 20 21 22 23 24 25 26 27 28 29
2005 7 153 7.25 7 153 7.25 – – 3 022 6.09 1 402 6.14 719 6.99 2 010 9.86 – – – – – – – – – – – – – –
2006 1 598 9.26 1 598 9.26 – – 583 8.99 812 9.39 – – 202 9.50 – – – – – – – – – – – – – –
2007 3 623 6.71 3 623 6.71 – – 1 311 7.00 2 045 6.56 166 6.40 101 6.31 – – – – – – – – – – – – – –
2008 23 542 11.86 9 772 14.85 1 188 14.32 1 033 15.16 3 410 14.93 3 461 14.72 679 15.60 – – – – – – 13 770 9.74 – – – – 2 000 9.50
2009 74 533 12.21 18 841 20.07 12 470 19.76 1 054 24.59 3 913 21.43 – – 366 15.60 1 038 15.60 7 991 9.83 – – 23 324 9.50 – – – – 29 342 9.50
2010 70 657 10.39 40 424 12.69 22 921 11.39 7 786 12.48 6 626 17.44 2 601 12.52 490 13.24 – – – – 16 443 5.50 6 390 9.50 – – – – 8 402 9.50
2011 50 260 9.17 28 906 8.92 9 726 7.93 4 785 9.17 9 884 9.77 – – 2 803 8.75 1 708 9.30 – – – – 8 854 9.50 413 8.92 – – 4 904 9.50
2012 42 948 12.94 35 948 13.56 8 791 13.55 4 535 14.96 4 665 9.56 – – 9 331 14.29 8 625 14.22 – – – – – – 2 543 8.92 317 4.80 – –
2013 65 221 13.13 50 521 12.96 8 195 7.02 – – 1 094 9.32 5 12.10 28 072 14.26 13 155 14.19 – – – – 1 400 9.50 5 311 7.63 112 4.80 – –
February 3 710 14.30 210 14.30 – – – – – – – – 210 14.30 – – – – – – – – 667 8.03 – – – –
March 7 419 13.53 5 419 13.24 889 8.22 – – 60 9.10 – – 3 905 14.30 565 14.30 – – – – – – 848 7.80 – – – –
April 8 570 13.41 8 570 13.41 1 286 8.48 – – – – – – 4 745 14.27 2 540 14.30 – – – – – – – – – – – –
May 3 248 14.16 3 248 14.16 48 7.75 – – – – – – 2 673 14.25 527 14.30 – – – – – – 780 7.64 – – – –
June 4 338 11.63 4 338 11.63 1 757 7.75 – – – – – – 1 141 14.25 1 439 14.30 – – – – – – 21 7.81 – – – –
July 9 141 13.38 9 141 13.38 1 231 7.75 – – – – – – 6 580 14.25 1 330 14.30 – – – – – – 298 8.24 – – – –
August 899 13.48 899 13.48 110 7.75 – – – – – – 269 14.25 520 14.30 – – – – – – 187 8.12 – – – –
September 7 750 14.15 2 750 13.96 – – – – – – – – 1 440 14.25 1 310 13.64 – – – – – – 25 8.25 61 4.80 – –
October 3 096 13.63 3 096 13.63 303 7.83 – – – – – – 2 291 14.25 503 14.30 – – – – – – – – – – – –
November 3 220 7.09 3 220 7.09 1 975 4.01 – – 477 9.50 – – 538 14.25 230 11.82 – – – – – – 821 7.77 – – – –
December 9 425 13.00 7 725 13.78 595 7.75 – – – – 5 12.10 2 934 14.25 4 192 14.30 – – – – 1 400 9.50 733 6.24 51 4.80 – –
2014 1
21 339 13.52 10 273 12.73 1 291 8.54 – – – – – – 8 972 13.33 10 14.30 – – – – – – 200 5.00 – – – –
January 3 654 12.23 3 654 12.23 1 291 8.54 – – – – – – 2 353 14.25 10 14.30 – – – – – – 200 5.00 – – – –
February 17 685 13.78 6 619 13.00 – – – – – – – – 6 619 13.00 – – – – – – – – – – – – – –
1 From the beginning of year.
yield
(average
weighted),
%
yield
(average
weighted),
%
total,
hryvnias
mln
yield
(average
weighted),
%
total,
hryvnias
mln
yield
(average
weighted),
%
total,
hryvnias
mln
yield
(average
weighted),
%
total,
hryvnias
mln
total,
hryvnias
mln
yield
(average
weighted),
%
total,
hryvnias
mln
yield
(average
weighted),
%
yield
(average
weighted),
%
total,
hryvnias
mln
total, USD
mln
Period
total,
hryvnias
mln
yield
(average
weighted),
%
total,
hryvnias
mln
including by maturity
yield
(average
weighted),
%
total,
hryvnias
mln
up to 1 year
amount total
obtained to budget
National currency-
denominated
government bonds
allocated on the
primary market
total, USD
mln
yield
(average
weighted),
%
over 5 years
yield
(average
weighted),
%
total,
hryvnias
mln
total,
hryvnias
mln
up to 4 years
yield
(average
weighted),
%
yield
(average
weighted),
%
US Dollars
up to 3 yearsup to 2 years
Monetization of T-
bills issued for
increase of
formation of banks
authorized capital
T-bills issue for
increase of
formation of banks
authorized capital
T-bills issued to
settle budgetary
VAT arrears
Restructuring of
the outstanding
debt of the
government to the
NBU via issuing
and transferring the
government bonds
to the NBU
Foreign currency-denominated
government bonds allocated on the
primary market, amount total obtained to
budget
up to 5 years
Euros
including

4. Financial markets
4.3. Government securities
4.3.2. Yield of government securities allocated on the open market
(in millions of hryvnias)
on stock
exchange
on the over-the-
counter market
on stock
exchange
on the over-the-
counter market
1 2 3 4 5 6 7 8 9
2005 20 336 – – 517 2 300 3 862 13 222 435
2006 34 818 – – 1 528 – 8 500 21 789 3 002
2007 54 279 – – 607 – 2 632 48 297 2 743
2008 85 281 6 568 2 000 39 412 – 3 982 33 232 87
2009 73 056 3 862 33 266 4 206 – 4 018 27 575 129
2010 275 056 20 673 28 396 748 2 005 40 075 182 749 410
2011 411 748 10 426 17 036 28 549 1 599 88 637 265 372 129
2012 638 573 4 443 36 748 88 789 – 173 086 334 757 750
2013 607 153 – 46 583 65 047 – 323 160 143 319 29 044
February 35 035 – 6 400 1 048 – 17 133 10 354 100
March 40 356 – 3 139 724 – 23 601 12 763 128
April 43 905 – 4 311 2 885 – 26 575 9 568 566
May 45 732 – 1 296 4 933 – 23 679 13 934 1 889
June 40 589 – 4 631 1 013 – 24 469 8 050 2 427
July 65 097 – 5 024 3 491 – 32 909 20 437 3 236
August 72 211 – 2 880 4 996 – 44 116 16 898 3 320
September 41 985 – 3 403 967 – 26 585 7 725 3 305
October 46 633 – 1 060 7 170 – 22 322 14 140 1 941
November 48 598 – – 7 000 – 31 559 4 213 5 826
December 75 924 – 7 101 27 275 – 28 097 7 198 6 254
2014 1
116 934 13 161 9 643 22 318 – 60 652 6 408 4 751
January 49 129 1 836 2 904 8 429 – 31 660 1 522 2 777
February 67 805 11 326 6 738 13 890 – 28 992 4 885 1 974
1 From the beginning of year.
Period Total
National Bank of Ukraine Economic entities
purchase/sales NBU refinancing for
banks including direct
repo
reverse repo
purchase/sales granted/obtained credits
including those under
repo agreements
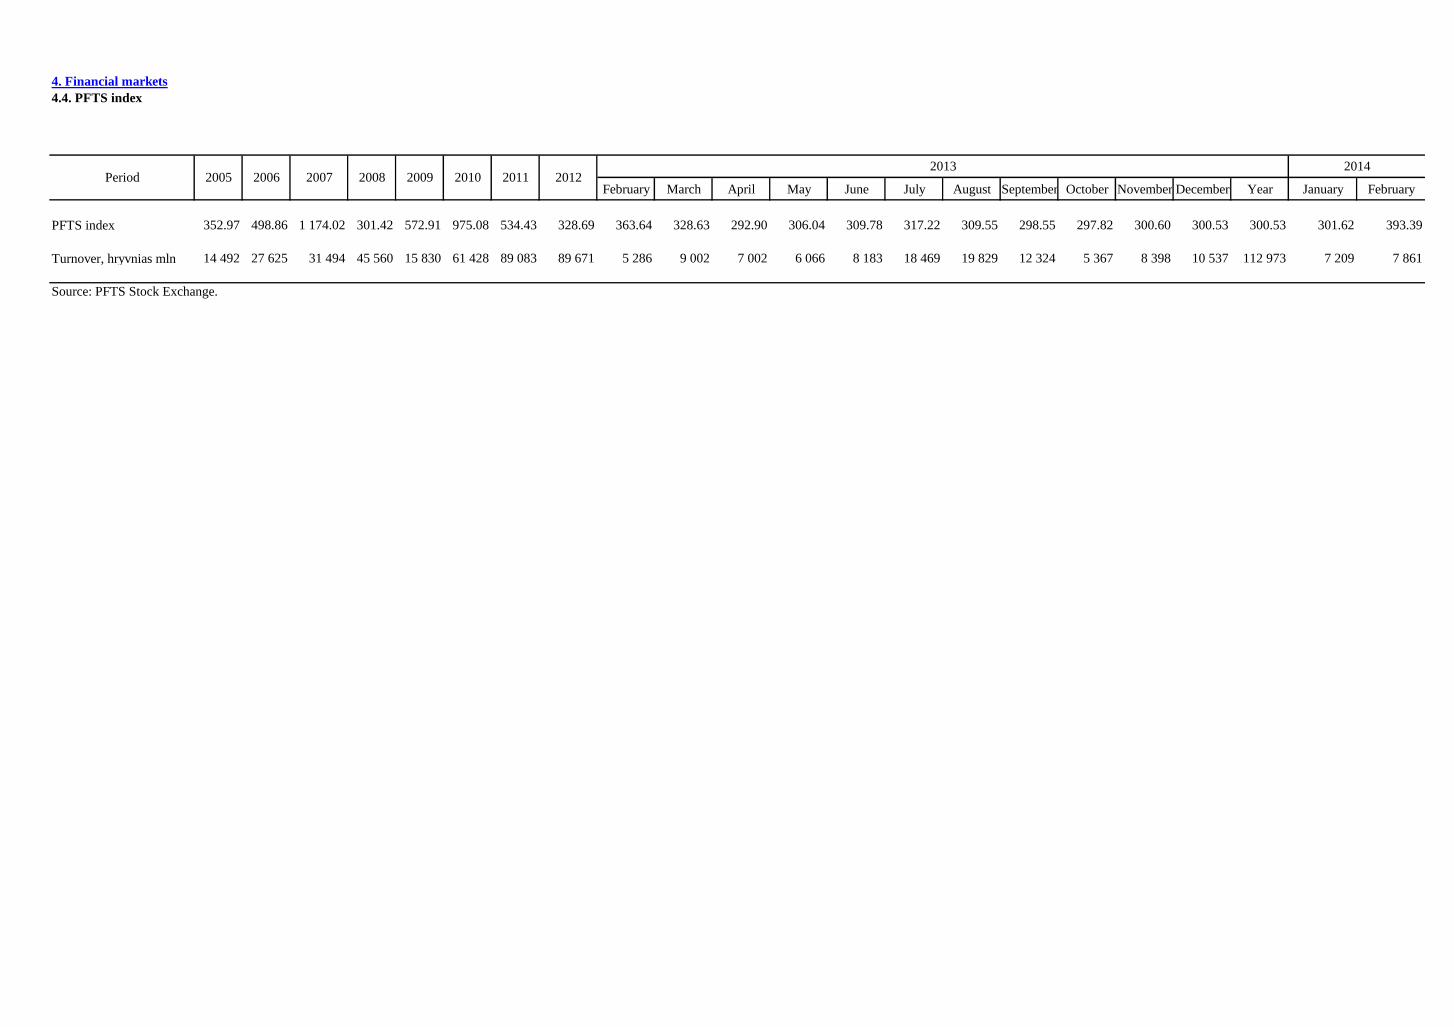
4. Financial markets
4.4. PFTS index
February March April May June July August September October November December Year January February
PFTS index 352.97 498.86 1 174.02 301.42 572.91 975.08 534.43 328.69 363.64 328.63 292.90 306.04 309.78 317.22 309.55 298.55 297.82 300.60 300.53 300.53 301.62 393.39
Turnover, hryvnias mln 14 492 27 625 31 494 45 560 15 830 61 428 89 083 89 671 5 286 9 002 7 002 6 066 8 183 18 469 19 829 12 324 5 367 8 398 10 537 112 973 7 209 7 861
Source: PFTS Stock Exchange.
20142012
20132008 2009 2010 20112007Period 2005 2006

5. Exchange rates
5.1. Official exchange rate of hryvnia against foreign currencies, period average
5.2. Official exchange rate of hryvnia against foreign currencies, end of period

5. Exchange rates
5.1. Official exchange rate of hryvnia against foreign currencies, period average
(hryvnias)
January February
100 Australian Dollar 390.88 380.32 423.29 443.77 617.14 729.63 822.70 827.69 774.63 708.06 774.79
100 Pound Sterling 933.76 929.45 1 010.69 966.88 1 219.48 1 226.89 1 277.71 1 266.38 1250.64 1316.80 1 431.53
10000/100 1
Azerbaijan Manat 10.83 557.91 588.48 641.78 969.36 988.66 1 008.93 1 017.12 1018.80 1018.97 1 103.42
10 Belarussian Ruble 0.02 0.02 0.02 0.02 0.03 0.03 0.02 0.01 0.01 0.01 0.01
100 Danish Krone 85.76 84.96 92.85 103.38 145.95 141.44 148.86 137.98 142.29 146.30 158.17
100 US Dollar 512.47 505.00 505.00 526.72 779.12 793.56 796.76 799.10 799.30 799.30 865.49
100 4
Estonian Kroon 40.84 40.50 44.21 49.26 69.46 67.32 – – – – –
100 Icelandic Krona 8.16 7.26 7.90 5.76 3.75 3.63 3.98 6.39 6.54 6.91 7.57
100 Canadian Dollar 422.89 445.16 471.98 493.94 685.60 770.66 805.96 799.58 776.52 733.37 782.42
100 Kazakh Tenge 3.86 4.01 4.12 4.38 5.30 5.39 5.43 5.36 5.25 5.17 5.04
100 5
Latvian Lats 909.94 907.95 988.22 1 097.12 1 539.89 1 486.13 1 570.16 1 472.83 1512.92 – –
100 Lithuanian Litas 185.20 183.56 200.36 223.24 314.76 305.05 321.24 297.46 307.35 316.14 341.84
100 Moldovan Leu 40.68 38.47 41.67 50.75 70.26 64.21 67.91 66.03 63.57 60.77 64.20
100 Norwegian Krone 79.67 78.80 86.34 93.63 124.67 131.48 142.31 137.37 136.18 129.98 141.00
100 Polish Zloty 158.76 162.77 183.06 219.19 252.09 263.85 270.21 245.52 252.92 261.78 282.32
10 Russian Ruble 1.81 1.86 1.98 2.11 2.47 2.61 2.72 2.57 2.51 2.39 2.46
100 Singapore Dollar 308.03 317.81 335.22 371.65 536.56 582.39 633.93 639.42 639.04 628.26 682.83
10000/100 2
Turkish Lira 380.29 352.97 387.74 404.35 502.51 526.90 477.13 443.69 420.98 361.36 390.52
10000/100 3
Turkmen Manat 9.86 9.71 9.71 5.30 273.38 278.44 279.56 280.39 280.46 280.46 303.68
1000 Hungarian Forint 25.78 24.02 27.53 30.64 38.92 38.31 39.89 35.53 35.74 36.28 38.01
100 Uzbek Sum 0.46 0.41 0.40 0.40 0.53 0.50 0.46 0.42 0.38 0.36 0.39
100 Czech Koruna 21.44 22.37 24.95 30.84 41.21 41.65 45.14 40.85 40.87 39.73 42.98
100 Swedish Krona 68.96 68.50 74.79 80.03 102.54 110.33 122.88 117.98 122.72 123.20 133.11
100 Swiss Franc 412.75 402.78 421.16 486.09 719.50 762.61 901.41 852.08 862.33 887.22 966.21
100 RNB (China) 62.53 63.34 66.40 75.85 114.06 117.23 123.27 126.66 129.98 131.99 142.46
1000 Japanese Yen 46.69 43.40 42.92 51.40 83.45 90.52 100.04 100.19 82.14 76.66 84.82
100 Euro 638.99 633.69 691.79 770.80 1 086.79 1 053.29 1 109.18 1 027.06 1061.22 1091.57 1 180.32
100 SDR 758.02 742.83 772.94 830.84 1 201.88 1 210.84 1 258.08 1 223.72 1214.70 1228.81 1 332.33
1 From January 2006, 100 Azerbaijan Manat.
2 From January 2005, 100 Turkish Lira.
3 From January 2009, 100 Turkmen Manat.
2014201320122011200820072006 2009
5Starting from 1 January 2014 the euro will enter into circulation as the new monetary unit on the
territory of Latvia instead of the Latvian lats.
4Starting from 1 January 2011 the euro will enter into circulation as the new monetary unit on the
territory of Estonia instead of the Estonian kroon.
2010Currencies 2005

5. Exchange rates
5.2. Official exchange rate of hryvnia against foreign currencies, end of period 1
(hryvnias)
January February
100 Australian Dollar 368.69 398.47 443.46 531.22 713.95 808.41 804.60 830.22 712.08 701.84 892.14
100 Pound Sterling 867.59 990.45 1 009.73 1 114.30 1 266.47 1 229.15 1 231.82 1 289.82 1 319.73 1317.03 1 662.37
10000/100 2
Azerbaijan Manat 11.00 579.46 597.35 961.30 994.27 997.83 1 016.00 1 018.22 1 018.87 1019.26 1 272.95
10 Belarussian Ruble 0.02 0.02 0.02 0.04 0.03 0.03 0.01 0.01 0.01 0.01 0.01
100 Danish Krone 80.06 89.20 99.50 145.70 153.85 141.84 138.52 141.24 148.01 145.40 182.74
100 US Dollar 505.00 505.00 505.00 770.00 798.50 796.17 798.98 799.30 799.30 799.30 998.63
100 5
Estonian Kroon 38.17 42.51 47.42 69.38 73.17 67.57 – – – – –
100 Icelandic Krona 7.93 7.14 8.13 3.74 3.95 3.65 6.48 6.20 6.93 6.92 8.78
100 Canadian Dollar 432.85 435.24 515.63 626.36 761.28 796.47 780.81 803.02 749.54 714.92 897.19
100 Kazakh Tenge 3.77 3.98 4.19 6.38 5.38 5.40 5.40 5.32 5.20 5.14 5.43
100 6
Latvian Lats 851.60 953.94 1 064.49 1 533.47 1 614.11 1 489.59 1 473.26 1 510.06 1 573.32 – –
100 Lithuanian Litas 173.53 192.62 214.88 314.40 331.58 306.22 298.25 305.18 319.78 314.23 394.96
100 Moldovan Leu 39.36 39.13 44.62 74.02 64.92 65.51 68.05 66.26 61.21 59.78 73.43
100 Norwegian Krone 74.49 80.73 93.05 110.32 137.57 135.22 132.47 143.61 130.71 128.13 164.83
100 Polish Zloty 154.70 173.61 206.01 261.80 277.56 266.66 231.88 258.21 265.96 256.42 326.42
10 Russian Ruble 1.75 1.92 2.06 2.62 2.64 2.61 2.50 2.63 2.45 2.27 2.77
100 Singapore Dollar 303.36 329.22 349.22 534.09 568.47 617.16 612.80 653.51 630.62 626.32 788.83
10000/100 3
Turkish Lira 374.09 356.81 431.92 502.43 527.84 512.36 417.77 446.79 369.79 352.17 449.13
10000/100 4
Turkmen Manat 9.71 9.71 9.71 5.40 280.18 279.36 280.34 280.46 280.46 280.46 350.40
1000 Hungarian Forint 23.65 26.42 29.23 40.76 42.08 37.90 33.14 36.24 37.14 34.89 43.86
100 Uzbek Sum 0.43 0.41 0.39 0.55 0.53 0.49 0.45 0.40 0.36 0.36 0.45
100 Czech Koruna 20.59 24.20 27.91 40.76 43.37 41.89 39.75 41.91 40.23 39.32 49.88
100 Swedish Krona 63.46 73.57 78.53 99.14 111.21 117.31 115.17 123.08 122.98 122.81 152.91
100 Swiss Franc 383.17 413.89 446.85 725.49 769.52 847.55 845.07 872.28 902.53 886.92 1 121.40
100 RNB (China) 62.57 64.70 69.14 112.65 116.99 120.62 126.42 128.23 131.70 131.83 162.95
1000 Japanese Yen 42.83 42.38 44.66 85.21 86.50 97.68 102.73 92.84 76.14 77.90 98.00
100 Euro 597.16 665.09 741.95 1 085.55 1 144.89 1 057.31 1 029.81 1 053.72 1 104.15 1084.97 1 363.73
100 SDR 721.78 759.72 798.03 1 186.01 1 251.80 1 226.13 1 222.76 1 228.46 1 235.08 1226.29 1 545.28
1 Established at last calendar day.
2 From January 2006, 100 Azerbaijan Manat.
3 From January 2005, 100 Turkish Lira.
4 From January 2009, 100 Turkmen Manat.
201420082006 2007 2013
6Starting from 1 January 2014 the euro will enter into circulation as the new monetary unit on the territory
of Latvia instead of the Latvian lats.
20122009
5Starting from 1 January 2011 the euro will enter into circulation as the new monetary unit on the territory of
Estonia instead of the Estonian kroon.
2010Currencies 20112005

6. Selected data on deposit-taking corporations (excluding National Bank of Ukraine)
6.1. Institutional coverage of banks for the sector of deposit-taking corporations
6.2. Data on number of banks of Ukraine
6.3. Loans and deposits of banks in distress or in receivership
6.4. Financial Soundness Indicators

6. Selected data on deposit-taking corporations (excluding National Bank of Ukraine)
6.1. Institutional coverage of banks for the sector of deposit-taking corporations
domesticforeign-
controlleddomestic
foreign-
controlled
1 2 3 4 5 6 7
Banks covered in the sector of
deposit-taking corporations
2005 163 181 068 1 443 1 154 7
2006 169 201 644 1 413 1 122 7
2007 173 244 686 1 362 1 116 6
2008 182 279 834 1 308 1 102 7
2009 182 240 571 1 091 1 114 8
2010 176 219 712 741 1 101 8
2011 176 221 193 455 1 111 13
2012
Q1 176 222 007 382 1 113 16
Q2 176 219 974 303 1 106 16
Q3 175 220 102 267 1 107 18
Q4 176 218 898 242 1 101 19
2013
Q1 175 218 145 221 1 108 20
Q2 175 218 075 217 1 105 20
Q3 181 217 260 181 1 103 20
Q4 180 … 177 1 105 19
Including:
Government-controlled
2005 2 39 280 465 – 15 –
2006 2 39 067 450 – 14 –
2007 2 39 535 435 – 14 –
2008 2 40 454 424 – 12 –
2009 5 46 561 404 – 15 –
2010 5 45 930 294 – 13 –
2011 5 44 476 156 – 12 –
2012
Q1 5 43 215 108 – 13 –
Q2 5 43 094 64 – 12 –
Q3 5 43 075 54 – 13 –
Q4 5 43 072 54 – 13 –
2013
Q1 5 43 104 54 – 13 –
Q2 5 43 088 54 – 13 –
Q3 6 43 078 54 – 12 –
Q4 7 … 54 – 12 –
Privately-controlled
2005 161 141 788 978 1 139 7
2006 167 162 577 963 1 108 7
2007 171 205 151 927 1 102 6
2008 180 239 380 884 1 90 7
2009 177 194 010 687 1 99 8
2010 171 173 782 447 1 88 8
2011 171 176 717 299 1 99 13
2012 171 175 826 188 1 88 19
Q1 171 178 792 274 1 100 16
Q2 171 176 880 239 1 94 16
Q3 170 177 027 213 1 94 18
Q4 171 175 826 188 1 88 19
2013
Q1 170 175 041 167 1 95 20
Q2 170 174 987 163 1 92 20
Q3 175 174 182 127 1 91 20
Q4 173 … 123 1 93 19
Banks in distress or in receivership
excluded from the coverage of the
sector of deposit-taking
corporations
2005 20 – 25 – – –
2006 19 – 1 – – –
2007 19 – 1 – – –
2008 13 – 5 – – –
2009 13 – 8 – – –
2010 18 – 52 – – –
2011 21 – 21 – – –
2012
Q1 23 – 10 – – –
Q2 23 – 8 – – –
Q3 24 – 8 – – –
Q4 22 – 4 – – –
2013
Q1 22 – 4 – – –
Q2 23 – 3 – – –
Q3 23 – 3 – – –
Q4 23 – 3 – – –
1 At end of period.
Descriptionsnumber of subsidiaries
Number of
institutions 1,
total
including
number of branchesAverage number of
employees, during the
reference year

6.2. Data on number of banks of Ukraine
January February
Number of banks included in the State Register of
Banks (end of period) 1
186 193 198 198 197 194 198 176 182 183 183
including banks registered over period 5 13 6 7 5 3 4 4 8 1 –
Number of banks that hold banking license
(end of period) 165 170 175 184 182 176 176 175 179 180 180
of which: banks with participation of foreign
capital 23 35 47 53 51 55 53 53 49 49 49
including with 100% foreign capital 9 13 17 17 18 20 22 22 19 19 19
Number of banks licensed as a remedial bank
(end of period) – – – – – – – 1 1 1 1
Moreover other financial corporations licenced to
perform banking operations 1 1 1 1 1 1 1 1 1 1 1
Number of banks with licenses for performance
of some banking operations revoked or suspended
(over period) 17 11 9 7 7 2 11 5 6 2 2
Number of banks with banking license
revoked (over period) 1 5 2 1 8 9 4 4 4 – –
Number of banks excluded from
the State Register of Banks (over period) 1
1 6 1 7 6 6 – 26 2 – –
including – –
due to reorganization – 2 1 1 – 2 – 2 2 – –
due to liquidation 1 4 – 6 6 4 – 1 – – –
Number of banks that give reports
to the National Bank of Ukraine
(end of period) 163 169 173 182 180 175 175 175 180 180 180
1 Since March 2012 banks in distress or in receivership excluded from the State Register.
2014
6. Selected data on deposit-taking corporations (excluding National bank of Ukraine)
201220112009Descriptions 2005 20132008 20102006 2007

6. Selected data on deposit-taking corporations (excluding National bank of Ukraine)
6.3. Loans and deposits of banks in distress or in receivership
(outstanding amounts at end of period, in millions of hryvnias)
other financial corporations,
nonfinancial corporations,
nonprofit institutions serving
households 2
households3
other financial corporations,
nonfinancial corporations,
nonprofit institutions serving
households 2
households3
1 2 3 4 5 6 7 8
2005 20 1 215 1 185 30 626 510 116
2006 19 1 287 1 249 38 538 422 116
2007 19 1 055 1 024 31 397 321 75
2008 13 1 279 1 099 180 373 226 147
2009 13 4 987 3 704 1 283 1 401 952 449
2010 18 16 177 14 164 2 013 2 224 1 709 515
2011 21 16 806 14 771 2 035 2 922 2 463 460
2012 22 13 862 12 558 1 304 3 231 2 708 523
2013
January 22 13 790 12 481 1 310 3 183 2 706 477
February 22 12 431 11 123 1 308 3 208 2 715 493
March 22 12 202 10 915 1 288 3 211 2 724 487
April 23 11 971 10 756 1 215 3 236 2 725 511
May 23 11 853 10 676 1 176 3 214 2 705 508
June 23 11 670 10 548 1 122 3 035 2 535 501
July 23 11 591 10 472 1 119 3 029 2 535 495
August 23 11 282 10 235 1 047 3 027 2 533 494
September 23 10 869 9 888 981 2 964 2 474 490
October 23 11 883 10 246 1 637 4 117 3 598 519
November 23 11 647 10 100 1 546 4 084 3 576 508
December 23 11 411 9 866 1 545 4 040 3 555 485
2014
January 23 11 058 9 473 1 585 4 044 3 557 487
February 23 11 216 9 539 1 678 4 035 3 548 486
2 Includes sub-sectors of employers and own-account workers of the households sector.
3 Includes sub-sectors of employees and recipients of property and transfer incomes of the households sector.
1 To October 2013 data of banks does not include whose assets are transferred to the control established by the National Bank of Ukraine legal
entities
Period
Number of
banks in
distress or in
receivership
(end of period)
Customers' indebtedness on loans 1
Customers' claims on deposits 1
total
including
total
including

6.4. Financial Soundness Indicators
I1 Regulatory capital to risk-weighted assets1
14.95 14.19 13.92 14.01 18.08 20.83 18.90
I2 Regulatory Tier 1 capital to risk-weighted assets1 11.54 10.84 10.09 11.15 14.23 15.11 13.99
I3 Nonperforming loans2 net of provisions to capital 325.99 352.44 313.82 9.16 31.97 29.17 25.76
I4 Nonperforming loans to total gross loans3 57.99 59.76 48.12 3.88 13.70 15.27 14.73
I5 Sectoral distribution of loans to total loans
Residents 98.56 98.35 97.54 96.85 96.56 96.29 98.23
Deposit-takers 6.67 6.94 9.68 3.77 2.67 3.36 4.71
Central bank 0.00 0.00 0.00 0.00 0.00 0.00 0.00
Other financial corporations 1.07 1.00 1.22 1.24 1.82 1.70 1.92
General government 0.00 0.00 0.00 0.00 0.75 1.12 1.00
Nonfinancial corporations 67.96 59.83 53.61 56.26 60.00 63.53 67.13
Other domestic sectors 22.86 30.58 33.02 35.58 31.32 26.58 23.48
Nonresidents 1.44 1.65 2.46 3.15 3.44 3.71 1.77
I6 Return on assets4 1.31 1.34 1.22 0.88 –4.38 –1.40 –0.74
I7 Return on equity5 10.37 11.38 10.52 7.29 –32.25 –9.73 –5.01
I8 Interest margin to gross income 48.36 54.49 55.45 51.16 66.76 65.98 63.07
I9 Noninterest expenses to gross income 65.99 59.79 60.76 52.95 61.08 61.89 68.26
I10 Liquid assets6 to total assets 18.03 14.28 11.60 9.35 11.45 18.84 18.65
I11 Liquid assets7 to short-term liabilities 40.17 37.83 39.93 32.99 35.88 91.19 94.73
I12 Net open position in foreign exchange to capital 1.41 10.55 13.38 33.10 28.51 21.61 8.41
I13 Capital to assets 11.90 12.47 11.58 12.86 13.10 14.63 14.76
I14 Large exposures to capital 202.61 191.44 171.06 187.36 169.21 161.21 164.46
I15 Geographical distribution of loans to total loans
Domestic economy 98.56 98.35 97.54 96.85 96.56 96.29 98.23
Advanced economies, excluding China 1.07 1.09 2.20 2.85 3.16 3.54 1.60
Other emerging market and developing countries, including China 0.37 0.56 0.27 0.30 0.28 0.17 0.17
Africa 0.00 0.00 0.00 0.00 0.00 0.00 0.00
Of which: Sub-Sahara 0.00 0.00 0.00 0.00 0.00 0.00 0.00
Central and Eastern Europe 0.04 0.02 0.04 0.02 0.02 0.02 0.05
Commonwealth of Independent States and Mongolia 0.18 0.26 0.21 0.26 0.24 0.15 0.11
Developing Asia 0.00 0.00 0.00 0.00 0.00 0.00 0.00
Middle East 0.00 0.00 0.00 0.00 0.00 0.00 0.00
Western Hemisphere 0.15 0.28 0.01 0.02 0.01 0.01 0.01
I18 Trading income to total income 7.21 8.25 7.45 16.46 4.45 3.22 5.12
I19 Personnel expenses to noninterest expenses 43.21 47.15 49.10 48.13 40.67 40.73 38.91
I20 Spread between reference lending and deposit rates (basis points) 683 654 546 816 586 721 567
I21 Spread between highest and lowest interbank rates (basis points) 2279 830 939 2753 2499 1790 2900
I22 Customer deposits to total (noninterbank) loans 95.05 74.90 64.86 48.36 45.27 56.01 61.19
I23 Foreign-currency-denominated loans to total loans 44.58 50.48 51.45 60.32 52.59 48.23 42.13
I24 Foreign-currency-denominated liabilities to total liabilities 43.47 50.31 49.77 59.04 55.83 51.25 49.76
І39 Residential real estate loans8 to total gross loans … 7.61 8.39 11.20 12.82 10.39 8.22
І40 Commercial real estate loans9 to total gross loans … 2.39 2.19 2.32 2.29 1.73 1.20
8 Loans to households lending for house purchase.
9 Loans to non-financial corporations commercial real estate loans.
6. Selected data on deposit-taking corporations (excluding National bank of Ukraine)
2006
(Data by the end of the period, %)
3Beginning in 4th quarter of 2012, indicator I4 is compiled on the basis of banking supervision
methodology. To calculate the indicator I4 takes the data on NPLs, which included credit transactions
attributed to the IV and V quality categories; total gross loans - is the debts arising from credit
transactions, including loans to customers, interbank loans and deposits, off-balance sheet liabilities
on guarantees and loans given to banks and customers, used for credit risk assessment.
Beginning in 2008 to the 3rd quarter 2012, NPLs included doubtful and loss loans, as recorded in the
balance sheet. Until the end of 2007, NPLs included under watch, substandard, doubtful and loss
loans, as recorded in the balance sheet.
2005 2009Descriptions
7The data have been recalculated using the indicator of liquid assets (broad). Until the end of 2009,
calculations were made on the basis of the indicator of liquid assets (broad) with initial maturity.
Beginning in 2010, calculations have been made on the basis of the indicator of liquid assets (broad)
with final maturity of up to 1 year.
5Average capital for the period.
Core FSIs for deposit takers
Encouraged FSIs for deposit takers
2Beginning in 4th quarter of 2012, to calculate the indicator I3 takes the data on non-performing
loans (NPL), which include negatively classified loans by the IV and V quality categories, as recorded
in the balance sheet, and do not include deposits, off-balance sheet liabilities on guarantees and loans
given, used for credit risk assessment.
Beginning in 2008 to the 3rd quarter 2012, NPLs included doubtful and loss loans, as recorded in the
balance sheet. Until the end of 2007, NPLs included under watch, substandard, doubtful and loss
loans, as recorded in the balance sheet.
6The data have been recalculated using the indicator of liquid assets (core) that include the assets with
final maturity of up to 31 days used for current liquidity ratio calculation. Until the end of 2009, the
indicator of liquid assets (core) was based on the assets used for instant liquidity ratio calculation.
2011
4Average total assets for the period.
20102007 2008
1Beginning in 2008, risk weighted assets comprise the total open foreign exchange position in all
foreign currencies and precious (banking) metals.
Note. Financial soundness indicators are compiled according to the IMF Financial Soundness
Indicators Compilation Guide (2006).

6.4. Financial Soundness Indicators
I1 Regulatory capital to risk-weighted assets1
I2 Regulatory Tier 1 capital to risk-weighted assets1
I3 Nonperforming loans2 net of provisions to capital
I4 Nonperforming loans to total gross loans3
I5 Sectoral distribution of loans to total loans
Residents
Deposit-takers
Central bank
Other financial corporations
General government
Nonfinancial corporations
Other domestic sectors
Nonresidents
I6 Return on assets4
I7 Return on equity5
I8 Interest margin to gross income
I9 Noninterest expenses to gross income
I10 Liquid assets6 to total assets
I11 Liquid assets7 to short-term liabilities
I12 Net open position in foreign exchange to capital
I13 Capital to assets
I14 Large exposures to capital
I15 Geographical distribution of loans to total loans
Domestic economy
Advanced economies, excluding China
Other emerging market and developing countries, including China
Africa
Of which: Sub-Sahara
Central and Eastern Europe
Commonwealth of Independent States and Mongolia
Developing Asia
Middle East
Western Hemisphere
I18 Trading income to total income
I19 Personnel expenses to noninterest expenses
I20 Spread between reference lending and deposit rates (basis points)
I21 Spread between highest and lowest interbank rates (basis points)
I22 Customer deposits to total (noninterbank) loans
I23 Foreign-currency-denominated loans to total loans
I24 Foreign-currency-denominated liabilities to total liabilities
І39 Residential real estate loans8 to total gross loans
І40 Commercial real estate loans9 to total gross loans
8 Loans to households lending for house purchase.
9 Loans to non-financial corporations commercial real estate loans.
6. Selected data on deposit-taking corporations (excluding National bank of Ukraine)
(Data by the end of the period, %)
3Beginning in 4th quarter of 2012, indicator I4 is compiled on the basis of banking supervision
methodology. To calculate the indicator I4 takes the data on NPLs, which included credit transactions
attributed to the IV and V quality categories; total gross loans - is the debts arising from credit
transactions, including loans to customers, interbank loans and deposits, off-balance sheet liabilities
on guarantees and loans given to banks and customers, used for credit risk assessment.
Beginning in 2008 to the 3rd quarter 2012, NPLs included doubtful and loss loans, as recorded in the
balance sheet. Until the end of 2007, NPLs included under watch, substandard, doubtful and loss
loans, as recorded in the balance sheet.
Descriptions
7The data have been recalculated using the indicator of liquid assets (broad). Until the end of 2009,
calculations were made on the basis of the indicator of liquid assets (broad) with initial maturity.
Beginning in 2010, calculations have been made on the basis of the indicator of liquid assets (broad)
with final maturity of up to 1 year.
5Average capital for the period.
Core FSIs for deposit takers
Encouraged FSIs for deposit takers
2Beginning in 4th quarter of 2012, to calculate the indicator I3 takes the data on non-performing
loans (NPL), which include negatively classified loans by the IV and V quality categories, as recorded
in the balance sheet, and do not include deposits, off-balance sheet liabilities on guarantees and loans
given, used for credit risk assessment.
Beginning in 2008 to the 3rd quarter 2012, NPLs included doubtful and loss loans, as recorded in the
balance sheet. Until the end of 2007, NPLs included under watch, substandard, doubtful and loss
loans, as recorded in the balance sheet.
6The data have been recalculated using the indicator of liquid assets (core) that include the assets with
final maturity of up to 31 days used for current liquidity ratio calculation. Until the end of 2009, the
indicator of liquid assets (core) was based on the assets used for instant liquidity ratio calculation.
4Average total assets for the period.
1Beginning in 2008, risk weighted assets comprise the total open foreign exchange position in all
foreign currencies and precious (banking) metals.
Note. Financial soundness indicators are compiled according to the IMF Financial Soundness
Indicators Compilation Guide (2006).
March June September December
18.06 18.20 17.99 17.92 18.26
13.77 13.72 13.81 13.50 13.89
36.03 35.72 35.65 31.80 30.65
16.54 15.91 15.20 14.02 12.89
98.41 98.20 98.54 98.57 98.72
2.8 1.87 1.92 2.03 1.99
0.00 0.00 0.00 0.00 0.00
1.9 2.26 2.20 2.05 2.05
0.68 0.65 0.64 0.59 0.63
71.01 71.46 71.86 72.30 73.48
22.01 21.96 21.92 21.60 20.57
1.59 1.80 1.46 1.43 1.28
0.44 0.28 0.10 0.14 0.11
2.92 1.82 0.67 0.98 0.79
64.15 61.97 60.87 60.49 58.56
61.45 60.48 64.30 65.92 65.95
22.15 24.68 22.73 22.81 20.63
90.28 93.07 90.28 88.27 89.11
2.5 7.13 9.56 9.01 6.94
15.03 15.22 14.75 14.51 15.06
172.91 176.15 179.42 185.71 172.05
98.41 98.20 98.54 98.57 98.72
1.42 1.64 1.35 1.35 1.18
0.17 0.17 0.11 0.08 0.10
0.00 0.00 0.00 0.00 0.00
0.00 0.00 0.00 0.00 0.00
0.08 0.07 0.02 0.02 0.03
0.07 0.07 0.06 0.03 0.05
0.00 0.00 0.00 0.00 0.00
0.00 0.00 0.00 0.00 0.00
0.03 0.03 0.03 0.03 0.03
3.71 3.41 3.13 3.42 3.83
41.32 46.22 43.95 42.05 41.04
485 559 518 482 383
4494 2390 1990 2190 6490
69.8 71.57 73.75 74.66 73.34
37.66 38.1 37.30 36.31 34.72
49.22 48.40 46.82 46.48 43.25
6.85 6.63 6.36 5.99 5.46
0.88 1.50 1.49 1.44 1.38
20122013

7. Methodological notes
Section 1. Macroeconomic indicators
Tables 1.1 – 1.4, Section 1, comprise the key indicators that characterize the
economic and social situation in Ukraine. The source data, used to form the tables,
are the data of the State Statistics Service of Ukraine and the Ministry of Finance
of Ukraine.
Gross domestic product (GDP) means an indicator featuring the final result
of the production activity of manufacturers – residents during the reporting period.
It is defined at market prices as a sum of gross value added of kinds of economic
activity and taxes on products less subsidies on products.
Nominal GDP means the GDP volume at current (actual) prices.
Real GDP means the GDP volume at the prices of the period taken as a
comparative base period.
Deflator is the ratio of the GDP in actual prices of the reporting period to that at
constant prices.
Industrial product index is measured in comparative prices of the proper
year.
Capital investment means money invested to acquire or own produce for
own use of tangible or intangible assets.
Industrial producer price index reflects price changes over time in the
industrial production.
Consumer price index (inflation index) characterizes changes over time in
the overall level of prices for the goods and services which are purchased by
households for the nonproductive consumption.
Registered unemployment rate is a ratio (in percent) of the number of
registered unemployed to the annual average number of working-age population.
Registered unemployed persons are the persons of working age who are
registered with the territorial authorities of the central executive body that
implements the state policy in the field of employment and labor migration as
unemployed and willing and being able to work (pursuant to the Law of Ukraine
“On Employment of the Population”).
Income of the population includes the amounts accrued in kind and in cash
of following: wages, profits and mixed income, incomes derived from property,
social allowances and other current transfers.
Disposable population income is a maximum volume of money income
intended for use by households to purchase consumer goods and pay for services.
Population expenditures and savings comprise expenditures for purchase of
goods and services, mandatory payments and voluntary contributions, increase in
deposit savings, expenditures for acquisition of securities, foreign currencies, etc.
Average monthly nominal wage per full-time employee is a payment to
employee in the money and natural form for the hours worked, or the work
performed, bonuses, benefits, increments, as well as other kinds of payment for

2
non-worked time, including obligatory payments: income tax, contributions to the
Pension Fund and for compulsory social insurance.
Index of real average monthly wage characterizes the change of purchasing
capacity of the nominal salary/wage in the reporting period versus to the reference
one (calculated as a ratio of the nominal salary/wage index (without taking into
account the taxes and obligatory payments to the social insurance funds) to the
consumer price index for the same period).
Budget revenues mean all tax, non-tax and other revenues on the irrevocable
basis, charged under the legislation of Ukraine (including transfers, gifts and
grants).
Budget expenditures are the funds used to fulfill the programs and measures
envisaged by the appropriate budget less the money to repay the principal amount
of debt and to refund the excessive amounts paid to the budget.
Budget deficit are expenditures in excess of revenues.
Budget surplus are revenues in excess of expenditures.
Main indicators of the external sector of the economy of Ukraine are given
in Table 1.5.
Balance of payments is a statistical statement that systematically summarizes
data on the external economic operations of residents of a country with residents of
other countries (non-residents) for a specific time period. The main components of
the balance of payments are grouped by the two accounts: current account and
capital and financial account.
Gross external debt means the total liabilities of the residents of Ukraine to
the non-residents as at the end of a certain period.
The dynamics of indicators of the statistics of the balance of payments, gross
external debt and international investment position is published in the official
edition of the National Bank of Ukraine «Balance of Payments and External Debt
of Ukraine».
Definitions of the official reserve assets are given in the special
methodological commentary to Section 3. Definitions of the official exchange rate
of hryvnia to foreign currencies are presented in Section 5.
Section 2. National bank of Ukraine monetary
policy statistics
Tables of Section 2 comprise the data on interest rates of the National Bank
of Ukraine, required reserves, and monetary base (base money), starting from
2002. Dynamics of these data for longer periods has been published on the official
website of the National Bank of Ukraine, www.bank.gov.ua.
Tables of subsection 2.1 present the data about the interest rates, set by the
National Bank of Ukraine on passive and active operations, in particular, discount
rate, refinancing rate, rates on overnights, deposit certificates, repo operations,
swap operations.
Discount rate is a monetary instrument whereby the National Bank of
Ukraine sets a price benchmark of money for the entities of the money and credit

3
market. Discount rate is the main interest rate that depends on the trends of the
general economic development, macroeconomic and budgetary processes, as well
as on the situation in the money and credit market. It is the lowest rate among the
interest rates used by the National Bank of Ukraine to support liquidity, and is
maintained on the positive actual level with regard to inflation.
Refinancing rate is the interest rate established by the National Bank of
Ukraine on refinancing credits during the amount tender or interest rate tender,
depending on the bid prices for the funds of the National Bank of Ukraine asked by
banks. The refinancing rate is estimated on the basis of the discount rate and
depending on the term and type of refinancing and cannot be lower than the
discount rate.
Overnight rate is determined by the National Bank of Ukraine based on the
discount rate and taking into account the current situation in the money and credit
market, the analysis of interest rates in the inter-bank credit market, as well as the
demand and possible supply with regard to the issue of money into circulation by
the National Bank of Ukraine. The overnight rate may be differentiated depending
on the credit security. Credits are granted to banks for a term until the next
working day on the collateral of government securities of Ukraine (except bonds of
external government loan of Ukraine) or deposit certificates of the National Bank
of Ukraine and without collateral (blank ones).
Interest income on a repo transactions is the income received by a buyer of
government securities of Ukraine or banking metals in case of performing the repo
operation. Interest income on a repo operation is measured as a difference between
the price of reverse sale (repurchase) of the portfolio of government securities of
Ukraine or banking metals and the price of purchase.
Interest rate on a swap transaction is the interest rate on the transaction that
is based on a bilateral agreement between a bank and the National Bank of Ukraine
about exchange of foreign currency to national one. Interest rate on the swap
transaction for the use of the national currency is defined in the size established on
the level of the interest rate, that has been determined by the results of the last
tender, held to support banks’ liquidity for the term of 14 days, and the interest rate
on the funds in foreign currency, that is determined by the National Bank of
Ukraine with regard to the average weighted rate of interbank lending (in foreign
currency).
Table 2.2 presents ratios of reserve requirements used by the National Bank
of Ukraine as one of the monetary instruments to regulate the money supply and to
manage the money and credit market.
Reserve requirement is the amount of required reserves, set by the National
Bank of Ukraine, as a percentage of the liabilities with regard to the attracted funds
by a bank in national and foreign currencies (including in banking metals). A
single procedure of determining and forming the required reserves by all the banks
of Ukraine is approved by the Board of the National Bank of Ukraine.

4
Information concerning the structure and dynamics of the monetary base is
presented in Table 2.3. Monetary base definition is given in the special
methodological commentary to Section 3.
Table 2.4 shows the balance sheet of the National Bank of Ukraine across
the categories of assets and liabilities according to the methodology of the
International Monetary Fund. Definitions of categories of assets and liabilities are
stated in the general methodological commentary to Section 3.
Section 3. Monetary statistics
General methodological commentary to Section 3
Monetary statistics is a complex set of data about claims on and liabilities to
the sector of financial corporations and its sub-sectors with regard to other sectors
of the economy of the country and non-residents. It is one of the four systems of
macroeconomic statistics, beside of national accounts statistics, government
finance statistics and balance of payments statistics.
Monetary statistics of Ukraine comprises data on the stocks and flows of
financial and non-financial assets and liabilities of the sector of financial
corporations. At present, the monetary statistics in Ukraine cover 100 percent of
banks, established and operating in the territory of Ukraine (except the banks under
liquidation), insurance companies, non-state pension funds and collective
investment institutions (investment funds), credit unions, other credit institutions,
financial companies, legal entities involved in financial leasing services,
pawnshops and financial auxiliaries. Under the Law of Ukraine «On the National
Bank of Ukraine», the National Bank of Ukraine is responsible for compilation of
the monetary statistics.
The main forms of presentation of the monetary statistics data are sectoral
balance sheets and surveys of the sector of financial corporations and its sub-
sectors.
The data source for compiling the monetary statistics is a statistical reporting
of banks and the National Bank of Ukraine that is provided in accordance with the
Rules of Organizing the Statistical Reporting Submitted to the National Bank of
Ukraine approved by the Resolution of the Board of the National Bank of Ukraine
of 19 March, 2003, No.124 (amended), as well as administrative data of the
National Commission for State Regulation of Financial Services Markets and the
National Commission on Securities and Stock Market, data provided by the State
Statistical Service of Ukraine, calculations and estimates of the National Bank of
Ukraine.
Monetary statistics are compiled and disseminated on a monthly basis.
Monetary statistics data contribute to development of the monetary policy and
control of its implementation, provide a statistical basis for the macroeconomic
analysis and assessment of financial sector stability. They are also necessary to

5
inform a broad circle of users: authorities, residents and non-residents, who
conduct operations with financial corporations of the country.
Indicators of the monetary statistics are disseminated on the official website
of the National Bank of Ukraine, and, pursuant to the Special Data Dissemination
Standard of the International Monetary Fund, are published in the official edition
«Bulletin of the National Bank of Ukraine» and in the statistical edition of the
International Monetary Fund «International Financial Statistics».
Monetary statistics is compiled pursuant to the international standards given
in Monetary and Financial Statistics Manual (International Monetary Fund, 2000)
and Monetary and Financial Statistics: Compilation Guide (International Monetary
Fund, 2008).
Methodology of the monetary statistics compilation meets the requirements
of the System of National Accounts, Balance of Payments and International
Investment Position Manual, Government Finance Statistics Manual and other
official editions of the International Monetary Fund, as well as other international
organizations by the following principles and concepts.
Classification of institutional units
Residence principles. Participants of economic operations – institutional
units are classified as residents and nonresidents pursuant to the legislation of
Ukraine and international standards.
Sectorization. Resident institutional units, similar by their objectives,
functions and activity, are grouped into five sectors of the economy according to
the Classification of Institutional Sectors of the Economy of Ukraine (CISE),
approved by the order of the State Statistics Committee of Ukraine of 18 April,
2005, No.96 (amended):
1) financial corporations;
2) general government;
3) non-financial corporations;
4) households;
5) non-profit institutions serving households.
Financial corporations sector consists of all resident principally engaged in
financial intermediation or in auxiliary financial activities which are closely related
to financial intermediation: the National Bank of Ukraine, other deposit-taking
corporations (banks established and operating in the territory of Ukraine) and other
financial corporations (insurance companies, non-state pension funds, investment
funds, credit institutions, financial companies, etc). The other deposit-taking
corporations (banks) sub-sector consists of financial corporations that are engaged
in financial intermediation as a principal activity and that issue liabilities in the
form of deposits or other instruments that are close substitutes for deposits in
mobilizing financial resources and included in the monetary aggregates.
General government sector includes legal entities, whose main activity is to
exercise legislative, executive or judicial authority over other institutional units
within a specific area, and is subdivided into sub-sectors: central government, state
and local government, social security funds.

6
Non-financial corporations sector consists of corporations engaged
primarily in the production of market goods and non-financial services, and is
subdivided into sub-sectors: public non-financial corporations, private non-
financial corporations and foreign-controlled non-financial corporations.
Households include employees, own-account workers, employers, recipients
of property, pensions and other transfer incomes.
Non-profit institutions serving households are legal or social entities that
provide non-market goods and services to their members or to other households
without charge or at prices that are not economically significant: political parties,
consumers’ associations, churches or religious societies, charities, relief and aid
organizations, social, cultural, recreational and sports clubs of non-financial and
financial corporations.
Classification of institutional sectors of the economy pursuant to the
international standards is given in Table 1.
Table 1 Sectorisation in the monetary statistics of Ukraine CISE code
Resident
sectors
Money-
issuing
sectors
Financial
corporations
Deposit-
taking
corporations
National Bank of Ukraine S.121
Other deposit-taking corporations
(banks: public, private,
foreign-controlled)
S.122
Money-
holding
sectors
Other
financial
corporations
Insurance corporations (public,
private, foreign-controlled)
and non-state pension funds
S.125
Other financial intermediaries and
financial auxiliaries (public,
private, foreign-controlled)
S.123 +
S.124
Money-
neutral sector General
government
Central government S.1311
among them: social security funds S.1313
Money-
holding
sectors
State and local government S.1312
among them: social security funds S.1313
Non-
financial
corporations
Public non-financial corporations S.11001
Other non-financial corporations
(private, foreign-controlled)
S.11002 +
S.11003
Households Employers, own-account workers S.141 +
S.142
Employees, recipients of property and transfer
incomes
S.143 +
S.144
Non-profit institutions serving households S.15
Nonresidents Rest of the world S.2
Division by types of industry. Resident institutional units are classified by
types of industry according to the National Classifier of Ukraine DK 009:2005
Industrial Classification of all Economic Activities approved by the order of the
State Committee of Ukraine on Technical Regulation and Consumer Policy of 26
December, 2005 (amended).
Classification of financial assets
Financial assets are classified by the following categories of assets and
liabilities:

7
monetary gold and special drawing rights (SDRs) (central bank’s asset);
currency and deposits;
securities other than shares;
loans;
shares and other equity;
insurance technical reserves;
financial derivatives;
other accounts receivable/payable.
Monetary gold and SDR holdings are financial assets having for which there
are no corresponding financial liabilities.
Monetary gold consists only of gold held by National Bank of Ukraine and
as part of official reserve assets (international reserves). Gold holdings that are not
part of official reserve assets are classified as non-finacial assets.
SDRs are international reserve assets created by the International Monetary
Fund (IMF) and allocated to members to supplement existing official reserve
assets. SDR holdings represent unconditional rights to obtain foreign exchange of
other reserve assets from other IMF members.
Currency consists of banknotes and coins that are issued by the National
Bank of Ukraine and are of fixed nominal values. Funds in cash in foreign
currency represent liabilities of central banks of foreign countries.
Deposits include claims on the National Bank of Ukraine, other deposit-
taking corporations that are represented by evidence of deposit. Deposits comprise
transferable deposits and other deposits.
Transferable deposits comprise financial assets that are exchangeable on
demand at par and without penalty or restriction and directly usable for making
payments.
Other deposits comprise non-transferable deposits that cannot be used to
make payments at any time and are only convertible into currency or transferable
deposits subject to a significant restriction or penalty. This subcategory includes
time deposits, savings deposits, demand deposits that are not used directly to make
payments, etc.
Securities other than shares are negotiable instruments serving as evidence
that units have obligations to settle by means of providing cash, a financial
instrument, or some other item of economic value. Some common types of
securities are bonds, treasury bills, promissory notes, deposit certificates of
corporations, etc.
Loans are financial assets that are created when a creditor lends funds
directly to a debtor, and are evidenced by non-negotiable documents. This category
includes all loans and advances – except accounts receivable/payable.
Shares and other equity comprise all instruments and records
acknowledging, after the claims of all creditors have been met, claims on the
residual value of a corporation: shares, investment certificates etc that provide for
participation in the residual value on dissolution of a corporation.

8
Insurance technical reserves consist of net equity of households in life
insurance reserves and pension funds, as well as prepayments of insurance
premiums and reserves against outstanding claims.
Financial derivatives are forward-type contracts (futures, swap agreements)
and options contracts.
Other accounts receivable/payable include trade credit and advances, that
are not included to the category «loans», and other accounts.
Trade credit and advances include amounts receivable/payable in respect of
extended trade credit and advances for work that is in progress and prepayment for
goods and services.
Financial assets and liabilities are classified by institutional sectors of the
economy of creditors and debtors.
Accounting rules Valuation of stocks and flows. Stocks measure the value of non-financial
and financial assets and liabilities at a point in time and are connected with flows.
Flows measure the changes in stocks over a period of time. Stocks data reflect the
value of outstanding amounts of assets and liabilities at the end of the accounting
period. Data on flows reflect transactions, revaluations and other changes in the
volume of assets during the accounting period.
Time of recording. Data on stocks and flows of assets and liabilities are
compiled by the application of accrual basis of accounting. On this basis, revenue
and gains are recognized in the period when they are earned, and expenses and
losses when they are incurred. Accrued income and expenditures under deposits,
credits and securities are included in the outstanding amount of a financial asset or
liability.
Valuation of financial assets. Financial assets are recorded at the prices at
which the assets are acquired or disposed of (at an original value or a fair value).
Bringing of the value of financial assets into line with a fair (market) value is
carried out through their revaluation on the balance sheet date.
Stocks and flows in national and foreign currencies. Stocks and flows
denominated in foreign currency are converted into national currency amounts,
using the official exchange rate of hryvnia versus foreign currencies, determined
by the National Bank of Ukraine on the basis of quotations in the interbank foreign
exchange market of Ukraine during the previous day with taking into account some
other indicators.
Maturity. Financial instruments are classified by the original maturities
during which full repayment of the principal amount and payment of the accrued
interest take place.
Data aggregation and consolidation.
Monetary statistics data are compiled on an aggregated basis. Aggregation
entails the summation of data across all institutional units within a particular sector
(sub-sector) and, for a given sector (sub-sector), the summation of all data within
particular asset or liability category in sectoral balance sheets for financial
corporations.

9
For analytical purposes, the monetary statistics data are consolidated to
obtain the surveys of financial corporations. Consolidation entails the elimination
of the data about financial claims and corresponding obligations that occur
between institutional units within the financial sector of sub-sector covered by a
particular survey.
Monetary statistics data are compiled on a gross basis. It means that claims
on a particular transactor (an institutional unit or a sector) are not netted against the
liabilities to that transactor. However, for analytical purposes, some categories of
data are compiled on a net basis. In the surveys of financial corporations sector and
its sub-sectors, the data about claims on and liabilities to the general government
and non-residents, other assets and other liabilities are netted in the categories «net
claims on general government», «net foreign assets», and «other items (net)».
Special methodological commentary to Section 3
Section 3.1 consists of the Sectoral balance sheet for deposit-taking
corporations (excluding National bank of Ukraine), Sectoral balance sheet for other
financial corporations, National Bank of Ukraine survey, Deposit-taking
corporations survey (excluding National bank of Ukraine), Deposit-taking
corporations survey (including National bank of Ukraine), Other financial
corporations survey, Financial corporations survey and other tables that contain
detailed information across the categories of assets and liabilities of financial
corporations.
Sectoral balance sheets comprise data on outstanding amounts of assets and
liabilities at the end of the accounting period and on financial flows (transactions)
during the accounting period across the categories of assets and liabilities of sub-
sectors of financial corporations sector.
Data on financial transactions are calculating using the following formula:
T = CS – OS – VC – OCVA ,
where T – transactions;
CS – outstanding amounts at the end of accounting period;
OS – outstanding amounts at the beginning of accounting period;
VC – valuation changes (revaluations);
OCVA – other changes in the volume of assets.
Transactions – financial flows that arise, by mutual agreement between
institutional units, from the creation, liquidation, or change in ownership of
financial assets or liabilities. Changes in ownership occur through the sale,
transfer, or other discharge of all rights, obligations, and risks associated with a
financial asset or liability. Data on transaction include the accrued interest for the
period.

10
Valuation changes (revaluations) – financial flows arising from changes in
the prices of financial assets and/or the exchange rates that affect the domestic
currency values of assets and liabilities denominated in foreign currency.
Other changes in the volume of assets – financial flows that arise from asset
changes other than those arising from transactions and revaluations. Included are
write-offs of claims, reclassification of assets or changes that arise from losses of
assets due to their destruction by disasters, etc.
Surveys are an analytical form of presenting the statistical data of the
financial corporations where data of sectoral balance sheets are consolidated into
generalized categories of assets and liabilities and balance sheet identity is
provided.
The National Bank of Ukraine survey comprises data on the liabilities of the
National Bank of Ukraine that are included in the monetary base and underlie the
monetary aggregates. Deposit-taking corporations survey (including National bank
of Ukraine) comprises data on the liabilities of deposit-taking corporations that are
included in the monetary aggregates. The balance sheet identity in Deposit-taking
corporations survey (including National bank of Ukraine) reflects the link of
monetary aggregate M3 and other items with claims of deposit-taking corporations
on residents and non-residents that can be presented as the equation:
Net foreign assets + domestic credit = monetary aggregate М3 + other items
Financial corporations survey is the result of consolidation of three surveys:
National Bank of Ukraine survey, Deposit-taking corporations survey (excluding
National bank of Ukraine), and Other financial corporations survey.
Surveys of financial corporations comprise the following main indicators:
Net foreign assets mean a balance between claims and liabilities of financial
corporations vis-a-vis non-residents. Claims on non-residents are reflected on the
gross basis and include official reserve assets (international reserves) and other less
liquid claims of deposit-taking corporations on non-residents by categories of
financial assets. Liabilities to non-residents are reflected on a gross basis by the
categories of liabilities.
Domestic credit includes net claims of financial corporations on the central
government and claims on other sectors of economy in national and foreign
currencies.
Net claims on the central government are a balance between claims and
liabilities of financial corporations vis-a-vis central government. Claims on the
central government are reflected on a gross basis and include claims under the
investments in government securities, under the loans granted and other accounts
receivable in national and foreign currencies. Liabilities to the central government
are reflected on a gross basis and include liabilities under the funds of the State
Budget, funds of the customers supported at the expense of the State Budget, funds
of the off-budget and special funds, as well as under other accounts payables in
national and foreign currencies.

11
Claims on other residents include the claims of financial corporations under
the loans, investments in securities etc with regard to state and local government,
public and other non-financial corporations, other sectors of the economy
(households and non-profit institutions serving households) in national and foreign
currencies.
Monetary base comprises the National Bank of Ukraine liabilities in national
currency that support the expansion of monetary aggregates and credit of the
economy. Monetary base is not a monetary aggregate, because it is a measure of
the funding base that underlies the monetary aggregates, rather than a monetary
aggregate itself. Monetary base includes the currency issued in circulation by the
National Bank of Ukraine and transferable deposits in national currency with the
National Bank of Ukraine. Currency comprises banknotes and coins issued by the
National Bank of Ukraine, except banknotes and coins in the vaults of the National
Bank of Ukraine, cashier’s desks and ATMs of the institutions of the National
Bank of Ukraine. Transferable deposits include liabilities of the National Bank of
Ukraine under the funds on the correspondent accounts, funds of required reserves
and other funds on demand of other deposit-taking corporations, as well as the
funds on the accounts of other financial corporations, non-financial corporations
and households (employees of the National Bank of Ukraine) in national currency
with the National Bank of Ukraine.
Monetary aggregates consist of certain liabilities of resident deposit-taking
corporations vis-a-vis resident sectors of the economy except general government
and other deposit-taking corporations. Components of monetary aggregates are
financial assets in the form of currency in circulation, transferable deposits, and
securities other than shares that are issued by deposit-taking corporations and
belong, on the ownership right, to other financial corporations, nonfinacial
corporations, households and non-profit institutions serving households. The
National Bank of Ukraine has defined the monetary aggregates М0, М1, М2 and
М3. These aggregates differ with regard to the degree of moneyness of the
financial assets included. Monetary aggregate M0 includes currency in circulation
outside the deposit-taking corporations. Monetary aggregate M1 comprises
monetary aggregate M0 and transferable deposits in national currency. Monetary
aggregate M2 comprises monetary aggregate M1 and transferable deposits in
foreign currency and other deposits. Monetary aggregate M3 (money supply)
comprises monetary aggregate M2 and securities other than shares.
Claims on and liabilities to every sub-sector of deposit-taking corporations
are presented separately in the National Bank of Ukraine Survey and Deposit-
taking corporations survey (excluding National bank of Ukraine) and consolidated
in Deposit-taking corporations survey (including National bank of Ukraine).
Liabilities to other deposit-taking corporations excluded from monetary
base are the sum total of funds of other deposit-taking corporations with the
National Bank of Ukraine in the form of transferable deposits in foreign currency,
other deposits, securities other than shares, and other accounts payable in national
and foreign currencies.
12
Deposits excluded from monetary base are the sum total of funds with the
National Bank of Ukraine in the form of transferable deposits of other financial
corporations in foreign currencies other.
Deposits excluded from monetary aggregate M3 are the sum total of
transferable and other deposits of state and local government in national and
foreign currencies other.
Insurance technical reserves comprise:
net equity of households in life insurance reserves – the reserves of
insurance corporations formed under contracts of life insurance;
net equity of households in life insurance reserves in pension funds – the
funds on individual retirement accounts of participants in pension funds;
prepayment of insurance premiums and reserves against outstanding claims
– the insurance technical reserves formed by insurance corporations under the
contracts other than life insurance.
Shares and other equity in liabilities of financial corporations include funds
contributed by owners, retained earnings, current year result, general and special
reserves, and valuation adjustment.
Other items (net) is a balance between other liabilities and claims not
included in the abovementioned items.
Table 3.1.6 comprises seasonally adjusted time series for monetary
aggregate M3 calculated based on monthly data by using the DEMETRA+
software (version 1.03.2005), which has been developed by the European
Statistical System (ESS), and applying the X-12-ARIMA method.
Table 3.1.9 comprises data on official reserve assets.
Official reserve assets are those foreign assets that are readily available to
and controlled by the National Bank of Ukraine for direct financing of payments
imbalances, for indirectly regulating the magnitudes of such imbalances through
intervention in exchange markets to affect the exchange rate of hryvnia versus
foreign currencies, and/or for other purposes. Official reserve assets are compiled
in accordance with the methodology given in the IMF Manual «International
Reserves and Foreign Currency Liquidity. Guidelines for a Data Template» (2001).
Official reserve assets are claims on non-residents in convertible foreign
currencies and comprise foreign currency reserves, IMF reserve position, special
drawing rights (SDRs), gold and other reserve assets that are available for use by
the National Bank of Ukraine.
Foreign currency reserves comprise cash in convertible foreign currencies
and claims of the National Bank of Ukraine on non-residents in the form of short-
term deposits in convertible foreign currencies (except deposits in gold), and
securities issued by non-residents.
IMF reserve position are claims of an IMF member on the IMF that are
determined as a difference between the quota and IMF holdings in its (member’s)
currency minus the IMF holdings received by the member-country as IMF loans
and balances on the IMF account No.2 which does not exceed 0.1% of the
member’s quota. The IMF reserve position is a part of the member’s international
reserves.

13
Special drawing rights (SDRs) are Ukraine’s assets within the special
drawing rights that are held on the account of the National Bank of Ukraine with
the IMF Treasury.
Gold is monetary gold placed with foreign banks and held in the vault of the
State Treasury of the National Bank of Ukraine. Monetary gold is high-fineness
gold in the form of coins, bullions, or bars of not less than 995 fineness, belonging
to the National Bank of Ukraine. The weight of gold is defined in troy ounces. One
troy ounce equals 31,103480 g.
The data (except gold and SDRs) in the US dollars are valued at the cross
rates of foreign currencies against the US dollar, that are calculated with the use of
the official exchange rate of hryvnia versus foreign currencies specified by the
National Bank of Ukraine at the end of the period.
Tables of Section 3.2 comprise data on deposits held with deposit-taking
corporations (excluding National bank of Ukraine) by resident sectors and non-
residents.
Tables of subsections 3.2.1 – 3.2.4 reflect data on deposits of residents
(except deposit-taking corporations) by sectors of the economy, original maturities
and currencies. Moreover, deposits of non-financial corporations are classified by
types of industry.
Tables of subsection 3.2.5 – 3.2.6 include data on deposits of deposit-taking
corporations (excluding National bank of Ukraine) and non-residents by original
maturities and currencies.
Deposits are classified by the following maturities: on demand, up to one
year, over one year and up to two years, over two years.
Data source is the monthly statistical reporting about liabilities under
attracted deposits that is provided to the National Bank of Ukraine.
Tables of Section 3.3 comprise data on loans granted by deposit-taking
corporations (excluding National bank of Ukraine) to resident sectors and non-
residents.
Tables of subsections 3.3.1 – 3.3.5 contain data on loans granted to residents
(except deposit-taking corporations) by sectors of the economy, original maturities
and currencies.
Loans granted to non-financial corporations are classified by types of
industry. Moreover, loans granted to non-financial corporations are classified with
regard to the purpose of their use as commercial real estate loans and other
lending.
Loans granted to households are classified with regard to the purpose of
their use as consumer credits, lending for house purchase (residential real estate
loans – loans granted for the purpose of investing in housing, including building
and home improvements) and other lending (loans granted for the purpose of
business, education, etc.).
Moreover, mortgage credits granted to non-financial corporations and
households are recorded.

14
Tables of subsection 3.3.6 include data on loans granted to deposit-taking
corporations (except deposit-taking corporations) by original maturities and
currencies.
Tables of subsection 3.3.7 include data on the loans granted to non-residents,
including to non-resident customers, except non-resident deposit-taking
corporations, by original maturities and currencies. Table 3.3.7.3 gives
geographical distribution of loans granted to non-residents.
Loans are classified by the following maturities: up to one year, over one
year and up to five years, over five years. Moreover, real estate loans to households
are classified by the following maturities: over five years and up to ten years, and
over ten years.
Data source is the monthly statistical reporting about claims under loans
granted, that is provided to the National Bank of Ukraine.
Tables of section 3.4 include data on securities in the portfolio of deposit-
taking corporations (excluding National bank of Ukraine) that have been issued by
resident sectors (excluding deposit-taking corporations) and non-residents.
Tables of subsection 3.4.1 reflect data on securities other than shares issued
by residents (except deposit-taking corporations) that are held in the portfolio
(tradable securities other than shares, securities other than shares available for sale,
held-to-maturity securities other than shares) by sectors of the issuer, original
maturities and currencies.
Subsection 3.4.2 comprises data on securities other than shares issued by
deposit-taking corporations (excluding National bank of Ukraine) and non-
residents by maturities.
Securities other than shares are classified by the following maturities: on
demand, up to one year, over one year and up to two years, over two years.
Tables of subsection 3.4.3 include data on shares and other equity that are
held in the portfolio (tradable shares, shares available for sale, equity investments
in associates and subsidiaries) by sectors of the issuer.
Data source is the monthly statistical reporting about the securities portfolio
that is provided to the National Bank of Ukraine.
Section 4. Financial Markets
Tables of section 4.1 comprise data about average weighted interest rates
and new business volumes on loans extended by and deposits placed with deposit-
taking corporations (excluding National bank of Ukraine) during the reference
period, including data on primary agreements concluded during the reporting
period as well as additional agreements under which a change occurred either in
the amount or the interest rate, or the amount and the interest rate.
Tables of section 4.1.1 present data about all average weighted interest rates
that deposit-taking corporations (excluding National bank of Ukraine) apply to
loans vis-à-vis residents (except deposit-taking corporations) by sectors of the

15
economy, original maturities, currencies, types of industry, purpose of their use,
and non-residents (except deposit-taking corporations).
Interest rates on loans are calculated as a weighted average (by
corresponding business volume on loans, including «rolled over» or renewed
loans) of interest rates for each type of borrower, maturity and currency,
percentages per annum, using the following formula:
ViViPik ,
where k – weighted average interest rate on loans;
Pi – interest rate and other income (commissions) for i-loan
agreement;
Vi – new business volume for i-loan agreement.
Tables of subsection 4.1.2 give data about all average weighted interest rates
that deposit-taking corporations (excluding National bank of Ukraine) apply to
deposits vis-à-vis residents (except deposit-taking corporations) by sectors of the
economy, original maturities, currencies, and non-residents (except deposit-taking
corporations). Interest rates on deposits are calculated as a weighted average (by
corresponding business volume on deposits) of interest rates for each type of
depositor, maturity and currency, percentages per annum, using the following
formula:
VjVjPjd ,
where d – weighted average interest rate on deposit;
Pj – interest rate for j-deposit agreement;
Vj – new business volume for j-deposit agreement.
Data source is monthly statistical reporting of the banks of Ukraine on
amounts and interest rates on new business loans and deposits that is provided to
the National Bank of Ukraine.
Tables of subsection 4.2 comprise data about money market interest rates
and new business volumes on loans extended by and deposits placed during the
reference period at the interbank market by maturities. Money market interest rates
are calculated as a weighted average of interest rates by corresponding business
volumes under agreements between banks. Data source is monthly statistical
reporting of the banks of Ukraine on amounts and interest rates on new business
loans and deposits that is provided to the National Bank of Ukraine.
Tables of subsection 4.3 comprise data on yields on government securities
placed on the primary market as well as data about the volumes of transactions on

16
the government securities allocation on the open market. The data cover all the
government bonds with maturity of up to 1 year, 2 years, 3 years, 4 years and 5
years.
Average weighted yield means yield, under which uncompetitive bids are
accepted, and that is calculated as the average weighted value based on the yield
levels of securities and on the number of their acquisition on competitive bids that
are accepted. Yield in the primary market is set by the Ministry of Finance of
Ukraine on the basis of banks’ bids coming to the auctions from participants of
securities allocation.
Table of section 4.4 comprises data of the PFTS Stock Exchange (First
Stock Exchange Trading System) with regard to the major indicator of Ukrainian
capital market development, official indicator of the stock exchange – PFTS index,
for the last working day of the reporting month (year) and turnover for the
reporting month (year). The PFTS index is calculated by the results of trades with
ordinary shares of enterprises accepted for circulation in the PFTS. The base
period, since which the PFTS index is calculated, is 1 October, 1997.
Section 5. Exchange Rates
Tables of section 5 provide the official exchange rate of hryvnia against
foreign currencies determined by the National Bank of Ukraine, end- and average-
period.
Official exchange rate of hryvnia against foreign currencies is the rate of the
national monetary unit, the hryvnia, officially set by the National Bank of Ukraine
versus every of foreign currencies. It is determined according to the rate defined as
average weighted exchange rate of seller and customer at the interbank foreign
exchange market of Ukraine, for the previous working day with possible deviation
±2% as well as other indicators.
Section 6. Some Data on Deposit-taking corporations
(except the National Bank of Ukraine)
Tables of section 6 include information about the number of banks of
Ukraine, that are covered in the sector of deposit-taking corporations (except
National Bank of Ukraine), the number of their branches and subsidiary
companies, that operate in Ukraine and outside of it, the average number of
employees and other data on the registered banks of Ukraine, information about the
banks in liquidation as well as data on Financial Soundness Indicators.
Table 6.4 comprises data on Financial Soundness Indicators of deposit-
taking corporations (except National Bank of Ukraine), including 12 core and 12
encouraged FSIs, that are compiled in compliance with the methodology set forth
in the Financial Soundness Indicators: Compilation Guide (IMF, 2006), on the
basis of monetary statistics and bank supervision data.

17
Technical notes
1. The annual growth rate at for month t, i.e. change in the 12-months
ending in month t, is calculated using of the following formula:
100111
0 1i it
it
t
LL
a , де Lt – outstanding amounts at the end of month t.
2. Data on transactions are calculating using the following formula:
T = CS – OS – VC – OCVA ,
where T – transactions;
CS – outstanding amounts on balance sheet accounts at the end of
accounting period;
OS – outstanding amounts on balance sheet accounts at the beginning of
accounting period;
VC – valuation changes (revaluations);
OCVA – other changes in the volume of assets.
For financial assets in national and foreign currencies that are affected by
price changes and/or exchange rates changes, data on valuation changes
(revaluations) VC are calculating using the following formula:
VC = RA1 – RA0 ,
where RA1 – outstanding amounts on balance sheet revaluation accounts at the end
of accounting period;
RA0 – outstanding amounts on balance sheet revaluation accounts at the
beginning of accounting period.
For financial assets denominated in foreign currency that are affected by
exchange rates changes, data on valuation changes (revaluations) VC are
calculating based on the data on stocks and exchange rates for each code of foreign
currency using the formula:
k
i
iMii
i
Mii
i
Mi OCVAеOSe
eCS
e
eVC
1 01
)1()1()1( ,
where е0 – exchange rate at the beginning of the period;
e1 – exchange rate at the end of the period;
eM – average exchange rate for the period;
i – code of foreign currency.
18
Exchange rates for each code of foreign currency at the beginning and at the
end of period are defined using the official exchange rate of hryvnia against
foreign currencies determined by the National Bank of Ukraine versus each of
foreign currencies.
The average exchange rate for each foreign currency is calculated as the
average value of foreign currency expressed in the national currency over a period.
Data on other changes in the volume of assets OCVA are reflected in case of
changes which occur over a period because of reclassification of assets or changes
that arise from losses of assets due to their destruction by disasters, etc. Because of
events cause these changes are rare, it is assumed that the other changes in the
volume of assets OCVA = 0.