key performance indicators - alamance community...
TRANSCRIPT

KEY PERFORMANCE
INDICATORS
November 2013
Institutional Effectiveness / Strategic Planning

i
TABLE OF CONTENTS
I. ENROLLMENT DATA Annual Unduplicated Headcount ________________________________________ 1 Annual ACC FTE _____________________________________________________ 2 Curriculum FTE: Fall and Spring Terms____________________________________ 3 Fall to Fall Retention _________________________________________________ 4 Curriculum Enrollment by Age __________________________________________ 5 Curriculum Enrollment by Ethnicity ______________________________________ 6 Curriculum Enrollment by Gender _______________________________________ 7 Curriculum Enrollment by Residence _____________________________________ 8 Curriculum Enrollment by Program ______________________________________ 9 Continuing Education Enrollment by Age ________________________________ 13 Continuing Education Enrollment by Ethnicity ____________________________ 14 Continuing Education Enrollment by Gender _____________________________ 15 Continuing Education Enrollment by Residence ___________________________ 16 Curriculum Student Completion _______________________________________ 17 Percent of Curriculum Students Receiving Financial Aid _____________________ 18 Percent of ABSS Curriculum Students Requiring Developmental Education _____ 19
II. STUDENT SATISFACTION Satisfaction with Programs/College _____________________________________ 20 Satisfaction with Services _____________________________________________ 21
III. STUDENT GOAL ATTAINMENT Goals for Attending _________________________________________________ 22 Accomplished Goals _________________________________________________ 23
IV. EMPLOYERS’ SATISFACTION WITH GRADUATES Employer Satisfaction ________________________________________________ 24
V. VALUE ADDED TO THE COMMUNITY Continuing Education FTE Comparison __________________________________ 25 Business & Industry Comparison _______________________________________ 26 Foundation and Grants Comparison ____________________________________ 27 Percent of Adult Population Served _____________________________________ 28 Number of External Events Hosted by College ____________________________ 29

ii
VI. STATE PERFORMANCE MEASURES Basic Skills Progress _________________________________________________ 30 GED Passage Rates __________________________________________________ 30 Developmental English subsequent success ______________________________ 30 Developmental Math subsequent success _______________________________ 30 Year One Progress __________________________________________________ 30 Curriculum Completion Rates _________________________________________ 30 Licensure Pass Rates_________________________________________________ 30 Transfer Performance _______________________________________________ 30
VII. EFFECTIVE USE OF PHYSICAL, FINANCIAL & HUMAN RESOURCES State Budget Summary Accounts to Include Percent of Budget in Personnel ____ 31 Full-time Employee Data _____________________________________________ 32 Operating Loss Data _________________________________________________ 33 Square Feet of Academic Facilities per FTE Student ________________________ 34 Employee Demographics _____________________________________________ 35 Number of Course Sections by Term and Annually _________________________ 36 Average Class Size __________________________________________________ 37 Overall Percent of Classes Taught by Full-time, Part-time ___________________ 38
Key Performance Indicators | 1
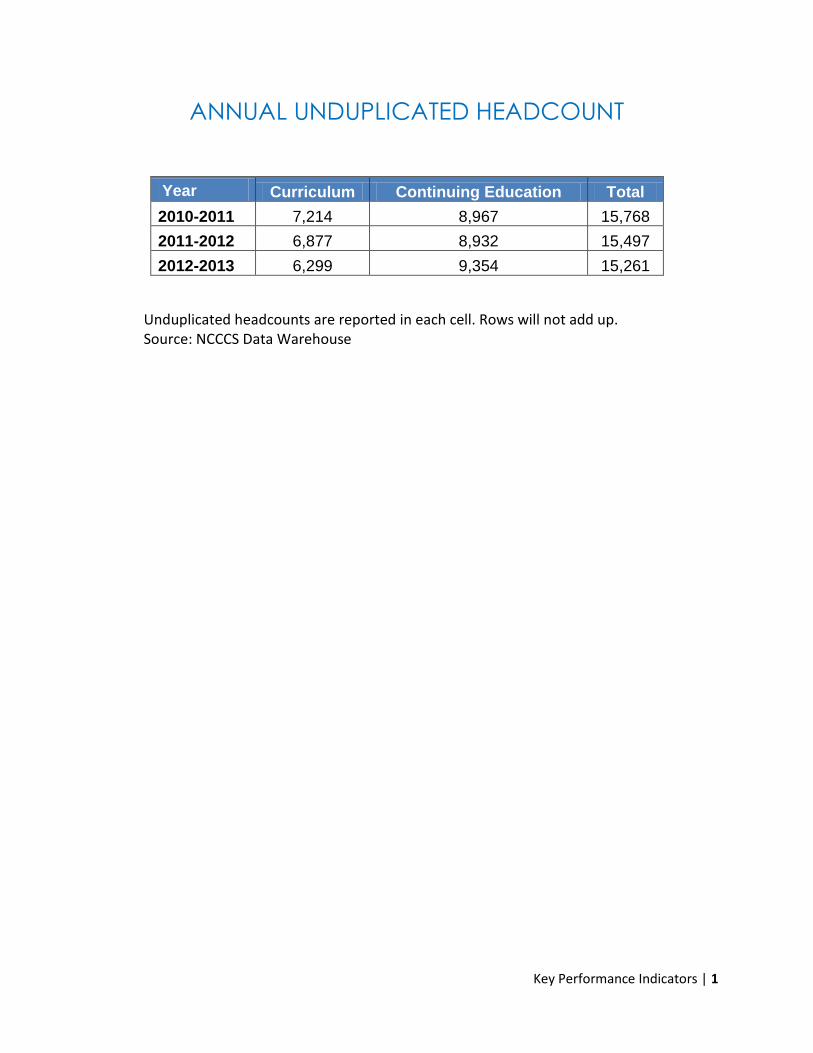
ANNUAL UNDUPLICATED HEADCOUNT
Year Curriculum Continuing Education Total
2010-2011 7,214 8,967 15,768
2011-2012 6,877 8,932 15,497
2012-2013 6,299 9,354 15,261
Unduplicated headcounts are reported in each cell. Rows will not add up. Source: NCCCS Data Warehouse

Key Performance Indicators | 2
ANNUAL ACC FTE
2007-2008 – 2012-2013
2007-08 2008-09 2009-10 2010-11 2011-12 2012-13
Curriculum (Fall, Spring)
3,176 3,547 4,198 4,207 3,903 3,535
Continuing Ed (Spring, Summer, Fall)
695 750 860 790 774 716
Total 3,871 4,297 5,058 4,997 4,677 4,251
Source: NCCCS Data Warehouse
3871
4297
5058 4997 4677
4251
0
1000
2000
3000
4000
5000
6000
2007-08 2008-09 2009-10 2010-11 2011-12 2012-13
Annual College Total FTE
Key Performance Indicators | 3
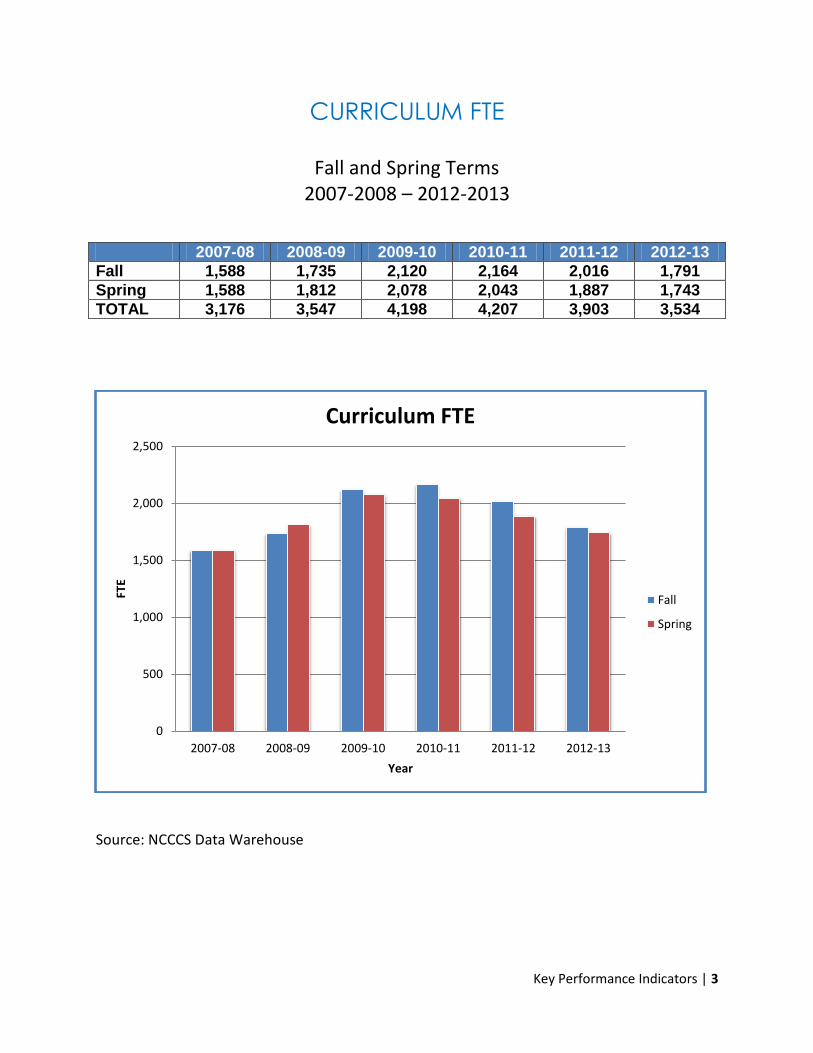
CURRICULUM FTE
Fall and Spring Terms
2007-2008 – 2012-2013
2007-08 2008-09 2009-10 2010-11 2011-12 2012-13
Fall 1,588 1,735 2,120 2,164 2,016 1,791
Spring 1,588 1,812 2,078 2,043 1,887 1,743
TOTAL 3,176 3,547 4,198 4,207 3,903 3,534
Source: NCCCS Data Warehouse
0
500
1,000
1,500
2,000
2,500
2007-08 2008-09 2009-10 2010-11 2011-12 2012-13
FTE
Year
Curriculum FTE
Fall
Spring
Key Performance Indicators | 4
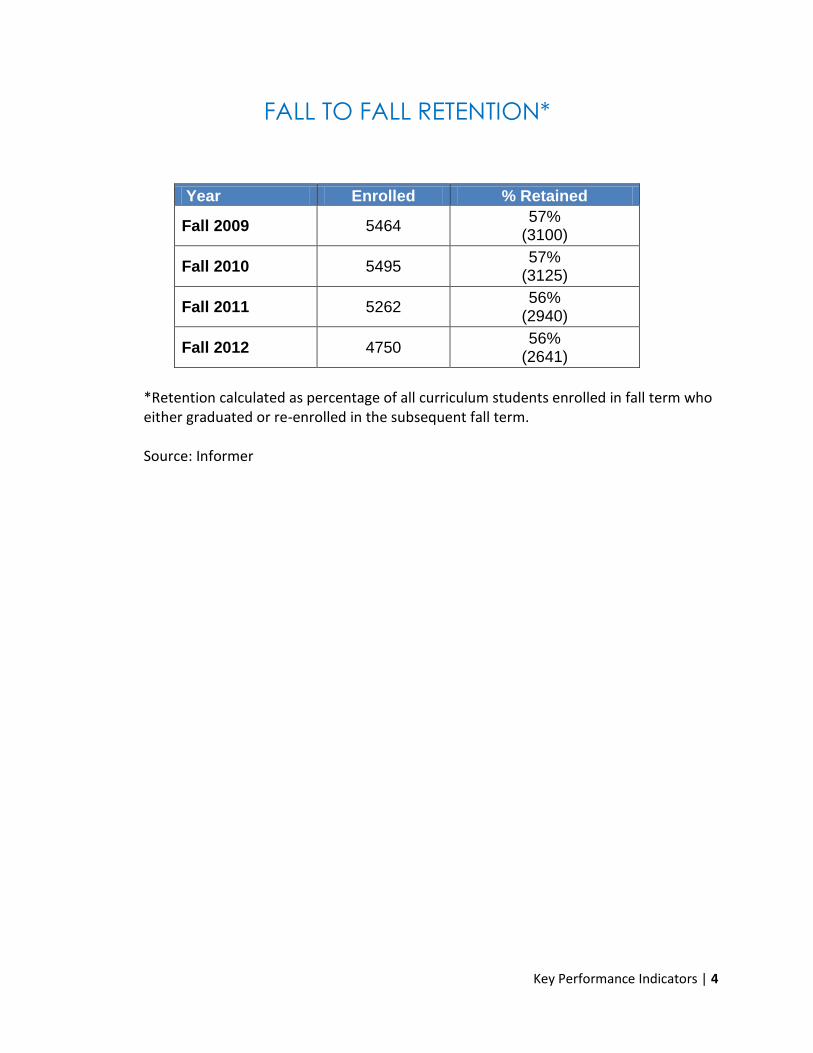
FALL TO FALL RETENTION*
Year Enrolled % Retained
Fall 2009 5464 57%
(3100)
Fall 2010 5495 57%
(3125)
Fall 2011 5262 56%
(2940)
Fall 2012 4750 56%
(2641)
*Retention calculated as percentage of all curriculum students enrolled in fall term who either graduated or re-enrolled in the subsequent fall term.
Source: Informer

Key Performance Indicators | 5
CURRICULUM ENROLLMENT BY AGE
Fall 2008-2012

Key Performance Indicators | 6
CURRICULUM ENROLLMENT BY ETHNICITY
Fall 2008-2012

Key Performance Indicators | 7
CURRICULUM ENROLLMENT BY GENDER
Fall 2008-2012

Key Performance Indicators | 8
CURRICULUM ENROLLMENT BY RESIDENCE
Fall 2008-2012
Key Performance Indicators | 9
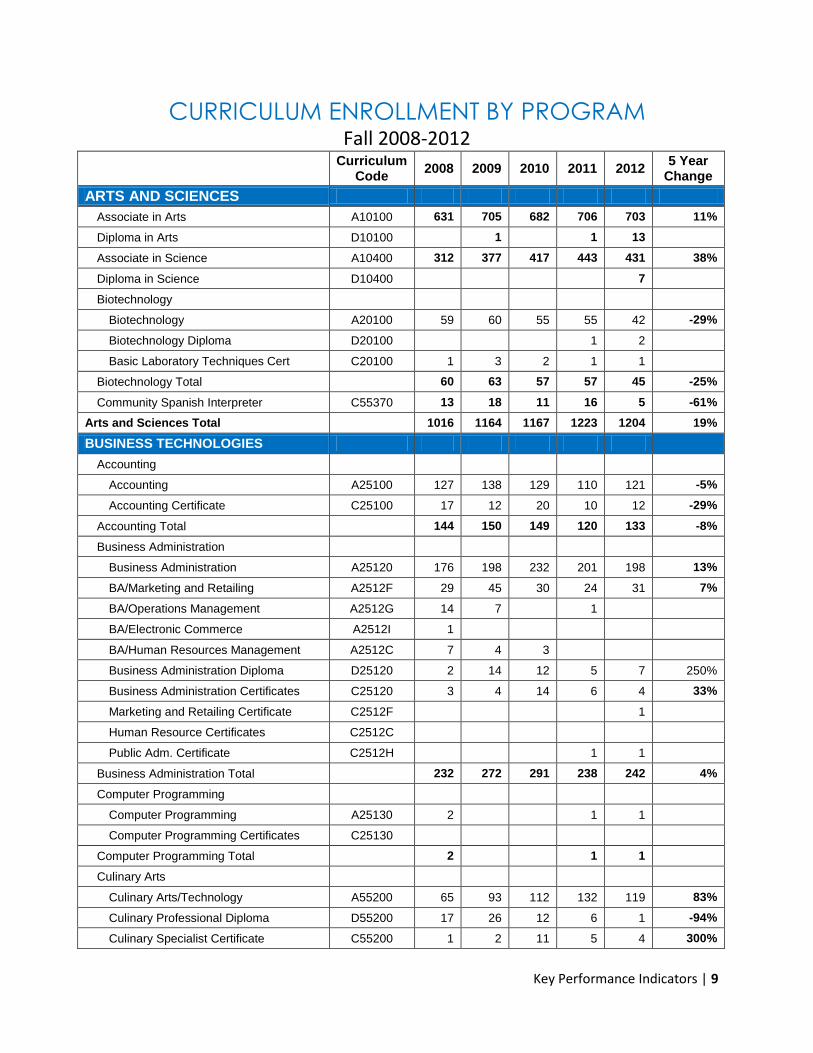
CURRICULUM ENROLLMENT BY PROGRAM Fall 2008-2012
Curriculum
Code 2008 2009 2010 2011 2012
5 Year Change
ARTS AND SCIENCES
Associate in Arts A10100 631 705 682 706 703 11%
Diploma in Arts D10100 1 1 13
Associate in Science A10400 312 377 417 443 431 38%
Diploma in Science D10400 7
Biotechnology
Biotechnology A20100 59 60 55 55 42 -29%
Biotechnology Diploma D20100 1 2
Basic Laboratory Techniques Cert C20100 1 3 2 1 1
Biotechnology Total
60 63 57 57 45 -25%
Community Spanish Interpreter C55370 13 18 11 16 5 -61%
Arts and Sciences Total
1016 1164 1167 1223 1204 19%
BUSINESS TECHNOLOGIES
Accounting
Accounting A25100 127 138 129 110 121 -5%
Accounting Certificate C25100 17 12 20 10 12 -29%
Accounting Total
144 150 149 120 133 -8%
Business Administration
Business Administration A25120 176 198 232 201 198 13%
BA/Marketing and Retailing A2512F 29 45 30 24 31 7%
BA/Operations Management A2512G 14 7 1
BA/Electronic Commerce A2512I 1
BA/Human Resources Management A2512C 7 4 3
Business Administration Diploma D25120 2 14 12 5 7 250%
Business Administration Certificates C25120 3 4 14 6 4 33%
Marketing and Retailing Certificate C2512F 1
Human Resource Certificates C2512C
Public Adm. Certificate C2512H 1 1
Business Administration Total
232 272 291 238 242 4%
Computer Programming
Computer Programming A25130 2 1 1
Computer Programming Certificates C25130
Computer Programming Total
2 1 1
Culinary Arts
Culinary Arts/Technology A55200 65 93 112 132 119 83%
Culinary Professional Diploma D55200 17 26 12 6 1 -94%
Culinary Specialist Certificate C55200 1 2 11 5 4 300%

Key Performance Indicators | 10
Culinary Arts Total
83 121 135 143 124 49%
Computer Information Technology
Computer Information Technology A25260 72 82 90 91 86 19%
Network Administration and Support A2526D 4 2 1 1 1 -75%
Computer Information Diploma D25260 5 15 16 15 10 100%
Computer Information Certificates C25260 2 2 1 4 4 100%
Computer Information Technology Total
79 101 108 111 101 28%
Medical Office Administration
Medical Office Administration A25310 115 200 229 201 162 41%
Medical Office Administration Certs. C25310 48 56 35 31 16 -66%
Medical Office Administration Total
163 256 264 232 178 9%
Networking Technology
Networking Technology A25340 27 26 31 25 21 -22%
Networking Technology Certificate C25340 2 3 1
Networking Technology Total
29 26 34 25 22 -24%
Office Administration/ Systems Technology
Office Administration/ Systems Technology
A25360/70 34 50 43 48 27 -21%
Office Admin/ Systems Tech. - Legal Option A2536/7A 16 17 18 15 19 19%
General Office Diploma D25360/70 6 14 8 6
Office Systems Certificates C25360 2 1 1
Office Systems/Legal Certificates C2536A
Office Systems Technology Total
56 83 70 64 52 -7%
Web Technologies
Web Technologies A25290 20 21 15 18 22 10%
Web Technologies Certificates C25290 2 9 4 3
Web Technologies Total
22 30 19 18 25 14%
Business Technologies Total
825 1043 1070 952 878 6%
HEALTH AND PUBLIC SERVICES
Animal Care and Management Tech.
Animal Care and Mgmt. Tech. A55100 51 73 91 104 80 57%
Animal Care and Mgmt. Diploma D55100 2 7 11 17 23 1050%
Animal Care and Mgmt. Certs. C55100 1 4 4 4 5 400%
Animal Care and Mgmt. Tech. Total
54 84 106 125 108 100%
Associate Degree Nursing A45110 115 112 110 103 107 -7%
Cosmetology
Cosmetology D55140 72 87 71 81 32 -56%
Cosmetology Certificate C55140 6 3 8 11 28 367%
Cosmetology Instructor Certificate C55160 2 3
Cosmetology Total
80 93 79 92 60 -25%
Criminal Justice Technology
Criminal Justice Technology A55180 114 148 184 152 170 49%

Key Performance Indicators | 11
Basic Law Enforcement Training Cert. C55120 2 1
Criminal Justice Technology C55180 15
Criminal Justice Technology Total
116 149 184 152 185 59%
Dental Assisting D45240 37 56 43 52 43 16%
Early Childhood
Early Childhood A55220 226 245 238 212 202 -11%
Early Childhood Diploma D55220 25 22 19 17 14 -44%
Early Childhood Certificate C55220 33 16 9 12 17 -48%
Early Childhood Total
284 283 266 241 233 -18%
Fire Protection Technology
Fire Protection Diploma D55240 21 23 27 21 20 -5%
Fire Protection Certificate C55240 4 4 6
Fire Protection Technology Total
31 25 26
Medical Assisting
Medical Assisting A45400 41 99 91 43 48 17%
Certified Medical Assistant C45400 8 14 1 1
Medical Assisting Total
49 113 92 43 49 0%
Medical Laboratory Technology A45420 67 92 109 60 31 -54%
Nursing Assistant C45480 49 38 27 43 32 -35%
Health and Public Services Total
872 1043 1047 936 874 .2%
INDUSTRIAL AND GRAPHICS TECHNOLGIES
Advertising and Graphic Design
Advertising and Graphic Design A30100 70 52 73 73 63 -10%
Advertising and Graphic Design Certs. C30100 8 4 6 9 223 2688%
Advertising and Graphic Design Total
78 56 79 82 286 267%
Air Condit., Heat., & Refrig. Tech.
Air Condit., Heat., & Refrig. Tech. A35100 47 75 64 63 50 6%
Air Condit., Heat., & Refrig. Diploma D35100 11 10 16 13 11 0%
Air Condit., Heat., & Refrig. Cert. C35100 14 9 15 13 17 21%
Air, Heat., & Refrig. Tech. Total
72 94 95 89 78 8%
Automotive Systems Technology
Automotive Systems Technology A60160 48 75 66 81 89 85%
Automotive Systems Diploma D60160 6 14 14 15 14 133%
Automotive Certificates C60160 4 7 4 2 4 0%
Automotive Systems Tech. Total
58 96 84 98 107 84%
Carpentry
Carpentry D35180 3 7 14 3 8 167%
Carpentry Certificates C35180 1 3 1 1 0%
Carpentry Total
4 10 15 3 9 125%
Horticulture Technology
Horticulture Technology A15240 47 47 42 50 35 -26%

Key Performance Indicators | 12
Horticulture Diplomas D15240 7 8 5 10 4 -43%
Horticulture Certificates C15240 3 1 5 5 9 200%
Horticulture Technology Total
57 56 52 65 48 -16%
Industrial Systems Technology
Industrial Systems Technology A50240 38 48 50 36 28 -26%
Industrial Systems Diploma D50240 5 7 6 2 3 -40%
Industrial Systems Certificates C50240 8 19 17 13 4 -50%
Industrial Systems Technology Total
51 74 73 51 35 -31%
Machining Technology
Machining Technology A50300 29 53 48 40 32 10%
Machining Diploma D50300 5 5 4 7 3 -40%
Machining Certificates C50300 12 10 6 3 3 -75%
Machining Technology Total
46 68 58 50 38 -17%
Mechanical Drafting Technology
Mechanical Drafting Technology A50340 30 28 25 18 21 -30%
Mechanical Drafting Diploma D50340 1 6 4 1 4 300%
Mechanical Drafting/Cad Certificate C50340 6 5 4 5 3 -50%
Mechanical Drafting Tech. Total
37 39 33 24 28 -24%
Welding Technology
Welding Technology A50420 24 60 54 44 45 88%
Welding Diploma D50420 6 8 11 5 10 67%
Welding Certificates C50420 16 13 8 5 14 -13%
Welding Technology Total
46 81 73 54 69 50%
Industrial Management Technology C50260 2
Industrial and Graphics Tech. Total
449 574 562 516 700 56%
GENERAL EDUCATION
Associate in General Education A10300 333 770 859 933 894 168%
General Occupational Technology
General Occupational Technology A55280 242 12 6 1
General Occupational Tech. Diploma D55280 7 1
General Occupational Tech. Total
249 13 6 1
General Education Total
582 783 865 934 894 54%
NON-DEGREE SEEKING
Huskins Bill Students* T90970 455 426 421 381
Dual Enrolled Students T90980 182 78 139 122
CTP- Humanities and Social Science P1012A 29
CTP- Business and Economics P1012B 5
CTP- Engineering and Mathematics P1042B 8
Special Credit Students T90990 356 377 248 208 153 -57%
Non-Degree Seeking Total
993 881 808 711 195 -80%
TOTAL 4737 5488 5519 5272 4745 .17%

Key Performance Indicators | 13
CONTINUING EDUCATION ENROLLMENT BY AGE
2007-2008 – 2012-2013
AGE RANGE* 2007-08 2008-09 2009-10 2010-11 2011-12 2012-13
Under 18 98 79 60 72 68 46
18-20 735 748 691 650 586 586
21-24 802 809 844 880 896 936
25-34 2,052 1,998 1,929 1,872 1954 2124
35-44 2,215 2,242 2,075 1,910 1903 2007
45-54 2,058 2,081 1,814 1,733 1691 1841
55-64 1,322 1,360 1,162 1,114 1041 1097
65-74 562 579 520 535 588 553
75 & Over 207 228 185 201 205 164
Median 40 42 40 40 40 40
Average 41 43 41 41 41 41
Total 10,051 10,124 9,280 8,967 8,932 9,354
Source: NCCCS Data Warehouse
0%
5%
10%
15%
20%
25%
Under 18 18-20 21-24 25-34 35-44 45-54 55-64 65-74 75 & Over
Percentage of CE Students Enrolled by Age 2007-08 -- 2012-13
2007-08 2012-13
Key Performance Indicators | 14
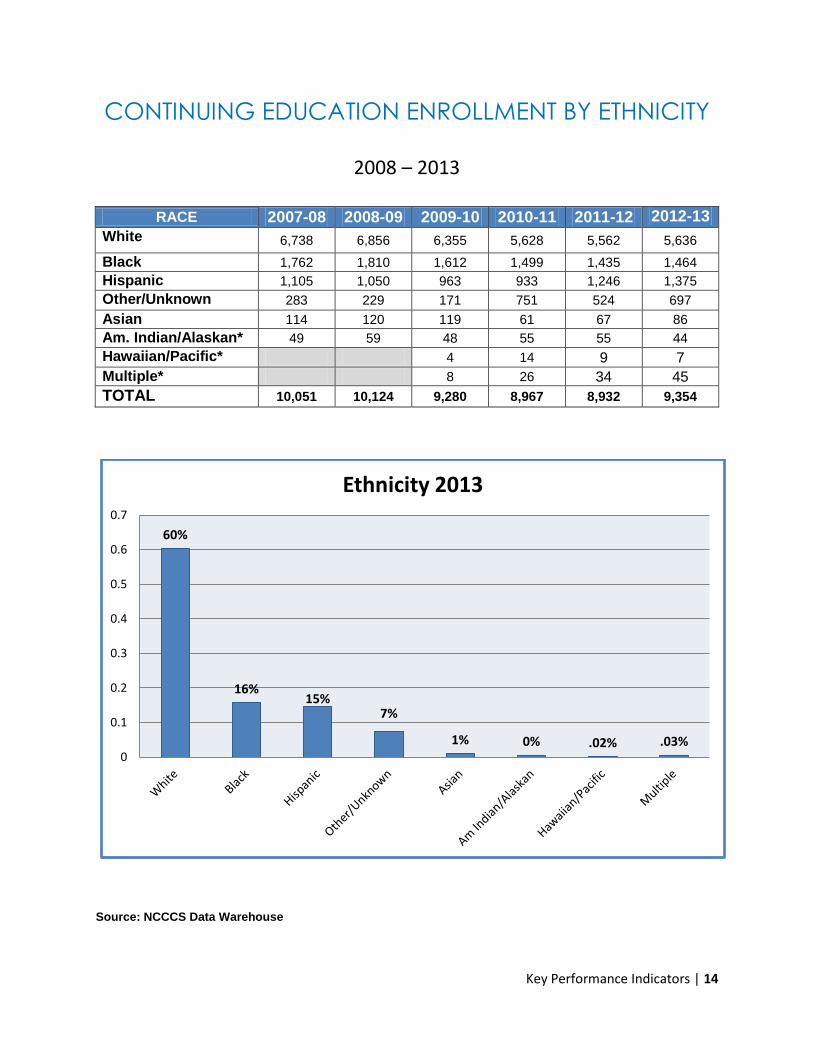
CONTINUING EDUCATION ENROLLMENT BY ETHNICITY
2008 – 2013
RACE 2007-08 2008-09 2009-10 2010-11 2011-12 2012-13
White 6,738 6,856 6,355 5,628 5,562 5,636
Black 1,762 1,810 1,612 1,499 1,435 1,464
Hispanic 1,105 1,050 963 933 1,246 1,375
Other/Unknown 283 229 171 751 524 697
Asian 114 120 119 61 67 86
Am. Indian/Alaskan* 49 59 48 55 55 44
Hawaiian/Pacific* 4 14 9 7
Multiple* 8 26 34 45
TOTAL 10,051 10,124 9,280 8,967 8,932 9,354
Source: NCCCS Data Warehouse
60%
16% 15%
7%
1% 0% .02% .03% 0
0.1
0.2
0.3
0.4
0.5
0.6
0.7
Ethnicity 2013

Key Performance Indicators | 15
CONTINUING EDUCATION ENROLLMENT BY GENDER
2008 – 2013
2007-08 2008-09 2009-10 2010-11 2011-12 2012-13
Female 4,805 4,940 4,332 4,197 4,166 4,487
Male 5,246 5,184 4,948 4,770 4,766 4,867
TOTAL 10,051 10,124 9,280 8,967 8,932 9,354
Source: NCCCS Data Warehouse
48% 49% 47% 47% 47% 48%
52% 51% 53% 53% 53% 52%
0%
10%
20%
30%
40%
50%
60%
70%
80%
90%
100%
2008 2009 2010 2011 2012 2013
Enrollment by Gender 2007-08 -- 2012-13
Male
Female

Key Performance Indicators | 16
CONTINUING EDUCATION ENROLLMENT BY RESIDENCE
2008 – 2013
2007-08 2008-09 2009-10 2010-11 2011-12 2012-13 Alamance County 7,063 7,119 6,474 6,187 6,189 6,393
Orange County 705 745 678 568 521 543
Guilford County 639 699 613 706 678 813
Caswell County 194 173 148 160 132 137
Durham County 300 280 264 251 242 212
Other NC Counties 1,107 1,031 989 1,038 1,099 1,182
Out of State/International 43 77 114 57 71 74
TOTAL 10,051 10,124 9,280 8,967 8,932 9,354
Source: NCCCS Data Warehouse
Out of St/Int, 1%
Alamance, 68%
Orange, 6%
Guilford, 9%
Caswell, 1%
Durham, 2%
All Other, 13% Other NC Co., 31%
CE Enrollment by Residence

Key Performance Indicators | 17
CURRICULUM STUDENT COMPLETION
Source: NCCCS 2013 Performance Measures for Student Success

Key Performance Indicators | 18
PERCENT OF CURRICULUM STUDENTS
RECEIVING FINANCIAL AID
2010-2011: 6831* / 4096** = 60% 2011-2012: 6500* / 4288** = 66% 2012-2013: 5830* / 3937** = 67%
*Unduplicated academic year headcount (from ICIR report) minus Career and College Promise students. **Unduplicated academic year headcount awarded financial aid from all sources (federal, Veterans Administration, state, foundation, other private scholarships, loans) minus Career and College Promise students.

Key Performance Indicators | 19
PERCENT OF ABSS CURRICULUM STUDENTS
REQUIRING DEVELOPMENTAL EDUCATION
2010 – 2012
2010
212 graduates enrolled
54 took Compass and placed into ENG 111 25%
2 used ACT and placed into ENG 111
1%
49 placed out of Reading using SAT scores
48 placed out of Writing using SAT scores
7 took Compass and placed into College Level Math 3%
2 used ACT to place into College Level Math 1%
31 used SAT to place into College level Math 15%
77% placed into Developmental Math
19% placed out of Developmental Math
4% no testing
2011
294 graduates enrolled
80 took Compass and placed into ENG 111 27%
42 placed out of Reading using SAT scores
34 placed out of Writing using SAT scores
16 took Compass and placed into College Level Math 5%
49 used SAT to place into College level Math 17%
76% placed into Developmental Math
22% placed out of Developmental Math
2% no testing
2012
299 graduates enrolled
42 No Developmental Studies required
14%
255 At least one developmental course
85%
2 did not take placement test
1%
81% placed into Development Math
18% placed out of Development Math
1% no testing

Key Performance Indicators | 20
SATISFACTION WITH PROGRAMS/COLLEGE
2012-13 Completer and Non-Completer Survey Results
As mandated by the state of North Carolina, ACC surveys completing students (graduates) and non-completing students each year to assess their satisfaction with college programs and services. Graduate surveys were completed by 255 of the 638 (40%) students graduating during 2012-13. Non-completer surveys were distributed by mail to all degree-seeking students enrolled in fall 2011 that did not return in fall 2012 and had not graduated during the 2012-13 school year. Surveys were returned by 159 of the 1836 (9%) non-completing students. Table 1 compares satisfaction levels (satisfied or very satisfied) for completers and non-completers over the past three academic years with the current year percentages in bold. The average response rates are 40% for completers (statistically valid) and 9% for non-completers (not statistically valid). This table also includes what percentage stated they would choose ACC if they “were to begin again.”
Table 1. Satisfaction with Programs/College
Satisfaction With ACC Programs
Completers 2012-13
Completers 2011-12
Completers 2010-11
Non-Completers
2012-13
Non-Completers
2011-12
Non-Completers
2010-11
Quality of instruction in program area courses
97% 96% 98% 93% 89% 96%
Quality of instruction in other courses
96% 95% 95% 83% 85% 89%
Overall quality of academic program
97% 95% 98% 90% 87% 95%
Overall quality of the college
96% 97% 97% 93% 92% 96%
Choose ACC if you were to begin again?
86% 83% 88% 80% 77% 87%

Key Performance Indicators | 21
SATISFACTION WITH SERVICES
2012-13 Completer and Non-Completer Survey Results
Completers and non-completers report their satisfaction levels (satisfied or very satisfied) with ACC services. Nine services are included within the surveys and are listed in Table 2.
Table 2. Satisfaction with Services
Satisfaction With ACC Services
Completers 2012-13
Completers 2011-12
Completers 2010-11
Non-Completers 2012-13
Non-Completers 2011-12
Non-Completers 2010-11
Academic advising
88% 88% 90% 71% 69% 81%
Admissions 94% 96% 96% 85% 88% 94%
Bookstore 80% 80% 74% 78% 78% 88%
Campus Security
84% 87% 83% 80% 81% 82%
Financial Aid 79% 80% 78% 52% 56% 58%
Food Service 65% 74% 73% 65% 62% 64%
Learning Resources Center
81% 86% 86% 74% 74% 78%
Registration 96% 96% 97% 89% 85% 91%
Student Activities
81% 80% 80% 59% 63% 65%
RED=5% or more drop GREEN=5% or more increase

Key Performance Indicators | 22
GOALS FOR ATTENDING
2012-13 Completer and Non-Completer Survey Results
When asked to indicate their goals for attending ACC, both completing and non-completing students listed earning a credential most often. The second most prevalent goal for completers was preparing for a new job; for non-completers it was transferring to a four-year college/university. Table 3 lists results for 2010-11 through 2012-13. Table 3. Goals for Attending
Goals for Attending ACC
Completers 2012-13
Completers 2011-12
Completers 2010-11
Non-Completers 2012-13
Non-Completers 2011-12
Non-Completers 2010-11
Earning an associate degree, diploma or certificate
85% 90% 90% 66% 62% 64%
Preparing for/getting a new job
46% 58% 52% 31% 32% 32%
Improving existing job skills
15% 21% 23% 14% 18% 19%
Transferring to a four-year college/university
34% 33% 28% 39% 30% 29%
Personal interest 19% 16% 17% 20% 17% 18%
RED=5% or more drop GREEN=5% or more increase
Key Performance Indicators | 23
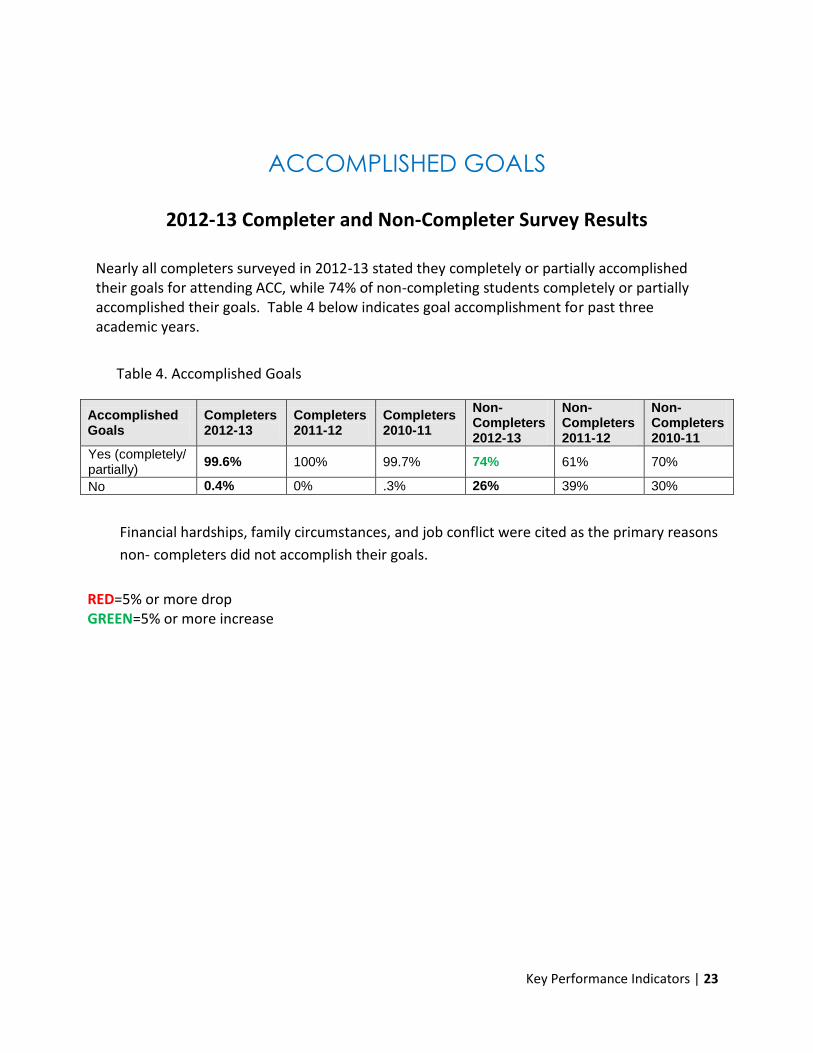
ACCOMPLISHED GOALS
2012-13 Completer and Non-Completer Survey Results
Nearly all completers surveyed in 2012-13 stated they completely or partially accomplished their goals for attending ACC, while 74% of non-completing students completely or partially accomplished their goals. Table 4 below indicates goal accomplishment for past three academic years.
Table 4. Accomplished Goals
Accomplished Goals
Completers 2012-13
Completers 2011-12
Completers 2010-11
Non-Completers 2012-13
Non-Completers 2011-12
Non-Completers 2010-11
Yes (completely/ partially)
99.6% 100% 99.7% 74% 61% 70%
No 0.4% 0% .3% 26% 39% 30%
Financial hardships, family circumstances, and job conflict were cited as the primary reasons
non- completers did not accomplish their goals.
RED=5% or more drop GREEN=5% or more increase

Key Performance Indicators | 24
EMPLOYER SATISFACTION
Program Review: Employer Satisfaction
Average Rating 2010-2012
ACC graduates possess the… 2010-11 Average
2011-12 Average
2012-13 Average
…Entry-level technical skills needed when employed by our firm.
3.46 3.53 3.17
…Entry-level human relations skills needed when employed by our firm.
3.30 3.31 3.00
…Specific job related knowledge needed when employed by our firm.
3.32 3.36 3.08
…Writing and speaking skills needed when employed by our firm.
3.27 3.26 2.92
…Mathematics skills needed when employed by our firm. 3.32 3.36 3.09
…Problem solving skills needed when employed by our firm. 3.34 3.33 3.00
…Organizational and planning skills needed when employed by our firm.
3.36 3.26 2.90
Overall, I am satisfied with the education that ACC graduates received at Alamance Community College.
3.54 3.50 3.00
ACC graduates' program of study at Alamance Community College was up-to-date and current with the needs of the local labor market.
3.45 3.53 3.18
I would gladly hire additional ACC graduates of this program. 3.49 3.60 3.25
N 86 46 12

Key Performance Indicators | 25
CONTINUING EDUCATION FTE COMPARISON
Basic Skills FTE 2010-2011 2011-2012 2012-2013
Alamance CC 354 333 335
Caldwell CC & TI 368 355 327
Davidson CCC 543 494 492
Lenoir CC 429 410 422
Vance-Granville CC 382 424 376
Occupational Extension FTE 2010-2011 2011-2012 2012-2013
Alamance CC 396 390 336
Caldwell CC & TI 552 479 489
Davidson CCC 521 461 413
Lenoir CC 1,014 1,376 1,591
Vance-Granville CC 655 560 615
Community Service FTE 2010-2011 2011-2012 2012-2013
Alamance CC 35 35 32
Caldwell CC & TI 27 33 45
Davidson CCC 16 18 21
Lenoir CC 40 40 26
Vance-Granville CC 27 82 108
B&I and Small Business Center FTE 2010-2011 2011-2012 2012-2013
Alamance CC 6 16 12
Caldwell CC & TI 4 3 2
Davidson CCC 4 6 10
Lenoir CC 60 28 28
Vance-Granville CC 18 16 9
Key Performance Indicators | 26
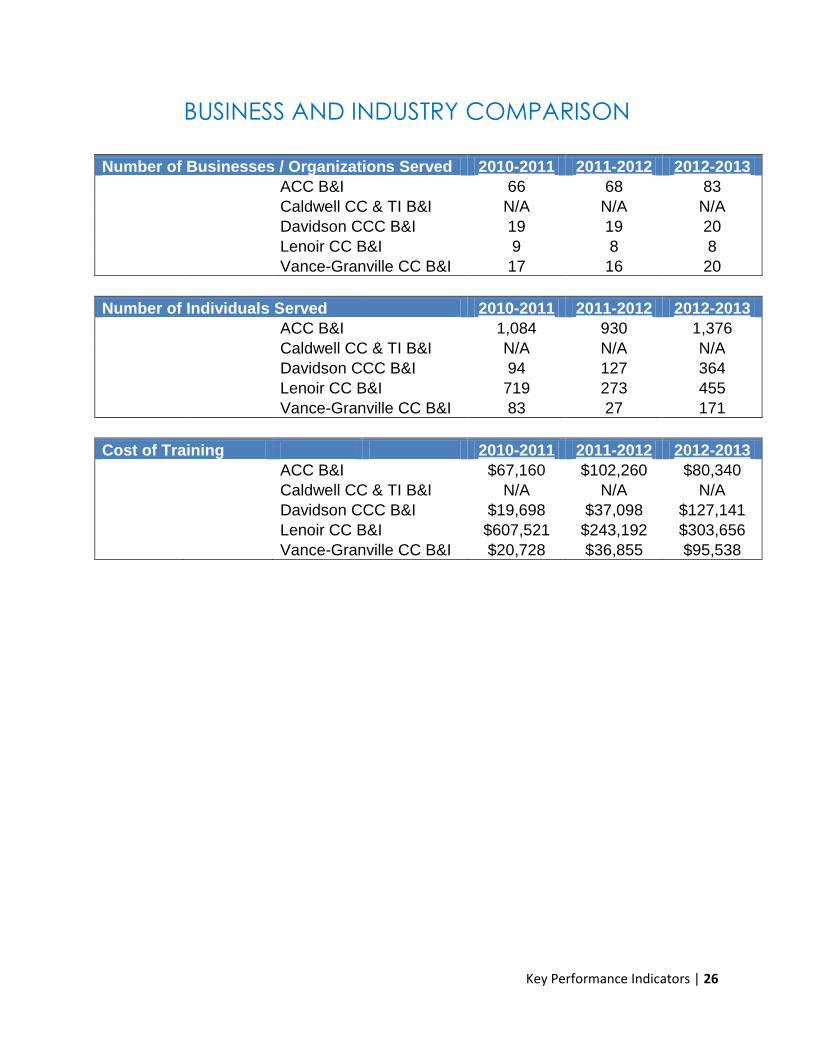
BUSINESS AND INDUSTRY COMPARISON
Number of Businesses / Organizations Served 2010-2011 2011-2012 2012-2013
ACC B&I 66 68 83
Caldwell CC & TI B&I N/A N/A N/A
Davidson CCC B&I 19 19 20
Lenoir CC B&I 9 8 8
Vance-Granville CC B&I 17 16 20
Number of Individuals Served 2010-2011 2011-2012 2012-2013
ACC B&I 1,084 930 1,376
Caldwell CC & TI B&I N/A N/A N/A
Davidson CCC B&I 94 127 364
Lenoir CC B&I 719 273 455
Vance-Granville CC B&I 83 27 171
Cost of Training 2010-2011 2011-2012 2012-2013
ACC B&I $67,160 $102,260 $80,340
Caldwell CC & TI B&I N/A N/A N/A
Davidson CCC B&I $19,698 $37,098 $127,141
Lenoir CC B&I $607,521 $243,192 $303,656
Vance-Granville CC B&I $20,728 $36,855 $95,538

Key Performance Indicators | 27
FOUNDATION AND GRANTS COMPARISON
Endowment Value Comparison $m 6/30/2011 6/30/2012 6/30/2013
ACC Foundation
$7.5 $7.2 $8.4
Caldwell CC & TI Foundation $1.5 $1.6 $1.8
Davidson CCC Foundation $9.4 $9.4 $9.4
Lenoir CC Foundation $2.7 $2.9 $3.1
Vance-Granville CC Foundation $4.4 $4.5
Total Financial Asset Value Comparison $m 6/30/2011 6/30/2012 6/30/2013
ACC Foundation
$8.0 $7.7 $8.9
Caldwell CC & TI Foundation $9.6 $9.7 $10.2
Davidson CCC Foundation $10.5 $12.4 $15.9
Lenoir CC Foundation $3.4 $3.8 $4.1
Vance-Granville CC Foundation $4.1 $4.3
Federal Grant Dollars Received 2010-2011 2011-2012 2012-2013
ACC Foundation
$199,207 $184,638 $74,219
Caldwell CC & TI Foundation n/a n/a n/a
Davidson CCC Foundation $390,505 $2,171,505 $1,041,025
Lenoir CC Foundation Unsure
Vance-Granville CC Foundation Vacation
Non-Federal Grant Dollars Received 2010-2011 2011-2012 2012-2013
ACC Foundation
$287,045 $303,765 $39,875
Caldwell CC & TI Foundation $27,600 $22,055 $47,500
Davidson CCC Foundation $644,320 $561,115 $1,122,860
Lenoir CC Foundation Unsure
Vance-Granville CC Foundation Vacation

Key Performance Indicators | 28
PERCENT OF ADULT POPULATION SERVED
2010-2011 2011-2012 2012-2013
Total FTE
4,985 4,673 4,231
Annual Enrollment 15,768 15,497 15,261
Service Area 18 & Up 115,993 166,674 117,845
Percentage 13.59% 13.28% 12.95%
Key Performance Indicators | 29
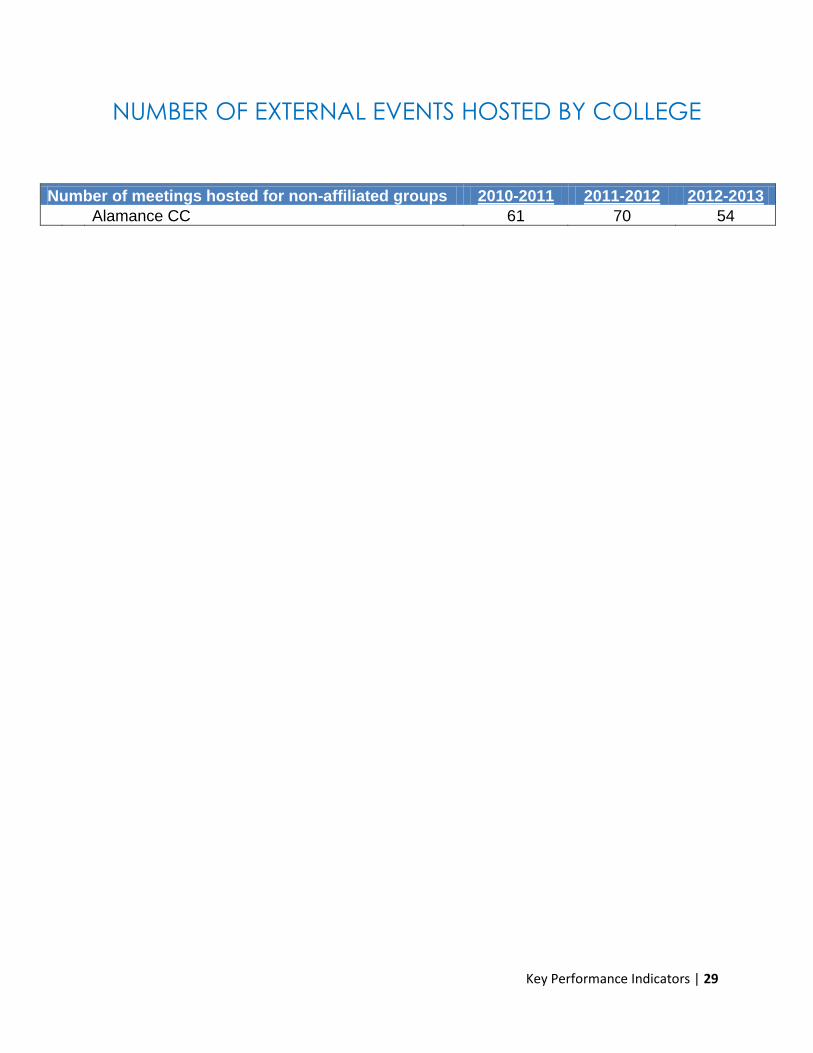
NUMBER OF EXTERNAL EVENTS HOSTED BY COLLEGE
Number of meetings hosted for non-affiliated groups 2010-2011 2011-2012 2012-2013
Alamance CC 61 70 54

Key Performance Indicators | 30
STATE PERFORMANCE MEASURES
Key Performance Indicators | 31
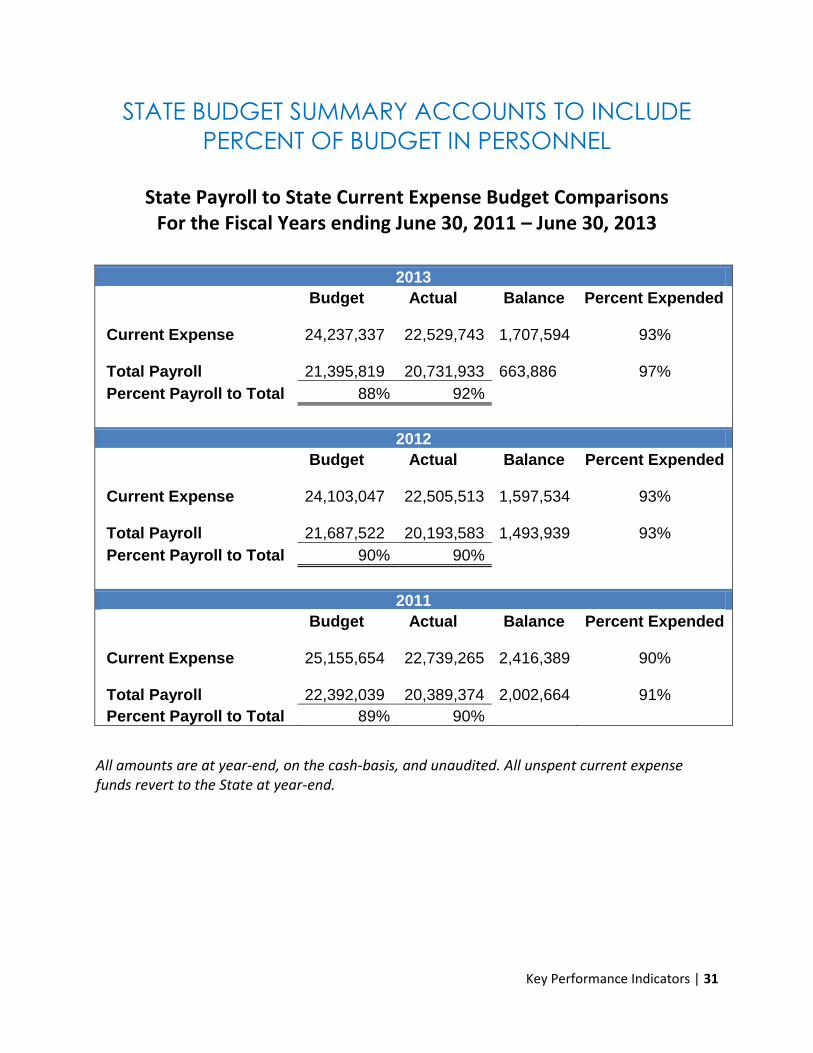
STATE BUDGET SUMMARY ACCOUNTS TO INCLUDE
PERCENT OF BUDGET IN PERSONNEL
State Payroll to State Current Expense Budget Comparisons
For the Fiscal Years ending June 30, 2011 – June 30, 2013
2013
Budget Actual Balance Percent Expended
Current Expense 24,237,337
22,529,743
1,707,594 93%
Total Payroll 21,395,819
20,731,933
663,886 97%
Percent Payroll to Total 88% 92%
2012
Budget Actual Balance Percent Expended
Current Expense 24,103,047
22,505,513
1,597,534 93%
Total Payroll 21,687,522
20,193,583
1,493,939 93%
Percent Payroll to Total 90% 90%
2011
Budget Actual Balance Percent Expended
Current Expense 25,155,654
22,739,265
2,416,389 90%
Total Payroll 22,392,039
20,389,374
2,002,664 91%
Percent Payroll to Total 89% 90%
All amounts are at year-end, on the cash-basis, and unaudited. All unspent current expense funds revert to the State at year-end.

Key Performance Indicators | 32
FULL-TIME EMPLOYEE DATA
For the Fiscal Years ending June 30, 2010 – June 30, 2013
Year Faculty Staff Total
2013 119 103 222
2012 119 106 225
2011 110 108 218
2010 110 105 215

Key Performance Indicators | 33
OPERATING LOSS DATA
For the Fiscal Years ending June 30, 2010 – June 30, 2013
YEAR OPERATING LOSS
2013 (30,511,193)
2012 (30,250,919)
2011 (34,232,257)
2010 (30,406,352)
Amounts shown are reported on the accrual basis in accordance with US generally accepted accounting principles and represent the difference between tuition and fees collected and total operating costs. Operating loss is a good approximation of the College's cost to the taxpayers. State, county, and federal support is considered non-operating income. Figures for 2012 and 2010 have been audited - 2013 and 2011 are unaudited.

Key Performance Indicators | 34
SQUARE FEET OF ACADEMIC FACILITIES
PER FTE STUDENT
The ratio of an institution’s square footage of academic facilities to its full-time equivalent enrollment represents an important index of the instructional utilization of campus facilities. It was first used by the U.S. Office of Education as a planning standard in the 1960s. In 1969, the Office of Education published an extensive study entitled Federal Support for Higher Education Construction: Current Programs and Future Needs which provided normative figures by level and control of institution. The figures, which are still widely used in determining facilities’ needs, can be summarized as follows:
Institutional Level Public Private Total
University 132 150 136
Four-year 93 103 98
Two-year 70 75 70
All institutions 103 115 107
There is currently much national interest in updating these norms through a new national survey of higher education facilities. Table 2. Square Feet of Academic Facilities per FTE Student
Institution ASF of
Academic Facilities FTE
Enrollment Square Feet of Academic Facilities
per FTE Student
2012 2011 2010 2009 2008
Alamance CC 216,405 3,582 60 57 59 57 71
Subtotal 14,650,164 192,820 76 85 82 83 93

Key Performance Indicators | 35
EMPLOYEE DEMOGRAPHICS
Key Performance Indicators | 36
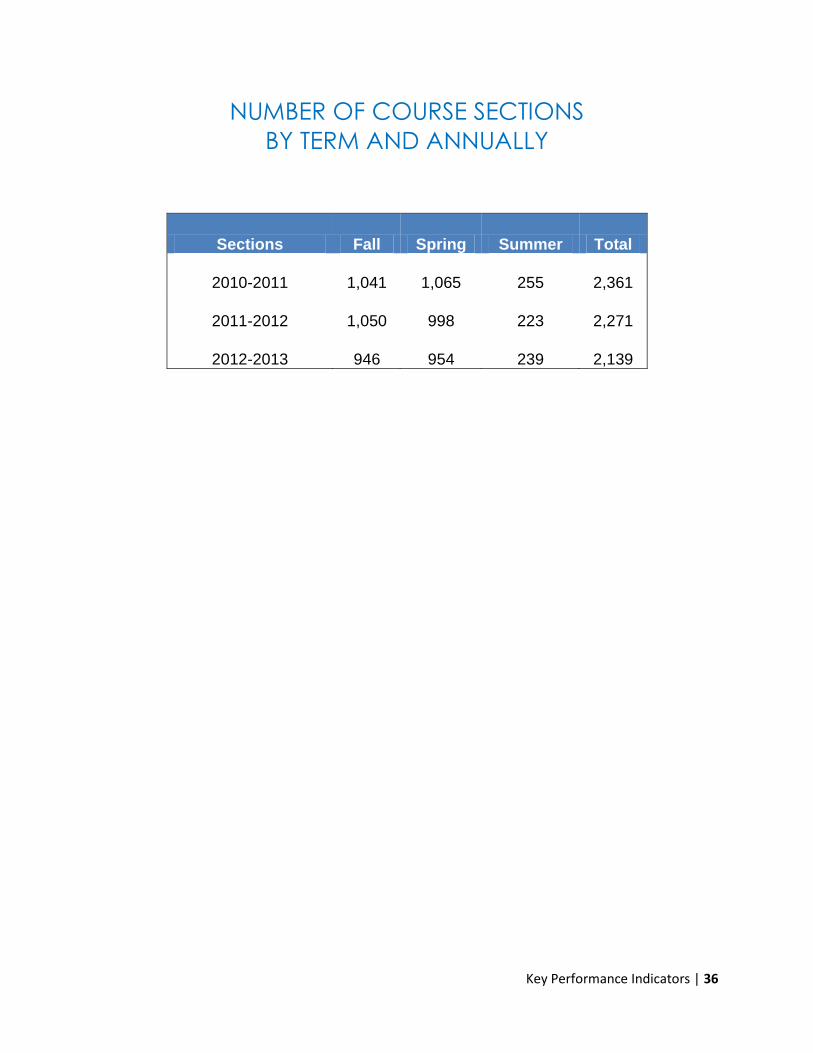
NUMBER OF COURSE SECTIONS
BY TERM AND ANNUALLY
Sections Fall Spring Summer Total
2010-2011 1,041 1,065 255 2,361
2011-2012 1,050 998 223 2,271
2012-2013 946 954 239 2,139

Key Performance Indicators | 37
AVERAGE CLASS SIZE
Year Fall Spring Summer
2010-2011 14 13 13
2011-2012 13 12 12
2012-2013 13 12 11

Key Performance Indicators | 38
OVERALL PERCENT OF CLASSES TAUGHT
BY FULL-TIME AND PART-TIME
Spring 2012
Delivery Mode Total Credit Hours Full-time Part-time
Combined 3,067 57% 43%
Seated 2,457 59% 41%
Distance Learning 610 51% 49%
Off-site 483 71% 29%
Fall 2012
Delivery Mode Total Credit Hours Full-time Part-time
Combined 2,916 60% 40%
Seated 2,304 62% 38%
Distance Learning 611 54% 46%
Off-site 137 72% 28%