key to the success of the denia project - etouches · key to the success of the denia project...
TRANSCRIPT

Key to the Success of the Denia Project
Vicent Moncho Mas
CIO Marina Salud

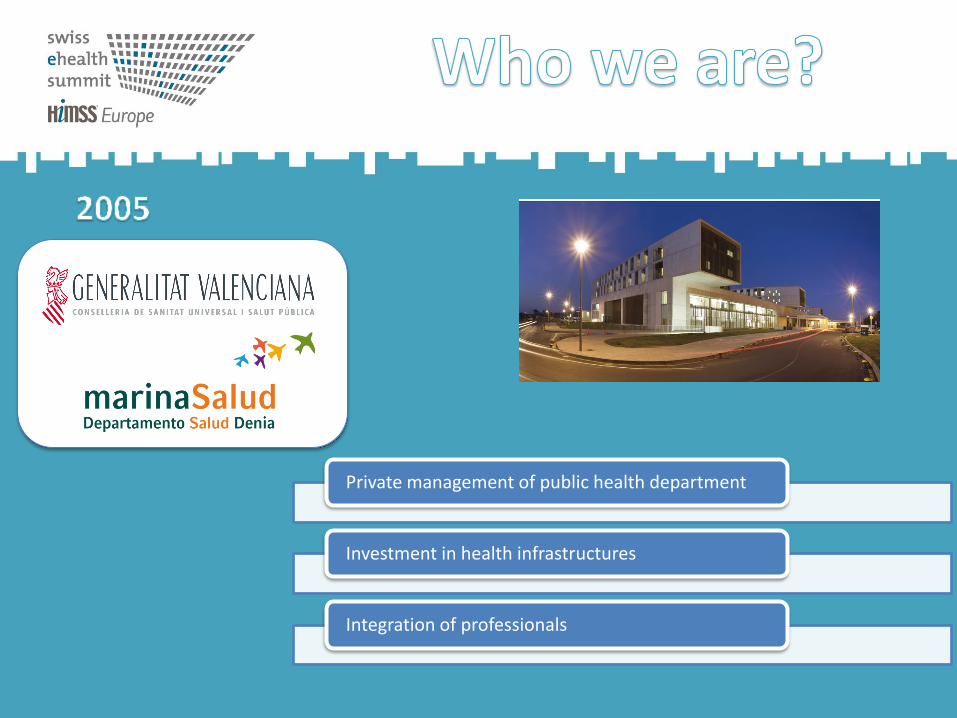
Private management of public health department
Investment in health infrastructures
Integration of professionals

1. Focused on the patient
2. Focused on the professional
3. Focused on the process
4. Healthcare integration
5. Quality management
6. Knowledge reference


5 doctors 3 nurses 2 IT staff
Design of clinical processes Management of implementation Priorization of proposals


Nursing documentation
Benefit Contribution Impact Cases Hours/year FTE Nurses
All discharged patients have a nursing discharge report
50% of the report's content is generated automatically
5
Minutes per report
11,728 977.33 0.56
Continuity of care between departments
Single database per patient 15
Minutes per discharge
11,728 2,932.00 1.69
Physician documentation
Benefit Contribution Impact Cases Hours /year FTE physician
Enable remote visits Structured clinical information available anywhere at any time. Protocols integrated.
10
Time per visit reduced from 15 to 5 minutes
5,828
971 0.56
Greater access to documentation
Single database per patient. 10
Minutes per discharge
11,728
1,955 1.13
Documentation in Operating Room
Integration of monitoring devices 7
Minutes per major surgery
8,608
1,004 0.58
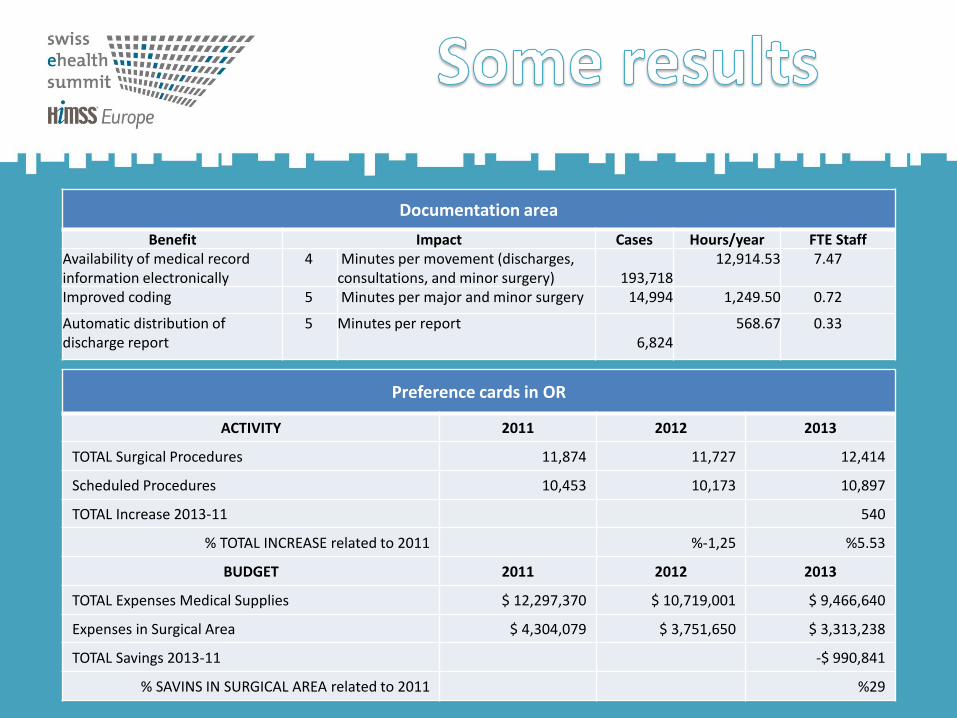
Documentation area
Benefit Impact Cases Hours/year FTE Staff Availability of medical record information electronically
4 Minutes per movement (discharges, consultations, and minor surgery)
193,718
12,914.53 7.47
Improved coding 5 Minutes per major and minor surgery 14,994 1,249.50 0.72
Automatic distribution of discharge report
5 Minutes per report 6,824
568.67 0.33
Preference cards in OR
ACTIVITY 2011 2012 2013
TOTAL Surgical Procedures 11,874 11,727 12,414
Scheduled Procedures 10,453 10,173 10,897
TOTAL Increase 2013-11 540
% TOTAL INCREASE related to 2011 %-1,25 %5.53
BUDGET 2011 2012 2013
TOTAL Expenses Medical Supplies $ 12,297,370 $ 10,719,001 $ 9,466,640
Expenses in Surgical Area $ 4,304,079 $ 3,751,650 $ 3,313,238
TOTAL Savings 2013-11 -$ 990,841
% SAVINS IN SURGICAL AREA related to 2011 %29

Full nursing process • 100% of patients with nursing care plans • 100% of patients with nursing care report • 5 rights in the close loop medication process • Full paperless nursing care process: assessment, diagnosis, care planning and evaluation of results.

Pressure ulcers (PU)
Falls
Phlebitis
• 72,832 stays were recorded. • Conley risk rating scale to 1,555 patients. • 126 falls were recorded. • Incidence rate of 1.73 x 1000.
The patient was: • 44% wandering. • 32% lying. • 11% sitting.
• 128 patients analyzed. • Selected dressing:
• Transparent 59,63% • Bandages or mesh 37.61%. • Opaque 2%
Degree of phlebitis: •No presence 86, 24%. •Signs 10.09%. •Phlebitis 3.67%
• 99.42% of hospitalized patients had Norton risk scale for pressure ulcer assessment. • In 1,561 patients, 72 PU prevalence of 4.61%. • Only 28 PU are hospital waste prevalence of 1.79%.

0,9446 0,9712
1,0566 1,0957
1,1141
0,85
0,9
0,95
1
1,05
1,1
1,15
2009 2010 2011 2012 2013
Complexity. Relative weight.
1,47 1,47
1,23
1,05 0,92
0,6
0,8
1
1,2
1,4
1,6
2009 2010 2011 2012 2013
IMAR (mortality)
1,1 1,06
1,01 0,93
1
0,6
0,7
0,8
0,9
1
1,1
1,2
2009 2010 2011 2012 2013
IRAR (readmisions)
1,12 1,09 1,04
1
0,92
0,6
0,7
0,8
0,9
1
1,1
1,2
2009 2010 2011 2012 2013
ICAR (complications)


Thank you very much
Vicent Moncho Mas
CIO Marina Salud