keyzones, edinburgh feb. 2005 - ecowin.org ecasa final.pdf · due d8 selection and description of...
TRANSCRIPT
Ecosystem Approach for Sustainable AquacultureEcosystem Approach for Sustainable Aquaculture
ECASAECASAwww.ecasa.org.uk/
ECASA Planning MeetingIFREMER Paris
6th-8th April 2005
J.G. FerreiraA. SequeiraA. Newton
www.ecowin.org/ecasa/
http://www.imar.ptIMAR – Portugal
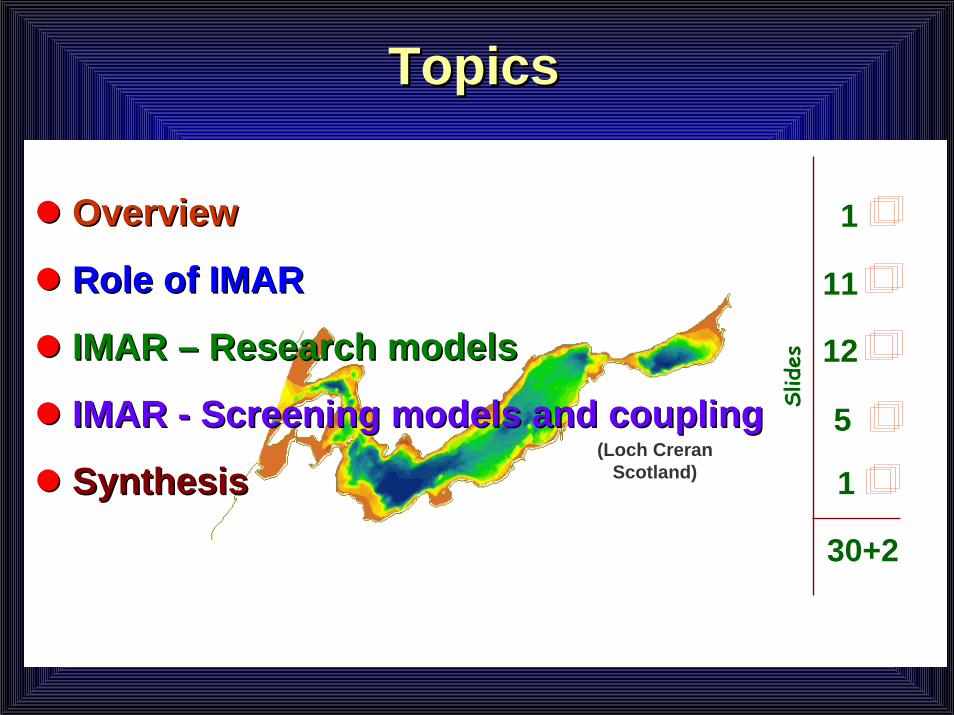
TopicsTopics
30+2
(Loch CreranScotland)
Slides
1
11
5
1
OverviewOverview
Role of IMARRole of IMAR
IMAR IMAR –– Research modelsResearch models
IMAR IMAR -- Screening models and couplingScreening models and coupling
SynthesisSynthesis
12
ECASA ECASA -- OverviewOverviewGeneral ObjectivesGeneral Objectives
ECASAECASA is an interdisciplinary project which has the following is an interdisciplinary project which has the following objectives:objectives:
1.1. To identify quantitative and qualitative indicators of the To identify quantitative and qualitative indicators of the effects of aquaculture on th environment and viceeffects of aquaculture on th environment and vice--versa, and versa, and to acess their applicability;to acess their applicability;
2.2. To develop operational tools, including models, to establish To develop operational tools, including models, to establish and describe the relationship between environmental and describe the relationship between environmental conditions and aquaculture activities over a range of conditions and aquaculture activities over a range of ecosystems and aquaculture production systems; ecosystems and aquaculture production systems;
3.3. To develop effective environmental impact assessment and To develop effective environmental impact assessment and site selection methods for coastal area management.site selection methods for coastal area management.
ECASAECASARole of IMARRole of IMAR
♦ Data handling and database development;
♦ Geographic information systems;
♦ Biogeochemical modelling at the ecosystem scale, supported by appropriate field and laboratory studies;
♦ Application of screening models, testing and validation.
♦ Contributor in WP3, Principal contributor in WP4 and WP5

IMARIMARWorkpackages Workpackages
and Topicsand Topics
Work-package
Topic (Person-months) WPleader
WP3 Identification of driving forces of Identification of driving forces of ecosystem changes ( 3)ecosystem changes ( 3)
UOC
WP4 Development of indicators and models Development of indicators and models (12)(12)
NUE
WP5 Testing and validation for EIA and site Testing and validation for EIA and site selection, in cooperation with other selection, in cooperation with other partners (17) partners (17)
Haifa
WP6 Dissemination (1)Dissemination (1) Akvaplan
3% WP6
9% WP3
36% WP4
52% WP5
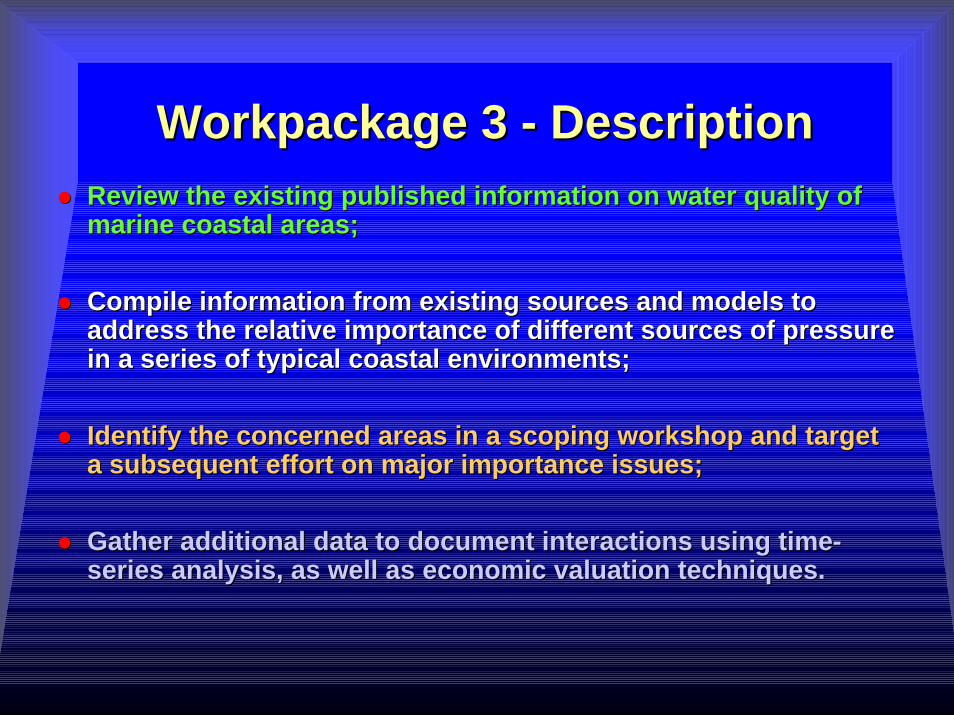
Workpackage 3 Workpackage 3 -- DescriptionDescriptionReview the existing published information on water quality of Review the existing published information on water quality of marine coastal areas;marine coastal areas;
Compile information from existing sources and models to Compile information from existing sources and models to address the relative importance of different sources of pressureaddress the relative importance of different sources of pressurein a series of typical coastal environments;in a series of typical coastal environments;
Identify the concerned areas in a scoping workshop and target Identify the concerned areas in a scoping workshop and target a subsequent effort on major importance issues;a subsequent effort on major importance issues;
Gather additional data to document interactions using timeGather additional data to document interactions using time--series analysis, as well as economic valuation techniques.series analysis, as well as economic valuation techniques.
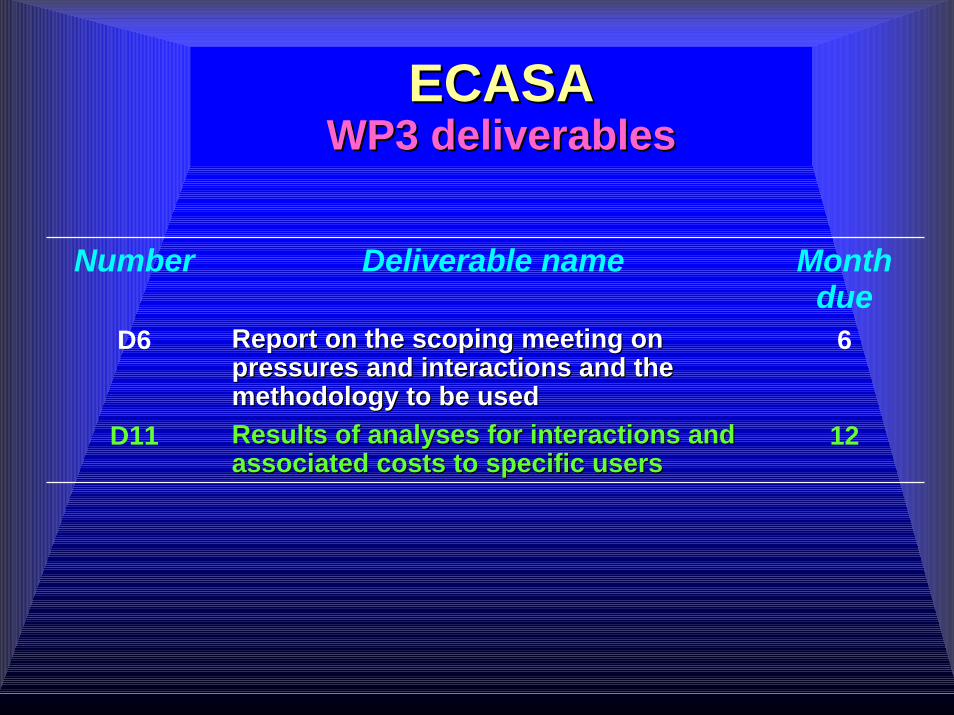
ECASAECASAWP3 deliverablesWP3 deliverables
Number Deliverable name Month due
D6 Report on the scoping meeting on Report on the scoping meeting on pressures and interactions and the pressures and interactions and the methodology to be usedmethodology to be used
6
D11 Results of analyses for interactions and Results of analyses for interactions and associated costs to specific usersassociated costs to specific users
12
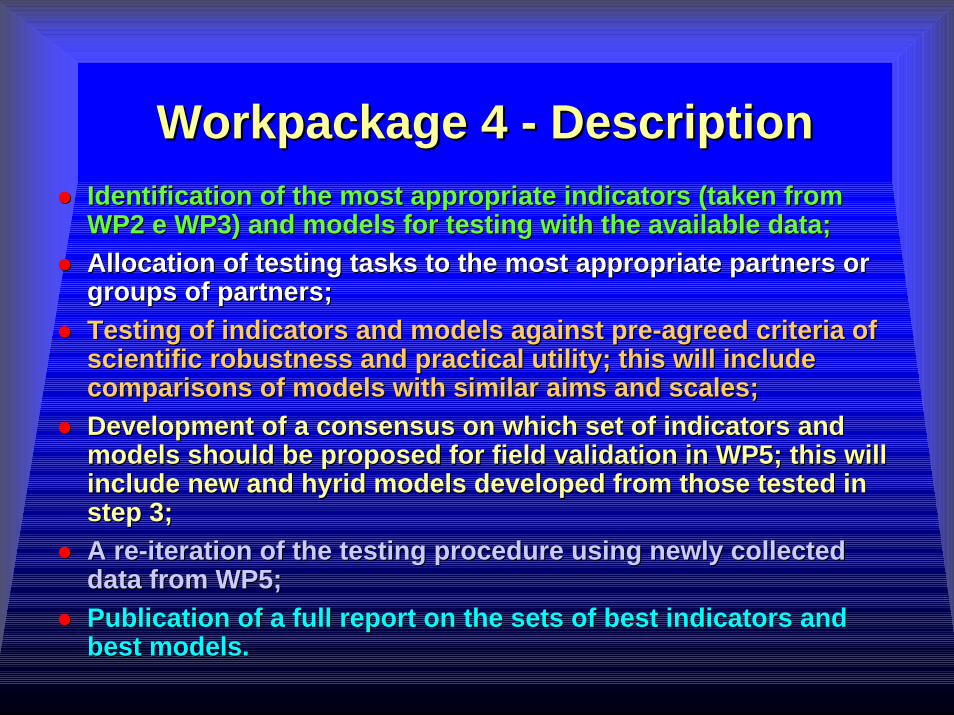
Workpackage 4 Workpackage 4 -- DescriptionDescriptionIdentification of the most appropriate indicators (taken from Identification of the most appropriate indicators (taken from WP2 e WP3) and models for testing with the available data;WP2 e WP3) and models for testing with the available data;Allocation of testing tasks to the most appropriate partners or Allocation of testing tasks to the most appropriate partners or groups of partners;groups of partners;Testing of indicators and models against preTesting of indicators and models against pre--agreed criteria of agreed criteria of scientific robustness and practical utility; this will include scientific robustness and practical utility; this will include comparisons of models with similar aims and scales;comparisons of models with similar aims and scales;Development of a consensus on which set of indicators and Development of a consensus on which set of indicators and models should be proposed for field validation in WP5; this willmodels should be proposed for field validation in WP5; this willinclude new and hyrid models developed from those tested in include new and hyrid models developed from those tested in step 3;step 3;A reA re--iteration of the testing procedure using newly collected iteration of the testing procedure using newly collected data from WP5;data from WP5;Publication of a full report on the sets of best indicators and Publication of a full report on the sets of best indicators and best models.best models.
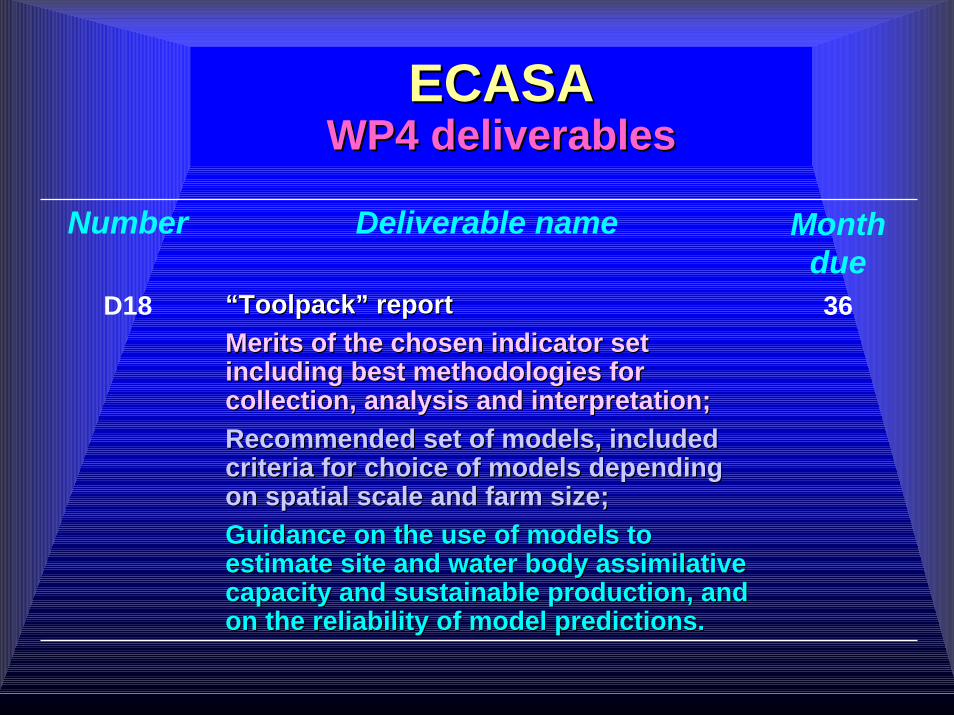
ECASAECASAWP4 deliverablesWP4 deliverables
Number Deliverable name Month due
D18 ““ToolpackToolpack” report ” report Merits of the chosen indicator set Merits of the chosen indicator set including best methodologies for including best methodologies for collection, analysis and interpretation;collection, analysis and interpretation;Recommended set of models, included Recommended set of models, included criteria for choice of models depending criteria for choice of models depending on spatial scale and farm size;on spatial scale and farm size;Guidance on the use of models to Guidance on the use of models to estimate site and water body assimilative estimate site and water body assimilative capacity and sustainable production, and capacity and sustainable production, and on the reliability of model predictions.on the reliability of model predictions.
36
Workpackage 5 Workpackage 5 -- DescriptionDescription
Brief intense field investigations will be undertaken by Brief intense field investigations will be undertaken by most of the partners to allow testing of selected tools most of the partners to allow testing of selected tools and indicators at selected sites: and indicators at selected sites:
Adriatic;Adriatic;Eastern Mediterranean;Eastern Mediterranean;Western Mediterranean;Western Mediterranean;Atlantic coast of mainland Europe;Atlantic coast of mainland Europe;West coast of Scotland.West coast of Scotland.
Covering a wide range of aquaculture types, including Covering a wide range of aquaculture types, including shellfish extensive bottom cultures and high density shellfish extensive bottom cultures and high density mussel culture rafts;mussel culture rafts;Results of these studies will be utilized in WP4 to test Results of these studies will be utilized in WP4 to test the predictive models and to evaluate the choice of the predictive models and to evaluate the choice of indicators and tools.indicators and tools.
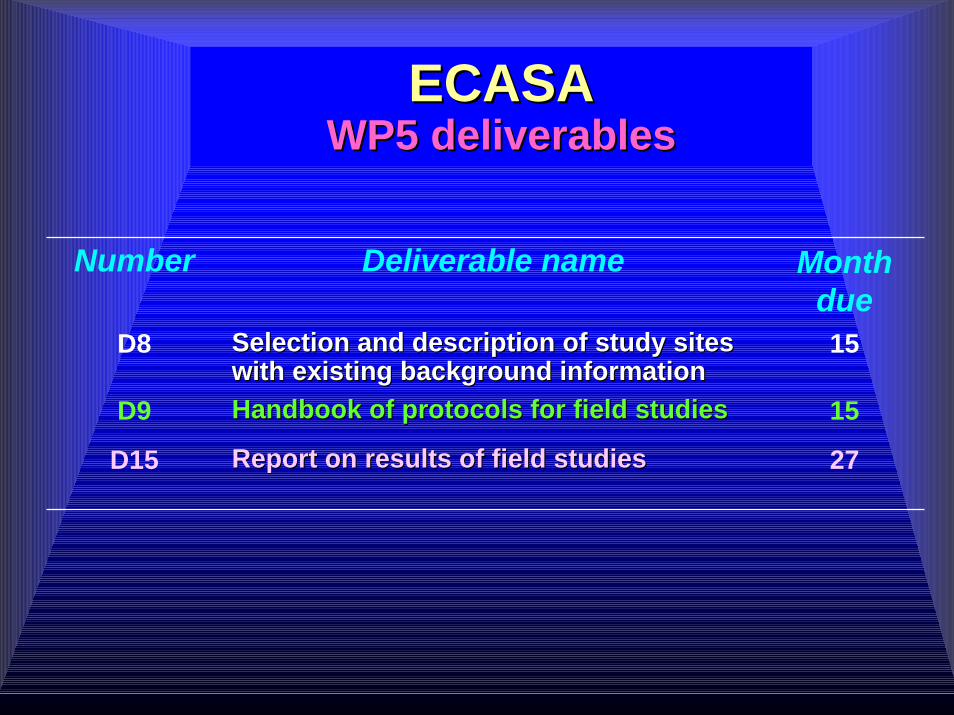
ECASAECASAWP5 deliverablesWP5 deliverables
Number Deliverable name Month due
D8 Selection and description of study sites Selection and description of study sites with existing background informationwith existing background information
15
D9 Handbook of protocols for field studiesHandbook of protocols for field studies 15
D15 Report on results of field studiesReport on results of field studies 27

Workpackage 6 Workpackage 6 -- DescriptionDescription
Strong interaction with WP1 to ensure effective Strong interaction with WP1 to ensure effective external relations;external relations;Development of the internal website as a key Development of the internal website as a key information medium for the participants;information medium for the participants;Organise and participate in national stakeholder Organise and participate in national stakeholder meetings to ensure: meetings to ensure:
Maximum uptake by the user community;Maximum uptake by the user community;That appropriate bodies including regulators and producer That appropriate bodies including regulators and producer representative organisation have the opportunity to influence threpresentative organisation have the opportunity to influence the e research trajectory;research trajectory;The outputs of these meetings will be disseminated both internalThe outputs of these meetings will be disseminated both internally ly (discussed at Steering Group and WP levels) and externally.(discussed at Steering Group and WP levels) and externally.
Organisation of an international meeting (near the end Organisation of an international meeting (near the end of the project).of the project).

ECASAECASAWP6 deliverablesWP6 deliverables
Number Deliverable name Month due
D2 Commissioned, functional Public Commissioned, functional Public WebsiteWebsite
4
D3 Commissioned, functional Partner Commissioned, functional Partner WebsiteWebsite
4
D4, D13, D17 Publication of Newsletters 1, 2 and 3Publication of Newsletters 1, 2 and 3
D16 OrganisationOrganisation of International Meetingof International Meeting 30
ECASA workplanECASA workplanApproachApproach
1. A description of water circulation and stratification-mixing dynamics adequate for upscaling detailed hydrodynamics to larger-scale, integrated ecosystem models: For Ria Formosa, this will be done with MOHID (follow-up from the EU OAERRE project), for Loch Creran with Delft3D (with WL|Delft in the EU KEYZONES project);
2. Explicit resolution between phytoplankton and organic detritus as separate food sources, and their variation in time and space, both due to production and exchange;
3. Detailed modelling of the key physiological processes at the individual level for the target organisms, enabling simulation of environmental impact (with PML and others in ECASA, SPEAR, KEYZONES and SMILE projects);
4. Integration of biogeochemistry, population dynamics and cultivation practice, allowing a focus on target cohorts, which is essential for management;
5. Application of screening models for aquaculture and eutrophication assessment, using a data-driven approach for standard conditions and a combination with research models for scenario analysis
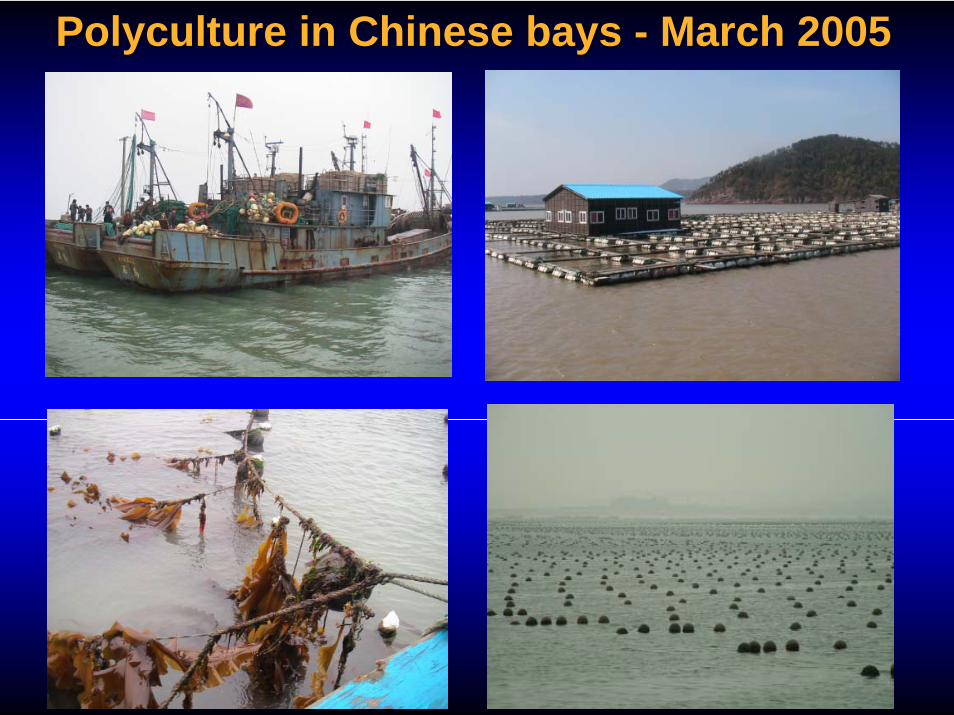
Polyculture in Chinese bays Polyculture in Chinese bays -- March 2005March 2005

Sanggou Bay polyculture - Kelp and scallop
4.5m
Nets: 3m
Longline. In somecases the ratio ofkelp ropes:scallops is1:1, others 1:2, others 2:1
kelp 3m
Kelp yield - 5kg dw per “double” ropeinside the bay, 10kg outside the bay.333-375 g dw/ m2. All harvested.Data calculated for inside the bay.
Kelp rope- 2.5m, 30-35 plantsX 2 for “double” rope
• 8-10 layers per Chinese lantern, 30 scallops per layer, 120 nets per culture Mu, i.e. 120 culture nets/1600-1800 m2, 240-300/ net:16-22.5 scallops/ m2.• Scallop nets are 2-3m long. 6 longlines per culture Mu, 30 longlines per block, then 8m channel for navigation.
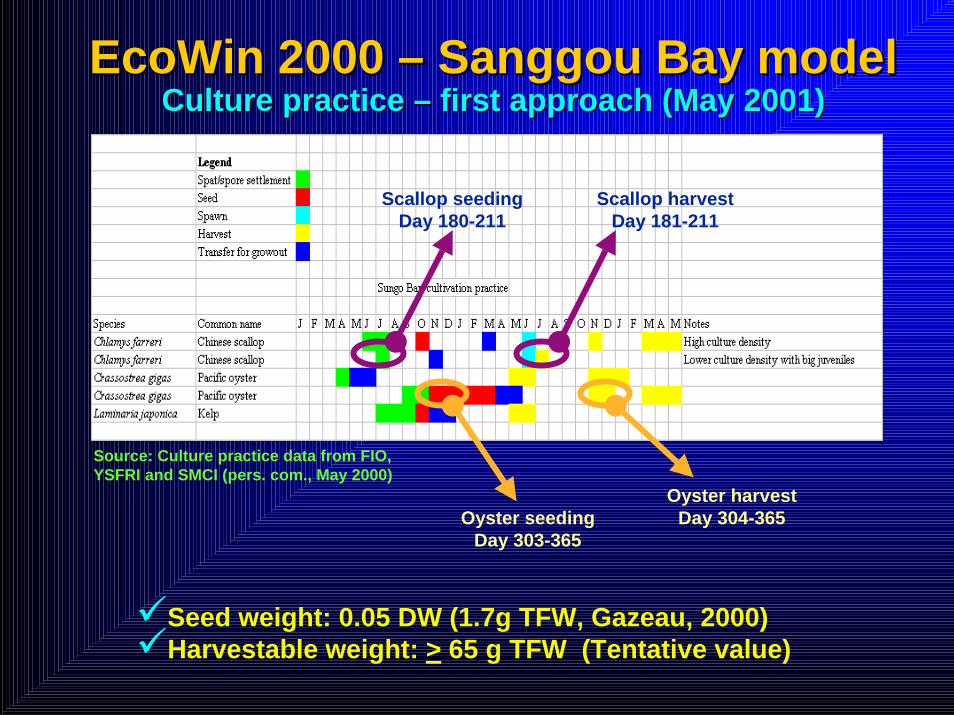
EcoWin 2000 EcoWin 2000 –– Sanggou Bay modelSanggou Bay modelCulture practice Culture practice –– first approach (May 2001)first approach (May 2001)
Scallop seedingDay 180-211
Scallop harvestDay 181-211
Oyster seedingDay 303-365
Oyster harvestDay 304-365
Source: Culture practice data from FIO, YSFRI and SMCI (pers. com., May 2000)
Seed weight: 0.05 DW (1.7g TFW, Gazeau, 2000)Harvestable weight: > 65 g TFW (Tentative value)

Sanggou Bay cultivation areas 1993/94Sanggou Bay cultivation areas 1993/94GIS determinationGIS determination
Scallop
Kelp
Scallop & Kelp
Aquaculture areas:Aquaculture areas:OystersOysters 391 ha391 haScallopScallop 3400 ha3400 haKelpKelp 4400 ha4400 ha
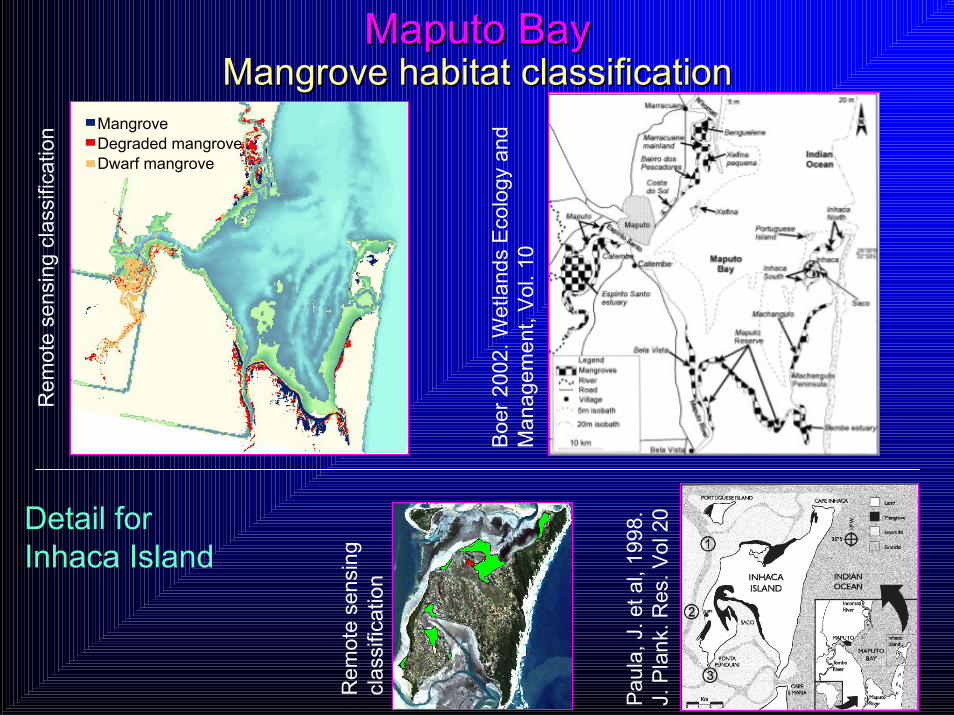
MangroveDegraded mangroveDwarf mangrove
Maputo BayMaputo BayMangrove habitat classificationMangrove habitat classification
Boe
r 200
2. W
etla
nds
Eco
logy
and
M
anag
emen
t, V
ol. 1
0
Rem
ote
sens
ing
clas
sific
atio
n
Detail for Inhaca Island
Pau
la, J
. et a
l, 19
98.
J. P
lank
. Res
. Vol
20
Rem
ote
sens
ing
clas
sific
atio
n
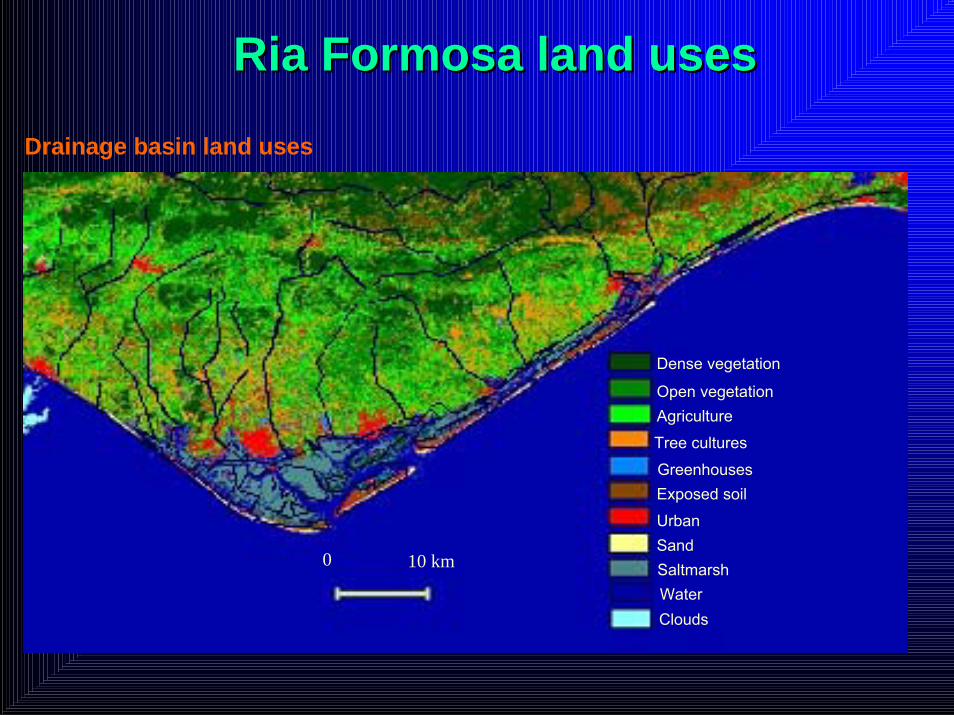
Ria Formosa land usesRia Formosa land uses
Drainage basin land uses
0 10 km
Dense vegetation
Open vegetationAgriculture
Tree cultures
GreenhousesExposed soil
UrbanSandSaltmarshWaterClouds
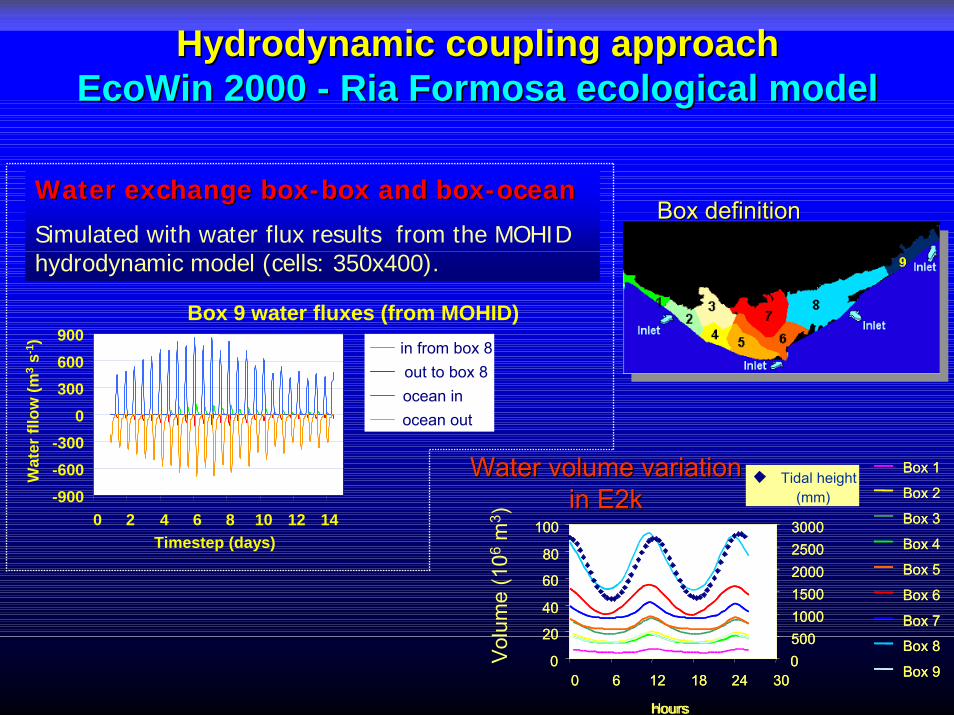
Hydrodynamic couplingHydrodynamic coupling approachapproachEcoWin 2000 EcoWin 2000 -- Ria Formosa ecological modelRia Formosa ecological model
Box definitionBox definition
Vol
ume
(106
m3 )
0
20
40
60
80
100
0 6 12 18 24 30
hours
050010001500200025003000
Box 1
Box 2
Box 3
Box 4
Box 5
Box 6
Box 7
Box 8
Box 90
20
40
60
80
100
0 6 12 18 24 30
Hours
050010001500200025003000
Box 1
Box 2
Box 3
Box 4
Box 5
Box 6
Box 7
Box 8
Box 9
(mm)Tidal heightWater volume variation Water volume variation
in E2kin E2kTimestep (days)
Box 9 water fluxes (from MOHID)
-900-600-300
0300600900
0 2 4 6 8 10 12 14
Wat
erfll
ow(m
3s-1
) in from box 8out to box 8ocean inocean out
Water exchange boxWater exchange box--box and boxbox and box--oceanocean
Simulated with water flux results from the MOHID hydrodynamic model (cells: 350x400).
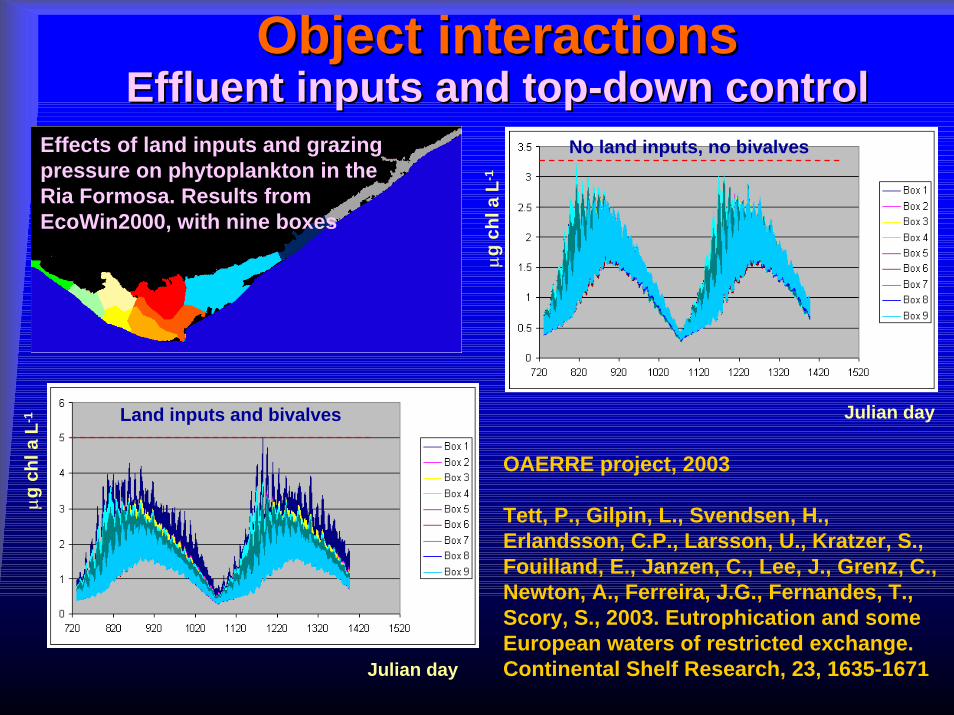
Object interactionsObject interactionsEffluent inputs and topEffluent inputs and top--down controldown control
Effects of land inputs and grazing pressure on phytoplankton in the Ria Formosa. Results from EcoWin2000, with nine boxes
OAERRE project, 2003
Tett, P., Gilpin, L., Svendsen, H., Erlandsson, C.P., Larsson, U., Kratzer, S., Fouilland, E., Janzen, C., Lee, J., Grenz, C., Newton, A., Ferreira, J.G., Fernandes, T., Scory, S., 2003. Eutrophication and some European waters of restricted exchange. Continental Shelf Research, 23, 1635-1671
No land inputs, no bivalves
Julian day
µg c
hl a
L-1
Land inputs and bivalves
Julian day
µg c
hl a
L-1
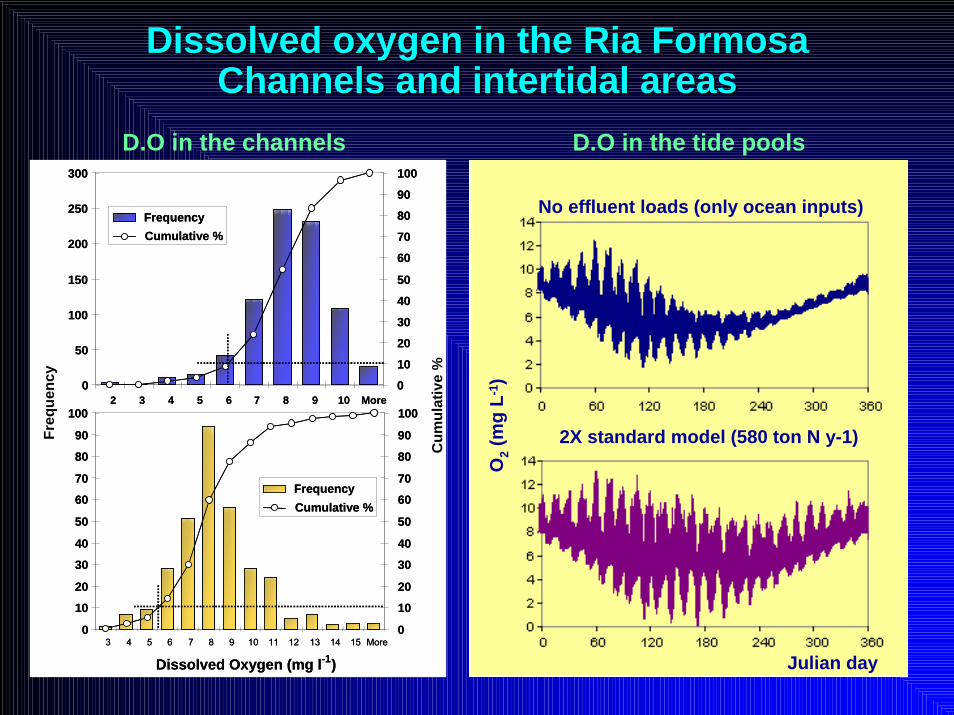
Dissolved oxygen in the Ria FormosaDissolved oxygen in the Ria FormosaChannels and intertidal areasChannels and intertidal areas
D.O in the channels D.O in the tide pools
0
50
100
150
200
250
300
2 3 4 5 6 7 8 9 10 More0
10
20
30
40
50
60
70
80
90
100
FrequencyCumulative %
0
50
100
150
200
250
300
2 3 4 5 6 7 8 9 10 More0
10
20
30
40
50
60
70
80
90
100
FrequencyCumulative %
0
10
20
30
40
50
60
70
80
90
100
3 4 5 6 7 8 9 10 11 12 13 14 15 More
Dissolved Oxygen (mg l-1)
0
10
20
30
40
50
60
70
80
90
100
Cum
ulat
ive
%
FrequencyCumulative %
0
10
20
30
40
50
60
70
80
90
100
3 4 5 6 7 8 9 10 11 12 13 14 15 More
Dissolved Oxygen (mg l-1)
Freq
uenc
y
0
10
20
30
40
50
60
70
80
90
100
FrequencyCumulative %
O2
(mg
L-1 )
Julian day
No effluent loads (only ocean inputs)
2X standard model (580 ton N y-1)

Growth of Ulva sp. in the Ria FormosaGrowth of Ulva sp. in the Ria FormosaPercentile 90Percentile 90 valuesvalues for different DIN loadsfor different DIN loads
Results from EcoWin2000Results from EcoWin2000Box 1 Box 1 –– Ancão area (Western Ria Formosa)Ancão area (Western Ria Formosa)
500
550
600
650
700
750
800
0 10 20 30 40 50 60150
200
250
300
350
400To
tal b
iom
ass
m-2
(g D
W)
DW (16-20g) m-2
No effluents
X 0.5
X 1 (standard model)
X 2
X 10
DW (>0-20g) m-2C
lass 5 biomass (16-20g) m
-2(g DW
)
DW592%
DW20%
DIN (µmol L-1)
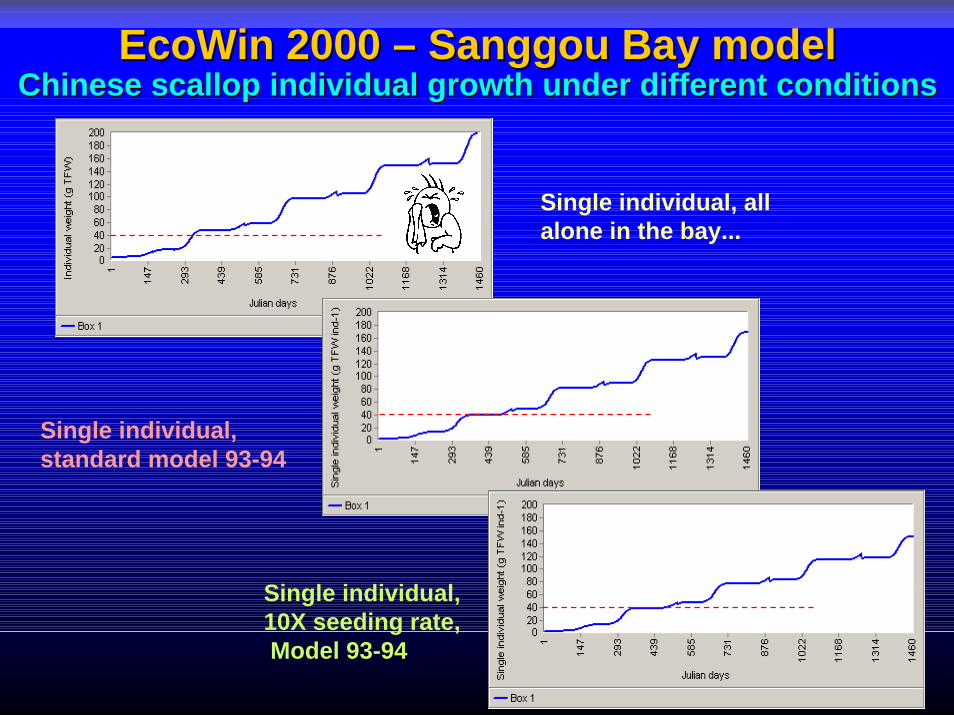
EcoWin 2000 EcoWin 2000 –– Sanggou Bay modelSanggou Bay modelChinese scallop individual growth under different conditionsChinese scallop individual growth under different conditions
Single individual, all alone in the bay...
Single individual, standard model 93-94
Single individual,10X seeding rate,Model 93-94

0
0.5
1
1.5
2
2.5
0 10 20 30seeding pressure (X standard seeding)
ug C
hl(a
) L-1Comparison between Comparison between
standard modelstandard modeland scenarioand scenario
PhytoplanktonPhytoplankton
Phytoplankton mass balance
-60000
-40000
-20000
0
20000
40000
60000
NPP Mortality Shellfishuptake
Boundaryexchanges
mgC
m-2
y-1
x0.5 x1 x2 x5 x10 x15 x20 x25 x30
Phytoplankton concentration
in the bay
Nunes, J.P, Ferreira, J.G., Gazeau, F., Lencart-Silva, J., Zhang, X.L, Zhu M.Y. & Fang J.G., 2003. A model for sustainable management of shellfish polyculture in coastal bays. Aquaculture, 219/1-4, 257-277.

Key aspects of the NEEA approach (OEC)Key aspects of the NEEA approach (OEC)
External Nutrient Inputs
External Nutrient Inputs
Primary Symptoms Secondary Symptoms
Harmful Algae
Nuisance BloomsToxic Blooms
Loss of SAV
SAV Spatial CoverageSAV Spatial
Coverage Trends
Nitrogen and Phosphorus
Low DissolvedOxygen
AnoxiaHypoxia
Biological Stress
Increased Organic Decomposition
Extreme Chl-a ConcentrationsProblematic Seaweed Growth
Decreased Light Availability
Extreme Chl-a ConcentrationsProblematic Epiphytic GrowthProblematic Seaweed Growth
Algal Dominance Changes
Diatoms to FlagellatesBenthic Dominance
to Pelagic Dominance

Overall level of expression matrixOverall level of expression matrixOverall level of expression of eutrophic conditions
MODERATEPrimary symptoms high but problems with more
serious secondarysymptoms still not being
expressed
MODERATE HIGHPrimary symptoms high
and substantial secondary symptoms
becoming more expressed, indicating
potentially serious problems
levels indicate serious
MODERATELevel of expression of eutrophic conditions is
substantial
conditionsin causing the conditions
LOWLevel of expression of eutrophic conditions is
minimal
Low secondary symptoms
Moderate secondary symptoms
High secondary symptoms
0 0.3 0.6 1
Low
prim
ary
sym
ptom
sM
oder
ate
prim
ary
sym
ptom
sH
igh
prim
ary
sym
ptom
s
0.3
0.6
1
MODERATEPrimary symptoms high but problems with more
serious secondarysymptoms still not being
expressed
MODERATE HIGHPrimary symptoms high
and substantial secondary symptoms
becoming more expressed, indicating
potentially serious problems
levels indicate serious
HIGHHigh primary and
secondary symptom
eutrophication problems
HIGHHigh primary and
secondary symptom
eutrophication problems
MODERATELevel of expression of eutrophic conditions is
substantial
HIGHSubstantial levels of eutrophic conditions
occurring with secondary symptoms indicating
serious problems
HIGHSubstantial levels of eutrophic conditions
symptoms indicating serious problems
MODERATE HIGHHigh secondary
symptoms indicate serious problems, but low primary indicates other factors may also be involved in causing
MODERATE HIGHHigh secondary
symptoms indicate serious problems, but low primary indicates other factors may also be involved in causing
conditionsin causing the conditions
LOWLevel of expression of eutrophic conditions is
minimal
Low secondary symptoms
Moderate secondary symptoms
High secondary symptoms
0 0.3 0.6 1
Low
prim
ary
sym
ptom
sM
oder
ate
prim
ary
sym
ptom
sH
igh
prim
ary
sym
ptom
s
0.3
0.6
1
factors may be involved factors may be involved
MODERATE LOWModerate secondary symptoms indicate
substantial eutrophic conditions, but low
primary indicates other
MODERATE LOWModerate secondary symptoms indicate
substantial eutrophic conditions, but low
primary indicates other
MODERATE LOWPrimary symptoms
beginning to indicate possible problems but still very few
secondary symptoms expressed
MODERATE LOWPrimary symptoms
beginning to indicate possible problems but still very few
secondary symptoms expressed
Bricker, S.B., J.G. Ferreira, T. Simas, 2003. An Integrated MethBricker, S.B., J.G. Ferreira, T. Simas, 2003. An Integrated Methodology for Assessment of Estuarine odology for Assessment of Estuarine Trophic Status. Ecological Modelling, 169(1), 39Trophic Status. Ecological Modelling, 169(1), 39--60. 60.
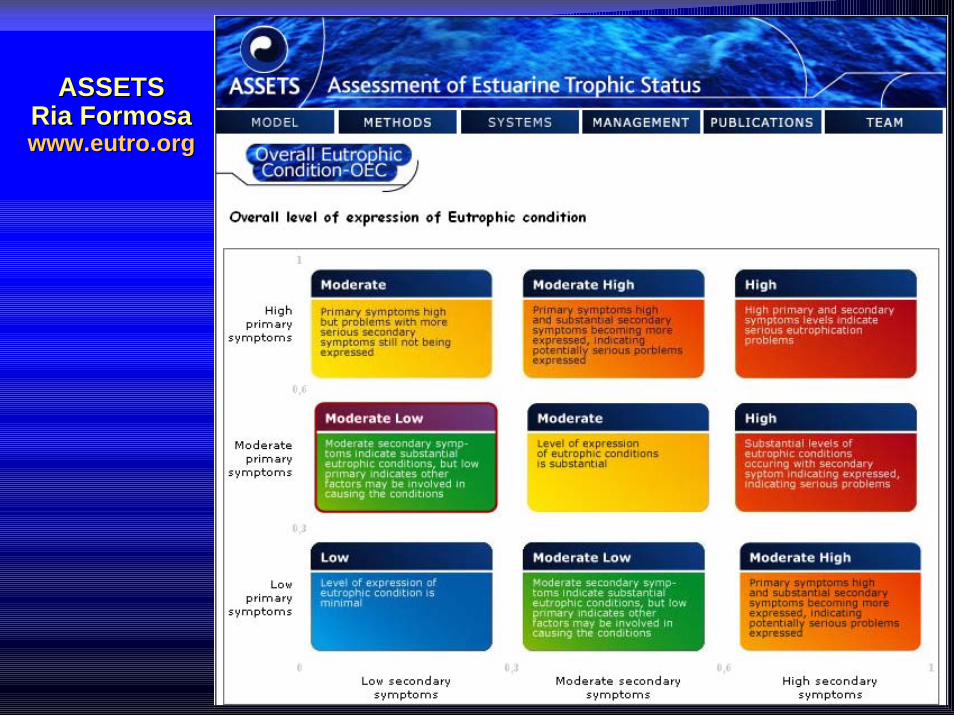
ASSETSASSETSRia FormosaRia Formosawww.eutro.orgwww.eutro.org
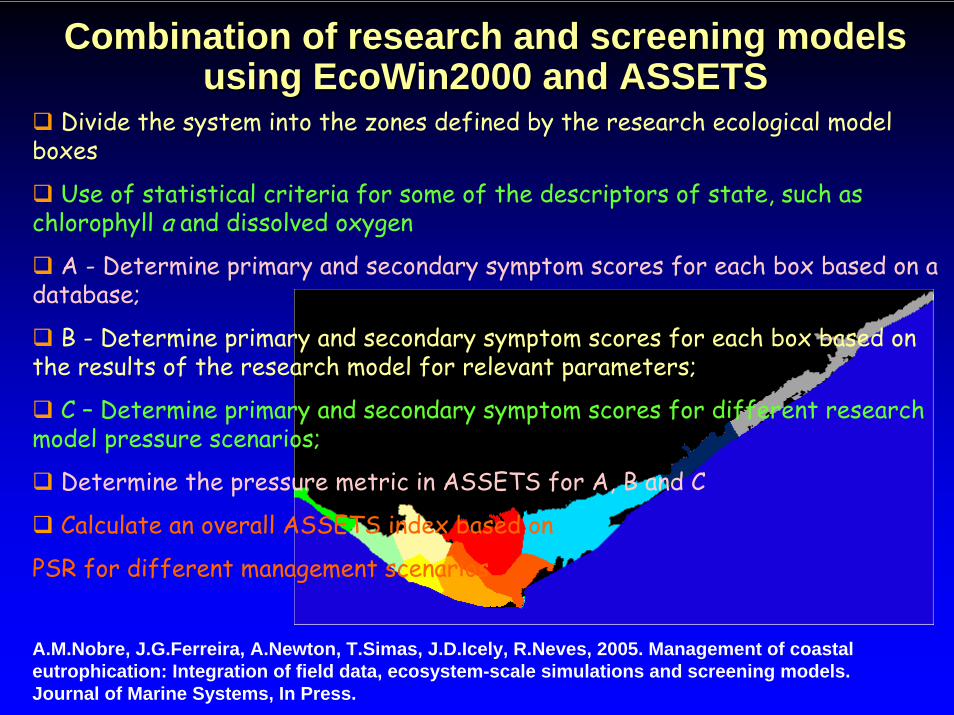
Combination of research and screening modelsCombination of research and screening modelsusing EcoWin2000 and ASSETSusing EcoWin2000 and ASSETS
Divide the system into the zones defined by the research ecological model boxes
Use of statistical criteria for some of the descriptors of state, such as chlorophyll a and dissolved oxygen
A - Determine primary and secondary symptom scores for each box based on adatabase;
B - Determine primary and secondary symptom scores for each box based on the results of the research model for relevant parameters;
C – Determine primary and secondary symptom scores for different researchmodel pressure scenarios;
Determine the pressure metric in ASSETS for A, B and C
Calculate an overall ASSETS index based on
PSR for different management scenarios
A.M.Nobre, J.G.Ferreira, A.Newton, T.Simas, J.D.Icely, R.Neves, 2005. Management of coastaleutrophication: Integration of field data, ecosystem-scale simulations and screening models. Journal of Marine Systems, In Press.
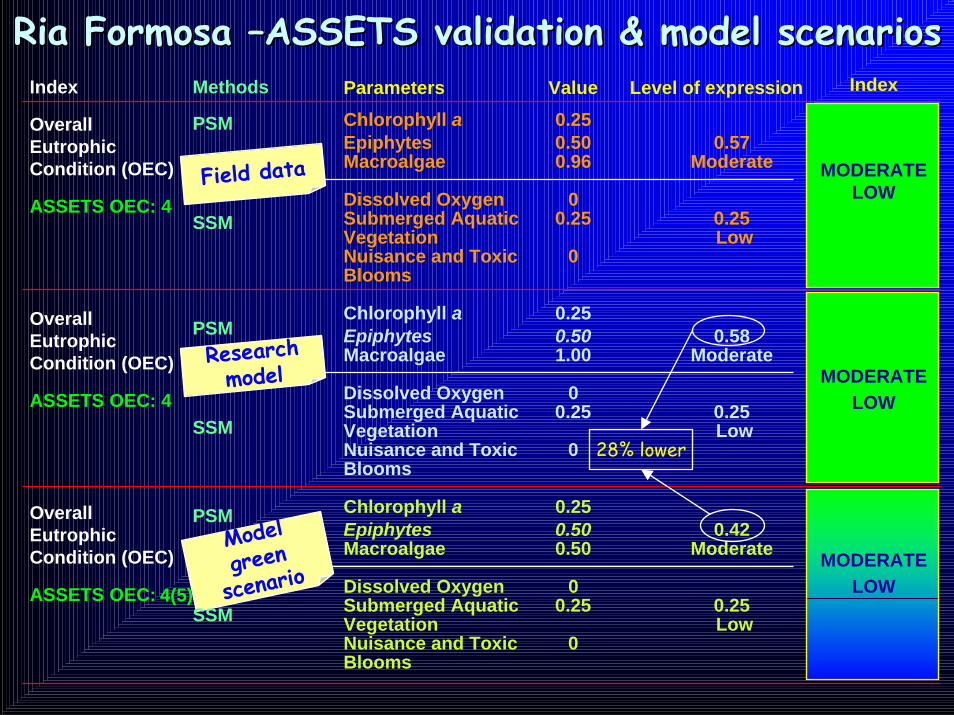
Ria FormosaRia Formosa ––ASSETSASSETS validation & model scenariosvalidation & model scenarios
Model green
scenario
Index
Overall Eutrophic Condition (OEC)
ASSETS OEC: 4
Overall Eutrophic Condition (OEC)
ASSETS OEC: 4
Overall Eutrophic Condition (OEC)
ASSETS OEC:
Methods
PSM
SSM
PSM
SSM
PSM
SSM
Parameters Value Level of expressionChlorophyll a 0.25Epiphytes 0.50 0.57Macroalgae 0.96 Moderate
Dissolved Oxygen 0Submerged Aquatic 0.25 0.25Vegetation LowNuisance and Toxic 0Blooms
Chlorophyll a 0.25Epiphytes 0.50 0.58Macroalgae 1.00 Moderate
Dissolved Oxygen 0Submerged Aquatic 0.25 0.25Vegetation LowNuisance and Toxic 0Blooms
Chlorophyll a 0.25Epiphytes 0.50 0.42Macroalgae 0.50 Moderate
Dissolved Oxygen 0Submerged Aquatic 0.25 0.25Vegetation LowNuisance and Toxic 0Blooms
Field data
Research model
Index
MODERATELOW
MODERATELOW
MODERATELOW
28% lower
4(5)
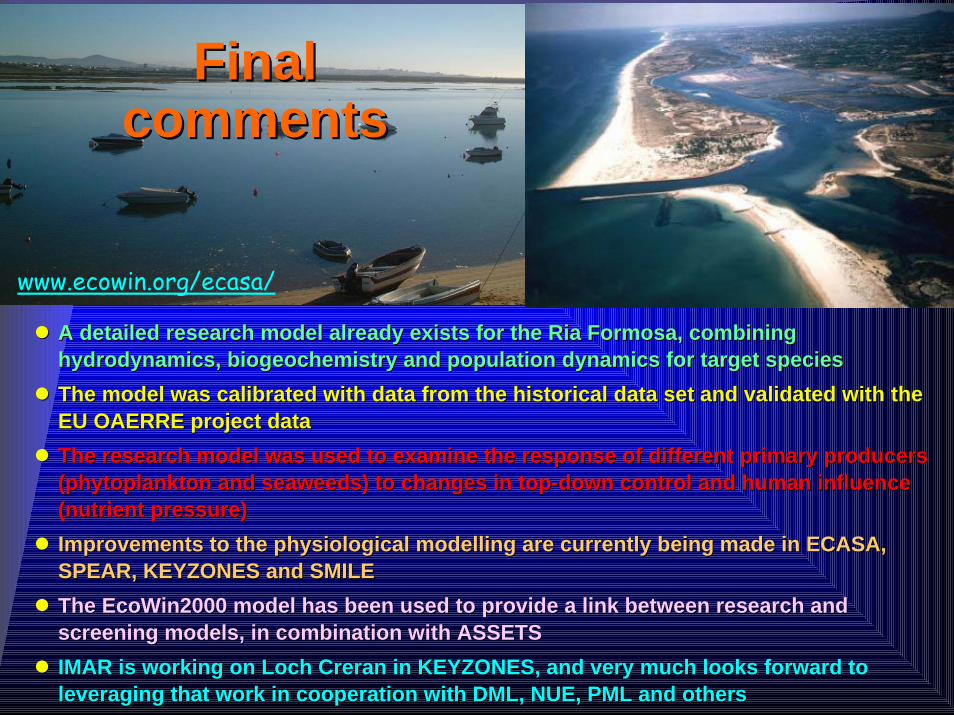
Final Final commentscomments
A detailed research model already exists for the Ria Formosa, coA detailed research model already exists for the Ria Formosa, combining mbining hydrodynamics, biogeochemistry and population dynamics for targehydrodynamics, biogeochemistry and population dynamics for target speciest speciesThe model was calibrated with data from the historical data set The model was calibrated with data from the historical data set and validated with the and validated with the EU OAERRE project dataEU OAERRE project dataThe research model was used to examine the response of differentThe research model was used to examine the response of different primary producers primary producers (phytoplankton and seaweeds) to changes in top(phytoplankton and seaweeds) to changes in top--down control and human influence down control and human influence (nutrient pressure)(nutrient pressure)Improvements to the physiological modelling are currently being Improvements to the physiological modelling are currently being made in ECASA, made in ECASA, SPEAR, KEYZONES and SMILESPEAR, KEYZONES and SMILEThe EcoWin2000 model has been used to provide a link between resThe EcoWin2000 model has been used to provide a link between research and earch and screening models, in combination with ASSETSscreening models, in combination with ASSETSIMAR is working on Loch Creran in KEYZONES, and very much looks IMAR is working on Loch Creran in KEYZONES, and very much looks forward to forward to leveraging that work in cooperation with DML, NUE, PML and otherleveraging that work in cooperation with DML, NUE, PML and otherss
www.ecowin.org/ecasa/