khairunnisa binti syaripuddin - … utility of bats (chiroptera) as ecological indicators in...
TRANSCRIPT
1
UTILITY OF BATS (CHIROPTERA) AS ECOLOGICAL
INDICATORS IN PENINSULAR MALAYSIA
KHAIRUNNISA BINTI SYARIPUDDIN
FACULTY OF SCIENCE
UNIVERSITY OF MALAYA
KUALA LUMPUR
2014
2
UTILITY OF BATS (CHIROPTERA) AS ECOLOGICAL
INDICATORS IN PENINSULAR MALAYSIA
KHAIRUNNISA BINTI SYARIPUDDIN
DISSERTATION SUBMITTED IN FULFILLMENT OF
THE REQUIREMENTS FOR THE DEGREE OF
MASTER OF SCIENCE
INSTITUTE OF BIOLOGICAL SCIENCES
FACULTY OF SCIENCE
UNIVERSITY OF MALAYA
KUALA LUMPUR
2014
ii
UNIVERSITI MALAYA
ORIGINAL LITERARY WORK DECLARATION
Name of Candidate: KHAIRUNNISA BINTI SYARIPUDDIN
I/C/Passport No: 900201137446
Regisration/Matric No.: SGR130005
Name of Degree: MASTER OF SCIENCE
Title of Project Paper/Research Report/Dissertation/Thesis (“this Work”):
“UTILITY OF BATS (CHIROPTERA) AS ECOLOGICAL INDICATORS IN
PENINSULAR MALAYSIA”
Field of Study: ECOLOGY AND BIODIVERSITY
I do solemnly and sincerely declare that:
(1) I am the sole author/writer of this Work,
(2) This Work is original,
(3) Any use of any work in which copyright exists was done by way of fair dealing and for
permitted purposes and any excerpt or extract from, or reference to or reproduction of any
copyright work has been disclosed expressly and sufficiently and the title of the Work and
its authorship have been acknowledged in this Work,
(4) I do not have any actual knowledge nor do I ought reasonably to know that the making of
this work constitutes an infringement of any copyright work,
(5) I hereby assign all and every rights in the copyright to this Work to the University of
Malaya (“UM”), who henceforth shall be owner of the copyright in this Work and that any
reproduction or use in any form or by any means whatsoever is prohibited without the
written consent of UM having been first had and obtained,
(6) I am fully aware that if in the course of making this Work I have infringed any copyright
whether intentionally or otherwise, I may be subject to legal action or any other action as
may be determined by UM.
(Candidate Signature) Date:
Subscribed and solemnly declared before,
Witness’s Signature Date:
Name DR JOHN JAMES WILSON
Designation
Witness’s Signature Date:
Name ASSOC. PROF. DR ROSLI RAMLI
Designation
iii
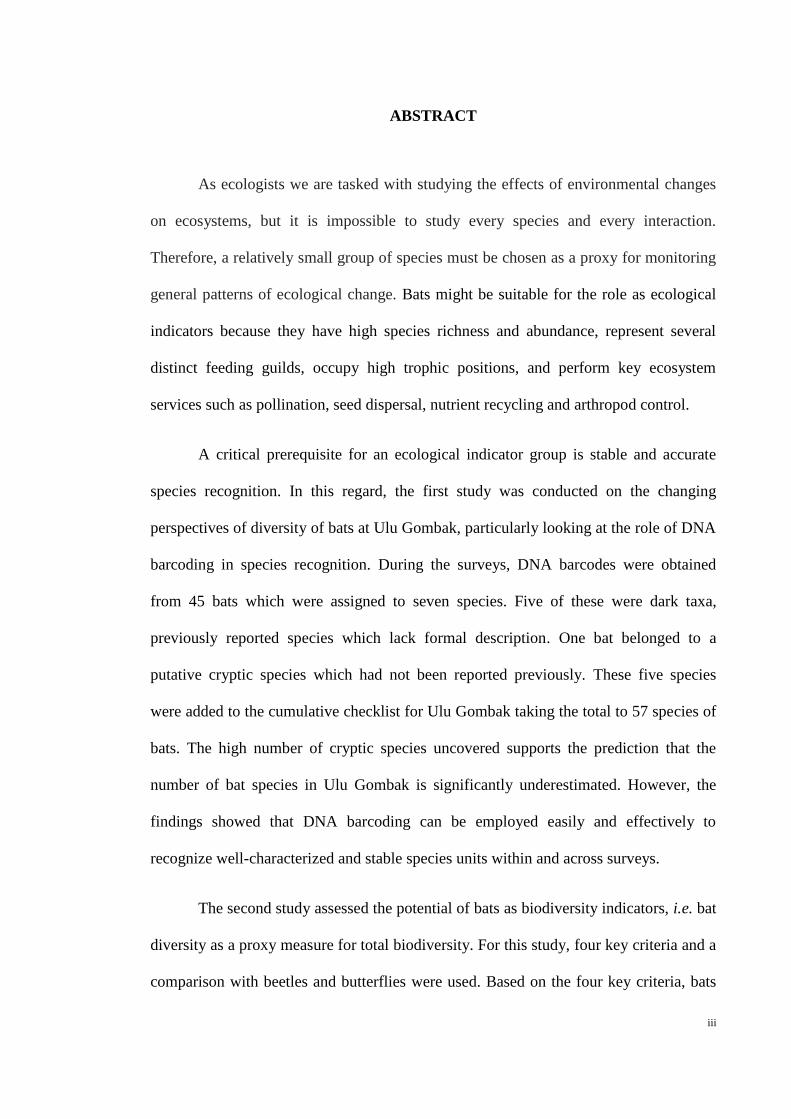
ABSTRACT
As ecologists we are tasked with studying the effects of environmental changes
on ecosystems, but it is impossible to study every species and every interaction.
Therefore, a relatively small group of species must be chosen as a proxy for monitoring
general patterns of ecological change. Bats might be suitable for the role as ecological
indicators because they have high species richness and abundance, represent several
distinct feeding guilds, occupy high trophic positions, and perform key ecosystem
services such as pollination, seed dispersal, nutrient recycling and arthropod control.
A critical prerequisite for an ecological indicator group is stable and accurate
species recognition. In this regard, the first study was conducted on the changing
perspectives of diversity of bats at Ulu Gombak, particularly looking at the role of DNA
barcoding in species recognition. During the surveys, DNA barcodes were obtained
from 45 bats which were assigned to seven species. Five of these were dark taxa,
previously reported species which lack formal description. One bat belonged to a
putative cryptic species which had not been reported previously. These five species
were added to the cumulative checklist for Ulu Gombak taking the total to 57 species of
bats. The high number of cryptic species uncovered supports the prediction that the
number of bat species in Ulu Gombak is significantly underestimated. However, the
findings showed that DNA barcoding can be employed easily and effectively to
recognize well-characterized and stable species units within and across surveys.
The second study assessed the potential of bats as biodiversity indicators, i.e. bat
diversity as a proxy measure for total biodiversity. For this study, four key criteria and a
comparison with beetles and butterflies were used. Based on the four key criteria, bats
iv
and butterflies showed good potential as bioindicators and should be given more
prominence in the evaluation of biodiversity in Southeast Asia.
The third study assessed bats as indicators of environmental contamination with
a case study looking at mercury contamination in hydroelectric reservoirs. Significantly
higher concentrations of mercury were found in the fur of insectivorous bats than
frugivorous bats suggesting mercury was being exported out of the reservoirs by aquatic
insect prey. Ten bats (H. cf. larvatus) sampled at Kenyir Lake had mercury
concentrations approaching or exceeding 10 mg/kg, which is the threshold at which
detrimental effects occur in humans, bats and mice. Future hydroelectric projects should
be aware that mercury contamination can occur due to construction of reservoirs and
move through the ecosystem through trophic pathways.
The combined findings of the three studies suggest that bats can be effectively
employed as ecological indicators. Therefore, bats are recommended to play a central
role in monitoring ecological change in Peninsular Malaysia in the years to come.
v
ABSTRAK
Sebagai ahli ekologi, kita ditugaskan untuk mengkaji kesan perubahan
persekitaran ke atas ekosistem, tetapi adalah mustahil untuk mengkaji setiap spesies dan
setiap interaksi. Oleh itu, sekumpulan kecil spesies mesti dipilih sebagai proksi untuk
memantau corak umum perubahan ekologi. Kelawar berkemungkinan sesuai sebagai
petunjuk ekologi kerana mereka mempunyai kekayaan dan kelimpahan spesies yang
tinggi, memiliki pelbagai cara pemakanan, berada pada aras trofik tinggi, dan
melaksanakan perkhidmatan ekosistem penting seperti pendebungaan, penyebaran biji
benih, kitar semula nutrien dan pengawalan artropoda.
Pra-syarat penting bagi kumpulan penunjuk ekologi adalah pengenalpastian
spesies dengan tepat. Sehubungan itu, kajian pertama telah dijalankan terhadap
perubahan perspektif kepelbagaian kelawar di Ulu Gombak, terutamanya melihat
peranan “DNA barcoding” dalam pengenalpastian spesies. Kod bar DNA telah
diperolehi daripada 45 kelawar yang dikumpulkan dalam tujuh spesies. Lima
daripadanya adalah “taksa gelap” iaitu spesies yang dilaporkan sebelum ini yang
mempunyai kurang penerangan formal dan “spesies samar” yang belum dilaporkan.
Lima spesies ini telah ditambah kepada senarai semak terkumpul untuk Ulu Gombak
menjadikan jumlah keseluruhan kelawar ialah 57 spesies. Bilangan tinggi “spesies
samar” yang terbongkar menyokong ramalan bahawa bilangan spesies kelawar di Ulu
Gombak lebih tinggi dari anggaran. Walau bagaimanapun, hasil kajian menunjukkan
bahawa “DNA barcoding” boleh digunakan dengan mudah dan berkesan untuk
mengenali spesies yang stabil.
vi
Kajian kedua menilai keupayaan kelawar sebagai petunjuk biodiversiti, iaitu
kepelbagaian spesies kelawar sebagai proksi untuk jumlah biodiversiti. Untuk kajian ini,
empat kriteria utama dan perbandingan dengan kumbang dan rama-rama telah dibuat.
Berdasarkan empat kriteria utama , kelawar dan rama-rama menunjukkan potensi yang
baik sebagai petunjuk biodiversiti yang perlu diberikan keutamaan dalam penilaian
kepelbagaian biologi di Asia Tenggara.
Kajian ketiga menilai kelawar sebagai petunjuk pencemaran alam sekitar dengan
melihat pencemaran raksa dalam empangan hidroelektrik dengan melakukan
perbandingan antara kepekatan raksa dalam kelawar buah dan kelawar serangga .
Kepekatan raksa adalah lebih tinggi dalam bulu kelawar serangga. Sepuluh kelawar (H.
cf. larvatus) disampel pada Tasik Kenyir mempunyai kepekatan raksa menghampiri
atau melebihi 10 mg/kg, iaitu ambang di mana kesan memudaratkan berlaku pada
manusia, kelawar dan tikus. Oleh itu, projek empangan hidroelektrik di masa hadapan
harus dipantau sekiranya melibatkan pencemaran raksa.
Gabungan penemuan tiga kajian ini menunjukkan bahawa kelawar boleh
berperanan sebagai petunjuk ekologi. Oleh itu, kelawar disyorkan memainkan peranan
utama dalam memantau perubahan ekologi di Semenanjung Malaysia pada tahun-tahun
mendatang.

vii
ACKNOWLEDGEMENTS
Alhamdulillah, I praise to ALLAH for giving me the chance and time, also knowledge
and ideas for me to finish all my fieldworks and the writing of my dissertation. I am
thankful to my parents and siblings too, for their support and prayers along the way.
I want to convey my gratitude to my supervisors: Dr. John James Wilson and
Assoc. Prof Dr. Rosli Ramli for the time, guidance and support in completing my
research and dissertation. Million thanks also to my labmates (Sing Kong Wah, Karen
Chia, Lee Ping Shin and Daniel Kong) and seniors (Nursyereen Mohd Nasir,
Muhammad Rasul Abdullah Halim, and Thary Gazi) for their generous help in my
fieldwork and labwork. Grateful thanks are also offered to my beloved friends (Patricia
Albert, Azira Azreen Abdul Aziz, Rachel Lau, Zafirah Zakri, Amni Bazilah Sulaiman,
Nur Sakinah Mohd Yassin and Nurfarahin Mustafa) for their help and supports through
ups and downs. Also, to the Institute of Biological Science (ISB) staffs and drivers who
had worked really hard in the fieldwork.
I was supported by Research Assistantships at the Museum of Zoology through a
University of Malaya grant (A-21010-DA322-B29000). Research expenses were
supported by grants from the University of Malaya. The Department of Wildlife and
National Parks provided a permit for fieldwork in Peninsular Malaysia. Dr. Noraishah
Abdul-Aziz assisted in securing the permit. The Department of Forestry of Terengganu
also issued a permit for fieldwork in Kenyir. I am grateful also to the Head of Institute
of Biological Sciences, University of Malaya and Director, Rimba Ilmu for providing
permission for sampling at the field sites. Many thanks to Dr. Anjali Kumar from
Massachusetts Institute of Technology for great collaboration in my third subproject.
Reuben Clements of RIMBA (myrimba.org) helped in planning, providing

viii
accommodation and engaging field guides at Temenggor and Kenyir. Locals from Pulau
Tujuh Village, Gerik assisted with fieldwork. Thanks also to Dave Yates and Dave
Evers, for providing access to their unpublished data, and Kevin Regan at the
Biodiversity Research Institute.

ix
TABLE OF CONTENT
ABSTRACT ..................................................................................................................... iii
ABSTRAK ........................................................................................................................ v
ACKNOWLEDGEMENTS ............................................................................................ vii
TABLE OF CONTENT ................................................................................................... ix
LIST OF FIGURES .......................................................................................................... xi
LIST OF TABLES ......................................................................................................... xiii
LIST OF SYMBOLS AND ABBREVIATIONS .......................................................... xiv
LIST OF APPENDICES ................................................................................................ xvi
CHAPTER 1 ...................................................................................................................... 1
GENERAL INTRODUCTION ..................................................................................... 1
CHAPTER 2 ...................................................................................................................... 3
LITERATURE REVIEW .............................................................................................. 3
2.1 Bats ...................................................................................................................... 3
2.2 Bats as biodiversity indicators ............................................................................. 5
2.3 Bats as ecotoxicology indicator ........................................................................... 5
CHAPTER 3 ...................................................................................................................... 7
CHANGING PERSPECTIVES ON THE DIVERSITY OF BATS (CHIROPTERA)
AT ULU GOMBAK SINCE THE ESTABLISHMENT OF THE FIELD STUDIES
CENTRE IN 1965 ......................................................................................................... 7
3.1 Introduction .......................................................................................................... 7
3.2 Materials and methods ......................................................................................... 9
3.3 Results ................................................................................................................ 12
3.4 Discussion .......................................................................................................... 19
3.5 Conclusion ......................................................................................................... 21
CHAPTER 4 .................................................................................................................... 22
ARE BUTTERFLIES, BATS AND BEETLES GOOD BIODIVERSITY
INDICATORS IN TROPICAL SOUTHEAST ASIA? AN ASSESSMENT USING
FOUR KEY CRITERIA AND DNA BARCODES .................................................... 22
4.1 Introduction ........................................................................................................ 22
4.2 Materials and methods ....................................................................................... 24
4.3 Results ................................................................................................................ 29
x
4.4 Discussion .......................................................................................................... 38
4.5 Conclusions ........................................................................................................ 43
CHAPTER 5 .................................................................................................................... 44
MERCURY ACCUMULATION IN BATS NEAR HYDROELECTRIC
RESERVOIRS IN PENINSULAR MALAYSIA ....................................................... 44
5.1 Introduction ........................................................................................................ 44
5.2 Materials and methods ....................................................................................... 48
5.3 Results ................................................................................................................ 51
5.4 Discussion .......................................................................................................... 60
5.5 Conclusion ......................................................................................................... 63
CHAPTER 6 .................................................................................................................... 64
GENERAL DISCUSSION .......................................................................................... 64
CHAPTER 7 .................................................................................................................... 67
CONCLUSION AND RECOMMENDATION .......................................................... 67
REFERENCES ................................................................................................................ 68
LIST OF PUBLICATIONS AND PAPER PRESENTED .............................................. 90
APPENDIX ..................................................................................................................... 91
xi
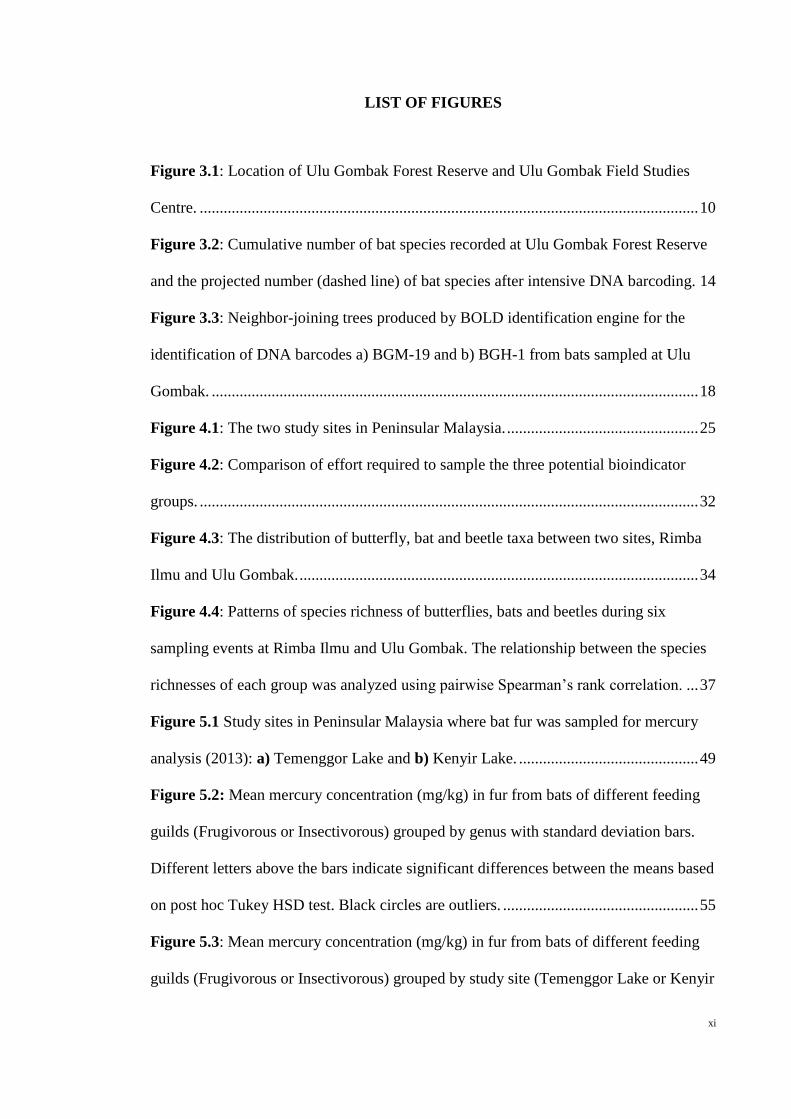
LIST OF FIGURES
Figure 3.1: Location of Ulu Gombak Forest Reserve and Ulu Gombak Field Studies
Centre. ............................................................................................................................. 10
Figure 3.2: Cumulative number of bat species recorded at Ulu Gombak Forest Reserve
and the projected number (dashed line) of bat species after intensive DNA barcoding. 14
Figure 3.3: Neighbor-joining trees produced by BOLD identification engine for the
identification of DNA barcodes a) BGM-19 and b) BGH-1 from bats sampled at Ulu
Gombak. .......................................................................................................................... 18
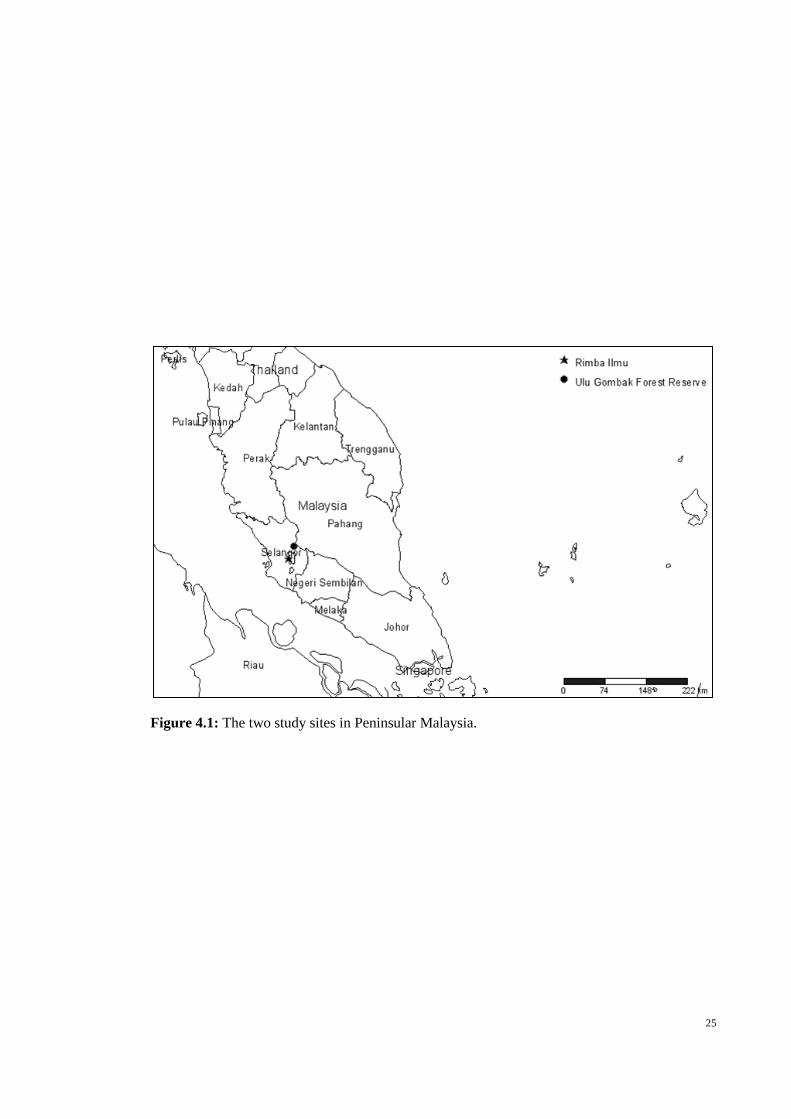
Figure 4.1: The two study sites in Peninsular Malaysia. ................................................ 25
Figure 4.2: Comparison of effort required to sample the three potential bioindicator
groups. ............................................................................................................................. 32
Figure 4.3: The distribution of butterfly, bat and beetle taxa between two sites, Rimba
Ilmu and Ulu Gombak. .................................................................................................... 34
Figure 4.4: Patterns of species richness of butterflies, bats and beetles during six
sampling events at Rimba Ilmu and Ulu Gombak. The relationship between the species
richnesses of each group was analyzed using pairwise Spearman’s rank correlation. ... 37
Figure 5.1 Study sites in Peninsular Malaysia where bat fur was sampled for mercury
analysis (2013): a) Temenggor Lake and b) Kenyir Lake. ............................................. 49
Figure 5.2: Mean mercury concentration (mg/kg) in fur from bats of different feeding
guilds (Frugivorous or Insectivorous) grouped by genus with standard deviation bars.
Different letters above the bars indicate significant differences between the means based
on post hoc Tukey HSD test. Black circles are outliers. ................................................. 55
Figure 5.3: Mean mercury concentration (mg/kg) in fur from bats of different feeding
guilds (Frugivorous or Insectivorous) grouped by study site (Temenggor Lake or Kenyir

xii
Lake) with standard deviation bars. Different letters above the bars indicate significant
differences between the means based on post hoc Tukey HSD test. Black circles are
outliers. ............................................................................................................................ 57
Figure 5.4: Mean mercury concentration (mg/kg) in fur from bats of different feeding
guilds (Frugivorous or Insectivorous) grouped by sex with standard deviation bars.
Different letters above the bars indicate significant differences between the means based
on post hoc Tukey HSD test. Black circles are outliers. ................................................. 59
xiii
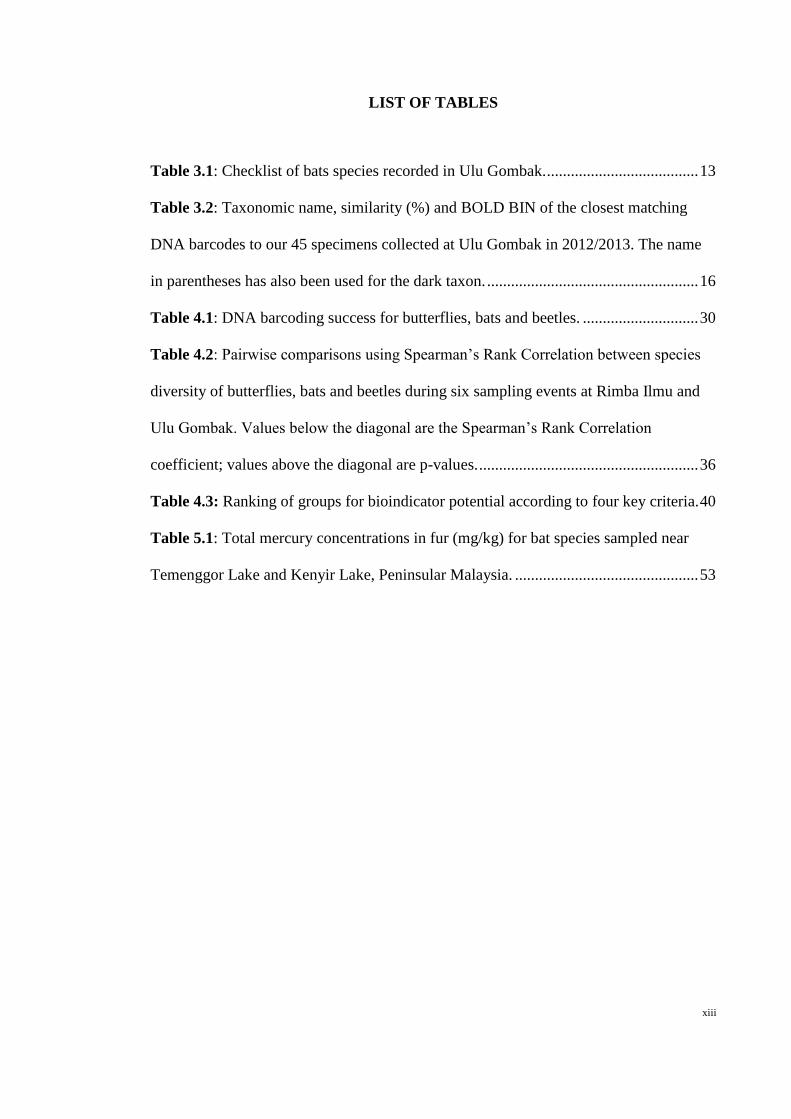
LIST OF TABLES
Table 3.1: Checklist of bats species recorded in Ulu Gombak. ...................................... 13
Table 3.2: Taxonomic name, similarity (%) and BOLD BIN of the closest matching
DNA barcodes to our 45 specimens collected at Ulu Gombak in 2012/2013. The name
in parentheses has also been used for the dark taxon. ..................................................... 16
Table 4.1: DNA barcoding success for butterflies, bats and beetles. ............................. 30
Table 4.2: Pairwise comparisons using Spearman’s Rank Correlation between species
diversity of butterflies, bats and beetles during six sampling events at Rimba Ilmu and
Ulu Gombak. Values below the diagonal are the Spearman’s Rank Correlation
coefficient; values above the diagonal are p-values. ....................................................... 36
Table 4.3: Ranking of groups for bioindicator potential according to four key criteria. 40
Table 5.1: Total mercury concentrations in fur (mg/kg) for bat species sampled near
Temenggor Lake and Kenyir Lake, Peninsular Malaysia. .............................................. 53
xiv
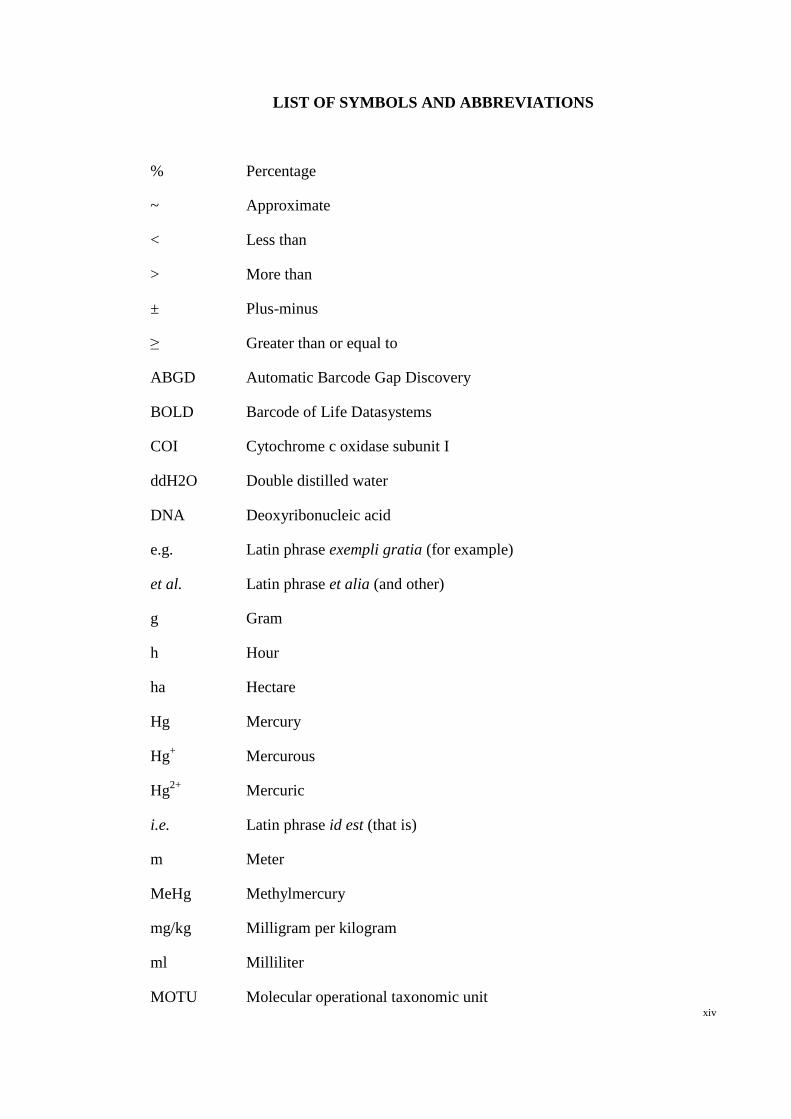
LIST OF SYMBOLS AND ABBREVIATIONS
% Percentage
~ Approximate
< Less than
> More than
± Plus-minus
≥ Greater than or equal to
ABGD Automatic Barcode Gap Discovery
BOLD Barcode of Life Datasystems
COI Cytochrome c oxidase subunit I
ddH2O Double distilled water
DNA Deoxyribonucleic acid
e.g. Latin phrase exempli gratia (for example)
et al. Latin phrase et alia (and other)
g Gram
h Hour
ha Hectare
Hg Mercury
Hg+
Mercurous
Hg2+
Mercuric
i.e. Latin phrase id est (that is)
m Meter
MeHg Methylmercury
mg/kg Milligram per kilogram
ml Milliliter
MOTU Molecular operational taxonomic unit
xv
mtDNA Mitochondrial deoxyribonucleic acid
PCR Polymerase chain reaction
ppm Part per million
SD Standard deviation
SE Standard error
sp. Species (singular)
spp. Species (plural)
ß Beta
UMKL University of Malaya, Kuala Lumpur
vs. Versus
α Alpha

xvi
LIST OF APPENDICES
APPENDIX A: Paper published……………………………………………………….91
APPENDIX B: Abstract for seminar presented……………………………………….98
1
CHAPTER 1
GENERAL INTRODUCTION
Four ‘biodiversity hotspots’ overlap in Southeast Asia: Indo-Burma, Sundaland,
the Philippines and Wallacea (Sodhi et al., 2004). Malaysia is a part of Sundaland and is
recognized as one of the twelve mega-biodiversity countries in the world (Giri et al.,
2001; Jamadon et al., 2007) with over 15000 species of flowering plants, 1500 species
of terrestrial vertebrates and 150000 species of invertebrates (Fong et al., 2006). Among
the 290 mammal species known in Malaysia, over 125 are bats and these account for
over 10% of the world’s bat species (Kingston et. al., 2006). Malaysia has been reported
as experiencing the highest percentage of forest loss in the world between 2000 and
2012; mostly attributed to logging for timber industries and forest conversion for oil
palm plantations (Butler, 2013). This should raise flags among those concerned about
global biodiversity hotspots, and especially Malaysia where there is a high number of
endemic species. According to the IUCN Red List of Threatened Species (2013), there
are 50 species of animals and 190 species of plants listed as critically endangered
species in Malaysia. This includes charismatic mega fauna such as the Sumatran rhino
(Dicerorhinus sumatrensis) which is now extinct in Peninsular Malaysia and
represented by only a few surviving individuals in a sanctuary in Sabah. A loss of
habitats for wildlife resulted in a loss of biodiversity as well as an increase of human-
wildlife conflicts.
2
As ecologists, we are tasked with studying the effect of these environmental
changes on ecosystems, but it is impossible to study every species and every interaction
occurring in the ecosystem. Therefore, a relatively small group of species must be
chosen as a proxy for monitoring general patterns of ecological change. Hence, this
study examines the utility of bats as ecological indicators, focusing in particular on bats
in Peninsular Malaysia.
Bats have high species richness and abundance, represent several distinct
feeding guilds, occupy high trophic positions, and perform key ecosystem services such
as pollination, seed dispersal, nutrient recycling and arthropod control. The human
interest in bats, coupled with their unique biology, suggests that bats could be useful,
yet currently underappreciated, models for ecology (Jones et al., 2009), particularly as
conservation flagships, as indicators of the “total” biodiversity of a site, and as
indicators of environmental contamination resulting from changes in land use.
Hence, the following objectives were set for this study:
i. To study the potential of DNA barcoding approach in yielding precise assessment of
bat diversity.
ii. To examine the potential of bats as an indicator group for “total biodiversity” using
assessment of four key criteria and comparison with beetles and butterflies.
iii. To investigate the role of bats as indicators of environmental pollution resulting
from changes in land use.
3
CHAPTER 2
LITERATURE REVIEW
2.1 Bats
Bats (Order: Chiroptera) are the most ubiquitous group of mammals with 330
species described in Southeast Asia (Kingston, 2010) and 1,150 species in the world
(IUCN, 2013). Due to high diversity of bat species in Malaysia, the country has become
a centre for research on bats. Various research related to populations and assemblages,
ecological, behavioral, and biological aspects of different groups of bats have been
undertaken. Kingston et al. (2003) studied species richness of insectivorous bat in Krau
Wildlife Game Reserve. Francis (1994) sampled the Krau Wildlife Game Reserve and
Sepilok, Sabah to compare the abundance of fruit bats in the subcanopy and ground
level at both sites. Francis (1990) also estimated the community trophic structure of
primary lowland dipterocarp forest in Peninsular Malaysia and Sabah. Shafie et al.
(2011) assessed the diversity of bats in two different habitats (i.e. secondary forest and
oil palm plantation) along Kerian River, Perak. Campbell et al. (2006) performed a
comparative study on the population structure of Cynopterus fruit bats in Peninsular
Malaysia and southern Thailand.
However, detailed studies of bat diversity suggest that species richness within
this mega-diversity region might be underestimated by at least 50%, as higher levels of
endemism and greater intra-specific population structure were recognized than
previously realized (Francis et al., 2010). The high number of overlooked taxa could be
attributed to their cryptic behavior and morphology (Clare et al., 2007).
4
DNA barcoding has been shown to be a useful tool for identifying mammal
species, particularly when morphological characters (e.g. cranial and dental characters)
are not readily available or are unreliable (Borisenko, 2008). DNA samples taken from
the animals can be analyzed to provide a standardized DNA sequence which can be
used to identify the specimen to a species by comparing with a library of sequences of
known species origin in the Barcode of Life Datasystems (www.barcodinglife.org).
Proper documentation of bat species is essential for conservation and bats are
ecologically and economically important. Insectivorous bats play important role in
regulating insect populations, especially nocturnal insect species. An insectivorous bat
can consume between 20-50% of their total body weight of insects in each foraging
session (Brunet-Rossinni & Austad, 2004). Since the insectivorous bats occupy a high
trophic level, they are likely to show consequences of pollutants before organisms at
lower trophic levels because accumulation of pollutants increases at higher positions in
the food webs (Jones et al., 2009). Therefore, bats have been proposed as an indicator
group for measuring pollution and environmental disturbances in the ecosystem (Jones
et al., 2009). Frugivorous bats disperse seeds and replant forests while nectarivorous
bats pollinate many forest flowers (Hodgkison et al., 2003). In Malaysia, fruit bats are
important to the agriculture as pollinators and seed dispersal agents for at least 31 plant
species with high commercial value including durian (Durio spp.) and petai (Parkia
speciosa and Parkia javanica) (Kingston et al., 2006). The fecal matter of insectivorous
bats, abundant on cave floors not only provides a source of nutrients for invertebrates in
cave ecosystems but also is used by humans as a fertilizer for agricultural crops
(Mildenstein & de Jong, 2011). Moreover, certain species of bats should be given more
attention as some are capable of transmitting virus to humans and other animals
(Calisher, 2006). For instance, the Nipah and Hendra viruses from fruit bats once caused
5
diseases in humans in Malaysia (Halpin et al., 2000; Yob et al., 2001). Hence, bats are
reservoirs for infectious diseases whose epidemiology may reflect environmental stress
(Jones et al., 2009).
2.2 Bats as biodiversity indicators
The use of indicator taxa in biodiversity assessment overcomes the lack of
human resources (e.g. time, money and trained personnel) as it acts as a ‘proxy’ for the
entire biota or “total” biodiversity (Moreno et al., 2007). Collectively, these species
must have stable taxonomy, be easily surveyed, widely distributed and show graded
responses to habitat changes which correlate with the responses of other taxa (Spector &
Forsyth, 1998; Moreno et al., 2007).
Fenton et al. (1992) suggested that the subfamily Phyllostominae is useful as a
habitat indicator since they were captured more often in forested than unforested sites in
Mexico. High species richness of Phyllostominae in a community indicates a healthy
habitat, and the assessment of bat assemblages was suggested to provide sufficient data
for decision-making in conservation (Medellin et al., 2000). Castro-Luna et al., (2007)
were able to evaluate the responses of bats to habitat modification by comparing the
richness, diversity and abundance of specific feeding guilds and intra-family levels. In
contrast to the Neotropics, there has been a lack of studies assessing the potential of bats
as a biodiversity indicator group in Southeast Asia.
2.3 Bats as ecotoxicology indicator
In addition to the potential role of bats as a biodiversity indicator, bats could also
be employed as an indicator of ecological health in the field of ecotoxicology. The
6
position of insectivorous bats at a high trophic level could expose them to high levels of
contaminants (e.g. heavy metals - lead, cadmium, mercury) through their diet (Alleva et
al., 2006; Jones et al., 2009). Bats that feed on insects emerging from aquatic systems
can show accumulation of heavy metals such as mercury consumed through their insect
prey (Wada et al., 2010). However, relatively little attention has been paid to the
concentration of contaminants in bats or other insectivorous animals (Hickey et al.,
2001).
In the case of mercury, if it is present in the aquatic insect prey, there should
be accumulation of mercury in the fur of insectivorous bats. For instance, measurements
for hair taken from insectivorous bats captured in the South River, Virginia, USA,
exceeded the specified adverse mercury effect levels of 10 ppm (Nam et al., 2012).
Individuals with mercury levels >10 ppm can experience significant and detrimental
changes to brain neurochemistry (Wada et al., 2010, Nam et al., 2012). Despite the
protected status of bats and their role as bioindicators of general ecosystem health (Jones
et al., 2009) the group has not previously been used as a model in ecotoxicology studies
in Malaysia.
7
CHAPTER 3
CHANGING PERSPECTIVES ON THE DIVERSITY OF BATS
(CHIROPTERA) AT ULU GOMBAK SINCE THE ESTABLISHMENT OF THE
FIELD STUDIES CENTRE IN 1965
3.1 Introduction
In Southeast Asia, the nineteenth century saw a dramatic increase in the rate of
discovery of bat species, a trend that leveled off during the first half of the twentieth
century (Kingston, 2010). However, over the last two decades, as a result of intensive
and new surveying approaches, 14 new species of bats have been described from
Southeast Asia, not only from new study sites, but also from well-studied areas (e.g.,
Bates et al., 2000; Hendrichsen et al., 2001; Matveev, 2005). Peninsular Malaysia
supports more than 100 bat species (Simmons, 2005), representing approximately 40%
of the native mammal species (Medway, 1982). The species richness of bats at Ulu
Gombak, reported as 50 species (Heller & Volleth, 1995), was the highest recorded bat
species for a single locality in the Old World until an intensive sampling effort
uncovered 65 species at Krau Wildlife Reserve, Pahang (Kingston et al., 2003).
Bats have been proposed as important indicators of the state of ecological
communities, and bat surveys are often used for conservation planning on the
assumption that the protection of bats will protect key habitat for many other taxa
(Francis et al., 2010). However, rapid changes in land use and deforestation in Malaysia
in recent decades have put many of the bat species at risk of extinction (Sodhi et al.,
2004). Accurate species identifications are important to assess bat diversity but due to
the presence of hidden species within cryptic species complexes, the identity of many
8
Malaysian bats appears to be uncertain (Kingston, 2010). It has been suggested that the
real number of bat species is at least twice that currently recognized (Francis et al.,
2010). The increased use of molecular methods, particularly DNA barcoding (Wilson et
al., 2014), for bat species identification is proving invaluable in differentiating cryptic
taxa overlooked by morphological methods. In the present ethical climate, the fact that
accurate species identification can be achieved from small wing tissue punches without
the need to sacrifice individuals is another significant advantage (Wilson et al., 2014).
Ulu Gombak Field Studies Centre, founded by Medway in 1965 (Medway,
1966), occupies approximately 120 ha of the 17,000 ha Ulu Gombak Forest Reserve.
Several pioneering studies in ecology have been conducted at the field centre and a
multitude of new species from diverse taxonomic groups have been described from Ulu
Gombak by various researchers from all over the world (e.g., Macdonald & Mattingly,
1960; Ballerio & Maruyama, 2010; Nuril Aida & Idris, 2011). The objective of the
present study was to investigate the changing perspectives on bat diversity at Ulu
Gombak since the establishment of the field study centre, and particularly how
estimates of species richness have changed very recently due to the inclusion of DNA
barcoding into surveys.
9
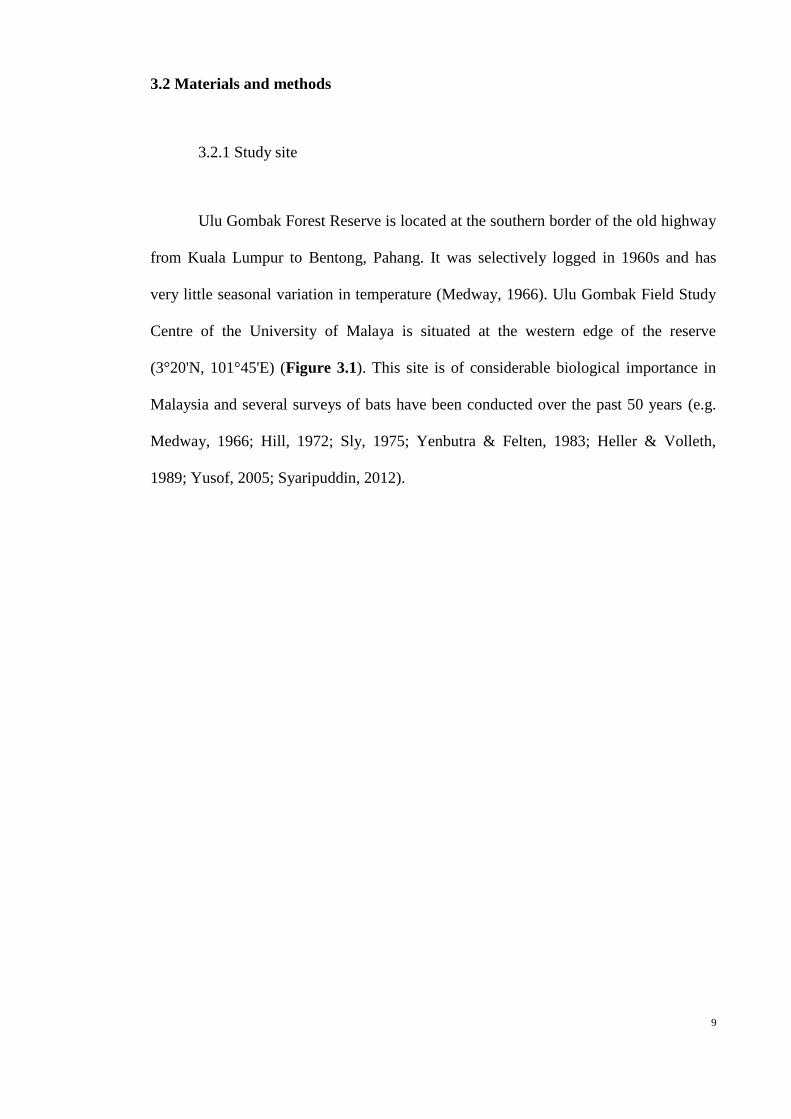
3.2 Materials and methods
3.2.1 Study site
Ulu Gombak Forest Reserve is located at the southern border of the old highway
from Kuala Lumpur to Bentong, Pahang. It was selectively logged in 1960s and has
very little seasonal variation in temperature (Medway, 1966). Ulu Gombak Field Study
Centre of the University of Malaya is situated at the western edge of the reserve
(3°20'N, 101°45'E) (Figure 3.1). This site is of considerable biological importance in
Malaysia and several surveys of bats have been conducted over the past 50 years (e.g.
Medway, 1966; Hill, 1972; Sly, 1975; Yenbutra & Felten, 1983; Heller & Volleth,
1989; Yusof, 2005; Syaripuddin, 2012).
10
Figure 3.1: Location of Ulu Gombak Forest Reserve and Ulu Gombak Field Studies Centre.
11
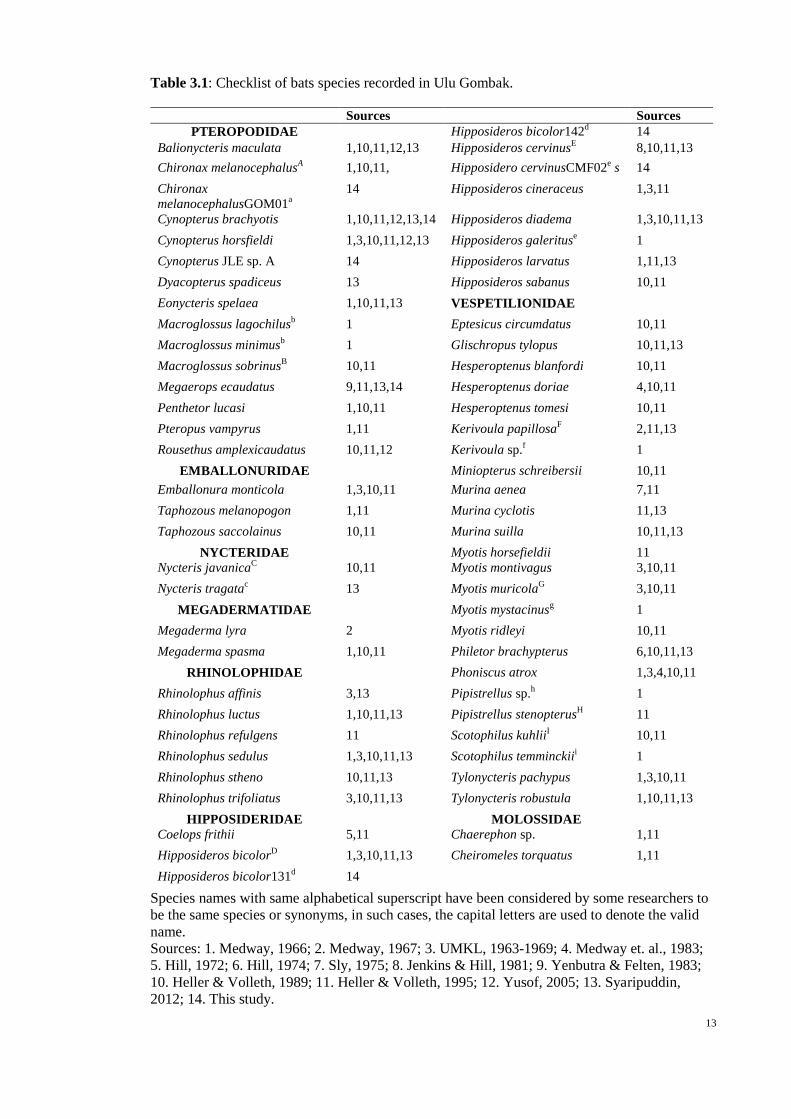
3.2.2 Literature review and museum specimens
Records of bat species recorded at Ulu Gombak since 1966 were extracted from
literature (Table 3.1). The collection of the Museum of Zoology, University of Malaya
(UMKL) was examined for preserved bat specimens collected from Ulu Gombak.
3.2.3 DNA barcoding
Ten mist nets (9 × 4 m) and four harp traps were set at ten locations within Ulu
Gombak Forest Reserve from 11–15 November 2012 and 11–14 March 2013. The nets
and traps were checked hourly from sunset (19:30) to late night (22:00) and again at
sunrise (07:30). The protocols for tissue sampling, DNA extraction, amplification and
sequencing of bat DNA barcodes followed Wilson (2012) and Wilson et al. (2014)
using the universal vertebrate primer pair VF1d_t1 and VR1d_t1 (Ivanova et al., 2012).
The resulting DNA barcodes were uploaded to BOLD (Ratnasingham & Hebert, 2007)
and are available (with GenBank Accessions) in the public dataset DS-MEDWAY.
DNA barcodes were assigned to species using the ‘Full Database’ (see Wilson et al.,
2014).

12
3.3 Results
One hundred and sixty records of bats at Ulu Gombak were extracted from
literature and the UMKL collection resulting in 52 traditional species records between
1962 and 2012 (Table 3.1; Figure 3.2). This represents an increase of one species every
two years between the initial checklist of Medway (1966), based on an Institute for
Medical Research report and our study.
13
Table 3.1: Checklist of bats species recorded in Ulu Gombak.
Sources Sources
PTEROPODIDAE Hipposideros bicolor142d 14
Balionycteris maculata 1,10,11,12,13 Hipposideros cervinusE 8,10,11,13
Chironax melanocephalusA 1,10,11, Hipposidero cervinusCMF02
e s 14
Chironax
melanocephalusGOM01a
14 Hipposideros cineraceus 1,3,11
Cynopterus brachyotis 1,10,11,12,13,14 Hipposideros diadema 1,3,10,11,13
Cynopterus horsfieldi 1,3,10,11,12,13 Hipposideros galerituse 1
Cynopterus JLE sp. A 14 Hipposideros larvatus 1,11,13
Dyacopterus spadiceus 13 Hipposideros sabanus 10,11
Eonycteris spelaea 1,10,11,13 VESPETILIONIDAE
Macroglossus lagochilusb 1 Eptesicus circumdatus 10,11
Macroglossus minimusb 1 Glischropus tylopus 10,11,13
Macroglossus sobrinusB 10,11 Hesperoptenus blanfordi 10,11
Megaerops ecaudatus 9,11,13,14 Hesperoptenus doriae 4,10,11
Penthetor lucasi 1,10,11 Hesperoptenus tomesi 10,11
Pteropus vampyrus 1,11 Kerivoula papillosaF 2,11,13
Rousethus amplexicaudatus 10,11,12 Kerivoula sp.f 1
EMBALLONURIDAE Miniopterus schreibersii 10,11
Emballonura monticola 1,3,10,11 Murina aenea 7,11
Taphozous melanopogon 1,11 Murina cyclotis 11,13
Taphozous saccolainus 10,11 Murina suilla 10,11,13
NYCTERIDAE Myotis horsefieldii 11
Nycteris javanicaC 10,11 Myotis montivagus 3,10,11
Nycteris tragatac 13 Myotis muricola
G 3,10,11
MEGADERMATIDAE Myotis mystacinusg 1
Megaderma lyra 2 Myotis ridleyi 10,11
Megaderma spasma 1,10,11 Philetor brachypterus 6,10,11,13
RHINOLOPHIDAE Phoniscus atrox 1,3,4,10,11
Rhinolophus affinis 3,13 Pipistrellus sp.h 1
Rhinolophus luctus 1,10,11,13 Pipistrellus stenopterusH 11
Rhinolophus refulgens 11 Scotophilus kuhliiI 10,11
Rhinolophus sedulus 1,3,10,11,13 Scotophilus temminckiii 1
Rhinolophus stheno 10,11,13 Tylonycteris pachypus 1,3,10,11
Rhinolophus trifoliatus 3,10,11,13 Tylonycteris robustula 1,10,11,13
HIPPOSIDERIDAE MOLOSSIDAE
Coelops frithii 5,11 Chaerephon sp. 1,11
Hipposideros bicolorD 1,3,10,11,13 Cheiromeles torquatus 1,11
Hipposideros bicolor131d 14
Species names with same alphabetical superscript have been considered by some researchers to
be the same species or synonyms, in such cases, the capital letters are used to denote the valid
name.
Sources: 1. Medway, 1966; 2. Medway, 1967; 3. UMKL, 1963-1969; 4. Medway et. al., 1983;
5. Hill, 1972; 6. Hill, 1974; 7. Sly, 1975; 8. Jenkins & Hill, 1981; 9. Yenbutra & Felten, 1983;
10. Heller & Volleth, 1989; 11. Heller & Volleth, 1995; 12. Yusof, 2005; 13. Syaripuddin,
2012; 14. This study.

14
Figure 3.2: Cumulative number of bat species recorded at Ulu Gombak Forest Reserve and the
projected number (dashed line) of bat species after intensive DNA barcoding.
0
20
40
60
80
100
120
19
50
19
60
19
70
19
80
19
90
20
00
20
10
20
20
20
30
Cum
ula
tive
nu
mb
er
o
f sp
ecie
s
Year
15
DNA barcodes were successfully amplified and sequenced from 45 specimens
sampled in our surveys during 2012/2013. The DNA barcodes were assigned into seven
taxa (Table 3.2). Of these seven, four species were dark taxa (Maddison et al., 2012;
Wilson et al., 2014) in the genera Cynopterus (Figure 3.3) and Hipposideros (see
Francis et al., 2010; Wilson et al., 2014). One DNA barcode matched to Chironax
melanocephalus but with only 95.8% similarity (Table 3.2; Figure 3.3) suggesting this
belonged to a cryptic species which was annotated as C. melanocephalusGOM01.
Therefore, of the seven species sampled in our surveys, five (71%) were dark or cryptic
taxa. This value and the tally of 52 traditional species were used to extrapolate that the
species richness of Ulu Gombak could be 89 bat species (Figure 3.2).
16
Table 3.2: Taxonomic name, similarity (%) and BOLD BIN of the closest matching DNA
barcodes to our 45 specimens collected at Ulu Gombak in 2012/2013. The name in
parentheses has also been used for the dark taxon.
Field ID Name of the closest match Similarity
with closest
match (%)
BOLD BIN
BGH-1 Cynopterus JLE sp. A 99.7 BOLD:AAA9308
BGM-10 Cynopterus brachyotis 99.3 BOLD:AAA9800
BGM-11 Cynopterus brachyotis 99.5 BOLD:AAA9800
BGH-12 Hipposideros cervinusCMF02 100.0 BOLD:AAB6249
BGM-14 Megaerops ecaudatus 99.4 BOLD:ABA9836
BGM-15 Cynopterus brachyotis 99.7 BOLD:AAA9800
BGM-16 Megaerops ecaudatus 98.7 BOLD:ABA9836
BGM-17 Cynopterus brachyotis 99.8 BOLD:AAA9800
BGM-18 Megaerops ecaudatus 99.3 BOLD:ABA9836
BGM-19 Chironax melanocephalus
(Chironax melanocephalusGOM01)
95.8 BOLD:AAE9045
BGM-20 Cynopterus JLE sp. A 99.3 BOLD:AAA9308
BGM-21 Cynopterus brachyotis 98.7 BOLD:AAA9800
BGM-22 Cynopterus brachyotis 99.5 BOLD:AAA9800
BGM-23 Megaerops ecaudatus 98.7 BOLD:ABA9836
BGM-24 Megaerops ecaudatus 99.7 BOLD:ABA9836
BGM-25 Cynopterus brachyotis 99.7 BOLD:AAA9800
BGM-26 Megaerops ecaudatus 98.4 BOLD:ABA9836
BGM-27 Cynopterus brachyotis 99.5 BOLD:AAA9800
BGM-2 Hipposideros cervinusCMF02 99.8 BOLD:AAB6249
BGM-3 Cynopterus brachyotis 99.5 BOLD:AAA9800
BGH-4 Hipposideros cervinusCMF02 100.0 BOLD:AAB6249
BGM-5 Cynopterus brachyotis 99.7 BOLD:AAA9800
17
Table 3.2, continued.
Sample Species Similarity
with closest
match (%)
BIN URI
BGM-7 Megaerops ecaudatus 99.2 BOLD:ABA9836
BGM-6 Hipposideros cervinusCMF02 99.6 BOLD:AAB6249
BGM-8 Hipposideros cervinusCMF02 99.5 BOLD:AAB6249
BGM-9 Cynopterus JLE sp. A 99.0 BOLD:AAA9308
TF-5 Cynopterus brachyotis 99.1 BOLD:AAA9800
TF-6 Cynopterus JLE sp. A 100.0 BOLD:AAA9308
TF-8 Cynopterus brachyotis 98.2 BOLD:AAA9800
TF-9 Hipposideros cervinusCMF02 100.0 BOLD:AAB6249
TF-15 Hipposideros cervinusCMF02 100.0 BOLD:AAB6249
TF-20 Hipposideros cervinusCMF02 100.0 BOLD:AAB6249
TI-10 Hipposideros cervinusCMF02 97.5 BOLD:AAB6249
TI-13 Hipposideros bicolor131 99.7 BOLD:AAD3329
TI-14 Hipposideros cervinusCMF02 99.8 BOLD:AAB6249
TI-16 Hipposideros cervinusCMF02 99.5 BOLD:AAB6249
TI-18 Hipposideros cervinusCMF02 100.0 BOLD:AAB6249
TI-21 Hipposideros cf. bicolor
(H. bicolor142)
100.0 BOLD:AAC0445
TI-22 Hipposideros cervinusCMF02 99.8 BOLD:AAB6249
TI-23 Hipposideros cervinusCMF02 100.0 BOLD:AAB6249
TI-24 Hipposideros cervinusCMF02 100.0 BOLD:AAB6249
TI-7 Hipposideros cervinusCMF02 100.0 BOLD:AAB6249
TI-8 Hipposideros cervinusCMF02 100.0 BOLD:AAB6249
TF-7 Cynopterus brachyotis 98.5 BOLD:AAA9800
TI-12 Hipposideros cf. bicolor
(H. bicolor142)
100.0 BOLD:AAC0445
18
a)
b)
Figure 3.3: Neighbor-joining trees produced by BOLD identification engine for the identification of
DNA barcodes a) BGM-19 and b) BGH-1 from bats sampled at Ulu Gombak.
19
3.4 Discussion
Ulu Gombak has been recognized as the home of one of the most diverse
community of bats in the Old World based on species richness (Kingston et al., 2003).
The literature review and examination of the UMKL collection revealed a total of 52
traditional species records with several taxa missed or omitted in previous compilations.
For example, one specimen of Rhinolophus affinis in UMKL, collected at Ulu Gombak
in 1963; was not included in the checklists of Medway (1966) or Heller & Volleth
(1995). This highlights the importance of museum collections as historical records of
biodiversity that are relevant and accessible to contemporary research projects. Overall,
28 new records for bat species were documented at Ulu Gombak since the establishment
of Ulu Gombak Field Study Centre in 1966, equivalent to one additional species record
every two years.
All the previous checklists reviewed in the present study have relied upon
morphological identification of species. However, the reported presence of cryptic taxa
within morphological species makes diversity assessment using morphological criteria
questionable. For example, “Hipposideros bicolor” includes two morphologically
similar species (H. bicolor131 and H. bicolor142) (Kingston et al., 2001), both present
at Ulu Gombak. Cryptic taxa like these can only be recognized by acoustic and/or
molecular methods such as DNA barcoding (Kingston et al., 2001; Francis et al., 2010).
Recently a cryptic species from the genus Kerivoula with extremely similar morphology
(but possibly an unusual fur coloration) to K. hardwickii has been described as K. krau
from Krau Wildlife Reserve after being confirmed by an 11% divergence in DNA
barcodes (Francis et al., 2007).
20
When DNA barcoding was incorporated into a survey of bats at Ulu Gombak,
DNA barcodes from this survey were found to match the DNA barcodes in BOLD
belonging to documented species (e.g., Francis et al., 2010) that do not yet have formal
species names. These have come to be known as “dark taxa” (Maddison et al., 2012;
Wilson et al., 2014). As a result of this survey, five species (dark taxa) were added to
the cumulative checklist for Ulu Gombak taking the total to 57 species. Chironax
melanocephalaGOM01 had not been reported in prior studies, but the deep DNA
barcode divergence (4.2%) from conspecifics from Indonesia strongly suggests this is a
cryptic species newly uncovered by this survey. Which one is the valid C.
melanocephala and whether the species are allopatric or both present at Ulu Gombak
remain to be seen. The high proportion of cryptic species sampled during relatively
small-scale surveys suggests that bat diversity at Ulu Gombak is not yet completely
known and is significantly underestimated.
The DNA barcodes from this survey were assigned a species identification with
high probability using the BOLD identification engine. This was also the case for the
dark taxa due to the extensive DNA barcode reference library for Southeast Asian bats
in BOLD (largely from Francis et al., 2010). DNA barcodes for H. bicolor fell into two
distinct clusters (see Francis et al., 2010; Wilson et al., 2014). Similarly, the deep DNA
barcode variation within morphological species in Cynopterus had been encountered in
prior DNA barcode surveys conducted at other locations. C. JLE sp. A is also known as
“C. cf. brachyotis Forest” (Francis et al., 2010) and has recently been subject to
morphometric cluster analysis (Jayaraj et al., 2012). These results support the view that
DNA barcoding provides an accurate, rapid and cost-effective approach for
identification of bats at Ulu Gombak. The high number of cryptic complexes in this
survey supports the suggestion of Francis et al. (2010) that the number of bat species in
21
Southeast Asia is significantly underestimated. The projected number of 89 bat species
for Ulu Gombak (Figure 3.2) provides a benchmark for future, more intensive surveys
using multiple trapping methods and covering a larger area of the reserve, but critically,
incorporating DNA barcoding for species recognition.
3.5 Conclusion
This study recorded five added bat species to the cumulative checklist for Ulu
Gombak taking the total to 57 species of bats. This suggested that bat diversity in the
site is not yet completely well studied and is significantly underestimated. The
importance of historical records of biodiversity from museum collections was
highlighted to be relevant to contemporary research projects. Also, the presence of
cryptic taxa which can only be recognized by acoustic and/or molecular methods such
as DNA barcoding makes diversity assessment utilizing morphological criteria
questionable. Hence, further intensive surveys using multiple trapping techniques which
cover larger part of the reserve should be conducted in the future, taking into account
the importance to incorporate DNA barcoding as well as access of museum collections
for more precise species inventories. The presence of cryptic species would need the
consideration to reexamine the total biodiversity of other forest reserves as well.
22
CHAPTER 4
ARE BUTTERFLIES, BATS AND BEETLES GOOD BIODIVERSITY
INDICATORS IN TROPICAL SOUTHEAST ASIA? AN ASSESSMENT USING
FOUR KEY CRITERIA AND DNA BARCODES
4.1 Introduction
The world is facing rapid growth of the human population and widespread
urbanization (United Nations, 2004; Bongaarts, 2009). In Asia in particular, the human
population has doubled over the last 40 years (Jones, 2013). Consequently, the
availability of habitats for wildlife is diminishing, resulting in extinction of species
(McKinney, 2002; Kowarik, 2011). Protecting habitats is vital to conserve populations
of species in decline. However, the designation of all remaining wild land as protected
areas is unrealistic. In an effort to conserve the most species, sites with the highest total
biodiversity should be selected to receive complete protection (Mittermeier et al., 1998).
Informed decision-making requires assessment of the biodiversity of a site (α-diversity)
and comparisons of biodiversity between sites (ß-diversity) (Martin et al., 2005), yet,
due to limited time and resources performing an inventory of all the species present at a
site is an impossibility. Thus, a relatively small group of species, sometimes even a
single species (Spitzer et al., 2009), is frequently used as a proxy for “total” biodiversity
(Ferris & Humphrey, 1999, Kerr et al., 2000, Koch et al., 2013).
Various criteria have been suggested for the selection of an ideal biodiversity
“indicator” group (e.g. Pearson, 1994; Ferris & Humphrey, 1999; Fleishman et al.,
2000; Cleary, 2004). The attributes commonly regarded as essential for a bioindicator
group can be synthesized under four key criteria:
23
(i) Tractable taxonomy – The component species must be easy to identify even by non-
specialists, facilitating comparisons between surveys conducted at different times,
different locations and by different researchers. DNA barcoding, the use of short
standardized DNA sequences for species identification, can impact on this criterion,
allowing rapid evaluation of species diversity by non-experts (Laforest et al., 2013; but
see Krishnamurthy & Francis, 2012).
(ii) Easily surveyed – A well-known ecology allows for the design of effective sampling
protocols that can be standardized and deployed in a cost- and time-efficient manner.
(iii) Broadly distributed higher taxa; specialized and habitat-sensitive lower taxa – The
group must be present at all sites with stable population sizes, but exhibit different
species composition at different sites.
(iv) Patterns of biodiversity reflected in other groups – The group should be a
biodiversity “umbrella”, meaning conservation of the group would benefit numerous co-
occurring species from other groups (Fleishman et al., 2000).
Various animal groups have been advocated as useful bioindicators including:
butterflies (Lepidoptera), due to their intimate relationship with plants (e.g. Thomas,
2005; Spitzer et al., 2009); bats (Chiroptera), due to their high diversity, top-predator
and conservation status (e.g. Pineda et al., 2005; Jones et al., 2009); and dung beetles
(Coleoptera), due to their ecological specialization and relationship with mammals (e.g.
Spector, 2006; Novelo et al., 2007). In this study butterflies, bats and beetles were
assessed against the four key criteria above to determine their potential as bioindicator
groups in tropical Southeast Asia.
24
4.2 Materials and methods
4.2.1 Field sites
Standardized surveys of the three target groups (butterflies, bats and dung
beetles) were conducted at Rimba Ilmu Botanic Garden, University of Malaya, Kuala
Lumpur (N 03° 7', E 101° 39') and Ulu Gombak Forest Reserve, Selangor (N 03° 19', E
101° 44') (Figure 4.1). Rimba Ilmu is an 80 ha tropical botanical garden, formerly a
rubber plantation, which houses over 1,600 species of tropical plants (Jussof, 2010). Ulu
Gombak Forest Reserve is a 17,000 ha selectively logged forest reserve (Sing et al.,
2013). The surveys were conducted at each site over three days and three nights and
were completed during two consecutive weeks in March 2013. The days were all dry
and sunny and the nights also clear and dry, with the exception of a small amount of
rain on the second night at Rimba Ilmu (<2 h).
25
Figure 4.1: The two study sites in Peninsular Malaysia.
26
4.2.2 Standardized sampling protocols
Butterflies were sampled using sweep nets by two experienced butterfly catchers
walking continuously at a standardized pace along two 1000 m transects, 500 m apart,
between 10:00 and 12:00 (following Pollard, 1977). The right hind leg (when viewed
dorsally) of each captured butterfly was collected into a 1.5 ml tube using forceps
before the butterfly was released. If a butterfly with no right hind leg was captured it
was released as a probable re-capture.
Ten mist nets and four harp traps were set along two transects 500 m apart
between 19:00-07:30 to sample bats. The nets and traps were checked every hour until
22:00 and then checked again at 07:30. A small wing punch was collected from each
captured bat into a 1.5 ml tube following AMNH (2013). If a bat with a wing punch was
captured it was released without re-sampling as a probable re-capture.
Beetles were sampled overnight using the standardized trapping protocol of
Inward et al. (2011) with slight modifications. In brief, 20 baited pitfall traps were set
10 m apart along two 90 m transects, 500 m apart. On each transect, five traps were
baited with fresh cow dung and five with raw chicken liver. Traps were emptied each
morning. Beetles were rinsed in ddH2O then complete specimens in the case of small
beetles, and single legs of large beetles, were placed individually into 1.5 ml tubes.
27
4.2.3 DNA barcoding
DNA extraction from bats and beetles was performed using a Nucleospin kit
(Machery-Nagel, Germany) and from butterflies using a XytXtract™ Animal kit
(Xytogen, Australia) following the manufacturers’ instructions. A first attempt was
made to PCR amplify the DNA barcode region of COI mtDNA following standard
protocols (Wilson, 2012) using the primer pairs LepF1/LepR1 for butterflies and beetles
and VF1d_t1/VR1d_t1 for bats (Wilson et al., 2014). If the first PCR failed PCR
troubleshooting was conducted using the primer pairs MLepF1/LepR1 (Wilson, 2012)
for butterflies and beetles and RonM/VF1d_t1 (Wilson et al., 2014) for bats. PCR
products were sequenced using LepR1 or the M13R (t1) tail. The DNA barcodes were
edited and aligned (Wilson, 2012) and sorted into molecular operational taxonomic
units (MOTU) using the online Automatic Barcode Gap Discovery (ABGD) system
(Puillandre et al., 2011). Previous studies have shown that there is typically a distinct
pattern to intra- and interspecies DNA barcode genetic distances, a “barcode gap”, but
that this pattern can be unique to a dataset. ABGD uses an automatic recursive
procedure to converge on the best patterns for the dataset and arranges DNA barcodes
into clusters accordingly. The median number of ABGD clusters was used as the basis
for the MOTU as this has produced good correspondence with traditional species in
empirical studies. Representatives of each MOTU were submitted to the full database of
the BOLD identification engine (Ratnasingham & Hebert, 2007) to assign a taxonomic
name to the MOTU. Species names were assigned using a >98% sequence similarity
threshold. When there was no match >98%, family names were assigned using the strict
tree-based method of Wilson et al. (2011) based on the “Tree Based Identification” of
the BOLD identification engine (Ratnasingham & Hebert, 2007). This method requires
28
the unknown DNA barcode to be nested within a cluster of sequences from the same
family.
4.2.4 Assessment of the groups against key criteria
(i) Tractable taxonomy – This criterion was assessed based on DNA barcoding success.
Successful PCR amplification on the first pass, and the number of MOTU assigned
taxonomic names, were quantified.
(ii) Easily surveyed – The number of individuals and MOTU sampled were divided by
the total number of person-hours required for surveying the group.
(iii) Broadly distributed higher taxa; specialized and habitat-sensitive lower taxa –
The similarity between sites in terms of higher taxa (families) and species (MOTU) was
assessed using the Sorenson Similarity index. The index has values between 0 and 1
with 1 indicating identicalness. For families, values closer to 1 are preferable, whereas
for species, values closer to 0 are preferable.
(iv) Patterns of biodiversity reflected in other groups – The relationship between the
species richness of each group was analyzed using Pairwise Spearman’s Rank
Correlation (following Koch et al., 2013).
29
4.3 Results
4.3.1 Tractable taxonomy
The PCR success rate on the first pass was high for both bats and butterflies
(>70%) but low for beetles (36%) (Table 4.1). After troubleshooting, eighteen butterfly
DNA barcodes were discarded as likely contaminants as they were either messy
sequences or failed to match target taxa in BOLD. Two bat samples failed to PCR
amplify after several attempts. Two beetle samples also failed to PCR amplify after
several attempts while a further three were likely contaminants as they showed high
similarity with non-target taxa. The DNA barcodes produced for this study are available
on BOLD in the public dataset DS-MBIO. The number of MOTU assigned a species
and family name was high for butterflies and bats (>82%) compared with beetles (Table
4.1).
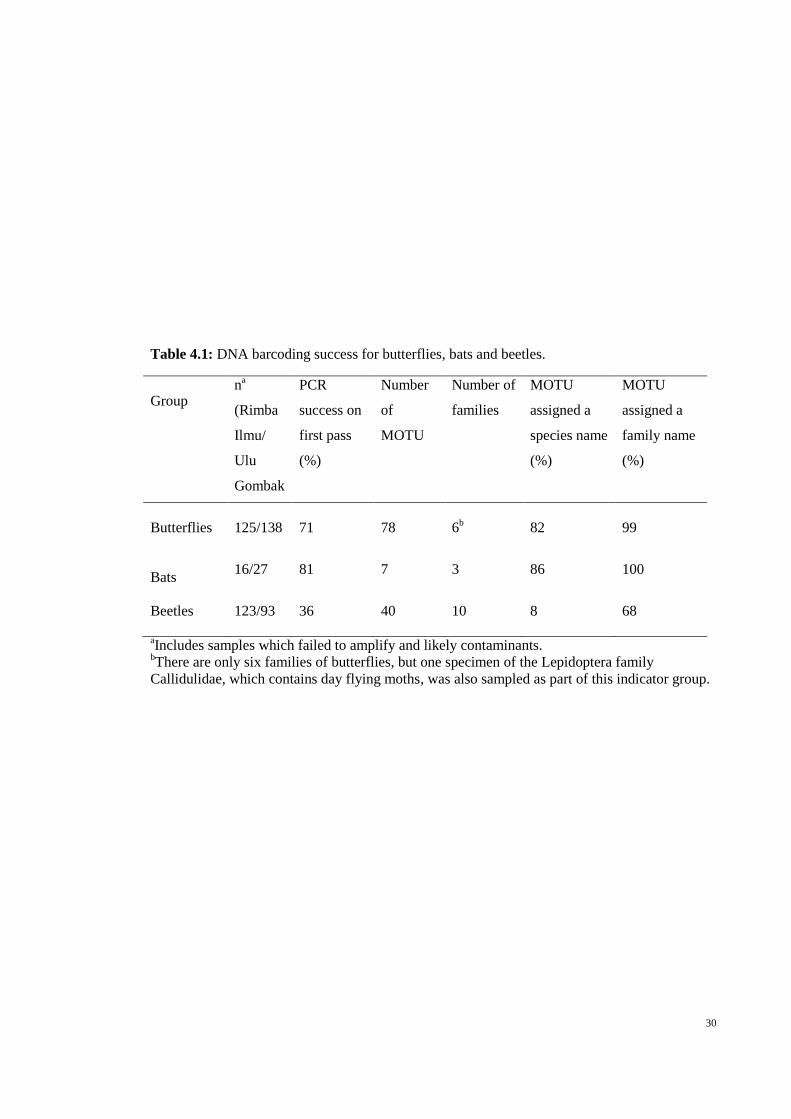
30
Table 4.1: DNA barcoding success for butterflies, bats and beetles.
Group n
a
(Rimba
Ilmu/
Ulu
Gombak
PCR
success on
first pass
(%)
Number
of
MOTU
Number of
families
MOTU
assigned a
species name
(%)
MOTU
assigned a
family name
(%)
Butterflies 125/138 71 78 6b 82 99
Bats 16/27 81 7 3 86 100
Beetles 123/93 36 40 10 8 68
aIncludes samples which failed to amplify and likely contaminants.
bThere are only six families of butterflies, but one specimen of the Lepidoptera family
Callidulidae, which contains day flying moths, was also sampled as part of this indicator group.

31
4.3.2 Easily surveyed
This study required 24 person-hours for sampling butterflies, 216 for sampling
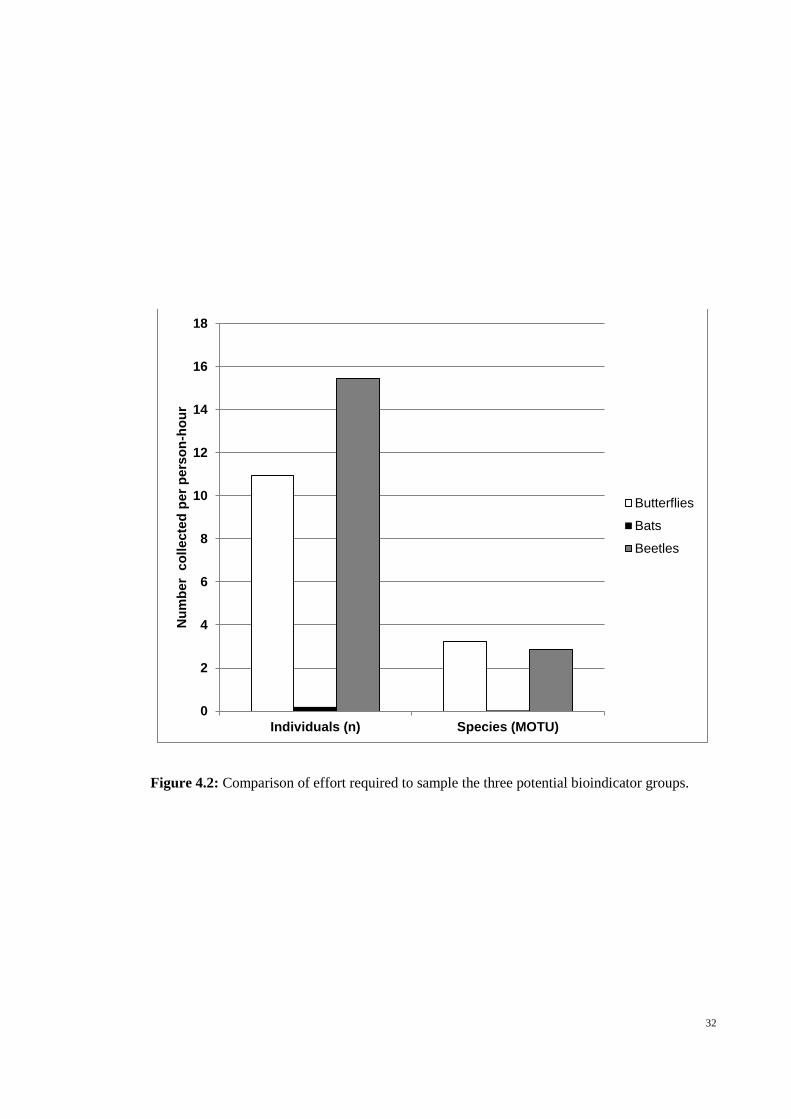
bats and 14 for sampling beetles. Bats accounted for an order of magnitude fewer
individuals and species sampled per person-hour than the butterflies and beetles (Figure
4.2).
32
Figure 4.2: Comparison of effort required to sample the three potential bioindicator groups.
0
2
4
6
8
10
12
14
16
18
Individuals (n) Species (MOTU)
Nu
mb
er
co
llecte
d p
er
pers
on
-ho
ur
Butterflies
Bats
Beetles
33
4.3.3 Broadly distributed higher taxa; specialized and habitat-sensitive lower
taxa
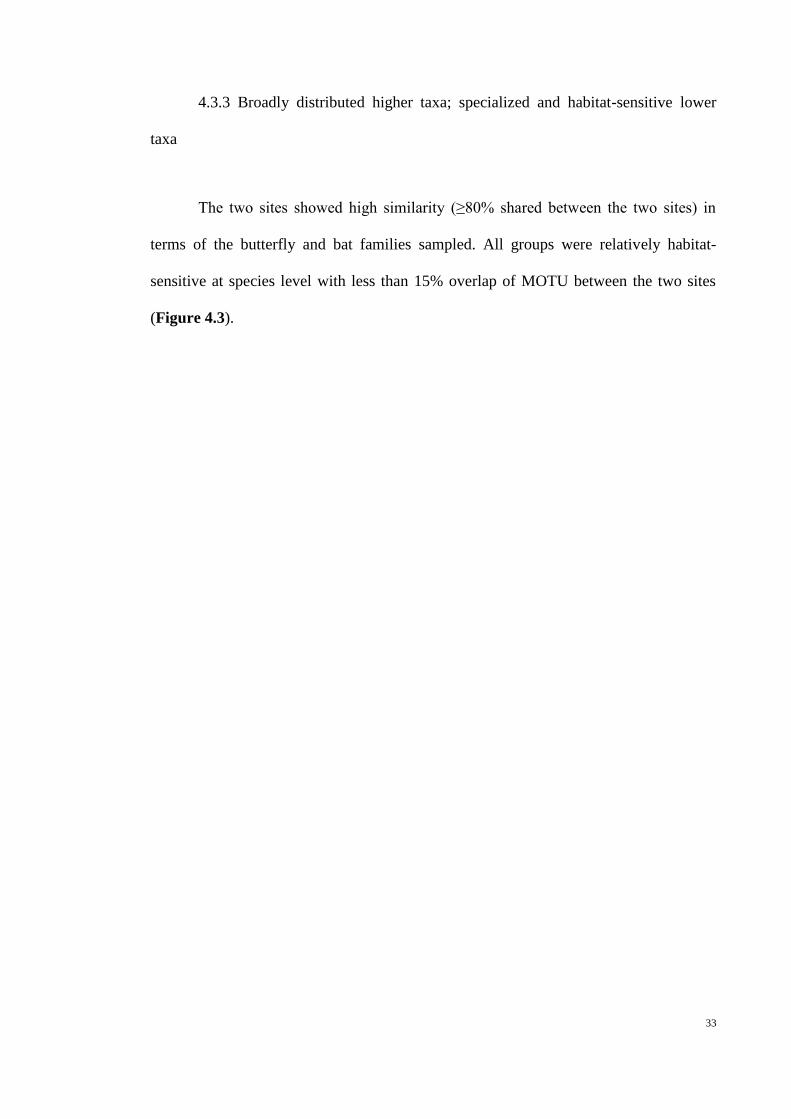
The two sites showed high similarity (≥80% shared between the two sites) in
terms of the butterfly and bat families sampled. All groups were relatively habitat-
sensitive at species level with less than 15% overlap of MOTU between the two sites
(Figure 4.3).
34
Figure 4.3: The distribution of butterfly, bat and beetle taxa between two sites, Rimba Ilmu and
Ulu Gombak.
0
0.1
0.2
0.3
0.4
0.5
0.6
0.7
0.8
0.9
1
Proportion ofshared taxa
Sorenson Index Proportion ofshared taxa
Sorenson Index
MOTU level Family level
Butterflies
Bats
Beetles

35
4.3.4 Patterns of biodiversity reflected in other groups
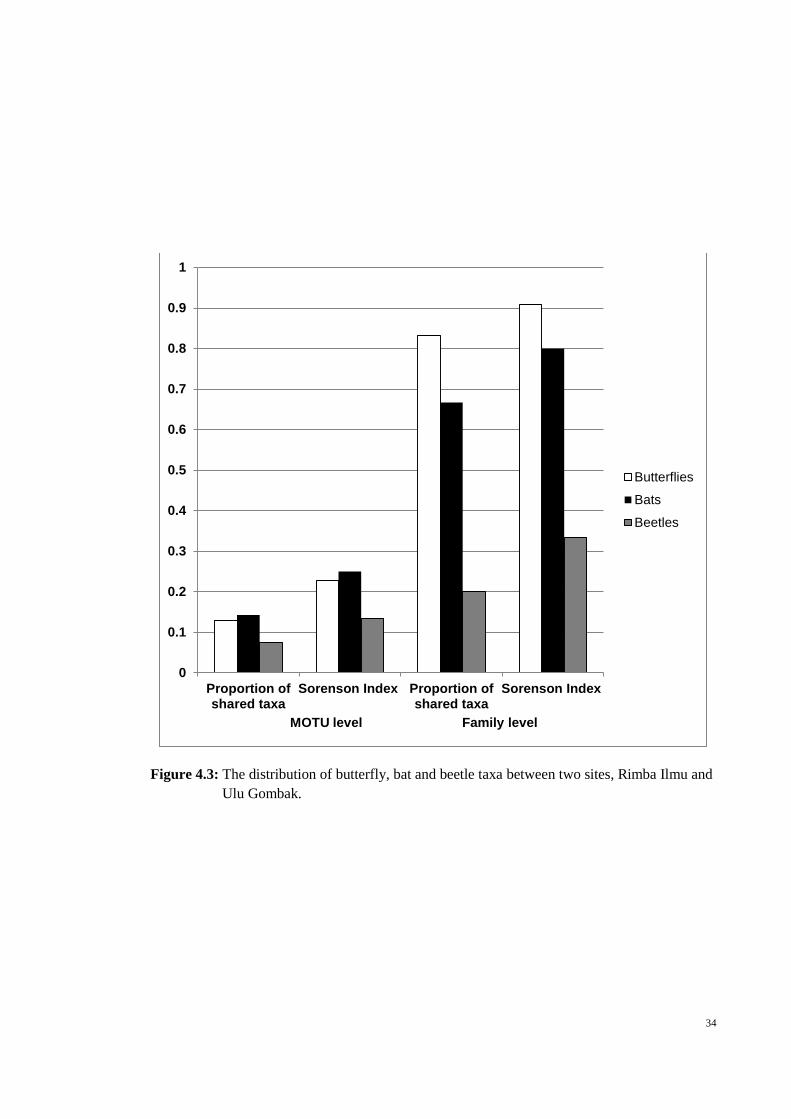
The species richness of all three groups were positively correlated with each
other (Table 4.2; Figure 4.4). The species richness of butterflies and bats were strongly
correlated and statistically significant (p <0.02). Both bat and beetle species richness
and beetle and butterfly species richness were weakly correlated and not statistically
significant (Table 4.2).

36
Table 4.2: Pairwise comparisons using Spearman’s Rank Correlation between species diversity
of butterflies, bats and beetles during six sampling events at Rimba Ilmu and Ulu
Gombak. Values below the diagonal are the Spearman’s Rank Correlation
coefficient; values above the diagonal are p-values.
Butterflies Bats Beetles
Butterflies
<0.02 <0.32
Bats 0.88 <0.82
Beetles 0.49 0.12
37
Figure 4.4: Patterns of species richness of butterflies, bats and beetles during six sampling
events at Rimba Ilmu and Ulu Gombak. The relationship between the species
richnesses of each group was analyzed using pairwise Spearman’s rank correlation.
0
5
10
15
20
25
30
35
1 2 3 1 2 3
Sp
ecie
s r
ich
ness
Rimba Ilmu Ulu Gombak
38
4.4 Discussion
In light of rapid habitat loss in Southeast Asia, there is a pressing need for a
standardized system of rapid, yet meaningful, measures of biodiversity. Considering
that performing a complete inventory of species at a site is impossible, it is not
surprising that research on the use of limited groups of species as indicators of
biodiversity has a long history (e.g. Pearson, 1994; Lawton et al., 1998; Jonsson &
Jonsell, 1999; Rainio & Niemelä, 2003). However, the choice of such indicator groups
still remains largely intuitive rather than evidence-based (Gillison et al., 2013). In this
study, a model for assessment of the bioindicator potential of a group based on four key
criteria was presented, which was then used to provide quantitative data on the
bioindicator potential of three groups (butterflies, bats and beetles) surveyed at two sites
in Peninsular Malaysia.
The first criterion used to assess bioindicator potential of a group was
“taxonomic tractability”, the ease of identifying component species by non-specialists.
For this study, this criterion was evaluated through DNA barcoding success. DNA
barcoding is the use of short standardized DNA sequences for species identification
(Kress & Erickson, 2012). Butterflies and bats have been the target of large DNA
barcoding campaigns (e.g. Clare et al., 2007; Janzen et al., 2009; Dincă et al., 2011)
including recently in Southeast Asia (Francis et al., 2010; Wilson, 2013). Consequently
the protocols for DNA barcoding these groups are well-optimized (Ivanova et al., 2012;
Wilson, 2012). Therefore it was not surprising that bats had high PCR amplification
success in this study (81% on the first pass) but the lower success (71%) for butterflies
was unexpected.
39
The DNA barcode reference libraries for Lepidoptera and Chiroptera are well-
developed with more than 700,000 DNA barcodes (75,000 species) for Lepidoptera and
20,000 DNA barcodes (700 species) for Chiroptera in BOLD. The large reference
libraries resulted in a high number (>82%) of assignments of species and family names
to the MOTU from these groups, after blasting representatives against BOLD. An
advantage of the DNA barcoding approach is that it can assign samples to “dark taxa”
adding precision to species inventories. “Dark taxa” are species that have been
previously recognized and reported by researchers, often through DNA barcoding, but
which have not (yet) been formally described (Maddison et al., 2012). For example,
Cynopterus cf. brachyotis Forest also known as Cynopterus JLE sp.A, reported by
Francis et al. (2010) was recorded in this study. Unlike butterflies and bats, beetles have
relatively poor coverage in BOLD and the lack of optimization for beetle DNA
barcoding is a major drawback to the use of beetles as a bioindicator group. DNA
barcoding studies of beetles have tended to target the 3’ end of COI mtDNA (Baselga et
al., 2013a) and the commonly used ‘Lep’ insect primers targeting the 5’ “barcode
region” (Wilson, 2012), as used in this study, seem to have low success for beetles.
However, new primers have recently been designed to target the 5’ region in beetles
(Baselga et al., 2013b) which could impact on the rating of beetles for this criterion
(Table 4.3).
40
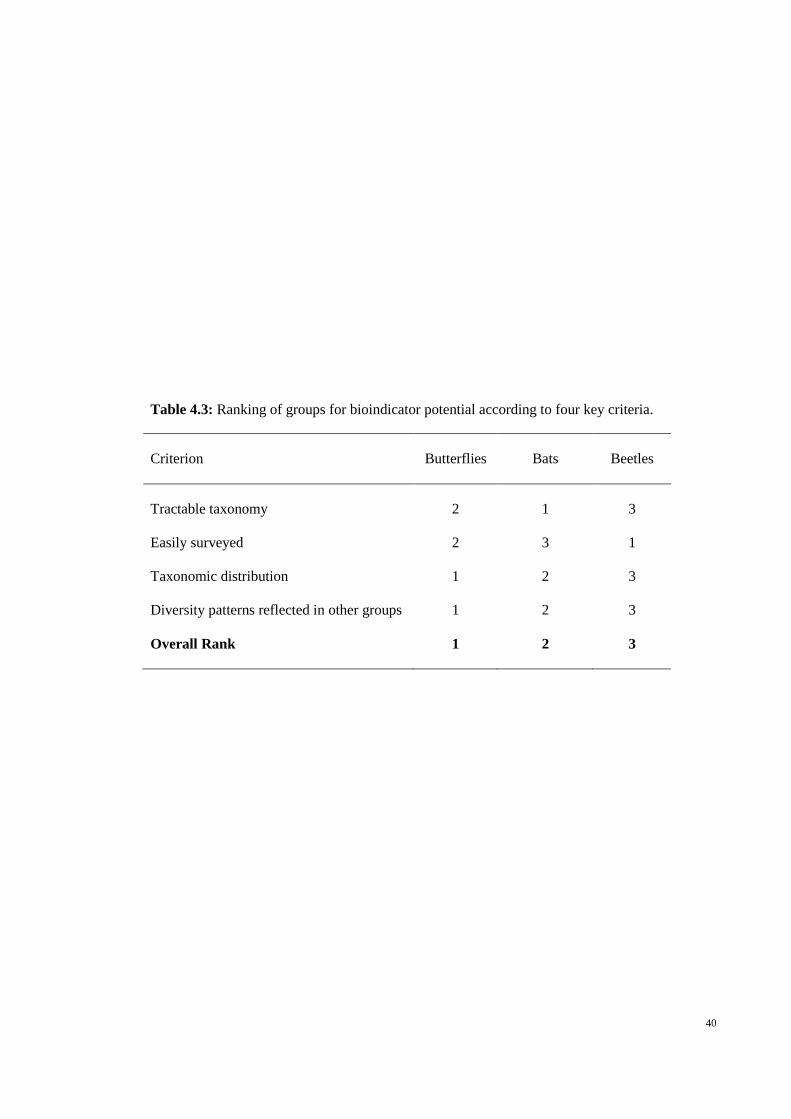
Table 4.3: Ranking of groups for bioindicator potential according to four key criteria.
Criterion Butterflies Bats Beetles
Tractable taxonomy 2 1 3
Easily surveyed 2 3 1
Taxonomic distribution 1 2 3
Diversity patterns reflected in other groups 1 2 3
Overall Rank 1 2 3
41
The second criterion used to assess bioindicator potential of a group was “easily
surveyed” and was quantified through cost- and time-efficiency of the sampling
protocol. In terms of person-hours required for the sampling protocols, beetles required
the least hours while bats required the most. Bat sampling requires at least two people to
set up and disassemble mist nets and harp traps, as well as to attend to the catch
regularly to avoid injury to the bats and escapees. Conversely, beetle traps can be set by
an individual and left unattended overnight. In terms of cost, bat sampling requires
expensive specialized equipment, while butterflies and beetles can be sampled with
inexpensive homemade devices. However, it is also worth considering the ease of
achieving a precisely comparable sampling protocol. For example, we can easily
imagine a tendency for keen butterfly collectors to target any “rare” or unusual species
they encounter during their walks rather than collecting randomly from among the
butterfly assemblages. An alternative approach to sweep net sampling could be to use
Malaise or light traps to sample lepidopterans and this may also reduce the required
person-hours. The pitfall traps were raided by dogs at Ulu Gombak but left undisturbed
at Rimba Ilmu. Ants were also a confounding factor, constructing nests over the traps at
Ulu Gombak and probably contributing to the lower number of beetles sampled at this
site. The choice of location for setting mist nets and harp traps can have an effect on the
efficiency of bat trapping, being influenced by vegetation and microclimate (Larsen et
al., 2007). Other factors affecting the ability to generate comparable survey data include
‘tourists’, and the seasonality of species (New, 1997).
The third criterion used to assess bioindicator potential of a group was “broadly
distributed higher taxa; specialized and habitat-sensitive lower taxa”. There was a high
similarity (>66%) of family composition at Rimba Ilmu and Ulu Gombak Forest Reserve
for both bats and butterflies. Bats are generally widespread in term of distribution but each
species occupies a specific habitat (e.g. caves, bamboos, hollow barks, foliages etc.)
42
(Francis, 2008). Butterflies are ubiquitous in vegetated terrestrial ecosystems yet
specialized, e.g. to disturbed or primary forest areas, as their caterpillars have strict
dependence on specific host plants (Kunte et al., 1999). The sampling included ten
families of beetles and the group exhibited a pattern of specialization at both low and
high taxonomic levels, although Scarabaeidae dominated the samples at both sites,
indicating their high preference for the baits (Larsen & Forsyth, 2005).
The fourth criterion used to assess bioindicator potential of a group was
“patterns of biodiversity reflected in other groups”. A good bioindicator group should
be able to be used to predict the diversity patterns of other unrelated groups at the site.
The species richness of all three groups were found to be correlated with each other.
The species richness of butterflies had a significant correlation with the species richness
of bats suggesting that the species richness of butterflies is useful to predict the species
richness of bats and vice versa. Harvey et al. (2006) likewise, found a significant
correlation between species richness of bats and nectarivorous butterflies in Rivas,
Nicaragua. However, in another study in the Neotropics, butterfly species richness was
found to be strongly correlated with species richness of birds but not with mammals
(Robbins & Opler, 1997). Under this criterion butterflies were ranked higher than bats
as the butterflies-beetles correlation was marginally stronger than the bats-beetles
correlation (Table 4.2).
43
4.5 Conclusions
In this study a model for the assessment of the bioindicator potential of a group
based on four key criteria was presented, which was then used to provide quantitative
data on the bioindicator potential of three groups, butterflies, bats, and beetles, surveyed
at two sites in Peninsular Malaysia. Butterflies had the most potential as a bioindicator
group ranking first in two of the criteria, taxonomic distribution and reflection of
diversity patterns in other groups, and second in another two, taxonomic tractability and
ease of surveying (Table 4.3).
DNA barcoding protocols for butterflies are well-optimized and there is a well-
developed DNA barcode reference library available with which to assign butterfly DNA
barcodes a precise taxonomic name. Furthermore, butterfly sampling requires only a
few hours per day with simple apparatus. Butterfly families are few and widespread, but
species are habitat specific due to a strict dependence on certain host plants. Butterfly
species richness showed a significant correlation with the species richness of another
unrelated animal group, bats. The ability to generate comparable survey data is an
important factor in the establishment of bioindicator groups as well as the development
of optimized DNA barcoding protocols and DNA barcode reference libraries. Despite
easy surveying, beetles suffered in the overall ranking due to inefficient PCR
amplification and low representation in BOLD.
The results suggest that out of the three animal groups assessed, butterflies has
the most potential as an indicator of biodiversity and surveys of butterflies should be
given more prominence in evaluation of biodiversity at sites in Southeast Asia.
44
CHAPTER 5
MERCURY ACCUMULATION IN BATS NEAR HYDROELECTRIC
RESERVOIRS IN PENINSULAR MALAYSIA
5.1 Introduction
Mercury (Hg) contamination has become a well-known global issue (Pacyna et
al., 2006; Selin et al., 2007) as the burning of coal, creation of hydroelectric dams,
metal mining and municipal waste incineration have increased and augmented the
amount of inorganic mercury entering the atmosphere and water sources (Chan et al.,
2003). Extensive deforestation and agricultural land use also release mercury from soils
creating point sources of local, acute contamination (Barbosa et al., 2003). Lake-
sediment records suggest locations distant from point source contamination can also
receive significant inputs of anthropogenically released mercury due to transcontinental
and global distribution of highly volatile, atmospheric mercury (Fitzgerald et al., 1998;
Chan et al., 2003).
In aquatic systems, relatively harmless inorganic mercuric (Hg2+
) or mercurous
(Hg+) forms of mercury are naturally present in the substrate, but can be transformed by
sulphate-reducing and iron-reducing bacteria to methylmercury (MeHg) (Chan et al.,
2003; Poulain & Barkay, 2013). Significant amounts of mercury can be introduced into
aquatic foodwebs during the flooding of forests (Barbosa et al., 2003), such as during
the construction of hydroelectric dams (Bodaly et al., 1984; Stokes & Wren, 1987;
Ikingura & Akagi, 2003). When a reservoir is created, submerged vegetation and
organic material start to slowly decompose (Rodgers et al., 1995), leading to a rise in
the dissolution rate of organic car- bon, increased release of mercury bound to organic
45
material and higher net mercury methylation rates (Chan et al., 2003). A deeper water
column and increased decomposition creates anoxic conditions which are ideal for
mercury methylation (Hylander et al., 2006). A study of reservoirs up to 67 years old
suggested that it may take 20–30 years before mercury concentrations return to pre-dam
levels (Hylander et al., 2006).
Methylmercury has been shown to be a potent neurotoxin in humans (Mergler et
al., 2007) and other mammals including bats and otters (Basu et al., 2005; Nam et al.,
2012). Central nervous system damage caused by methylmercury toxicity in mammals
includes motor and sensory deficits and behavioral impairment (Wolfe et al., 1998).
Increased levels of methylmercury in vertebrates have been shown to impair
reproductive system function (Wada et al., 2010; Nam et al., 2012). Methylmercury is
readily transferred across the placenta and can concentrate selectively in the fetal brain,
causing developmental alterations leading to fetal death (Wolfe et al., 1998). Infants can
also be exposed to methylmercury during lactation (Mergler et al., 2007).
Mercury biomagnifies as it moves up the food chain, with high trophic level
species, such as top predators showing higher concentrations of mercury in their tissues
than primary consumers, which absorb mercury (Barbosa et al., 2003, Stewart et al.,
2008). Insects that have aquatic larval stages could act as biovectors, exporting
methylmercury from aquatic systems upon emergence (Benoit et al., 2013; Mogren et
al., 2013). The biomass of aquatic insects can reach 190kg/ha per day in productive lake
systems (Mogren et al., 2013).
Most studies of environmental mercury contamination have been conducted in
temperate regions (e.g. Baxter, 1977; Tweedy et al., 2013), have measured total
mercury in fish (e.g. Barbosa et al., 2003), aquatic insects (e.g. Hall et al., 1998; Benoit
et al., 2013); or fish-eating birds and mammals (see Chan et al., 2003 and references
46
therein). In Malaysia, studies have examined mercury levels in fish and seafood (e.g.
Bloom, 1992; Agusa et al., 2005; Hajeb et al., 2009) and in humans living in coastal
communities, or in fishing communities near lakes (e.g. Sivalingam & Sani, 1980;
Hajeb et al., 2008).
Sixty reservoirs have been created as the result of hydroelectric damming over
the past 80 years in Malaysia (ICOLD, 2014). Twelve more dams, slated for
construction by 2020, have been planned for Malaysian Borneo alone (Herbertson,
2013; Thin, 2013). Despite the increasing concern regarding mercury contamination in
this global biodiversity hotspot, no studies currently exist of methylmercury
accumulation in non-human mammals.
One mammalian group showing potential as a model for the study of mercury
contamination and bioaccumulation through trophic levels is bats (Chiroptera) (Nam et
al., 2012; Yates et al., 2014). Bat assemblages occupy high and low trophic levels, are
species rich and abundant, and represent several distinct feeding guilds including
frugivorous and insectivorous species (Rojas et al., 2013). Insectivorous bats eat 20–
50% of their pre-feeding body mass in insects every night (Brunet-Rossinni & Austad,
2004) including insects with an aquatic larval life stage (e.g. Megaloptera, Trichoptera,
certain Diptera, certain Coleoptera, Neuroptera, Ephemeroptera, and Odonata) and/or
insects without an aquatic larval life stage (e.g. most Lepidoptera, and certain
Coleoptera) (Bogdanowicz et al., 1999; Fukui et al., 2006). The limited studies of the
diet of insectivorous bat species found in Malaysia (Hipposideros, and Rhinolophus)
suggest 1-4% of the insects consumed have an aquatic larval stage (Thabah et al., 2006;
Jiang et al., 2008). If mercury is present in aquatic insect prey, there should be
accumulation of mercury in the tissues of insectivorous bats. Hair and blood mercury
concentration are closely correlated (Yates et al., 2014) and both are accepted as valid
47
biomarkers of methylmercury exposure (US EPA, 2001). Hair generally has a 250-300
fold higher mercury concentration than blood (Mergler et al., 2007; Wada et al., 2010)
and mercury fixed in the hair at the time of collection is stable and can give a
longitudinal history of blood mercury levels (US EPA, 2001). To our knowledge no
studies have compared mercury concentration in insectivorous and frugivorous bat
species and there is only a single unpublished report of Hg concentrations in bats from
Malaysia (Yates, unpublished).
The overall objective of this study was to investigate whether the concentration
of total mercury in the fur of insectivorous bat species was significantly higher than that
in the fur of frugivorous bat species sampled near reservoirs created by hydroelectric
damming in Peninsular Malaysia.
48
5.2 Materials and methods
5.2.1 Study area
Bats were sampled on the shores of two major hydroelectric reservoirs in
Peninsular Malaysia: Temenggor Lake, Perak (N 05° 31’, E 101° 26’) and Kenyir Lake,
Terengganu (N 05° 08’, E 102° 46’) (Figure 5.1) between 16-25 July 2013. Temenggor
Lake was created in 1979 and is the second largest man-made lake in Peninsular
Malaysia, covering 15,200 ha (Lin, 2006) with an average depth of 127 m and average
width of 537 m (Davidson et al., 1995). The reservoir is filled by two major river
systems in the north, two in the east and one in the west (Norizam & Ali, 2000). The
lake is used as a supply for domestic water consumption (Khalik & Abdullah, 2012) and
is also fished by the local aboriginal community. Bats were sampled along the eastern
edge of Temenggor Lake (Figure 5.1a). Kenyir Lake was created in 1986 and is the
largest man-made lake in Peninsular Malaysia covering 36,900 ha with an average
depth of 37 m and a maximum depth of 145 m (Kamaruddin et al., 2011). The lake
receives water from two main rivers– the Terengganu River and the Terengan River
(Rouf et al., 2010). Bats were sampled along the northeastern edge of Kenyir Lake
(Figure 5.1b).
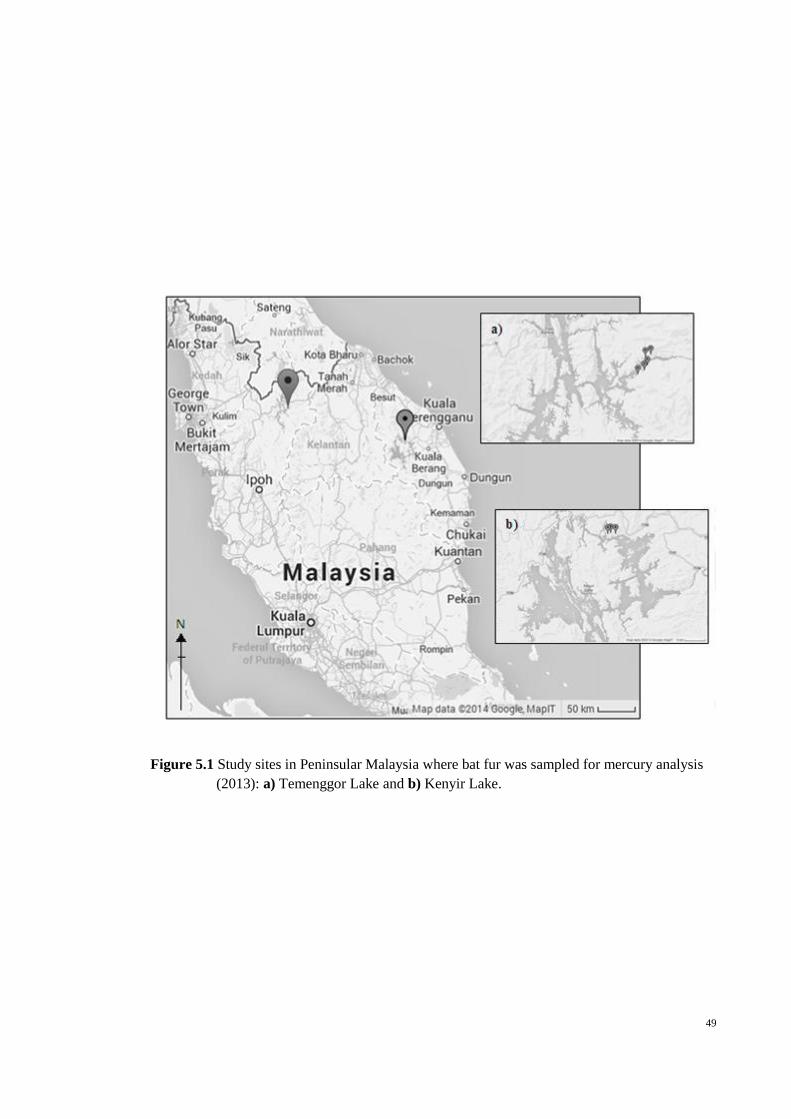
49
Figure 5.1 Study sites in Peninsular Malaysia where bat fur was sampled for mercury analysis
(2013): a) Temenggor Lake and b) Kenyir Lake.
50
5.2.2 Capture, sample collection and handling
Bats were captured using 4 four-bank harp traps positioned across flight paths
(trails, logging skids or streams) and ten mist nets set near the lake edge. Traps were set
at 19:00 until 07:30 and were checked at 30 minutes intervals with sampling continuing
until morning unless it rained. A small wing punch was collected from each captured
bat into a 1.5 ml microcentrifuge tube following AMNH (2013). Hair samples were
taken from each captured bat by snipping a small amount of hair (0.02g) from the upper
part of the body using stainless steel scissors. Hair was stored in a 1.5 ml
microcentrifuge tube. Scissors and forceps were cleaned with alcohol and sterile tissues
between bats to avoid cross-contamination. If a bat with a wing punch was captured it
was treated as a re-capture (Faure et al., 2009) and not subjected to another wing punch
or further hair sampling. Sex and lifestage of the captured bats were recorded. Bats were
identified in the field using morphological guides (Kingston et al., 2006; Francis, 2008),
but given the prevalence of cryptic bat species in Malaysia (Sing et al., 2013; Wilson et
al., 2014) species identification was confirmed using DNA barcoding (Francis et al.,
2010), following standard methods used in previous studies (see Sing et al., 2013;
Wilson et al., 2014).
5.2.3 Mercury analysis
Hair samples from adults of the most abundant genera of the two feeding guilds
- insectivorous (Hipposideros, Rhinolophus) and frugivorous (Cynopterus, Megaerops)
were selected for analysis of total mercury. We measured total mercury concentration in
fur which is a standard approach, and is directly proportional to the concentration of
methlymercury in the fur (Yates et al., 2014). Total mercury concentration was
51
measured using a Milestone Direct Mercury Analyzer (DMA-80) following US EPA
Method 7473 (US EPA, 2007). The total mercury detection limit is 0.001 mg/kg.
Quality control included the use of standard reference materials DORM-3
(percentage recovery = 89.2-101.1%) and DOLT-4 (percentage recovery = 96.1-
106.2%), running method blanks, sample blanks, and sample duplicates (percentage
recovery = 83.5-103.6%), initially and then every 20 samples. The percentage recovery
of spiked material was 92.7%.
5.2.4 Statistical analysis
Mercury concentration was compared between bats of different genera and
species (with singleton species omitted from the test) using one-way ANOVA with a
post-hoc Tukey HSD test; and between feeding guilds (frugivorous vs. insectivorous),
sites (Temenggor Lake vs. Kenyir Lake) and sexes using two-way ANOVA with a post-
hoc Tukey HSD test. All statistical analyses were performed using JMP 11.1.1 (SAS
Institute 2013).
52
5.3 Results
Forty-one samples (9 frugivorous bats and 32 insectivorous bats) from
Temenggor Lake and 87 samples (22 frugivorous bats and 65 insectivorous bats) from
Kenyir Lake were analyzed for mercury concentration, comprising 12 species (two
genera) of insectivorous bats and three species (two genera) of frugivorous bats. Note
that bat species in Malaysia are often “dark taxa”, species which have been recognized
and recorded previously but which have not yet been formally described (Sing et al.,
2013; Wilson et al., 2014), so a few of the species are referred to using non-Linnaean
species names (Table 5.1).
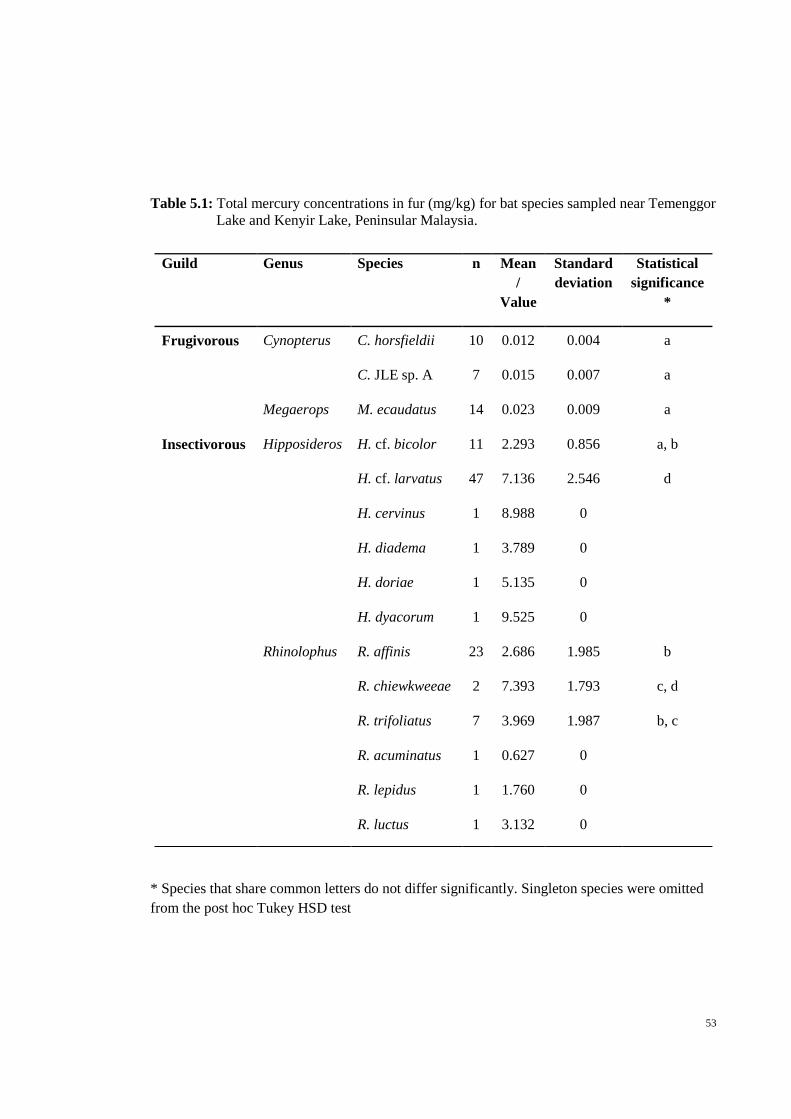
53
Table 5.1: Total mercury concentrations in fur (mg/kg) for bat species sampled near Temenggor
Lake and Kenyir Lake, Peninsular Malaysia.
* Species that share common letters do not differ significantly. Singleton species were omitted
from the post hoc Tukey HSD test
Guild Genus Species n Mean
/
Value
Standard
deviation
Statistical
significance
*
Frugivorous Cynopterus C. horsfieldii 10 0.012 0.004 a
C. JLE sp. A 7 0.015 0.007 a
Megaerops M. ecaudatus 14 0.023 0.009 a
Insectivorous Hipposideros H. cf. bicolor 11 2.293 0.856 a, b
H. cf. larvatus 47 7.136 2.546 d
H. cervinus 1 8.988 0
H. diadema 1 3.789 0
H. doriae 1 5.135 0
H. dyacorum 1 9.525 0
Rhinolophus R. affinis 23 2.686 1.985 b
R. chiewkweeae 2 7.393 1.793 c, d
R. trifoliatus 7 3.969 1.987 b, c
R. acuminatus 1 0.627 0
R. lepidus 1 1.760 0
R. luctus 1 3.132 0
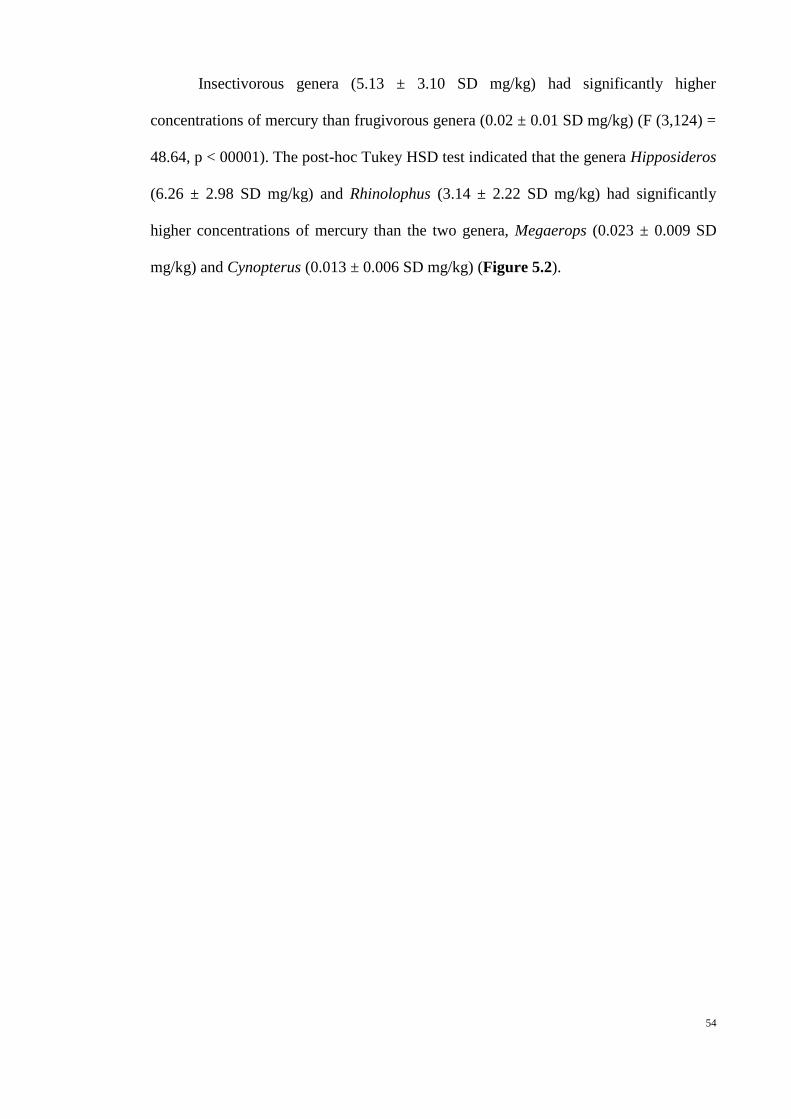
54
Insectivorous genera (5.13 ± 3.10 SD mg/kg) had significantly higher
concentrations of mercury than frugivorous genera (0.02 ± 0.01 SD mg/kg) (F (3,124) =
48.64, p < 00001). The post-hoc Tukey HSD test indicated that the genera Hipposideros
(6.26 ± 2.98 SD mg/kg) and Rhinolophus (3.14 ± 2.22 SD mg/kg) had significantly
higher concentrations of mercury than the two genera, Megaerops (0.023 ± 0.009 SD
mg/kg) and Cynopterus (0.013 ± 0.006 SD mg/kg) (Figure 5.2).
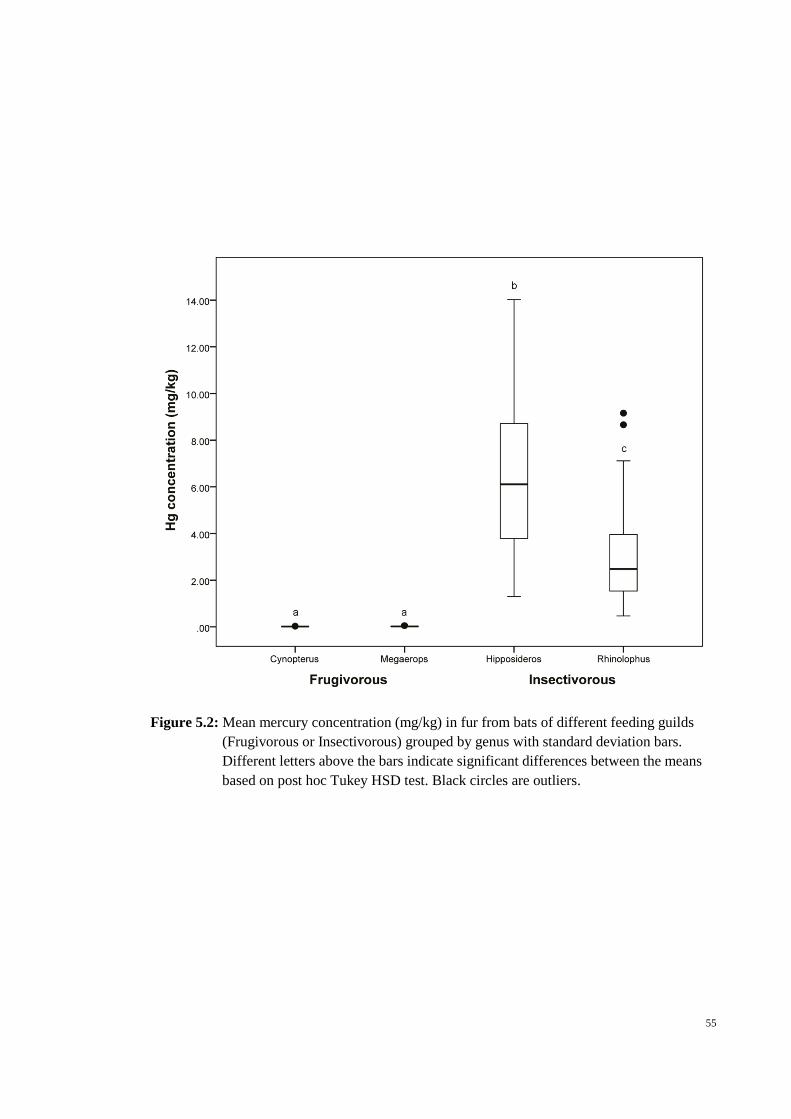
55
Figure 5.2: Mean mercury concentration (mg/kg) in fur from bats of different feeding guilds
(Frugivorous or Insectivorous) grouped by genus with standard deviation bars.
Different letters above the bars indicate significant differences between the means
based on post hoc Tukey HSD test. Black circles are outliers.
56
Hipposideros cf larvatus (7.136 ± 2.546 SD mg/kg) and Rhinolophus
chiewkweeae (7.393 ± 1.793 SD mg/kg) both had significantly higher mercury
concentrations than the other insectivorous species (with singleton species omitted).
There were no significant differences in mercury concentration among the frugivorous
bat species ((F (7,113) = 40.29, p < 0.0001); Table 5.1).
Mercury concentrations in insectivorous bats at Kenyir were significantly higher
than insectivorous bats at Temenggor (F (1,124) = 10.41, p = 0.0016). Grouped
separately by site, mercury concentrations in insectivorous bats were significantly
higher than frugivorous bats at both sites. The interaction between guild and site was
significant (F (1,124) = 10.50, p = 0.0015) (Figure 5.3).
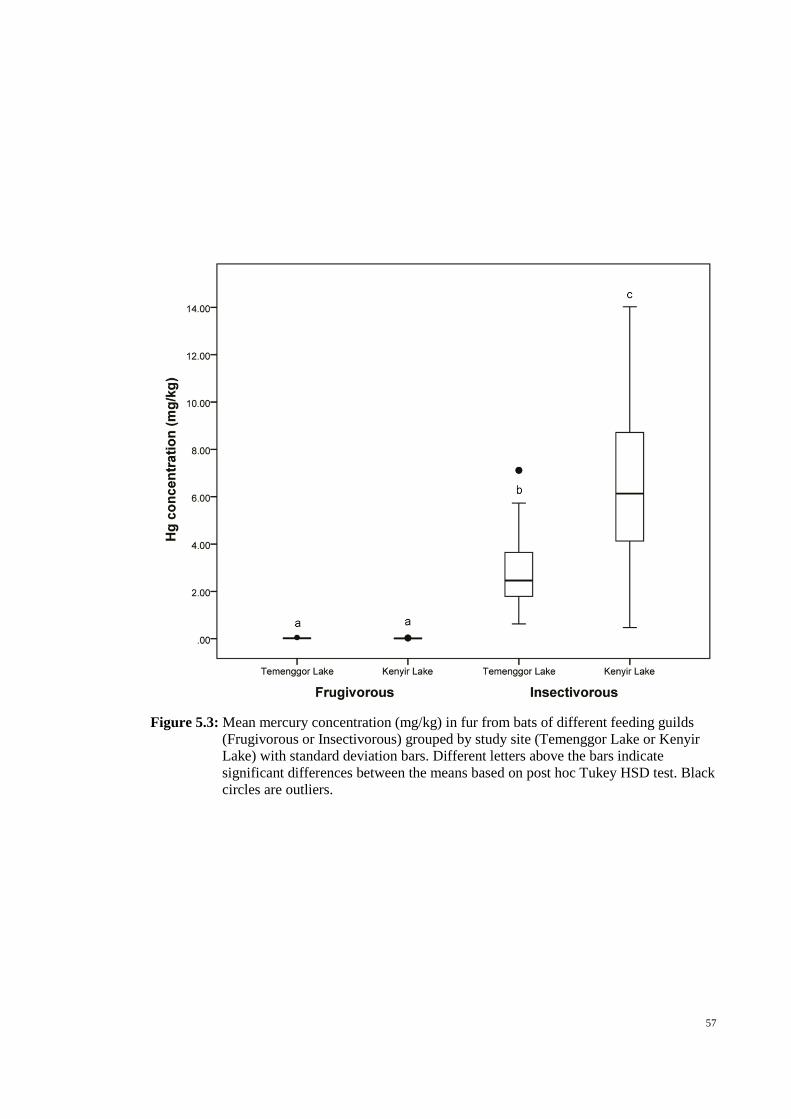
57
Figure 5.3: Mean mercury concentration (mg/kg) in fur from bats of different feeding guilds
(Frugivorous or Insectivorous) grouped by study site (Temenggor Lake or Kenyir
Lake) with standard deviation bars. Different letters above the bars indicate
significant differences between the means based on post hoc Tukey HSD test. Black
circles are outliers.

58
Comparison of mercury concentrations between sex was not significant (F
(1,124) = 0.0006, p = 0.9810). On average, females exhibited slightly lower mercury
concentrations (3.412 ± 3.669 SD mg/kg) than males (4.347 ± 3.261 SD mg/kg) (Figure
5.4).
59
Figure 5.4: Mean mercury concentration (mg/kg) in fur from bats of different feeding guilds
(Frugivorous or Insectivorous) grouped by sex with standard deviation bars.
Different letters above the bars indicate significant differences between the means
based on post hoc Tukey HSD test. Black circles are outliers.
60
5.4 Discussion
It was found that mercury concentration was significantly higher in the hair of
insectivorous bats than of frugivorous bats sampled at two hydroelectric lakes in
Peninsular Malaysia. This suggests that insectivorous bats could be accumulating
methylmercury through their diet. The diet of insectivorous bats includes emergent
aquatic insects (Fukui et al., 2006) that are, plausibly, contaminated with mercury from
the lakes (Tremblay & Lucotte, 1997; Tweedy et al., 2013). Other studies have
demonstrated that aquatic insects can act as biovectors transferring sedimentary mercury
from lakes into terrestrial predators on the shoreline (Haro et al., 2013; Tweedy et al.,
2013). Interestingly, Reidinger (1972) argued that mercury contamination in bats
probably occurred from their free water drinking source rather than through their insect
prey, however, this idea has largely been abandoned (Yates et al., 2014).
Of the two insectivorous genera analyzed for mercury concentration,
Hipposideros made up the largest proportion of analyzed samples (37%) and showed
significantly higher mercury concentrations than the Rhinolophus bats. This could be
due to a larger proportion of aquatic insects in the Hipposideros diet; however, records
on the diet of bat species in Malaysia are limited. One study conducted in various
secondary forests in Malaysia reported that 17% of the diet of H. larvatus s.l. consisted
of Coleoptera with the rest comprising unidentifiable insect fragments (Muda, 1991).
Thabah et al. (2006) reported that the diet of H. larvatus s.l. collected from 11 sites in
the Indo-Malayan region (India, China, Myanmar, Malaysia) comprised more than 80%
coleopterans. Alternatively, the diet of Rhinolophus affinis from a cave in Jiangxi
Province, China contained more than 50% of Lepidoptera (Jiang et al., 2008). While the
diet of insectivorous bats is likely to be opportunistic, relying on the presence and
density of prey species in the bats particular foraging area, this could suggest a larger
61
proportion of aquatic insect species in the diet of Hipposideros compared to
Rhinolophus bats, and may explain the increased exposure to mercury contamination of
Hipposideros bats in the study areas. It is also a possibility that Hipposideros bats could
be foraging more frequently and cover a larger area including over water bodies. But no
studies have documented this yet. The use of next generation DNA sequencing (NGS)
to establish the taxonomic identity of prey fragments - “DNA metabarcoding” - in feces
could help resolve this question (Razgour et al., 2011). Both the frugivorous bat genera
sampled, Cynopterus and Megaerops, showed significantly lower concentrations of
mercury (~99% lower than the insectivorous genera). The frugivorous bats were
expected to exhibit low concentrations of mercury because their diet likely contains
little mercury. Plant roots absorb small amounts of mercury from soils and the mercury
is not directly translocated from root tissues to the tissues at the top of plants (Patra &
Sharma, 2000) where the bats are feeding.
The comparison between the mercury concentrations in insectivorous bats
collected at the two lakes showed a significantly higher concentration of mercury in bats
sampled at Kenyir Lake. There was no known point source or intense agricultural
activities near the study area at the lake. Kenyir Lake is shallower than Temenggor
Lake, based on average depth, allowing rapid erosion of soils which increases
bioavailability of mercury-rich particles to filter feeding invertebrates (Lucotte et al.,
1999). Limitations on methylmercury production in Temenggor Lake might include low
total mercury concentrations in the flooded soils and sediments and rapid oxidation and
decay of organic matter leading to low total organic carbon in the reservoir (Ikingura &
Akagi, 2003). The study area in Temenggor Lake can be considered pristine without
human encroachment except for small-scale fishing and collecting of forest resources by
aborigines. Ikingura and Akagi (2003) reported it was a common phenomenon for fish
62
mercury concentration to be negatively correlated with age of reservoirs even with a
difference of only five years. Therefore, the age of the reservoirs could potentially be a
partial explanation for the differences in mercury concentration in bats from the two
lakes in our study, as Kenyir Lake is seven years younger than Temenggor Lake.
There was no significant variation in mercury concentration among sexes within
each feeding guild. Similarly, no significant difference in mercury concentration
between sexes was observed for both adult and juvenile bats from Oneida Lake, New
York, USA (Yates et al., 2014) and Southwest England (Walker et al., 2007). Mercury
contamination would not be expected to vary significantly between males and females
of the same species as they live in colonies and most likely have a very similar diet.
Comparing mercury concentration in bats on a global scale, mean mercury
concentrations in the fur of Myotis lucifugus, M. septentrionalis, M. leibii and M.
grisescens from non-point source sites in Quebec exceeded the threshold for mercury
concentration in hair (10 mg/kg) (Hickey et al., 2001) at which detrimental effects occur
in humans (Murata et al., 1999) and neurobehavioral disorders occurred in rodents
(Burton et al., 1977). Mercury concentrations in fur from bats at point source sites in
North America have been reported as 28 mg/kg to 132 mg/kg (Wada et al., 2010; Nam
et al., 2012; Yates et al., 2014) 5-30 times higher than the values for insectivorous bats
in the present study. However the values in this study are similar to the mean mercury
concentration in fur from bats at 69 non-point source sites in North America (6.44
mg/kg) (Yates et al., 2014).
63
5.5 Conclusion
This is the first study comparing mercury concentrations in frugivorous and
insectivorous bats at hydroelectric reservoirs. Fur from ten bats (H. cf. larvatus)
sampled at Kenyir Lake had mercury concentrations approaching or exceeding 10
mg/kg which is the threshold at which harmful effects occur in mammals (Murata et al.,
1999; Burton et al., 1977). Insectivorous bats consuming large numbers of prey
emerging from new reservoirs could be exposed to increased, and potentially harmful,
levels of mercury as has been shown previously in insectivorous songbirds (Gerrard &
St Louis, 2001). A reduction in bat populations due to neurological problems as a result
of mercury toxicity could have serious consequences for the local ecosystem:
insectivorous bats are important for controlling insect populations and for nutrient
recycling (Jones et al., 2009). Malaysia has created 60 reservoirs as a consequence of
hydroelectric damming since 1920; however, the ecological consequences of
hydroelectric damming have never received serious consideration. Likewise, many
other countries have embraced hydroelectricity as a renewable energy resource resulting
in the creation of thousands of reservoirs around the world (Barros et al., 2011).
64
CHAPTER 6
GENERAL DISCUSSION
A critical criterion in selecting a suitable indicator group is stable and accurate
species recognition which is achievable through a molecular approach. DNA barcoding
is a reliable identification tool by comparing DNA sequences generated from small
initial samples against the barcode reference libraries (Wilson et al., 2014). Bats have
been a target of a large DNA barcoding campaign in Southeast Asia (Francis et al.,
2010), facilitating the incorporation of DNA barcoding in identification to species level.
The use of field guides for bat species identification is well-known but is unable to
recognize dark taxa and cryptic species which are achievable through molecular
approach, adding precision to the species inventory. This was supported in the first
study, investigating the impact of DNA barcoding to the changing perspectives on bat
species diversity in Ulu Gombak Field Centre. The results were able to uncover a high
number (71%) of cryptic species, supporting the prediction that the number of bat
species in Ulu Gombak is significantly underestimated. DNA barcoding also was
applied in the second study to assess the first proposed key criterion: tractable
taxonomy. The result showed that bats had a high PCR success rate (81%) and a high
number (>82%) of assignments of species and family names to the MOTU after blasting
representatives against BOLD. In the third study, DNA barcoding was also incorporated
and allowed the recognition of 12 bat species including three “dark taxa”. Hence, this
suggested that DNA barcoding is able to enhance the effectiveness and efficiency of
employing bats as ecological indicator groups in Southeast Asia.
65
The second study suggested bats as good biodiversity indicator when assessed
using four key criteria. As discussed, the bats have tractable and stable taxonomy for
species recognition which could be enhanced with the inclusion of DNA barcoding.
Compared to butterflies and beetles, bats are relatively not easily surveyed due to high
person-hours and more complex equipment needed. However, the increased time and
equipment investment may be justifiable as they show variety of feeding guilds in
comparison to the other assessed taxa (butterflies and dung beetles). Bats have both
strong connections with other plants and animals because they are
frugivorous/nectarivorous and insectivorous/carnivorous bats, thus their richness and
abundance data may more accurately reflect the quality of habitat. Also, bats are widely-
distributed across wide range of habitats but each species inhabits a specific roosting
site. Hence, high species richness within a site would indicate a healthy habitat which
offers various niches for many groups of biota. The second study also showed
significant relationship between species richness of bats and butterflies, suggesting bat
diversity can reflect other co-occurring taxa which also include plant taxa. Results from
previous studies have shown a significant relationship between bat communities and
vegetation diversity and structure, suggesting bats as good disturbance indicators and
this encouraged at least three reserves in tropical Mexico to adopt bats in evaluation of
conservation status in each reserves (Medellin et al., 2000).
Other than being a suitable biodiversity indicator group, bats have the potential
to be environmental indicators as well. In addition to the four key criteria exhibited by
bats, they are also sensitive towards human-induced disturbances in the ecosystems and
positioned at various trophic levels in food webs (Jones et al., 2009). Insectivorous bats
occupy high trophic levels, consume large portion of insects per night, and travel great
distances each night, thus increasing the capacity of bioaccumulation and
66
biomagnification of contaminants through their diet intake (Zukal et al., 2012). In
addition, they would incorporate the contaminants into their hairs as a valid and stable
biomarker (US EPA, 2001). Therefore, bats are suitable to be used as indicators of
certain environmental pollutions. This was supported by the third study which assessed
mercury contamination in bats near hydroelectric reservoirs in Peninsular Malaysia. As
hypothesized, the result showed significantly high mercury concentrations in
insectivorous bats compared to frugivorous bats that were sampled near the reservoirs,
supporting the view that the intake of mercury in bats was through their diet. In Kenyir
Lake, bats were observed showing higher mercury concentrations than bats in
Temenggor Lake, which exceeded the threshold at which the concentrations could cause
lethal effects to humans and mammals. This highlighted the urgent need to reconsider
the construction plan of hydroelectric reservoirs in future, especially in Malaysia, where
several dams are scheduled for construction in the coming decades (Herbertson, 2013;
Thin, 2013). Heavy metal contamination in the current 60 reservoirs in the country
(ICOLD, 2014) should be studied to monitor the effects of land-use to the ecosystems
by employing bats as the indicator group.
The combined findings of these three studies suggested that bats can be
effectively employed as ecological indicators. For instance, other countries like United
Kingdom have already recognized the importance of bats as bioindicators and the
government has adopted bats into their suite of biodiversity indicators since May 2008
(Jones et al., 2009). Even an international symposium had been held in Barcelona
(2012) to bring together experts to discuss the importance of bats as bioindicators and to
open up new ideas for developing successful bat monitoring schemes. Therefore, it is
recommended that bats play a central role as a bioindicator group in monitoring
ecological change in Peninsular Malaysia in years to come.
67
CHAPTER 7
CONCLUSION AND RECOMMENDATION
Bats were found to fit the criteria as a good ecological indicator group for
Peninsular Malaysia. First of all, they are taxonomically stable, supported by the
inclusion of DNA barcoding in recognizing the species accurately. Secondly, they are
suitable to be chosen as an indicator in biodiversity monitoring. This study proposed
four key criteria to select a small group of species to be used as a proxy for “total”
biodiversity. These are, i) easily surveyed, ii) tractable taxonomy, iii) broadly
distributed higher taxa but specialized species, and iv) diversity patterns reflected in
other groups. Based on these criteria, bats showed good potential as a bioindicator
group although this study revealed butterflies to be a better group compared to bats.
Nonetheless, these could be taken as evidences for bats having good potential as a
bioindicator group and should be given more attention in the evaluation of biodiversity
of sites in Southeast Asia. Thirdly, bats are positioned at various trophic levels in food
webs and sensitive towards human-induced disturbances in the ecosystems, making
them as good environmental indicators. Significantly higher concentrations of total
mercury were found in the fur of insectivorous bats caught near hydroelectric reservoirs
with ten bats sampled at Kenyir Lake had mercury concentrations approaching or
exceeding 10 mg/kg, which is the threshold at which detrimental effects occur in
humans, bats and mice. Therefore, it is good to acknowledge the potential of bats as
environmental indicators and more studies should be done to evaluate the impact of
employing bats in other type of environmental contamination monitoring.
68
REFERENCES
Agusa, T., Kunito, T., Yasunaga, G., Iwata, H., Subramanian, A., Ismail, A., &
Tanabe, S. (2005). Concentrations of trace elements in marine fish and its risk
assessment in Malaysia. Marine Pollution Bulletin, 51(8), 896-911.
Alleva, E., Francia, N., Pandolfi, M., De Marinis, A. M., Chiarotti, F., & Santucci,
D. (2006). Organochlorine and heavy-metal contaminants in wild mammals and
birds of Urbino-Pesaro province, Italy: an analytic overview for potential
bioindicators. Archives of Environmental Contamination and Toxicology, 51(1),
123-134.
AMNH (American Museum of Natural History) (2013) Wing punch and hair
sampling protocols. http://research.amnh.org/vz/mammalogy/donating-bat-tissue-
and-hair-samples-genomic-and-stable-isotope-studies/wing-punch-and-hair-
sampling. Accessed 1 July 2013.
Ballerio, A. & Maruyama, M. (2010). The Ceratocanthinae of Ulu Gombak: high
species richness at a single site, with descriptions of three new species and an
annotated checklist of the Ceratocanthinae of Western Malaysia and Singapore
(Coleoptera, Scarabaeoidea, Hybosoridae). ZooKeys, 34, 77-104.
Barbosa, A. C., De Souza, J., Dorea, J. G., Jardim, W. F., & Fadini, P. S. (2003).
Mercury biomagnification in a tropical black water, Rio Negro, Brazil. Archives of
Environmental Contamination and Toxicology, 45(2), 235-246.
69
Barros, N., Cole, J. J., Tranvik, L. J., Prairie, Y. T., Bastviken, D., Huszar, V. L., &
Roland, F. (2011). Carbon emission from hydroelectric reservoirs linked to reservoir
age and latitude. Nature Geoscience, 4(9), 593-596.
Baselga, A., Fujisawa, T., Crampton-Platt, A., Bergsten, J., Foster, P. G.,
Monaghan, M. T., & Vogler, A. P. (2013a). Whole-community DNA barcoding
reveals a spatio-temporal continuum of biodiversity at species and genetic
levels. Nature communications, 4.
Baselga, A., Gómez-Rodríguez, C., Novoa, F., & Vogler, A. P. (2013b). Rare
Failures of DNA Barcodes to Separate Morphologically Distinct Species in a
Biodiversity Survey of Iberian Leaf Beetles. PloS One, 8(9), e74854.
Basu, N., Scheuhammer, A., Grochowina, N., Klenavic, K., Evans, D., O'Brien, M.,
& Chan, H. M. (2005). Effects of mercury on neurochemical receptors in wild river
otters (Lontra canadensis). Environmental Science & Technology, 39(10), 3585-
3591.
Bates, P. J., Nwe, T., Pearch, M. J., Swe, K. M., Bu, S. S. H., & Tun, T. (2000). A
review of bat research in Myanmar (Burma) and results of a recent survey. Acta
Chiropterologica, 2(1), 53-82.
Baxter, R. M. (1977). Environmental effects of dams and impoundments. Annual
Review of Ecology and Systematics, 8(1), 255-283.
Benoit, J. M., Cato, D. A., Denison, K. C., & Moreira, A. E. (2013). Seasonal
Mercury Dynamics in a New England Vernal Pool. Wetlands, 33(5), 887-894.
70
Bloom, N. S. (1992). On the chemical form of mercury in edible fish and marine
invertebrate tissue. Canadian Journal of Fisheries and Aquatic Sciences, 49(5),
1010-1017.
Bodaly, R. A., Hecky, R. E., & Fudge, R. J. P. (1984). Increases in fish mercury
levels in lakes flooded by the Churchill River diversion, northern
Manitoba. Canadian Journal of Fisheries and Aquatic Sciences, 41(4), 682-691.
Bogdanowicz, W., Fenton, M. B., & Daleszczyk, K. (1999). The relationships
between echolocation calls, morphology and diet in insectivorous bats. Journal of
Zoology, 247(3), 381-393.
Bongaarts, J. (2009). Human population growth and the demographic transition.
Philosophical Transactions of the Royal Society B: Biological Sciences, 364(1532),
2985-2990.
Borisenko, A. V., Lim, B. K., Ivanova, N. V., Hanner, R. H., & Hebert, P. D.
(2008). DNA barcoding in surveys of small mammal communities: a field study in
Suriname. Molecular Ecology Resources, 8(3), 471-479.
Brunet-Rossinni, A. K., Austad, S. N. (2004) Ageing studies on bats: a review.
Biogerontology 5, 211-222.
Burton, G. V., Alley, R. J., Rasmussen, G. L., Orton, P., Cox, V., Jones, P., & Graff,
D. (1977). Mercury and behavior in wild mouse populations. Environmental
Research, 14(1), 30-34.
Butler, R. A. (November 15, 2013). Malaysia has the world's highest deforestation
rate, reveals Google forest map. http://news.mongabay.com/2013/1115-worlds-
highest-deforestation-rate.html. Accessed 26 February 2014.
71
Calisher, C. H., Childs, J. E., Field, H. E., Holmes, K. V., & Schountz, T. (2006).
Bats: important reservoir hosts of emerging viruses. Clinical microbiology
reviews, 19(3), 531-545.
Campbell, P., Schneider, C. J., Adura, M. A., Zubaid, A. and Kunz, T. H. (2006).
Comparative population structure of Cynopterus fruit bats in Peninsular Malaysia
and southern Thailand. Molecular Ecology, 15, 29-47.
Castro-Luna, A. A., Sosa, V. J., & Castillo-Campos, G. (2007). Quantifying
phyllostomid bats at different taxonomic levels as ecological indicators in a
disturbed tropical forest. Acta Chiropterologica, 9(1), 219-228.
Chan, H. M., Scheuhammer, A. M., Ferran, A., Loupelle, C., Holloway, J., &
Weech, S. (2003). Impacts of mercury on freshwater fish-eating wildlife and
humans. Human and Ecological Risk Assessment, 9(4), 867-883.
Clare, E. L., Lim, B. K., Engstrom, M. D., Eger, J. L., & Hebert, P. D. (2007). DNA
barcoding of Neotropical bats: species identification and discovery within Guyana.
Molecular Ecology Notes, 7(2), 184-190.
Cleary, D. F. (2004). Assessing the use of butterflies as indicators of logging in
Borneo at three taxonomic levels. Journal of Economic Entomology, 97(2), 429-435.
Davidson, G. W. H., Soepadma, E., Yap, S. K. (1995). The Malaysian heritage and
scientific expedition to Belum: Temenggor Reservoir Forest, 1993-1994. Malayan
Nature Journal, 48,133-146.
Dincă, V., Zakharov, E. V., Hebert, P. D., & Vila, R. (2011). Complete DNA
barcode reference library for a country's butterfly fauna reveals high performance
72
for temperate Europe. Proceedings of the Royal Society B: Biological Sciences,
278(1704), 347-355.
Faure, P. A., Re, D. E., & Clare, E. L. (2009). Wound healing in the flight
membranes of big brown bats. Journal of Mammalogy, 90(5), 1148-1156.
Fenton, M. B., Acharya, L., Audet, D., Hickey, M. B. C., Merriman, C., Obrist, M.
K., & Adkins, B. (1992). Phyllostomid bats (Chiroptera: Phyllostomidae) as
indicators of habitat disruption in the Neotropics. Biotropica, 24(3), 440-446.
Ferris, R., Humphrey, J. W. (1999). A review of potential biodiversity indicators for
application in British forests. Forestry, 72, 313-328.
Fitzgerald, W. F., Engstrom, D. R., Mason, R. P., & Nater, E. A. (1998). The case
for atmospheric mercury contamination in remote areas. Environmental Science &
Technology, 32(1), 1-7.
Fleishman, E., Murphy, D. D., & Brussard, P. F. (2000). A new method for selection
of umbrella species for conservation planning. Ecological Applications, 10(2), 569-
579.
Fong, C. H., Sinniah, U. R., & Ahmad, I. (2006). The Development of Seed Industry
in Malaysia. APSA Country Report No. 33. Report presented at Asian Seed 2006,
Kuala Lumpur, Malaysia.
Francis, C. M. (1990). Trophic structure of bat communities in the understorey of
lowland dipterocarp rain forest in Malaysia. Journal of Tropical Ecology, 6(4), 421-
431.
73
Francis, C. M., Kingston, T., & Zubaid, A. (2007). A new species of Kerivoula
(Chiroptera: Vespertilionidae) from Peninsular Malaysia. Acta Chiropterologica,
9(1), 1-12.
Francis, C. M. (2008). A field guide to the mammals of South-East Asia. New
Holland Publishers. London.
Francis, C. M., Borisenko, A. V., Ivanova, N. V., Eger, J. L., Lim, B. K., Guillén-
Servent, A., Kruskop, S. V., Mackie, I. & Hebert, P. D. N. (2010). The role of DNA
barcodes in understanding and conservation of mammal diversity in Southeast Asia.
PLoS One, 5(9): e12575.
Fukui, D. A. I., Murakami, M., Nakano, S., & Aoi, T. (2006). Effect of emergent
aquatic insects on bat foraging in a riparian forest. Journal of Animal Ecology,
75(6), 1252-1258.
Gerrard, P. M., & St. Louis, V. L. (2001). The effects of experimental reservoir
creation on the bioaccumulation of methylmercury and reproductive success of tree
swallows (Tachycineta bicolor). Environmental Science & Technology, 35(7), 1329-
1338.
Gillison, A. N., Bignell, D. E., Brewer, K. R., Fernandes, E. C., Jones, D. T., Sheil,
D., & Nunes, P. C. (2013). Plant functional types and traits as biodiversity indicators
for tropical forests: two biogeographically separated case studies including birds,
mammals and termites. Biodiversity and Conservation, 22(9), 1909-1930.
Giri, C. P., Shrestha, S., Foresman, T. W., & Singh, A. (2001). Global Biodiversity
Data and Information. United Nations Economic and Social Council.
74
Hajeb, P., Selamat, J., Ismail, A., Bakar, F. A., Bakar, J., & Lioe, H. N. (2008). Hair
mercury level of coastal communities in Malaysia: a linkage with fish
consumption. European Food Research and Technology, 227(5), 1349-1355.
Hajeb, P., Jinap, S., Ismail, A., Fatimah, A. B., Jamilah, B., & Abdul Rahim, M.
(2009). Assessment of mercury level in commonly consumed marine fishes in
Malaysia. Food Control, 20(1), 79-84.
Hall, B. D., Rosenberg, D. M., & Wiens, A. P. (1998). Methyl mercury in aquatic
insects from an experimental reservoir. Canadian Journal of Fisheries and Aquatic
Sciences, 55(9), 2036-2047.
Halpin, K., Young, P. L., Field, H. E., & Mackenzie, J. S. (2000). Isolation of
Hendra virus from pteropid bats: a natural reservoir of Hendra virus. Journal of
General Virology, 81(8), 1927-1932.
Haro, R. J., Bailey, S. W., Northwick, R. M., Rolfhus, K. R., Sandheinrich, M. B., &
Wiener, J. G. (2013). Burrowing dragonfly larvae as biosentinels of methylmercury
in freshwater food webs. Environmental Science & Technology,47(15), 8148-8156.
Hendrichsen, D. K., Bates, P. J. J., Hayes, B. D., & Walston, J. L. (2001). Recent
records of bats (Mammalia: Chiroptera) from Vietnam with six species new to the
country. Myotis, 39, 35-122.
Herbertson, K. (2013). Sarawak’s Murum dam: What has changed since the
indigenous blockade? International Rivers.
http://www.internationalrivers.org/blogs/267/sarawak%E2%80%99s-murum-dam-
what-has-changed-since-the-indigenous-blockade. Accessed 18 November 2013.
75
Hickey, M. B. C., Fenton, M. B., MacDonald, K. C., & Soulliere, C. (2001). Trace
elements in the fur of bats (Chiroptera: Vespertilionidae) from Ontario and Quebec,
Canada. Bulletin of Environmental Contamination and Toxicology, 66(6), 699-706.
Hill, J. E. (1972). New records of Malayan bats, with taxonomic notes and the
description of a new Pipistrellus. Bulletin of the British Museum (Natural History)
Zoology, 23: 23-42.
Hill, J. E. (1974). New records of bats from southeastern Asia, with taxonomic
notes. Bulletin of the British Museum (Natural History) Zoology Zoology, 27: 127-
138.
Hodgkison, R., Balding, S. T., Zubaid, A., & Kunz, T. H. (2003). Fruit Bats
(Chiroptera: Pteropodidae) as seed dispersers and pollinators in a lowland Malaysian
rain forest. Biotropica, 35(4), 491-502.
Hylander, L. D., Gröhn, J., Tropp, M., Vikström, A., Wolpher, H., de Castro E
Silva, E., & Oliveira, L. J. (2006). Fish mercury increase in Lago Manso, a new
hydroelectric reservoir in tropical Brazil. Journal of environmental
management, 81(2), 155-166.
ICOLD (International Commission on Large Dams) (2014) Number of dams by
country members. http://www.icold-
cigb.org/GB/World_register/general_synthesis.asp?IDA=206. Accessed 23 January
2014
Ikingura, J. R., & Akagi, H. (2003). Total mercury and methylmercury levels in fish
from hydroelectric reservoirs in Tanzania. Science of the Total Environment, 304(1),
355-368.
76
Inward, D. J., Davies, R. G., Pergande, C., Denham, A. J., & Vogler, A. P. (2011).
Local and regional ecological morphology of dung beetle assemblages across four
biogeographic regions. Journal of Biogeography, 38(9), 1668-1682.
IUCN. (2013). IUCN Red List of Threatened Species. Version 2013.2.
www.iucnredlist.org. Downloaded on 27 February 2014.
Ivanova, N. V., Clare, E. L. & Borisenko, A. V. (2012). DNA barcoding in
mammals. In Kress, W. J. & Erickson, D. L. (Eds.) DNA barcodes: Methods and
protocols: Method in Molecular Biology, 858, 153-182. doi:10.1007/978-1-61779-
591-6.
Jamadon, B., Zulhairil, A., Salma, I., & Shukor, N.M. (2007). Current status of
conservation and utilization of tropical plant genetic resources for food and
agriculture in Malaysia. International Training Workshop. pp. 51-66.
Janzen, D. H., Hallwachs, W., Blandin, P., Burns, J. M., CADIOU, J., Chacon, I., &
Wilson, J. J. (2009). Integration of DNA barcoding into an ongoing inventory of
complex tropical biodiversity. Molecular Ecology Resources, 9(s1), 1-26.
Jayaraj, V. K., Laman , C. J. & Abdullah, M. T. (2012). A predictive model to
differentiate the fruit bats Cynopterus brachyotis and C. cf. brachyotis Forest
(Chiroptera: Pteropodidae) from Malaysia using multivariate analysis. Zoological
Studies, 51, 259–271.
Jenkins, P. D., & Hill, J. E. (1981). The Status of Hipposideros Galeritus Carter,
1846 and Hipposideros Cervinus (Gould, 1854) (Chiroptera: Hipposideridae).
Bulletin of the British Museum (Natural History) Zoology, 27: 127-138.
77
Jiang, T., Feng, J., Sun, K., & Wang, J. (2008). Coexistence of two sympatric and
morphologically similar bat species Rhinolophus affinis and Rhinolophus pearsoni.
Progress in Natural Science, 18(5), 523-532.
Jones, G., Jacobs, D. S., Kunz, T. H., Willig, M. R., & Racey, P. A. (2009). Carpe
noctem: the importance of bats as bioindicators. Endangered Species Research, 8(1-
2), 93-115.
Jones, G. W. (2013). The population of Southeast Asia. Asia Research Institute.
http://www.ari.nus.edu.sg/docs/wps/wps13_196.pdf. Accessed 17 Sept 2013.
Jonsson, B. G., & Jonsell, M. (1999). Exploring potential biodiversity indicators in
boreal forests. Biodiversity & Conservation, 8(10), 1417-1433.
Jusoff, K. (2010). Individual species crown mapping in Taman Rimba Ilmu,
University Malaya using airborne hyperspectral imaging. American Journal of
Applied Sciences, 7(4).
Kamaruddin, I. S., Kamal, A. M., Christianus, A., Daud, S. K., & Abit, L. Y. (2011).
Fish community in Pengkalan Gawi-Pulau Dula Section of Kenyir Lake,
Terengganu, Malaysia. Journal of Sustainability Science and Management, 6(1), 89-
97.
Kerr, J. T., Sugar, A., & Packer, L. (2000). Indicator taxa, rapid biodiversity
assessment, and nestedness in an endangered ecosystem. Conservation
Biology, 14(6), 1726-1734.
Khalik, W. M. A. W. M., & Abdullah, M. P. (2012). Seasonal influence on water
quality status of Temenggor Lake, Perak. Malaysian Journal of Analytical
Sciences, 16(2), 163-171.
78
Kingston, T., Lara, M. C., Jones, G., Akbar, Z., Kunz, T. H., & Schneider, C. J.
(2001). Acoustic divergence in two cryptic Hipposideros species: a role for social
selection? Proceedings of the Royal Society of London. Series B: Biological
Sciences, 268(1474), 1381-1386.
Kingston, T., Francis, C. M., Akbar, Z. & Kunz, T. H. (2003). Species richness in an
insectivorous bat assemblage from Malaysia. Journal of Tropical Ecology, 19, 67-
79.
Kingston, T., Boo Liat, L., Zubaid, A. (2006). Bats of Krau Wildlife Reserve.
Universiti Kebangsaan Malaysia Press, Bangi.
Kingston, T. (2010). Research priorities for bat conservation in Southeast Asia: a
consensus approach. Biodiversity and Conservation, 19, 471-484.
Koch, B., Edwards, P. J., Blanckenhorn, W. U., Buholzer, S., Walter, T., Wüest, R.
O., & Hofer, G. (2013). Vascular plants as surrogates of butterfly and grasshopper
diversity on two Swiss subalpine summer pastures. Biodiversity and
Conservation, 22(6-7), 1451-1465.
Kowarik, I. (2011). Novel urban ecosystems, biodiversity, and conservation.
Environmental Pollution, 159(8), 1974-1983.
Kress, W. J., Erickson, D. L. (2012). DNA Barcodes: methods and protocols. In
Kress, W.J. & Erickson, D.L. (Eds.). DNA barcodes: Methods and Protocols:
Methods in Molecular Biology, (pp.3-8). doi:10.1007/978-1-61779-591-6.
Krishnamurthy, P. K., & Francis, R. A. (2012). A critical review on the utility of
DNA barcoding in biodiversity conservation. Biodiversity and Conservation, 21(8),
1901-1919.
79
Kunte, K., Joglekar, A., Utkarsh, G., & Padmanabhan, P. (1999). Patterns of
butterfly, bird and tree diversity in the Western Ghats. Current Science, 77(4), 577-
586.
Laforest, B. J., Winegardner, A. K., Zaheer, O. A., Jeffery, N. W., Boyle, E. E., &
Adamowicz, S. J. (2013). Insights into biodiversity sampling strategies for
freshwater microinvertebrate faunas through bioblitz campaigns and DNA
barcoding. BMC Ecology, 13(1), 13.
Larsen, T. H., & Forsyth, A. (2005). Trap Spacing and Transect Design for Dung
Beetle Biodiversity Studies1. Biotropica, 37(2), 322-325.
Larsen, R. J., Boegler, K. A., Genoways, H. H., Masefield, W. P., Kirsch, R. A., &
Pedersen, S. C. (2007). Mist netting bias, species accumulation curves, and the
rediscovery of two bats on Montserrat (Lesser Antilles). Acta
Chiropterologica, 9(2), 423-435.
Lawton, J. H., Bignell, D. E., Bolton, B., Bloemers, G. F., Eggleton, P., Hammond,
P. M., & Watt, A. D. (1998). Biodiversity inventories, indicator taxa and effects of
habitat modification in tropical forest. Nature, 391(6662), 72-76.
Lin, C. Y. O. (2006). Autonomy re-constituted social and gendered implications of
dam resettlement on the orang asli of Peninsular Malaysia. Gender, Technology and
Development, 10(1), 77-99.
Lucotte, M., Montgomery, S., & Bégin, M. (1999). Mercury dynamics at the
flooded soil-water interface in reservoirs of northern Quebec: in situ observations.
In Mercury in the Biogeochemical Cycle (pp. 165-189). Springer Berlin Heidelberg.
80
Macdonald, W. W. & Mattingly, P. F. (1960). A new species of Udaya from Malaya
and a description of the early stages of U. argyrurux (Edwards, 1934) (Diptera :
Culicidae). The Proceedings of the Royal Entomological Society of London, 29, 22-
28.
Maddison, D. R., Guralnick, R., Hii, A., Reysenbach, A.-L., & McDade, L. A.
(2012). Rampling up biodiversity discovery via online quantum contributions.
Trends in Ecology and Evolution, 27, 72-77.
Martin, L. M., Moloney, K. A., & Wilsey, B. J. (2005). An assessment of grassland
restoration success using species diversity components. Journal of Applied
Ecology, 42(2), 327-336.
Mayer, F., Dietz, C., & Kiefer, A. (2007). Molecular species identification boosts
bat diversity. Frontiers in Zoology, 4(4), 5.
McKinney, M. L. (2002). Urbanization, biodiversity, and conservation. BioScience,
52, 883-890.
Medellín, R. A., Equihua, M., & Amin, M. A. (2000). Bat diversity and abundance
as indicators of disturbance in Neotropical rainforests. Conservation Biology, 14(6),
1666-1675.
Medway, L., 1966. The Ulu Gombak Field Studies Centre. Malayan Scientist, 2, 1-
16.
Medway, L. (1967). A bat-eating bat Megaderma lyra Geoffroy. Malayan Nature
J, 20, 107-110.
81
Medway, L., Matsom, M., & Suhaimi, H. (1983). The wild mammals of Malaya
(Peninsular Malaysia) and Singapore. 2nd edition. Oxford University Press, Kuala
Lumpur. 130 pp.
Mergler, D., Anderson, H. A., Chan, L. H. M., Mahaffey, K. R., Murray, M.,
Sakamoto, M., & Stern, A. H. (2007). Methylmercury exposure and health effects in
humans: a worldwide concern. AMBIO: A Journal of the Human
Environment, 36(1), 3-11.
Mildenstein, T., & de Jong, C. (2011). Natural history, ecology and socio-economic
value of bats. In Investigating the Role of Bats in Emerging Zoonoses: Balancing
Ecology, Conservation and Public Health Interest. Edited by Newman, S. H., Field,
H. E., Jong, C. E., Epstein, J. H. FAO Animal Production and Health Manual, 12,
15-28.
Mittermeier, R. A., Myers, N., Thomsen, J. B., Da Fonseca, G. A., & Olivieri, S.
(1998). Biodiversity hotspots and major tropical wilderness areas: approaches to
setting conservation priorities. Conservation Biology, 12(3), 516-520.
Mogren, C. L., Walton, W. E., Parker, D. R., & Trumble, J. T. (2013). Trophic
transfer of arsenic from an aquatic insect to terrestrial insect predators. PloS
One, 8(6), e67817.
Moreno, C. E., Sánchez-Rojas, G., Pineda, E., & Escobar, F. (2007). Shortcuts for
biodiversity evaluation: a review of terminology and recommendations for the use
of target groups, bioindicators and surrogates. International Journal of Environment
and Health, 1(1), 71-86.
Muda, H. (1991). Diet of small mammals in the secondary tropical forest in
Malaysia. Journal of Wildlife and Parks, 11, 44-52.
82
Murata, K., Weihe, P., Renzoni, A., Debes, F., Vasconcelos, R., Zino, F., &
Grandjean, P. (1999). Delayed evoked potentials in children exposed to
methylmercury from seafood. Neurotoxicology and Teratology, 21(4), 343-348.
Nam, D. H., Yates, D., Ardapple, P., Evers, D. C., Schmerfeld, J., & Basu, N.
(2012). Elevated mercury exposure and neurochemical alterations in little brown
bats (Myotis lucifugus) from a site with historical mercury contamination.
Ecotoxicology, 21(4), 1094-1101.
New, T. R. (1997). Are Lepidoptera an effective ‘umbrella group ‘for biodiversity
conservation? Journal of Insect Conservation, 1(1), 5-12.
Norizam, M. M., Ali, A. (2000). A comparative study on the secondary productivity
of the littoral and limnetic zone of Temenggor Reservoir, Perak, Malaysia. Journal
of Bioscience, 11, 1-10.
Novelo, R. E., Delfín-González, H., & Morón, M. Á. (2007). Copro-necrophagous
beetle (Coleoptera: Scarabaeidae) diversity in an agroecosystem in Yucatan,
Mexico. Revista de Biología Tropical, 55(1), 83-99.
Nuril Aida, K. I. & Idris, A. B. (2011). Anochetus maryatiae, a new species of
Ponerinae (Hymenoptera: Formicidae). Sains Malaysiana, 40(4), 301–304.
Pacyna, E. G., Pacyna, J. M., Steenhuisen, F., & Wilson, S. (2006). Global
anthropogenic mercury emission inventory for 2000. Atmospheric Environment,
40(22), 4048-4063.
Patra, M., & Sharma, A. (2000). Mercury toxicity in plants. The Botanical
Review, 66(3), 379-422.
83
Pearson, D. L. (1994). Selecting indicator taxa for the quantitative assessment of
biodiversity. Philosophical Transactions of the Royal Society of London. Series B:
Biological Sciences, 345(1311), 75-79.
Pineda, E., Moreno, C., Escobar, F., & Halffter, G. (2005). Frog, bat, and dung
beetle diversity in the cloud forest and coffee agroecosystems of Veracruz,
Mexico. Conservation Biology, 19(2), 400-410.
Pollard, E. (1977). A method for assessing changes in the abundance of
butterflies. Biological Conservation, 12(2), 115-134.
Poulain, A. J., & Barkay, T. (2013). Cracking the mercury methylation code.
Science, 339(6125), 1280-1281.
Puillandre, N., Lambert, A., Brouillet, S., & Achaz, G. (2012). ABGD, Automatic
Barcode Gap Discovery for primary species delimitation. Molecular Ecology, 21(8),
1864-1877.
Rainio, J., & Niemelä, J. (2003). Ground beetles (Coleoptera: Carabidae) as
bioindicators. Biodiversity & Conservation, 12(3), 487-506.
Ratnasingham, S. & Hebert, P. D. N. (2007). BOLD: The barcode of life data
system (www.barcodinglife.org). Molecular Ecology Notes, 7, 355-364.
Razgour, O., Clare, E. L., Zeale, M. R., Hanmer, J., Schnell, I. B., Rasmussen, M.,
& Jones, G. (2011). High‐throughput sequencing offers insight into mechanisms of
resource partitioning in cryptic bat species. Ecology and Evolution, 1(4), 556-570.
Reidinger, R. F. (1972). Factors influencing Arizona bat population levels. PhD
dissertation, Department of Biological Sciences, University of Arizona, Tucson. 172
pp.
84
Robbins, R. K., & Opler, P. A. (1997). Butterfly diversity and a preliminary
comparison with bird and mammal diversity. Biodiversity II: Understanding and
Protecting Our Biological Resources, 69-82.
Robinson, S. A., Lajeunesse, M. J., & Forbes, M. R. (2012). Sex differences in
mercury contamination of birds: testing multiple hypotheses with meta-analysis.
Environmental Science & Technology, 46(13), 7094-7101.
Rodgers, D. W., Dickman, M., & Han, X. (1995). Stores from old reservoirs:
Sediment Hg and Hg methylation in Ontario hydroelectric developments. Water,
Air, and Soil Pollution, 80(1-4), 829-839.
Rojas, D., Mancina, C. A., Flores‐Martínez, J. J., & Navarro, L. (2013).
Phylogenetic signal, feeding behaviour and brain volume in Neotropical bats.
Journal of Evolutionary Biology, 26(9), 1925-1933.
Rouf, A. A., Phang, S. M., & Ambak, M. A. (2010). Depth distribution and
ecological preferences of periphytic algae in Kenyir Lake, the largest tropical
reservoir of Malaysia. Chinese Journal of Oceanology and Limnology, 28(4), 856-
867.
Sarmani, S. B., Kiprawi, A. Z., & Ismail, R. B. (1994). Mercury determination in
hair of Malaysian fishermen by neutron activation analysis. Biological Trace
Element Research, 43(1), 435-441.
Selin, N. E., Jacob, D. J., Park, R. J., Yantosca, R. M., Strode, S., Jaeglé, L., & Jaffe,
D. (2007). Chemical cycling and deposition of atmospheric mercury: Global
constraints from observations. Journal of Geophysical Research: Atmospheres
(1984–2012), 112(D2).
85
Shafie, N. J., Sah, S. A. M., Latip, N. S. A., Azman, N. M., & Khairuddin, N. L.
(2011). Diversity pattern of bats at two contrasting habitat types along Kerian River,
Perak, Malaysia. Tropical Life Sciences Research, 22(2), 13-22.
Simmons, N. (2005). Chiroptera. In: Wilson, D. E & D. M. Reeder DM (eds.),
Mammal species of the World: a taxonomic and geographic reference. John
Hopkins University Press, Baltimore. pp. 312–529.
Sing, K. W., Syaripuddin, K., & Wilson, J. J. (2013). Changing perspectives on the
diversity of bats (Mammalia: Chiroptera) at Ulu Gombak since the establishment of
the field study centre in 1965. The Raffles Bulletin of Zoology, (29), 211-217.
Sivalingam, P. M., & Sani, A. B. (1980). Mercury content in hair from fishing
communities of the State of Penang, Malaysia. Marine Pollution Bulletin, 11(7),
188-191.
Sly, G. R. (1975). Second record of the Bronzed Tube-nosed Bat (Murina aenea) in
Penisular Malaysia. Malayan Nature Journal, 28, 217.
Sodhi, N. S., L. P. Koh, B. W. Brook, & P. K. L. Ng, 2004. Southeast Asian
biodiversity: an impending diasaster. Trends in Ecology and Evolution, 19, 654-660.
Spector, S. & Forsyth, A. B. (1998). Indicator taxa for biodiversity assessment in the
vanishing tropics. Conservation in a changing world. Cambridge University Press,
Cambridge, 181-209.
Spector, S. (2006). Scarabaeine dung beetles (Coleoptera: Scarabaeidae:
Scarabaeinae): An invertebrate focal taxon for biodiversity research and
conservation. The Coleopterists Bulletin, 60(sp5), 71-83.
86
Spitzer, L., Benes, J., Dandova, J., Jaskova, V., & Konvicka, M. (2009). The Large
Blue butterfly, Phengaris [Maculinea] arion, as a conservation umbrella on a
landscape scale: The case of the Czech Carpathians. Ecological Indicators, 9(6),
1056-1063.
Stewart, A. R., Saiki, M. K., Kuwabara, J. S., Alpers, C. N., Marvin-DiPasquale, M.,
& Krabbenhoft, D. P. (2008). Influence of plankton mercury dynamics and trophic
pathways on mercury concentrations of top predator fish of a mining-impacted
reservoir. Canadian Journal of Fisheries and Aquatic Sciences, 65(11), 2351-2366.
Stokes, P. M., & Wren, C. D. (1987). Bioaccumulation of mercury by aquatic biota
in hydroelectric reservoirs: a review and consideration of mechanisms. Lead,
Mercury, and Arsenic in the Environment, 255-278.
Syaripuddin., K. (2012). Study of diversity of bat at three different elevations using
two different techniques. BSc Thesis, Institute of Biological Sciences, University of
Malaya, Kuala Lumpur. 140 pp.
Thabah, A., Rossiter, S. J., Kingston, T., Zhang, S., Parsons, S., Mya, K. M., &
Jones, G. (2006). Genetic divergence and echolocation call frequency in cryptic
species of Hipposideros larvatus sl (Chiroptera: Hipposideridae) from the
Indo‐Malayan region. Biological Journal of the Linnean Society, 88(1), 119-130.
Thin, L. W. (2013). Proposed Malaysia dams raise transparency, livelihood fears.
Thomson Reuters Foundation. http://www.trust.org/item/20130521123410-
dp5oe/?source=hptop. Accessed 3 January 2014.
87
Thomas, J. A. (2005). Monitoring change in the abundance and distribution of
insects using butterflies and other indicator groups. Philosophical Transactions of
the Royal Society B: Biological Sciences, 360(1454), 339-357.
Tremblay, A., & Lucotte, M. (1997). Accumulation of total mercury and methyl
mercury in insect larvae of hydroelectric reservoirs. Canadian Journal of Fisheries
and Aquatic Sciences, 54(4), 832-841.
Tweedy, B. N., Drenner, R. W., Chumchal, M. M., & Kennedy, J. H. (2013). Effects
of fish on emergent insect-mediated flux of methyl mercury across a gradient of
contamination. Environmental Science & Technology, 47(3), 1614-1619.
United Nations. (2004). World population to 2300. United Nations, New York.
US EPA. (Environmental Protection Agency). (2001). Water quality criterion for the
protection of human health: methylmercury, final. EPA-823-R-01-001. Washington.
http://www.epa.gov/waterscience/criteria/methylmercury/document.html. Accessed
17 February 2013.
US EPA (Environmental Protection Agency) (2007). Mercury in solids and
solutions by thermal decomposition, amalgamation, and atomic absorption
spectrophotometry. EPA Method 7473. Washington.
http://www.epa.gov/osw/hazard/testmethods/sw846/pdfs/7473.pdf. Accessed 2 May
2014.
Wada, H., Yates, D. E., Evers, D. C., Taylor, R. J., & Hopkins, W. A. (2010). Tissue
mercury concentrations and adrenocortical responses of female big brown bats
(Eptesicus fuscus) near a contaminated river. Ecotoxicology, 19(7), 1277-1284.
88
Walker, L. A., Simpson, V. R., Rockett, L., Wienburg, C. L., & Shore, R. F. (2007).
Heavy metal contamination in bats in Britain. Environmental Pollution, 148(2), 483-
490.
Wilson, J. J., Rougerie, R., Schonfeld, J., Janzen, D. H., Hallwachs, W., Hajibabaei,
M., & Hebert, P. D. (2011). When species matches are unavailable are DNA
barcodes correctly assigned to higher taxa? An assessment using sphingid
moths. BMC Ecology, 11(1), 18.
Wilson, J. J. (2012). DNA barcodes for insects. In Kress, W. J. & Erickson, D. L.
(Eds.) DNA barcodes: Methods and protocols: Methods in Molecular Biology. pp.
17-46. doi:10.1007/978-1-61779-591-6.
Wilson, J. J. (2013) Butterflies of Peninsular Malaysia.
http://malaysiabutterflies.myspecies.info. Accessed 16 June 2013.
Wilson, J. J., Sing, K. W., Ramli, R., Halim, R., Hashim, R., & Azirun S. M. (2014).
Testing the utility of DNA barcoding for rapid assessment of bat diversity in
Malaysia. Genetic Molecular Research, 13, 920-925.
Wolfe, M. F., Schwarzbach, S., & Sulaiman, R. A. (1998). Effects of mercury on
wildlife: a comprehensive review. Environmental Toxicology and Chemistry, 17(2),
146-160.
Yates, D. E., Kunz, T. H., Evers, D. C., Divoll, T. (unpublished). Assessment of
mercury accumulation in bat fur from 8 countries around the world. Poster presented
at The 10th
International Conference on Mercury as a Global Pollutant, Halifax,
Nova Scotia, Canada.
89
Yates, D. E., Adams, E. M., Angelo, S. E., Evers, D. C., Schmerfeld, J., Moore, M.
S., & O’Driscoll, N. J. (2014). Mercury in bats from the northeastern United
States. Ecotoxicology, 23(1), 45-55.
Yenbutra, S., & Pelten, H. (1983). A new species of the fruit bat genus Megaerops
from SE-Asia (Mammalia: Chiroptera: Pteropodidae).Senckenbergiana
Biologica, 64(1-3), 1-11.
Yob, J. M., Field, H., Rashdi, A. M., Morrissy, C., van der Heide, B., Rota, P., &
Ksiazek, T. (2001). Nipah virus infection in bats (order Chiroptera) in Peninsular
Malaysia. Emerging Infectious Diseases, 7(3), 439.
Yusof, M. D. N. N. (2005). Kajian kepelbagaian mamalia kecial di Hutan Simpan
Ulu Gombak. BSc Thesis, Institute of Biological Sciences, University of Malaya,
Kuala Lumpur. 43 pp.
Zukal, J., Pikula, J., & Bandouchova, H. (2012). Bats and toxic pollutants. In
Flaquer, C. & Puig-Montserrat, X. (Eds.). Proceedings of the International
Symposium on the Importance of Bats as Bioindicators. Paper presented at
International Symposium on the Importance of Bats as Bioindicators, Granollers,
Catalonia, 5-7 December (pp. 75-79). Museum of Natural Sciences Edicions,
Granollers.
90
LIST OF PUBLICATIONS AND PAPER PRESENTED
1. Sing, K. W., Syaripuddin, K. & Wilson, J. J. (2013). Changing perspectives on
the diversity of bats (Mammalia: Chiroptera) at Ulu Gombak since the
establishment of the field study centre in 1965. The Raffles Bulletin of Zoology,
29: 211-217.
2. Syaripuddin, K., Sing, K. W. & Wilson, J. J. (2013). Are butterflies, bats and
beetles good biodiversity indicators in Southeast Asia? An assessment using four
key criteria and DNA barcodes. Paper presented at the 18th
Biological Sciences
Graduate Congress.
3. Syaripuddin, K., Kumar, A., Sing, K. W., Halim, M. R. A., Nursyereen, M. N.,
& Wilson, J. J. (2014). Mercury accumulation in bats near hydroelectric
reservoirs in Peninsular Malaysia. Ecotoxicology, 23(7), 1-8.
91
APPENDIX
APPENDIX A: Paper published.
92
93
94
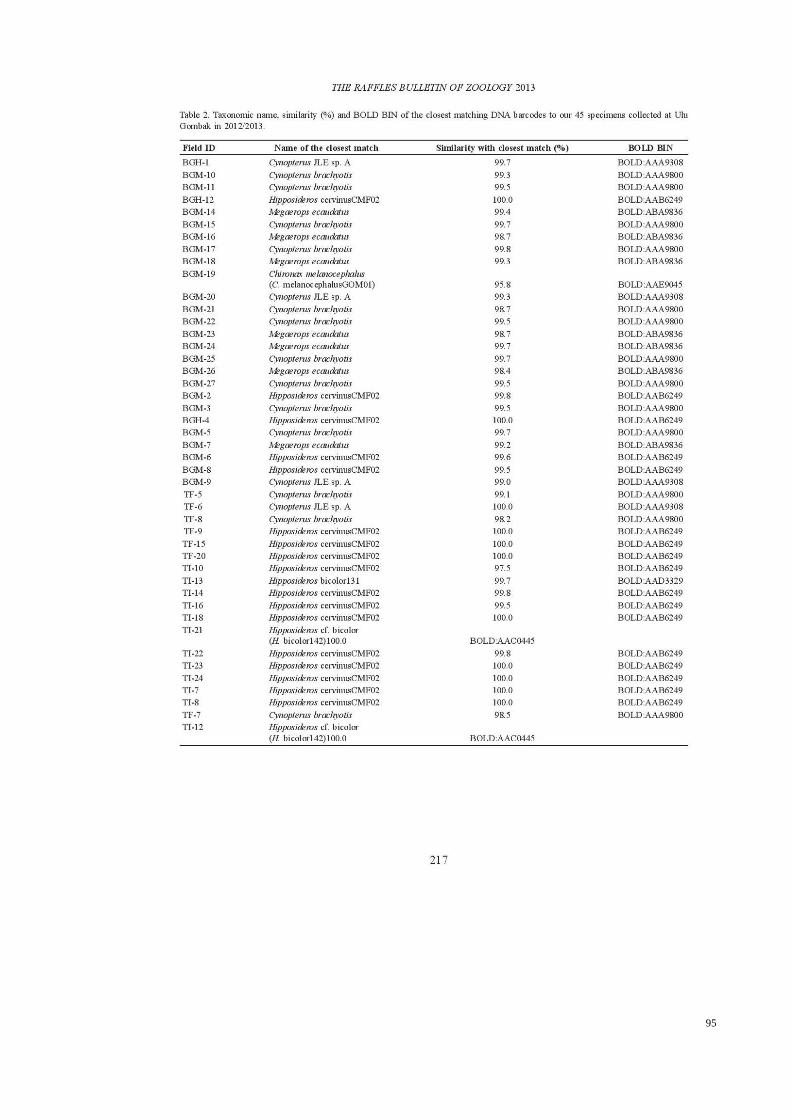
95
96
97
98
APPENDIX B: Abstract for seminar presented.