kinetics of methylene blue adsorptionon koh …
TRANSCRIPT

Malaysian Journal of Science 30 (3): 196-207(2011)
196
KINETICS OF METHYLENE BLUE ADSORPTIONON KOH-ACTIVATED CARBON
USING CORN COBS
Diya’uddeen Basheer Hasan1,*, Mohammed, I.A², Jibril, B.Y³ 1 Chemical Engineering Department, University of Malaya, Malaysia, 2 Chemical Engineering Department, A.B.U. Zaria, Nigeria, 3 Petroleum& Chemical Engineering Department, Sultan Qaboos University, Muscat, Oman *[email protected](Corresponding author) Received on 26th June 2011, accepted in revised form 15th November 2011. ABSTRACTDifferent samples of activated carbons were prepared by carbonization of corn cob – an abundant lignocelluloses material available locally. The thermo-gravimetric profile of the carbon was studied. Based on this, carbonization temperature was varied (600 – 800 oC) to obtain samples of different surface areas, porosities and densities. The sample carbonized at 700 oC exhibited the highest surface area and apparent density of 1,084 m2/g and 0.1031 g/cm2. These characteristics were associated with the extent of re-polymerization reactions of the tar species with the main carbon matrix at the reaction temperature. The samples were further compared based on the adsorption of methylene blue (MB) from its aqueous solution. The adsorption was investigated using MB initial concentrations of 100-500 mg/L at ambient temperature of 30 oC, constant pH, adsorbent dosage and particle size. Equilibrium isotherms generated were analyzed according to the linear form of Langmuir and Freundlich isotherms. The Langmuir model was found to better describe the adsorption process over the whole concentration range. The adsorptive capacities range for the model is 417 – 833 mg/g. Attempt was made to find the adsorption mechanism. Both pseudo-first-order model and pseudo-second-order kinetic model were tested. Better description was found using pseudo-second-order model. The study demonstrated that locally available carbonaceous materials could be employed to prepare activated carbon with high adsorptive capacity.
(Keywords: Activated carbon; Adsorption isotherm; Corn cobs; Kinetics; Methylene blue)
INTRODUCTION
The removal of dyes such as Methylene blue (MB) from industrial water before discharge is of uttermost importance. As organic dyes, they colorize other substances in water making it visibly and aesthetically unpleasant [1,2]. Besides, photosynthetic activities are hampered due to interference with sunlight penetration into water bodies thus affecting fish and other aquatic organisms [3]. Though, some reports have indicated that MB is not strongly hazardous [4], recent literatures have established carcinogenic and mutagenic effect of some of these dyes [5]. There are serious adverse effects with far-reaching consequences that are attributed to MB. Contact with the eye can lead to
permanent blindness to human and animals, experiencing short periods of rapid or difficult breathing when inhaled, burning sensation when ingested through the mouth and causes other adverse conditions such as nausea, vomiting, profuse sweating and mental confusion [4, 6]. Due to recent increases in industrial activities such as textile manufacturing, the use of dyes increases rapidly [1, 3]. Most recent statistics reported by Doğan et al. [7] indicated rapid use of these dyes with more than 10,000 different types of these dyes being produced. They reported a global annual manufacture of these dyestuff and intermediates estimated to be 7x10⁸ kg. Therefore, removal of the dyes from wastewater is gaining research interest. Removal of these dyes from wastewater effluents is problematic as they possess a complex aromatic chemical structure that makes them more stable to light, heat and oxidation agents [1, 8]. Several methods have

Malaysian Journal of Science 30 (3): 196-207(2011)
197
been employed. Some of these techniques are chemical coagulation/flocculation, ozonation, cloud point extraction, oxidation processes, nanofiltration, chemical precipitation, ion-exchange, reverse osmosis and ultra filtration. All are either operationally expensive [7], inefficient in the removal of the dyes [9] or creates disposal problems [10].
The most preferred method according to [11] is activated carbon adsorption. Reasons advanced by El-Khaiary [2] for the successful application of this technique is that it absorbs all recalcitrant dyes against bioremediation limitation of ineffective degrading of such dyes, highly porous nature of the activated carbon and extremely large surface area to the volume ratio [12] increases rate and adsorption capacity for colored pollutants [1]. However, most recent investigations by Weng et al. [13] elucidates that utilization of commercial activated carbon is becoming unattractive due to the high operation cost resulting from a need for regeneration and difficulty in separation from the waste water after use [1, 10]. Use of low-cost alternative adsorbents developed from agricultural solid by -products waste, according to El-Khaiary [2] not only decrease cost of treatment but convert the waste to useful product thus mitigates the problem of disposal as they are cost effective. Coconut shell activated carbon is another viable option; however,
the availability at commercial quantities limits make it less attractive [14]. Maize being the 2nd most widely grown cereal in the world [15] offers a more readily available precursor on a global scale. The raw material also satisfies the basic requirements of a potential precursor namely availability [11], cost effectiveness [16] and ease of pretreating and activating [13, 17]. High surface area with microporous structure has been established to be obtained from corncobs using KOH activation [18, 19]. Corn cob is a lignocelluloses material composing of cellulose, hemicellulose and lignin [20] thus by carbonizing the precursor a porous carbon adsorbent would be obtained [21]. Several researchers have reported developing activated carbon from corn cobs, but the surface areas were relatively low and the physical adsorption more energy demanding. Different values of surface areas were reported some of which are a value of 437 m2/g [22], 664, 850, and 700 m2/g [23]; 608 and 897 m2/g [24], 1014 and 1063 m2/g [24], depending on the carbonization. In this study, we report KOH activation of corncob to produce activated carbon, the activated carbon producedwas characterized and tested in removal of methylene blue from aqueous solution.
MATERIALS AND METHOD
The chemical reagents used were all of analytical grade. Furthermore, all the solutions were prepared with double distilled water. Methylene blue dye used was a cationic dye having molecular weight of 373.9 g/mol and a chemical formula of C16H18CN3S. The precursor was further purified by removing dirt and open sun dried for 5 h in sunlight (at about 35 oC) and finally crushed in a local pestle and mortar. Thomas Wiley laboratory mill was used to grind the corn cob in order to provide enough grinded samples for the analysis. A sieve was fitted to the mill to obtain hence a desired fine and uniform particle size of 1.0 - 2.0 mm. Thermogravimetric analysis Appropriate carbonizing temperature was determined in an SDT 2960 thermogravimetric analyzer
(Quantrachome Instruments Co. LTD.) by obtaining the % weight loss profile of the precursor between the temperature ranges of 0-800 oC. Platinum container was selected and samples filled into the container, heated under nitrogen environment at 2.5 mL/min and heating rate of 20 oC/min to a final temperature of 800 oC. Production of activated carbon Based on the TGA profile, four batches of the dried corn cobs precursor were carbonized in a carbonization rig (Carbolite HTR 11/75). The carbonization involved heating the samples slowly from the ambient temperature (30 oC)at a ramping rate of 20 oC/min to a final temperature of 300 oC. The holding time at the final carbonization temperature was 2 h. At the end of the carbonized phase, samples were allowed to cool to room

Malaysian Journal of Science 30 (3): 196-207(2011)
198
temperature and then impregnated with KOH pellets physically in a ratio 1:3 precursor to activating agent [6, 19, 25]. Distilled water was then used to mix the impregnated sample into a homogeneous moist sticky paste which was immediately charged into a furnace and rampedagain at 20 oC/min for 2 h. The carbonized and impregnated samples wereremoved from the rig, allowed tobe cooled to room temperature (30 oC) and subsequently washed with distil water to remove excess chemicals. The initial KOH treatment makes the samples basic and thus samples were treated with HCl (1M) to near neutral pH. Finally, the activated carbon produced were washed with distil water and dried in an oven at 110 oC overnight.The activation temperature was varied from 600-800 oC. Both carbonization and activation processes were conducted under N2 flowing at 2.5 mL/min.
The four categories of activated carbon developed were given notations based on activation temperature. The first alphabet denotes carbon sample while the preceding number represents the activation temperature. Thus C600 indicates carbon sample activated at 600 oC.
Determination of apparent density
Sample was placed in a previously weighed glass tube, and the new weight recorded. It was tapped until there was no change in volume and the tube and its content reweigh. The weight difference was calculated and eq. 1 [26] used to compute the bulk density.
%100% xsampleofvolumesampleofweight
a
Determination of solid density
An Ultrapycnometer (UPY 1000, Quantachrome Corp.) was used to determine the solid density. Samples were weighed, placed in the sample holder of the machine and the relevant options selected.
Surface area determination
Surface area, pore size and width were determined from physical adsorption isotherms of nitrogen (with surface area of molecule assumed to be 0.162 nm) at 77.4 K in an automated adsorption surface area analyzer (AUTOSORB-1, Quantachrome Corp.). To purge sample of impurities, the samples were outgassed at a temperature of 300oC with complete outgassing achieved between time regimes of 28-52 h. Adsorption studies A standard methylene blue calibration curve was prepared using dye solutions of known concentrations (25 - 3.7 mg/L) at wavelength of maximum absorbance 661.2 nm [27-29] in a Lambda 25 UV spectrometer. A stock solution was prepared prior to conducting the experiments by dissolving 1.401 g of the analytical grade methylene blue dye in 1 dm3 of double-distilled water and subsequent dilution to desired concentrations (100-500 mg/L) of test solutions. Adsorption isotherms Batch adsorption studies were carried out by contacting 0.5 g of the KOH activated carbon samples with 100 mL of methylene blue at concentrations ranging from 500 to 100 mg/L. A B212 controlled orbital shaker was used to stir the mixture continuously at 240 rpm until equilibrium was attained at the ambient temperatures of 30 oC. Liquid samples were withdrawn from the flask at regular intervals. The samples were put in a Hettich centrifuge and operated at 220 rpm for 5 min. to separate the solid particles. The supernatant liquid was analysed for residual methylene blue concentration in the spectrometer from the calibration curve and amount of dye adsorbed, eq , was calculated using eq. 2 [27]:
m
CeCoVqe

Malaysian Journal of Science 30 (3): 196-207(2011)
199
RESULTS AND DISCUSSION
Table 1. BET surface area and micropore data of the activated carbons
Adsorbent Surface Area(m2/g)
Micropore width (Å)
Micropore volume (%)
Solid density (g/cm)
Apparent density (g/cm)
Porosity (%)
C600 598.4 8.87 6.20 3.9206 0.1009 97.43
C700 1084 10.61 15.69 3.9206 0.1031 97.34
C800 674.1 13.46 13.46 2.9931 0.0918 96.93
The carbonization profile of the corn cob samples (Figure 1), indicates no significant change in weight up to 200 oC. Then, there was a rapid change from200-400 oC. These are typical behaviors of lignocellulosic materials. Such profile has been observed in the carbonization of various carbonaceous materials such as coconut shell [30], iron bamboo (2) and palm shell [31] that were not mixed with inorganic activating agents. Lignocellulosic materials such as corncob consist of three main components – cellulose, hemicellulose and lignin. Cellulose is a partly crystalline linear polysaccharide that consists of up to 3000 glucose units in long chains. Hemicellulose is similar; but it consists of an order of magnitude lower number of units. Lignin is more complex. It is a three-dimensional polymer of phenylpropane units linked together by C–O–C or C–C bonds. In addition to linking the phenylpropane units, the ether and C–C bond connects with the cellulose and hemicellulose. Thus, lignin acts as a cement for the lignocellulosic structures.This composition and structure of the lignocellulosic materials determine its decomposition profile. As the reaction temperature increases, adsorbed species are released. This is followed by decomposition of hemicellulose (200–260 oC), cellulose (240–350 oC) and lignin (280–500 oC). Up to 400 oC, the decomposition is dominated by depolymerization and chain scission through the ether and carbon–carbon bonds. As shown in the figure, rapid change was observed at the onset of hemicelluloses decomposition, which continued into the lignin decomposition
Temperature (oC)
0 200 400 600 800
Mas
s (w
eigh
t %)
0
20
40
60
80
100
Figure 1. A thermo gravimetric (TG) profileplot for the corn cobs precursor
Surface areas were calculated using the BET method while micropore width and volume data were obtained by employing the Dubunin-Raduskhevich method. Volume of nitrogen as liquid adsorbed on the activated carbon sample at a relative pressure of 0.98 was estimated to be the total pore volume.
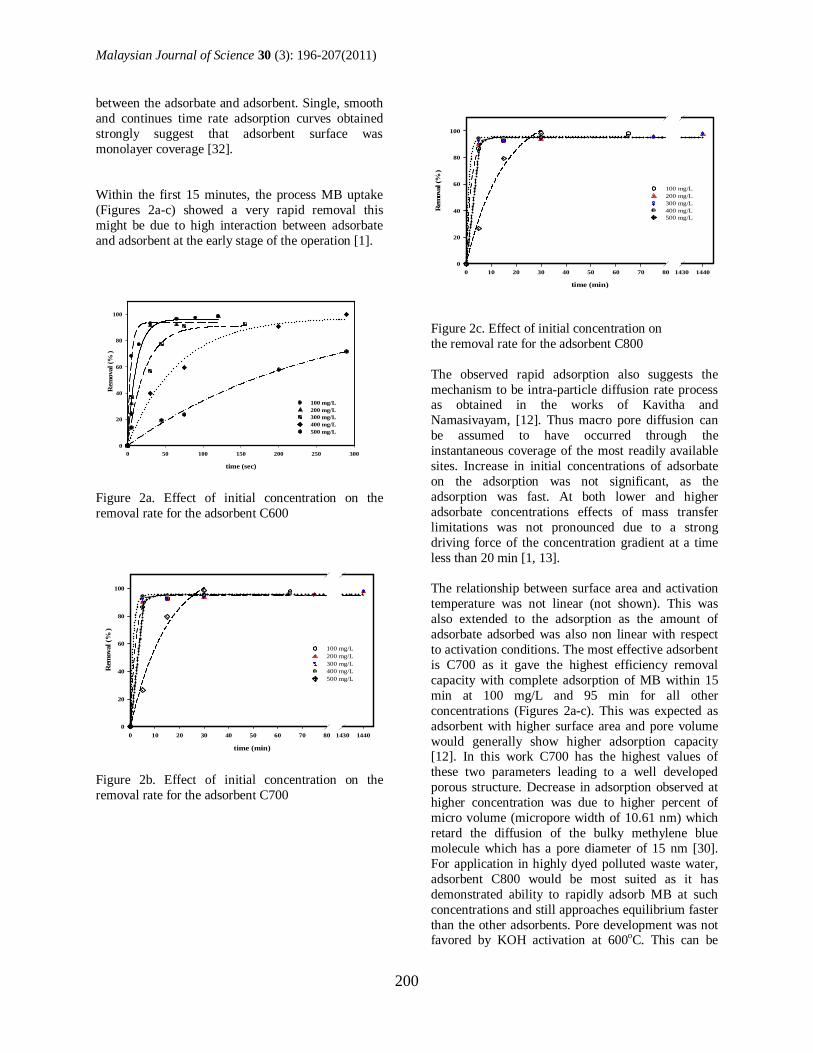
Adsorption studies Adsorption behavior of the adsorbents was investigated by determining the percentage removal of the MB (Figure 2a-c), the plot shows curves that are single, smooth and continuous, leading to saturation, suggesting the possible monolayer coverage [29] of methylene blue on the adsorbent surface and validating the high correlation coefficient (R2) observed in Table 2.
% Removal 100o t
o
C Cx
C
As elucidated by Doğan et al. [7], one of the most important parameters of waste water treatment by adsorption is the time required to reach equilibrium
Malaysian Journal of Science 30 (3): 196-207(2011)
200
between the adsorbate and adsorbent. Single, smooth and continues time rate adsorption curves obtained strongly suggest that adsorbent surface was monolayer coverage [32]. Within the first 15 minutes, the process MB uptake (Figures 2a-c) showed a very rapid removal this might be due to high interaction between adsorbate and adsorbent at the early stage of the operation [1].
time (sec)
0 50 100 150 200 250 300
Rem
oval
(% )
0
20
40
60
80
100
100 mg/L200 mg/L300 mg/L400 mg/L500 mg/L
Figure 2a. Effect of initial concentration on the removal rate for the adsorbent C600
time (min)
0 10 20 30 40 50 60 70 80 1430 1440
Rem
oval
(% )
0
20
40
60
80
100
100 mg/L200 mg/L300 mg/L400 mg/L500 mg/L
Figure 2b. Effect of initial concentration on the removal rate for the adsorbent C700
time (min)
0 10 20 30 40 50 60 70 80 1430 1440
Rem
oval
(% )
0
20
40
60
80
100
100 mg/L200 mg/L300 mg/L400 mg/L500 mg/L
Figure 2c. Effect of initial concentration on the removal rate for the adsorbent C800 The observed rapid adsorption also suggests the mechanism to be intra-particle diffusion rate process as obtained in the works of Kavitha and Namasivayam, [12]. Thus macro pore diffusion can be assumed to have occurred through the instantaneous coverage of the most readily available sites. Increase in initial concentrations of adsorbate on the adsorption was not significant, as the adsorption was fast. At both lower and higher adsorbate concentrations effects of mass transfer limitations was not pronounced due to a strong driving force of the concentration gradient at a time less than 20 min [1, 13]. The relationship between surface area and activation temperature was not linear (not shown). This was also extended to the adsorption as the amount of adsorbate adsorbed was also non linear with respect to activation conditions. The most effective adsorbent is C700 as it gave the highest efficiency removal capacity with complete adsorption of MB within 15 min at 100 mg/L and 95 min for all other concentrations (Figures 2a-c). This was expected as adsorbent with higher surface area and pore volume would generally show higher adsorption capacity [12]. In this work C700 has the highest values of these two parameters leading to a well developed porous structure. Decrease in adsorption observed at higher concentration was due to higher percent of micro volume (micropore width of 10.61 nm) which retard the diffusion of the bulky methylene blue molecule which has a pore diameter of 15 nm [30]. For application in highly dyed polluted waste water, adsorbent C800 would be most suited as it has demonstrated ability to rapidly adsorb MB at such concentrations and still approaches equilibrium faster than the other adsorbents. Pore development was not favored by KOH activation at 600oC. This can be

Malaysian Journal of Science 30 (3): 196-207(2011)
201
adjudged from the low micropore volume of 6.2% computed from the N2 adsorption. This has significantly adversely affected performance of the adsorbent. A possible explanation advanced by Rahman & Saad [21] for such might be due to due to blocking of pores by the decomposed lignocellulic material. Surface functional groups were not investigated in this study, as our previous investigation showed an insignificant change in surface functional groups formation with temperature for corn cobs activated carbon at temperature regime of 600-800 oC [33]. Adsorption kinetics Langmuir and Freundlich adsorption isotherm The Langmuir and Freundlich adsorption isotherms (eqs. 3 &5) were linearised to obtained eqs. 4 & 6 respectively.
e
eO
e bCbCQ
q
1
Oe
Oe QbCQq
111
nCkq Fe
1
eFe Cn
kq log1loglog
The parameter that indicates amount of adsorbate that an adsorbent can take per unit is the Langmuir adsorption capacity, OQ ; calculated values for the
process ranged from 172-833 mg/g. This value was found to be very high compared to various previous reports - 74-360 mg/g [34], 225.64 mg/g [29], 13-914 mg/g [28, 35], 13.44-914.59 mg/g [12] and 47-300.052 mg/g [36]. Values of energy of absorption, b, were low suggesting a physical adsorption of the adsorbate on the adsorbent surface (Table 3). Based on the large surface area of adsorbent C700, its uptake capacity should have been higher but considering that contribution of micropore to the total surface area is highest thus access to the porous interior would be severely restricted.
Empirical Freundlich constant, Fk , related to adsorption capacity was also very high compared to the same literature values reported above. The adsorbent showed high strength of adsorption from the n values which are observed to be higher than commercial adsorbent figure of n=1.85 [37]. The experimental data generated were analyzed according to the linear form of Langmuir and Freundlich isotherms (Table 3). Langmuir model fitted the adsorption process more than the Freundlich model as confirmed by the high values of the correlation coefficients for the Langmuir.As Langmuir isotherm is valid for monolayer coverage on an adsorbent surface due to availability of a finite number of binding sites [38], in this case,
Table 2.Freundlich and Langmuir isotherms constants for the adsorption
Adsorbent Freundlich Isotherm Langmuir Isotherm
kF(mg/g)(L/mg) n R2 Qo (mg/g) b (L/mg) R2
C600 167.89 4.91 0.5320 416.67 0 2376 0.9902
C700 647.10 2.17 0.7181 172.41 0.9508 0.4082
C800 69.93 1.45 0.9792 833.33 0.0750 0.9983
the assumption is validated as the adsorption process can be seen to decrease steadily after the initial rapid adsorption as a result of decrease in the number of sites available on adsorbent [7, 12]. Fitting the adsorption data generated into the Langmuir model
and obtaining a high correlation coefficient confirms the monolayer coverage on the adsorbent surface (Table 2). The slow adsorption of the second region can also be attributed to affecting of surface forces such as van der Waals and electrostatic attractions

Malaysian Journal of Science 30 (3): 196-207(2011)
202
that set in as the removal tends to equilibrium slowly [7]. Similar observation was made by Kavitha and Namasivayam,[12]. Pseudo-second-order model The adsorption kinetics may also be described by a Pseudo-second-order reaction model [39]. The equation shows the differential equation for the reaction as shown in eq. 7
22 qqkdtdq
e
Integrating equation 7 and rearranging, the integrated linear form of the equation (eq. 8) was obtained
tqqkq
t
ee
112
2
The plot of t/q versus t of eq.8 allows for determining experimentally the constants k2 and qe of the methylene blue adsorption from the slope and intercept of the plot if second order kinetic equation is applicable. Initial adsorption rate as t tends to 0 is defined as
2
2 eh k q
Values of all the constants were computed at the various concentrations investigated and presented in Table 4.
Figure 3. Second order kinetics plot of Madsorptionon adsorbent C800 at different initial concentrations

Malaysian Journal of Science 30 (3): 196-207(2011)
203
Figure 4. Second order kinetics plot of MB adsorption on adsorbent C700 at different initial concentrations
Figure 5. Second order kinetics plot of MB adsorption on the adsorbent C600 at different initial concentrations Though pseudo-second order model fitted the experimental results, the observed non-linear relation between the rate constants and initial adsorbate concentration suggest the influence of other adsorption mechanisms [2]. Generally, an
exceptionally high initial rate of reaction, h, was obtained for all the samples. The exceptions are samples C600 at initial concentrations of 300 – 500 mg/L and C700 at initial concentrations of 300-500 mg/L. There was no definite trend of either decrease

Malaysian Journal of Science 30 (3): 196-207(2011)
204
or increase in the adsorption rate with an increase in initial MB concentration, such phenomena was also reported by El-Khaiary et al. [2].
In this study, batch kinetic studies were carried out to quantify the adsorption rate and determine the effect of time on the process by investigating the influence of the systems concentration and time. Two kinetic models were adopted to examine the mechanism of the adsorption.
CONCLUSION
Different grades of activated carbons adsorbents were prepared from corn cobs at different activation temperatures ranging from 600-800 oC. Highest surface area was obtained at 700 oC. Studies of MB adsorption on these adsorbents demonstrated that activation condition of the adsorbent had a significant effect on the adsorption capacity of the adsorbent. Removal of more than 90 % adsorbate was observed after an average equilibrium adsorption time of 20 min for all absorbents at all concentrations investigated.
The adsorption kinetics data followed a pseudo–second–order kinetic model for the entire adsorption period, because all calculated correlation coefficients (R2) approached unity while the capacity of the adsorbents determined by fitting the equilibrium data into the two aforementioned adsorption isotherms indicated Langmuir model best describe the adsorption equilibrium data with a maximum adsorption capacity of 833.33 mg/g. The adsorbents are found to be efficient as a potential adsorbent for removal Methylene blue from waste water.
Table 3. Second-order reaction constant and correlation coefficient
Adsorbent Co (mg/L) Second order kinetic model
qe(mg/g) k2(g/mgmin) h ( (mg/g min) R2
C600 100 110.35 0.4800 52.63 0.9992
200 228.67 0.0038 200.00 0.9941
300 316.72 4.52e-4 41.67 0.9954
400 455.71 0.0010 142.86 0.9439
500 375.90 0.0016 25.00 0.9543
C700 100 125.00 0.0063 333.33 0.9997
200 229.55 0.0042 500.00 0.9999
300 343.43 0.0012 142.86 0.9976
400 405.81 4.34e-4 71.42 0.9897
500 515.38 0.0038 - 0.9942
C800 100 94.94 0.0180 166.67 0.9996
200 236.31 0.0010 500.00 1.0000
300 337.43 0.0880 10,000 1.0000
400 429.42 0.0540 10,000 0.9998
500 455.64 0.0480 10,000 1.0000

Malaysian Journal of Science 30 (3): 196-207(2011)
205
Nomenclature
B equilibrium constant related to sorption energy between adsorbate and adsorbent
Ceq unadsorbed MB concentration in solution at equilibrium (mg l-1)
C0 initial MB concentration (mg l-1)
h initial rate of adsorption
k1 rate constant of pseudo-first order adsorption (min−1)
k2 rate constant of pseudo-second order adsorption (gmg-1min-1)
kF Freundlich constant
M mass of adsorbent (g)
n Freundlich adsorption constant
qe adsorbed MB quantity per gram of adsorbent at equilibrium (mgg-1)
qt amount of MB adsorbed per gram of adsorbent at time t (mgg-1)
Qo Langmuir adsorption capacity (mgg-1)
ρa apparent density
R2 regression correlation coefficient
t time (min)
V volume (m3)
Malaysian Journal of Science 30 (3): 196-207(2011)
206
REFERENCES
1. Özer, D., Dursun, G. and Özer, A. (2007). Methylene blue adsorption from aqueous solution by dehydrated peanut hull.J. Hazard. Mater.144: 171-179.
2. El-Khaiary, M. I. (2007). Kinetics and mechanism of adsorption of methylene blue from aqueous solution by nitric-acid treated water-hyacinth.J. Hazard. Mater.147: 28-36.
3. Hameed, B. H., Din, A.T.M. and Ahmad, A. L. (2007). Adsorption of methylene blue onto bamboo-based activated carbon: Kinetics and equilibrium studies.J. Hazard. Mater.141:819-825.
4. Ghosh, D. and Bhattacharyya, K. G. (2002). Adsorption of methylene blue on kaolinite.Appl. Clay Sci.20: 295-300.
5. Lorenc-Grabowska, E. and Gryglewicz, G. (2007). Adsorption characteristics of Congo Red on coal-based mesoporous activated carbon. Dyes and Pigments74:34-40.
6. Diya’uddeen, B. H., Mohammed, I. A., Ahmed, A. S. and Jibril, B. Y. (2008a). Production of activated carbon from corn cobs and its utilization in crude oil spillage. Agricultural Engineering International: CIGR Ejournal X.
7. Dogan, M., Abak, H. and Alkan, M. (2009). Adsorption of methylene blue onto hazelnut shell: Kinetics, mechanism and activation parameters. J. Hazard. Mater.164: 172-181.
8. Kapdan, I. K. and Kargi, F. (2002). Simultaneous biodegradation and adsorption of textile dyestuff in an activated sludge unit.Process Biochem.37: 973–981.
9. Konstantinou, I. K. and Albanis, T. A. (2004). TiO2-assisted photocatalytic degradation of azo dyes in aqueous solution: kinetic and mechanistic investigations: A review.Appl. Catal. B: Environ.49:1-14.
10. Mahmoodi, N. M. and Arami, M. (2008). Modeling and sensitivity analysis of dyes adsorption onto natural adsorbent from
colored textile wastewater.J. Appl. Polym. Sci.109: 4043–4048.
11. Babel, S. and Kurniawan, T. A. (2003). Low-cost adsorbents for heavy metals uptake from contaminated water: a review. J. Hazard. Mater.97: 219-243.
12. Kavitha, D. and Namasivayam, C. (2007). Experimental and kinetic studies on methylene blue adsorption by coir pith carbon. Bioresour. Technol.98: 14-21.
13. Weng, C.-H., Lin, Y.-T.andTzeng, T.-W.(2009). Removal of methylene blue from aqueous solution by adsorption onto pineapple leaf powder.J. Hazard. Mater.170: 417-424.
14. Li, W., Yang, K. Peng, J. Zhang, L. Guo, S. and Xia, H. (2008). Effects of carbonization temperatures on characteristics of porosity in coconut shell chars and activated carbons derived from carbonized coconut shell chars. Ind. Crops Prod.28: 190-198.
15. Food and Agriculture Organization of the United Nation, Quarterly Bulleting Statistics, 1 (2003).
16. Kim, J.-W.,Sohn, M.-H., Kim, D.-S., Sohn, S.-M.andKwon, Y.-S.(2001). Production of granular activated carbon from waste walnut shell and its adsorption characteristics for Cu2+ ion.J. Hazard. Mater.85: 301-315.
17. Weng, C.-H. andPan, Y.-F. (2006). Adsorption characteristics of methylene blue from aqueous solution by sludge ash.ColloidsSurf. A: Physicochem. Eng.274: 154-162.
18. Akmil-Basar, C., Önal, Y., KilIçer, T. and Eren, D. (2005). Adsorptions of high concentration malachite green by two activated carbons having different porous structures.J. Hazard. Mater.127:73-80.
19. Yasin, Y., Hussein, M. Z. and Hj Ahmad, F. (2007). Adsorption of methylene blue onto treated activated carbon.Malay. J. Anal.Sci.11:400 - 406.
20. Vaughan, T., Seo, C. W. and Marshall, W. E. (2001). Removal of selected metal ions

Malaysian Journal of Science 30 (3): 196-207(2011)
207
from aqueous solution using modified corncobs.Bioresour. Technol.78:133-139.
21. Rahman, I. A., Saad, B., Shaidan, S. and Sya Rizal,E.S. (2005). Adsorption characteristics of malachite green on activated carbon derived from rice husks produced by chemical-thermal process.Bioresour. Technol.96:1578-1583.
22. Tsai, W.T.,Chang, C.Y., Wang, S.Y., Chang, C.F., Chien, S.F. andSun, H.F. (2001). Preparation of activated carbons from corn cob catalyzed by potassium salts and subsequent gasification with CO2.Bioresour. Technol.78:203-20
23. El-Hendawy, A.-N.A. (2003).Influence of HNO3 oxidation on the structure and adsorptive properties of corncob-based activated carbon.Carbon41: 713-72
24. Chang, C.F., Chang, C.Y. and Tsai, W.T. (2000). Effects of burn-off and activation temperature on preparation of activated carbon from corncob agrowaste by CO2 and steam, Colloid Interf.Sci.232:45–49.
25. Lillo-Ródenas, M.A., Cazorla-Amorós, D. and Linares-Solano, A. (2003). Understanding chemical reactions between carbons and NaOH and KOH: An insight into the chemical activation mechanism.Carbon41:267-275.
26. Ahmedna, M., Johns, M.M., Clark, S.J., Marshall, W.E. and Rao, M.M. (1997). Potential of agricultural by-product based activated carbon for use in raw sugar discolorization.J. Sci. Food Agric.75: 117-124.
27. Ahmad, A.L.,Loh, M.M. and Aziz, J.A. (2007). Preparation and characterization of activated carbon from oil palm wood and its evaluation on Methylene blue adsorption.Dyes and Pigments75:263-272.
28. Banerjee, S. and Dastidar, M.G. (2005). Use of jute processing wastes for treatment of wastewater contaminated with dye and other organics. Bioresour.Technol.96: 1919-1928.
29. Senthilkumaar, S. Varadarajan, P.R.,Porkodi, K. and Subbhuraam, C.V. (2005). Adsorption of methylene blue onto jute fiber carbon: kinetics and equilibrium studies.J. Colloid Interf. Sci.284:78-82.
30. Hu, Z., Srinivasan, M.P. and Ni, Y. (2001). Novel activation process for preparing highly microporous and mesoporous activated carbons.Carbon39: 877-886.
31. Hayashi, J., Horikawa, T., Takeda, I., Muroyama, K. and Ani, F. N. (2002). Preparing activated carbon from various nutshells by chemical activation with K2CO3.Carbon40:2381–2386.
32. Yadava, K.P., Tyagi, B.S., Panday, K.K. and Singh, V.N. (1987). Fly ash for the treatment of Cd (II) rich effluents.Environ. Technol.8:225–234.
33. Diya’uddeen, B.H., Musa, I.A. and I.M. Misau. Temperature effect on surface functional groups formation of KOH activated adsorbents developed from corn cobs and coconut shell.J. Phy. Sci.Safety Stud.1:92-105.
34. San Miguel, G., Fowler, G.D. and Sollars, C.J. (2003).A study of the characteristics of activated carbons produced by steam and carbon dioxide activation of waste tyre rubber.Carbon 41:1009-1016.
35. Mohan, D. and Pittman Jr,C.U. (2006).Activated carbons and low cost adsorbents for remediation of tri- and hexavalent chromium from water.J. Hazard. Mater.137: 762-811.
36. Hameed, B.H. (2009). Spent tea leaves: A new non-conventional and low-cost adsorbent for removal of basic dye from aqueous solutions. J. Hazard. Mater.161: 753-759.
37. Polat, H., Molva, M. and Polat, M. (2006). Capacity and mechanism of phenol adsorption on lignite.Int. J. Min. Proces.79: 264-273.
38. Arslan, G. and Pehlivan, E. (2007). Batch removal of chromium(VI) from aqueous solution by Turkish brown coals. Bioresour. Technol.98:2836-2845.
39. Ho, Y.S. and McKay, G. (1999). Pseudo-second order model for sorption processes.Proces.Biochem.34: 451-465.